Circular Market Drivers Infographic Template for PowerPoint & Google Slides
Description
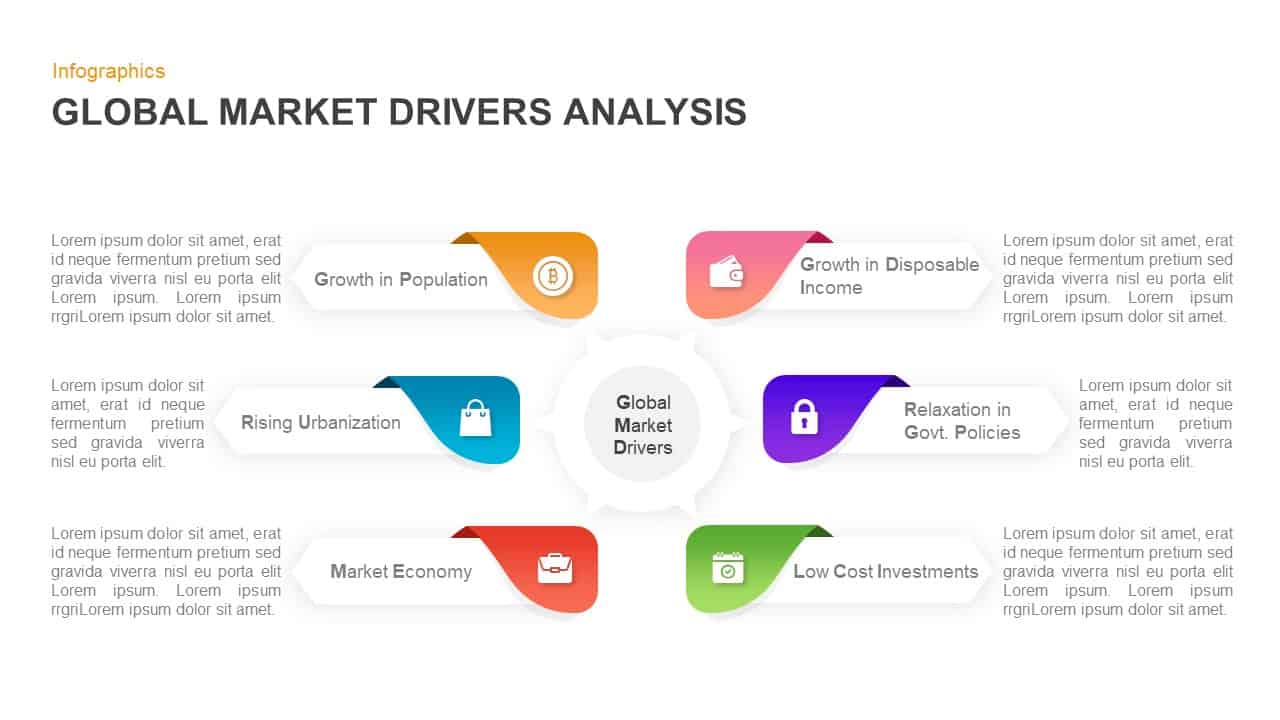
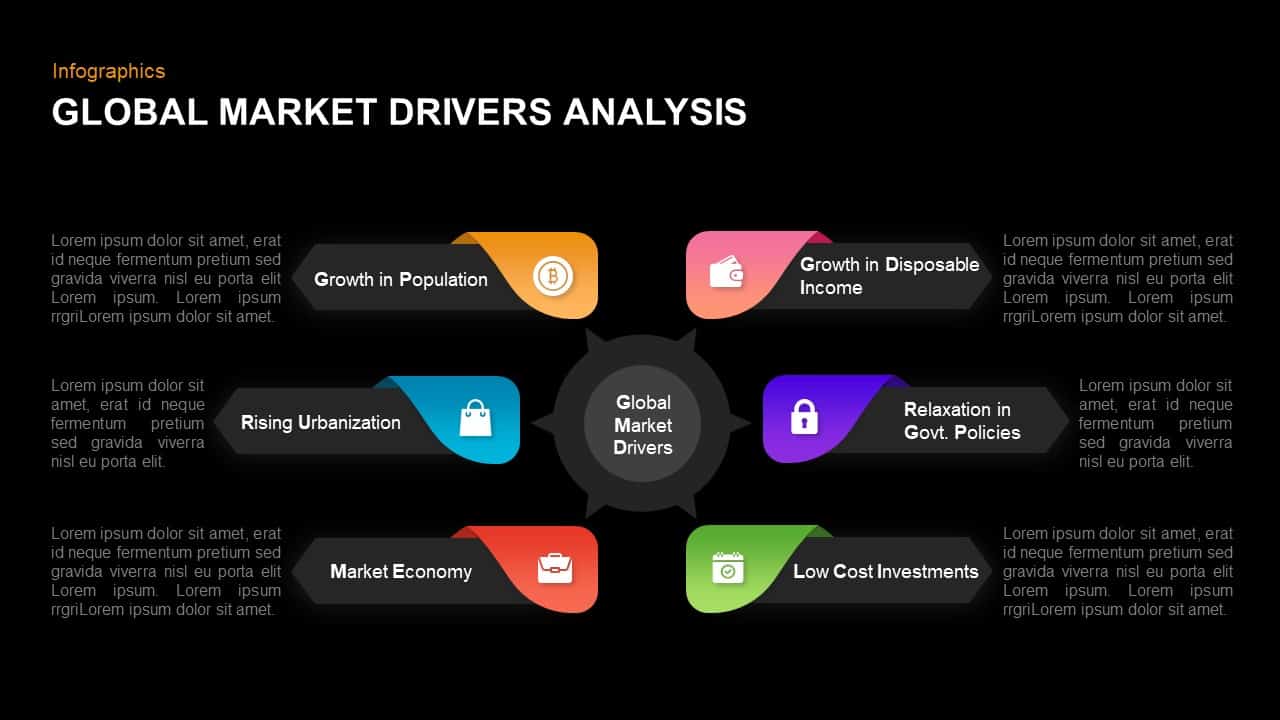
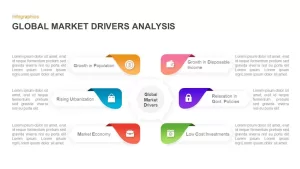
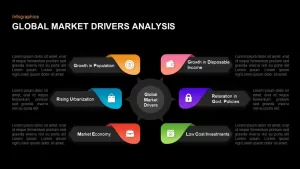
Leverage this circular market drivers infographic to showcase six global growth factors in a visually engaging layout. A central hub labeled “Global Market Drivers” anchors six colored tabs—yellow for population growth, teal for urbanization, red for market economy, pink for disposable income, purple for policy relaxation, and green for low-cost investments—each with customizable icons and text placeholders. Editable vector shapes and master-slide integration allow you to swap icons, adjust colors, and reposition tabs effortlessly. The clean white background, subtle drop shadows, and crisp typography ensure maximum focus on your insights, while built-in animations guide audiences through each driver step-by-step.
Optimized for both PowerPoint and Google Slides, this template uses SmartArt-style vector elements for pixel-perfect scaling on any device. You can hide or highlight individual segments to emphasize specific drivers, recolor gradients to match brand standards, and update fonts globally via the theme pane—eliminating manual tweaks and version-control headaches. Accessibility features, including high-contrast icon rings and alt-text placeholders, ensure clear communication for all viewers.
Designed for versatility, this infographic extends beyond market analysis: repurpose it to map SWOT factors, stakeholder networks, project roadmaps, or product ecosystems. Duplicate or reorder tabs to fit any scenario, and leverage the central hub to anchor your narrative. Whether you’re a consultant presenting strategic insights or a marketing lead outlining growth catalysts, this circular drivers template empowers you to communicate complex data with clarity and impact.
Who is it for
Marketing analysts, business strategists, consultants, product managers, and researchers will benefit from this infographic when illustrating key market drivers or comparative factors.
Other Uses
Use this slide to visualize SWOT elements, stakeholder ecosystems, project milestone frameworks, product feature comparisons, or technology adoption drivers.
Login to download this file

Item ID
SB01347
Related Templates

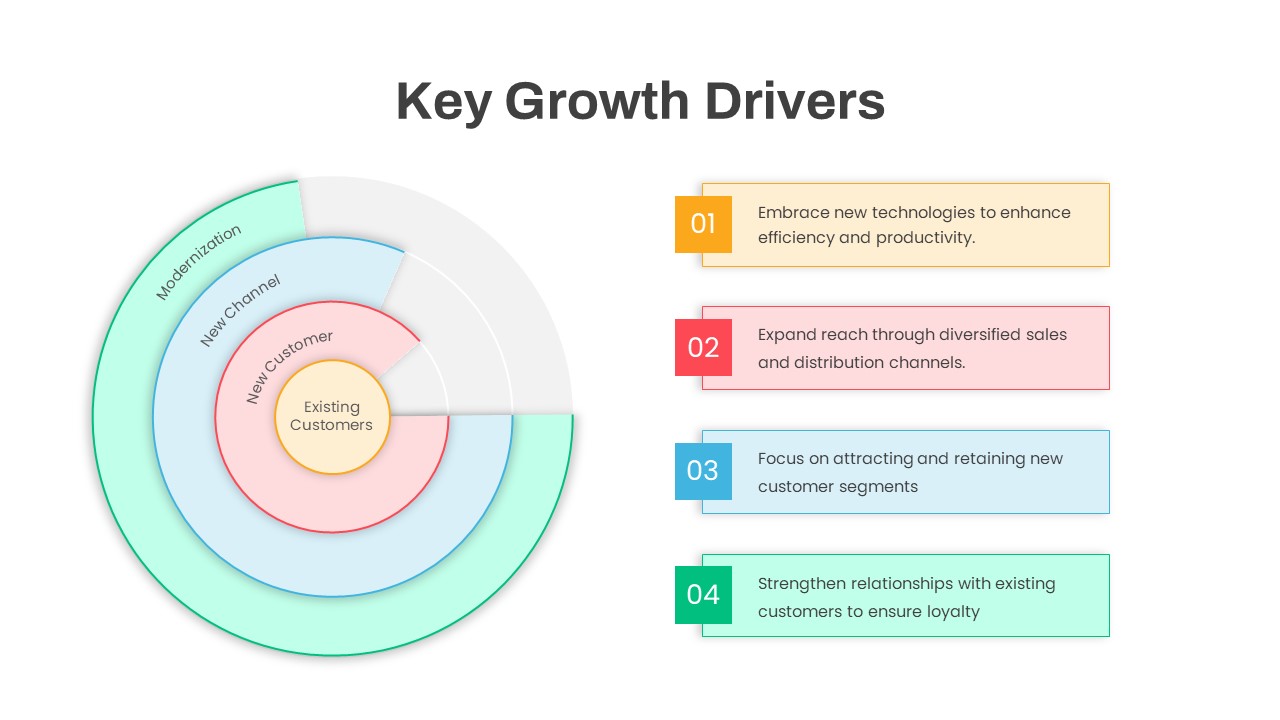
Circular Key Growth Drivers Diagram Template for PowerPoint & Google Slides
Circular
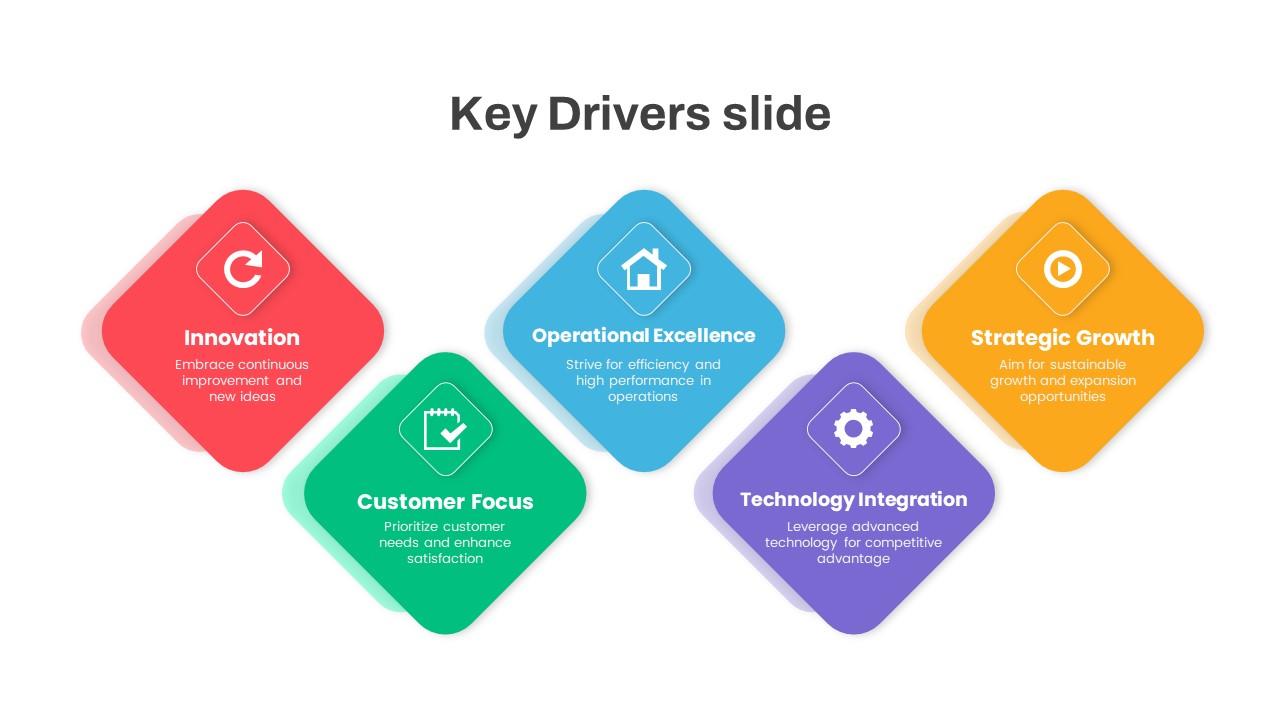
Dynamic Business Key Drivers Slide Template for PowerPoint & Google Slides
Process
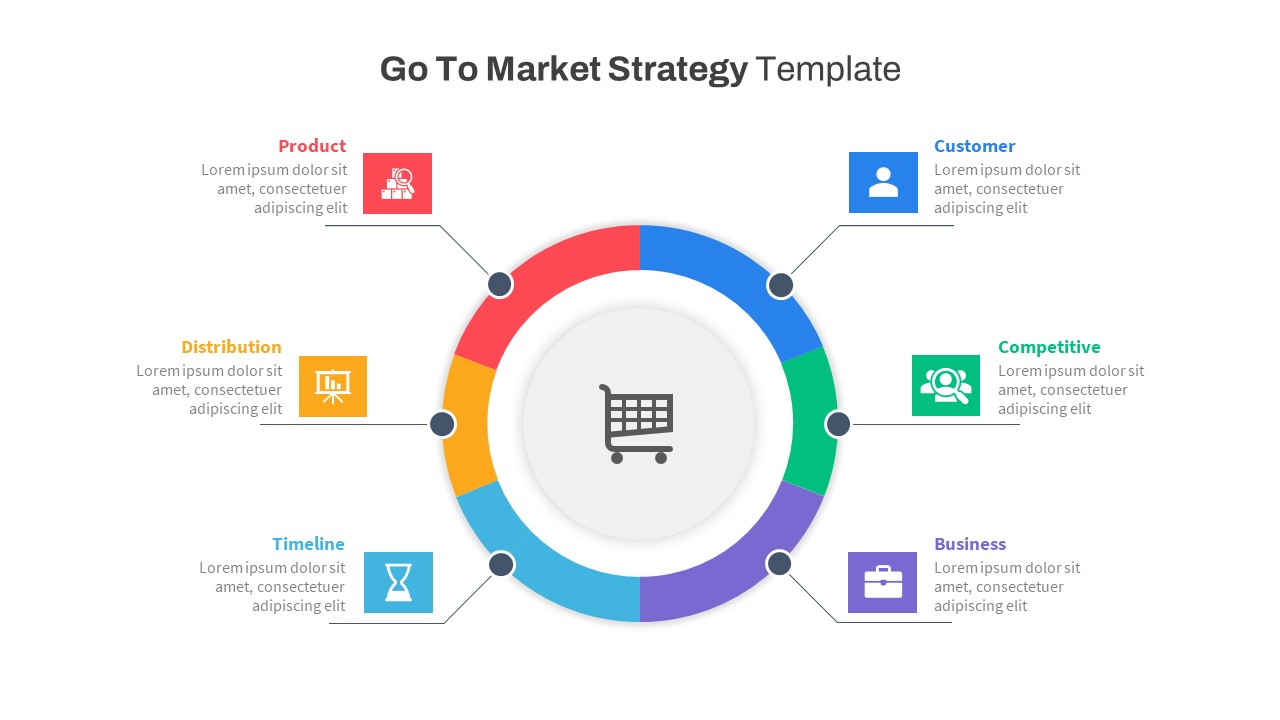
Circular Go To Market Strategy Template for PowerPoint & Google Slides
Business Strategy
Free
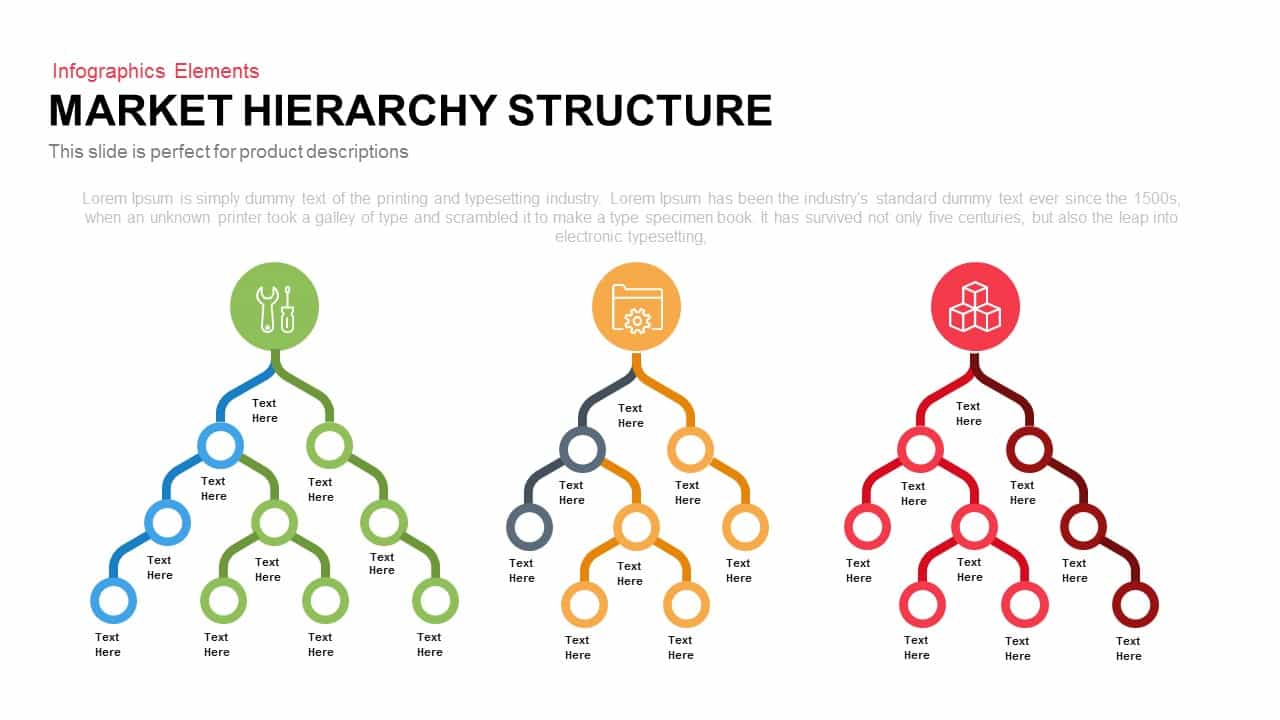
Market Hierarchy Structure Infographic template for PowerPoint & Google Slides
Org Chart
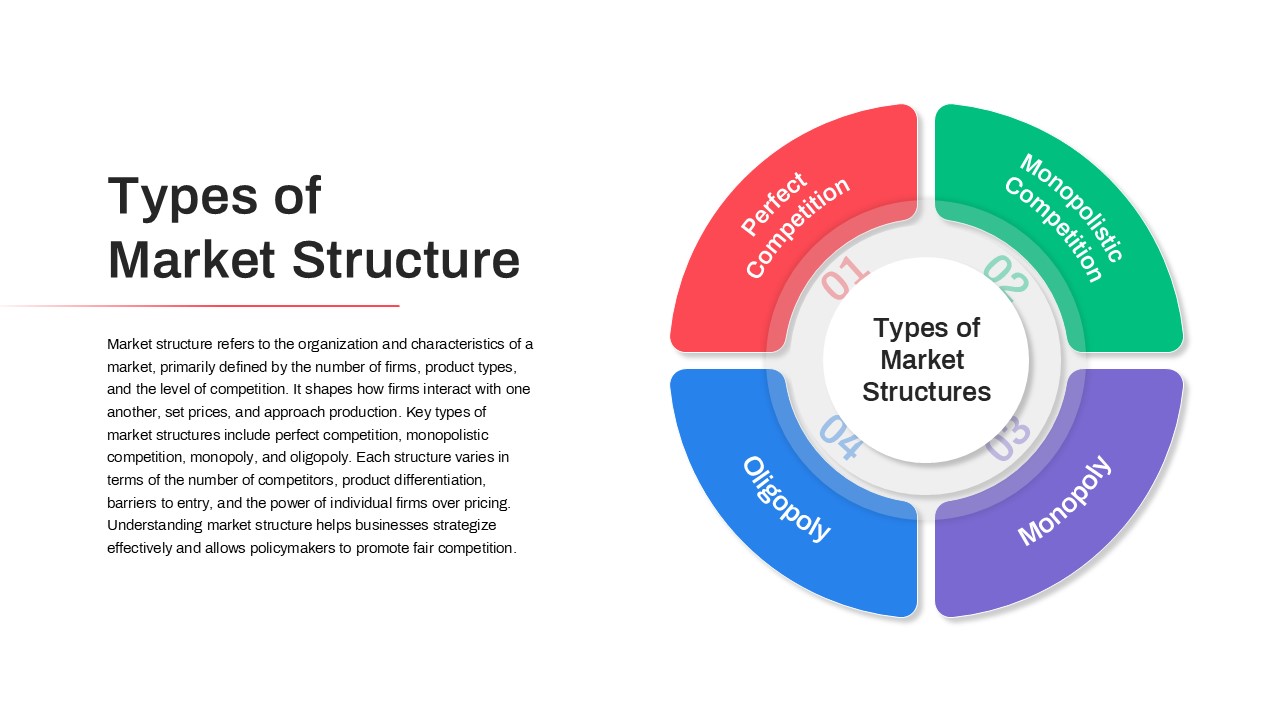
Types of Market Structure Infographic Template for PowerPoint & Google Slides
Comparison
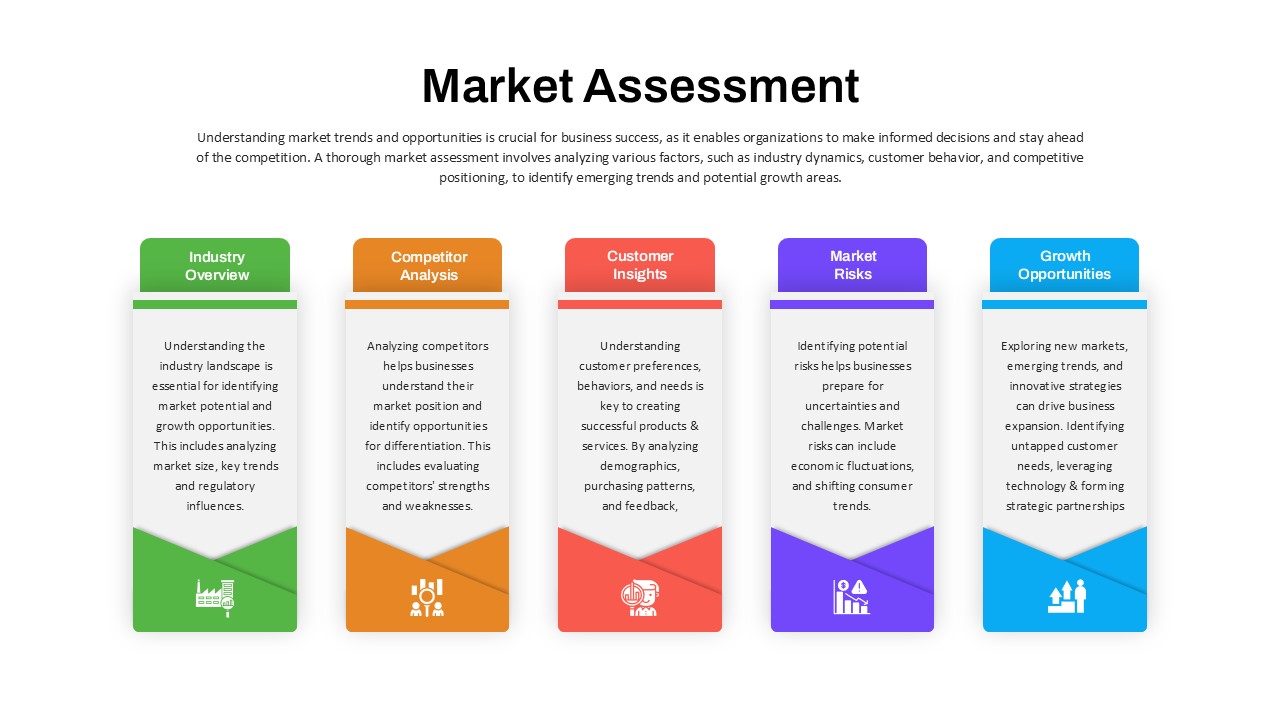
Market Assessment Infographic Slide Template for PowerPoint & Google Slides
Process
Six Section Circular Infographic Diagram Template for PowerPoint & Google Slides
Circular
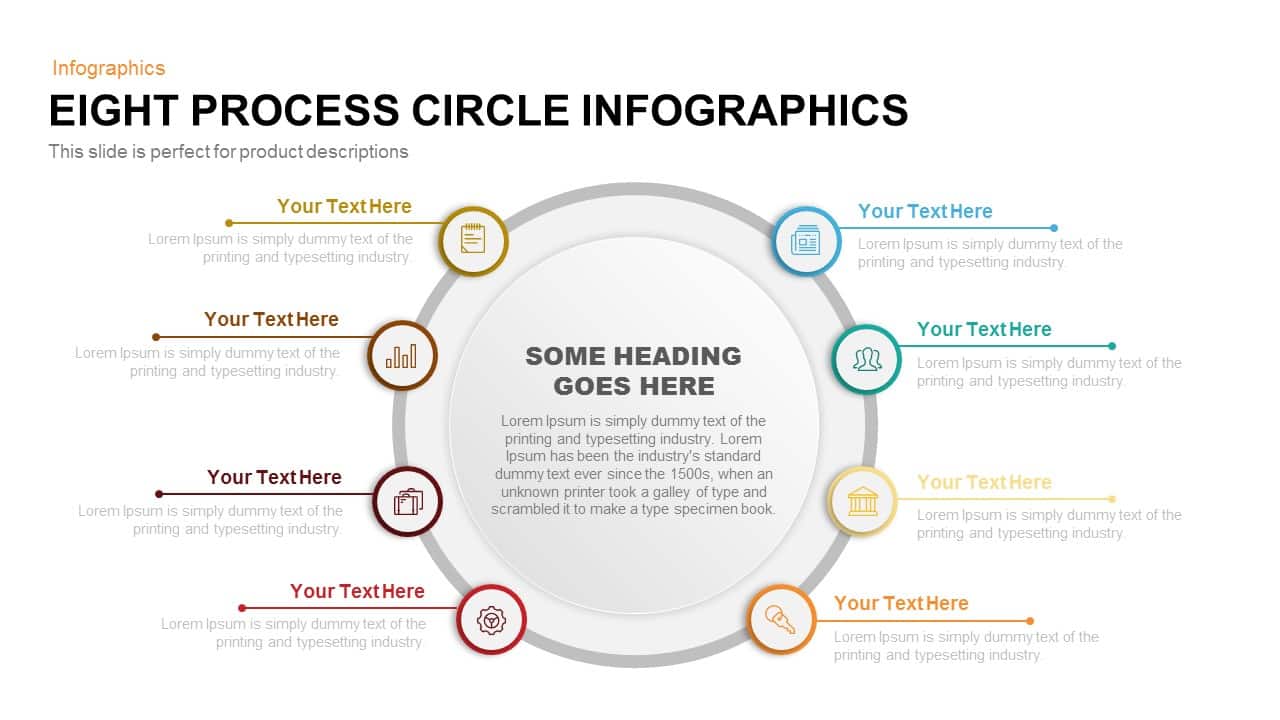
Eight-Stage Circular Process Infographic Template for PowerPoint & Google Slides
Circular
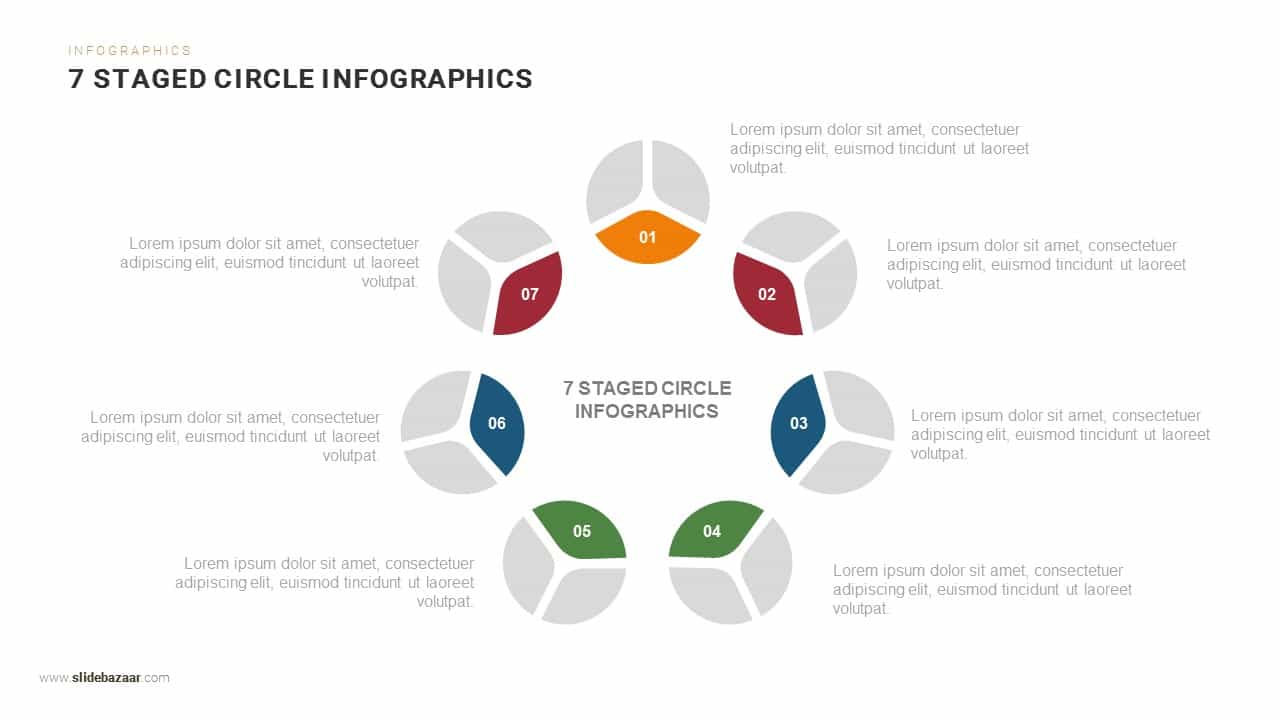
Seven-Stage Circular Infographic Template for PowerPoint & Google Slides
Circular
Six-Segment Circular Hub Infographic Template for PowerPoint & Google Slides
Circular
Eight-Step Circular Diagram Infographic Template for PowerPoint & Google Slides
Circular
Five-Stage Circular Infographic Diagram Template for PowerPoint & Google Slides
Process
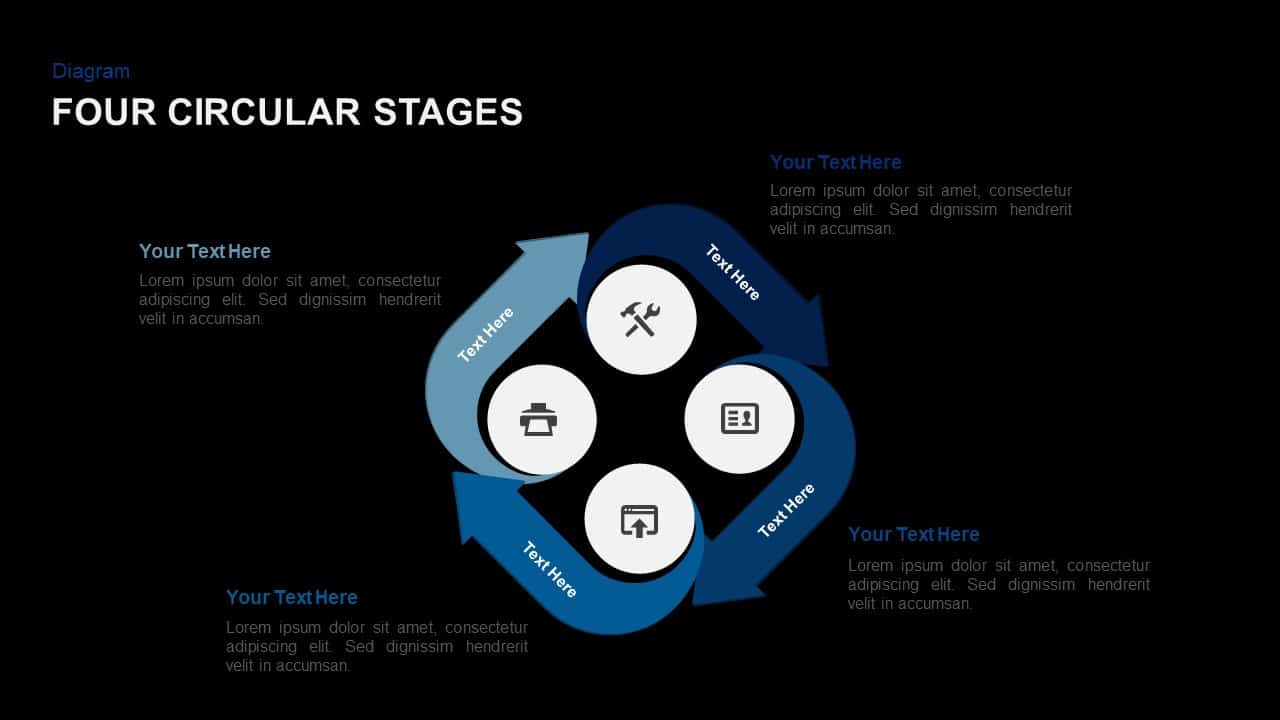
Four-Stage Circular Diagram Infographic Template for PowerPoint & Google Slides
Circular
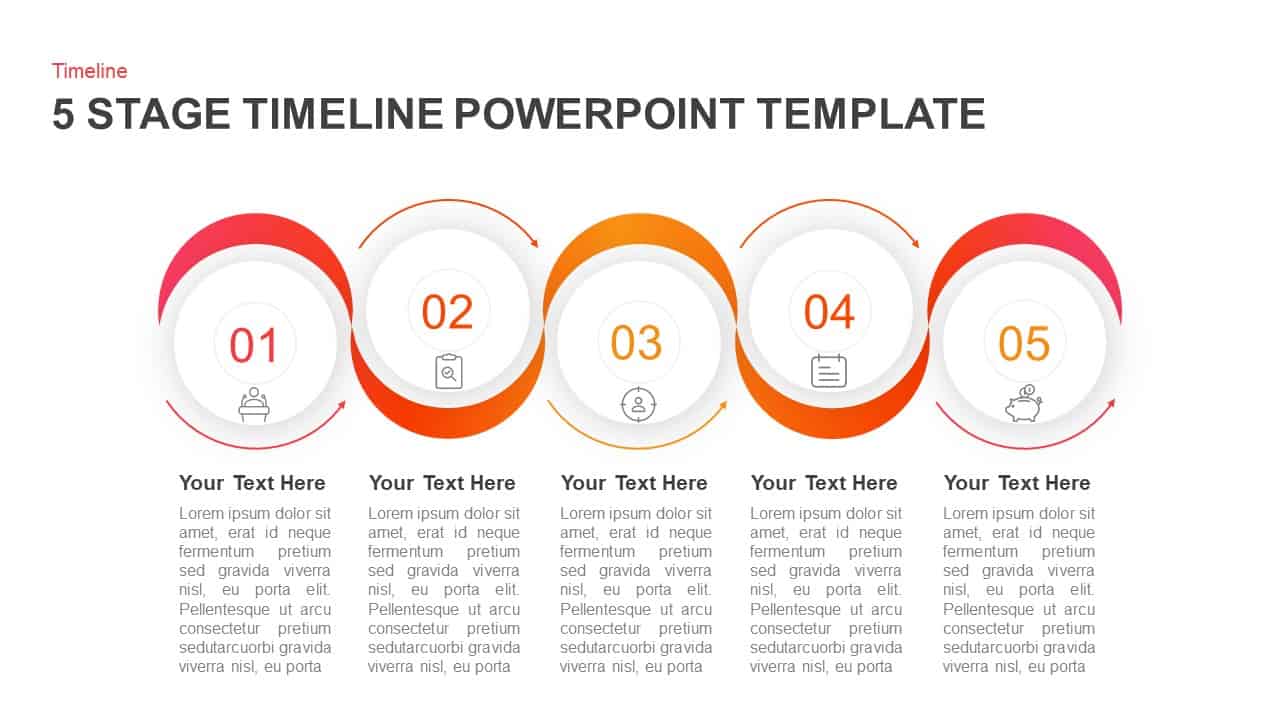
5 Stage Circular Timeline Infographic Template for PowerPoint & Google Slides
Timeline
4 Factors Circular Diagram Infographic Template for PowerPoint & Google Slides
Circular
Circular CRM Process Diagram Infographic Template for PowerPoint & Google Slides
Circular
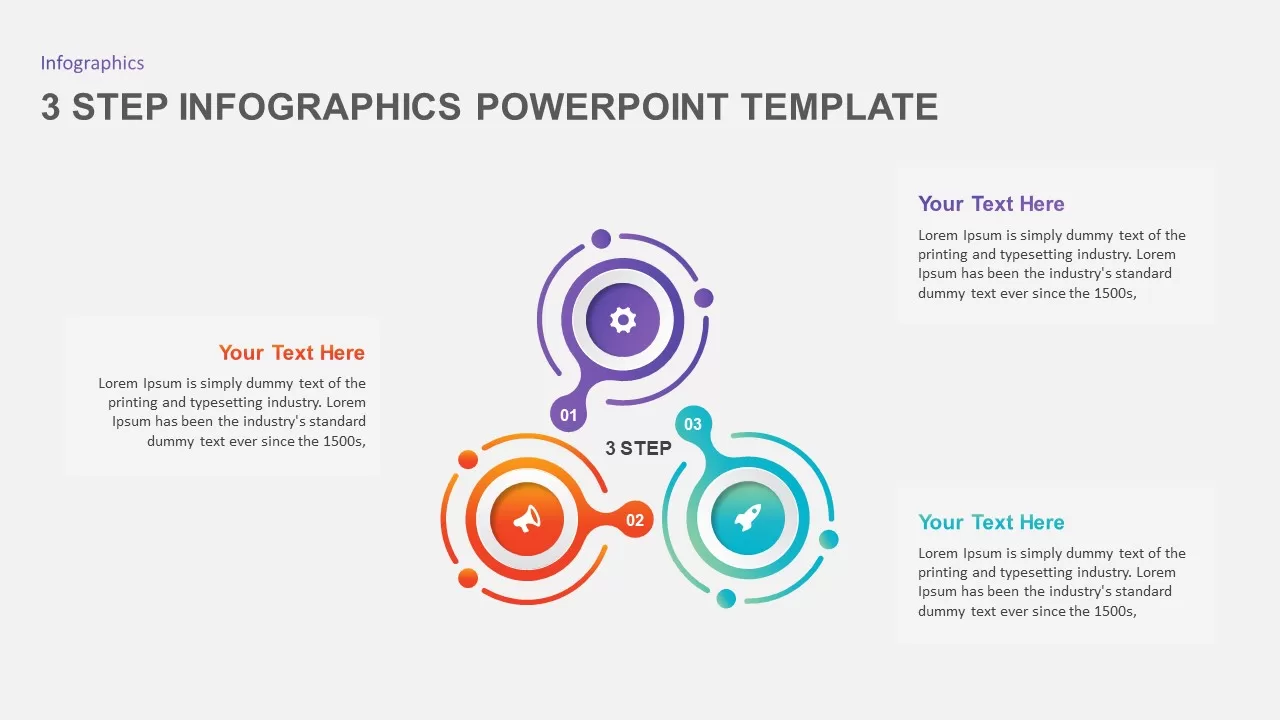
Circular Three-Step Infographic Diagram Template for PowerPoint & Google Slides
Circular
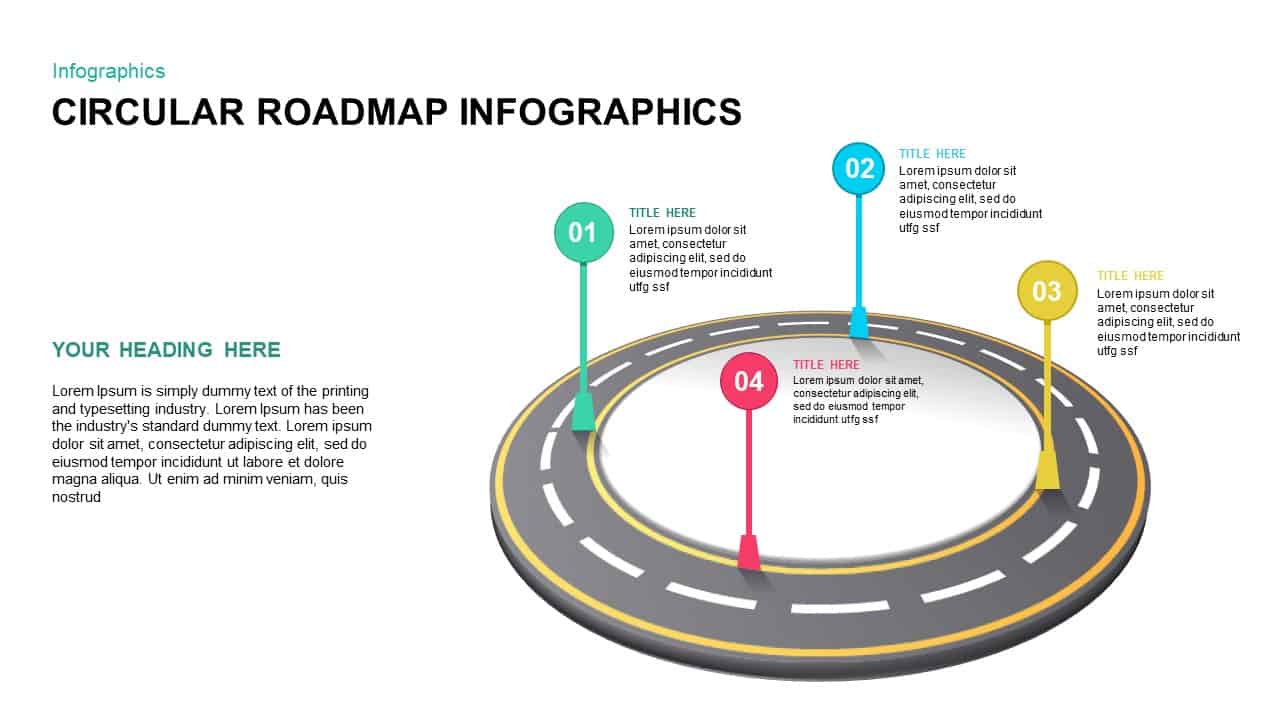
4-Step Circular Roadmap Infographic Template for PowerPoint & Google Slides
Roadmap
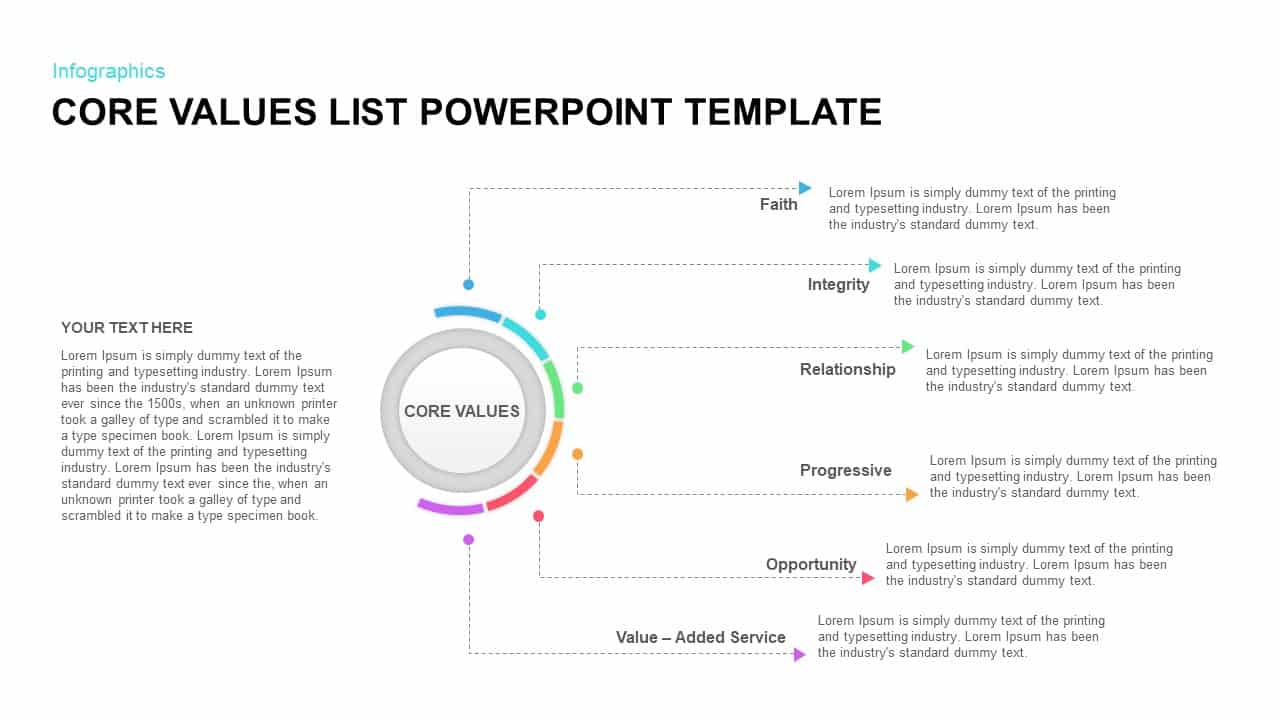
Circular Core Values Infographic List Template for PowerPoint & Google Slides
Circular
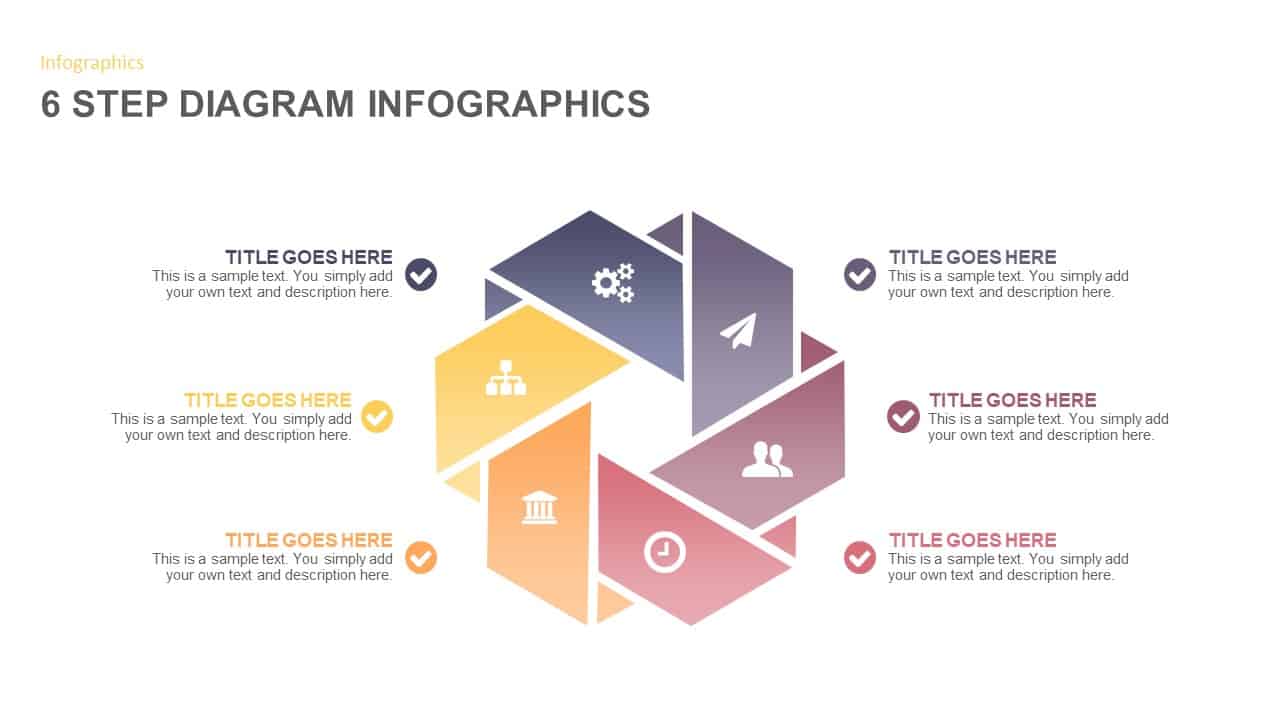
6-Step Circular Diagram Infographic Template for PowerPoint & Google Slides
Circular
8-Step Circular Gear Infographic Diagram Template for PowerPoint & Google Slides
Circular
6-Part Circular Gear Infographic Diagram Template for PowerPoint & Google Slides
Process

Circular CRM Process Infographic Diagram Template for PowerPoint & Google Slides
Circular
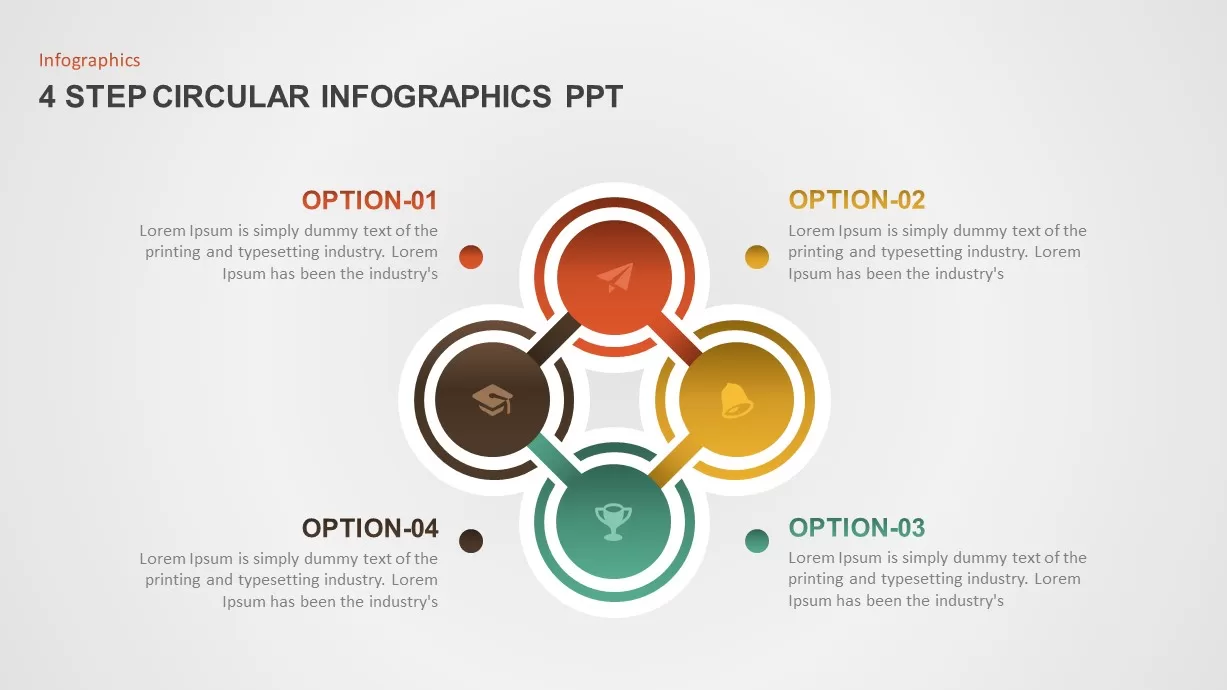
4-Step Circular Infographic Diagram Template for PowerPoint & Google Slides
Circular
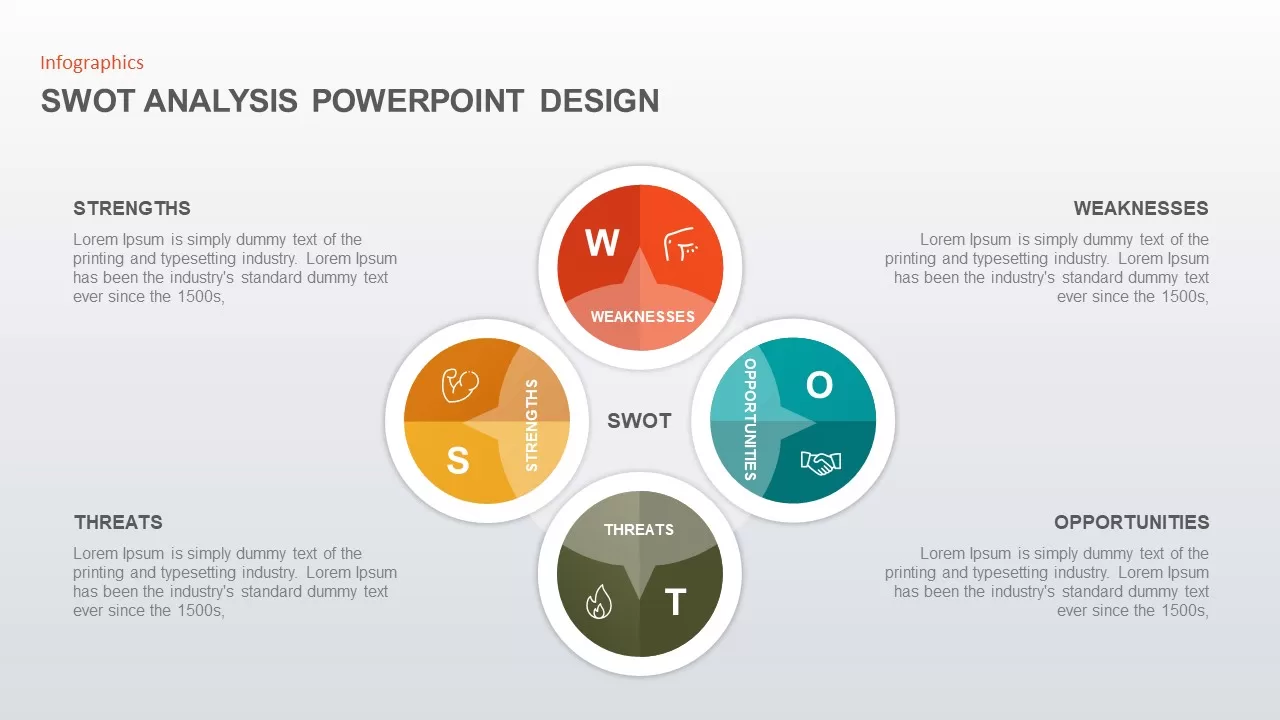
SWOT Analysis Circular Infographic Template for PowerPoint & Google Slides
SWOT
3 & 4 Step Circular Process Infographic Template for PowerPoint & Google Slides
Process
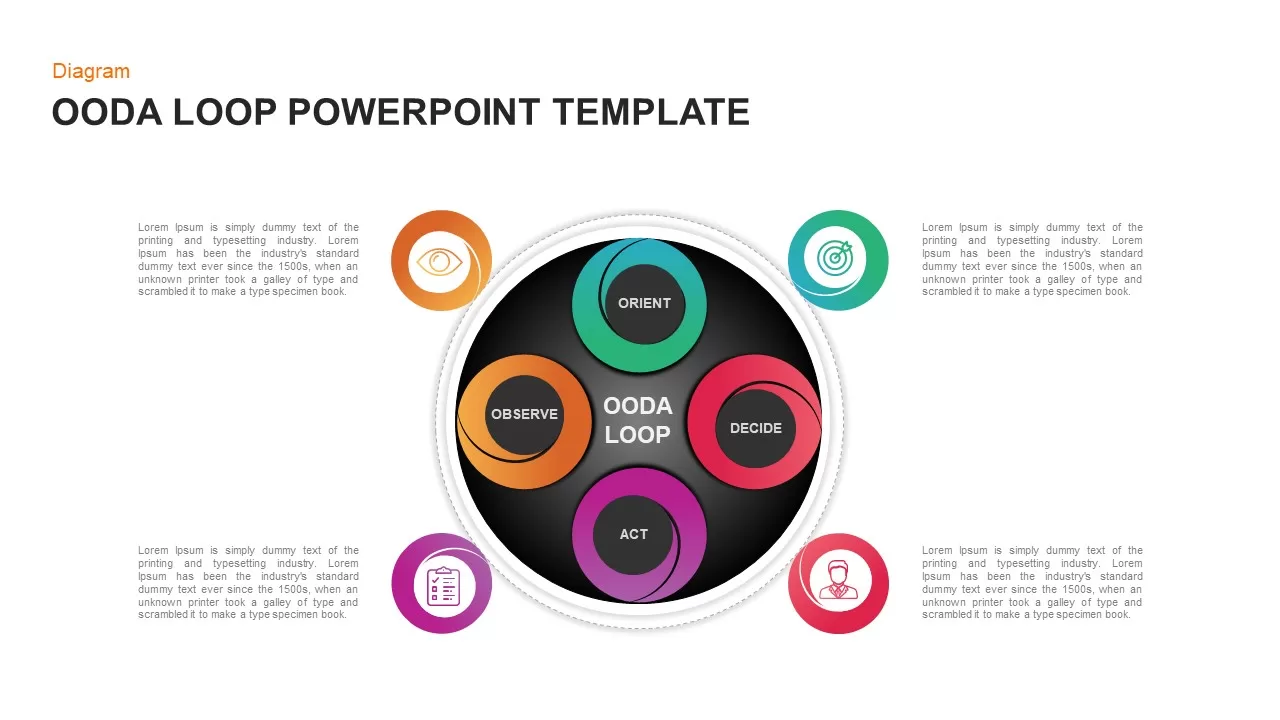
Modern Circular OODA Loop Infographic Template for PowerPoint & Google Slides
Circular
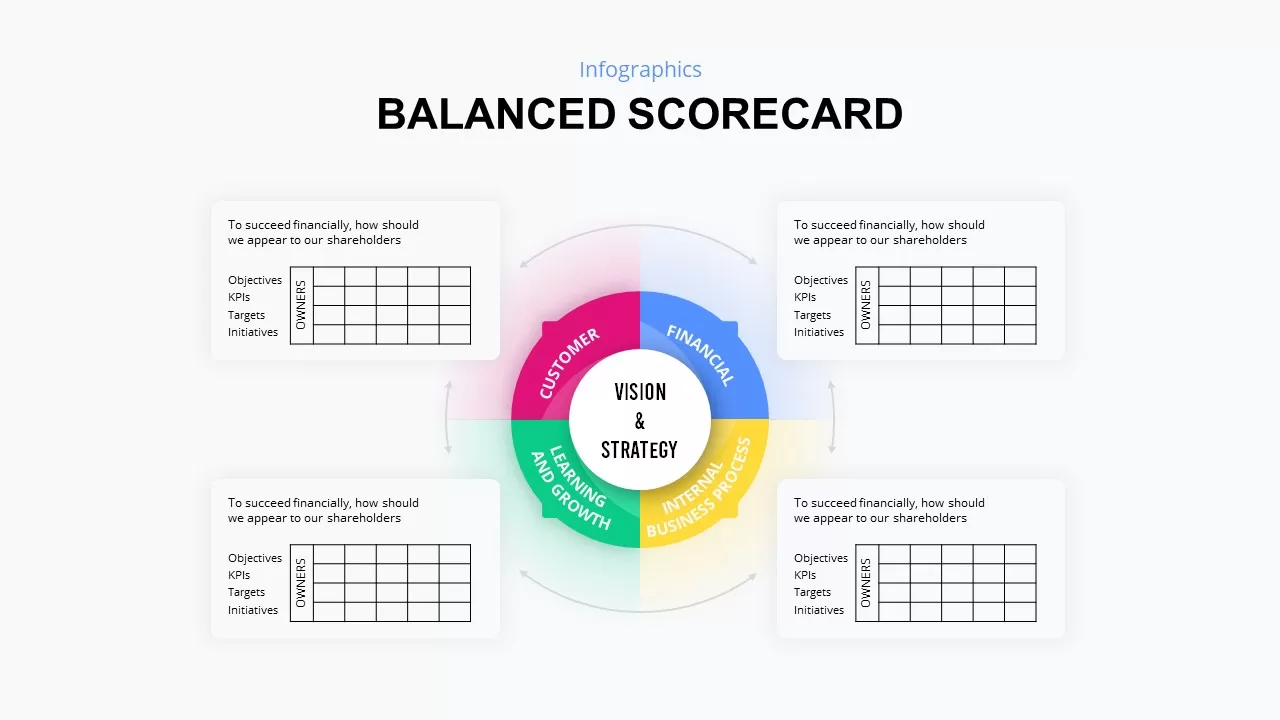
Circular Balanced Scorecard Infographic Template for PowerPoint & Google Slides
Business Strategy
Circular Arrows Infographic Template for PowerPoint & Google Slides
Business
Circular SWOT Analysis Infographic Template for PowerPoint & Google Slides
SWOT

Free Five-Step Circular Timeline Infographic Template for PowerPoint & Google Slides
Timeline
Free
Five-Stage Circular Arrow Infographic Template for PowerPoint & Google Slides
Circular
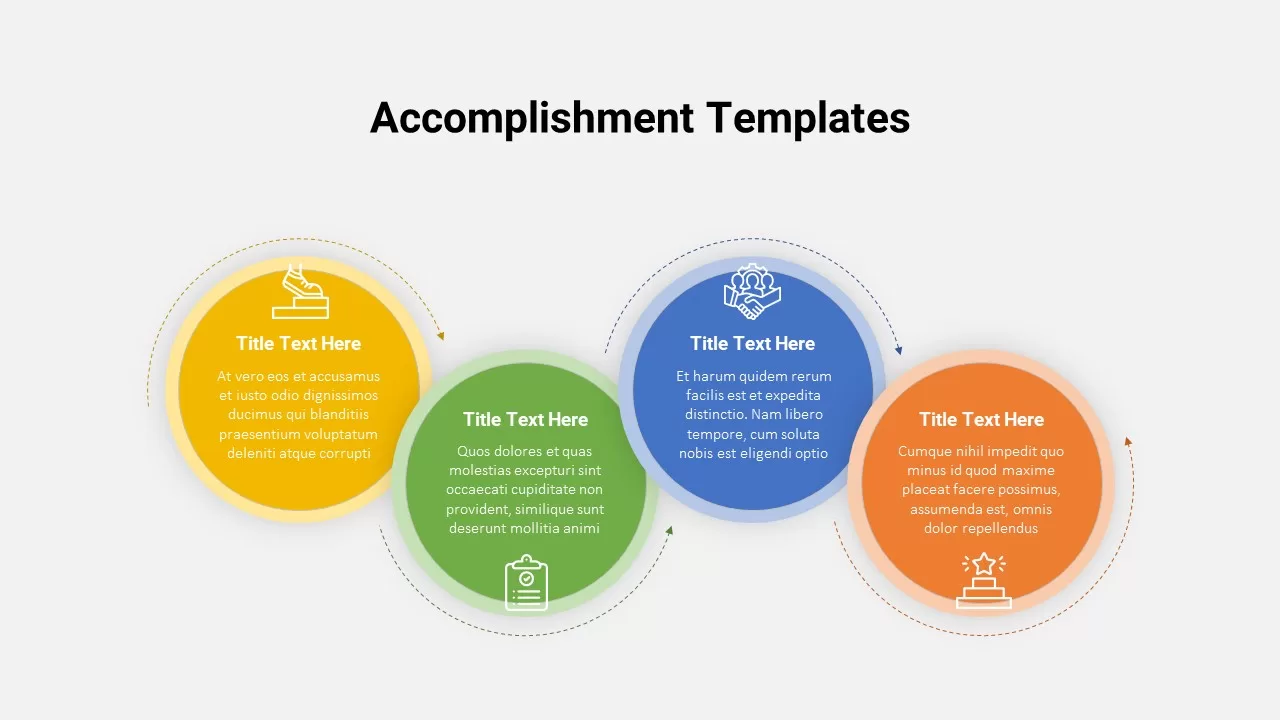
Accomplishment Circular Infographic Template for PowerPoint & Google Slides
Accomplishment
Six-Segment Circular Arrow Infographic Template for PowerPoint & Google Slides
Circular
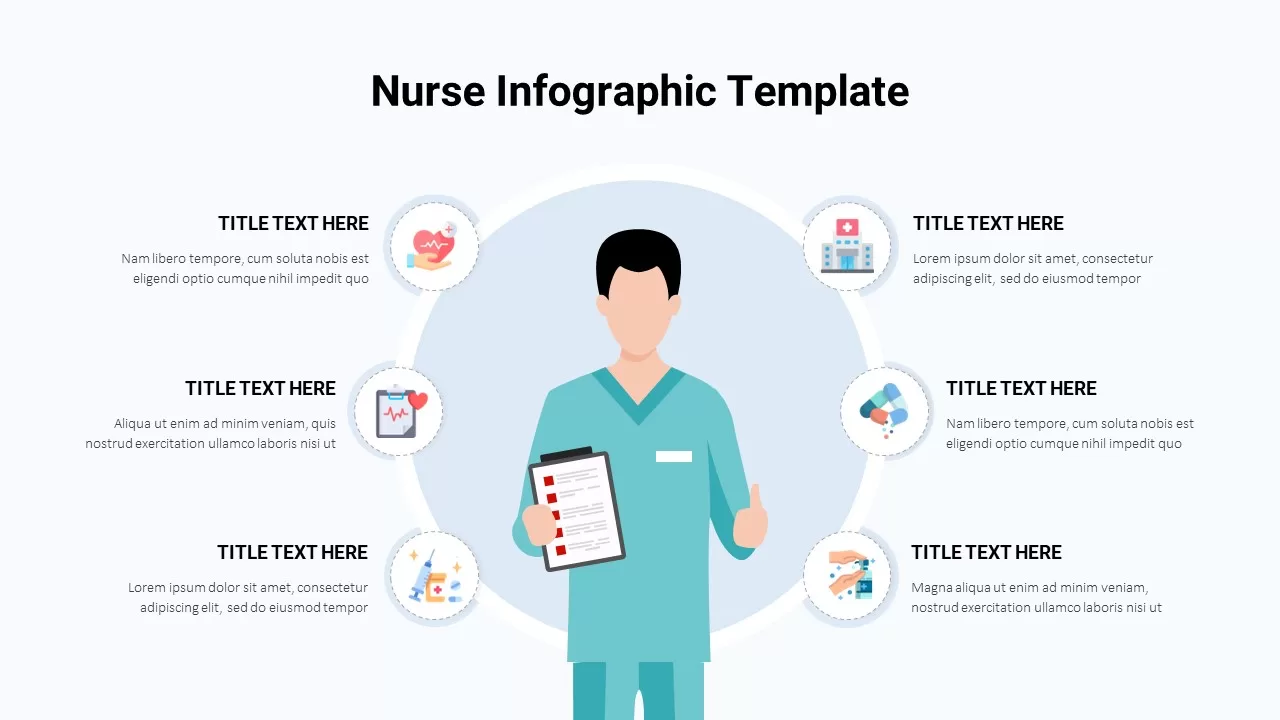
Healthcare Nursing Circular Infographic Template for PowerPoint & Google Slides
Nursing
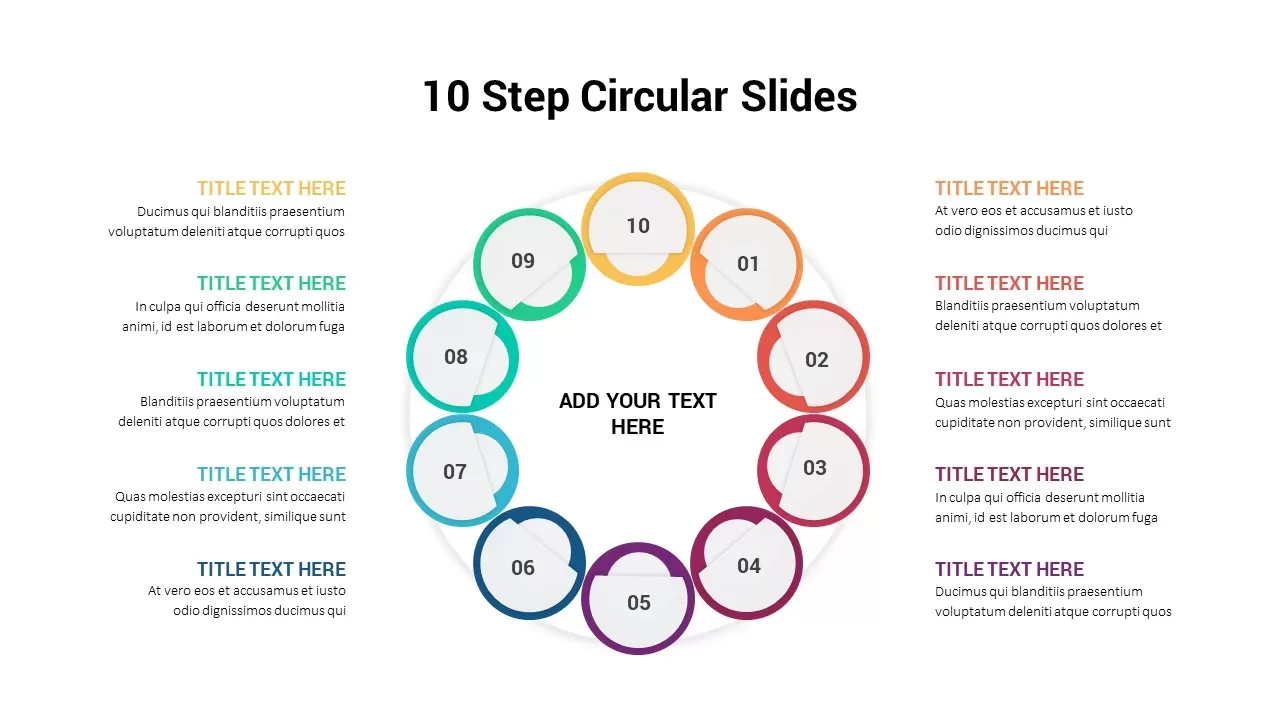
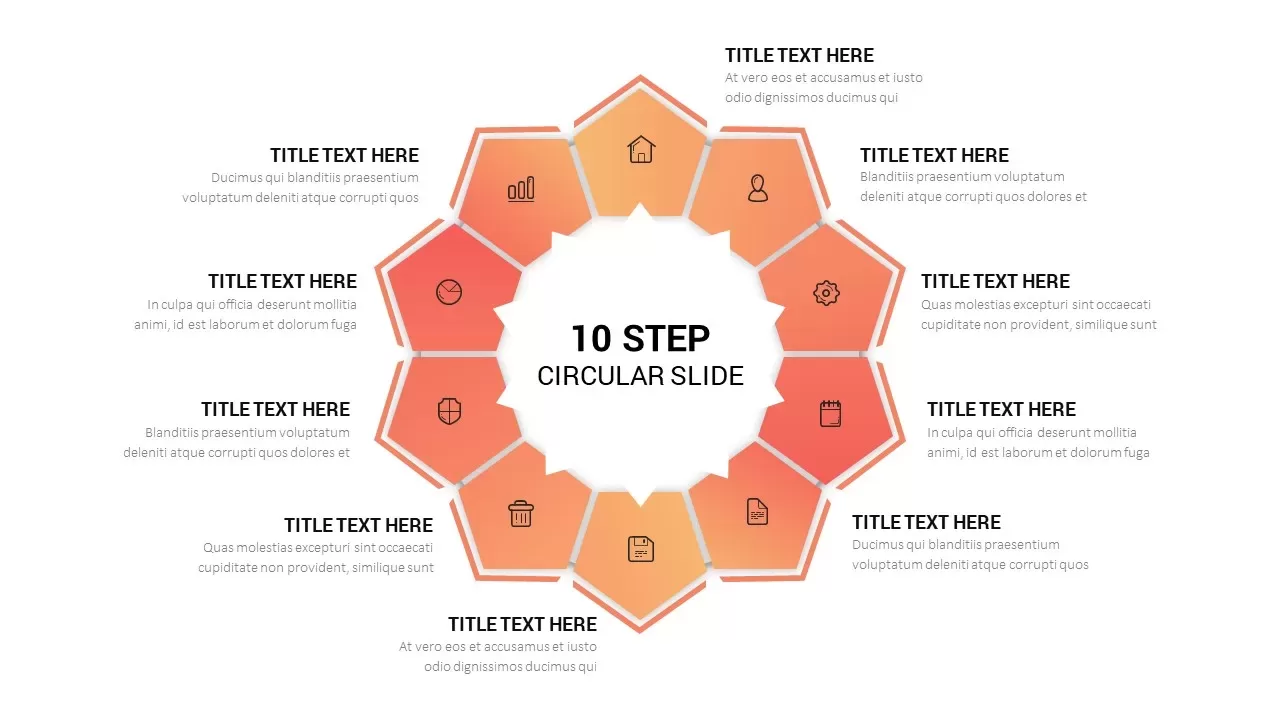
Ten Step Circular Process Infographic Template for PowerPoint & Google Slides
Process
Ten-Step Circular Process Infographic Template for PowerPoint & Google Slides
Circular
Dynamic Circular Hub-and-Spoke Infographic Template for PowerPoint & Google Slides
Circular
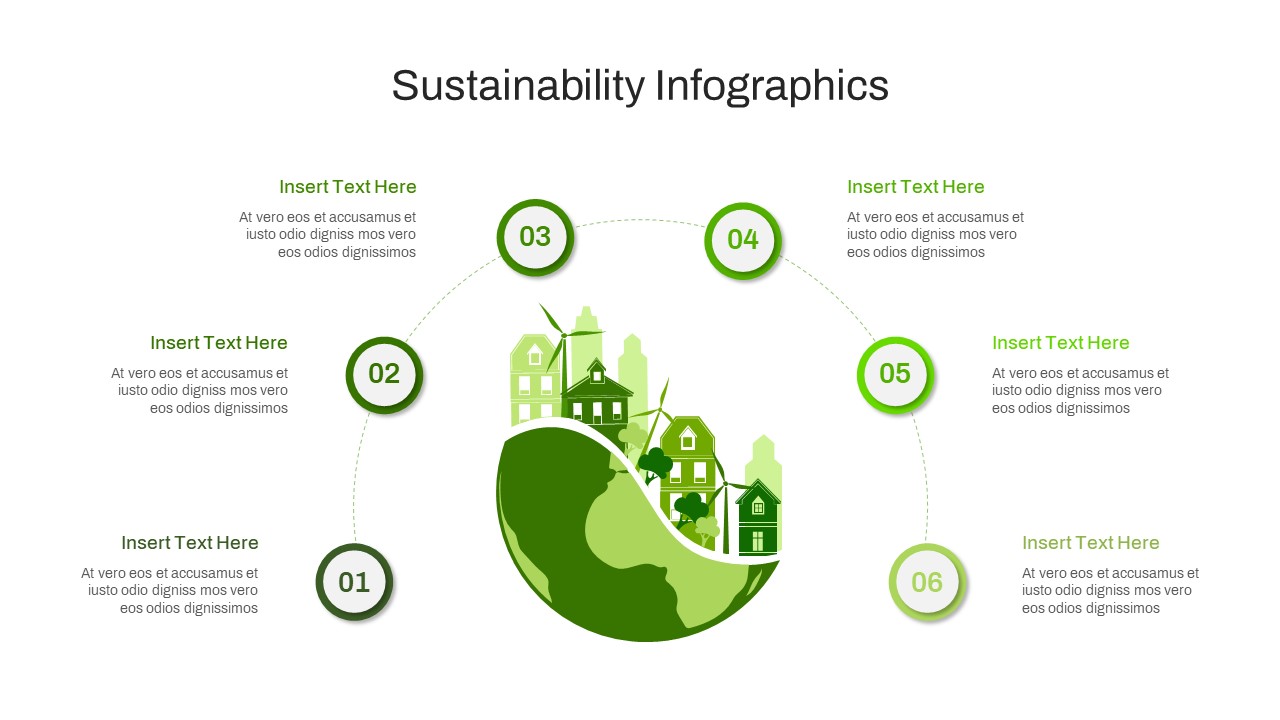
Circular Sustainability Infographic Template for PowerPoint & Google Slides
Process
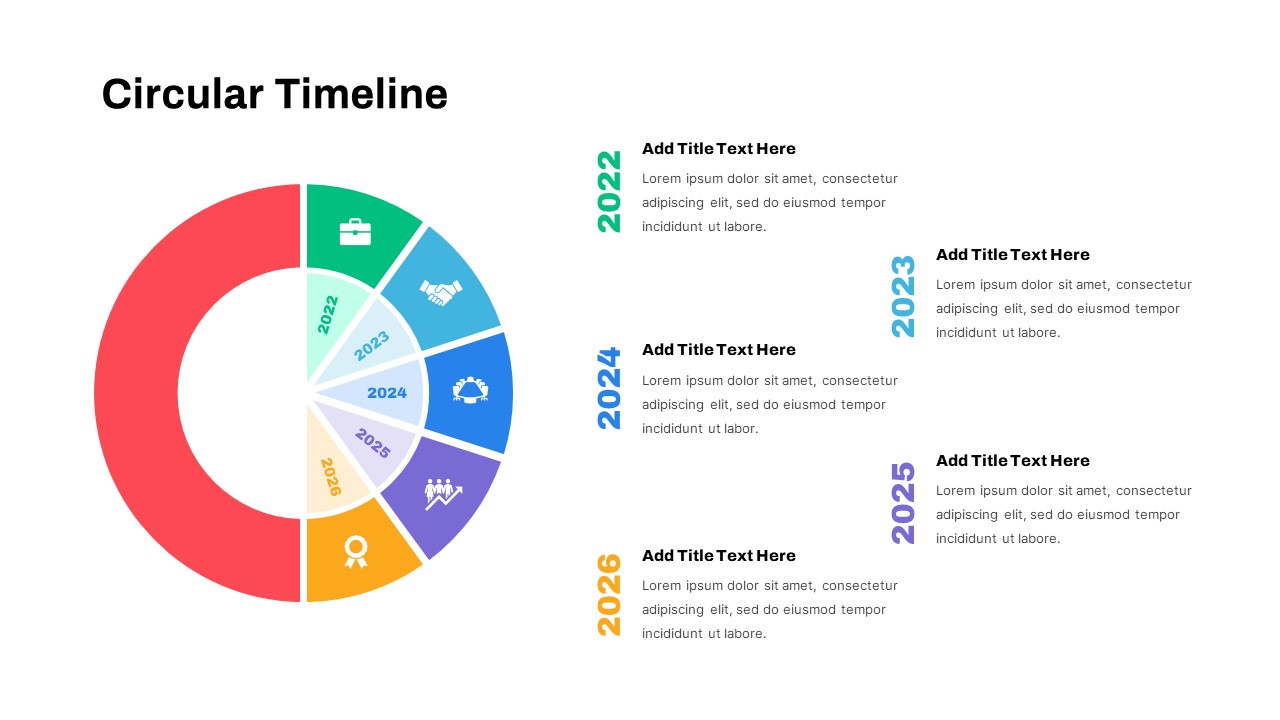
Circular Timeline Infographic Template for PowerPoint & Google Slides
Timeline
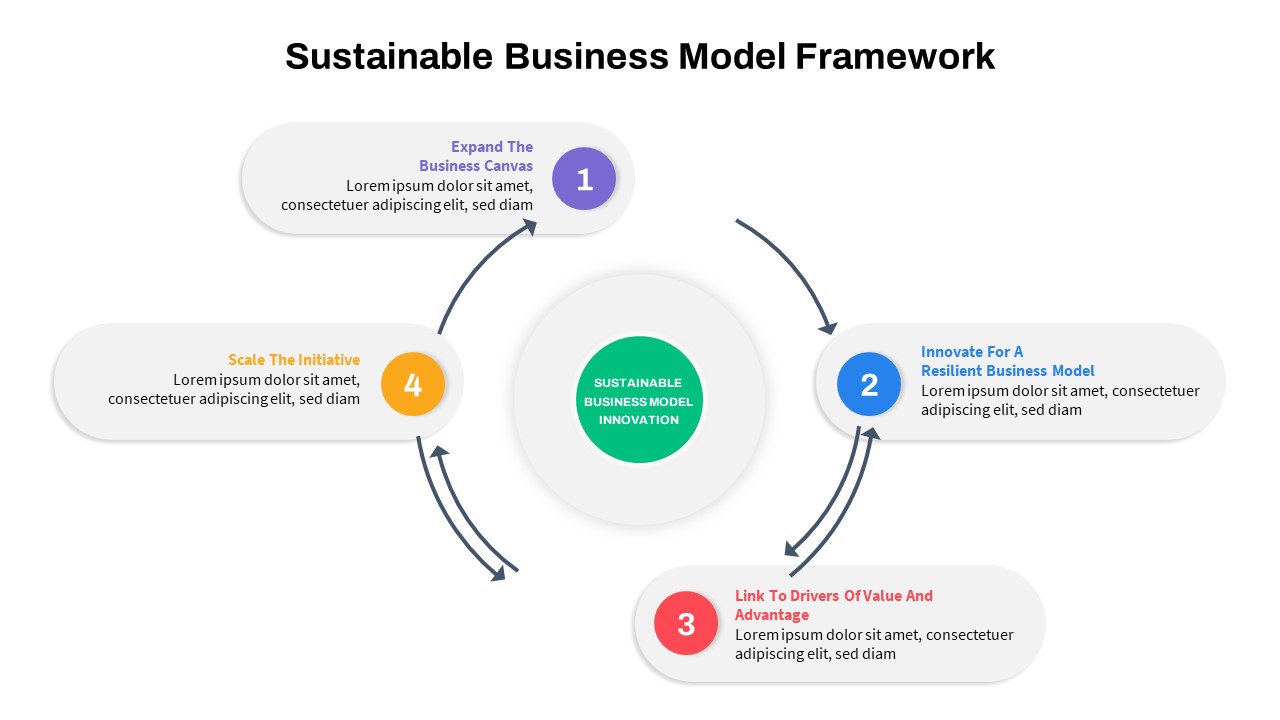
Sustainable Business Model Circular Infographic Template for PowerPoint & Google Slides
Business Strategy
Circular Financial Ratios Infographic Template for PowerPoint & Google Slides
Finance
Circular Business Strategy Infographic Template for PowerPoint & Google Slides
Circular
Service Catalog Circular Infographic Template for PowerPoint & Google Slides
Circular
AI in E-Commerce Circular Infographic Template for PowerPoint & Google Slides
AI
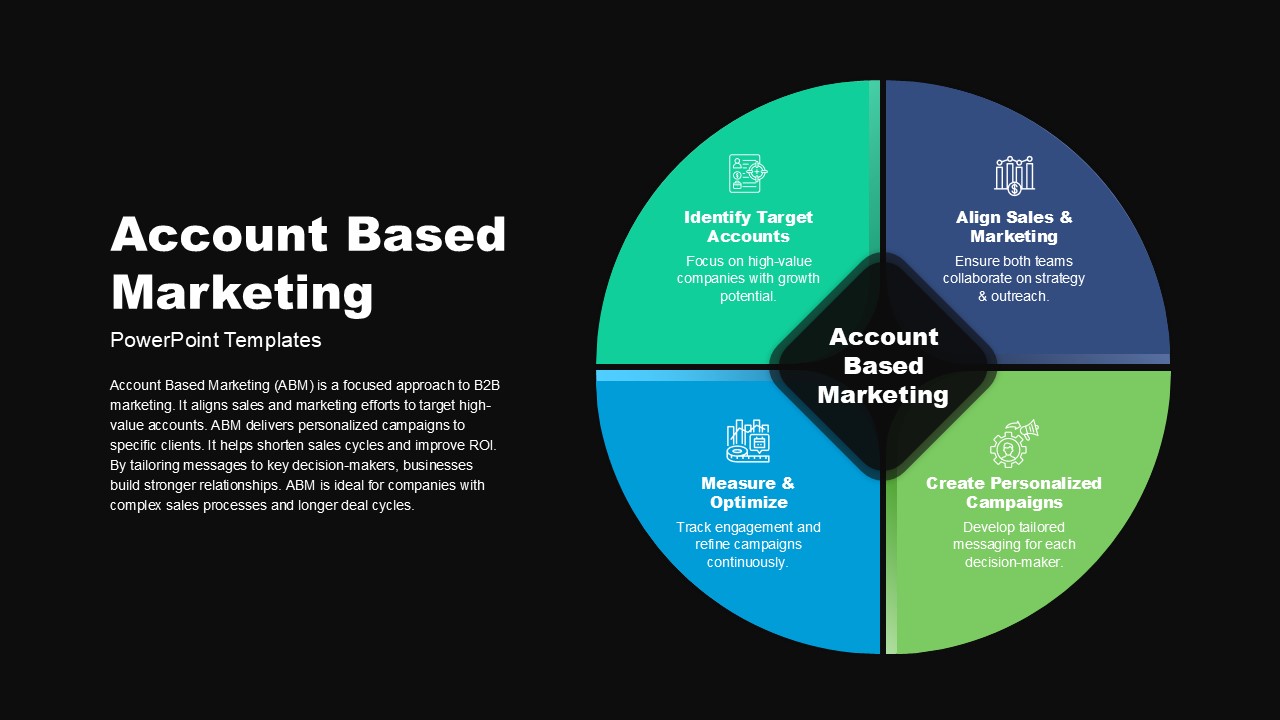
Account Based Marketing Circular Infographic Template for PowerPoint & Google Slides
Marketing
SWOT Analysis Infographic with Circular Icons Template for PowerPoint & Google Slides
SWOT

Go-to-Market Strategy PowerPoint Template for PowerPoint & Google Slides
Marketing
How to Market Your Product template for PowerPoint & Google Slides
Business Strategy
Free
Global Market Share Cylinder Chart Template for PowerPoint & Google Slides
Bar/Column
Market Development Matrix Chart Template for PowerPoint & Google Slides
Comparison Chart
Social Media Market Share Pie Charts Template for PowerPoint & Google Slides
Pie/Donut
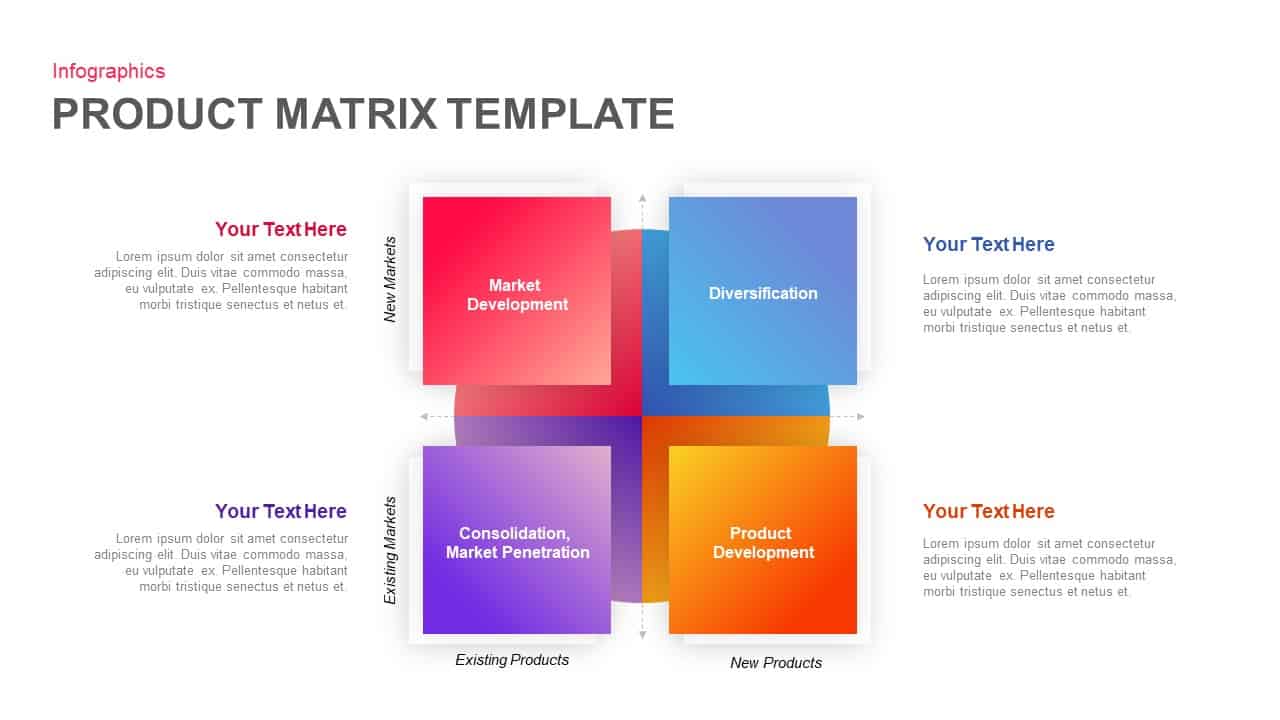
Product Market Expansion Matrix Template for PowerPoint & Google Slides
Business
Car Sales Market Share Pie Chart Template for PowerPoint & Google Slides
BCG
Market Segmentation & STP Infographics Pack Template for PowerPoint & Google Slides
Marketing
Business Case Deck with Market Analysis Template for PowerPoint & Google Slides
Business Report
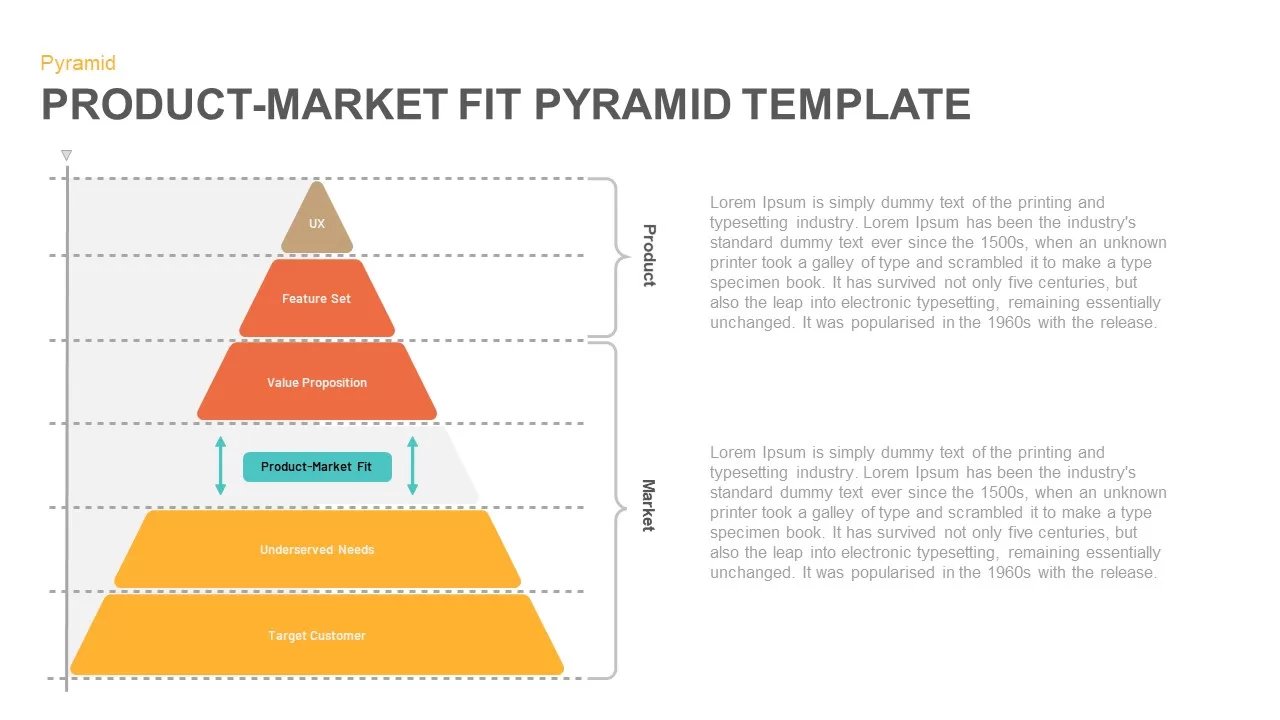
Product-Market Fit Pyramid template for PowerPoint & Google Slides
Pyramid
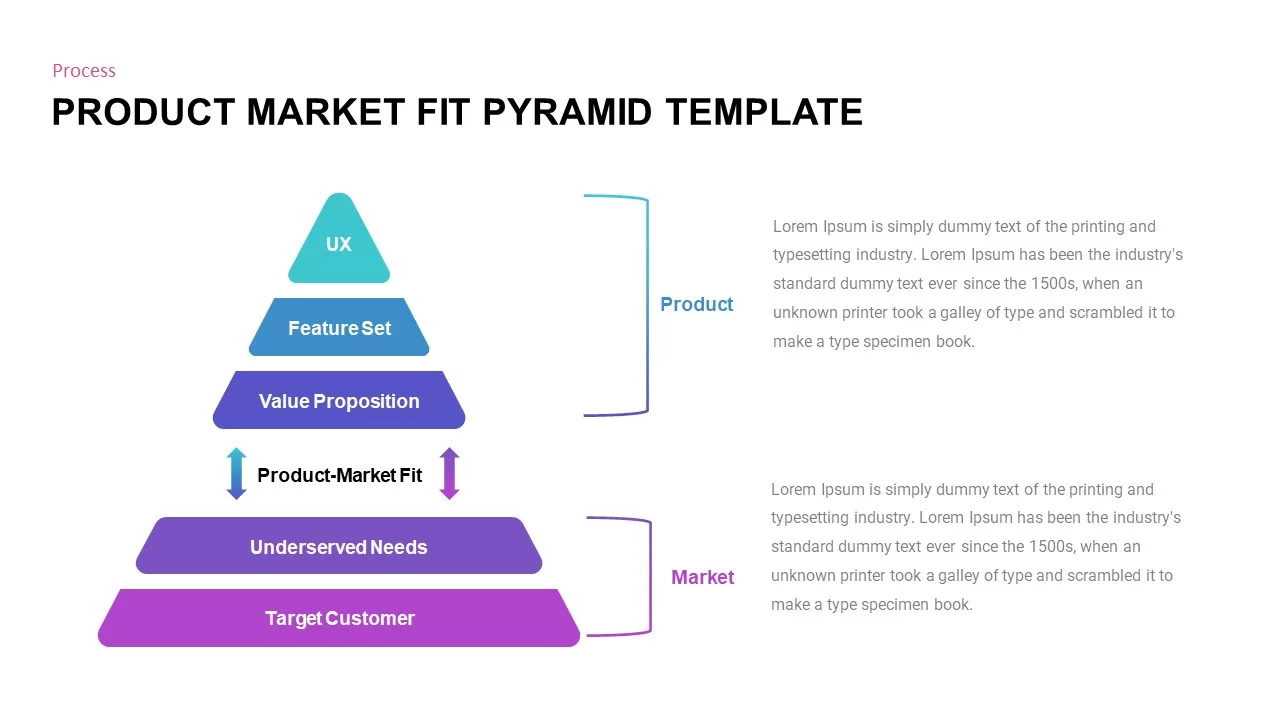
Professional Product Market Fit Pyramid Template for PowerPoint & Google Slides
Pyramid
Business Review Deck with Market Updates Template for PowerPoint & Google Slides
Company Profile
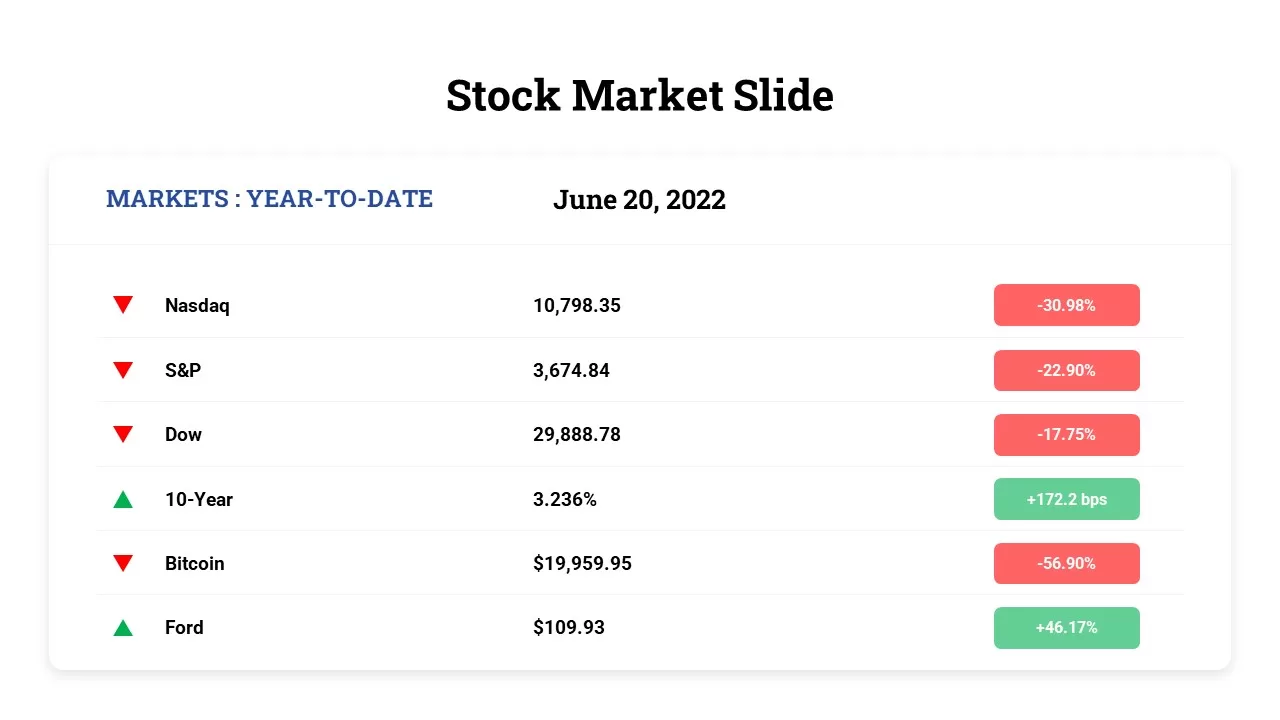
Free Stock Market Performance Overview template for PowerPoint & Google Slides
Finance
Free
Bull and Bear Stock Market Dashboard Template for PowerPoint & Google Slides
Infographics
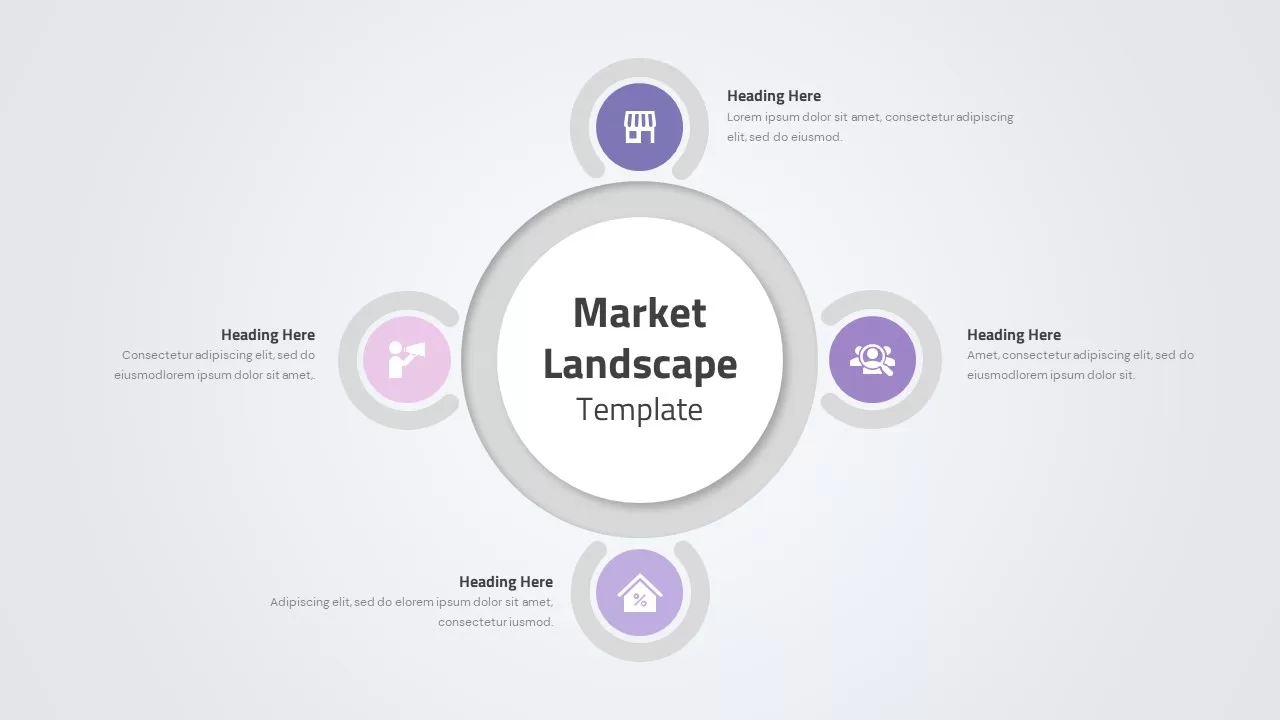
Market Landscape Hub and Spoke Diagram Template for PowerPoint & Google Slides
Infographics
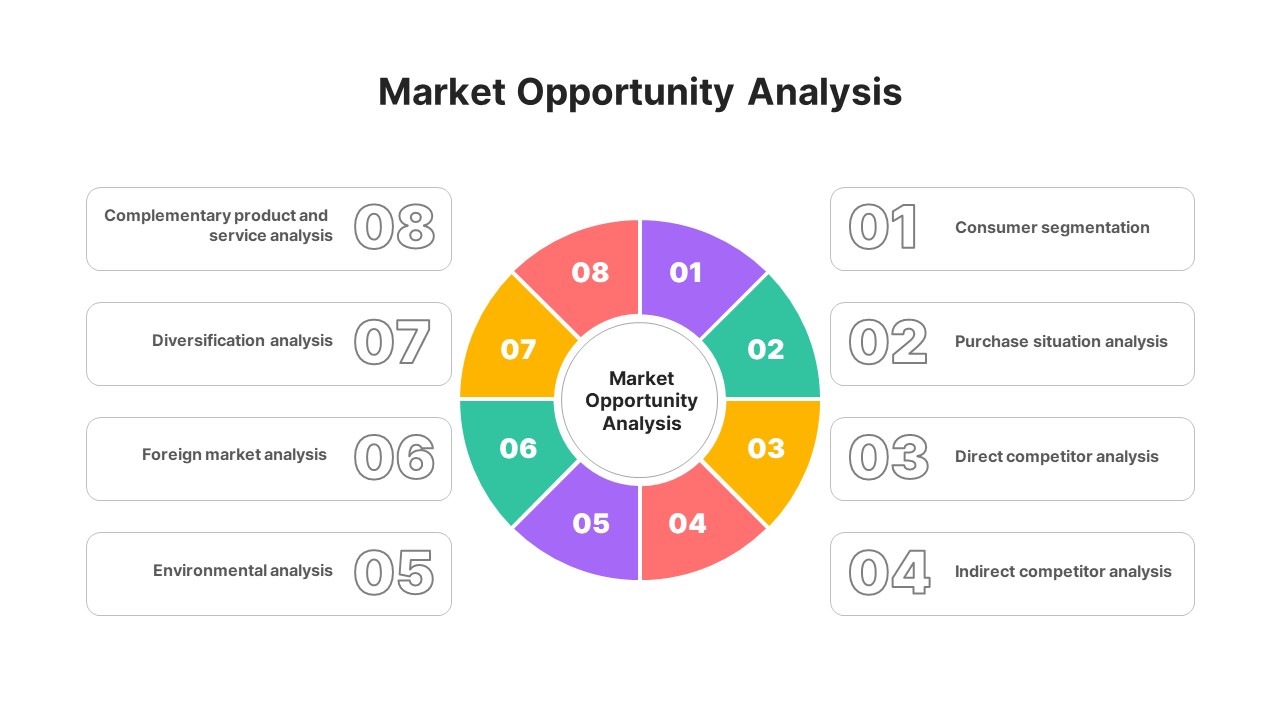
Market Opportunity Analysis Wheel template for PowerPoint & Google Slides
Business Strategy
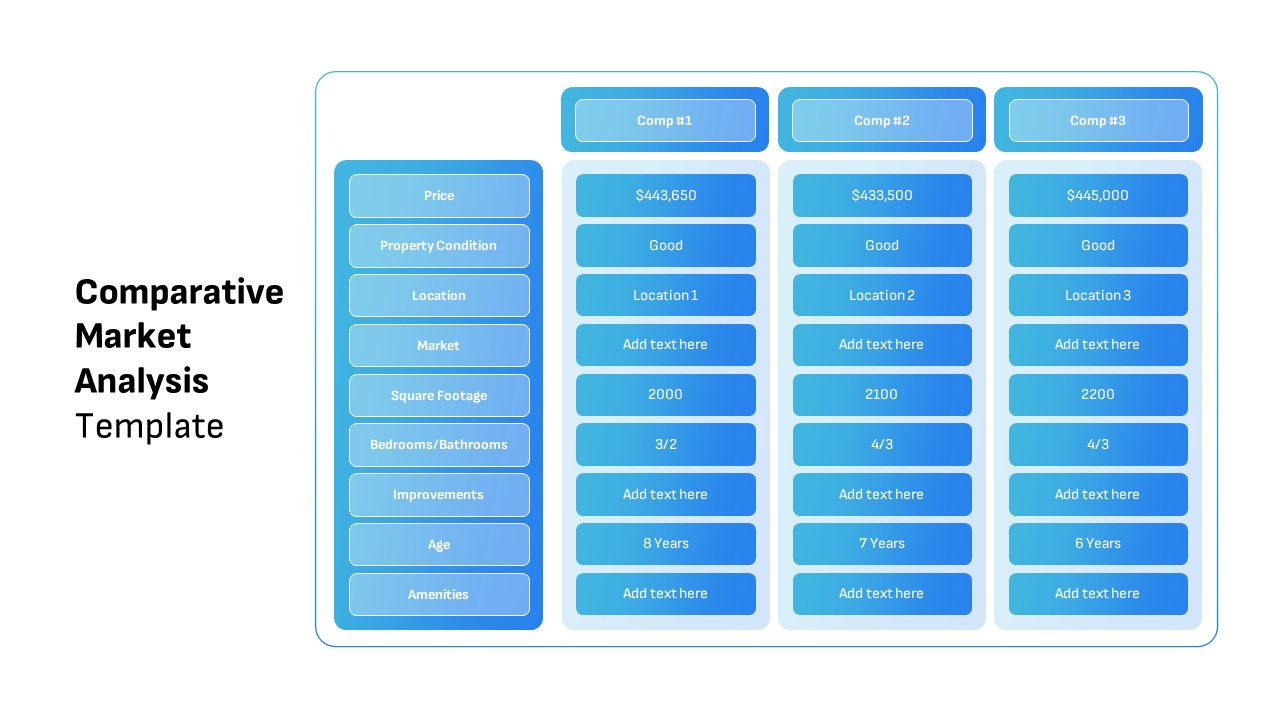
Comparative Market Analysis Template for PowerPoint & Google Slides
Comparison
Free Global Market Distribution Map Template for PowerPoint & Google Slides
World Maps
Free
Neon Dark Stock Market Analysis Template for PowerPoint & Google Slides
Pitch Deck
Free
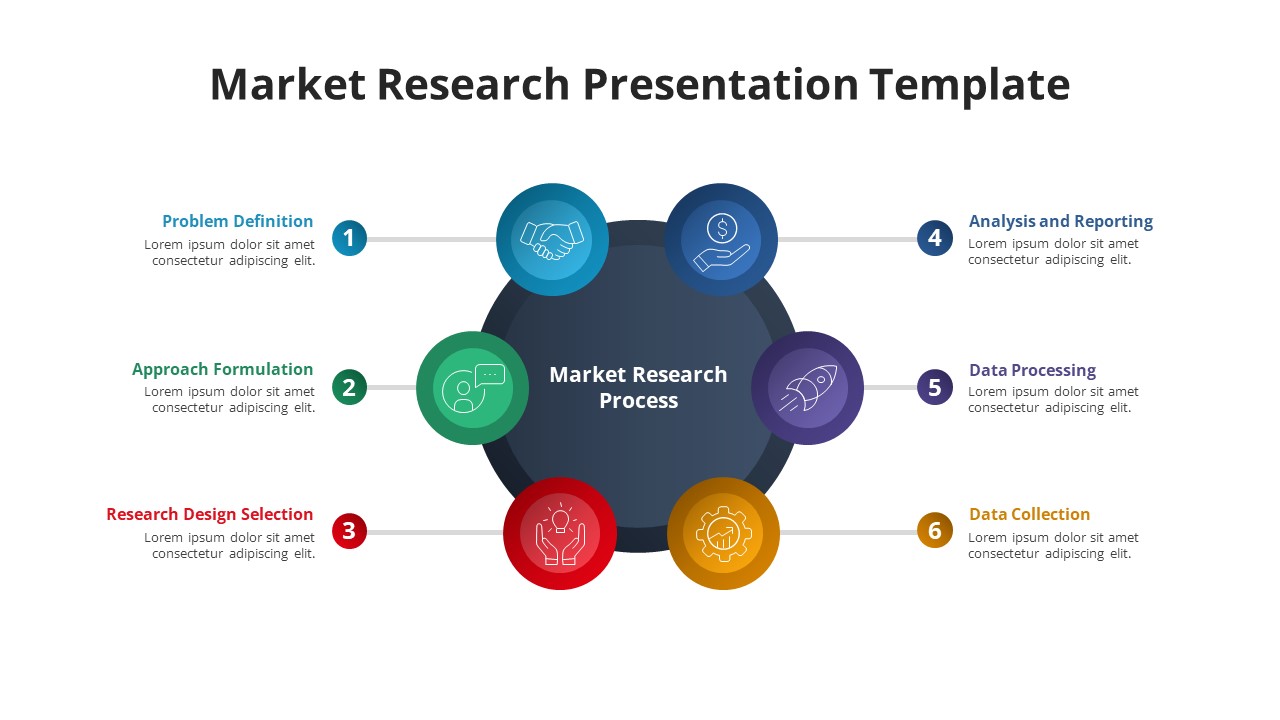
Free Six-Phase Market Research Process Template for PowerPoint & Google Slides
Process
Free
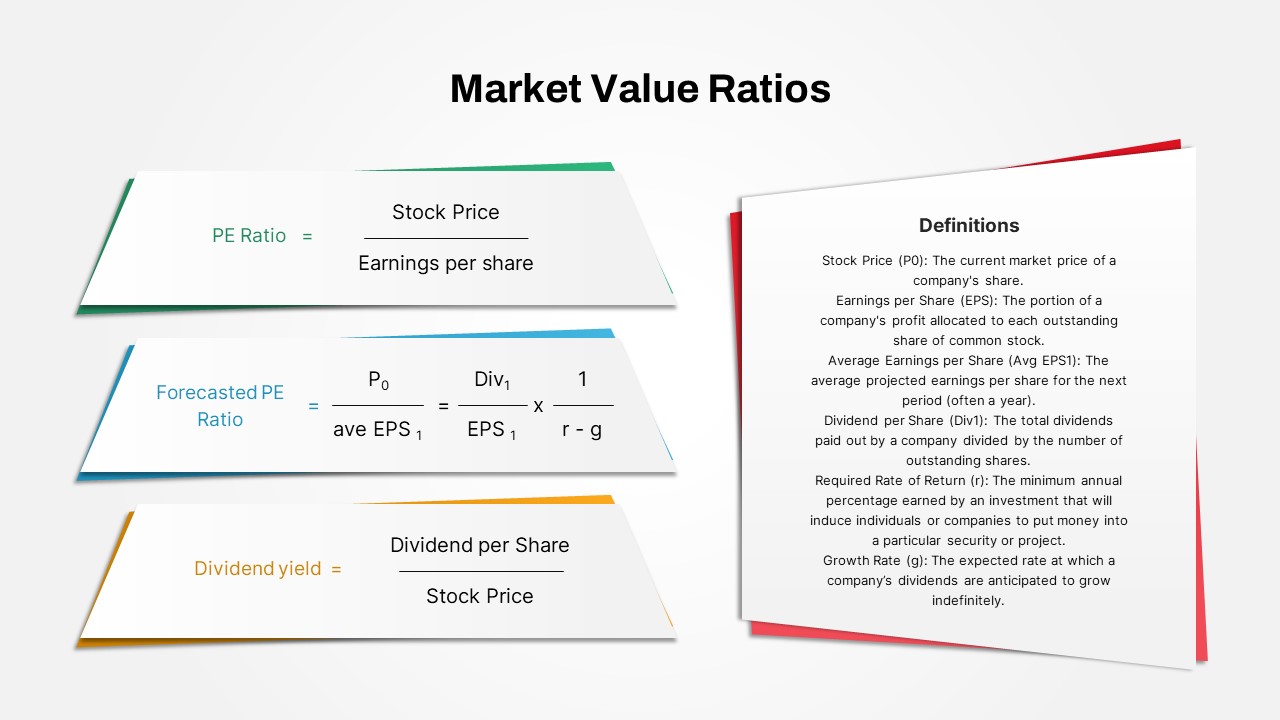
Market Value Ratios Formula Overview Template for PowerPoint & Google Slides
Business Report
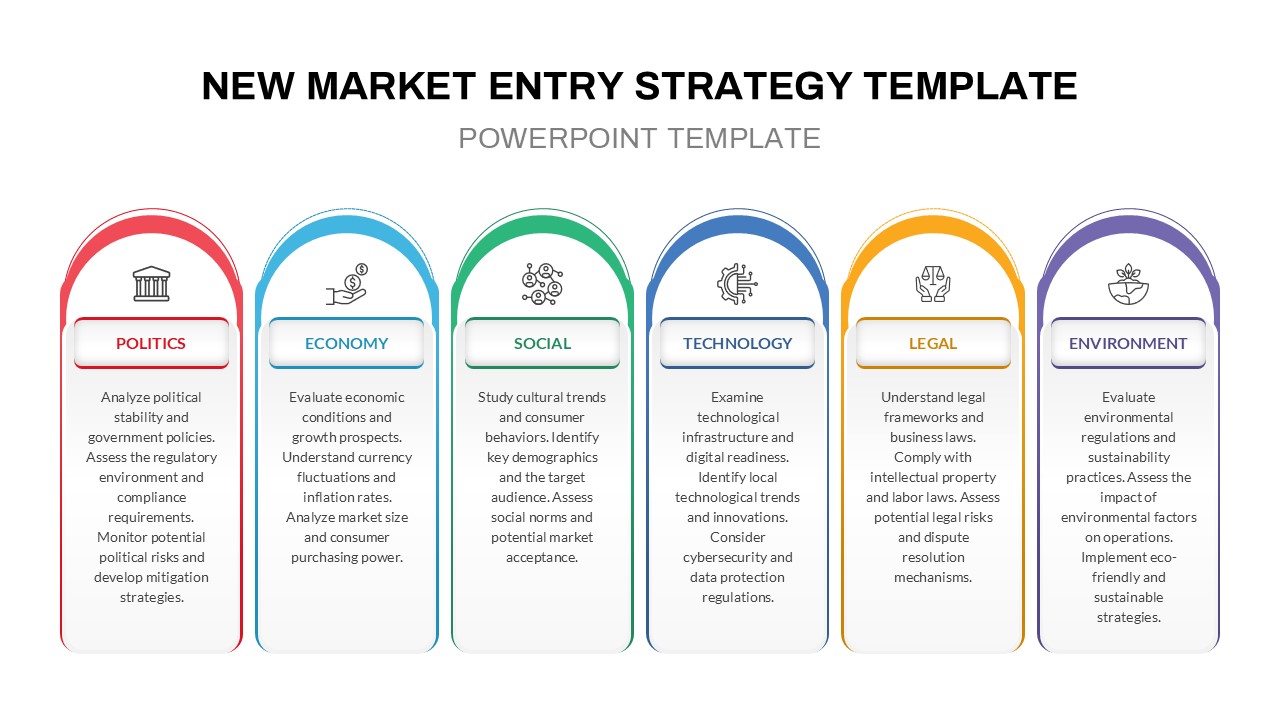
PESTLE Analysis for Market Entry Template for PowerPoint & Google Slides
PEST
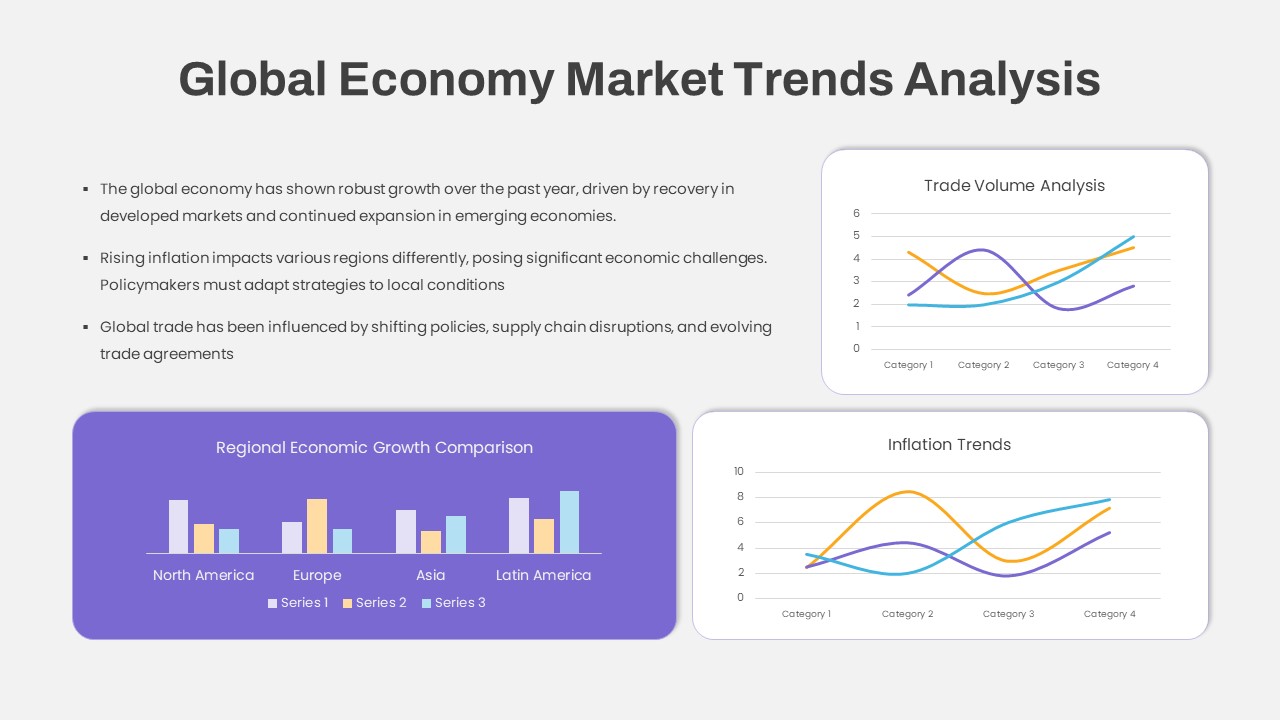
Global Economy Market Trends Analysis Template for PowerPoint & Google Slides
Comparison Chart
Market Validation Metrics Overview Template for PowerPoint & Google Slides
Business
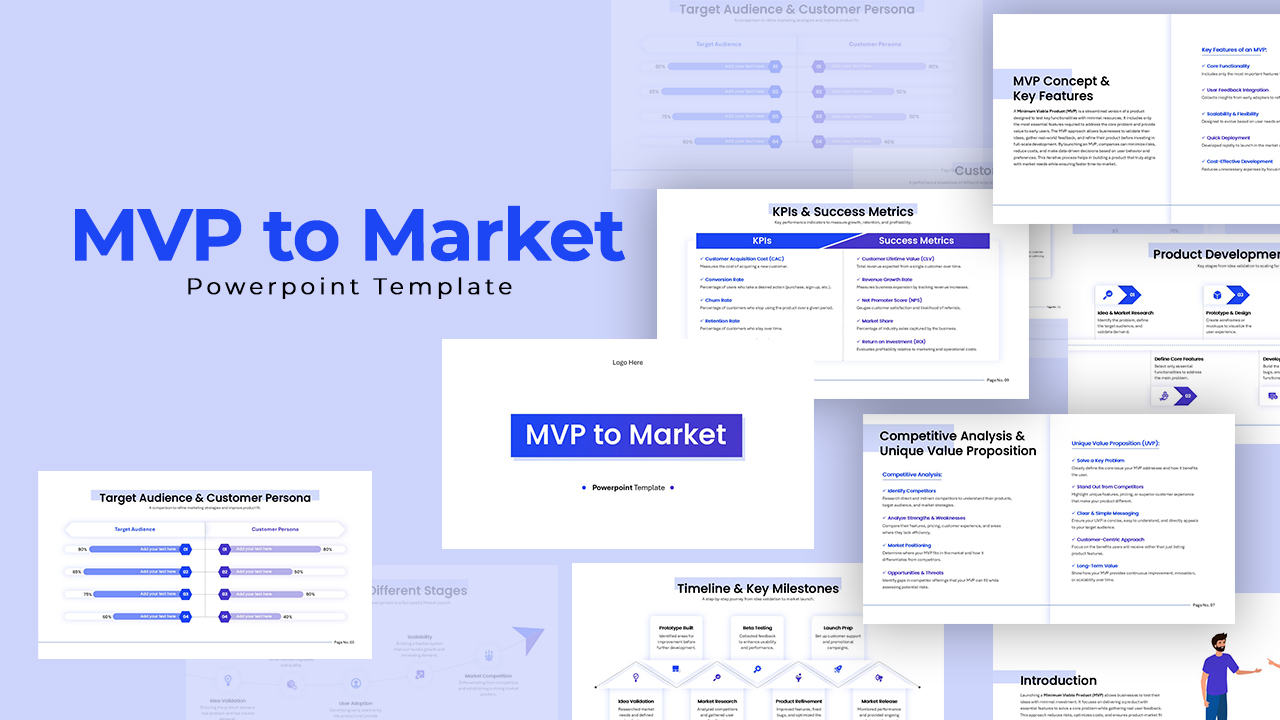
MVP to Market Strategy Pitch Deck Template for PowerPoint & Google Slides
Pitch Deck
Market Share Comparison Diagram Template for PowerPoint & Google Slides
Comparison Chart
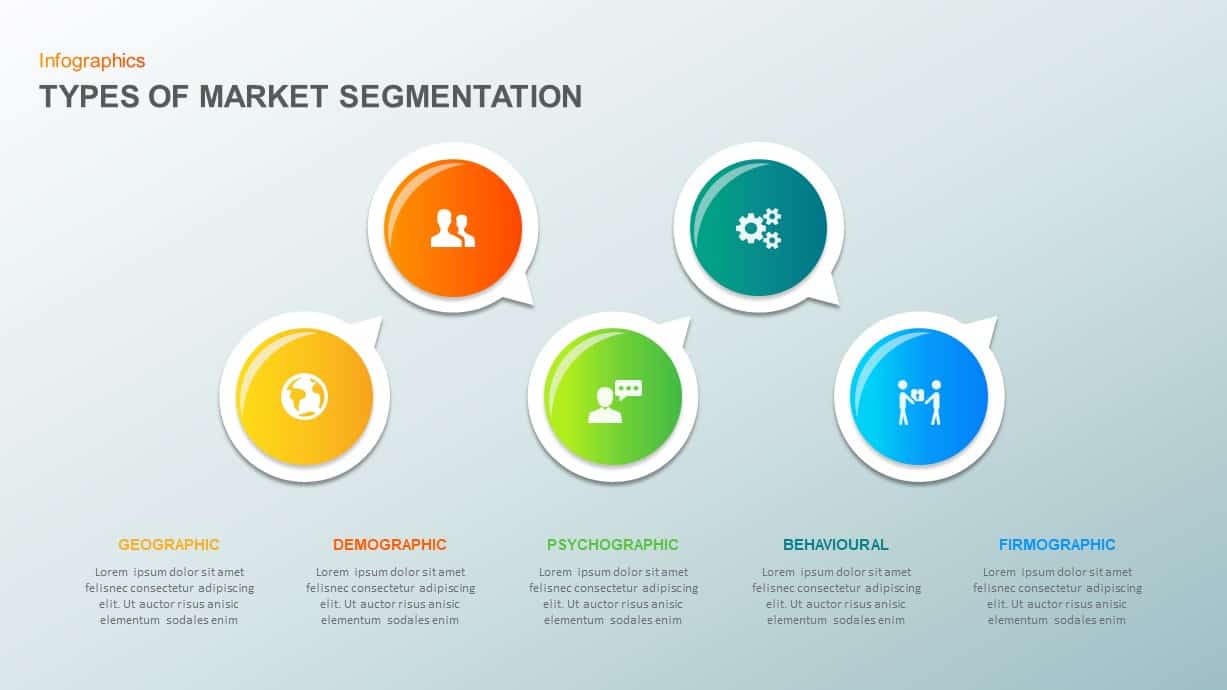
5 Types of Market Segmentation PowerPoint Template
Marketing
3D Arrow Infographics Circular Flow Template for PowerPoint & Google Slides
Arrow
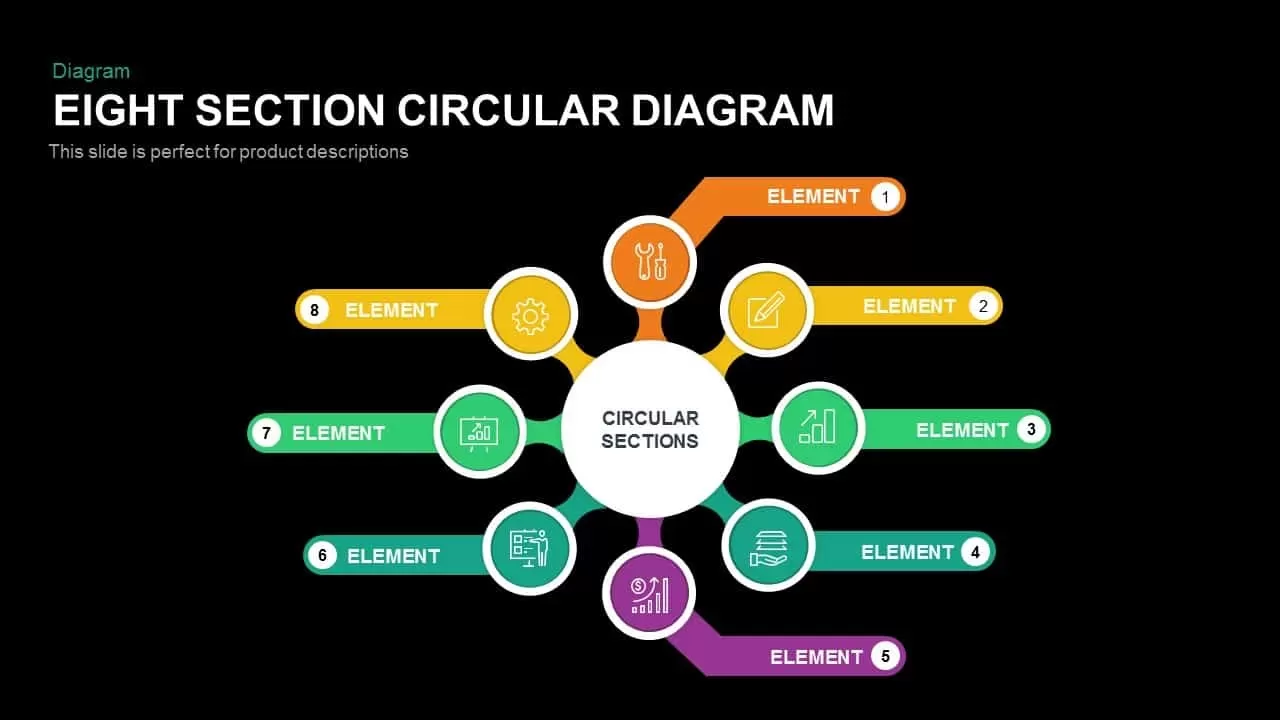
Eight Section Circular Diagram Template for PowerPoint & Google Slides
Circular
Six-Stage Circular Cycle Diagram Template for PowerPoint & Google Slides
Process
Seven-Segment Circular Arrow Diagram Template for PowerPoint & Google Slides
Arrow
Team Member Profile with Circular Photos Template for PowerPoint & Google Slides
Our Team

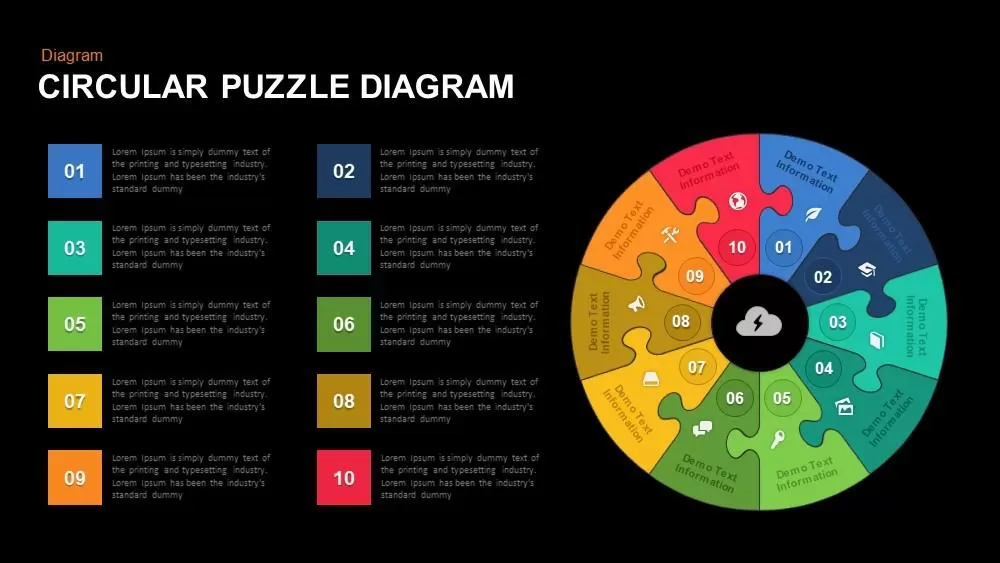
Ten-Piece Circular Puzzle Diagram Template for PowerPoint & Google Slides
Circular
Six Stage Circular Diagram with Icons Template for PowerPoint & Google Slides
Circular
Six Segment Hexagon Circular Diagram Template for PowerPoint & Google Slides
Circular
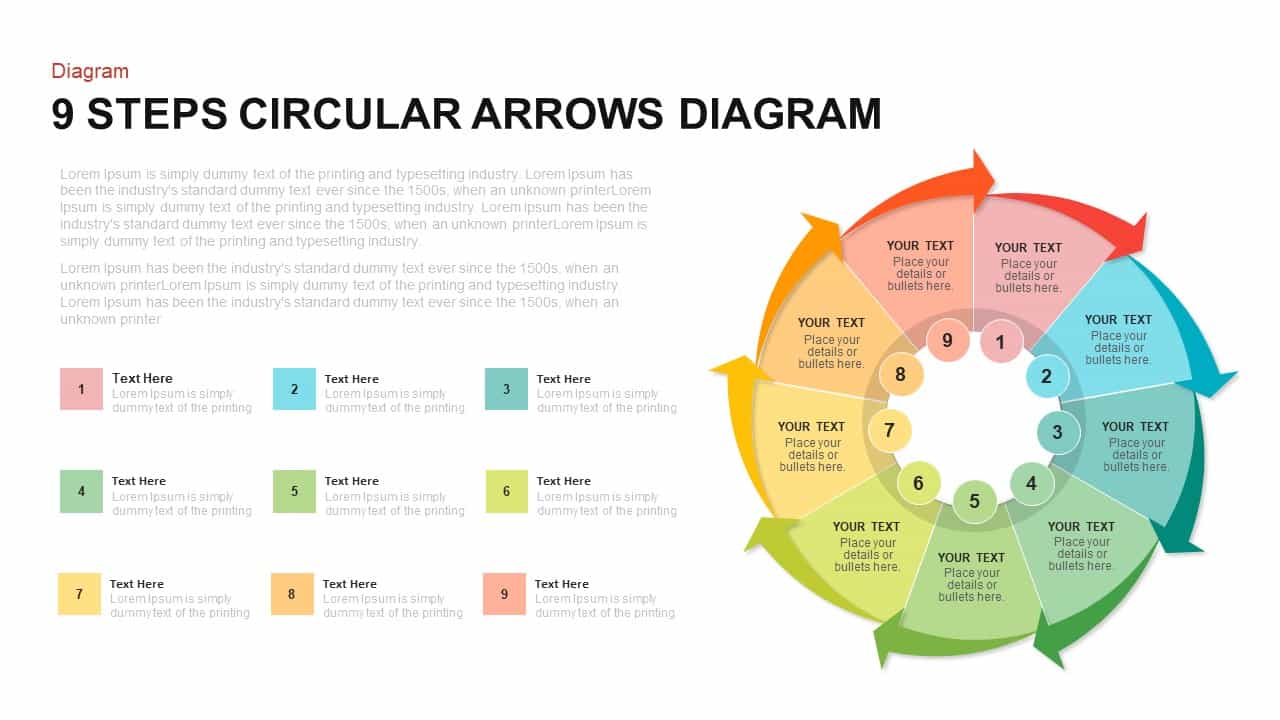
9-Step Circular Arrows Process Diagram Template for PowerPoint & Google Slides
Process
3, 4 & 5 Circular Stages Cycle Diagram Deck Template for PowerPoint & Google Slides
Circular
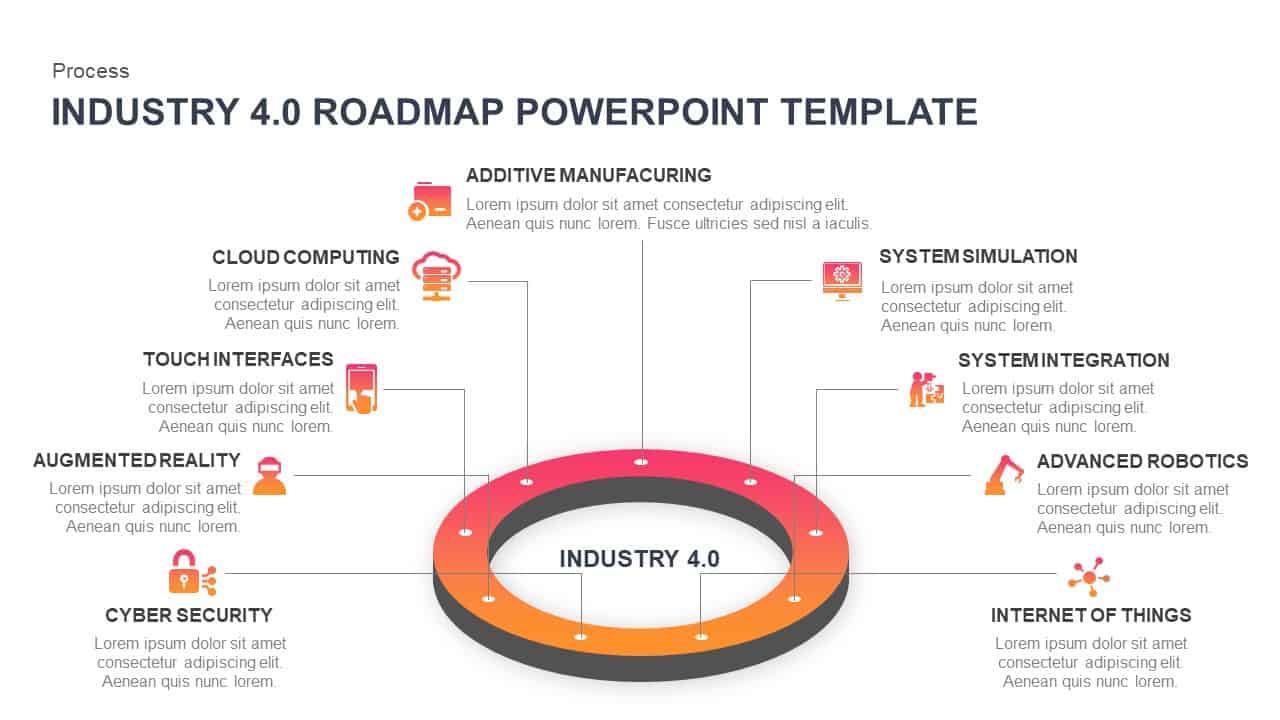
Industry 4.0 Roadmap Circular Ring Template for PowerPoint & Google Slides
Roadmap
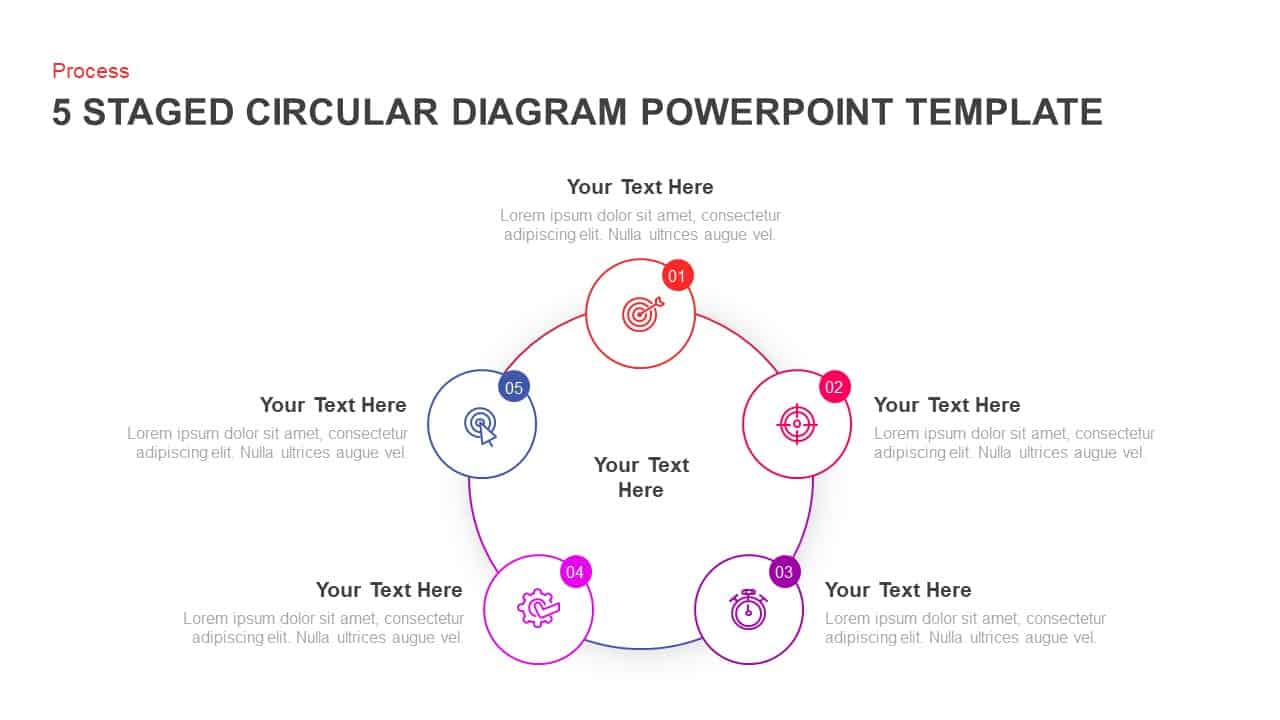
Five-Stage Circular Process Diagram Template for PowerPoint & Google Slides
Circular
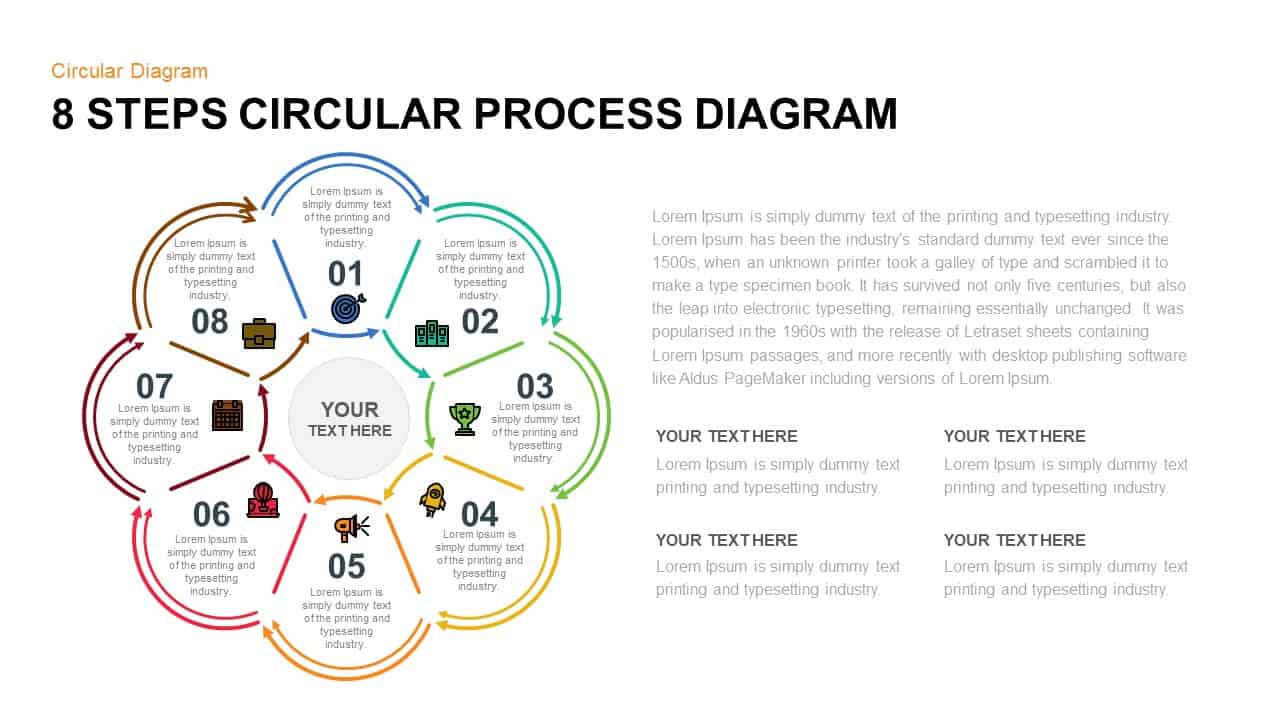
8 Steps Circular Process Diagram Template for PowerPoint & Google Slides
Circular
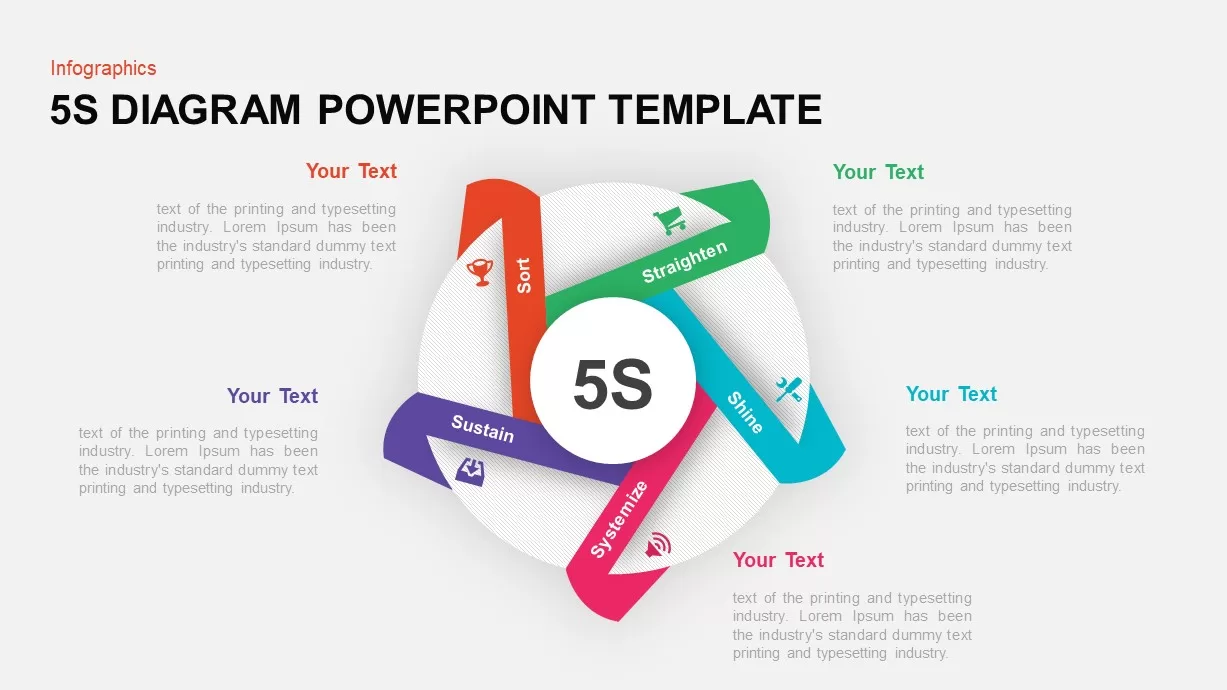
5S Lean Methodology Circular Diagram Template for PowerPoint & Google Slides
Process
Four-Step Circular Process Infographics Template for PowerPoint & Google Slides
Circular
Multi-Color Enneagram Circular Diagram Template for PowerPoint & Google Slides
Circular
Circular Product Comparison Chart Template for PowerPoint & Google Slides
Comparison Chart
Circular Arrows Process Flow template for PowerPoint & Google Slides
Process
Circular Arrow Process Diagram Template for PowerPoint & Google Slides
Circular
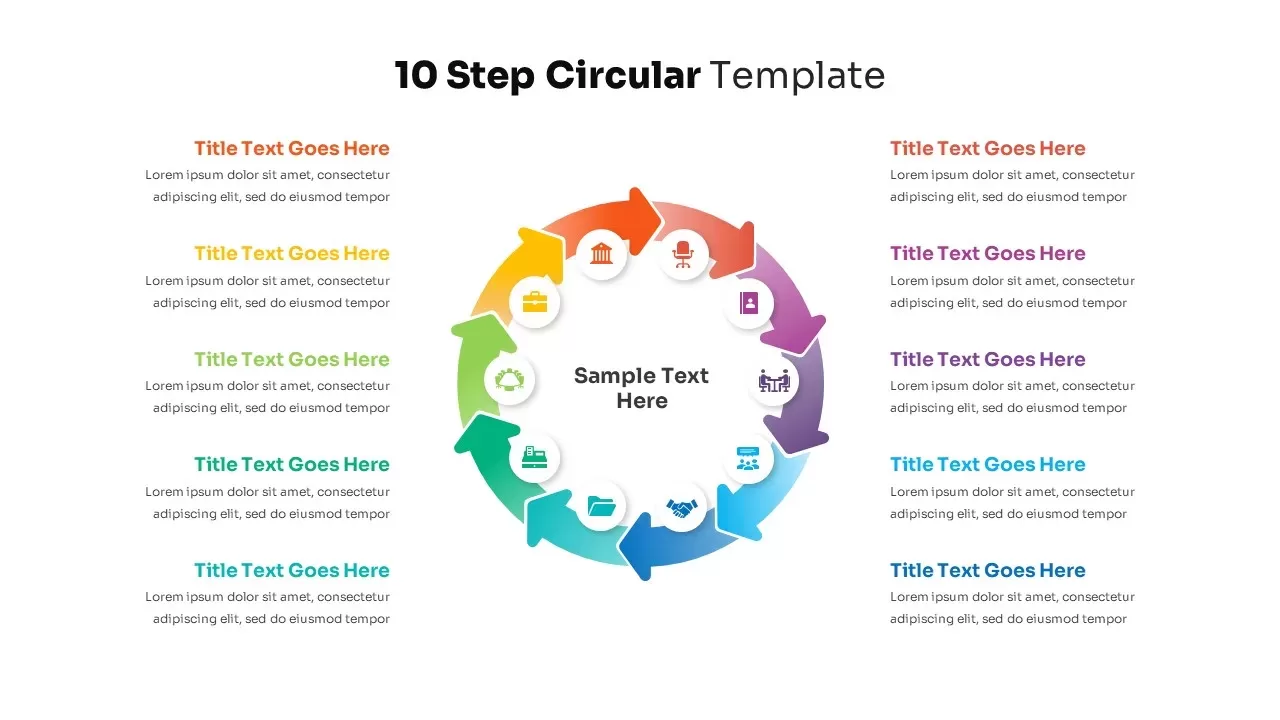
10-Step Circular Process Diagram Template for PowerPoint & Google Slides
Process
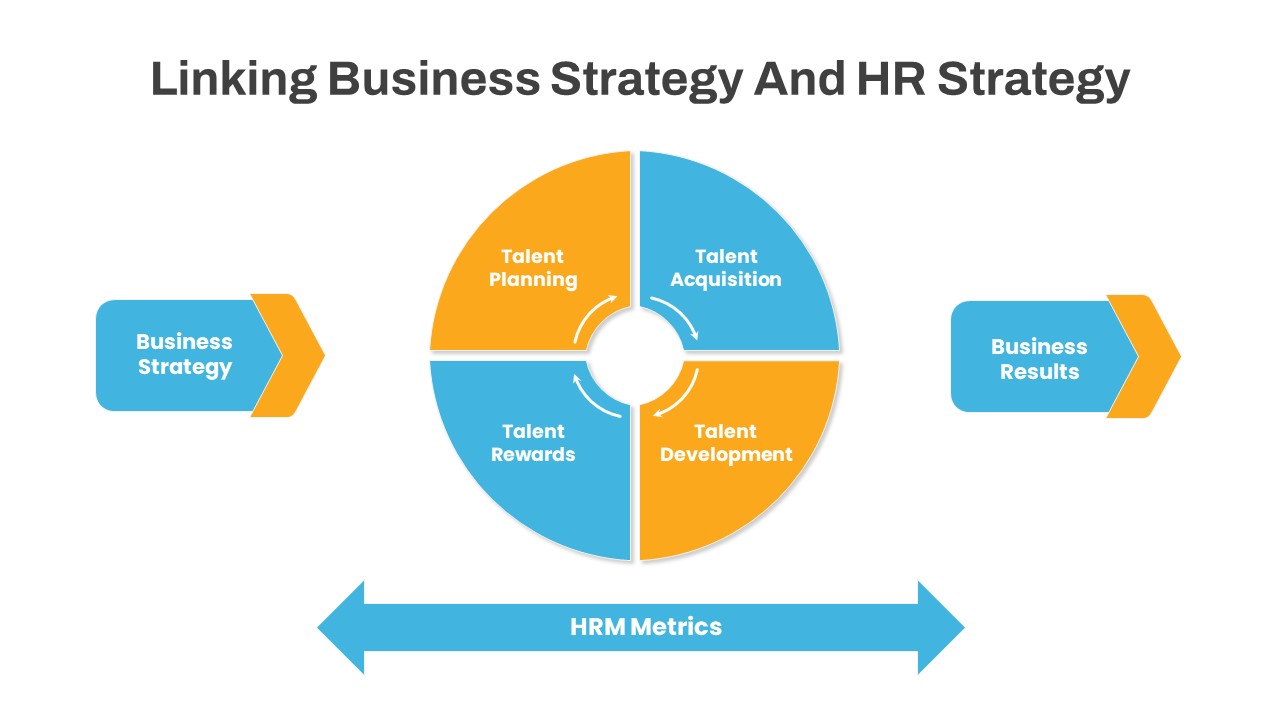
Linking Business HR Strategy Circular Diagram Template for PowerPoint & Google Slides
Business Strategy
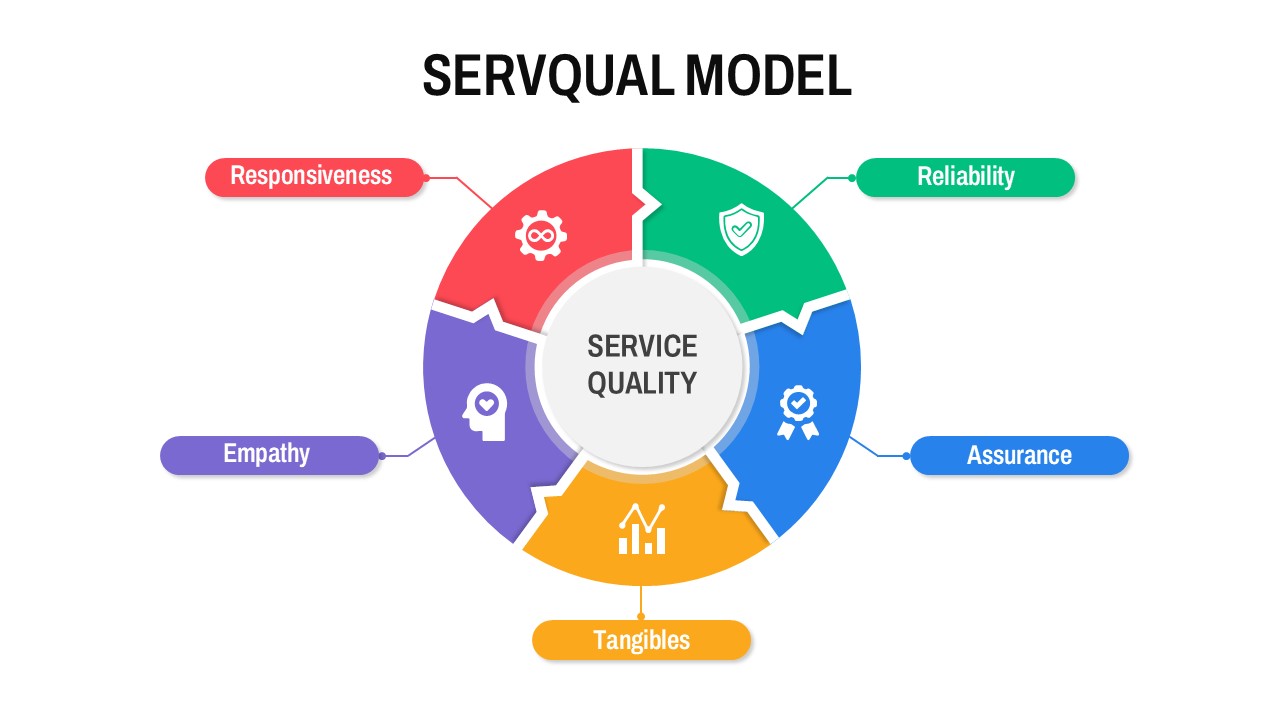
Circular SERVQUAL Model Diagram Template for PowerPoint & Google Slides
Business Strategy
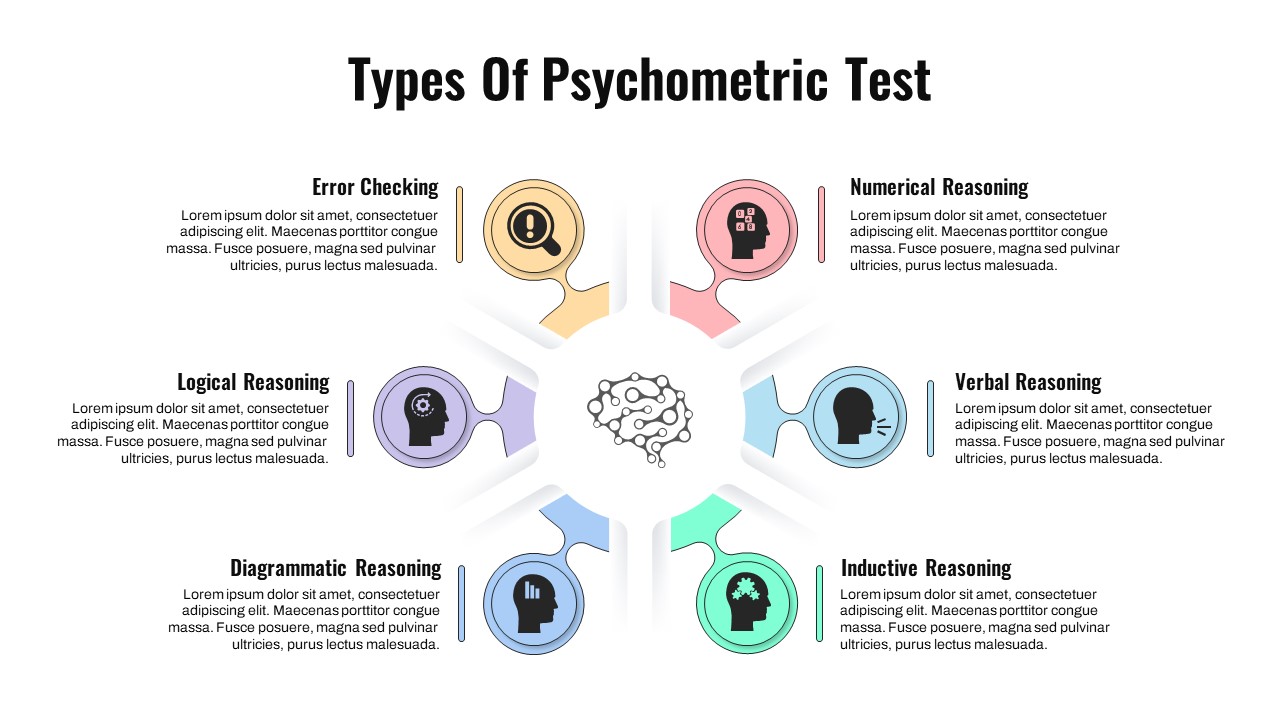
Psychometric Test Types Circular Diagram Template for PowerPoint & Google Slides
Circular
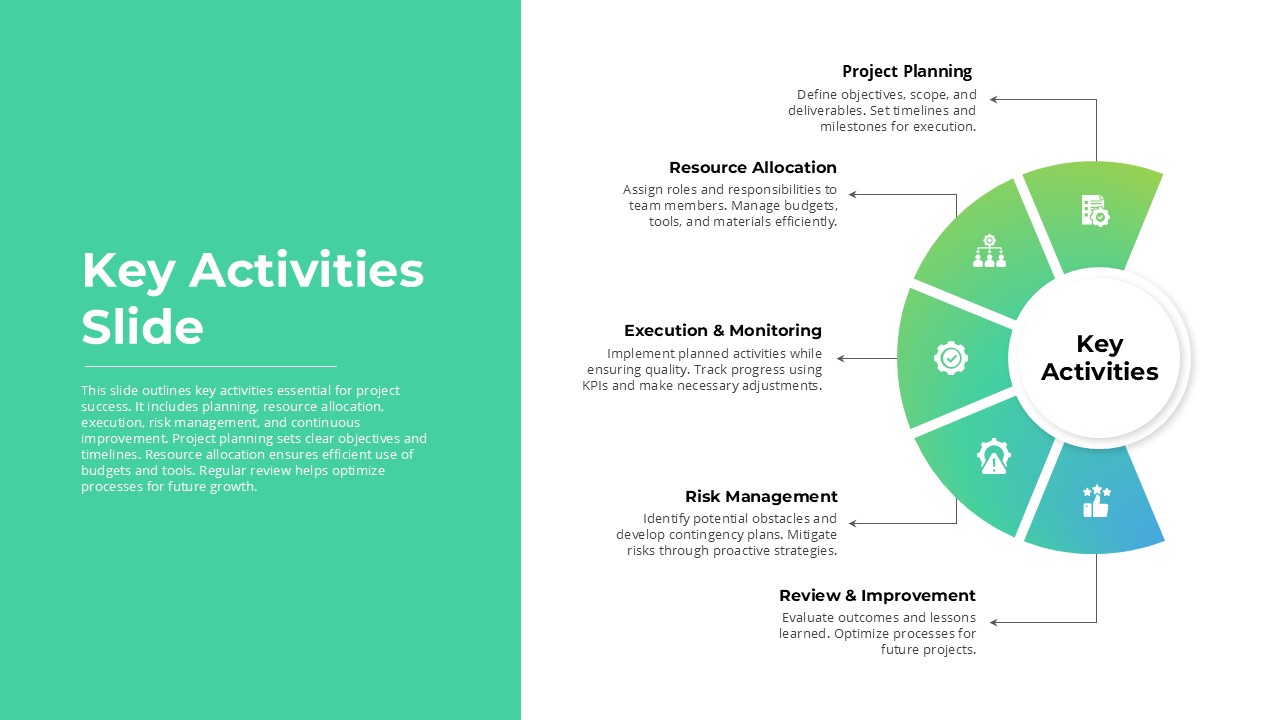
Project Key Activities Circular Diagram Template for PowerPoint & Google Slides
Process
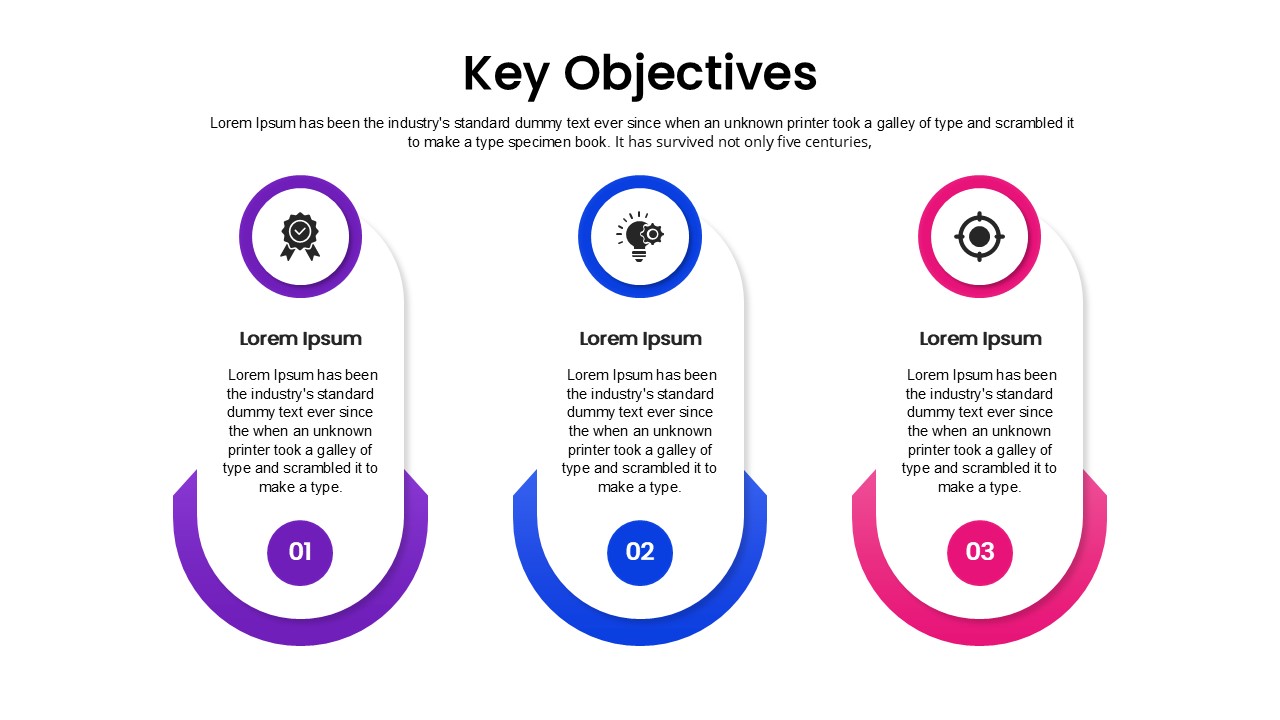
Key Objectives Circular Process template for PowerPoint & Google Slides
Business
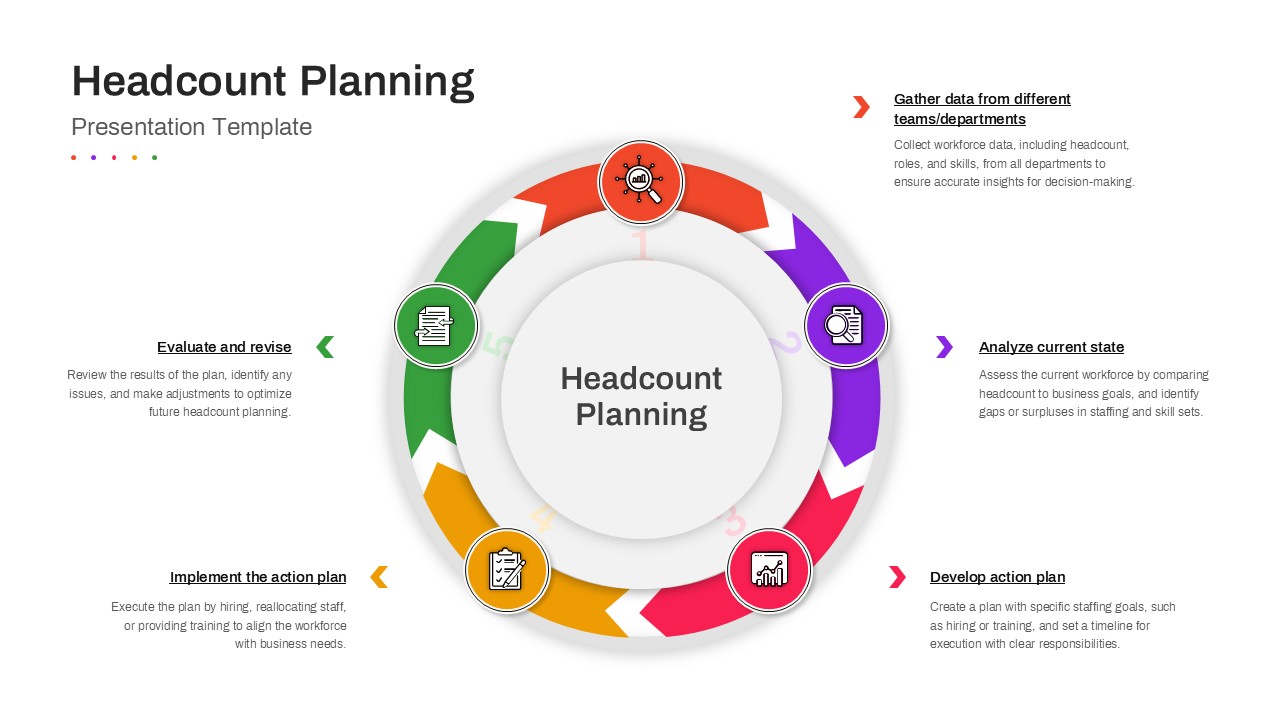
Headcount Planning Circular Process Diagram Template for PowerPoint & Google Slides
HR