Free Venn Diagram template for PowerPoint & Google Slides

Description
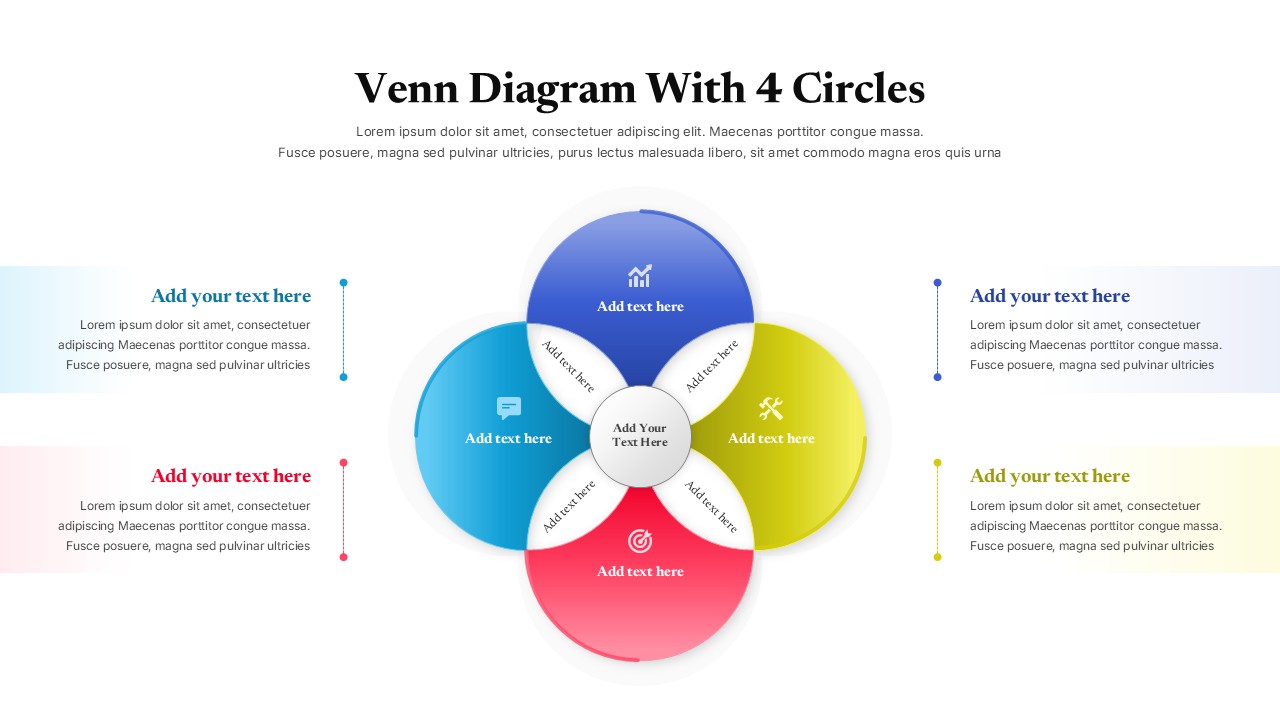
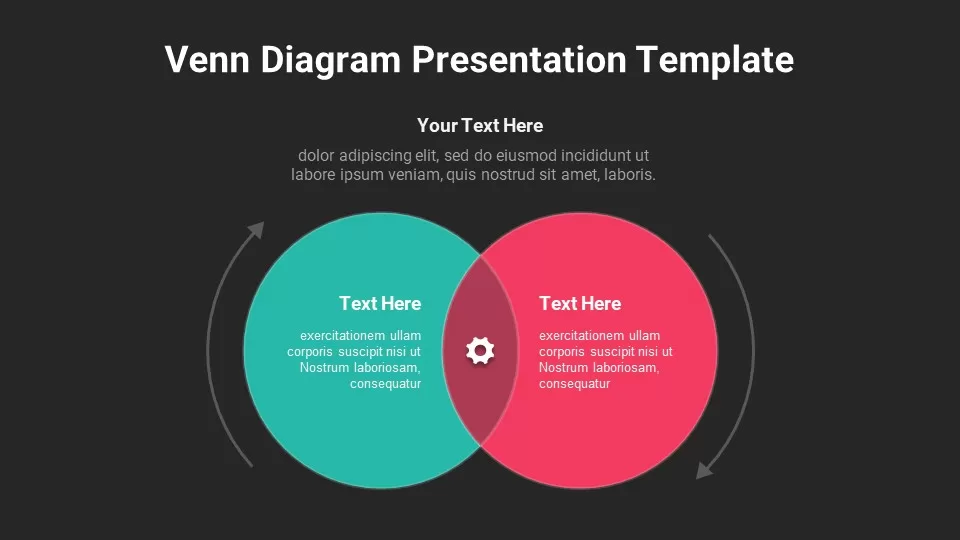
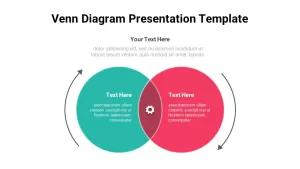
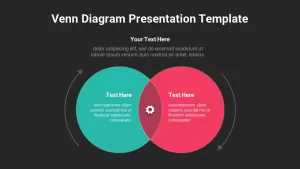
This Venn diagram slide offers a simple yet effective way to compare and contrast two concepts, showing both their unique elements and their shared overlap. The slide features two color-coded circles—green and red—that intersect to create a shared space in the middle. Each section is labeled with placeholders for text, which allows you to easily add descriptions or data points related to each area of the diagram. The use of icons, such as a gear symbol in the center, emphasizes the connection between the two concepts.
The minimalistic design of the Venn diagram makes it perfect for a variety of purposes, such as visualizing overlapping concepts, comparing products or features, or illustrating shared challenges or opportunities. Whether for business, education, or research, this diagram will help you present complex information in an easy-to-understand and visually appealing manner.
Editable in both PowerPoint and Google Slides, this template allows for fast customization to suit your needs. You can adjust the colors, text, and icons or resize the diagram to fit any presentation style.
Who is it for
This slide is ideal for business professionals, educators, marketers, or researchers who need to illustrate the relationships or differences between two elements. It’s perfect for business analysts, project managers, marketing teams, and students working on comparative analyses or visual presentations.
Other Uses
Beyond comparisons, this slide can be used for showing overlaps in data sets, customer personas, decision-making criteria, or product features. It is versatile enough for use in reports, product evaluations, market research, or academic presentations.
Login to download this file

Item ID
SB02623
Related Templates

Free Simple Venn Diagram Overview template for PowerPoint & Google Slides
Comparison Chart
Free
Four-Circle Venn Process Diagram template for PowerPoint & Google Slides
Process

Venn Diagram Infographics Pack Template for PowerPoint & Google Slides
Circular
Creative Three-Circle Venn Diagram Template for PowerPoint & Google Slides
Comparison
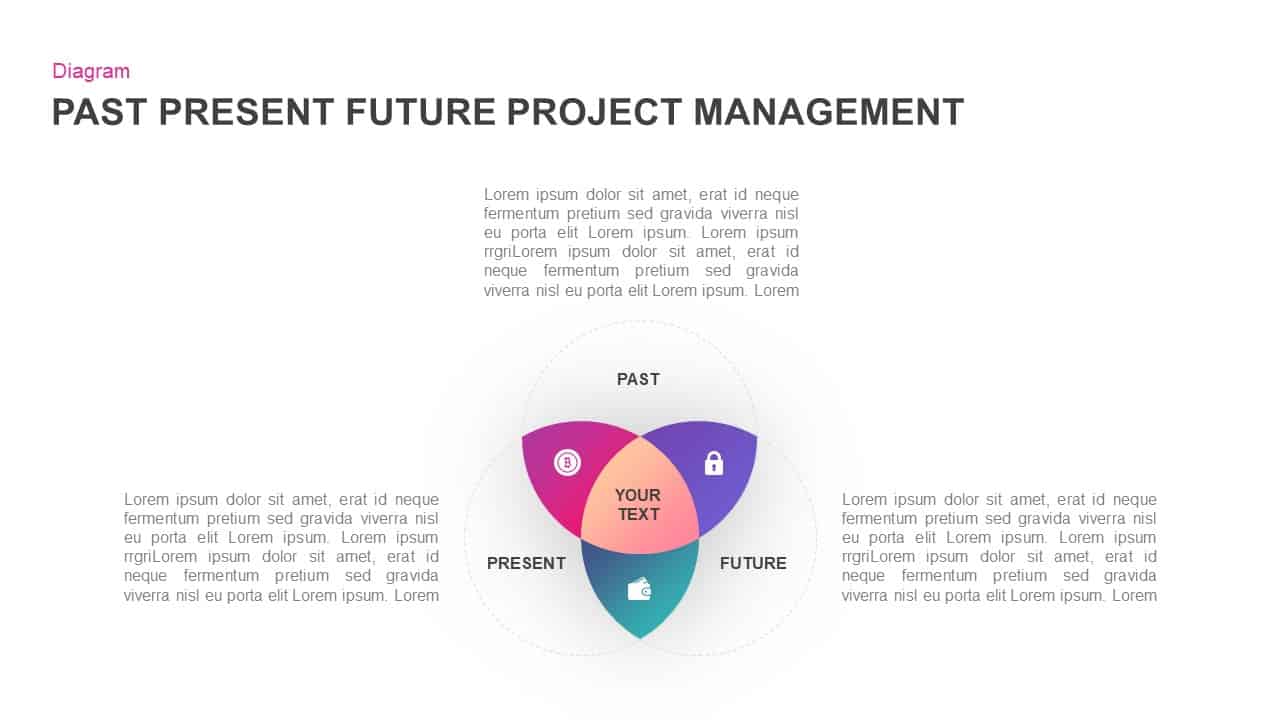
Past, Present & Future Venn Diagram Template for PowerPoint & Google Slides
Comparison
Colorful Venn Diagram Infographics Template for PowerPoint & Google Slides
Circular
Modern Gear Venn Diagram Infographic Template for PowerPoint & Google Slides
Comparison
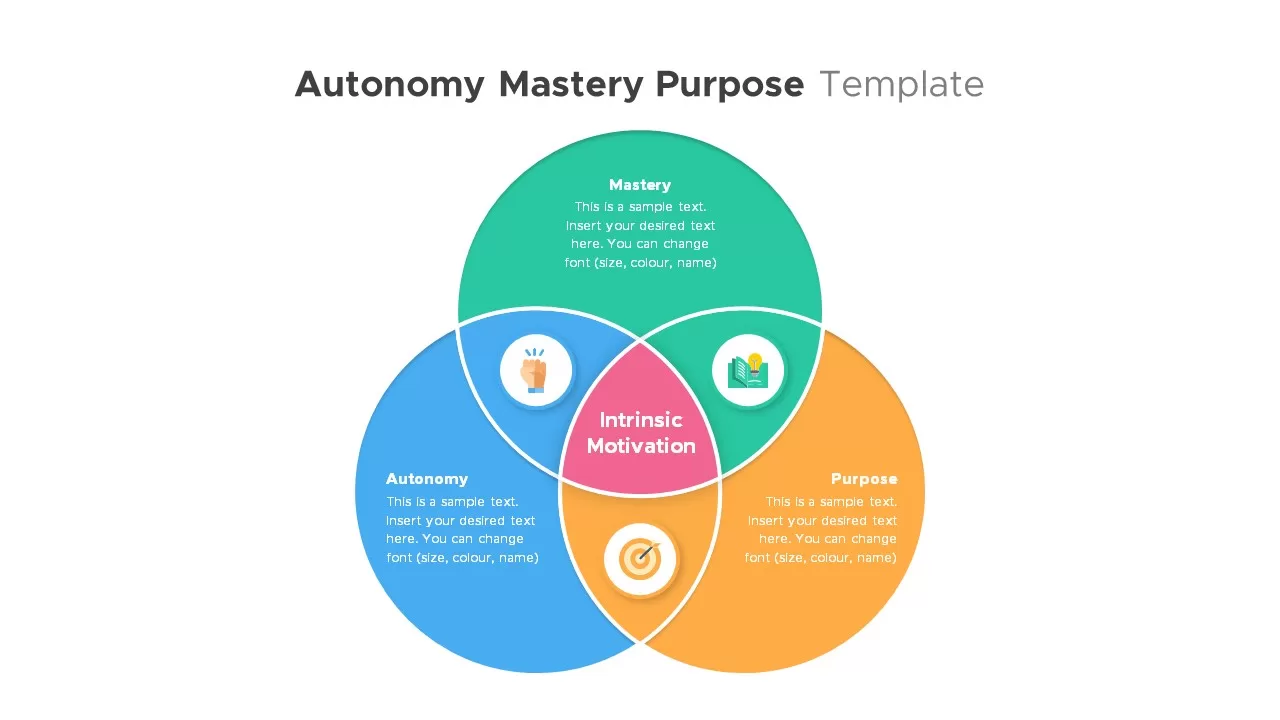
Autonomy, Mastery & Purpose Venn Diagram Template for PowerPoint & Google Slides
Circular
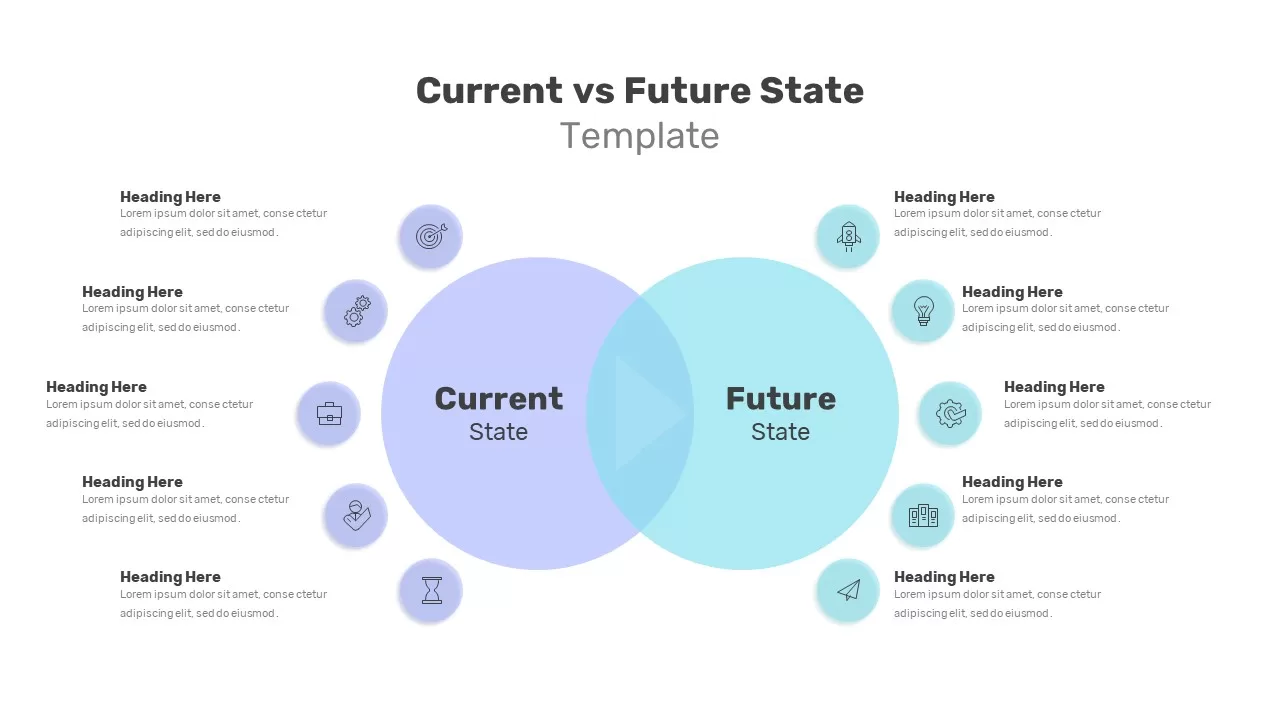
Current vs Future State Venn Diagram Template for PowerPoint & Google Slides
Comparison
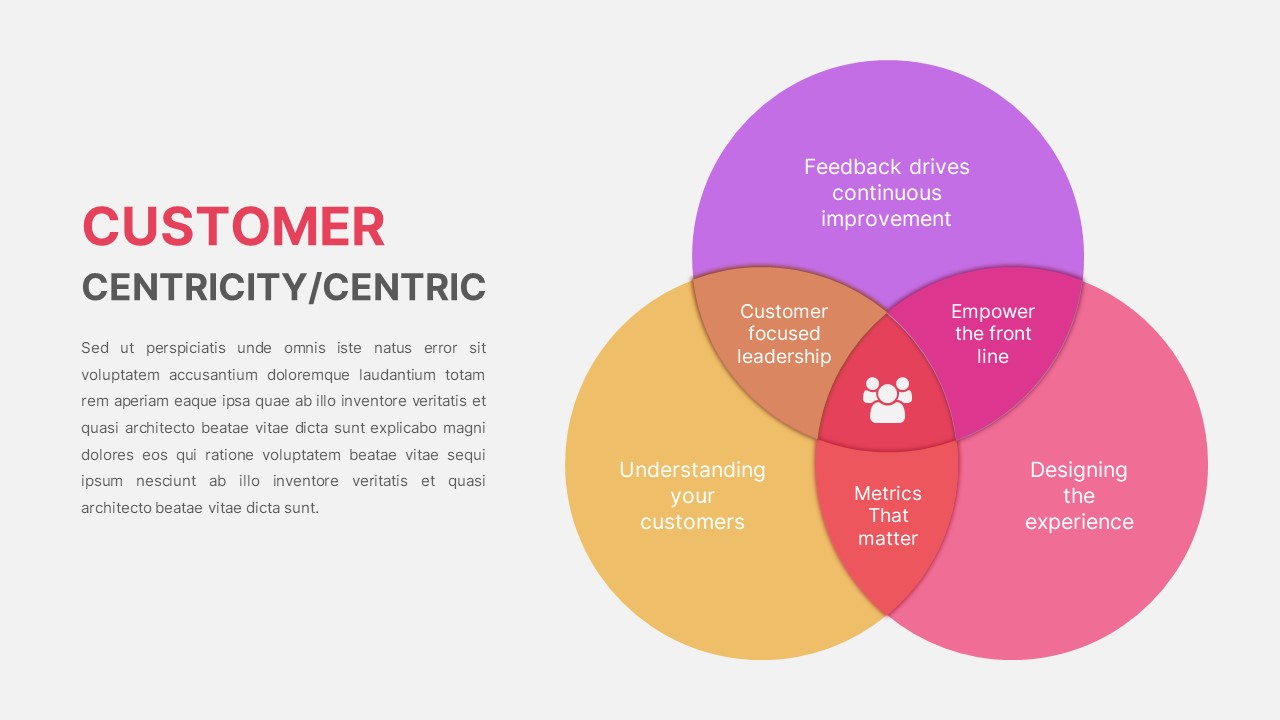
Customer Centricity Venn Diagram template for PowerPoint & Google Slides
Infographics
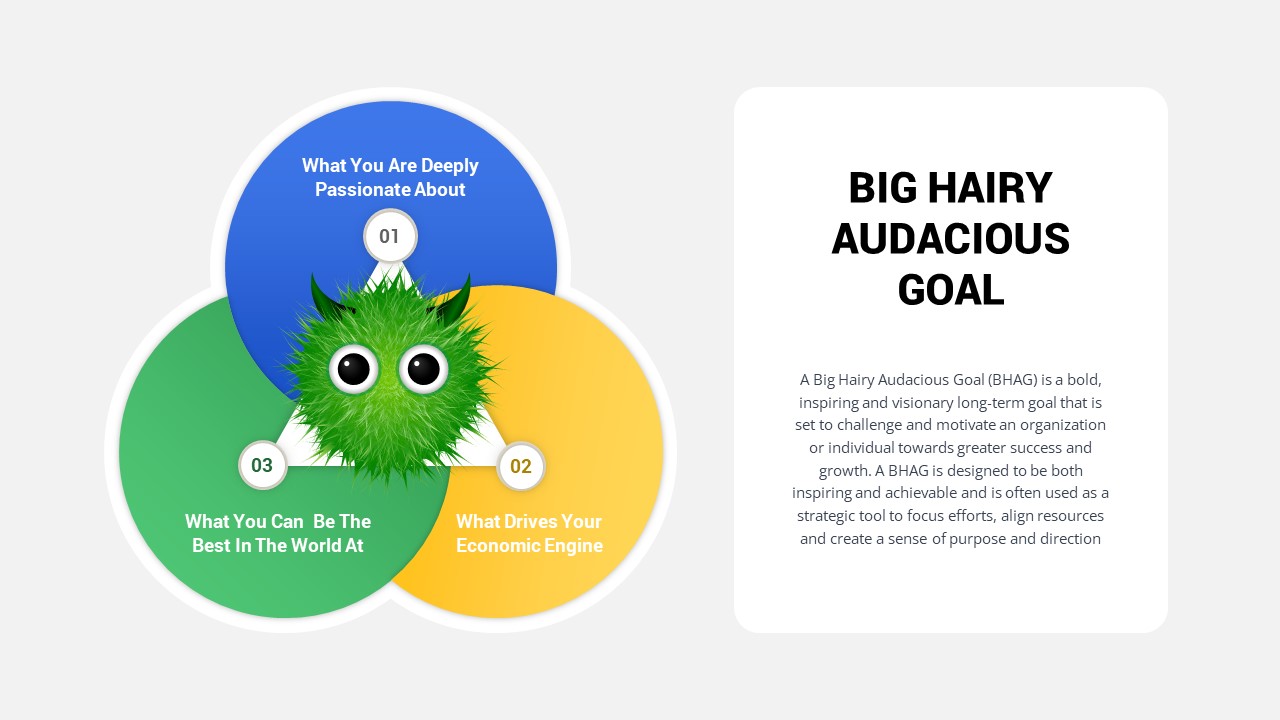
Big Hairy Audacious Goal Venn Diagram Template for PowerPoint & Google Slides
Circular
Five Circle Venn Diagram for Template for PowerPoint & Google Slides
Circular
8 Circle Venn Diagram Infographic Design Template for PowerPoint & Google Slides
Circular
Professional 6 Circle Venn Diagram Template for PowerPoint & Google Slides
Circular
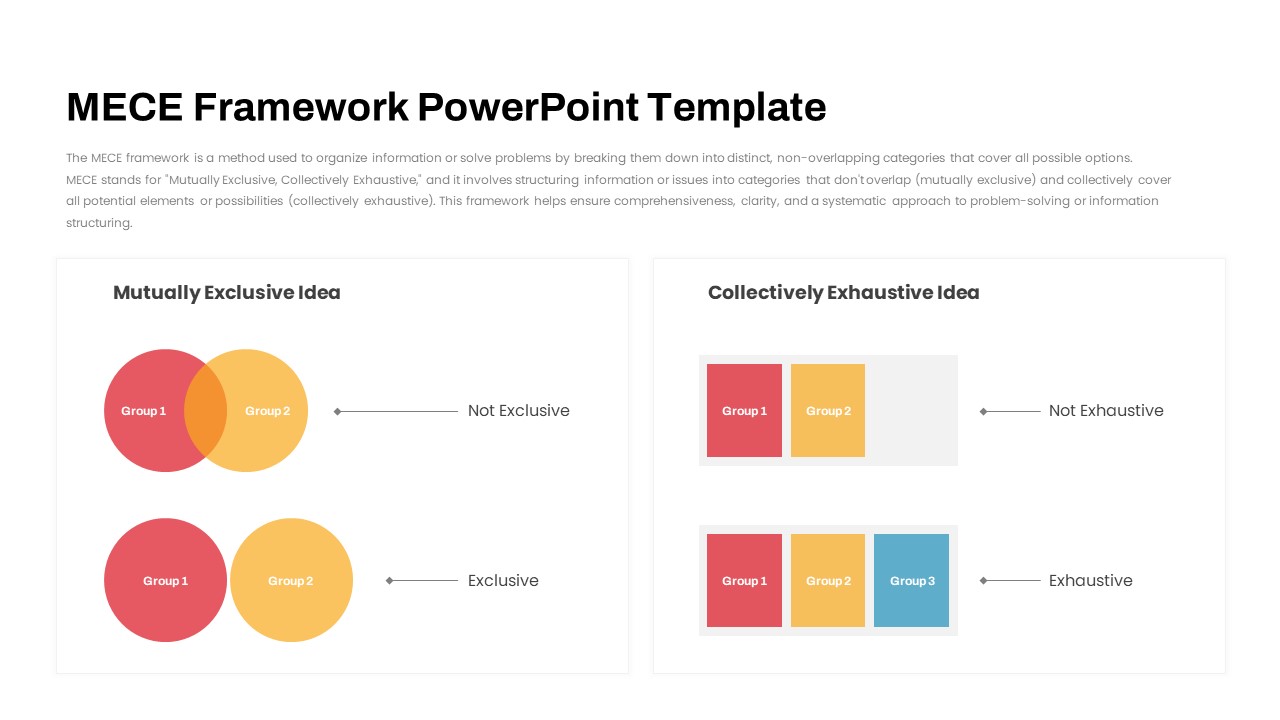
MECE Framework Venn & Block Diagram Template for PowerPoint & Google Slides
Comparison
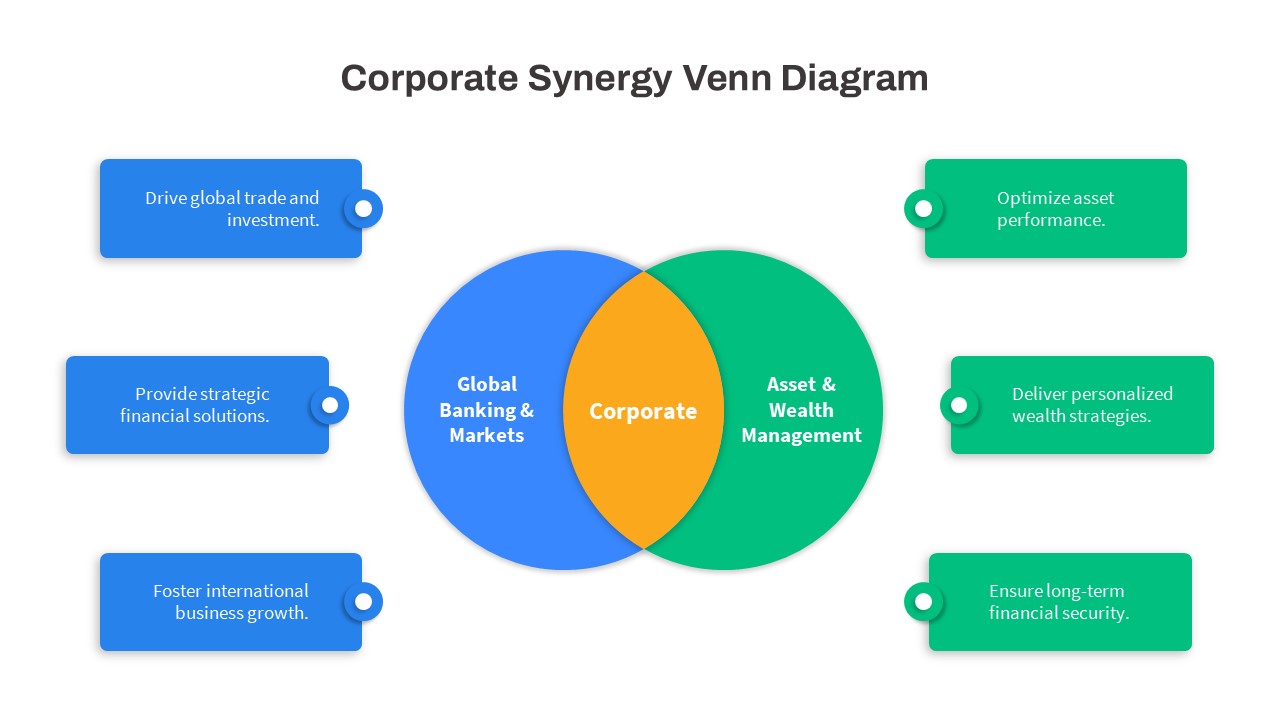
Corporate Synergy Venn Diagram Template for PowerPoint & Google Slides
Comparison
Salience Model Venn Diagram Infographic Template for PowerPoint & Google Slides
Circular
Modern Growth Hacking Venn Diagram Template for PowerPoint & Google Slides
Circular
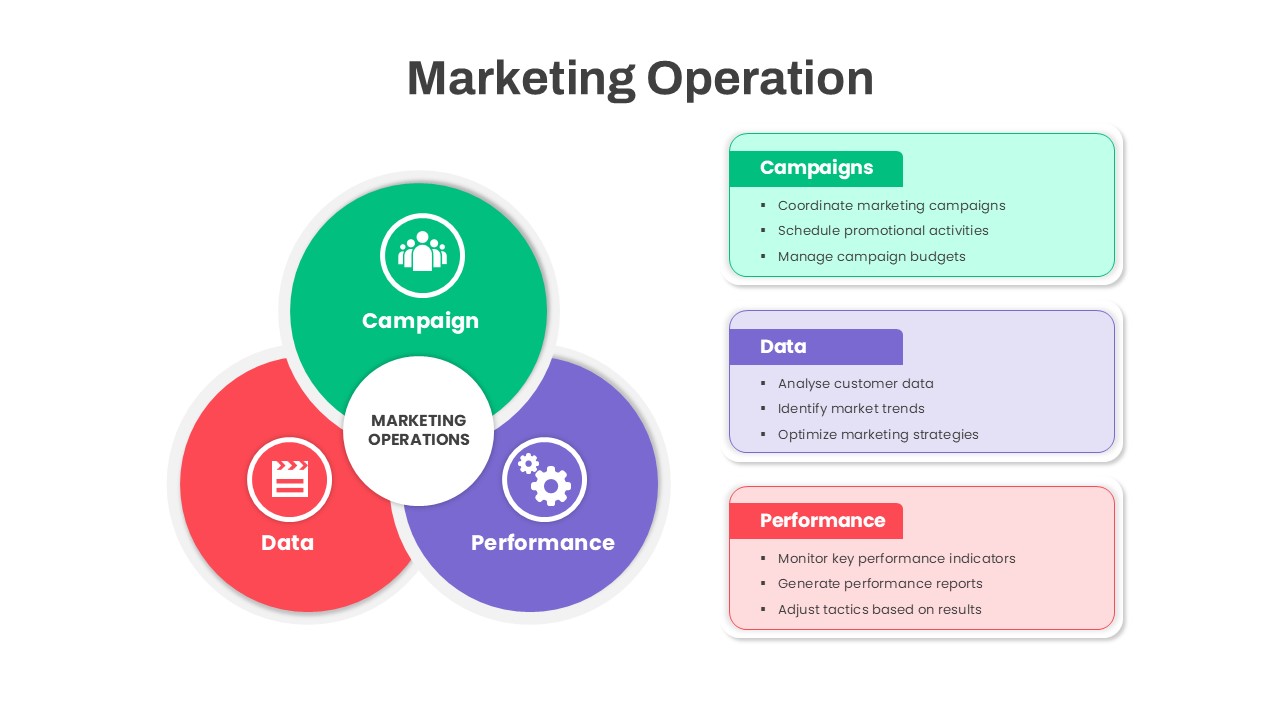
Marketing Operations Venn Diagram Template for PowerPoint & Google Slides
Circular
3Ps Triple Bottom Line Venn Diagram Template for PowerPoint & Google Slides
Circular
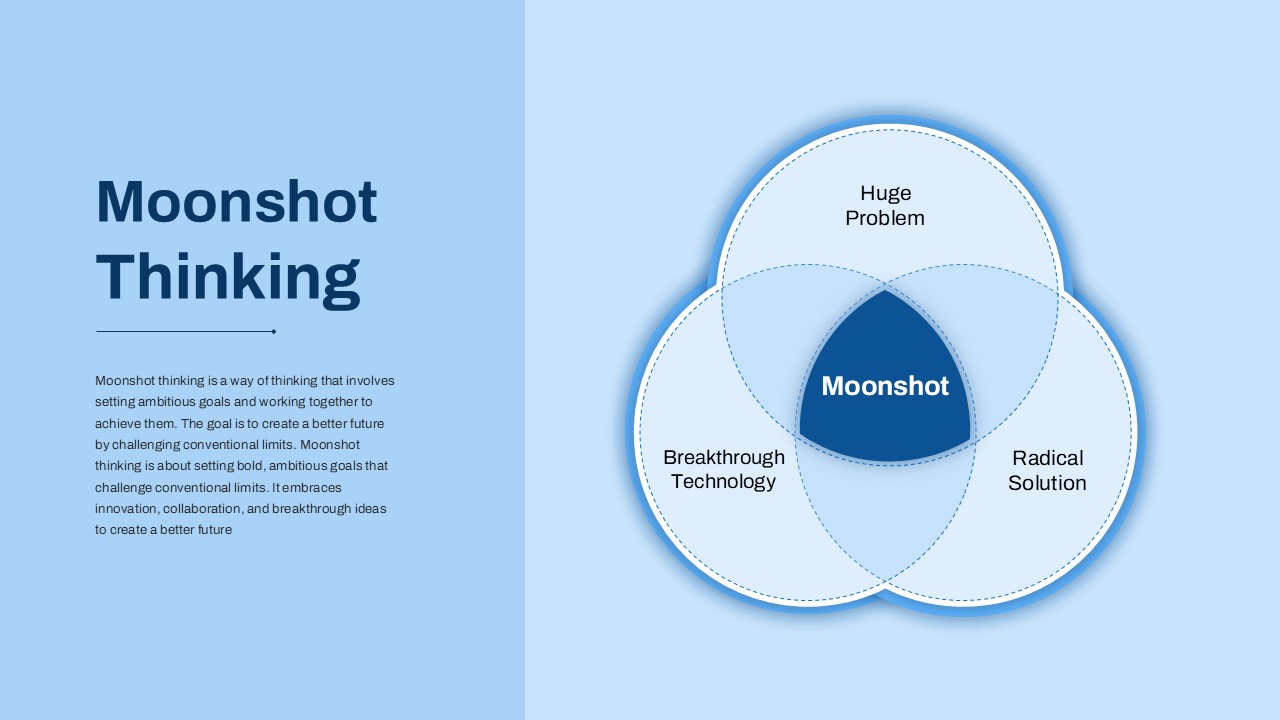
Bold Moonshot Thinking Venn Diagram Template for PowerPoint & Google Slides
Circular
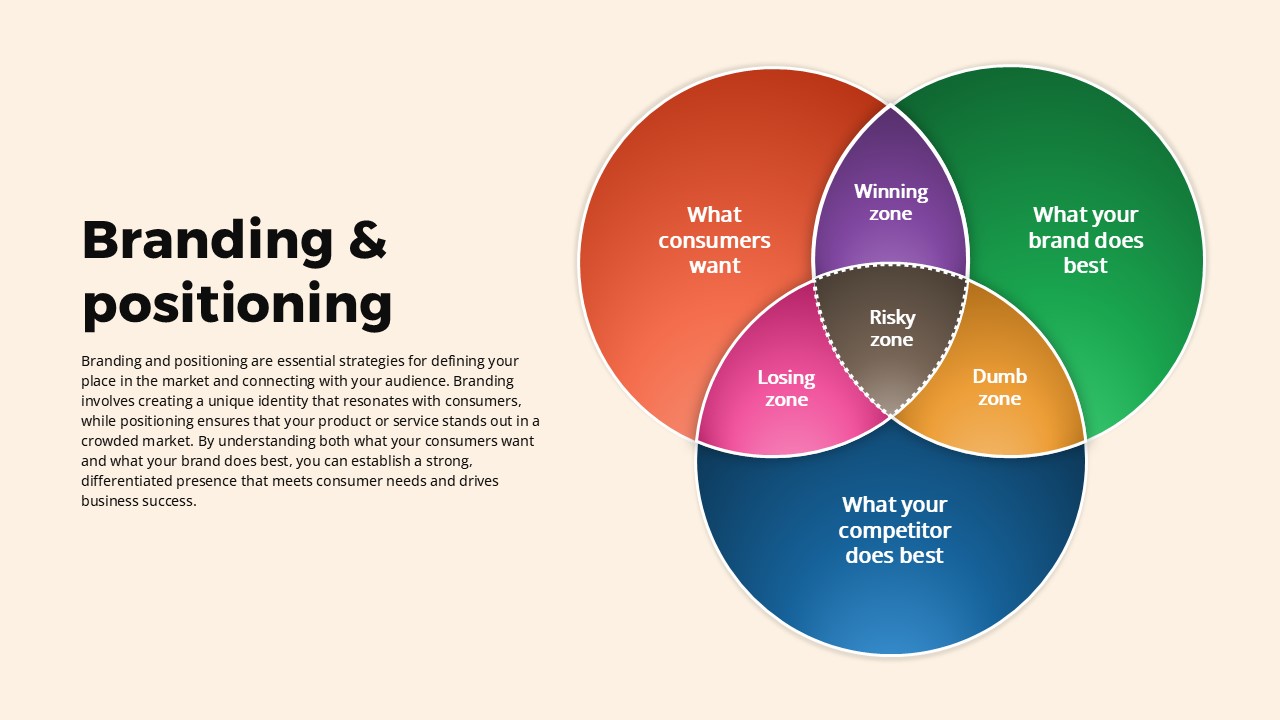
Branding and Positioning Venn Diagram Template for PowerPoint & Google Slides
Comparison
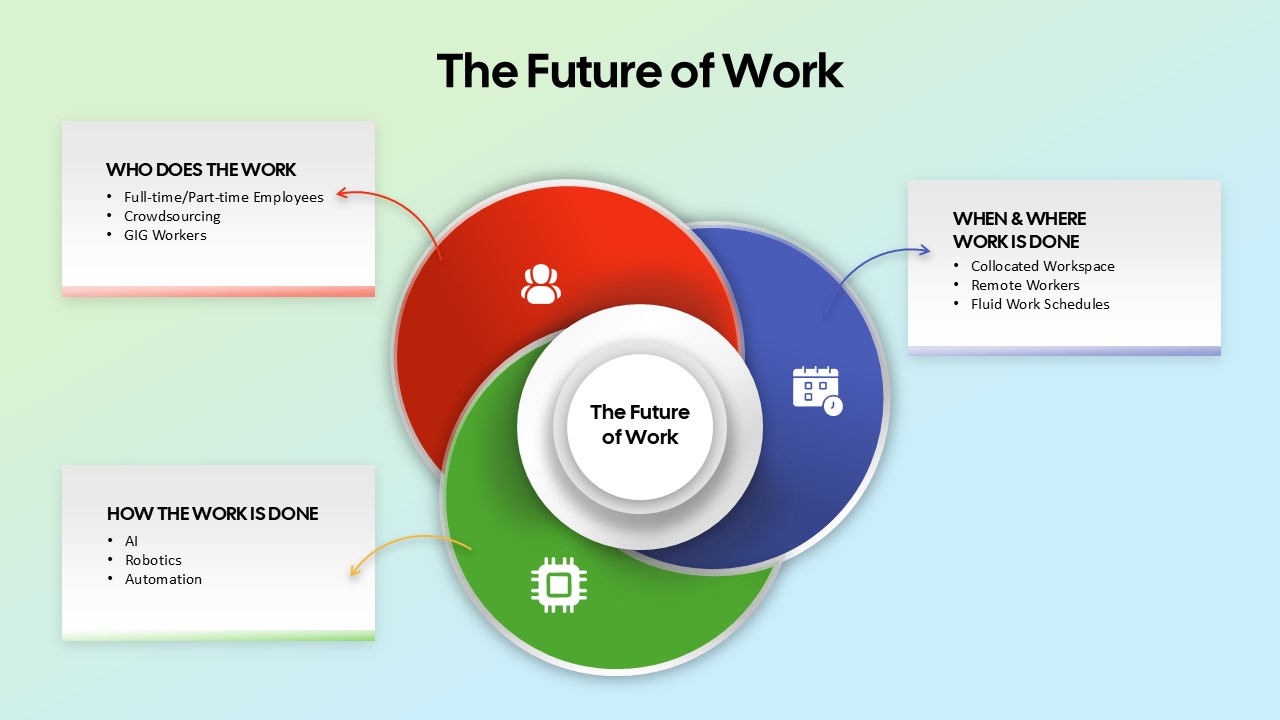
The Future of Work Venn Diagram Template for PowerPoint & Google Slides
Circular
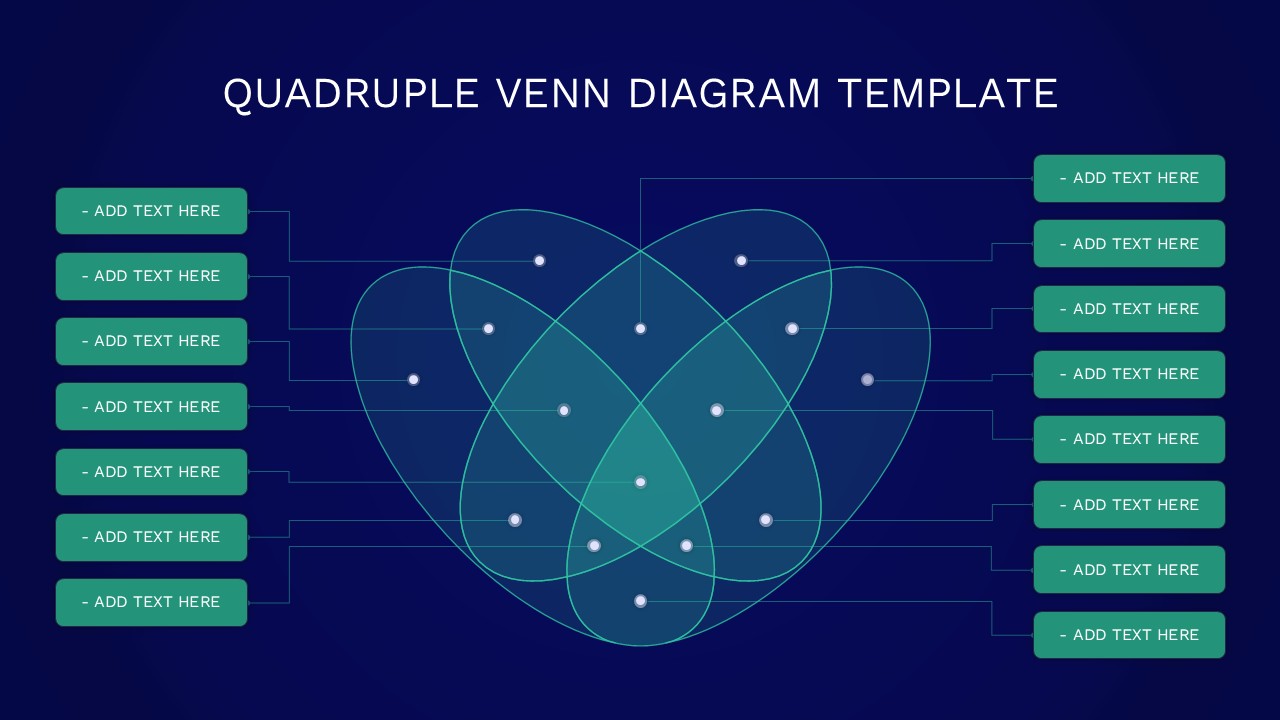
Quadruple Venn Diagram Template for PowerPoint & Google Slides
Circular
Colorful Venn Diagram with 4 Circle for PowerPoint & Google Slides
Circular
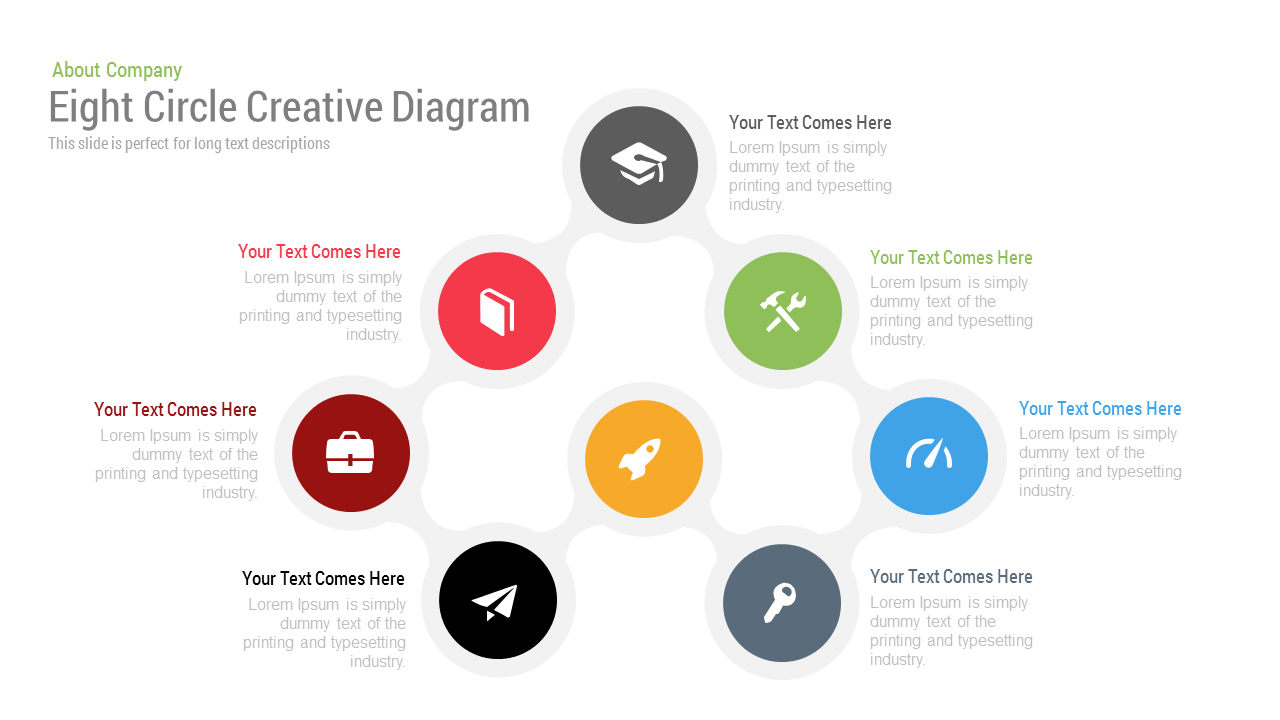
Free Eight Circle Creative Diagram template for PowerPoint & Google Slides
Circular
Free
Free Six Stage Bubble Process Diagram template for PowerPoint & Google Slides
Process
Free
Free Color-Coded Fishbone Diagram Template for PowerPoint & Google Slides
Project
Free
Free Six-Stage Arrow Process Diagram Template for PowerPoint & Google Slides
Process
Free
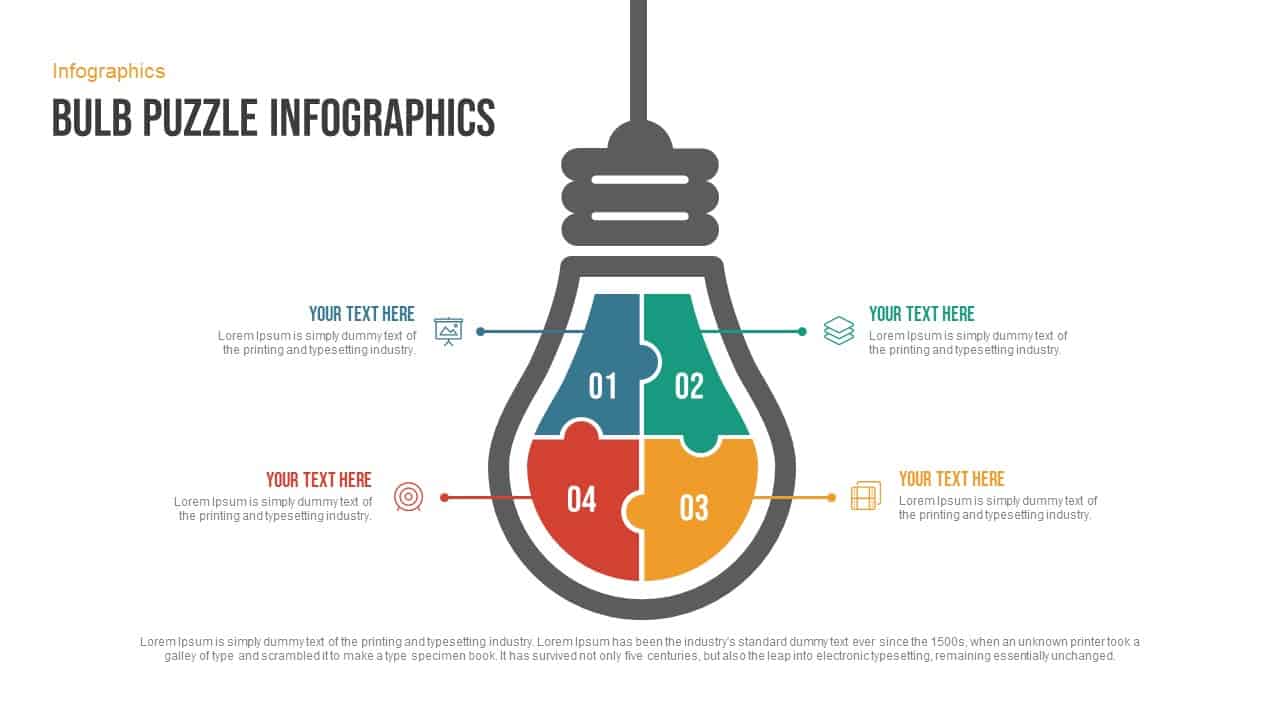
Free Bulb Puzzle Infographics Diagram Template for PowerPoint & Google Slides
Process
Free
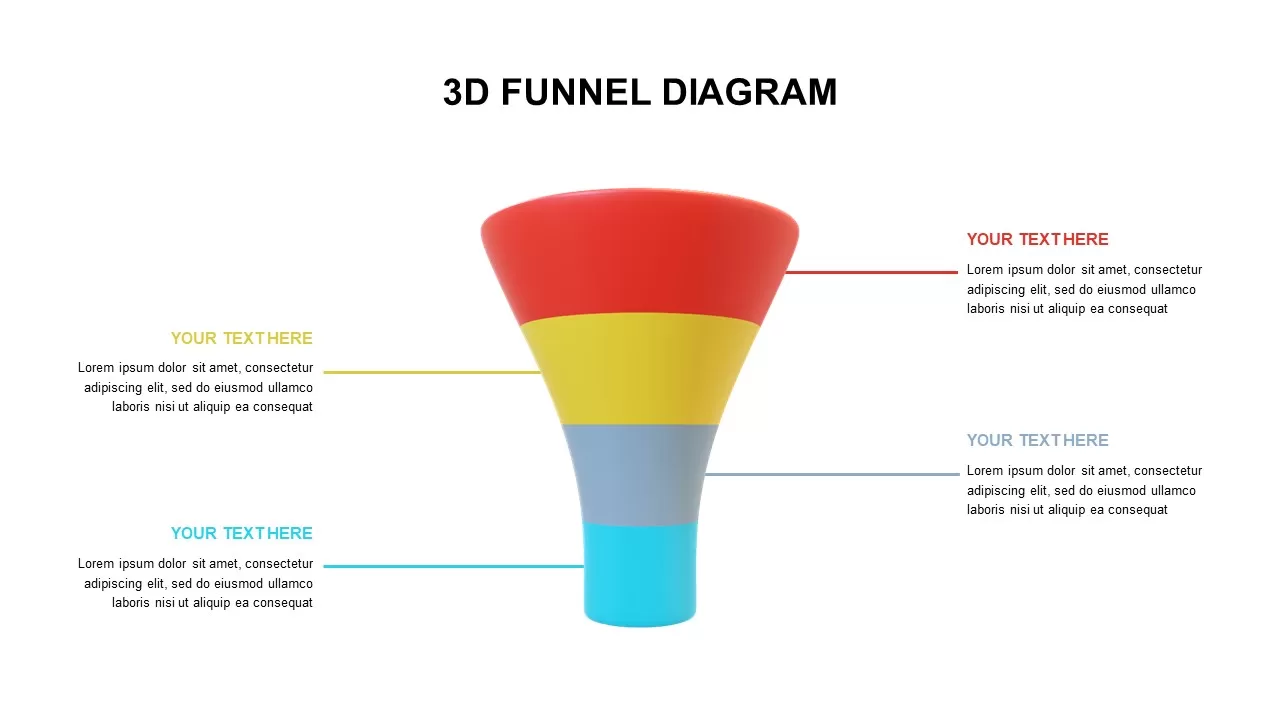
Free 4-Step 3D Funnel Diagram Template for PowerPoint & Google Slides
Funnel
Free
Free Circular Multi-Step Flow Chart Diagram Template for PowerPoint & Google Slides
Flow Charts
Free
Free Curved Arrow Infographic Diagram Template for PowerPoint & Google Slides
Arrow
Free
Free Journey Slide with Four Icons Diagram Template for PowerPoint & Google Slides
Process
Free
Free Animated DNA Infographic Diagram Template for PowerPoint & Google Slides
Infographics
Free
Free Vision and Mission Target Diagram Template for PowerPoint & Google Slides
Vision and Mission
Free
Free Editable Family Tree Genealogy Diagram Template for PowerPoint & Google Slides
Org Chart
Free
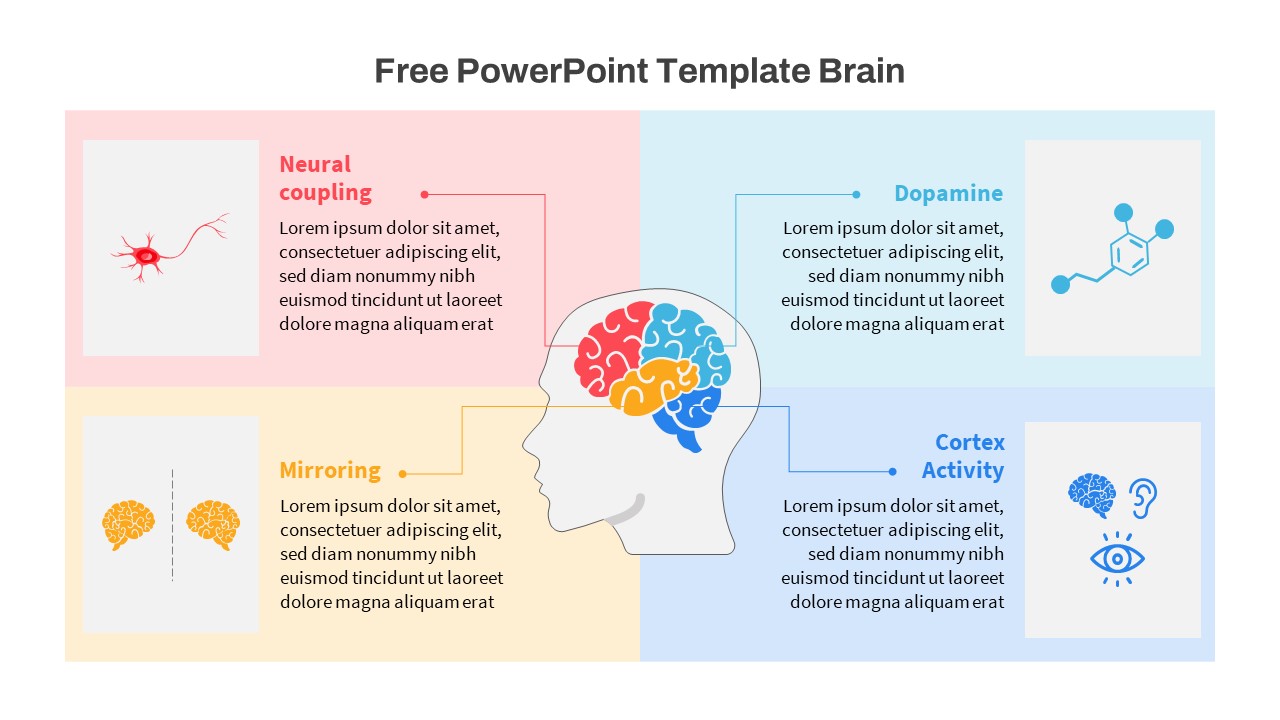
Free Brain Function Diagram Infographic Template for PowerPoint & Google Slides
Process
Free
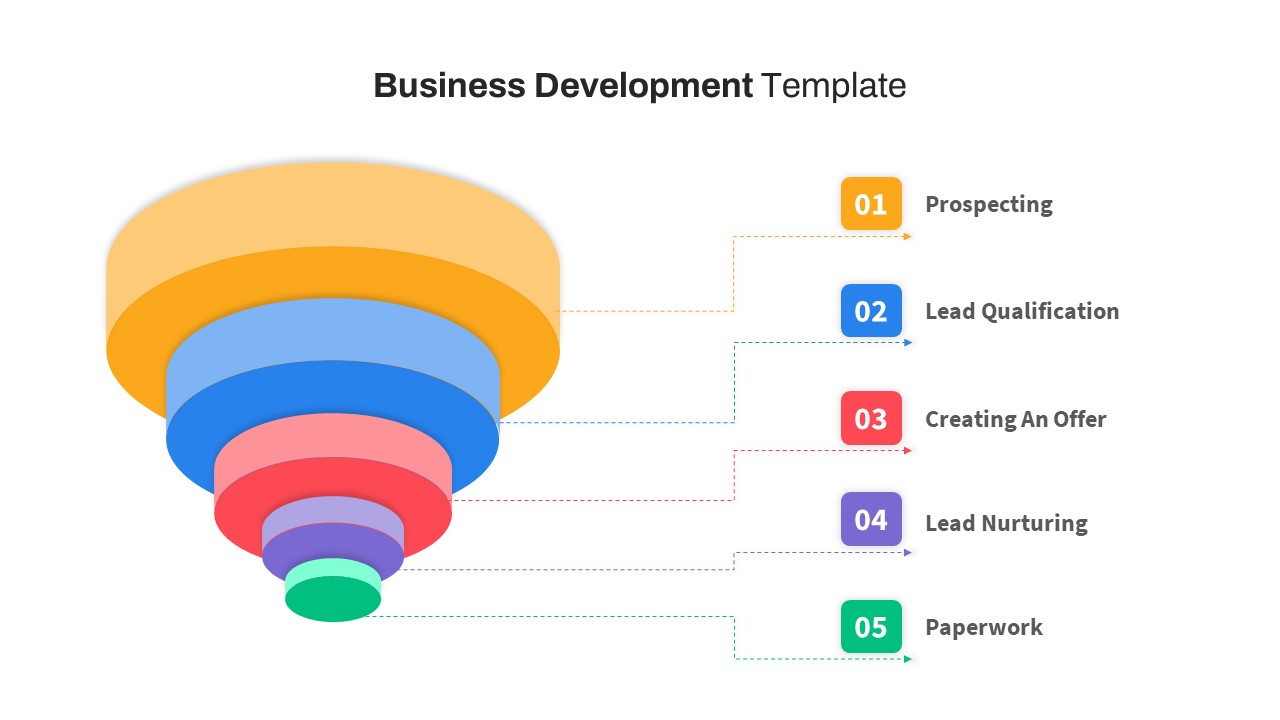
Free Business Development Funnel Diagram Template for PowerPoint & Google Slides
Marketing Funnel
Free
Free Root Cause Analysis Fishbone Diagram Template for PowerPoint & Google Slides
Process
Free
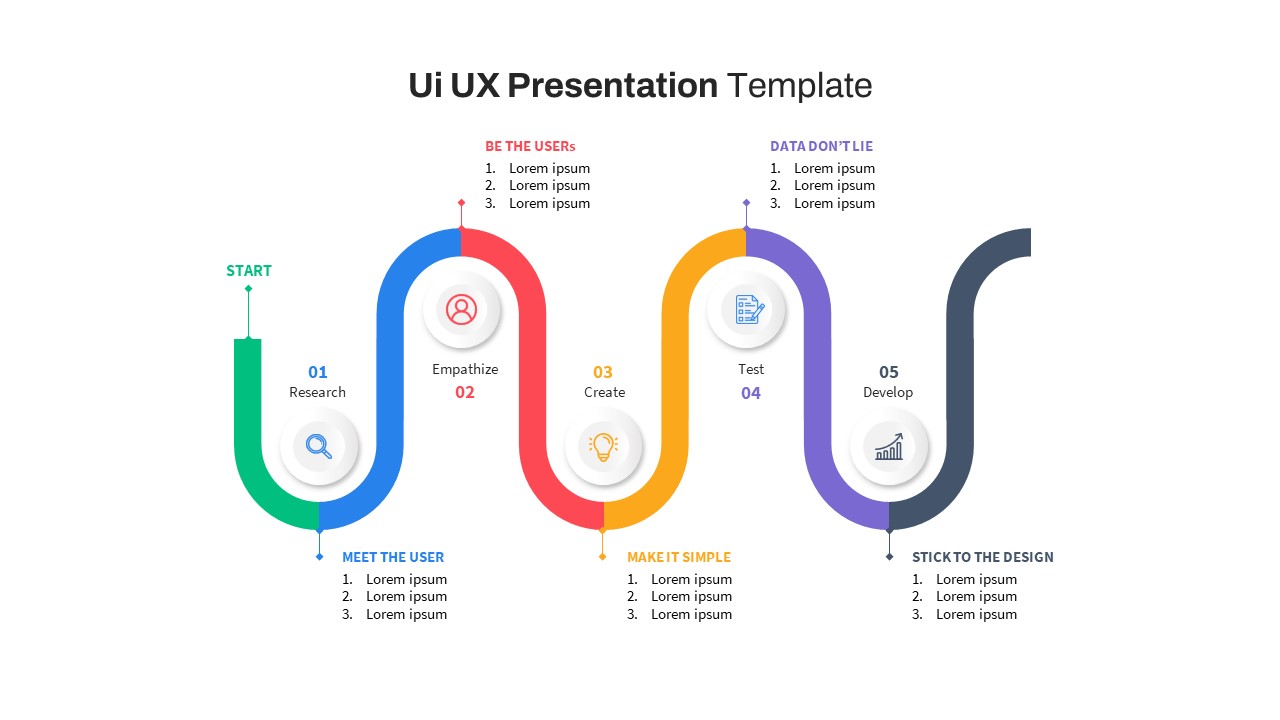
Free UI/UX Process Timeline Diagram Template for PowerPoint & Google Slides
Process
Free
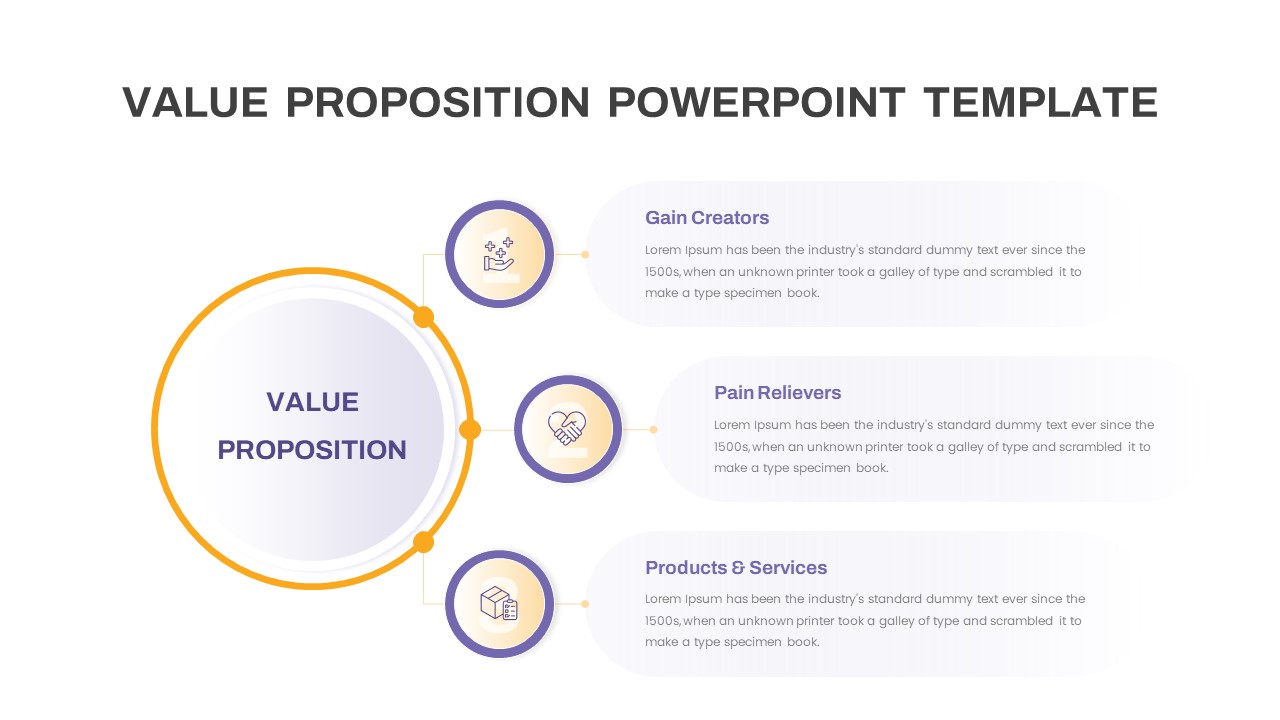
Free Value Proposition Diagram Template for PowerPoint & Google Slides
Business Strategy
Free
Free Time Management Clock Cycle Diagram Template for PowerPoint & Google Slides
Process
Free
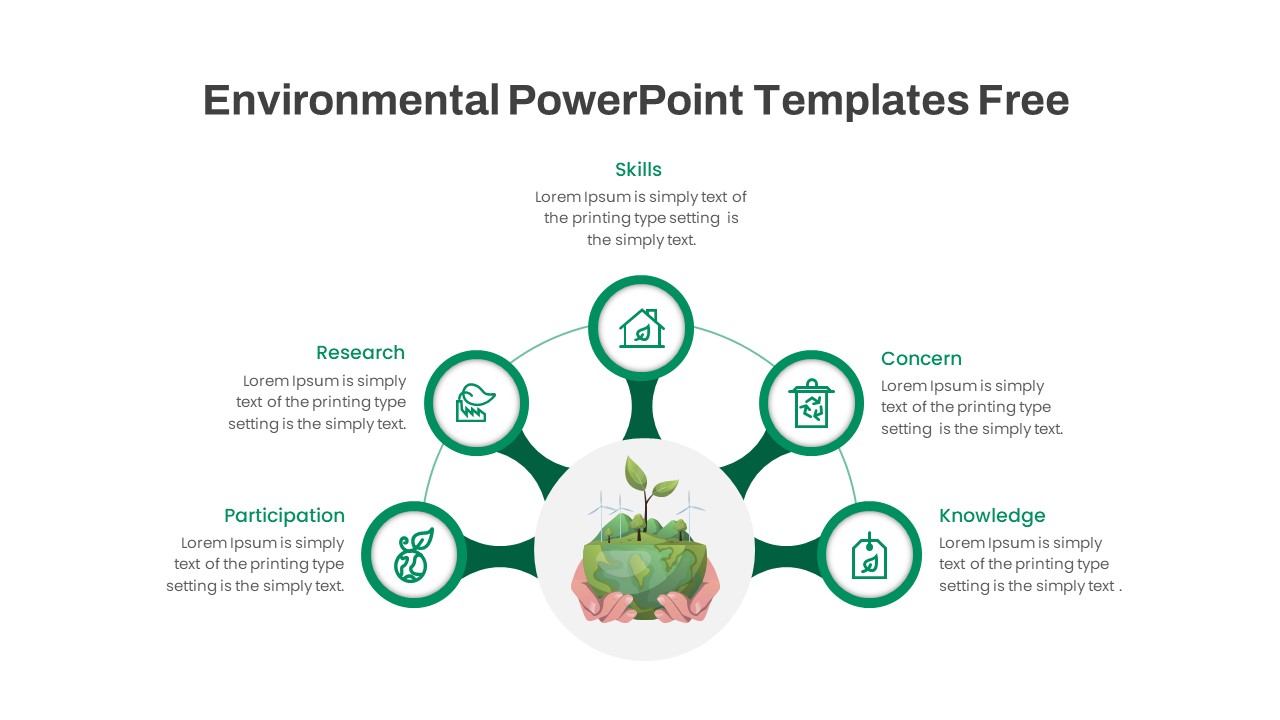
Free Environmental Hub-and-Spoke Diagram Template for PowerPoint & Google Slides
Circular
Free
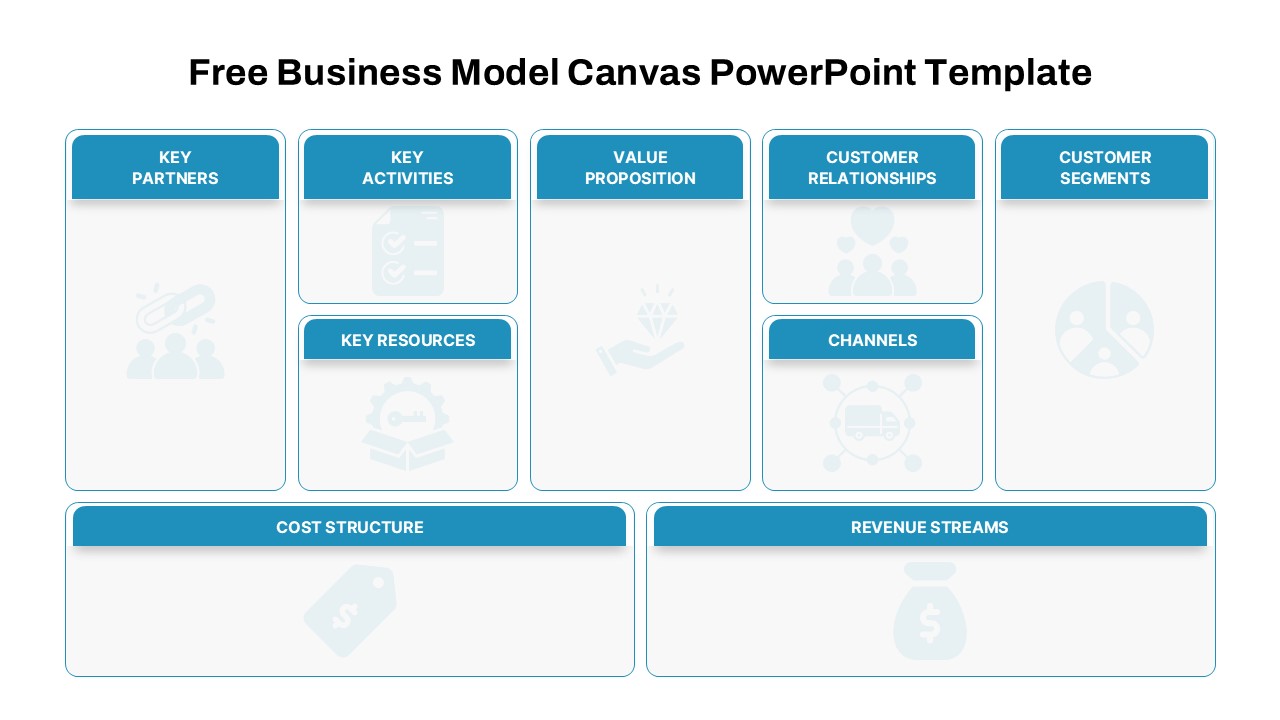
Free Business Model Canvas Diagram Slide Template for PowerPoint & Google Slides
Business Models
Free
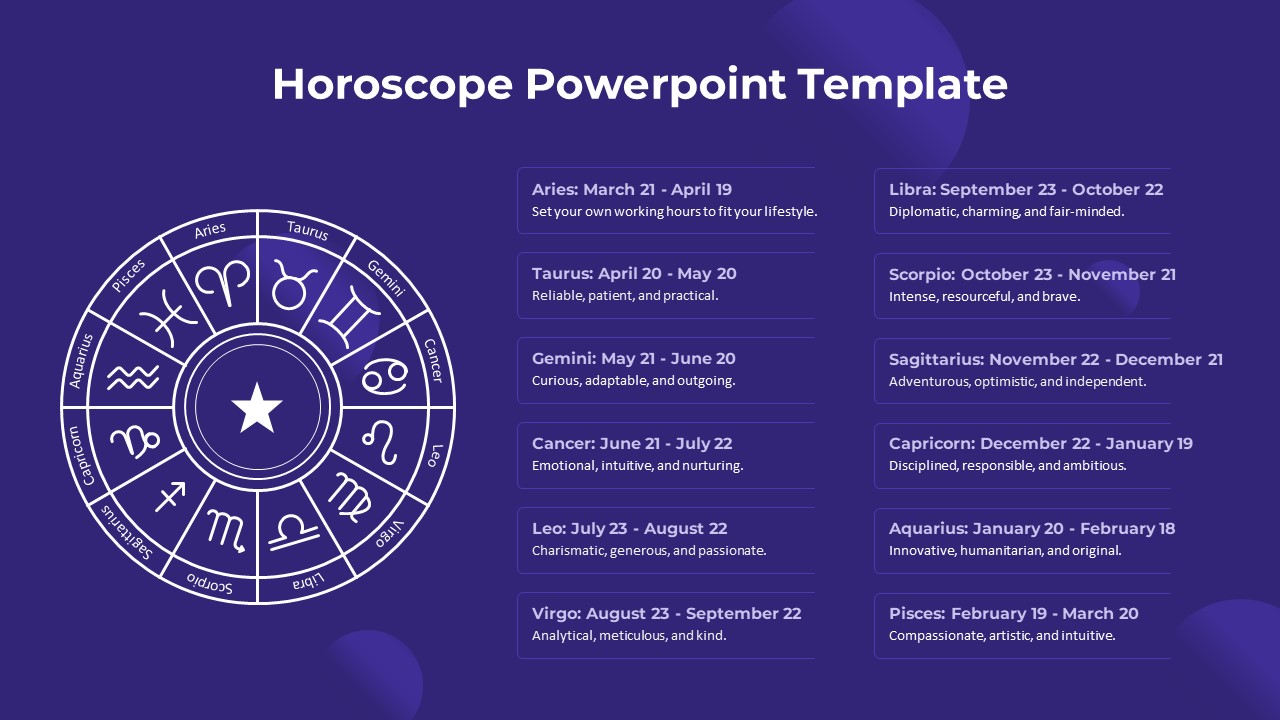
Free Zodiac Horoscope Wheel Diagram Template for PowerPoint & Google Slides
Circular
Free
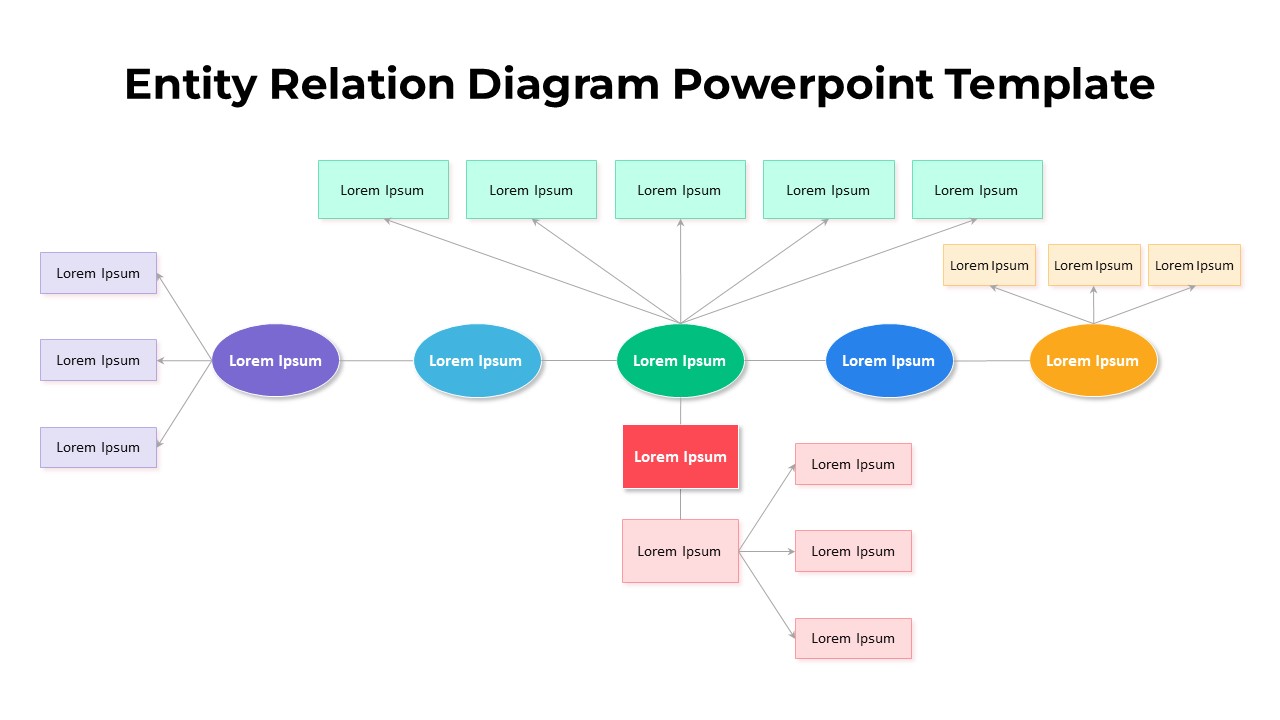
Free Entity Relation Diagram template for PowerPoint & Google Slides
Flow Charts
Free
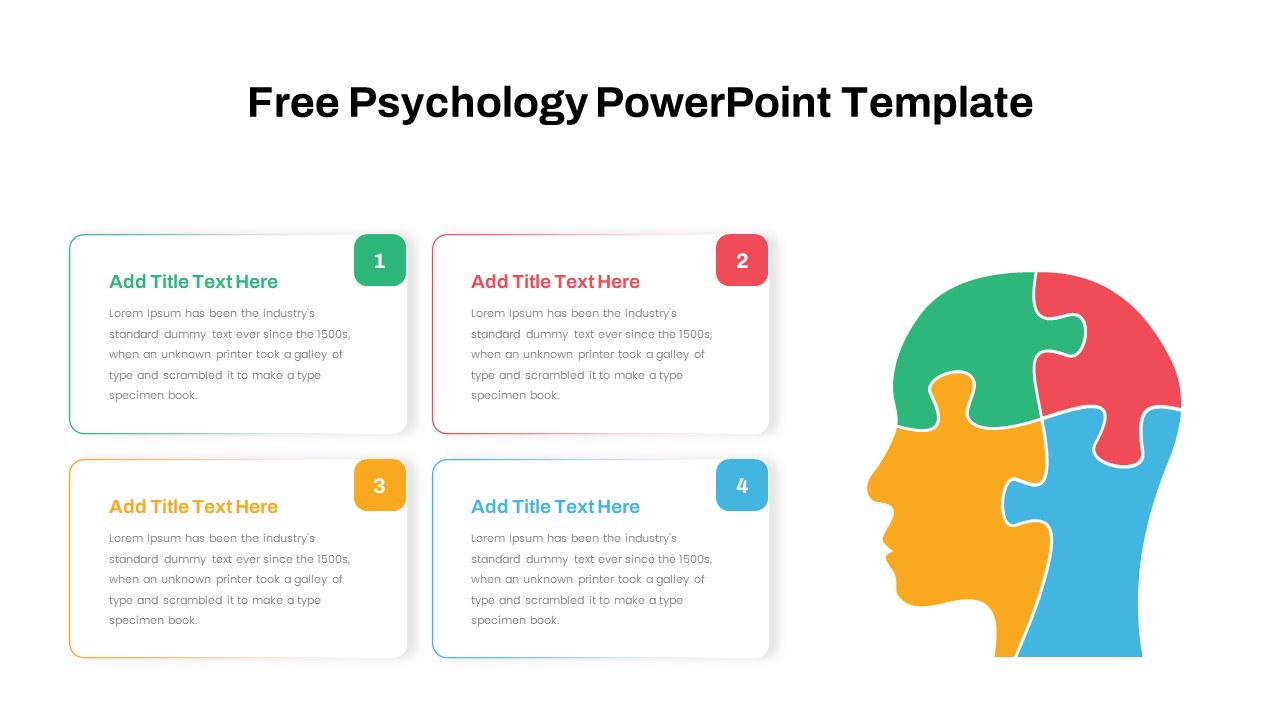
Free Psychology Puzzle Diagram Slide for PowerPoint & Google Slides
Comparison
Free
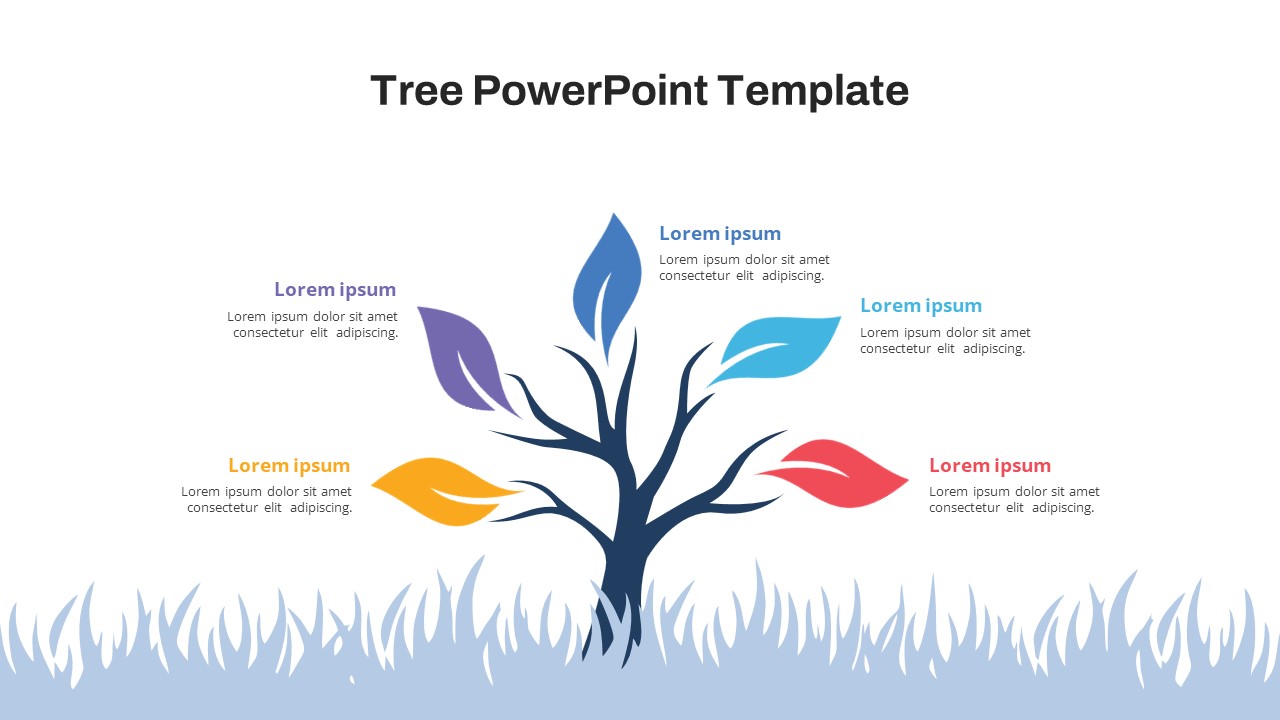
Free Colorful Tree Diagram for Growth & Strategy in PowerPoint & Google Slides
Infographics
Free
Free Professional Gantt Chart Pack – 4 Slides Template for PowerPoint & Google Slides
Gantt Chart
Free

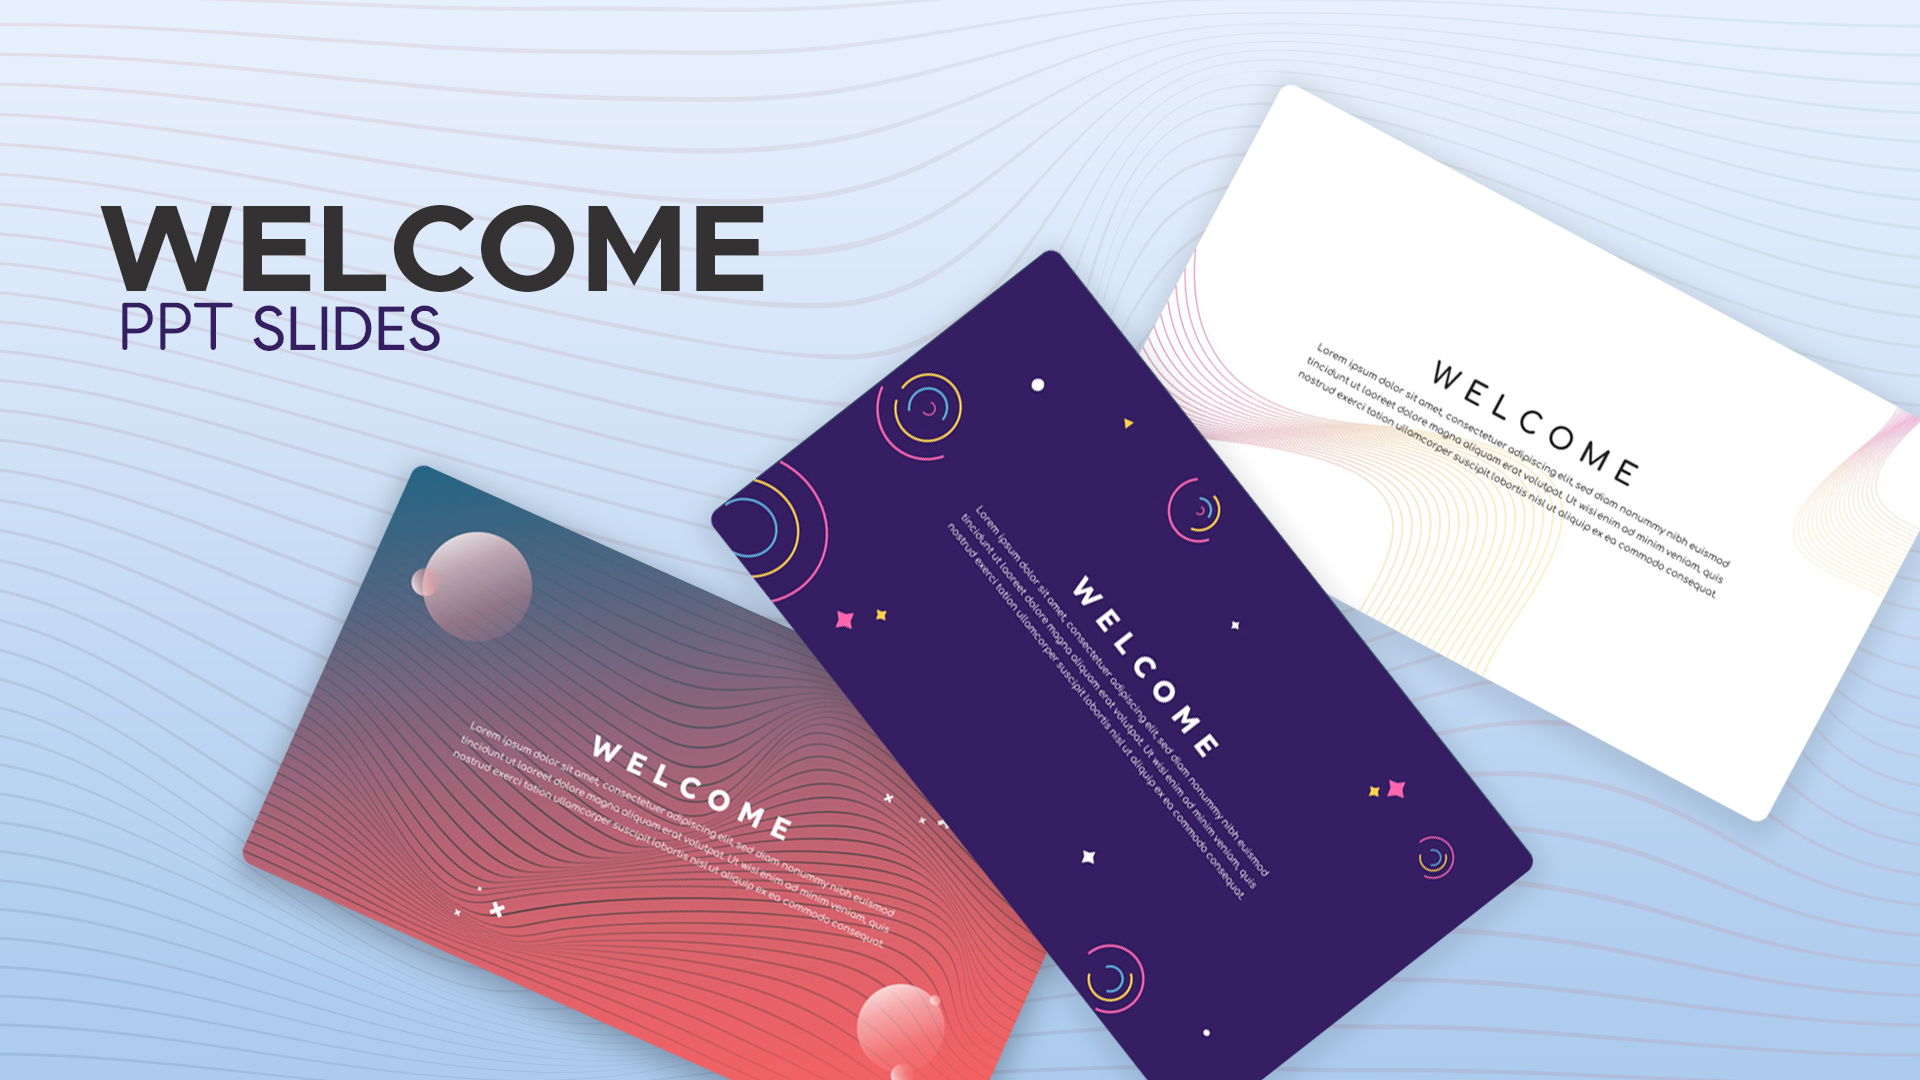
Free Modern Gradient Wave Welcome Slides Template for PowerPoint & Google Slides
Free
Free
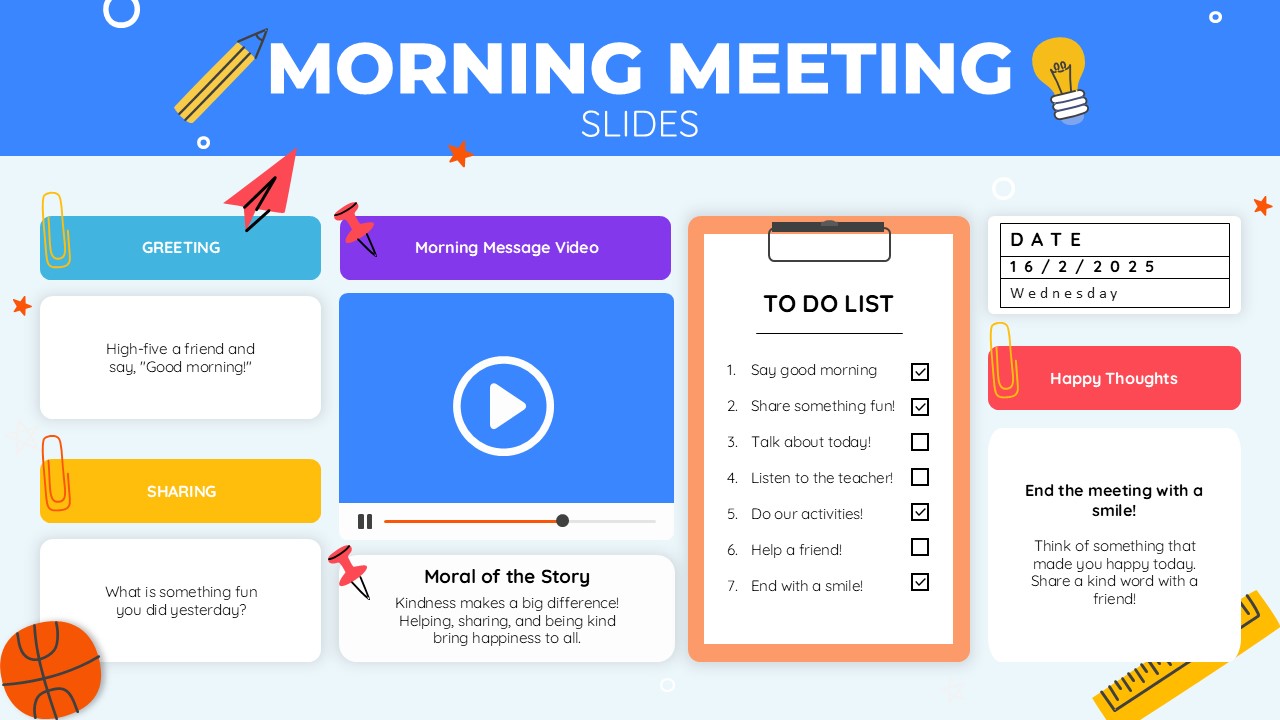
Free Colorful Morning Meeting Agenda Slides Template for PowerPoint & Google Slides
Agenda
Free
Free New Year’s Resolution Slides Pack for PowerPoint & Google Slides 2023
Graphics
Free
Snake Diagram Pack of 8 Slides template for PowerPoint & Google Slides
Process
BEST Free Business PowerPoint Templates Collection Template for PowerPoint & Google Slides
Company Profile
Free
Free Garden Area PowerPoint Template for PowerPoint & Google Slides
Marketing
Free
Free Teacher’s Week Plan PowerPoint Template for PowerPoint & Google Slides
Decks
Free

Free Animated Church PowerPoint Template for PowerPoint & Google Slides
Decks
Free
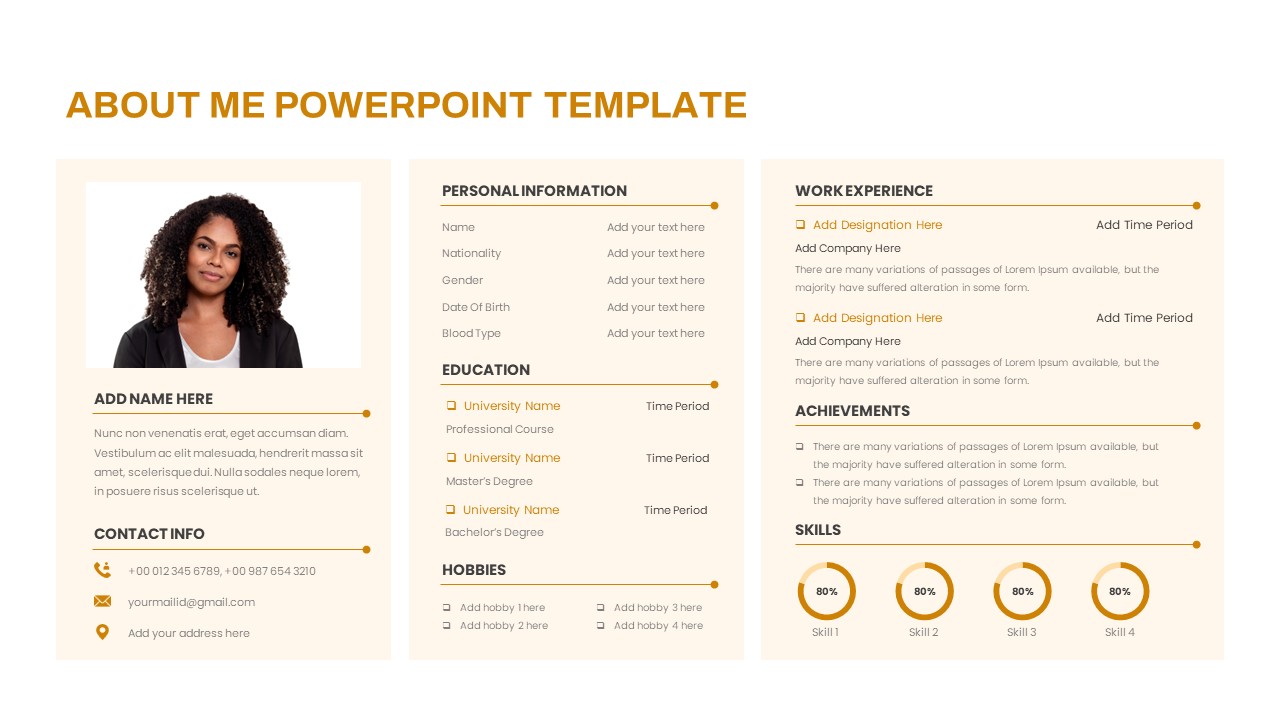
Free About Me PowerPoint Template for PowerPoint & Google Slides
Employee Performance
Free
Free KPI Dashboard PowerPoint Template for PowerPoint & Google Slides
Charts
Free
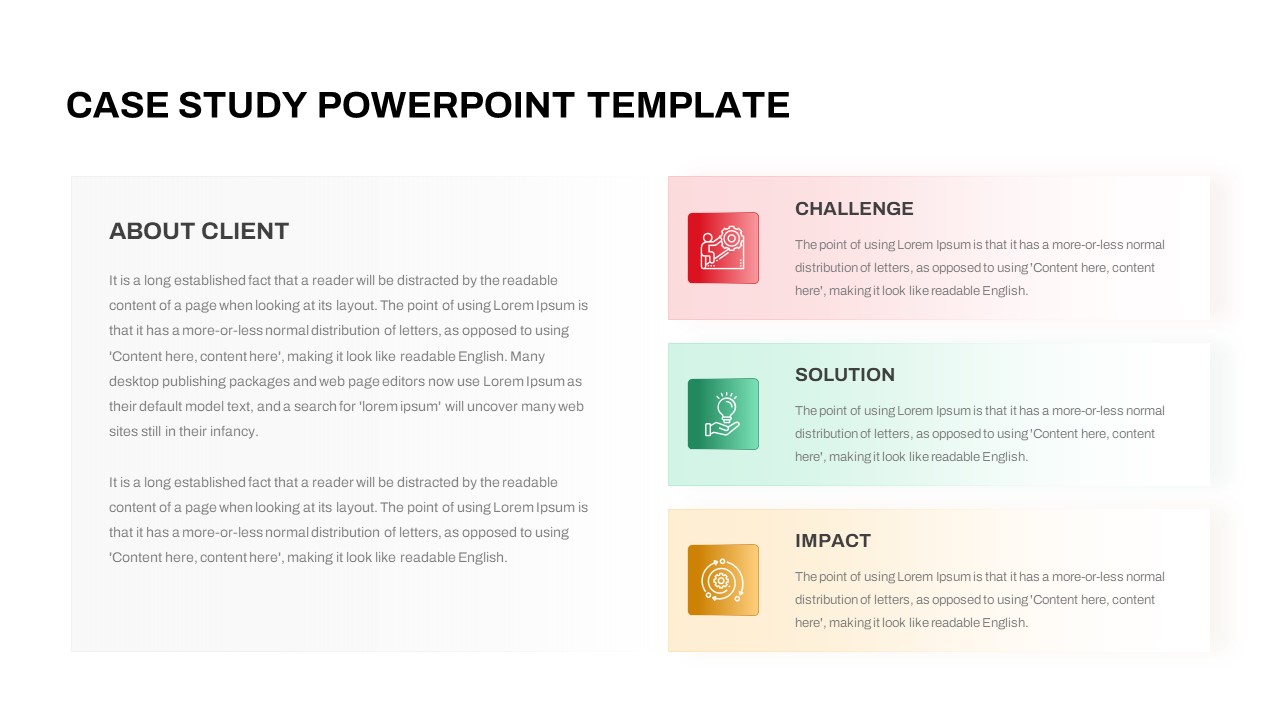
Free Case Study PowerPoint Template for PowerPoint & Google Slides
Infographics
Free
Free Callout Boxes PowerPoint Shapes for PowerPoint & Google Slides
Infographics
Free
Free Infographic Deck PowerPoint Pack for PowerPoint & Google Slides
Infographics
Free
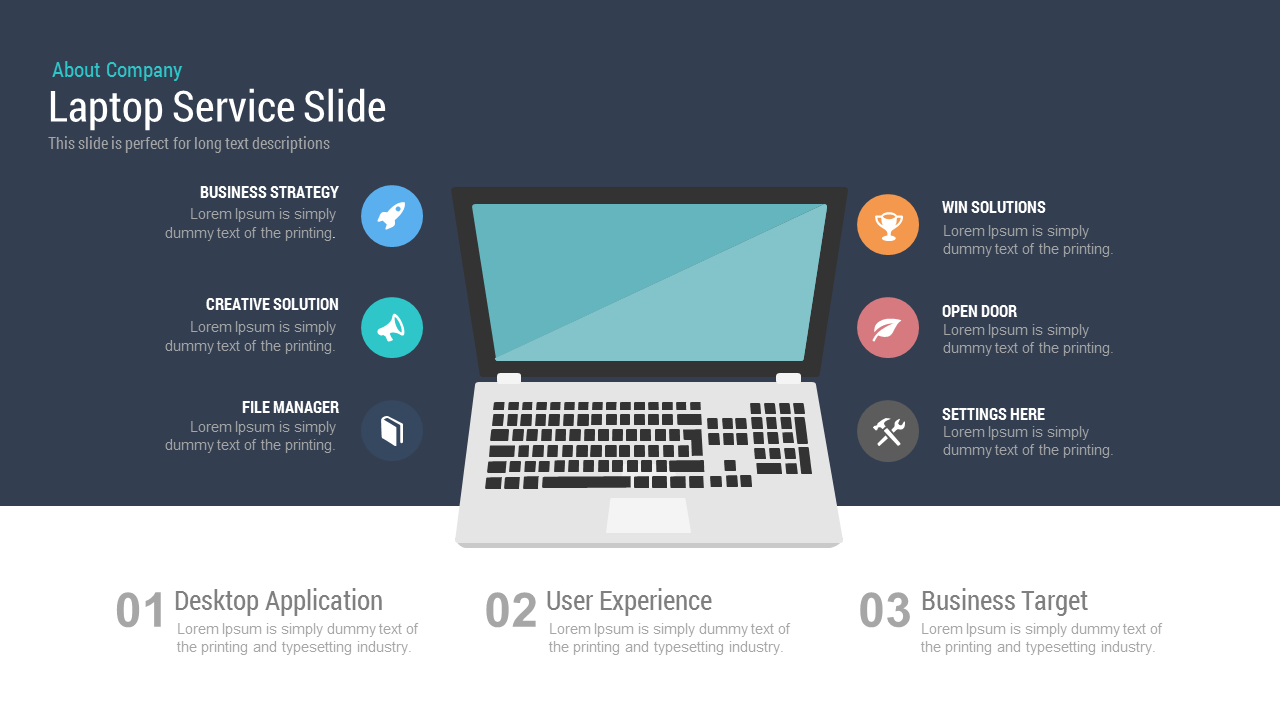
Free Laptop Service Slide template for PowerPoint & Google Slides
Business
Free
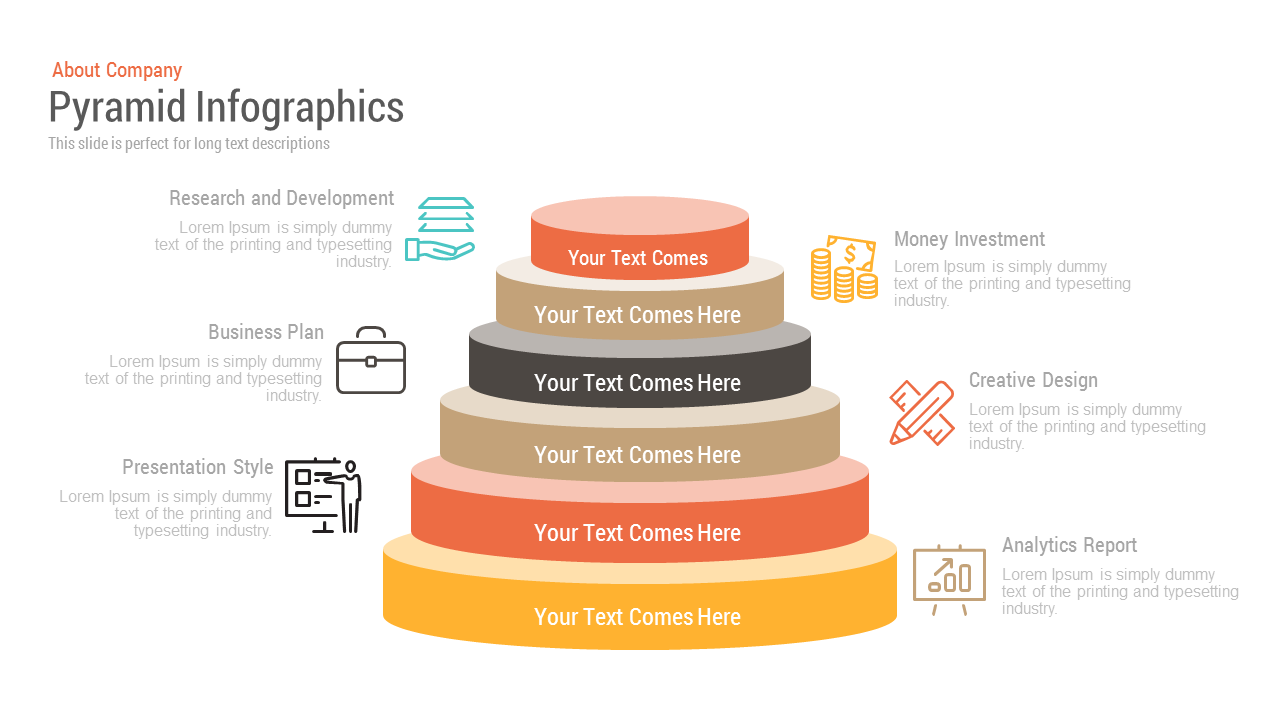
Free Pyramid Infographics template for PowerPoint & Google Slides
Pyramid
Free

Free Modern Pitch Deck Presentation Template for PowerPoint & Google Slides
Pitch Deck
Free
Free Chalkboard Theme Presentation Deck Template for PowerPoint & Google Slides
Pitch Deck
Free
Free Corporate Design Deck Template for PowerPoint & Google Slides
Company Profile
Free
Free Thank You Slide Template for PowerPoint & Google Slides
Graphics
Free
Free Corporate Business Template for PowerPoint & Google Slides
Pitch Deck
Free
Free Agenda PowerPoint Template & Google Slides
Agenda
Free
Free Strategic Plan Overview template for PowerPoint & Google Slides
Business Strategy
Free
Free Curved Arrow Progress Chart template for PowerPoint & Google Slides
Project
Free
Free Chocolate Company Profile Slide Template for PowerPoint & Google Slides
Company Profile
Free
Free Stacked Column Chart Data Visualization Template for PowerPoint & Google Slides
Bar/Column
Free
Free Editable U.S. Map with Regional Metrics Template for PowerPoint & Google Slides
World Maps
Free
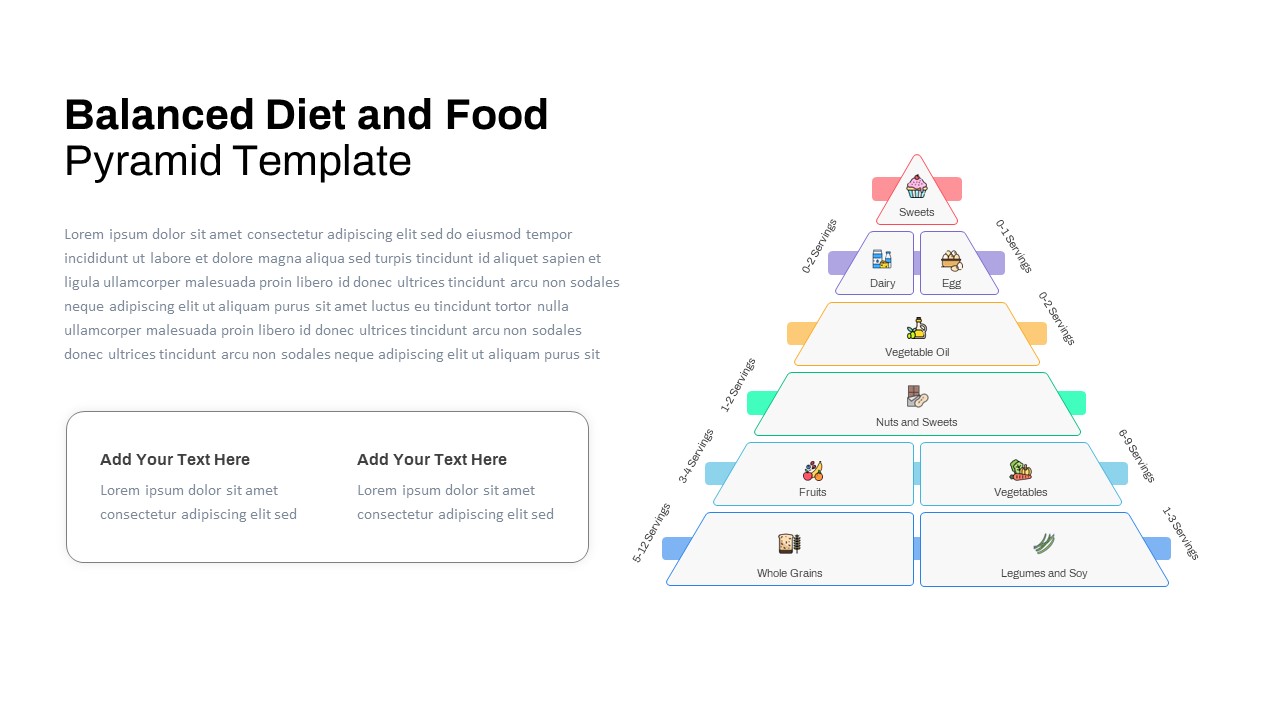
Free Balanced Diet and Food Pyramid Template for PowerPoint & Google Slides
Pyramid
Free
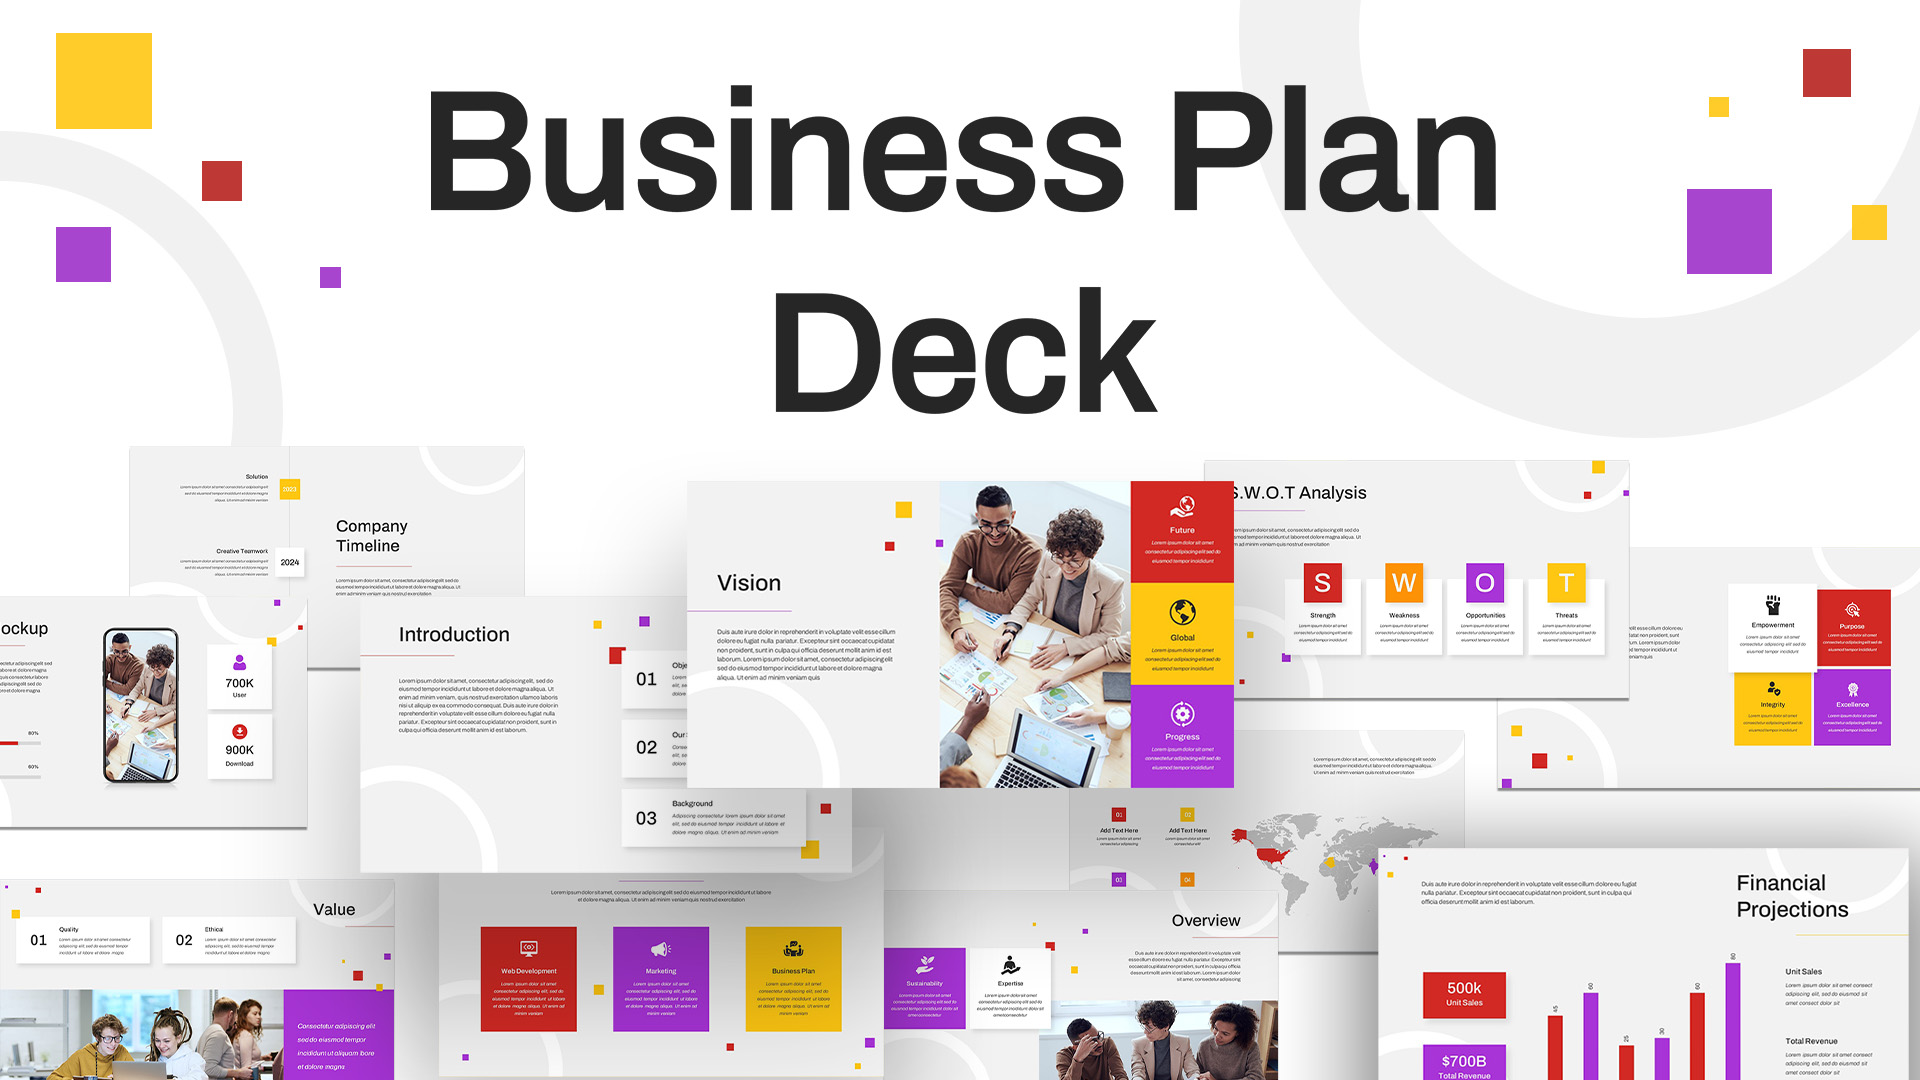
Free Modern Colorful Business Plan Deck Template for PowerPoint & Google Slides
Business Plan
Free
Free Valentine’s Day PowerPoint & Google Slides Template
Business
Free
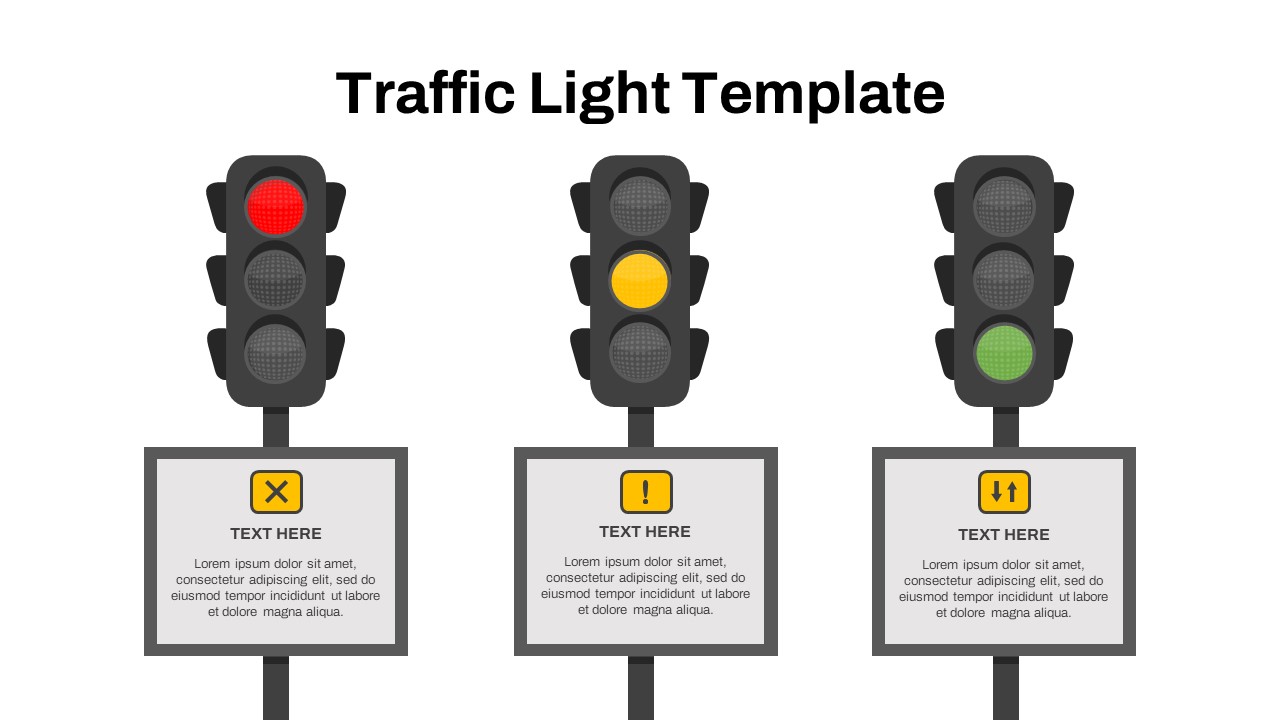
Free Traffic Light Status Indicator Slide Template for PowerPoint & Google Slides
Project Status
Free
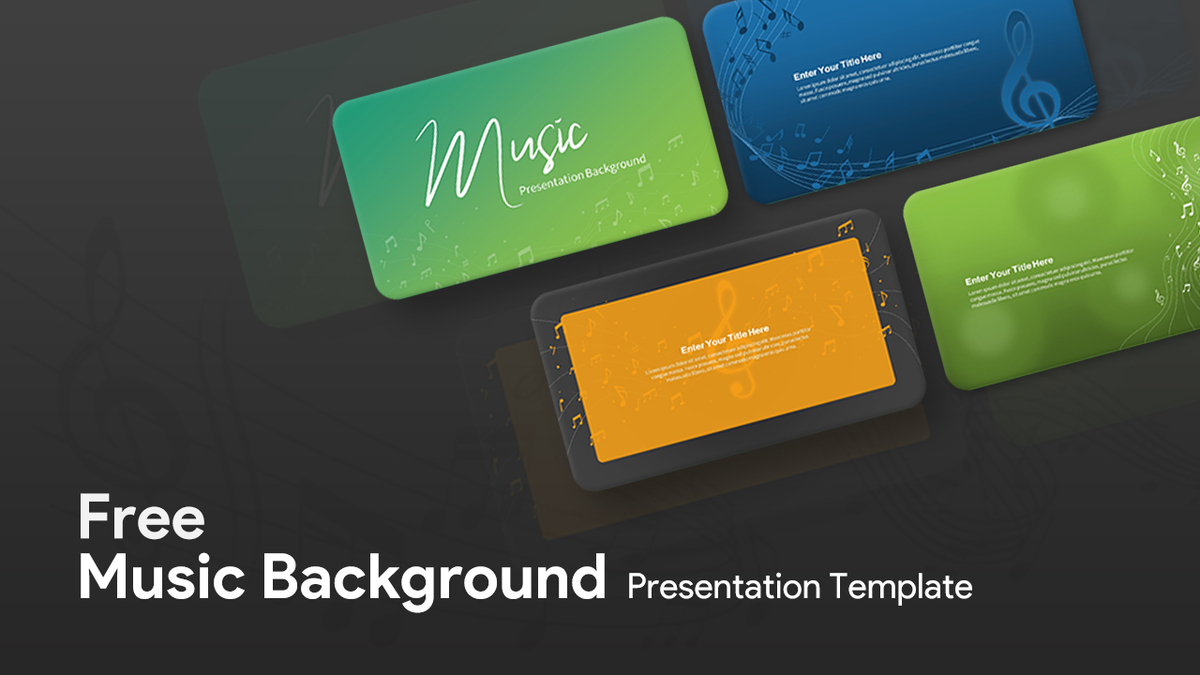
Free Music Background Presentation Template for PowerPoint & Google Slides
Pitch Deck
Free
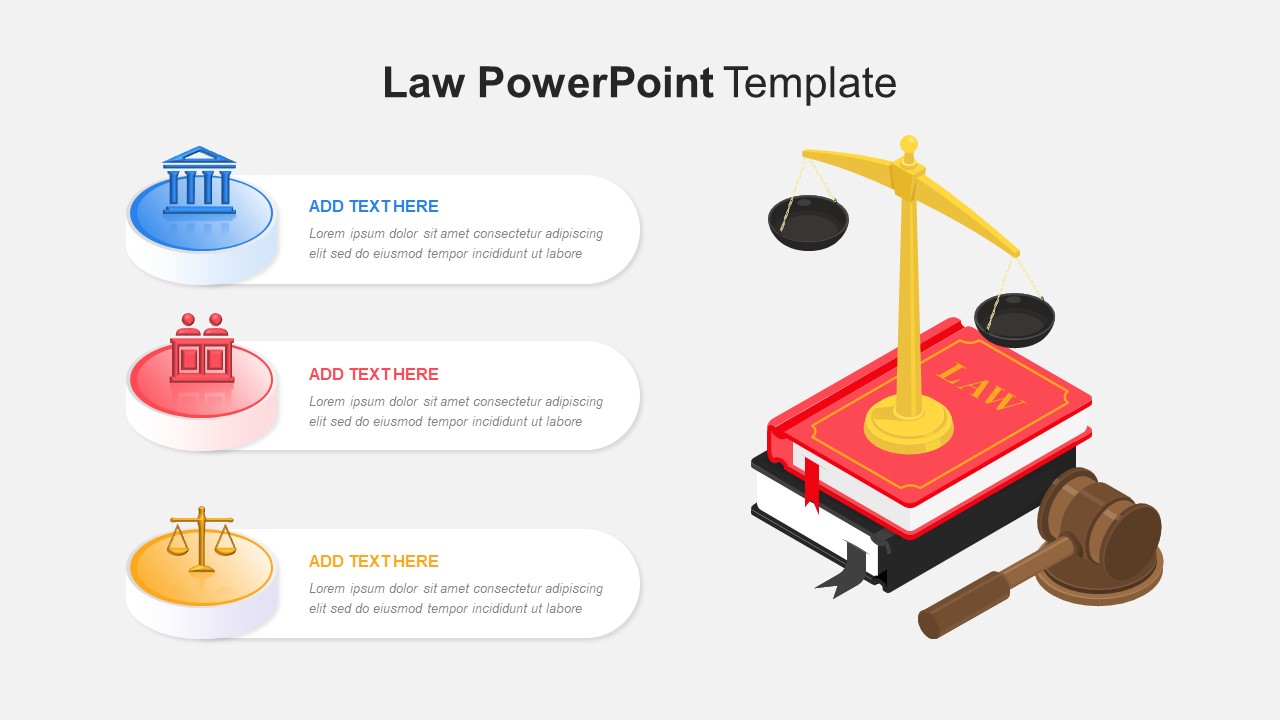
Free Law Infographics Slide Pack Collection Template for PowerPoint & Google Slides
Infographics
Free
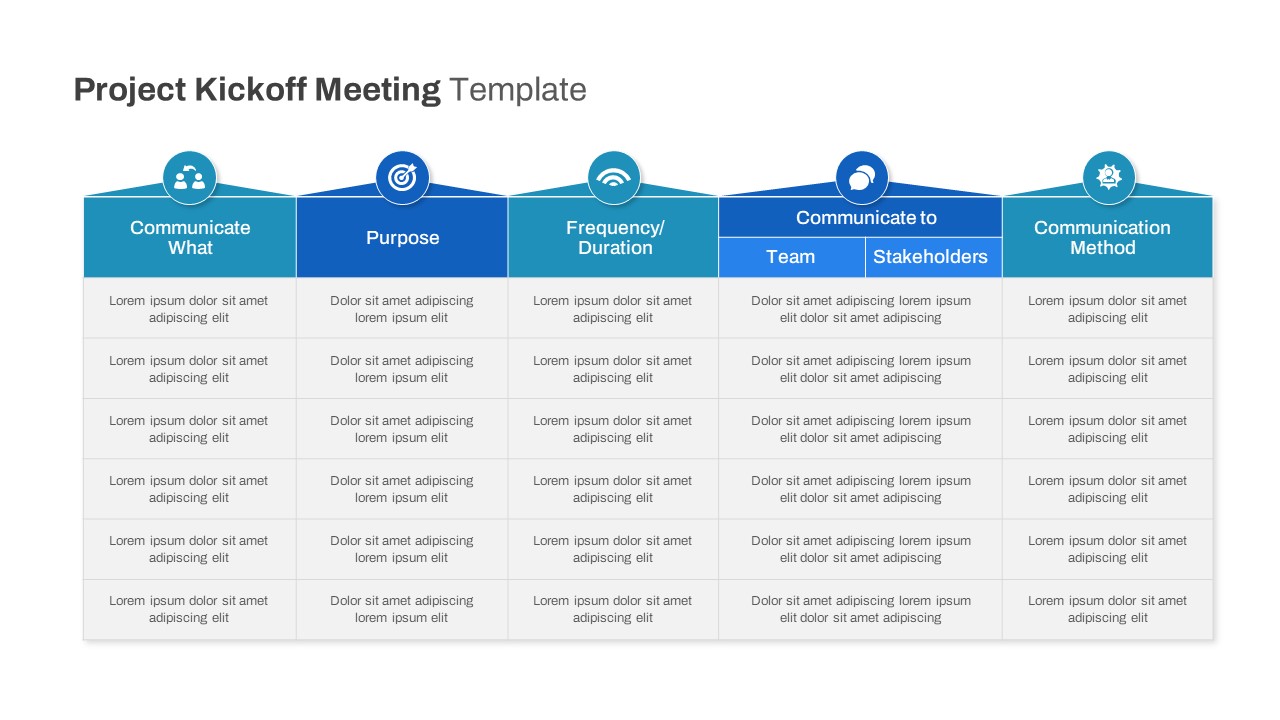
Free Project Kickoff Communication Plan Template for PowerPoint & Google Slides
Project
Free
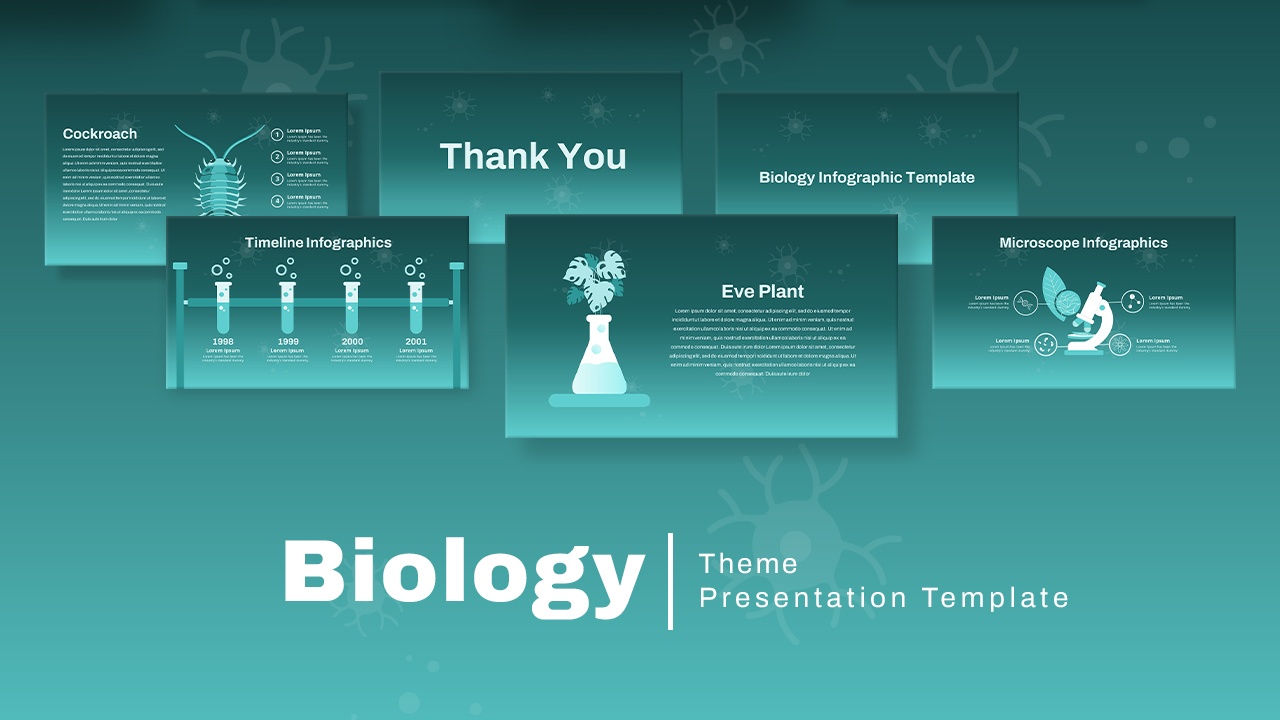
Free Biology Theme Infographics Deck Template for PowerPoint & Google Slides
Health
Free
Free Festive Birthday Celebration Slide Template for PowerPoint & Google Slides
Graphics
Free
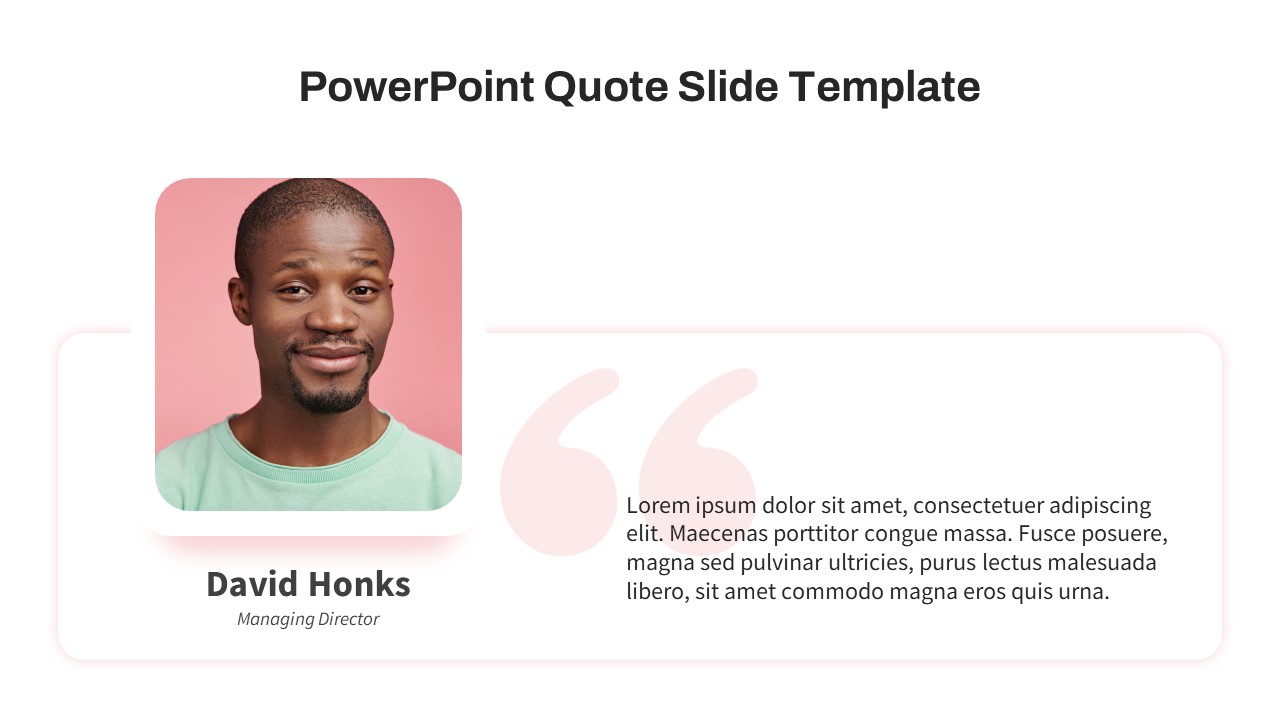
Free Elegant Executive Quote Slide Layout Template for PowerPoint & Google Slides
Our Team
Free
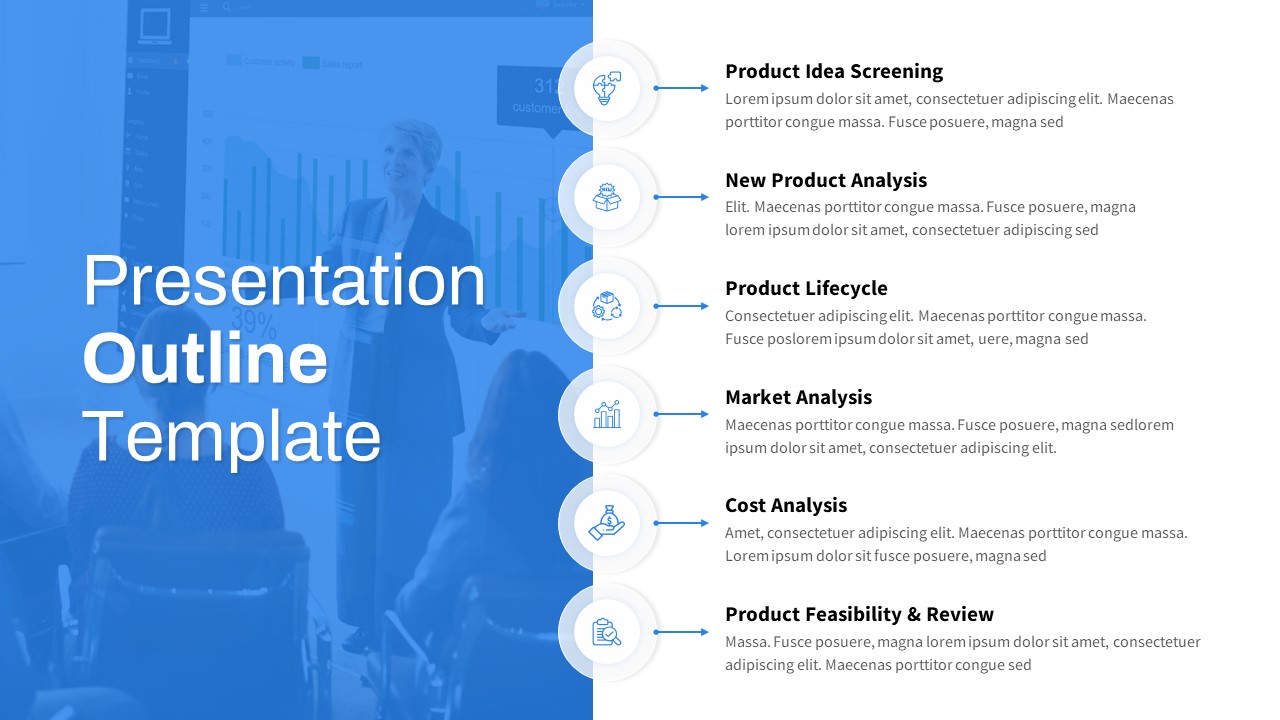
Free Product Development Process Outline Template for PowerPoint & Google Slides
Infographics
Free
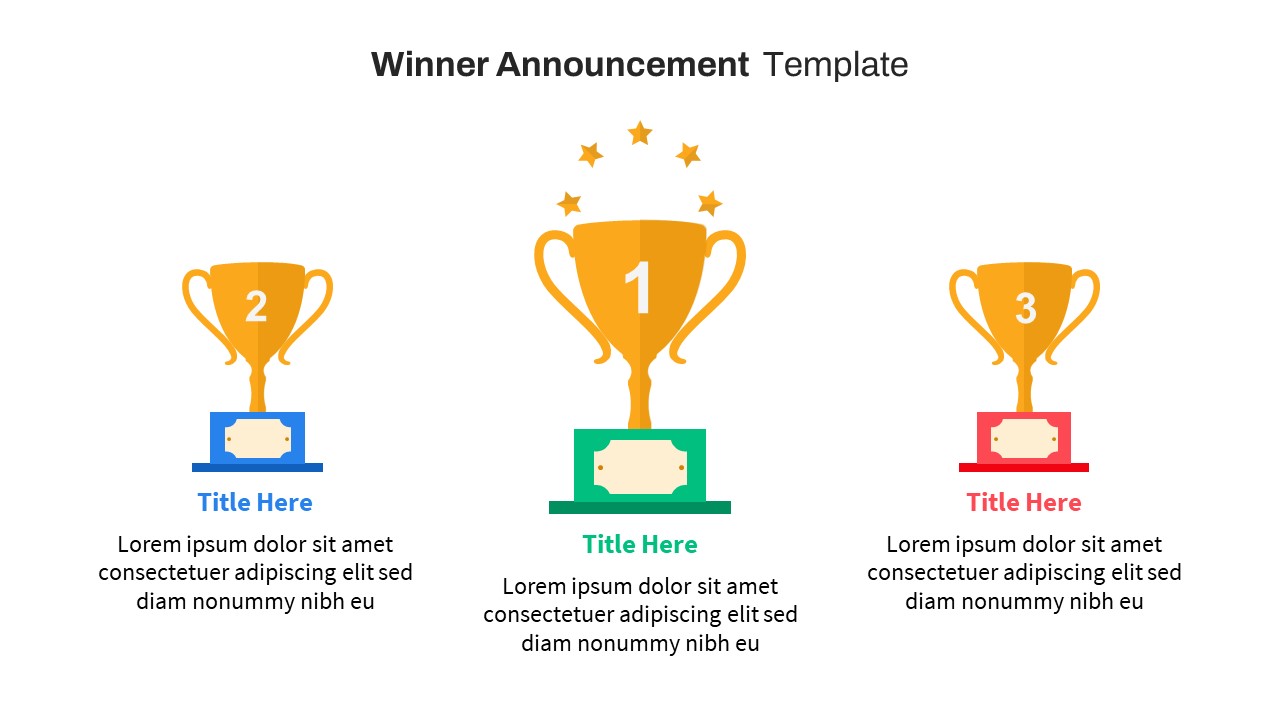
Free Award-Winning Podium Winner Announcement Template for PowerPoint & Google Slides
Accomplishment
Free
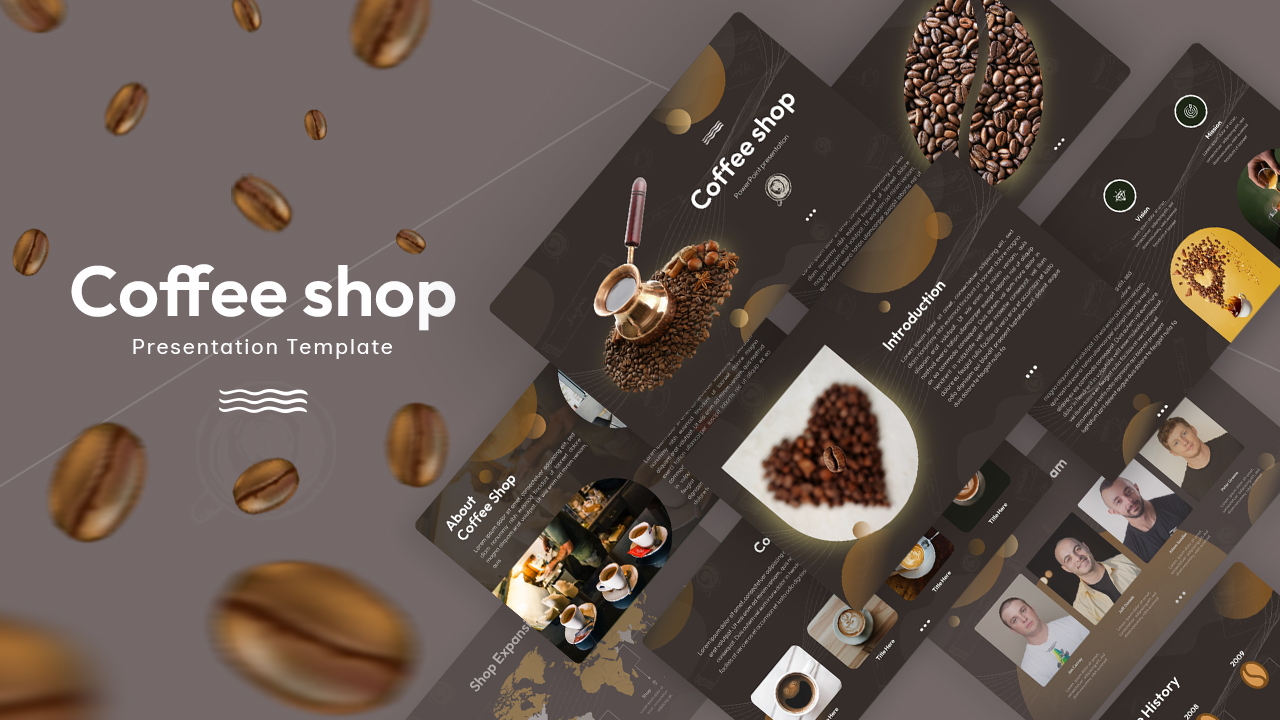
Free Dark Coffee Shop Company Profile Template for PowerPoint & Google Slides
Company Profile
Free
Free Monthly Report PowerPoint Template for PowerPoint & Google Slides
Business Report
Free
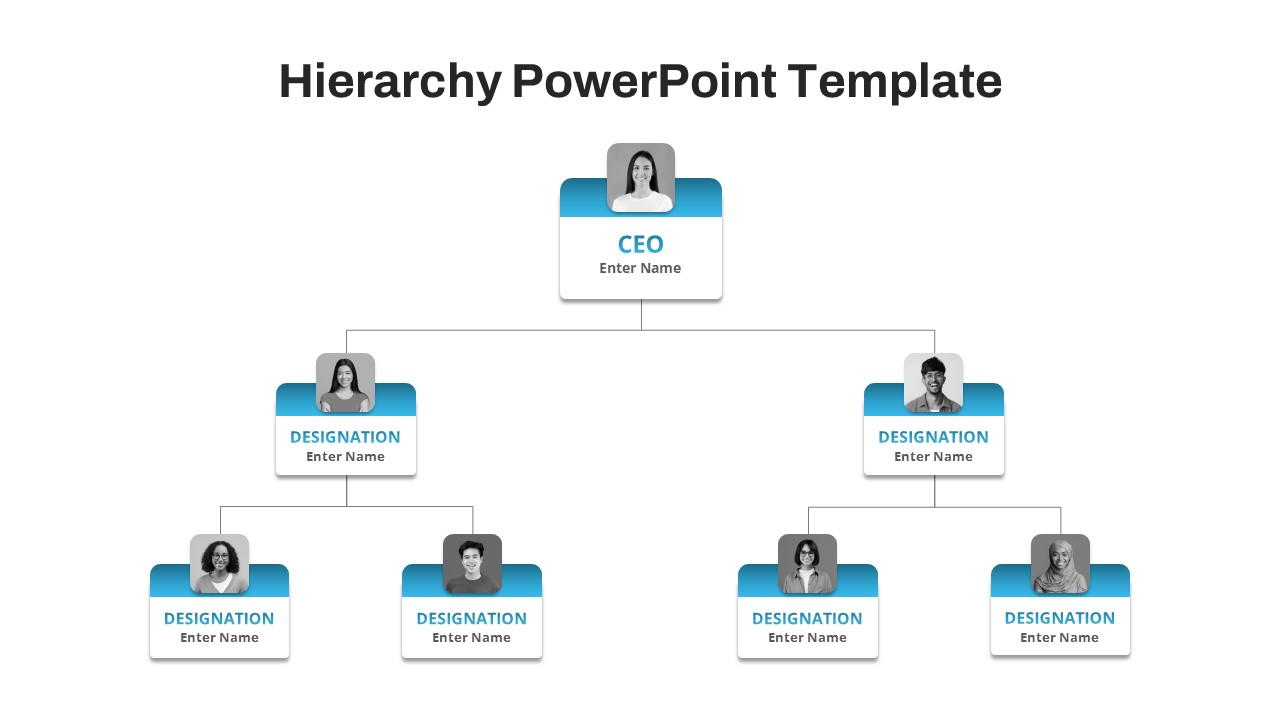
Free Corporate Hierarchy Organizational Chart Template for PowerPoint & Google Slides
Org Chart
Free
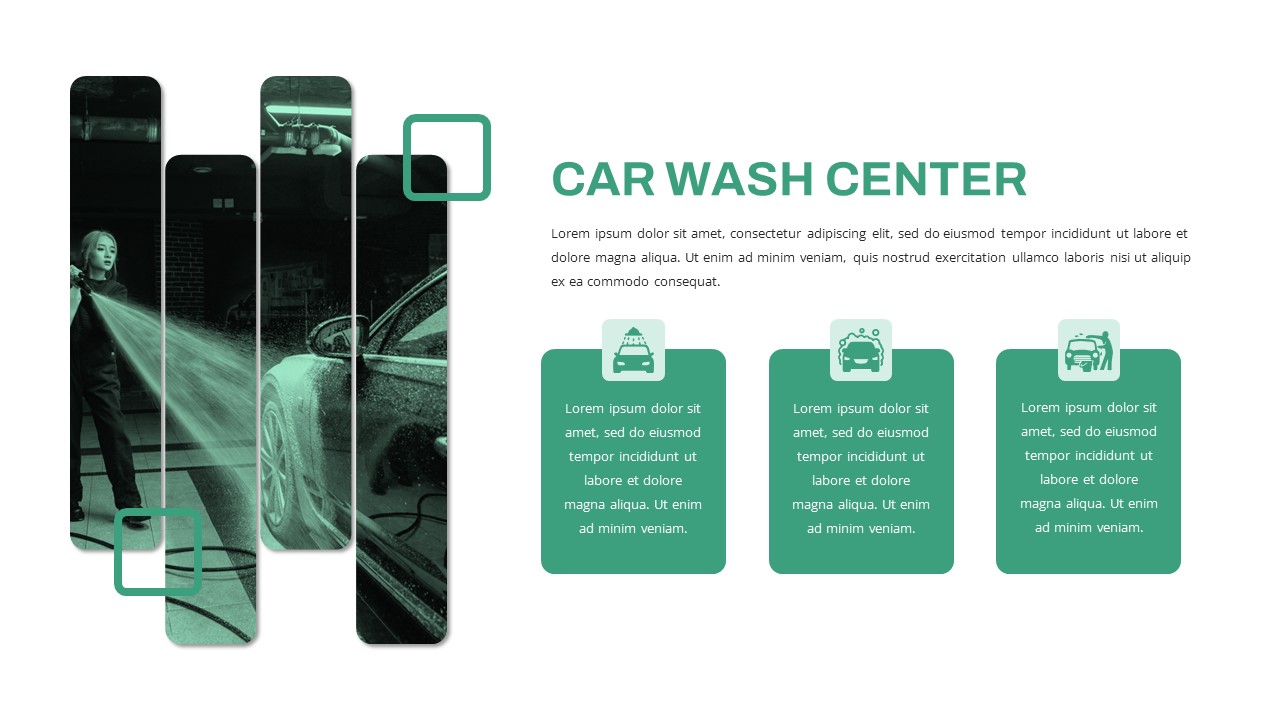
Free Car Wash Center Service Features Slide Template for PowerPoint & Google Slides
Business Proposal
Free
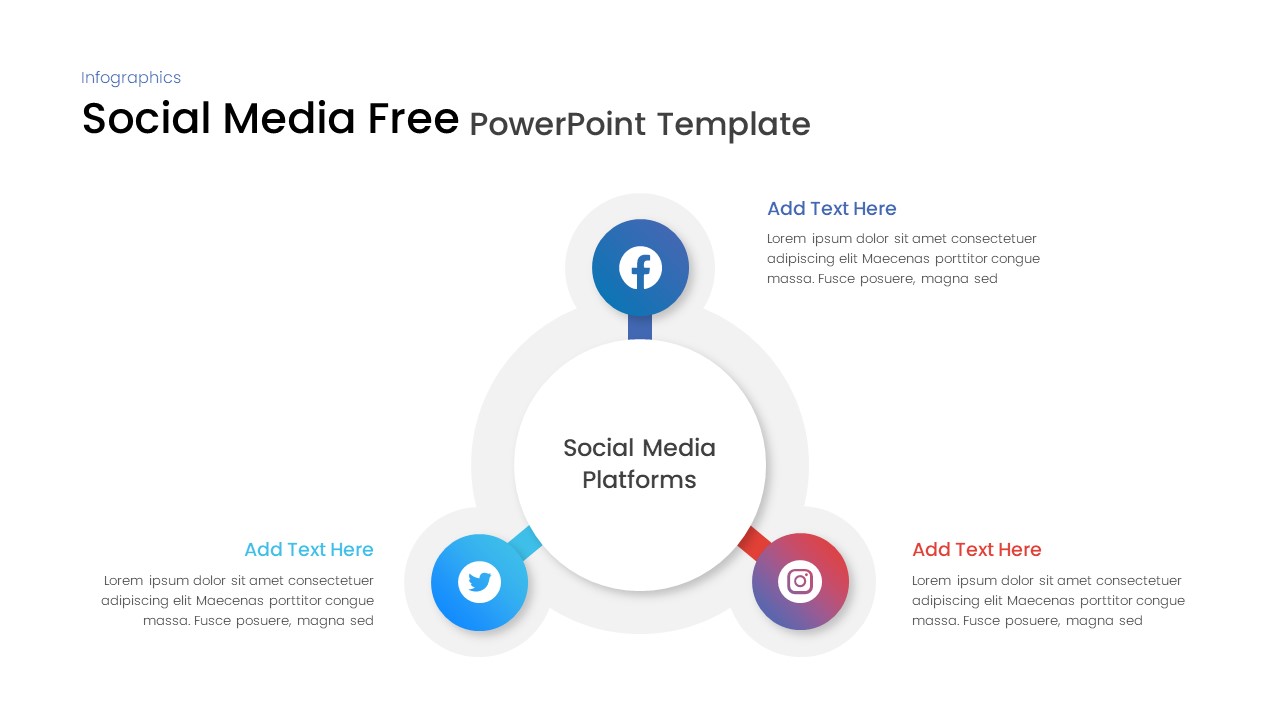
Free Social Media Hub-and-Spoke Infographic Template for PowerPoint & Google Slides
Circular
Free
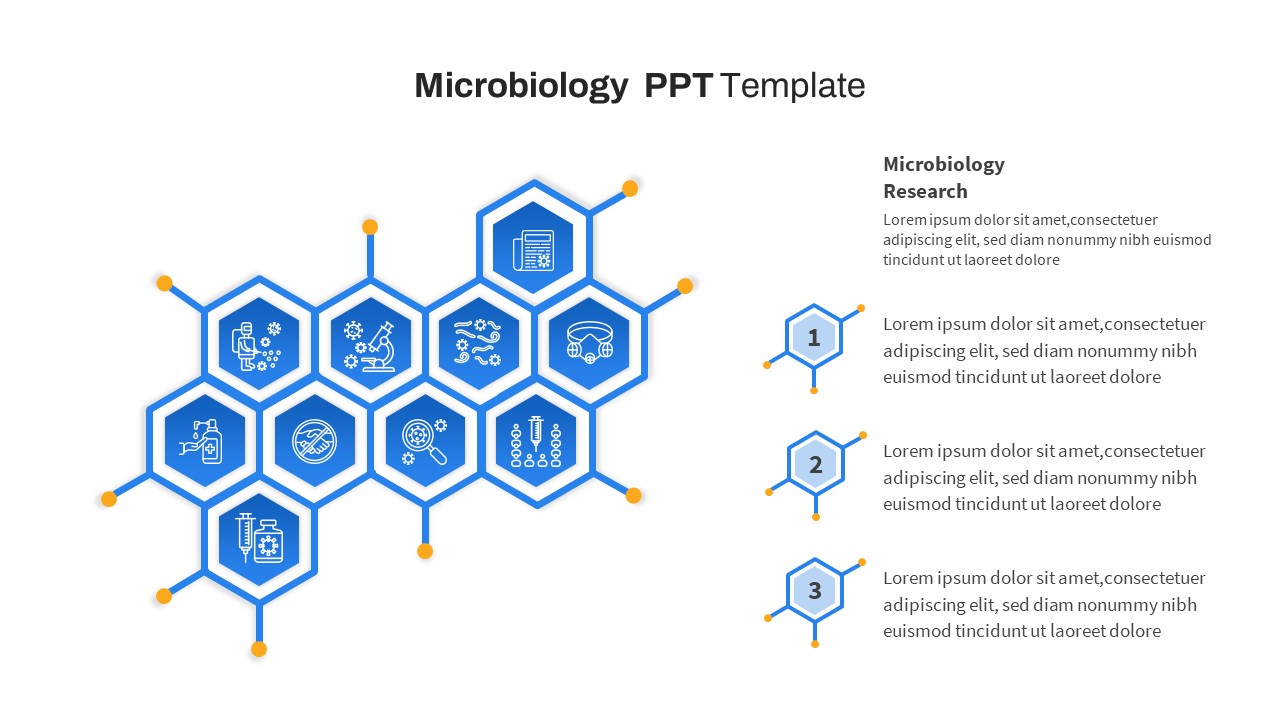
Free Hexagonal Microbiology Research Process Template for PowerPoint & Google Slides
Process
Free
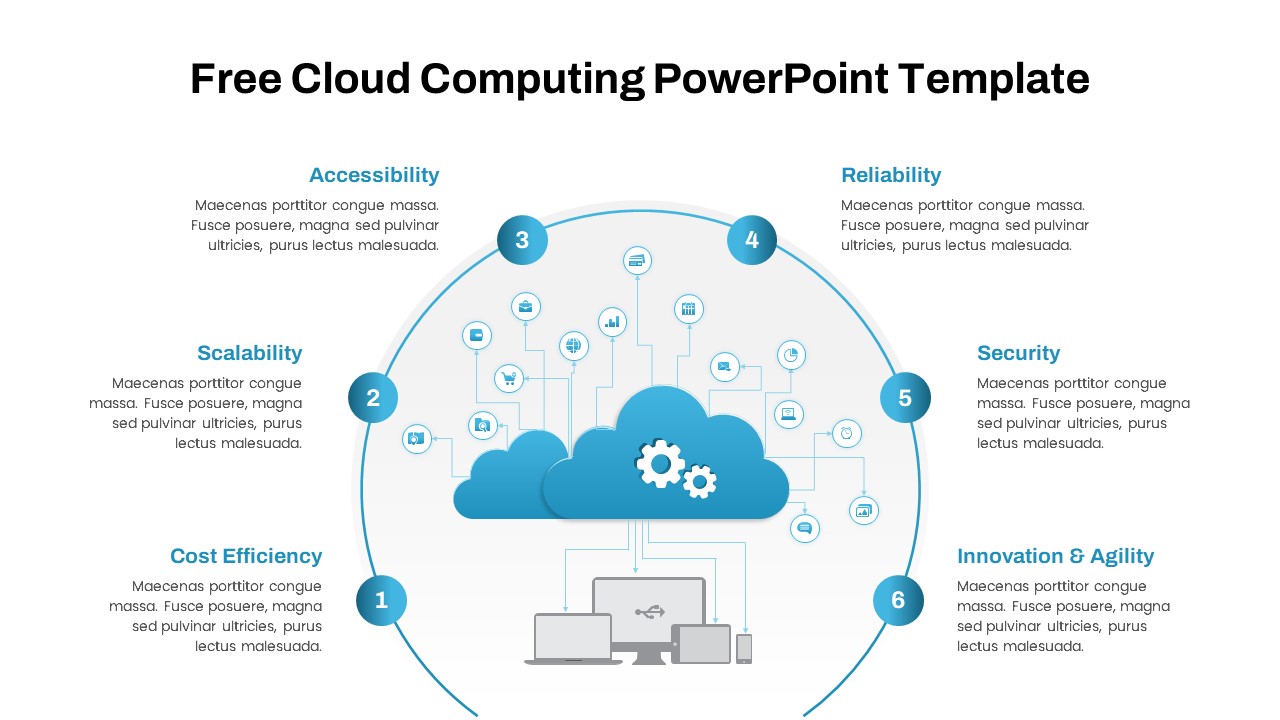
Free Cloud Computing Six-Step Circular Template for PowerPoint & Google Slides
Cloud Computing
Free
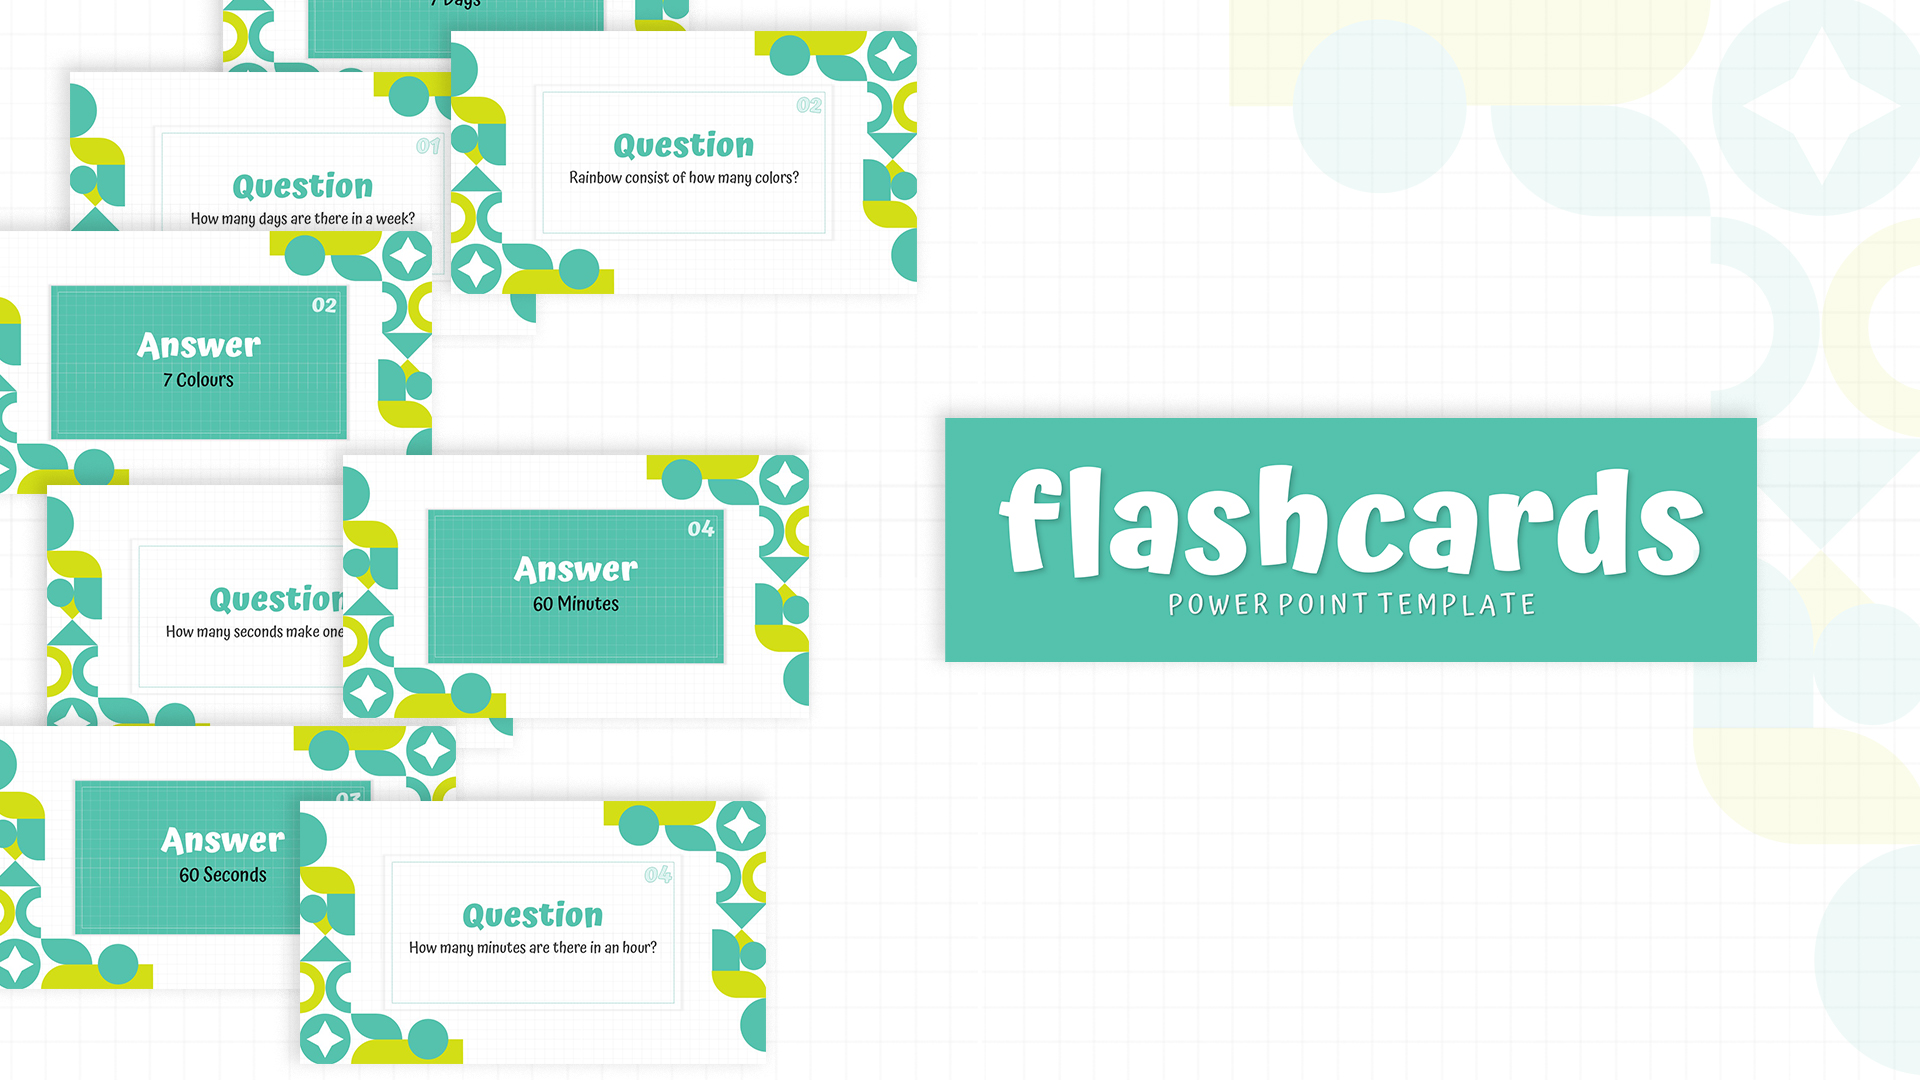
Free Interactive Flashcards Q&A Deck Template for PowerPoint & Google Slides
Free
Free
Free Event Management Gradient Template for PowerPoint & Google Slides
Company Profile
Free
Free Yellow Film Reel Cinema Pitch Deck Template for PowerPoint & Google Slides
Pitch Deck
Free
Free Dynamic Global Warming Presentation Template for PowerPoint & Google Slides
Pitch Deck
Free
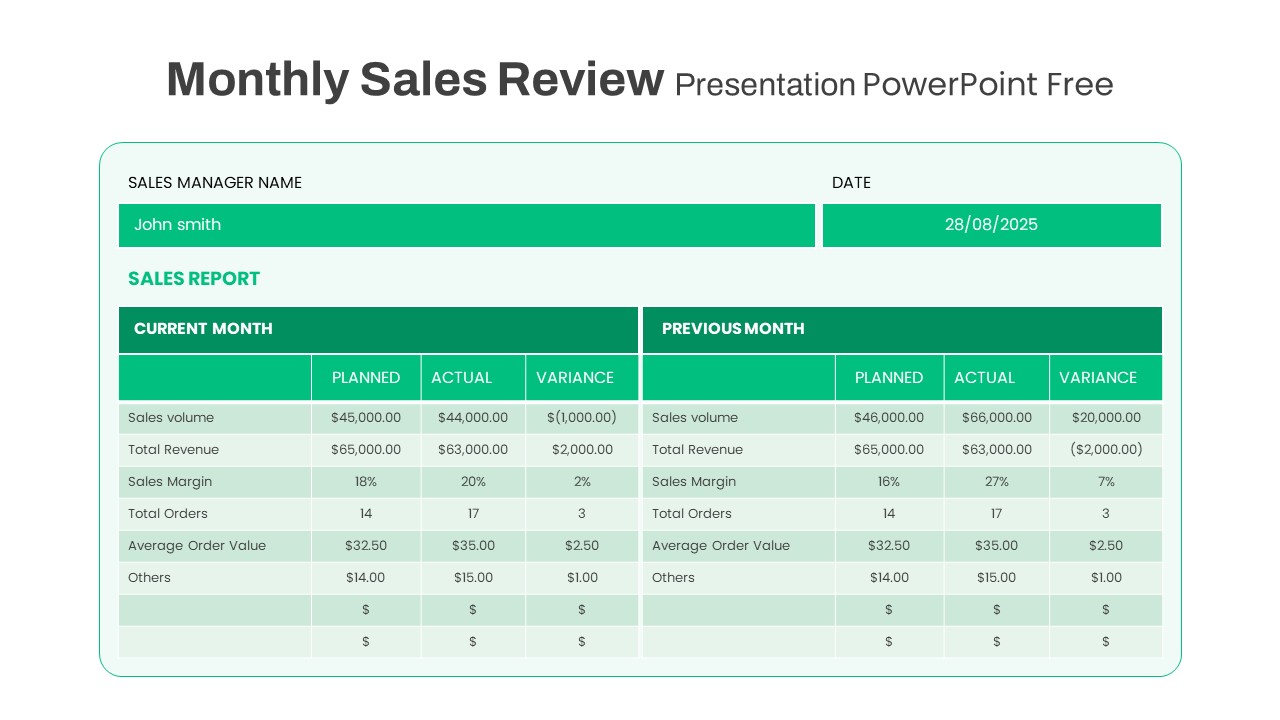
Free Monthly Sales Review template for PowerPoint & Google Slides
Business Report
Free