Flow of Funds Financial System Diagram Template for PowerPoint & Google Slides

Description
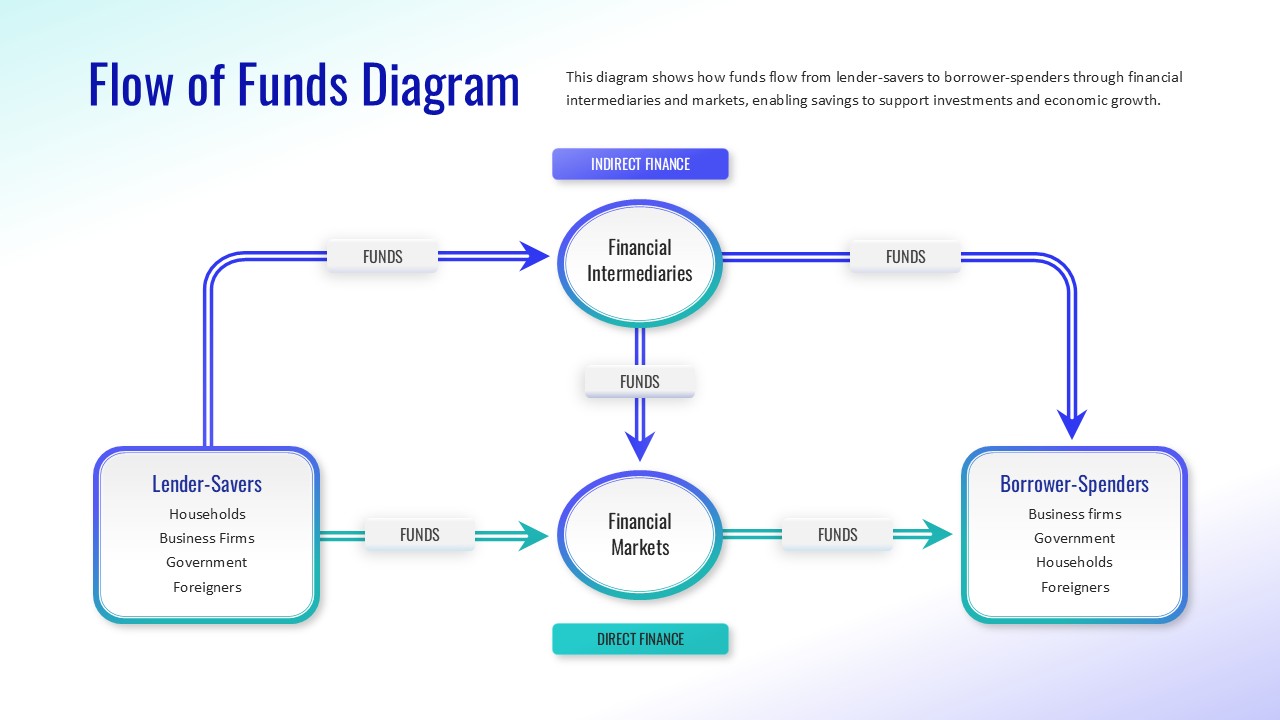
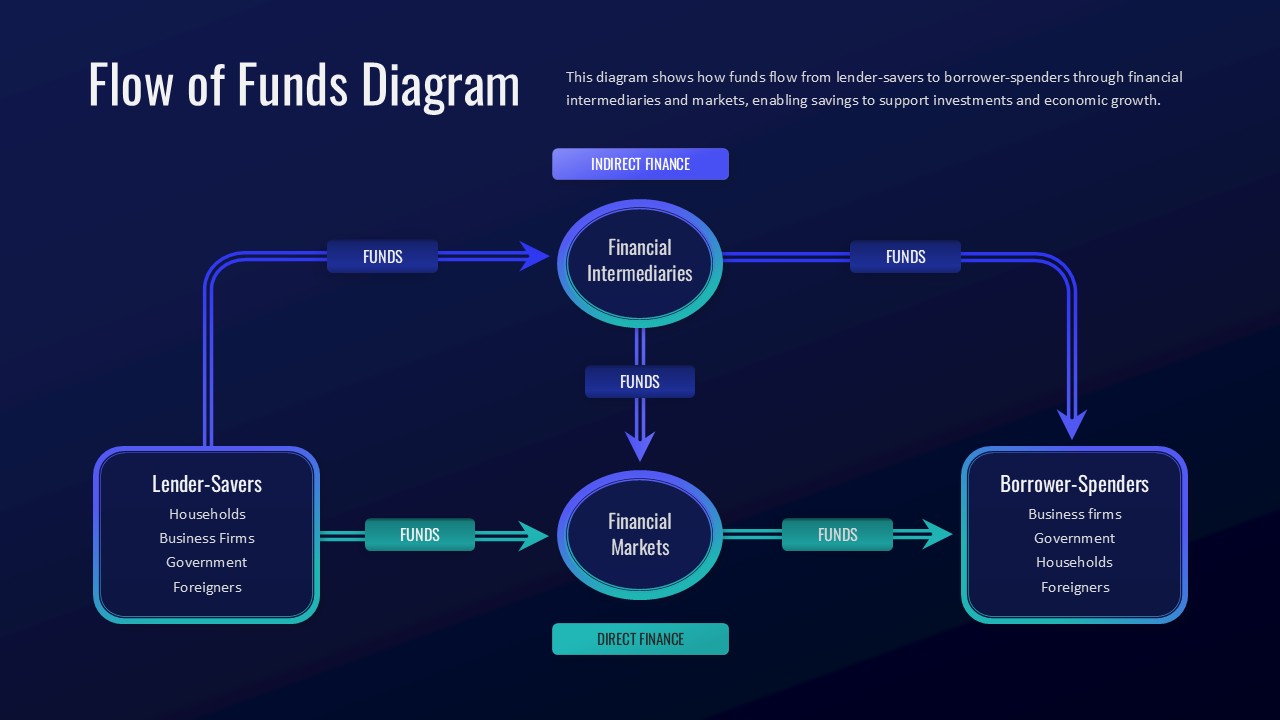
Explain how capital moves through an economy with this clear and structured Flow of Funds diagram slide. The layout visually maps the movement of funds from lender-savers to borrower-spenders through two primary channels: indirect finance via financial intermediaries and direct finance via financial markets. Arrows and labeled connectors clearly illustrate how savings are transformed into investments, supporting economic activity and growth.
On the left, lender-savers—such as households, businesses, governments, and foreigners—are grouped in a dedicated panel. At the center, financial intermediaries and financial markets are presented as distinct yet interconnected entities, emphasizing their roles in channeling funds. On the right, borrower-spenders are highlighted to demonstrate how capital is ultimately allocated across sectors. The structured design ensures audiences can easily follow both indirect and direct financing pathways. Fully editable in PowerPoint and Google Slides, this slide allows you to adjust labels, customize categories, and tailor visual elements to match your teaching or presentation needs.
Ideal for economics lectures, finance training sessions, and policy discussions, this diagram simplifies a foundational macroeconomic concept into an accessible and professional visual framework.
Who is it for
Economics professors, finance instructors, and business school students can use this slide to explain capital flows and financial system structures. Corporate trainers and financial analysts will also find it valuable for workshops on banking, investment systems, or economic policy.
Other Uses
Beyond academic settings, adapt this diagram to present corporate fund allocation models, internal budgeting processes, capital investment strategies, or organizational resource flows. It also works effectively in financial literacy programs, executive briefings, and economic development presentations.
Login to download this file

Item ID
SB05693Designed By
Naseeba
Related Templates

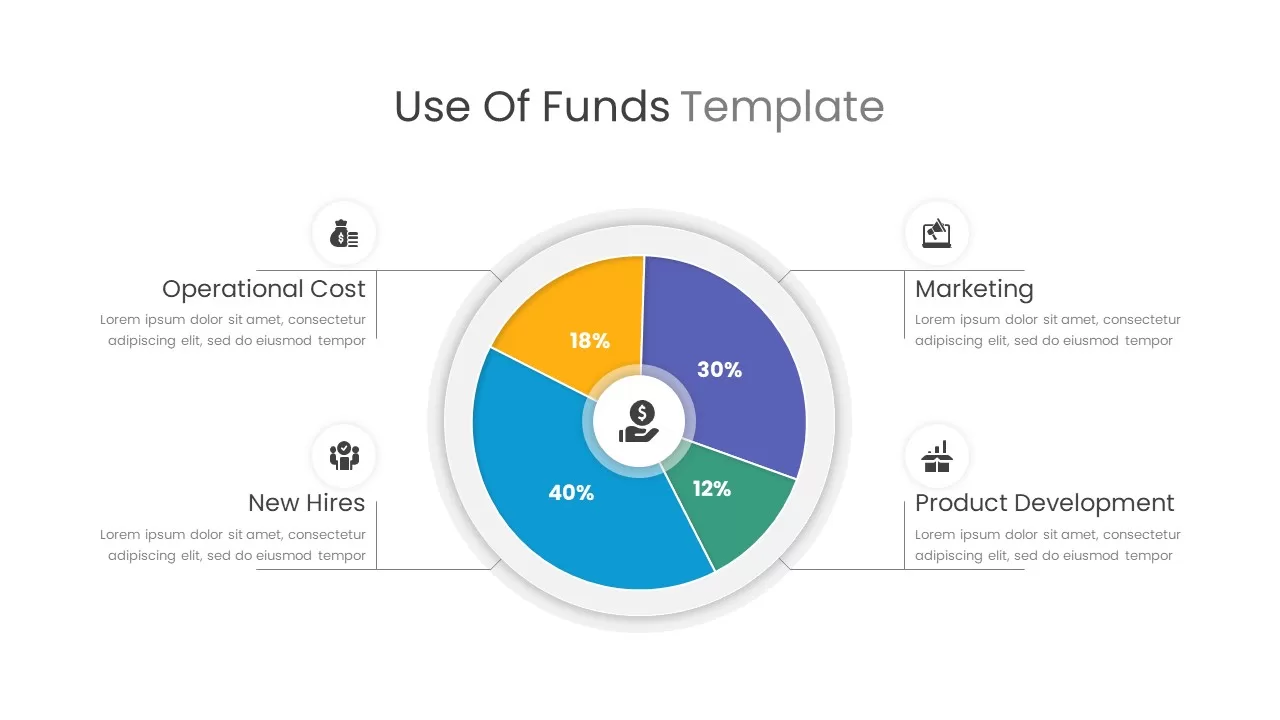
Use of Funds Donut Chart Infographic Template for PowerPoint & Google Slides
Circular
Financial Agreement Signing Flow Diagram Template for PowerPoint & Google Slides
Process
Free Monthly Report PowerPoint Template for PowerPoint & Google Slides
Business Report
Free
Sunk Costs Financial Concept Diagram Template for PowerPoint & Google Slides
Finance
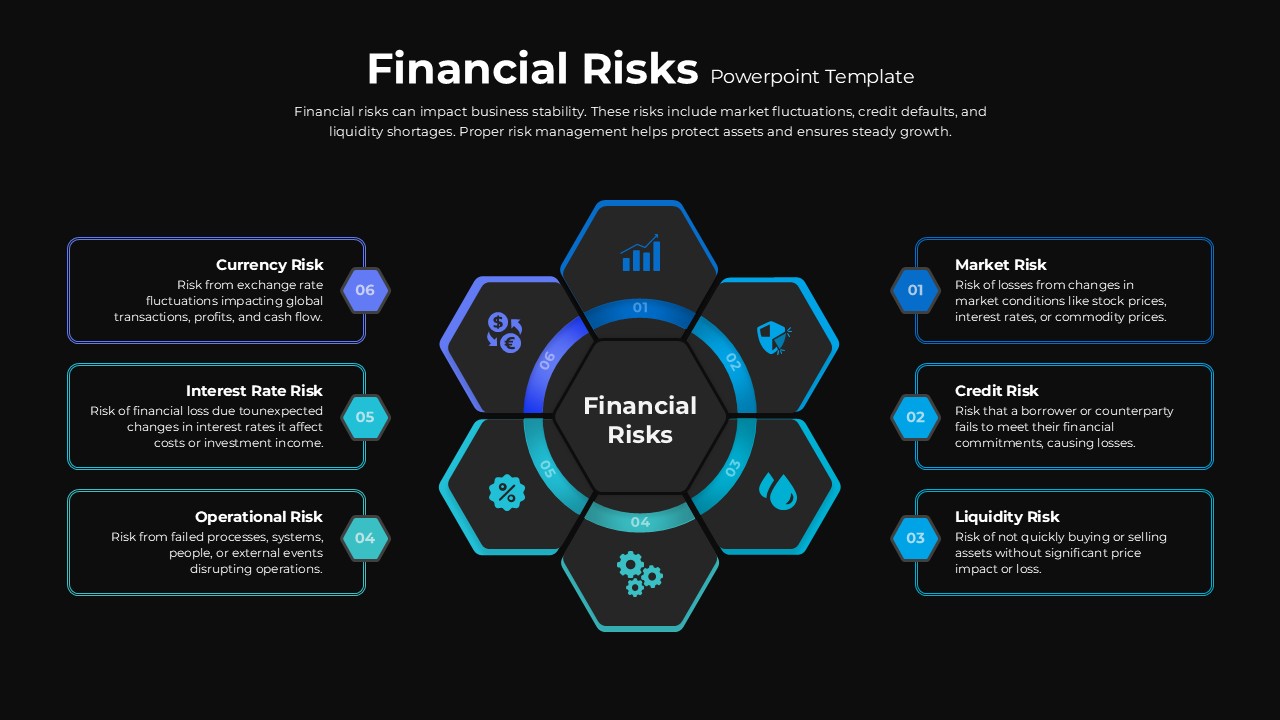
Financial Risks Hexagon Diagram Template for PowerPoint & Google Slides
Risk Management
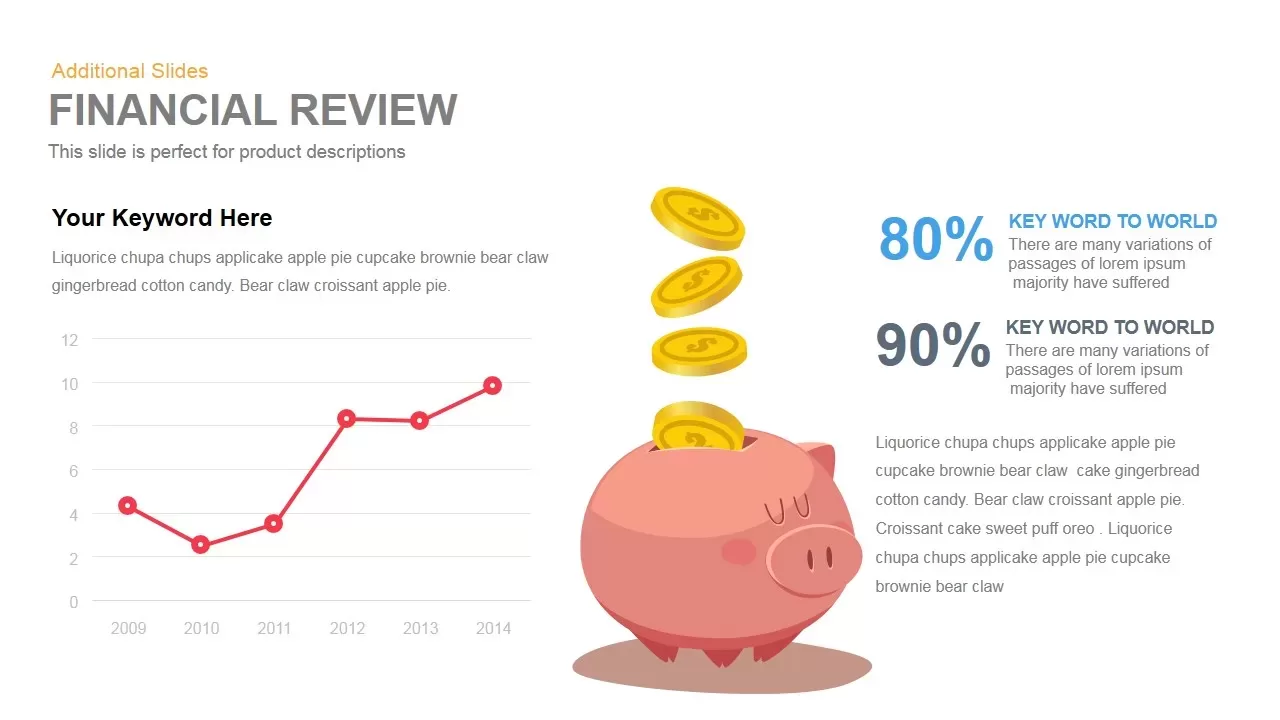
Financial Review template for PowerPoint & Google Slides
Finance

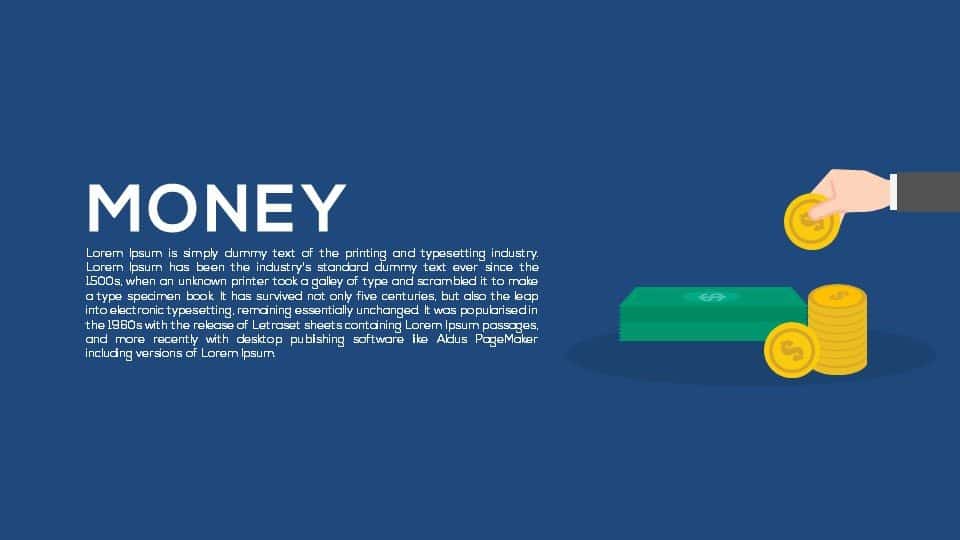
Money Metaphor Financial Overview Template for PowerPoint & Google Slides
Finance
Financial Planning Circular Process Template for PowerPoint & Google Slides
Process
5-Stage Financial Growth Timeline Template for PowerPoint & Google Slides
Timeline
Financial Report Metaphor Illustration Template for PowerPoint & Google Slides
Finance
Income Statement Financial Reporting Template for PowerPoint & Google Slides
Finance
Income Statement Financial Summary Template for PowerPoint & Google Slides
Business Report
Income Statement Financial Report Template for PowerPoint & Google Slides
Business Report
Corporate Financial Auditing Service Template for PowerPoint & Google Slides
Finance

Financial Advisory Service Pitch Deck Template for PowerPoint & Google Slides
Finance
Financial Institutions Presentation Template for PowerPoint & Google Slides
Company Profile
Financial Consulting Company Profile Template for PowerPoint & Google Slides
Finance

Comprehensive Financial Statements Template for PowerPoint & Google Slides
Finance
Circular Financial Ratios Infographic Template for PowerPoint & Google Slides
Finance
Quarterly Financial Summary Dashboard Template for PowerPoint & Google Slides
Business Report
Banking Financial Overview Dashboard Template for PowerPoint & Google Slides
Finance
Annual Financial Results Slide Deck Template for PowerPoint & Google Slides
Finance
Dynamic Financial Analysis Line Chart Template for PowerPoint & Google Slides
Finance
Financial Snapshot & Metrics Overview Template for PowerPoint & Google Slides
Finance
Financial Manager Roles Template for PowerPoint & Google Slides
Process
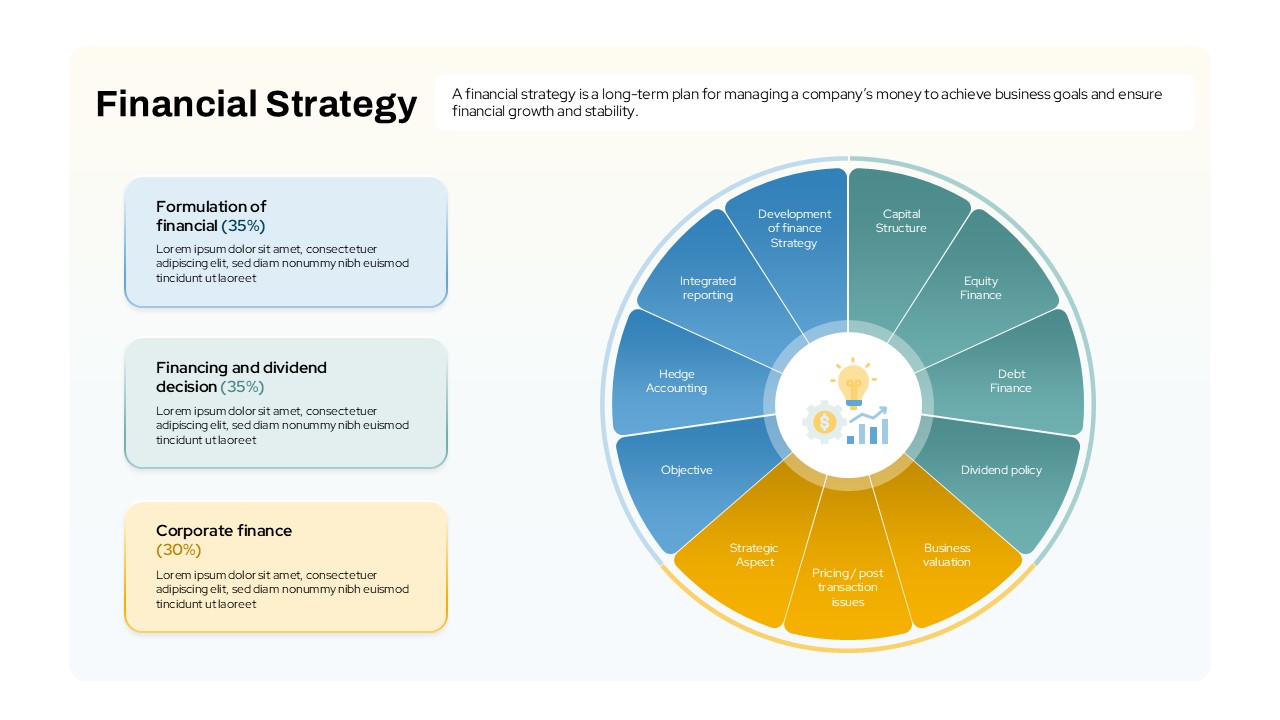
Financial Strategy template for PowerPoint & Google Slides
Business Strategy
Financial Gap Analysis Framework Template for PowerPoint & Google Slides
Finance
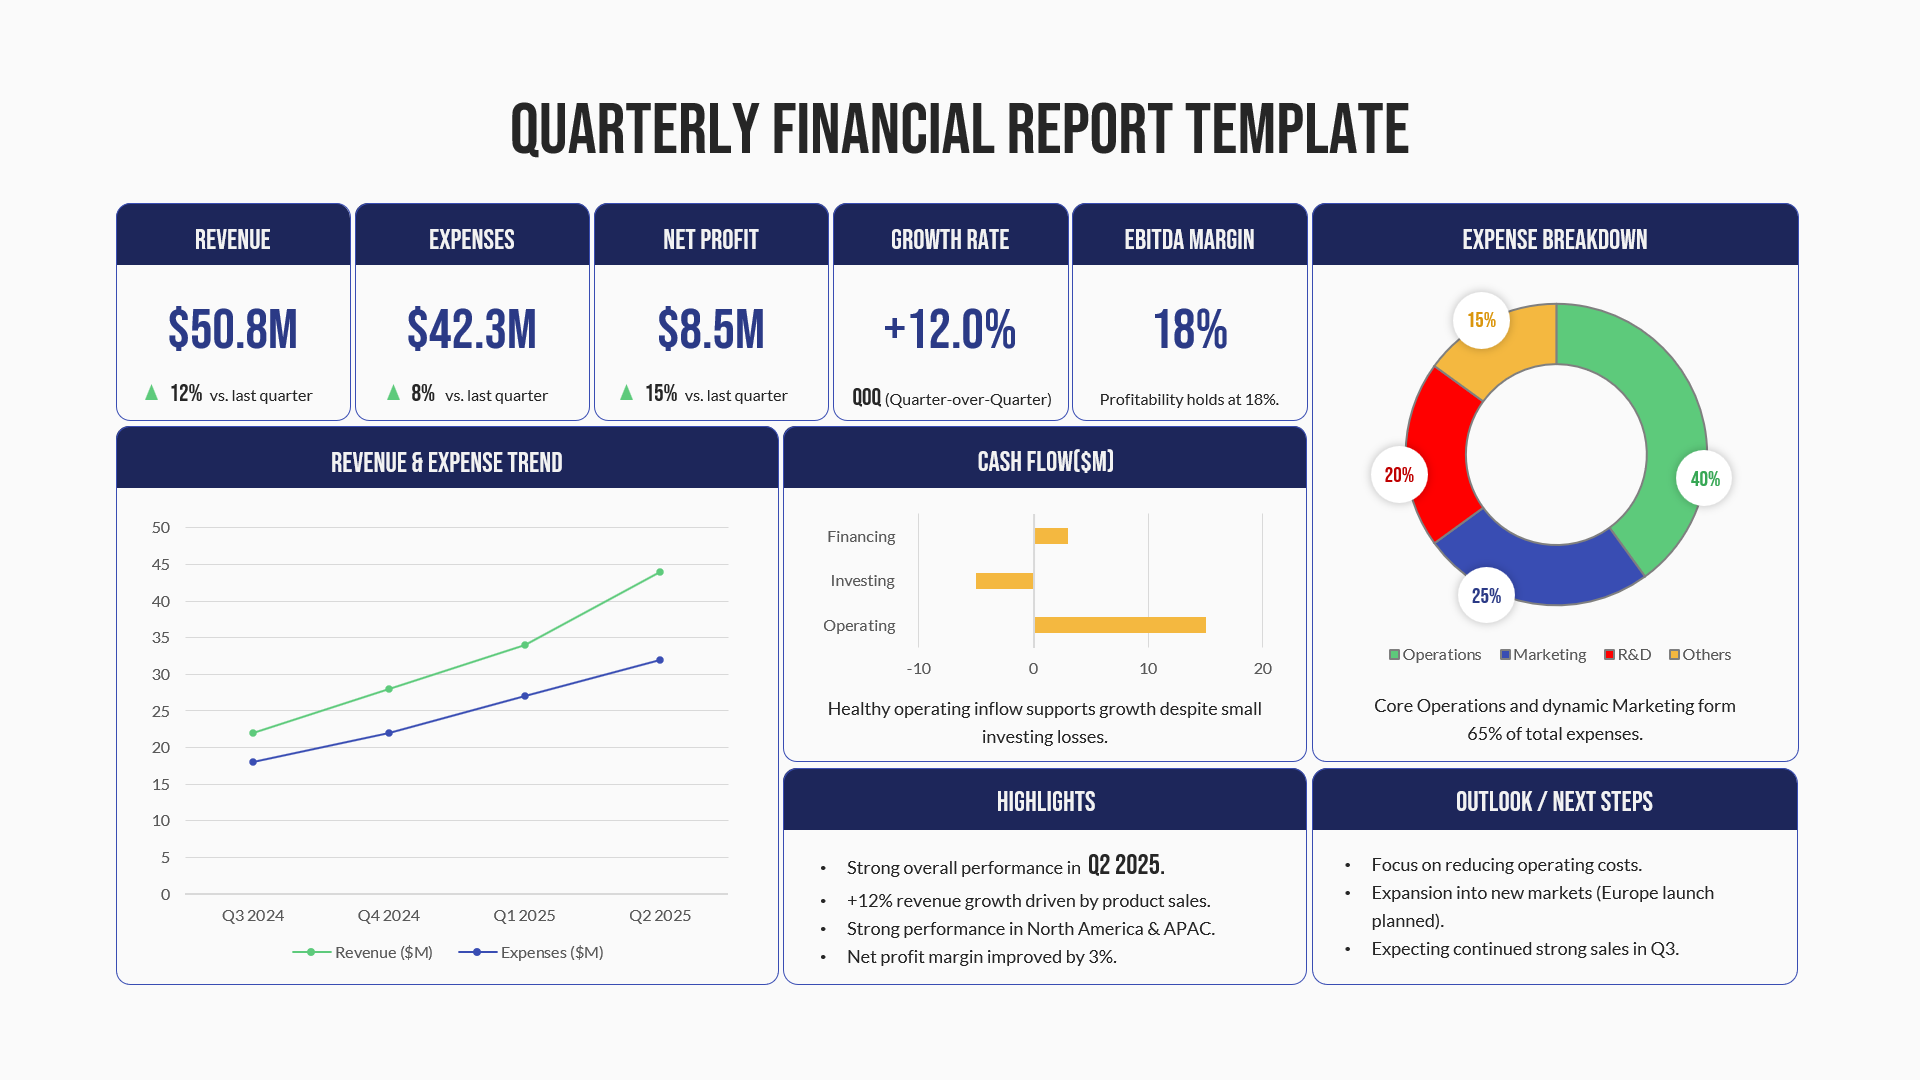
Quarterly Financial Report Dashboard Template for PowerPoint & Google Slides
Finance
Stacked Area Chart with Financial Highlights for PowerPoint & Google Slides
Finance
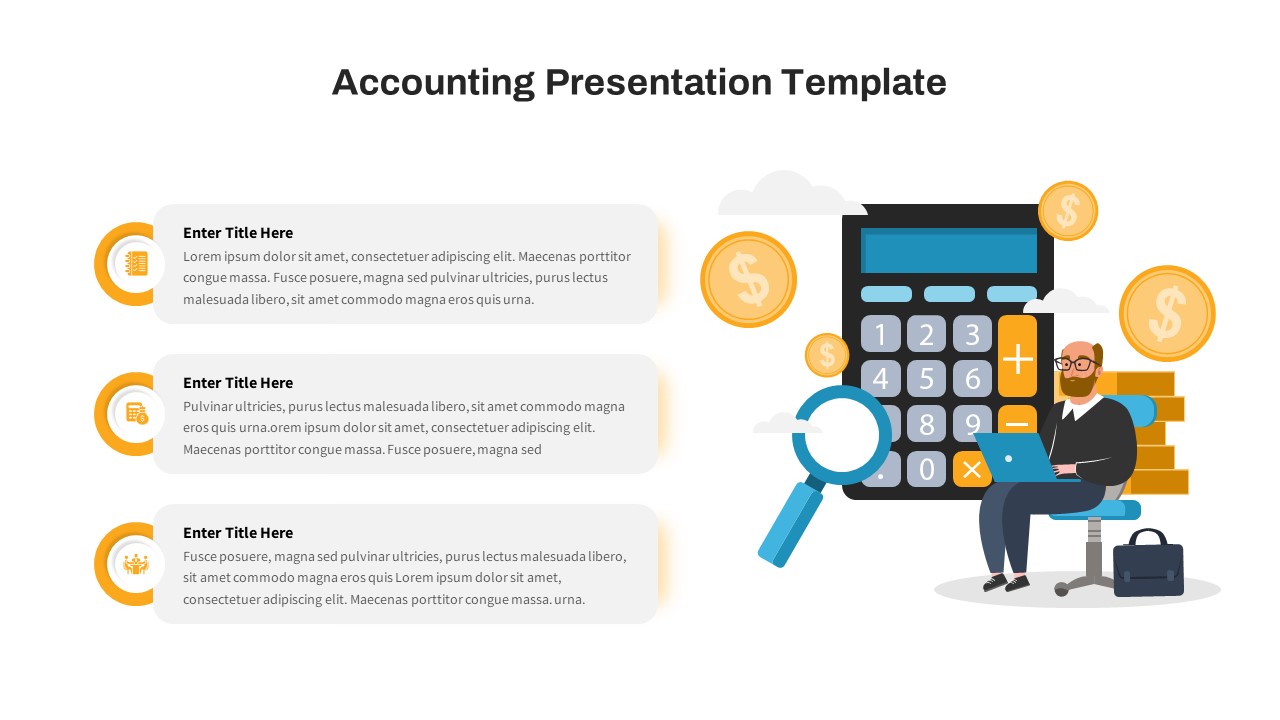
Free Financial Accounting Overview Slide for PowerPoint & Google Slides
Accounting
Free
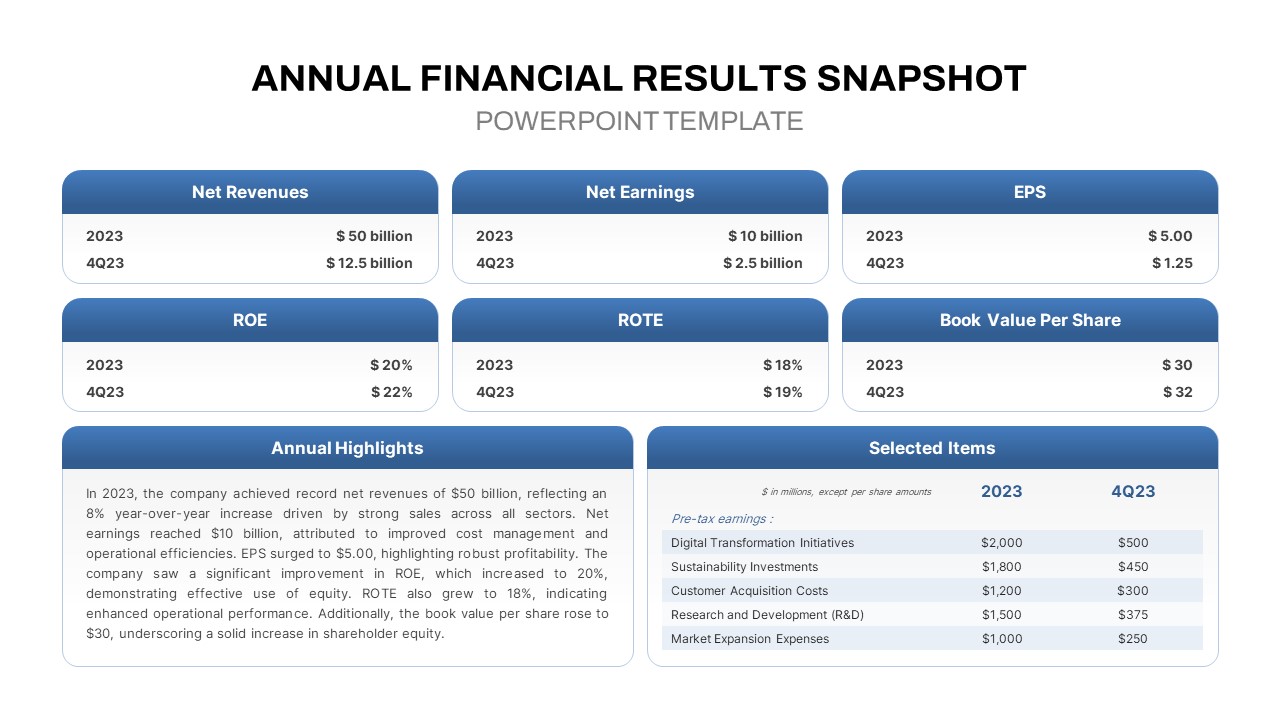
Annual Financial Results Snapshot Template for PowerPoint & Google Slide
Finance
Creative flow diagram template for PowerPoint & Google Slides
Process
8-Stage Process Flow Flower Diagram Template for PowerPoint & Google Slides
Infographics
Circular Flow Diagram Template for PowerPoint & Google Slides
Infographics
4 Section Pipe Diagram Process Flow Template for PowerPoint & Google Slides
Process
Six Hexagon Stages Process Flow Diagram Template for PowerPoint & Google Slides
Process
Ribbon Diagram Flow template for PowerPoint & Google Slides
Process
Process Flow Diagram template for PowerPoint & Google Slides
Infographics
3D Shape Linear Process Flow Diagram Template for PowerPoint & Google Slides
Process
Three Important Services Flow Diagram Template for PowerPoint & Google Slides
Process
Linear Process Flow Circles Diagram Template for PowerPoint & Google Slides
Process
Six-Stage Zig-Zag Process Flow Diagram Template for PowerPoint & Google Slides
Process
Vertical Business Process Flow Diagram Template for PowerPoint & Google Slides
Process
Six-Sided Shutter Diagram Process Flow Template for PowerPoint & Google Slides
Process
Five-Stage 3D Box Flow Diagram Template for PowerPoint & Google Slides
Process
10 Stages Business Flow Process Diagram template for PowerPoint & Google Slides
Business
Gear Flow Diagram template for PowerPoint & Google Slides
Process

Eight-Stage Radial Process Flow Diagram Template for PowerPoint & Google Slides
Process
Four-Plus Process Flow Diagram Template for PowerPoint & Google Slides
Process
4 Step Revenue Growth Flow Diagram Template for PowerPoint & Google Slides
Process
Pipe Water Infographics Flow Diagram Template for PowerPoint & Google Slides
Process
Five Stage Linear Process Flow Diagram Template for PowerPoint & Google Slides
Process
10-Point Gradient Agenda Flow Diagram Template for PowerPoint & Google Slides
Agenda
Five-Stage Agenda Flow Diagram Template for PowerPoint & Google Slides
Agenda
Six-Step Hexagon Process Flow Diagram Template for PowerPoint & Google Slides
Process
Five-Stage Circular Flow Diagram Template for PowerPoint & Google Slides
Circular
5-Stage Gear Process Flow Diagram Template for PowerPoint & Google Slides
Process
3D Seven-Stage Process Flow Diagram Template for PowerPoint & Google Slides
Process
Four-Stage Linear Process Flow Diagram Template for PowerPoint & Google Slides
Process
Four-Stage Circular Flow Diagram Template for PowerPoint & Google Slides
Circular
5-Stage Linear Process Flow Diagram Template for PowerPoint & Google Slides
Process
5 Stage Linear Process Flow Diagram Template for PowerPoint & Google Slides
Process
Five-Stage Process Flow Diagram Template for PowerPoint & Google Slides
Process
4 Stage Linear Process Flow Diagram Template for PowerPoint & Google Slides
Process
7 Stage Linear Process Flow Diagram Template for PowerPoint & Google Slides
Process
8 Step Circular Process Flow Diagram Template for PowerPoint & Google Slides
Process
4 Stage Linear Process Flow Diagram Template for PowerPoint & Google Slides
Process
6-Step Business Process Flow Diagram Template for PowerPoint & Google Slides
Process
Six-Stage Circular Flow Diagram Template for PowerPoint & Google Slides
Circular
4-Step Linear Process Flow Diagram Template for PowerPoint & Google Slides
Process
Vertical Split Flow Chart Diagram Template for PowerPoint & Google Slides
Flow Charts
Business Process Management Flow Diagram Template for PowerPoint & Google Slides
Process
Colorful 8-Stage Droplet Process Flow Diagram Template for PowerPoint & Google Slides
Process
Flow Chart Diagram Template for PowerPoint & Google Slides
Flow Charts
Minimal Process Flow Diagram Infographic Template for PowerPoint & Google Slides
Process
Flow Chart Diagram template for PowerPoint & Google Slides
Flow Charts
Process Flow Diagram template for PowerPoint & Google Slides
Process
Free Circular Multi-Step Flow Chart Diagram Template for PowerPoint & Google Slides
Flow Charts
Free
Curved Arrow Process Flow Diagram Template for PowerPoint & Google Slides
Process
Curved Arrow Process Flow Diagram Template for PowerPoint & Google Slides
Arrow
Curved Arrow Flow Diagram template for PowerPoint & Google Slides
Business
3D Conveyor Belt Process Flow Diagram Template for PowerPoint & Google Slides
Process
E-Waste Management Process Flow Diagram Template for PowerPoint & Google Slides
Process
Comprehensive Process Flow Diagram Template for PowerPoint & Google Slides
Process
Animated Gears Process Flow Diagram Template for PowerPoint & Google Slides
Process
Advanced Data Flow Diagram Pack Template for PowerPoint & Google Slides
Flow Charts
Capital Investments Process Flow Diagram Template for PowerPoint & Google Slides
Process
Order to Cash Process Flow Diagram Template for PowerPoint & Google Slides
Process
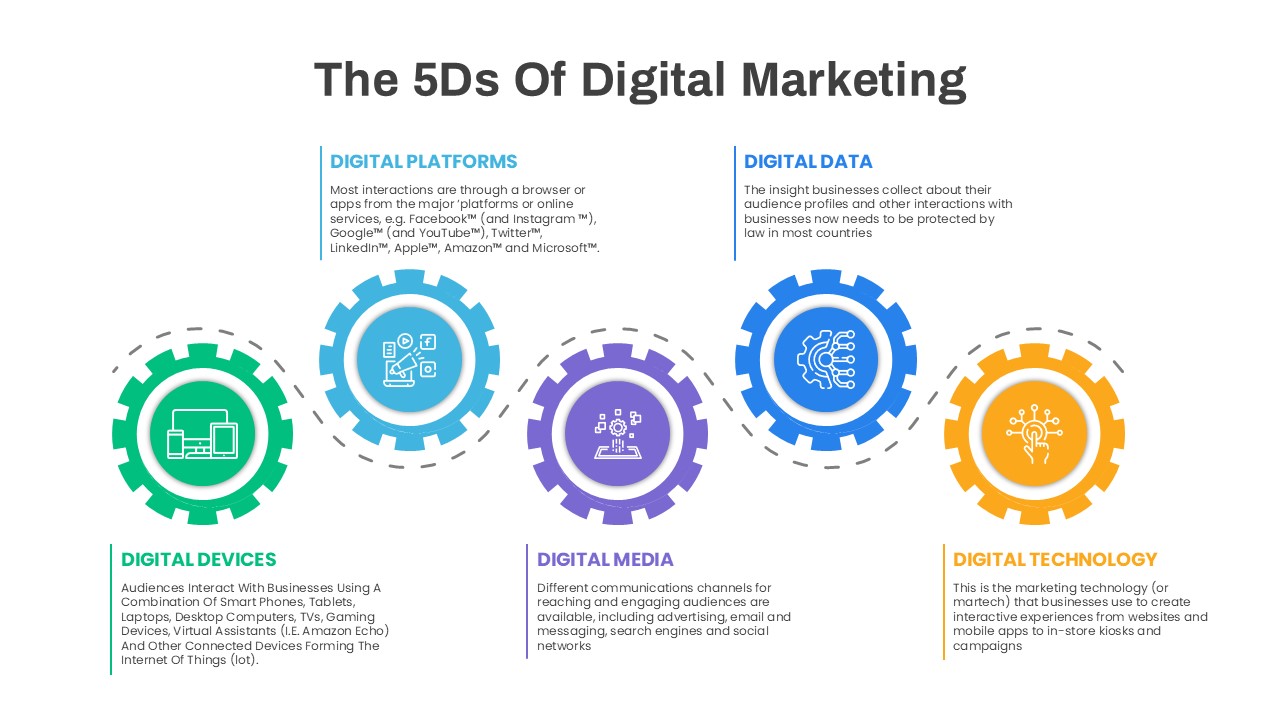
5D Digital Marketing Flow Diagram Template for PowerPoint & Google Slides
Digital Marketing
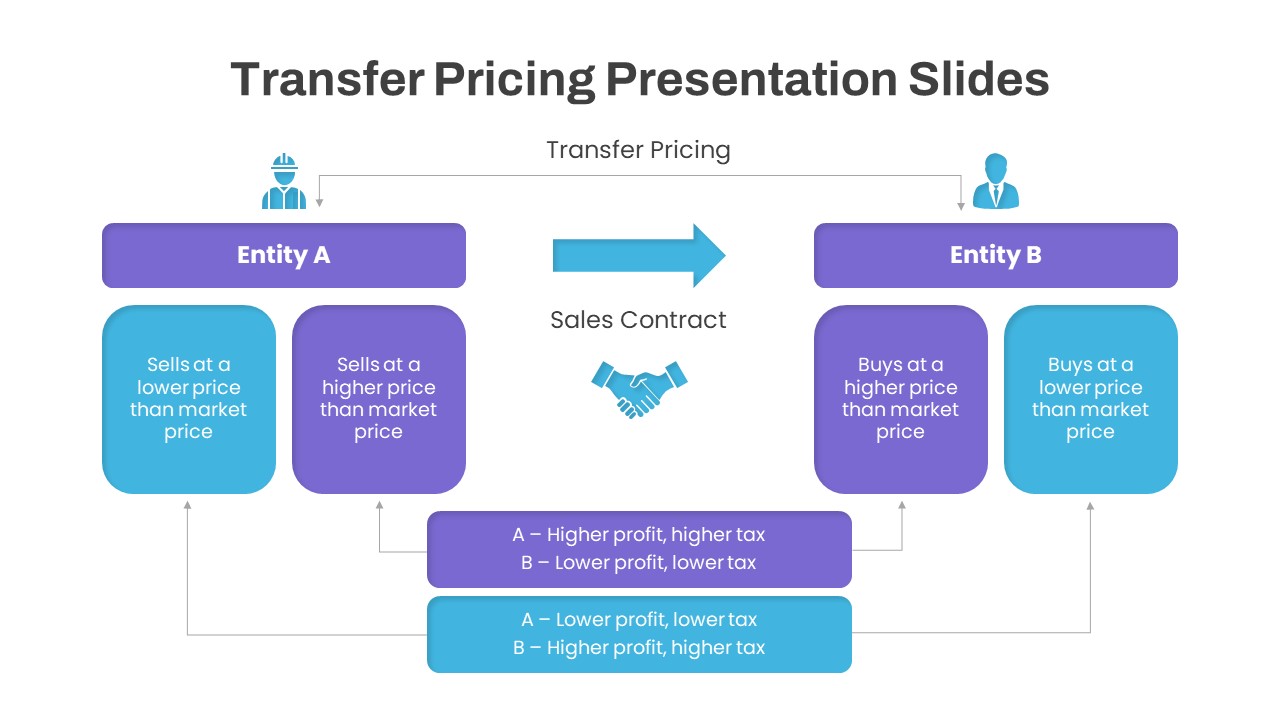
Dynamic Transfer Pricing Flow Diagram Template for PowerPoint & Google Slides
Finance
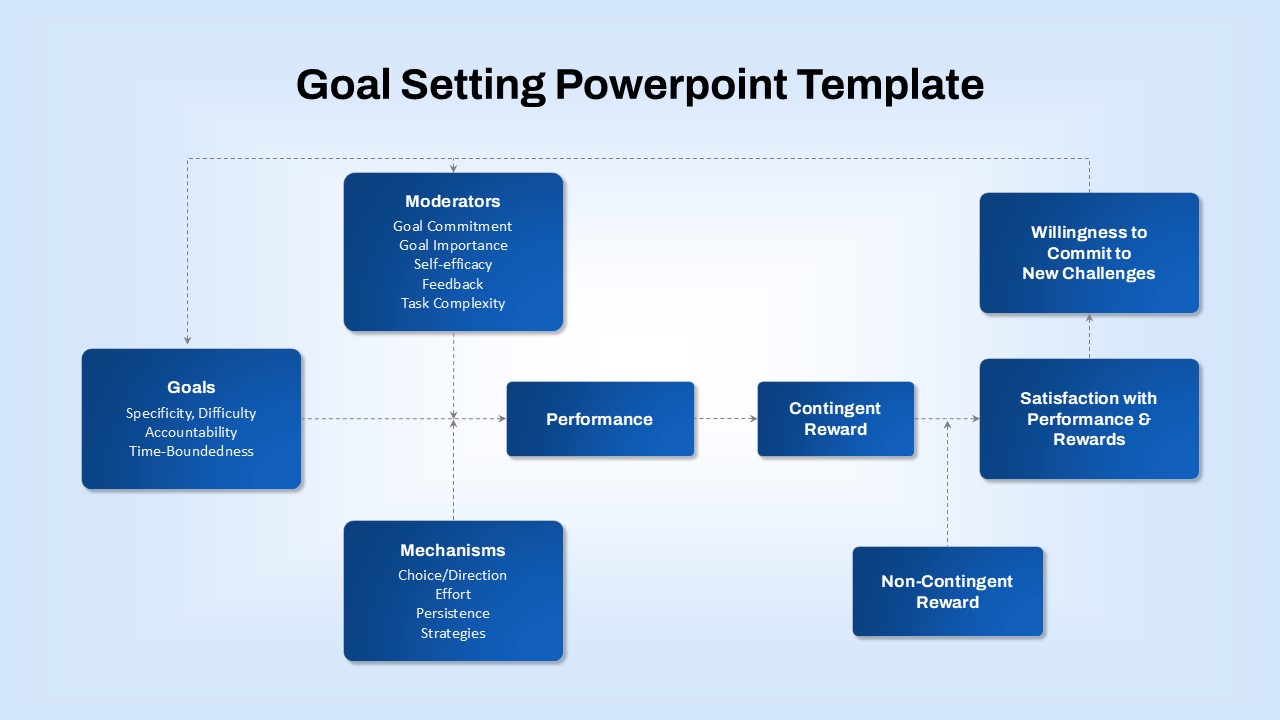
Goal-Setting Process Flow Diagram Template for PowerPoint & Google Slides
Goals
Semi-Supervised Learning Flow Diagram Template for PowerPoint & Google Slides
Machine Learning
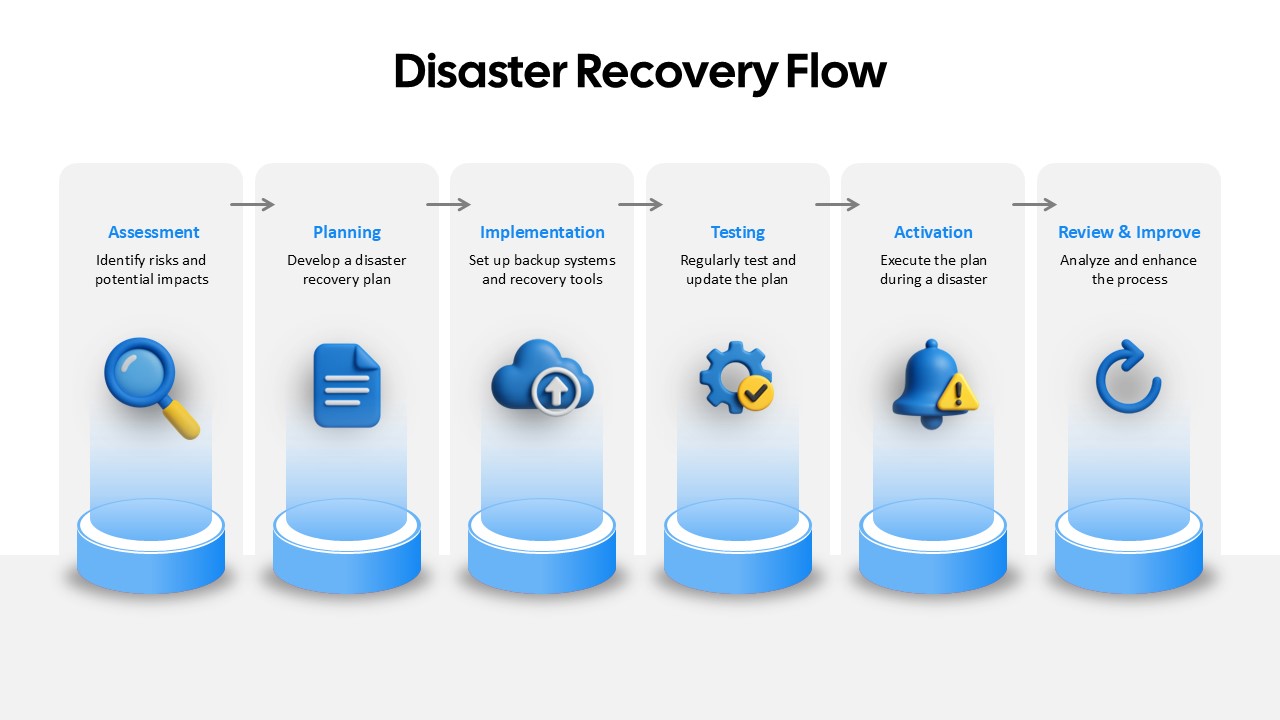
Disaster Recovery Flow Diagram Template for PowerPoint & Google Slides
Process
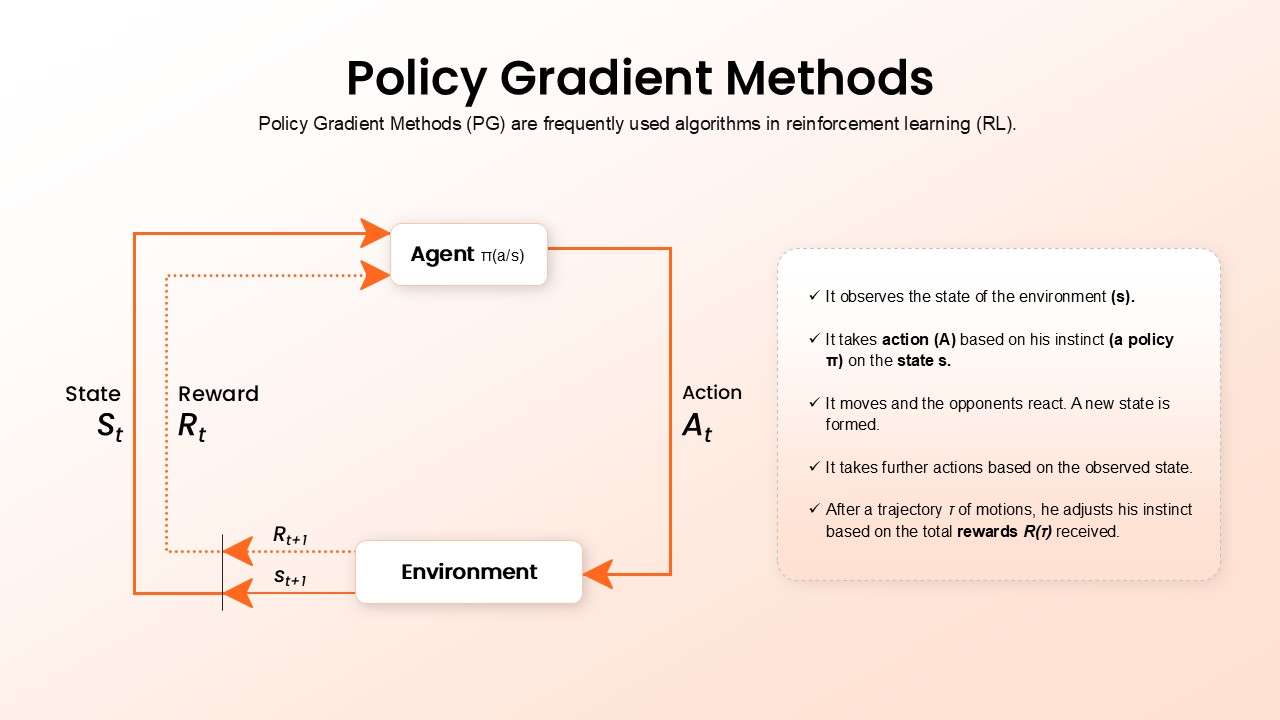
Policy Gradient Methods Flow Diagram Template for PowerPoint & Google Slides
AI
Resume Screening Process Flow Diagram Template for PowerPoint & Google Slides
Process
Q-Learning Process Flow Diagram Template for PowerPoint & Google Slides
Process
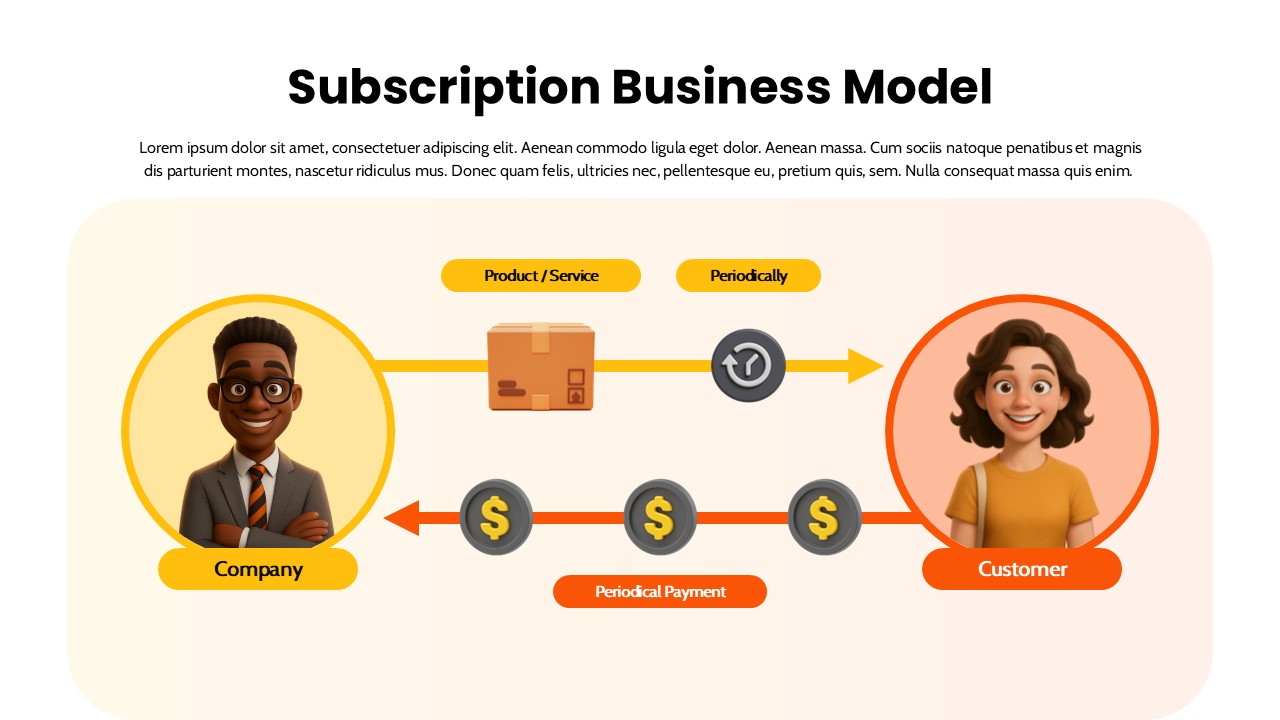
Subscription Business Model Flow Diagram Template for PowerPoint & Google Slides
Business Models
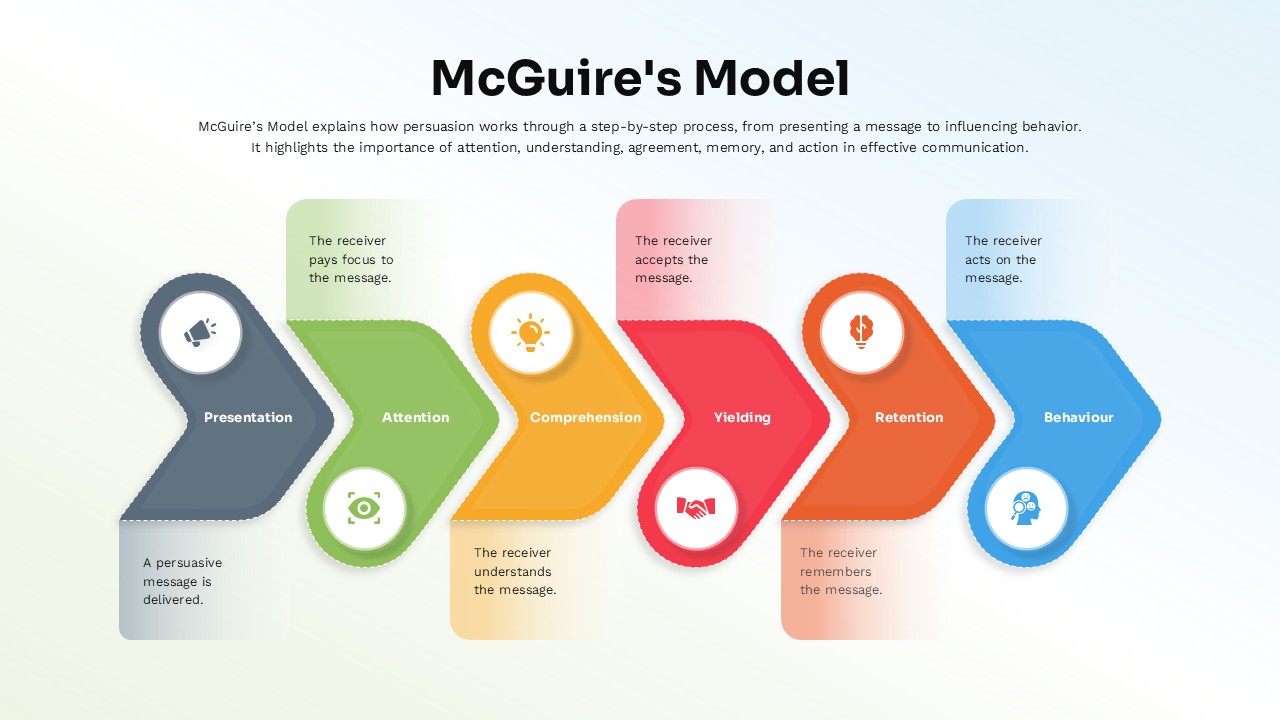
McGuire’s Persuasion Process Flow Diagram Template for PowerPoint & Google Slides
Marketing
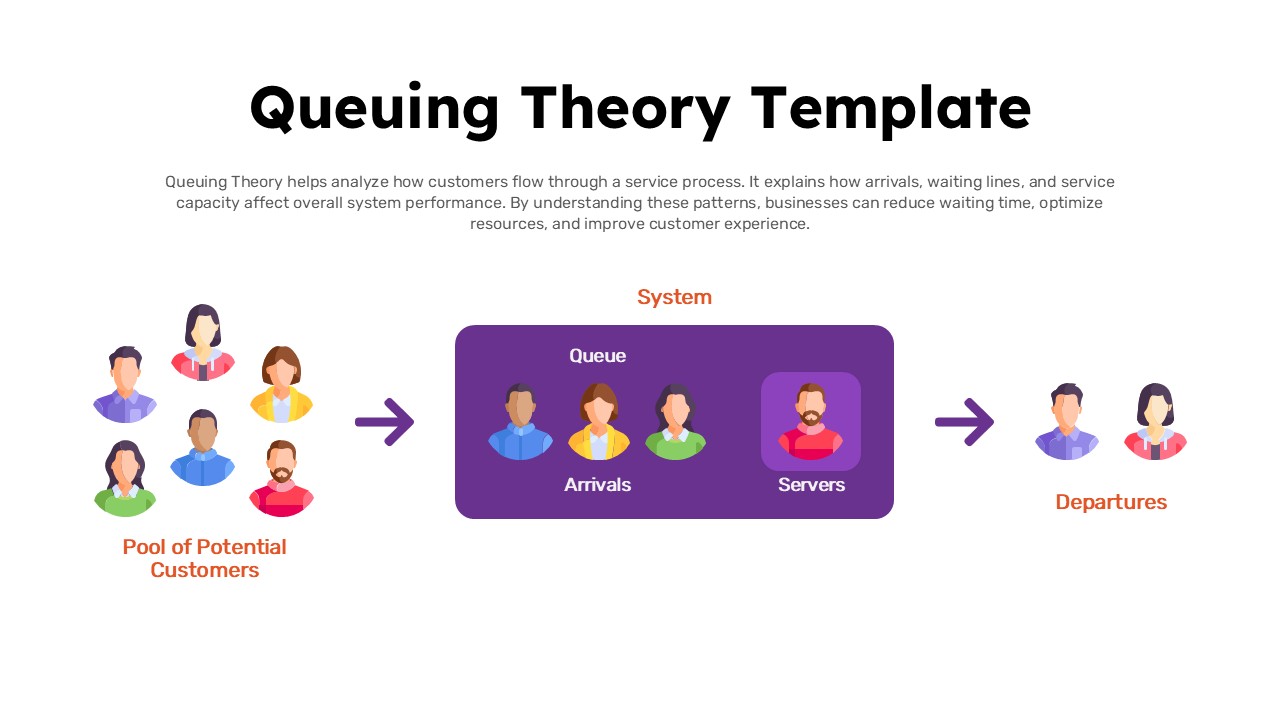
Queuing Theory System Flow Diagram Template for PowerPoint & Google Slides
Process
Product Design Process Flow Diagram Template for PowerPoint & Google Slides
Process