Facebook User Split template for PowerPoint & Google Slides


Description
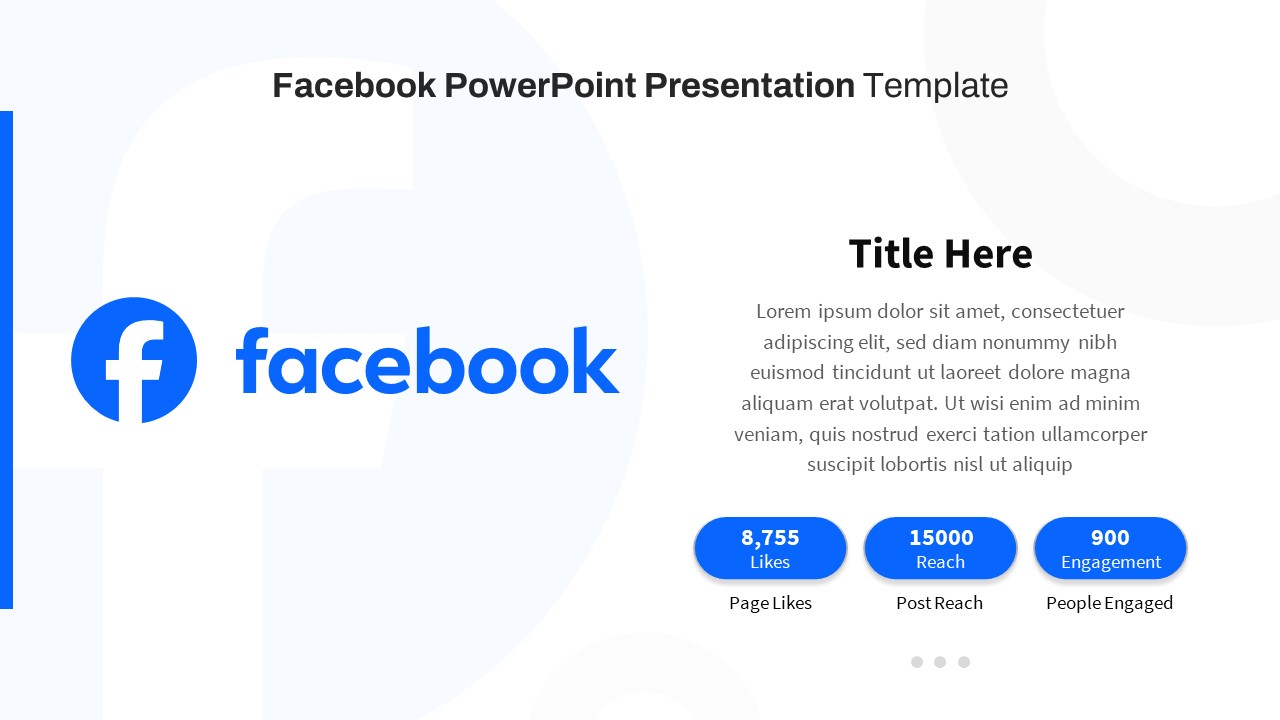
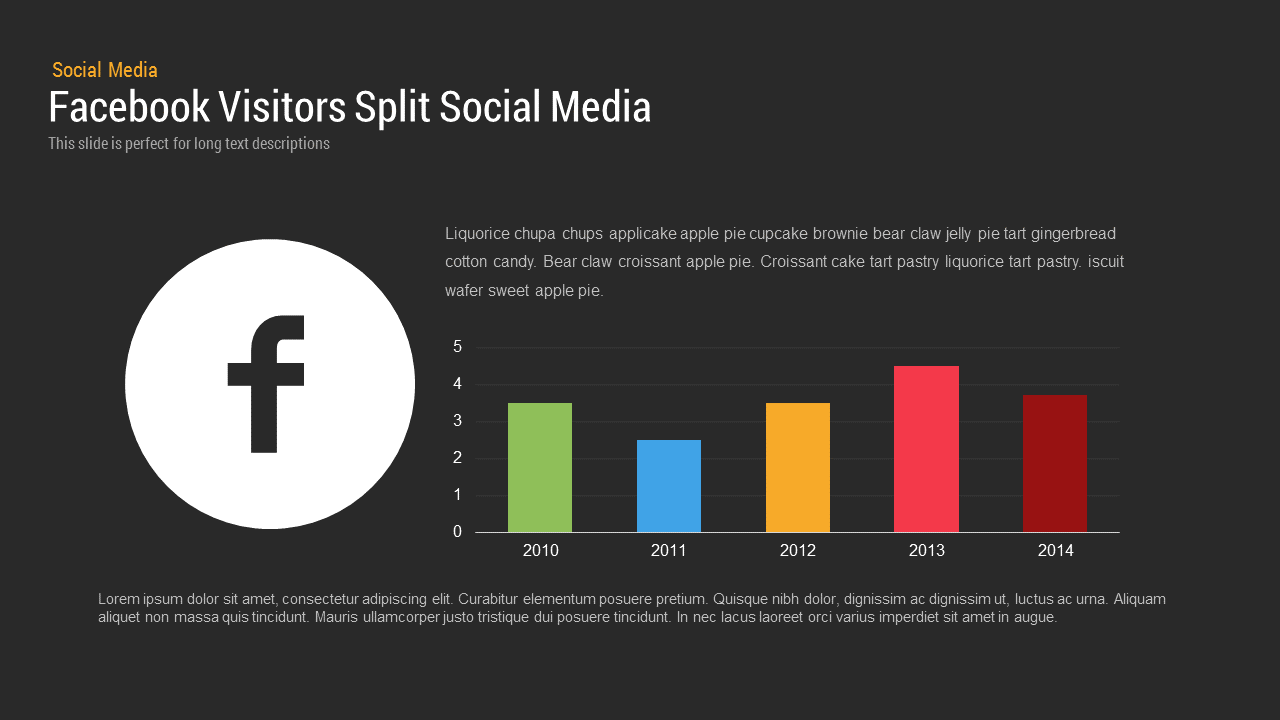
This Facebook User Split template features a pristine white background anchored by a prominent vector Facebook icon in a circular field on the left, perfect for brand-centric presentations. On the right, a multi-colored bar chart displays annual visitor metrics from 2010 through 2014, with each bar rendered in a distinct accent hue—green, blue, yellow, red, and maroon—for immediate visual differentiation. Above the chart, a headline placeholder and subtitle area enable concise context-setting, while a lower text block accommodates detailed commentary or data interpretation. Built on master slides, all elements support global edits to theme colors, typography via free Google Fonts, and vector icon swaps. The chart is fully editable within PowerPoint or Google Slides, allowing instant data updates or replacement with line, area, or pie visuals. Subtle gridlines and axes maintain clarity without clutter, and drop shadows beneath the icon and chart region add depth. The layout is optimized for both 16:9 widescreen and 4:3 formats, ensuring crisp legibility on HD projectors and virtual meeting platforms. Drag-and-drop placeholders simplify the insertion of screenshots or custom graphics, while consistent alignment and generous white space preserve a professional aesthetic. A hidden variation slide offers alternate color schemes and layout tweaks, streamlining brand alignment. Whether you’re reporting social media analytics, year-over-year comparisons, or marketing campaign performance, this template accelerates slide creation with a clean, data-driven design.
Who is it for
Social media managers, digital marketers, data analysts, and brand strategists will find this slide invaluable for presenting audience metrics. Consultants, corporate communicators, and agency teams can leverage it for client reports, stakeholder briefings, or quarterly business reviews.
Other Uses
Repurpose this layout to compare sales figures, campaign ROI, website traffic sources, or financial KPIs across multiple years. Swap the Facebook icon for other logos to illustrate channel performance, product adoption, or regional growth.
Login to download this file

Item ID
SB00055
Related Templates

Facebook Social Metrics Infographic Template for PowerPoint & Google Slides
Graphics
Free Facebook Page Analytics Slide for PowerPoint & Google Slides
Customer Experience
Free
Donut Split Analysis template for PowerPoint & Google Slides
Pie/Donut
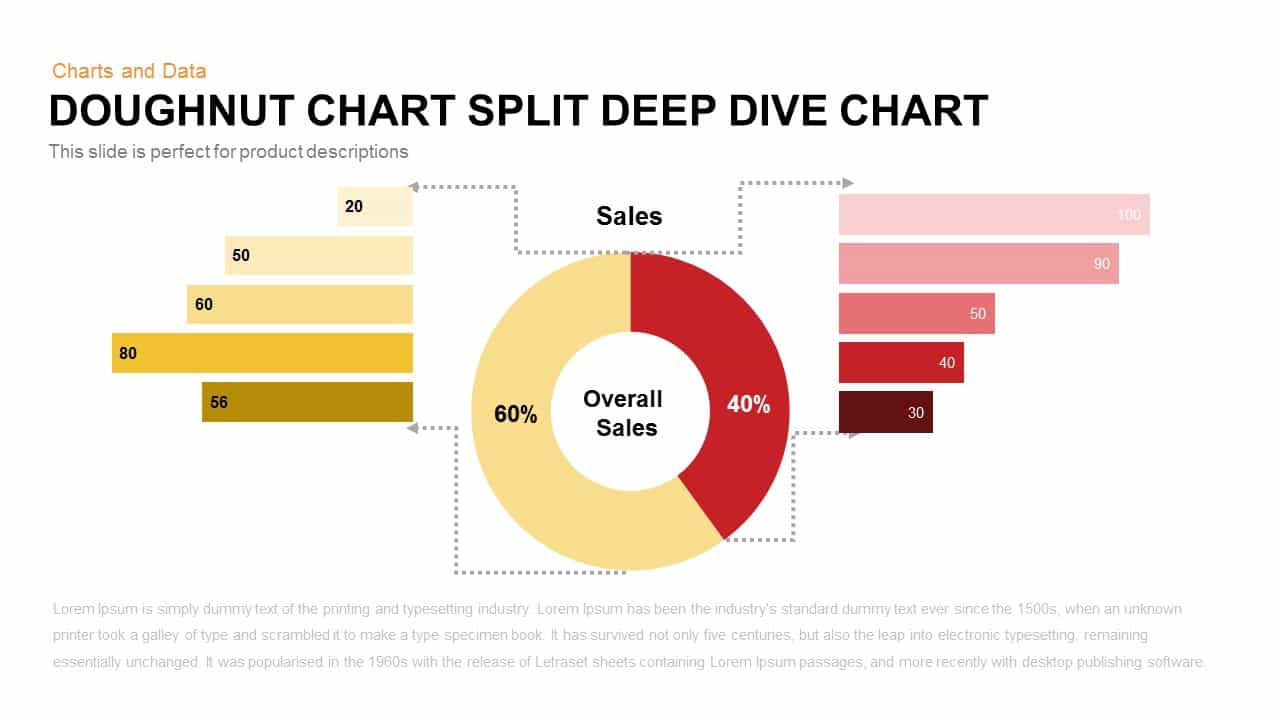
Donut Chart Split Template for PowerPoint & Google Slides
Charts
Split Doughnut Deep Dive Sales Analysis Template for PowerPoint & Google Slides
Pie/Donut
Multi-Segment Circle Split Diagram template for PowerPoint & Google Slides
Circular

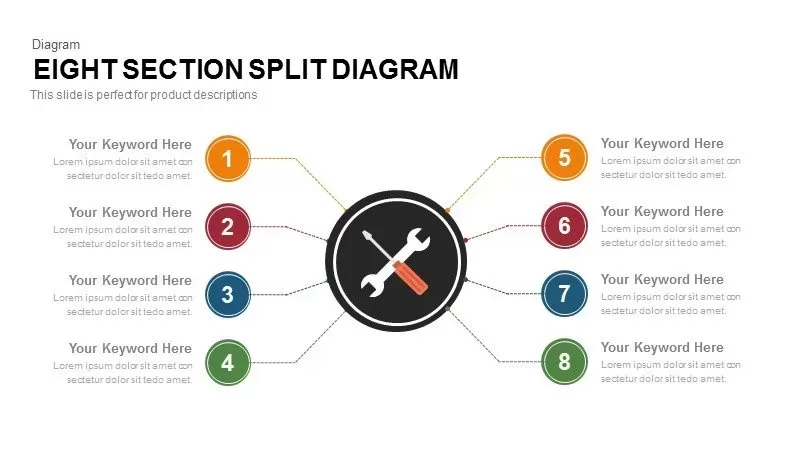
8-Section Split Diagram with Hub Icon template for PowerPoint & Google Slides
Circular
Vertical Split Flow Chart Diagram Template for PowerPoint & Google Slides
Flow Charts
Capital Structure Dynamic Split Chart Template for PowerPoint & Google Slides
Comparison Chart
About Us Split Photo Template for PowerPoint & Google Slides
Marketing
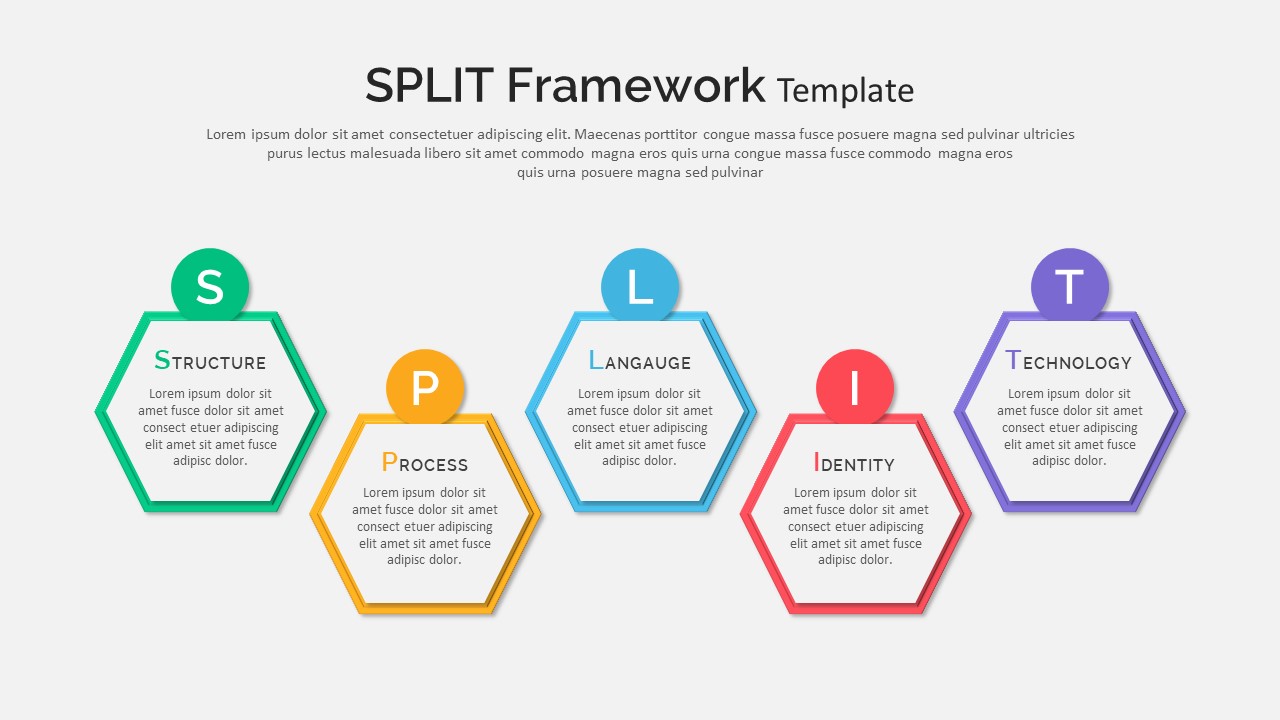
Split Framework Hexagon Diagram Slide Template for PowerPoint & Google Slides
Process

Smartphone Data User template for PowerPoint & Google Slides
Charts

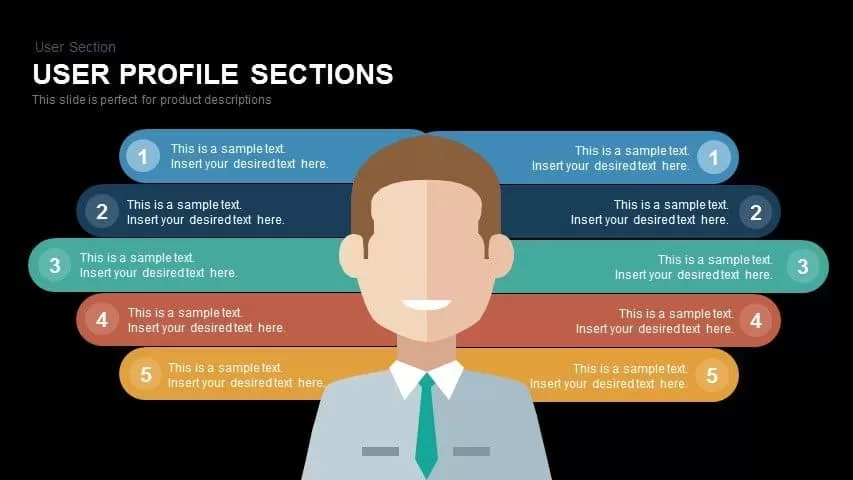
User Profile Hub-and-Spoke Diagram Template for PowerPoint & Google Slides
Our Team
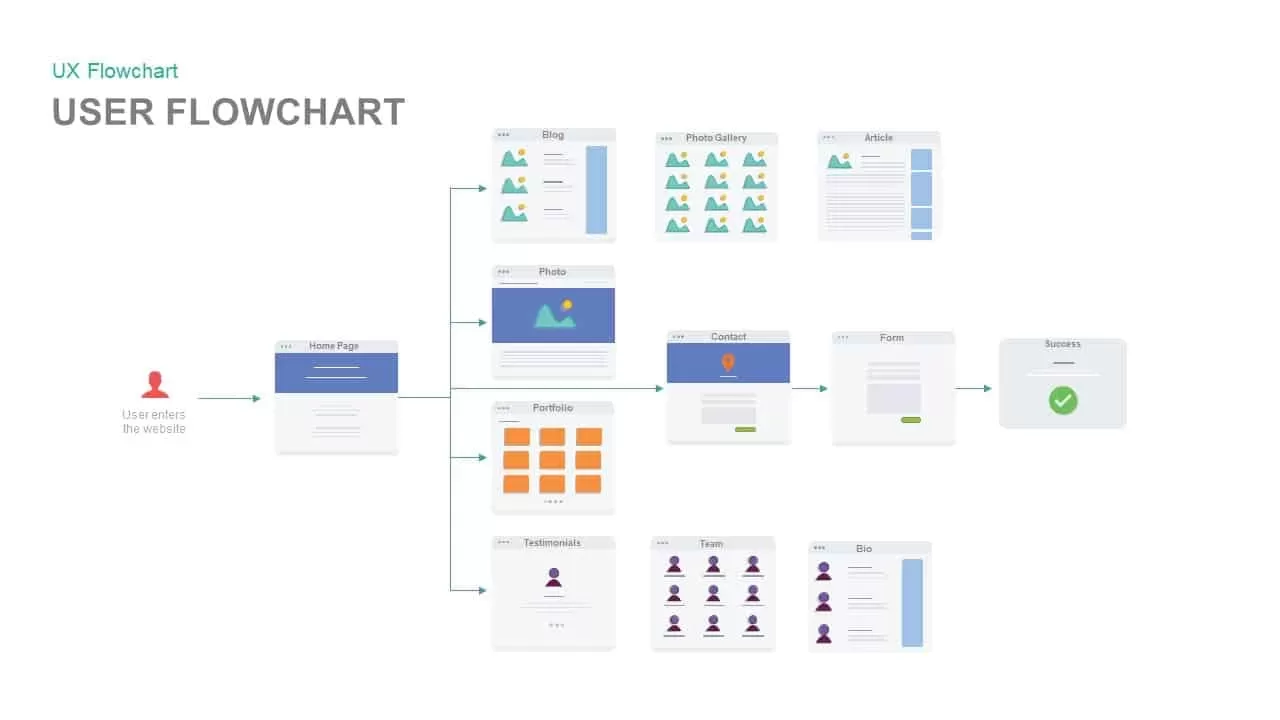
Website User Flowchart Diagram Template for PowerPoint & Google Slides
Process

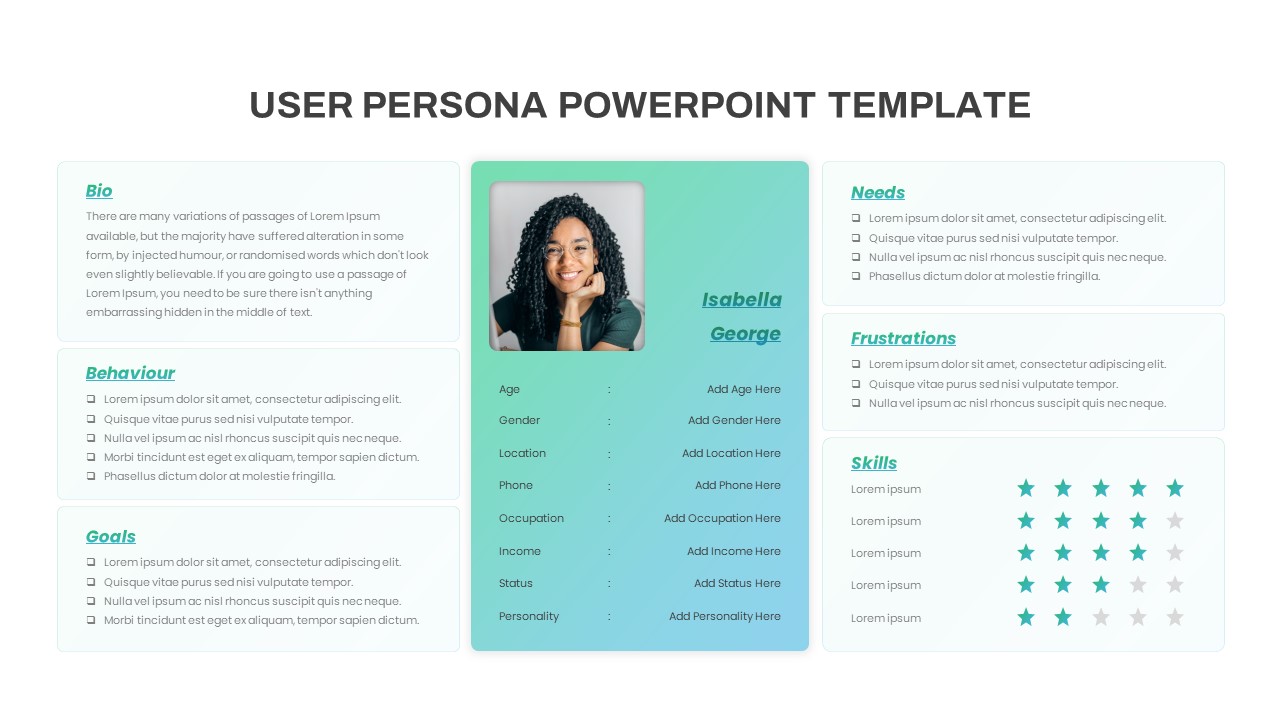
User Persona template for PowerPoint & Google Slides
Company Profile
User Persona template for PowerPoint & Google Slides
Customer Journey
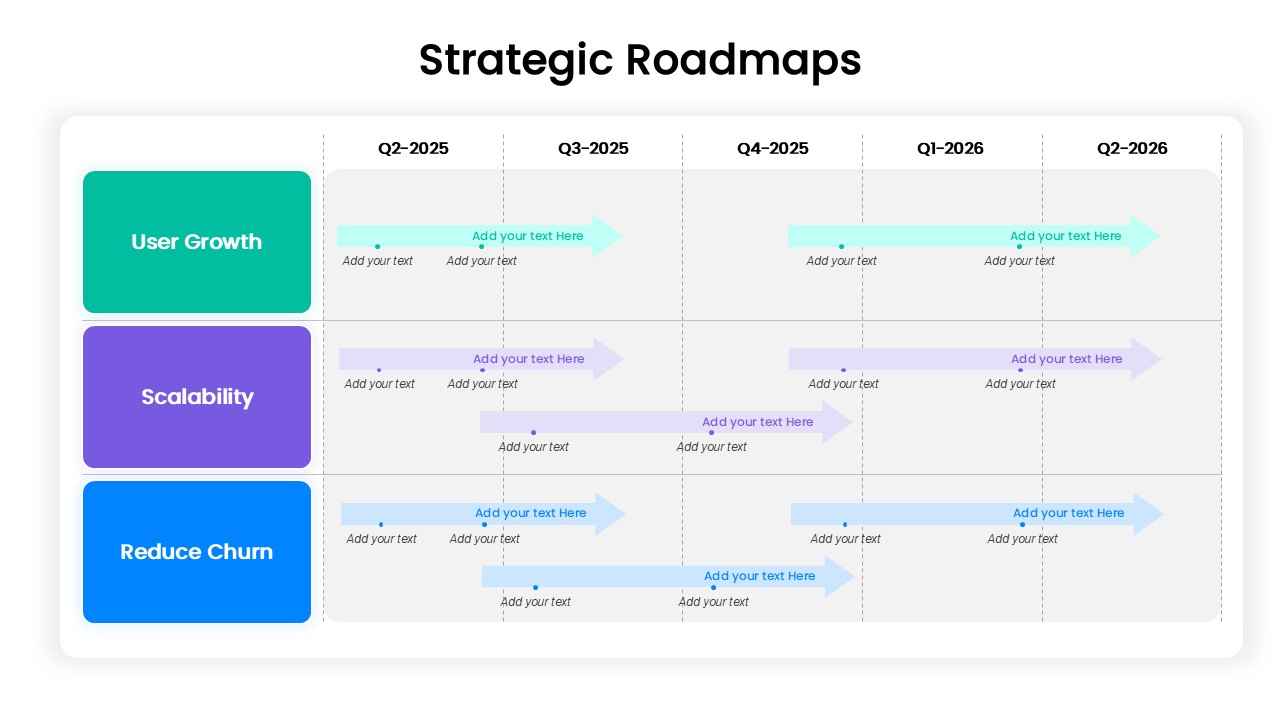
Strategic Roadmap for User Growth, Scalability, and Reducing Churn template for PowerPoint & Google Slides
Business
Mobile User Data Analysis Infographic for PowerPoint & Google Slides
Process
Free Gradient User Persona Profile Slide for PowerPoint & Google Slides
Recruitment
Free
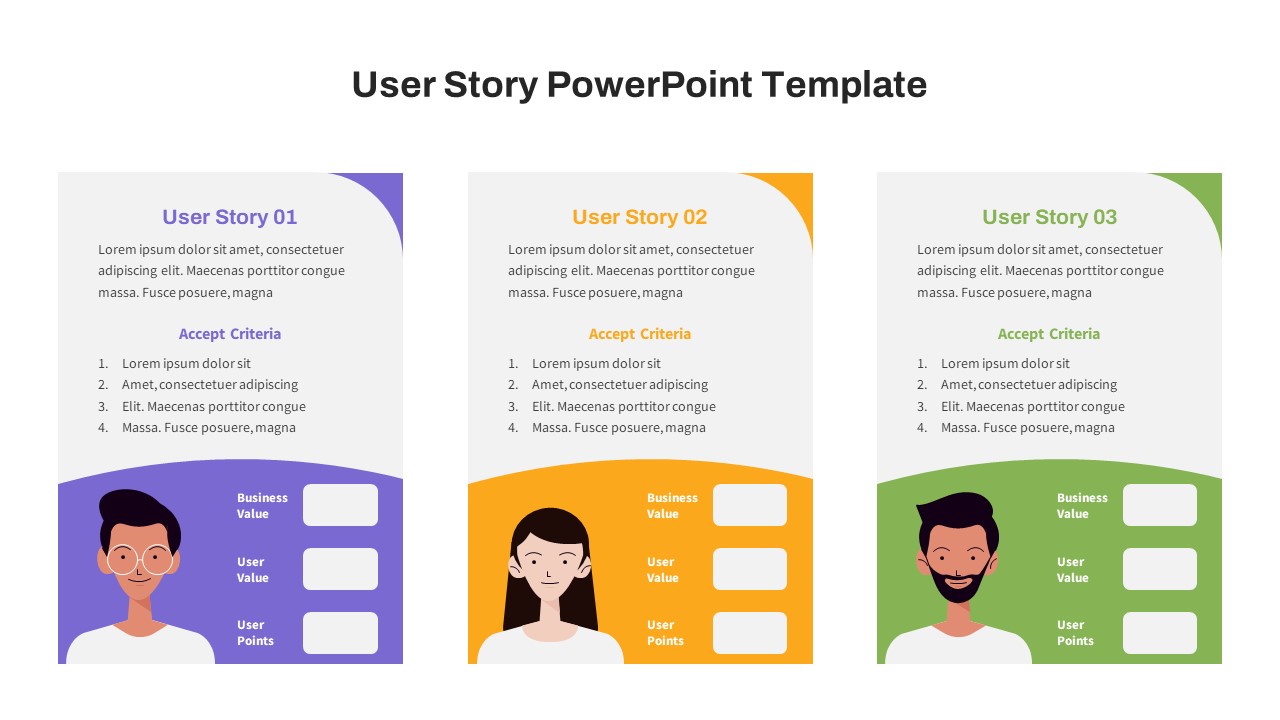
Free Agile User Story Card Slide for PowerPoint & Google Slides
Infographics
Free
4 Step Process PowerPoint & Google Slides Template for PowerPoint & Google Slides
Process