Disruptive Innovation Framework Diagram Template for PowerPoint & Google Slides
Description
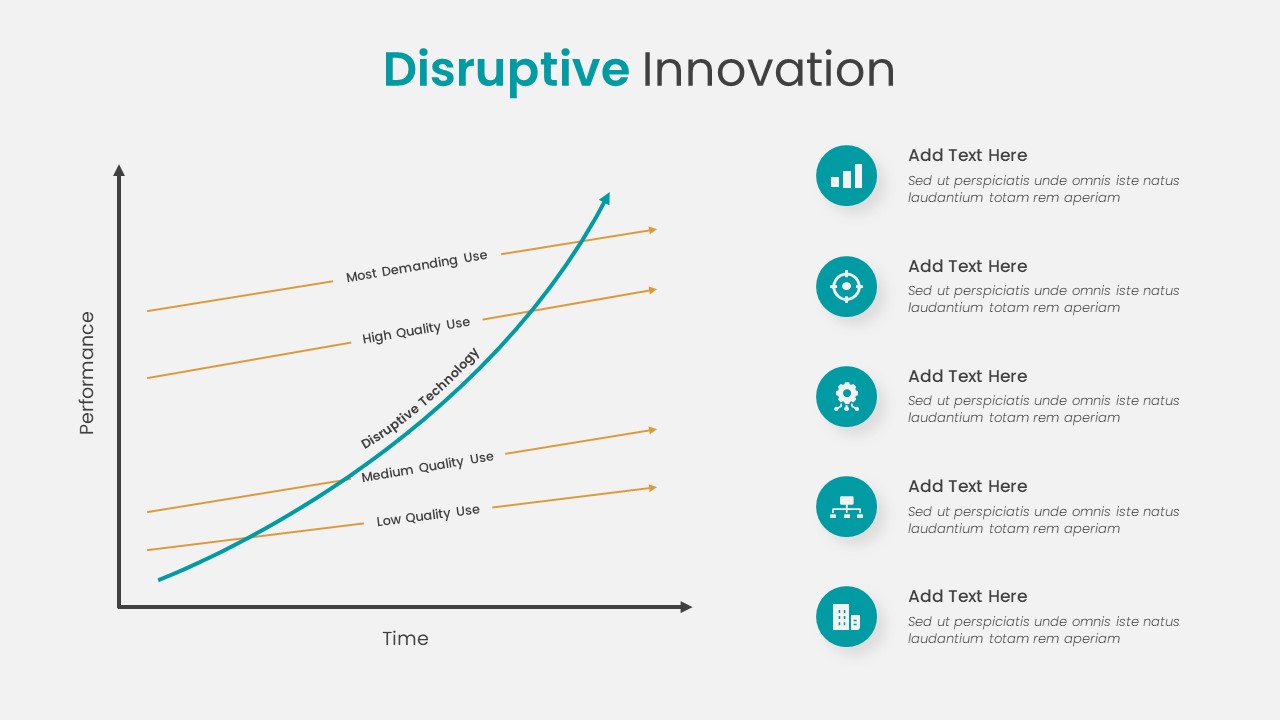
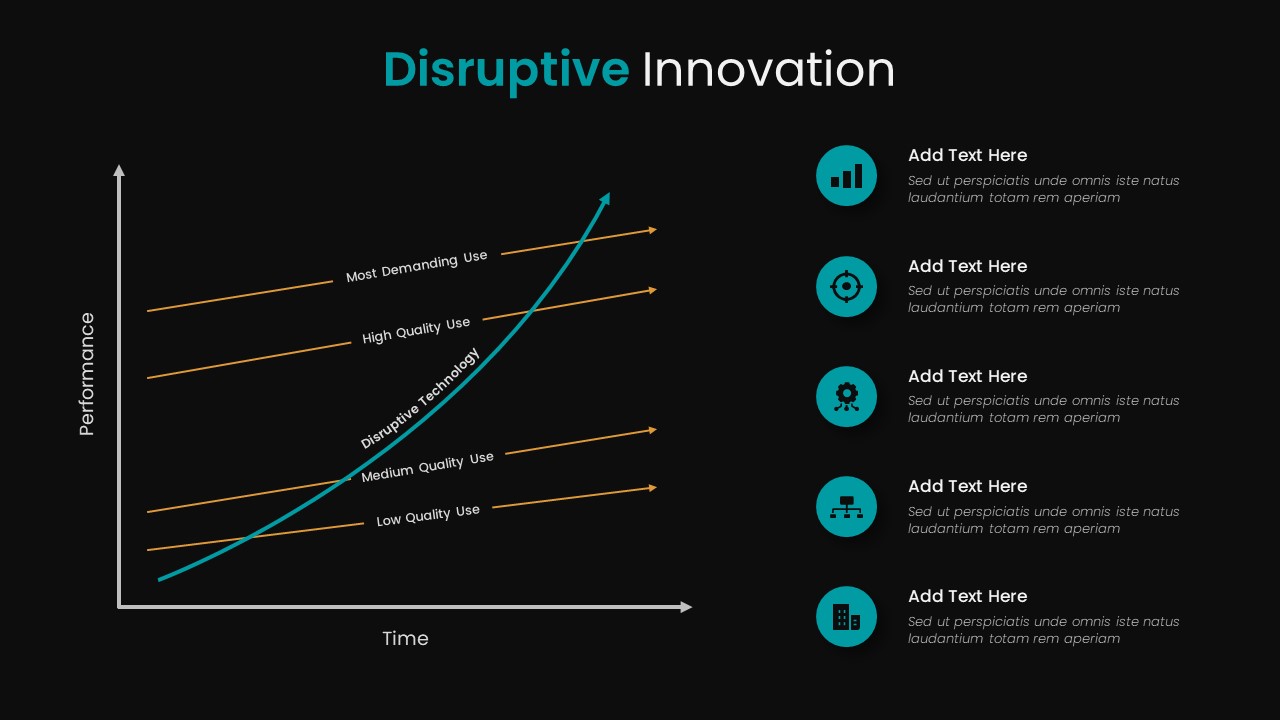
Leverage this dynamic disruptive innovation chart to illustrate how emerging technologies evolve relative to existing market requirements over time. The slide features a two-axis graph plotting Performance on the vertical axis and Time on the horizontal axis. The teal curve, labeled “Disruptive Technology,” represents a new entrant’s rapid performance improvement, while four parallel orange trend lines—Low Quality Use, Medium Quality Use, High Quality Use, and Most Demanding Use—depict incumbent technologies meeting various market segment needs. Each trend line is clearly annotated to guide viewers through the classic disruption model.
On the right, five customizable icon panels allow you to highlight key insights, drivers, or strategic recommendations. Each panel consists of a circular teal icon—such as a bar chart, target, gear, network, or building—paired with a concise headline and descriptive text placeholder. Use these panels to call out adoption milestones, competitive challenges, investment priorities, or organizational implications.
This editable master slide is optimized for both PowerPoint and Google Slides, ensuring consistent formatting, vector-based elements, and seamless collaboration. Adjust colors, line weights, or text labels through intuitive placeholders. Animate individual elements for progressive storytelling or simplify the layout for print-friendly reports. The neutral light-gray background and clean typography maintain a professional aesthetic that adapts to any brand palette.
Whether you’re presenting a board update, investor briefing, or strategy workshop, this disruptive innovation diagram clarifies complex technology adoption curves and market entry strategies. Its modular design also supports alternative use cases—swap the curve for revenue projections, repurpose lines for product roadmap timelines, or adapt icon panels to outline project phases. Scale or duplicate chart elements without loss of resolution, and leverage integrated icon libraries to enrich your messaging. With this slide, you can drive impactful discussions around innovation, competition, and growth trajectories.
Who is it for
Business strategists, product managers, and innovation teams seeking to explain technology adoption curves and market dynamics. Executives and investors will value the clear visualization during board meetings or pitch sessions. Consultants and educators can use it to teach disruption theory.
Other Uses
Repurpose the radial graph to compare revenue streams, map product roadmaps, or illustrate performance benchmarks. Use icon panels to showcase project milestones, key performance indicators, or risk factors in client presentations.
Login to download this file

Item ID
SB03411
Related Templates

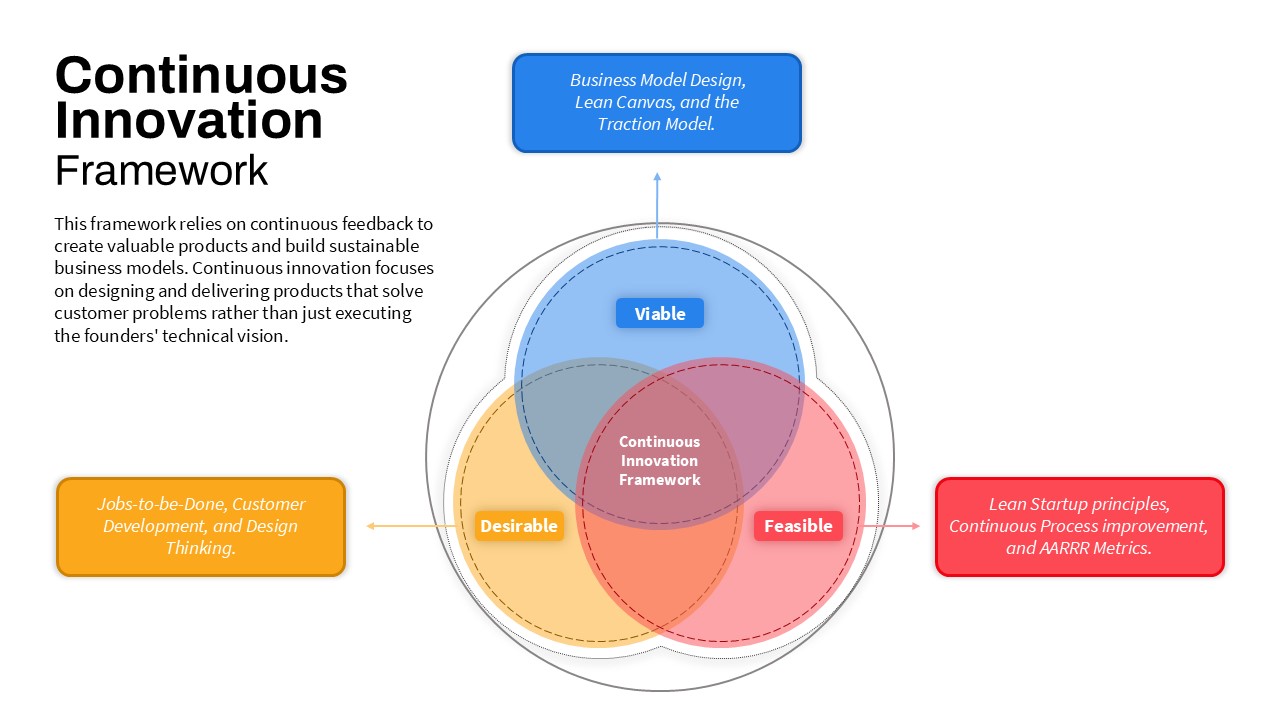
Continuous Innovation Framework Template for PowerPoint & Google Slides
Circular
Closed Innovation Model Funnel Diagram Template for PowerPoint & Google Slides
Funnel
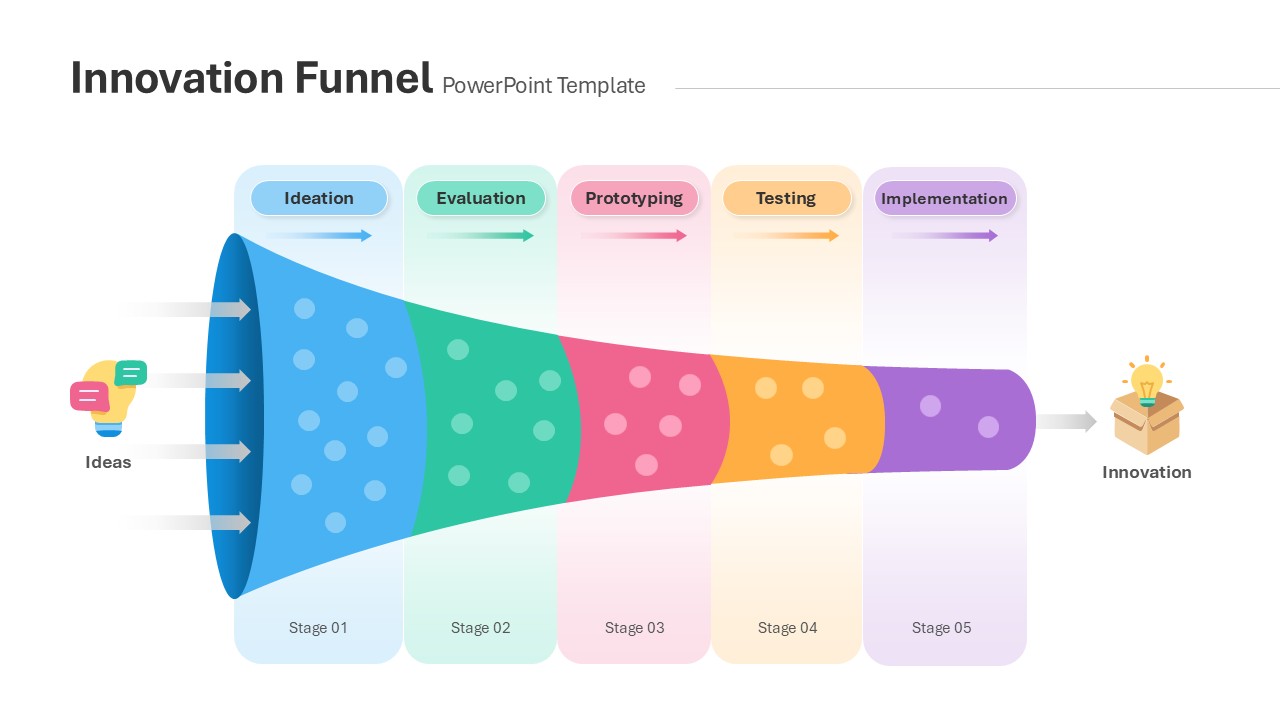
Innovation Funnel Process Diagram Template for PowerPoint & Google Slides
Funnel

Innovation Ambition Matrix & Funnel Strategy Slides for PowerPoint & Google Slides
Process
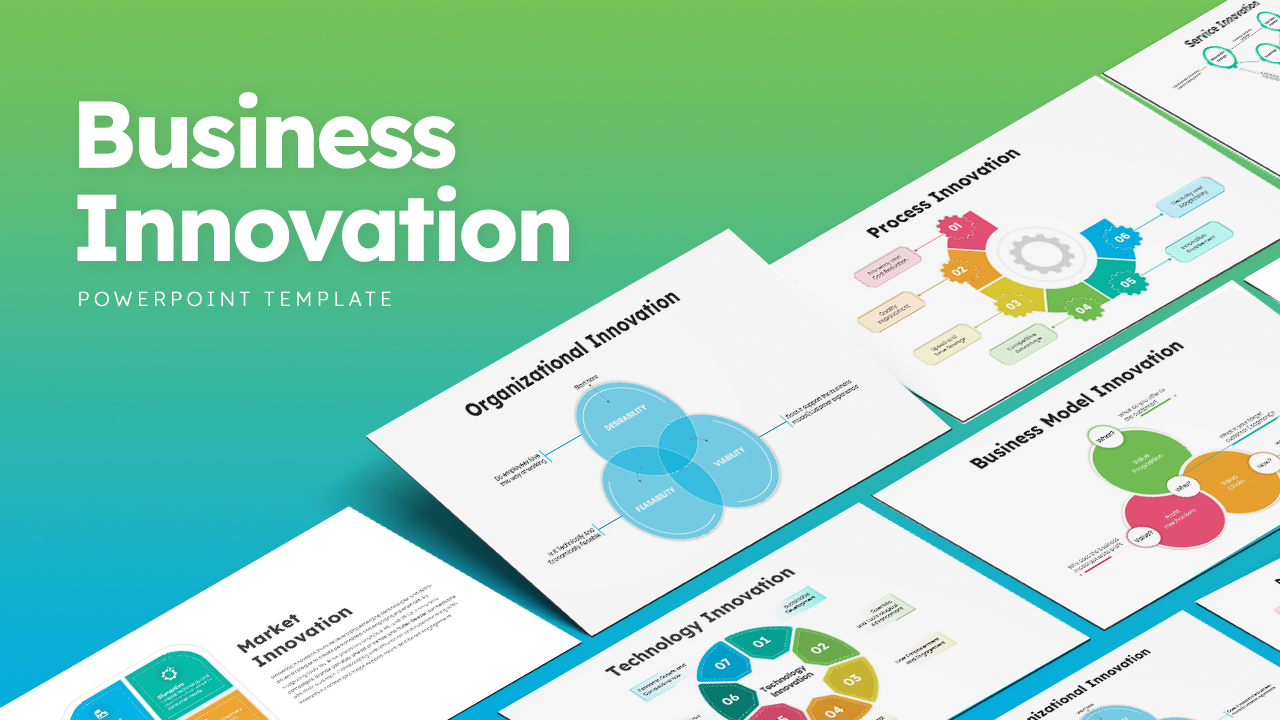
Business Innovation Infographics template for PowerPoint & Google Slides
Process
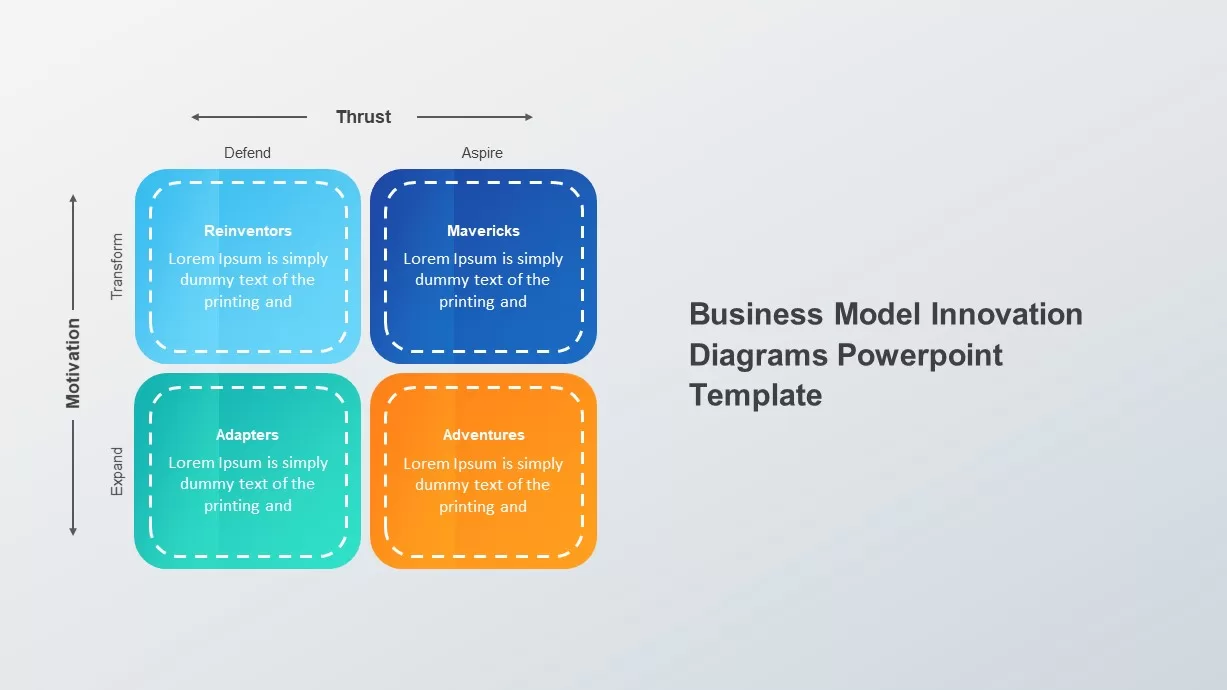
Business Model Innovation Diagrams template for PowerPoint & Google Slides
Process
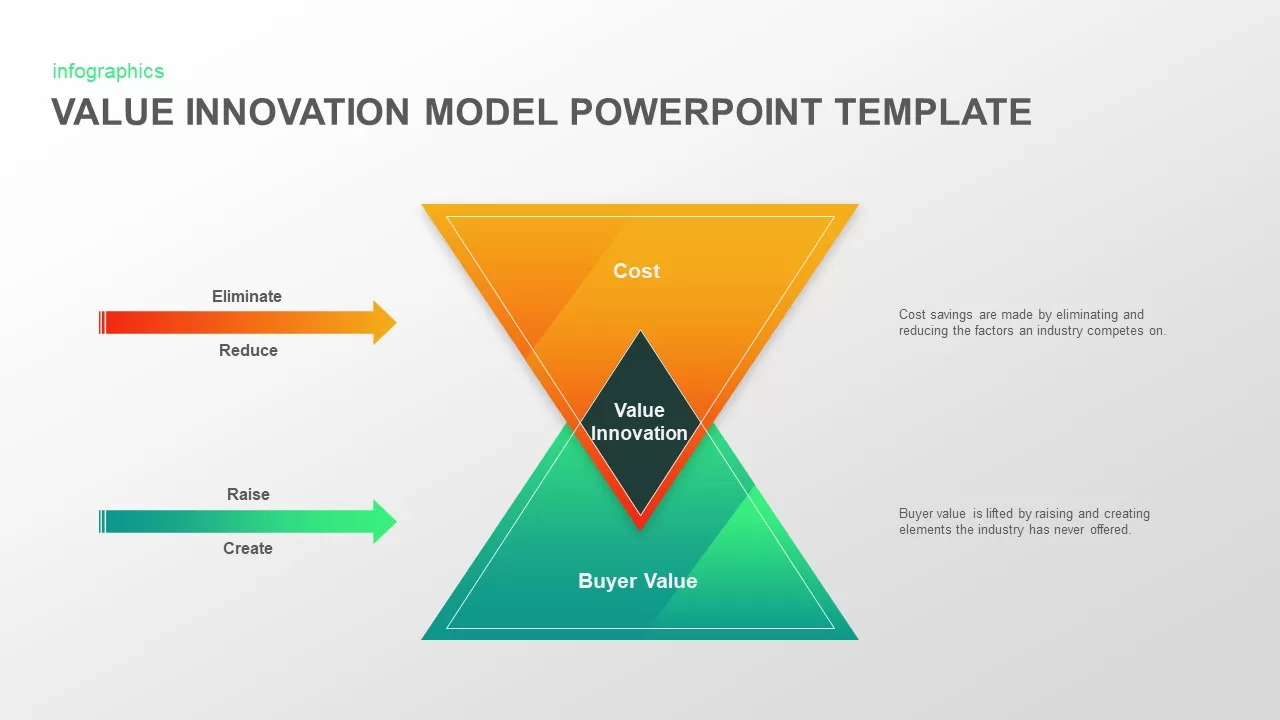
Value Innovation Model PowerPoint & Google Slides Template for Presentations
Business Proposal
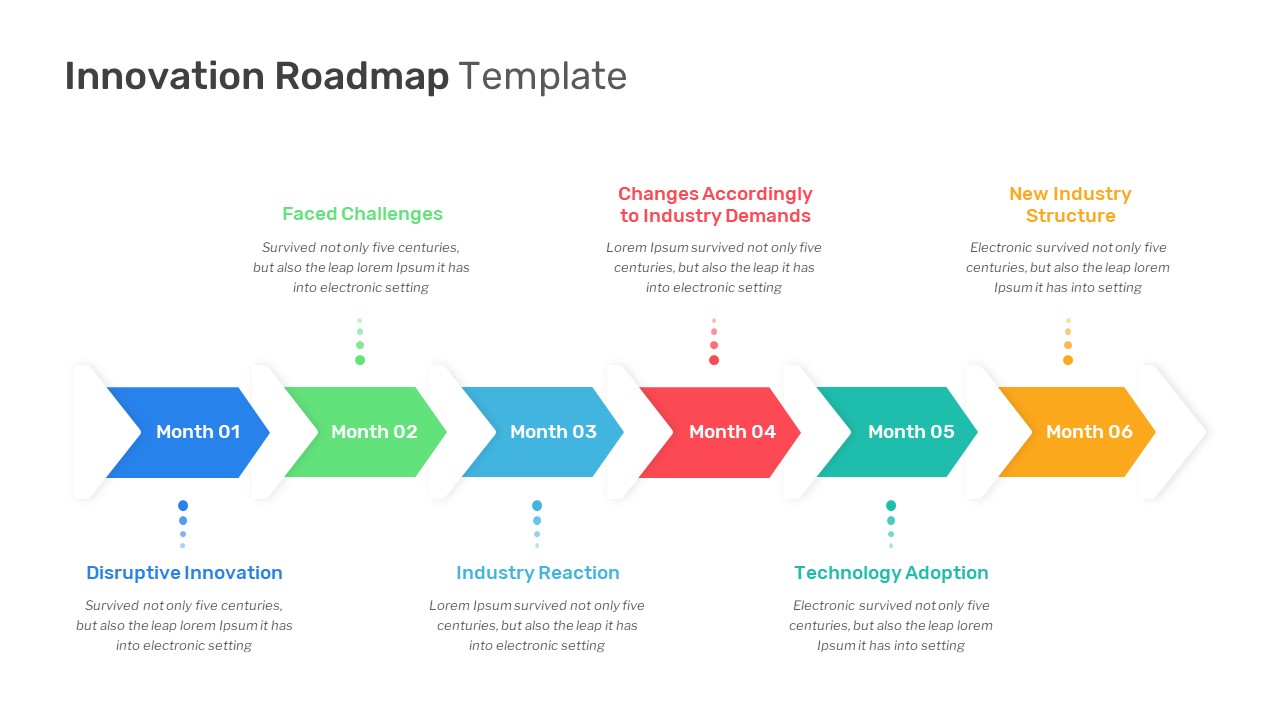
Six-Month Innovation Roadmap Timeline Template for PowerPoint & Google Slides
Roadmap
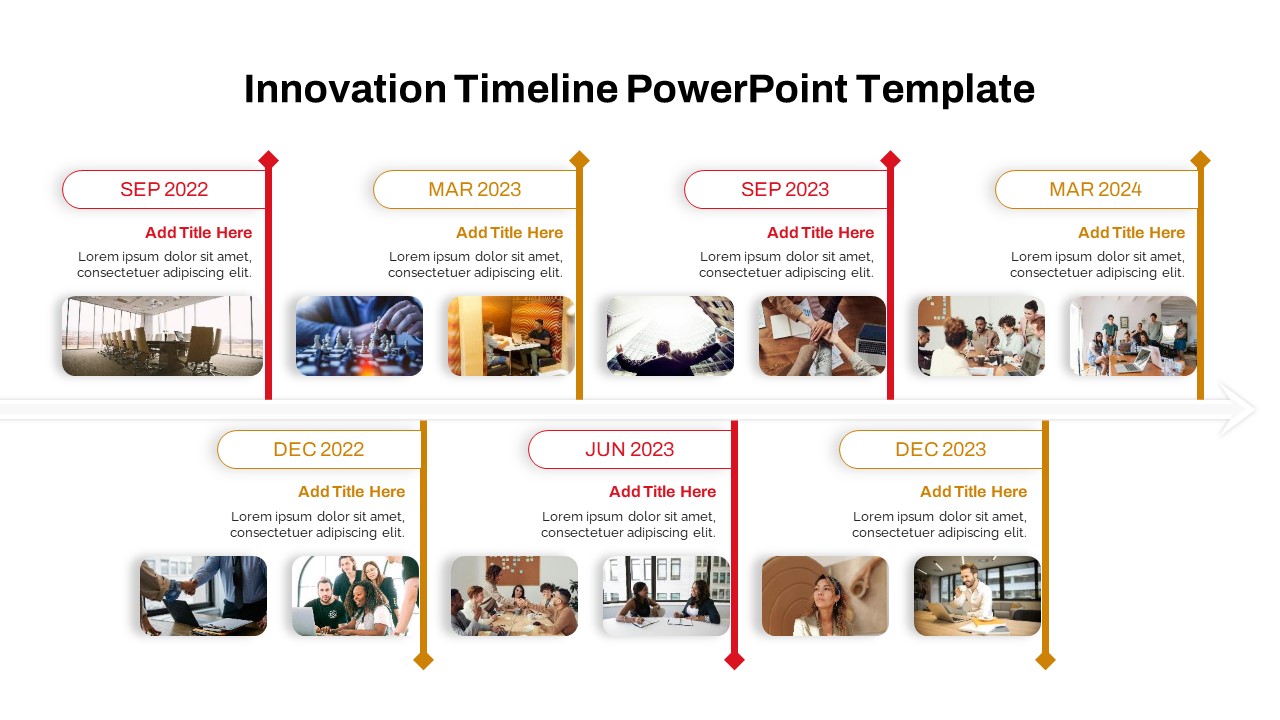
Interactive Innovation Timeline Roadmap Template for PowerPoint & Google Slides
Timeline
Business Innovation Models Deck Template for PowerPoint & Google Slides
Decks
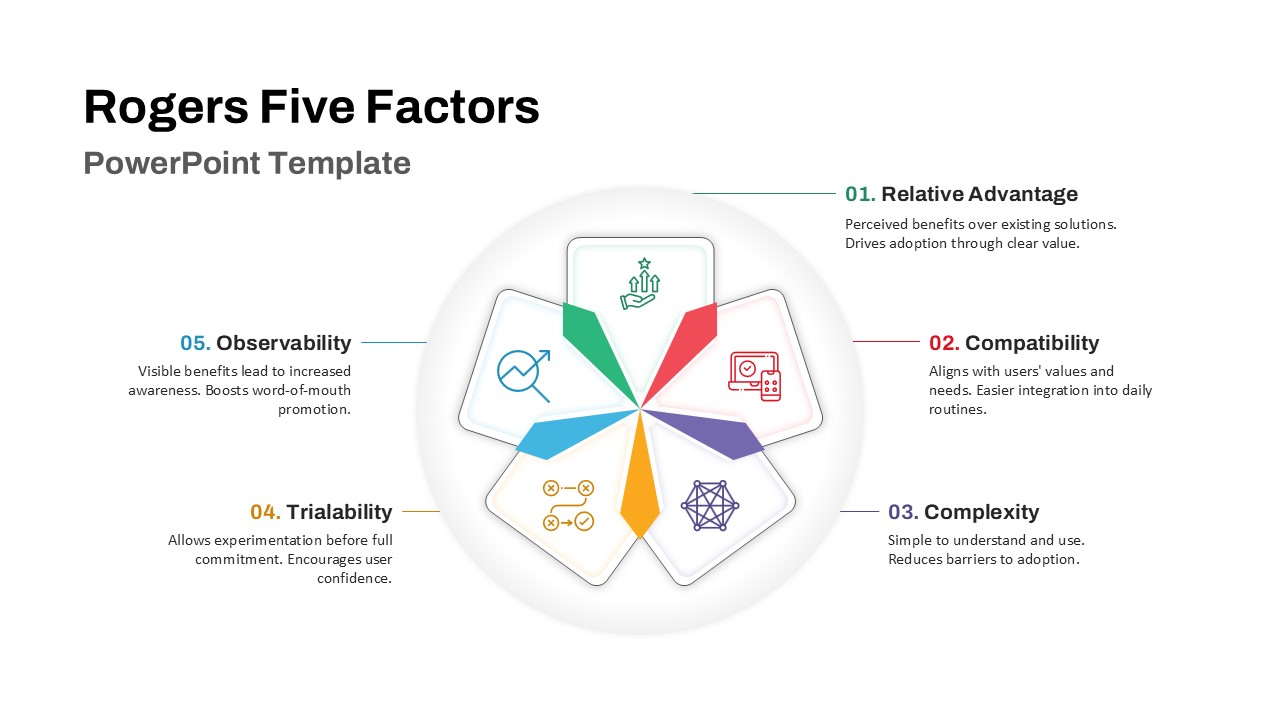
Rogers Five Factors Diffusion Innovation Template for PowerPoint & Google Slides
Process
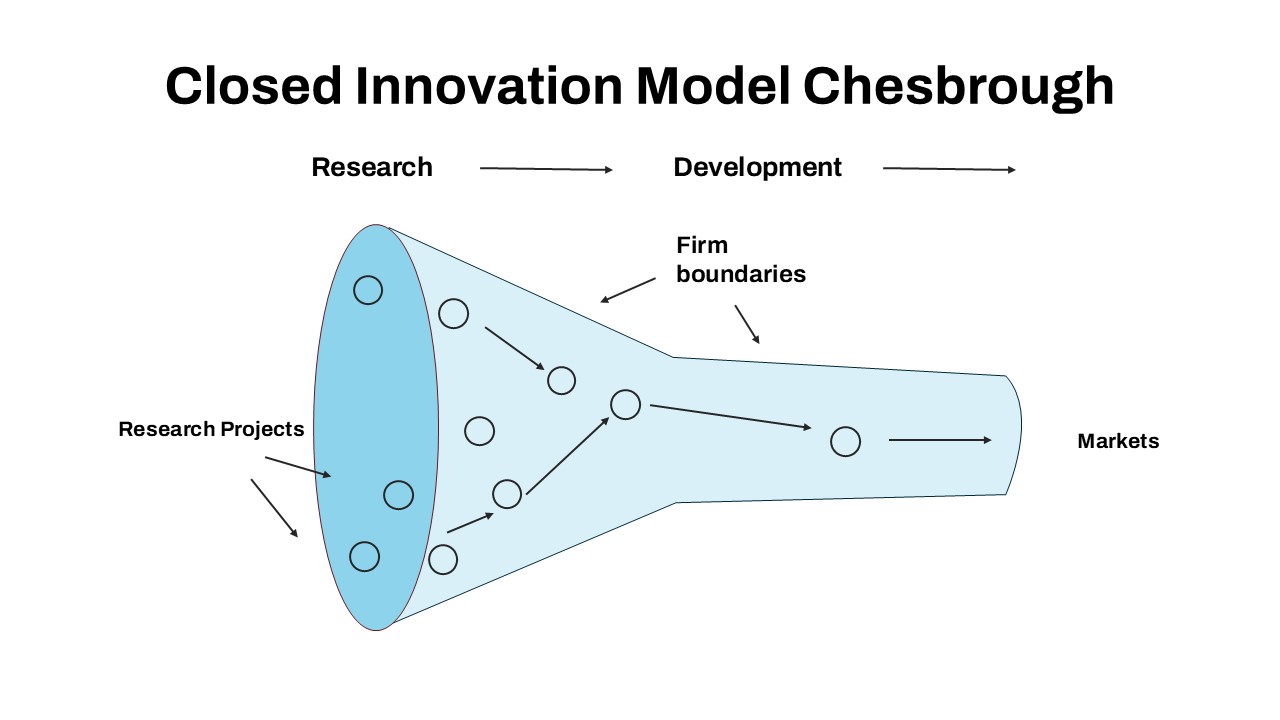
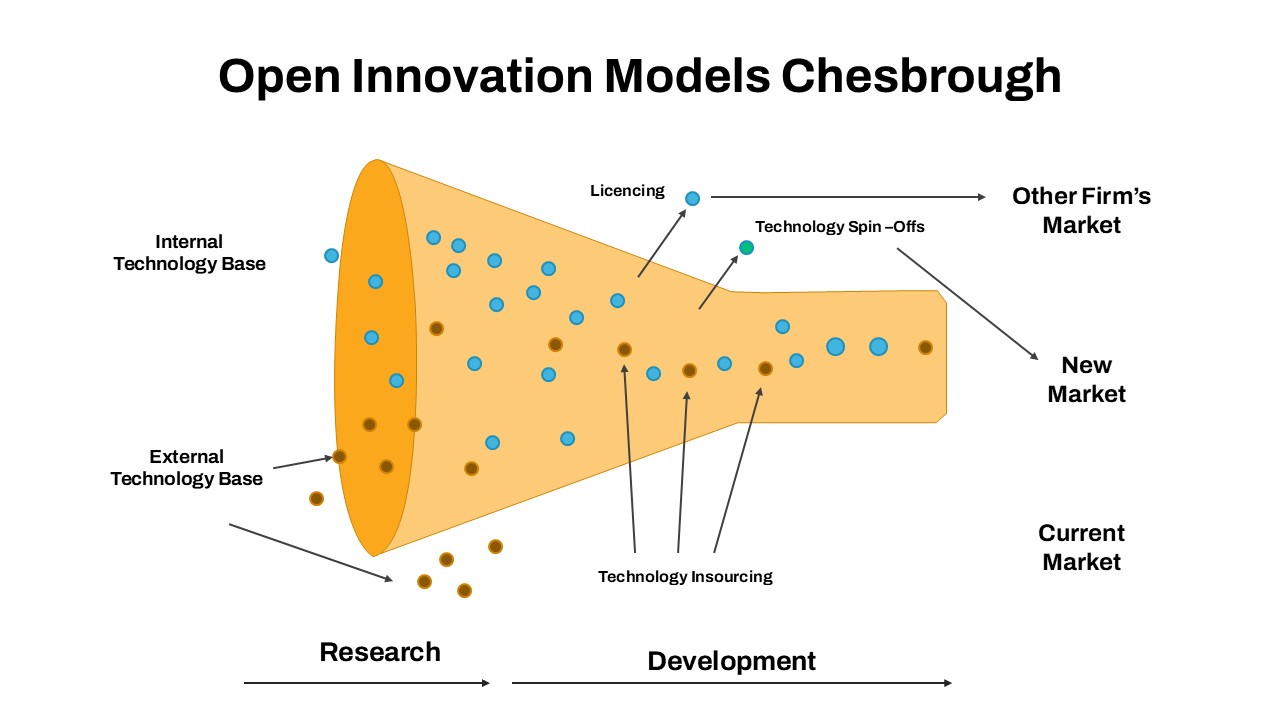
Open Innovation Models Chesbrough template for PowerPoint & Google Slides
Funnel
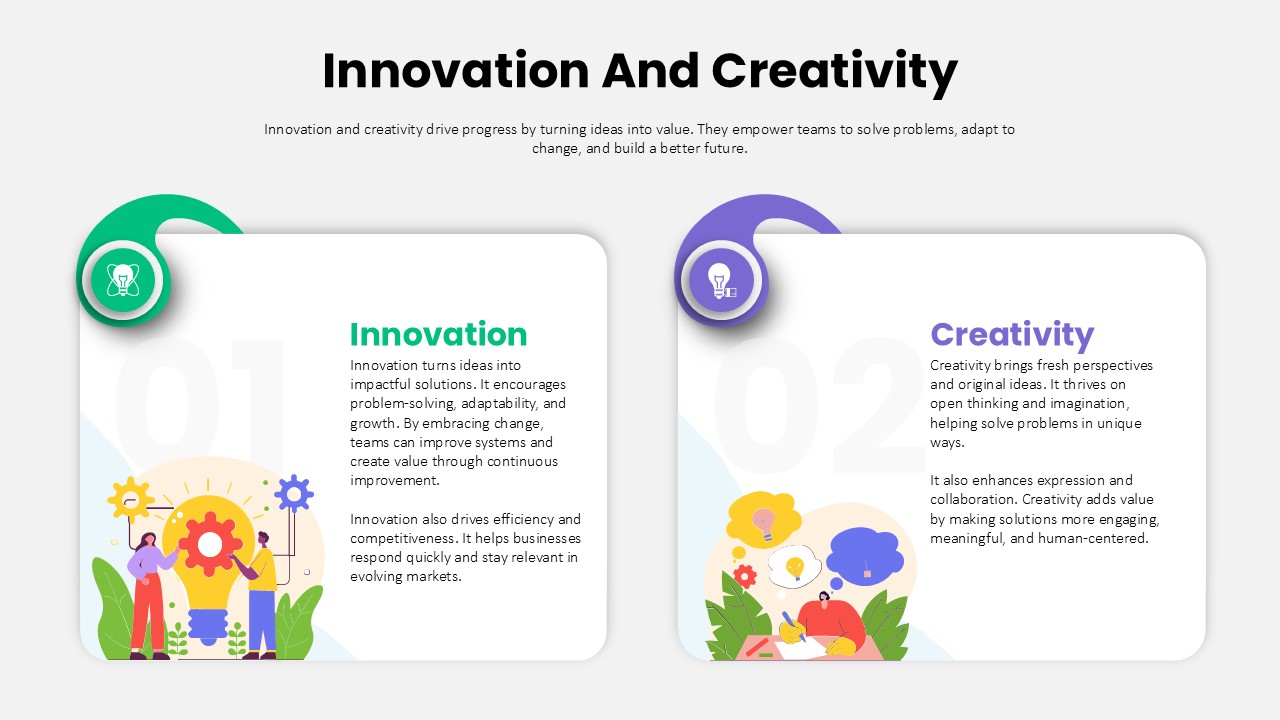
Innovation and Creativity Overview template for PowerPoint & Google Slides
Process
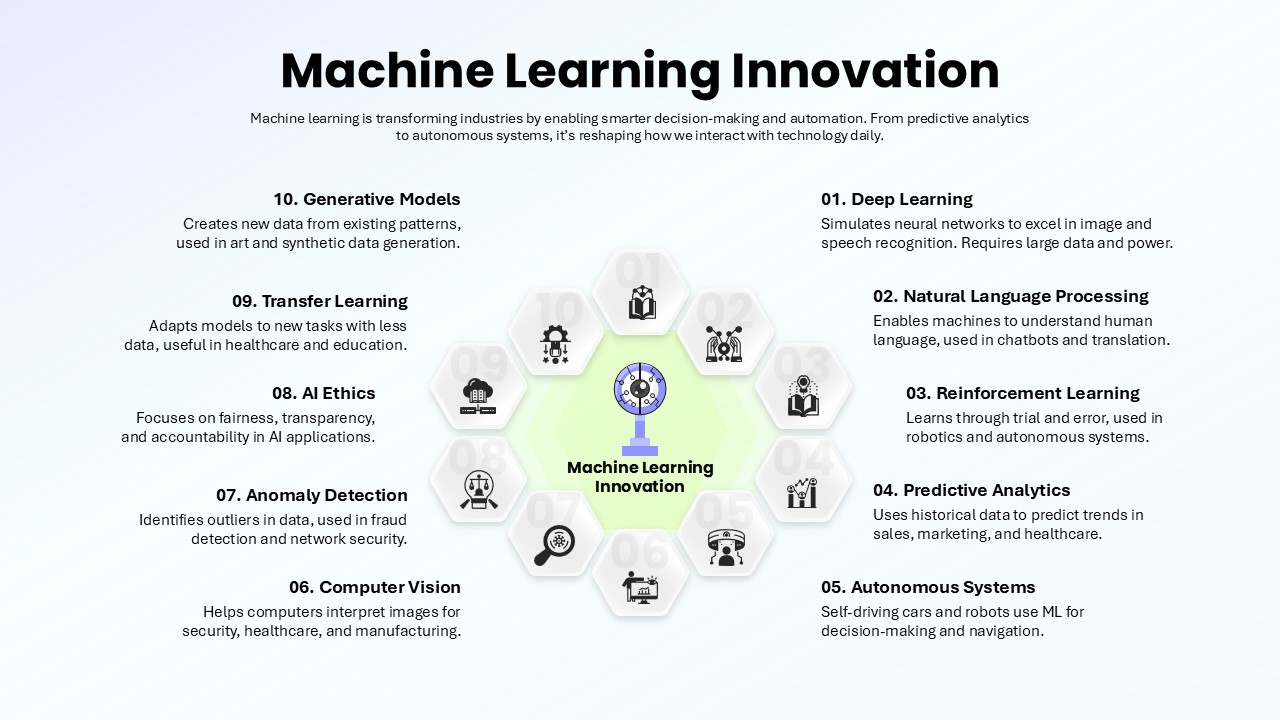
Machine Learning Innovation Overview template for PowerPoint & Google Slides
AI
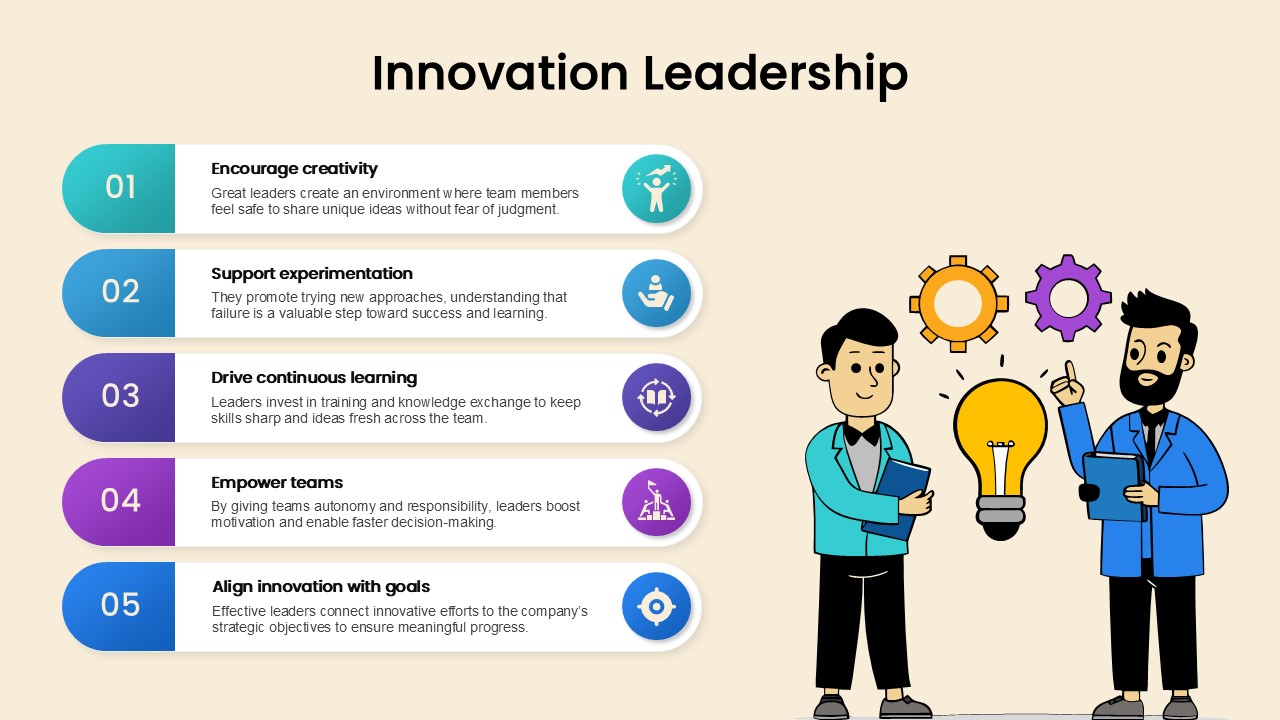
Innovation Leadership Five-Step List Template for PowerPoint & Google Slides
Leadership
Six-Staged Gear Diagram Framework Template for PowerPoint & Google Slides
Process
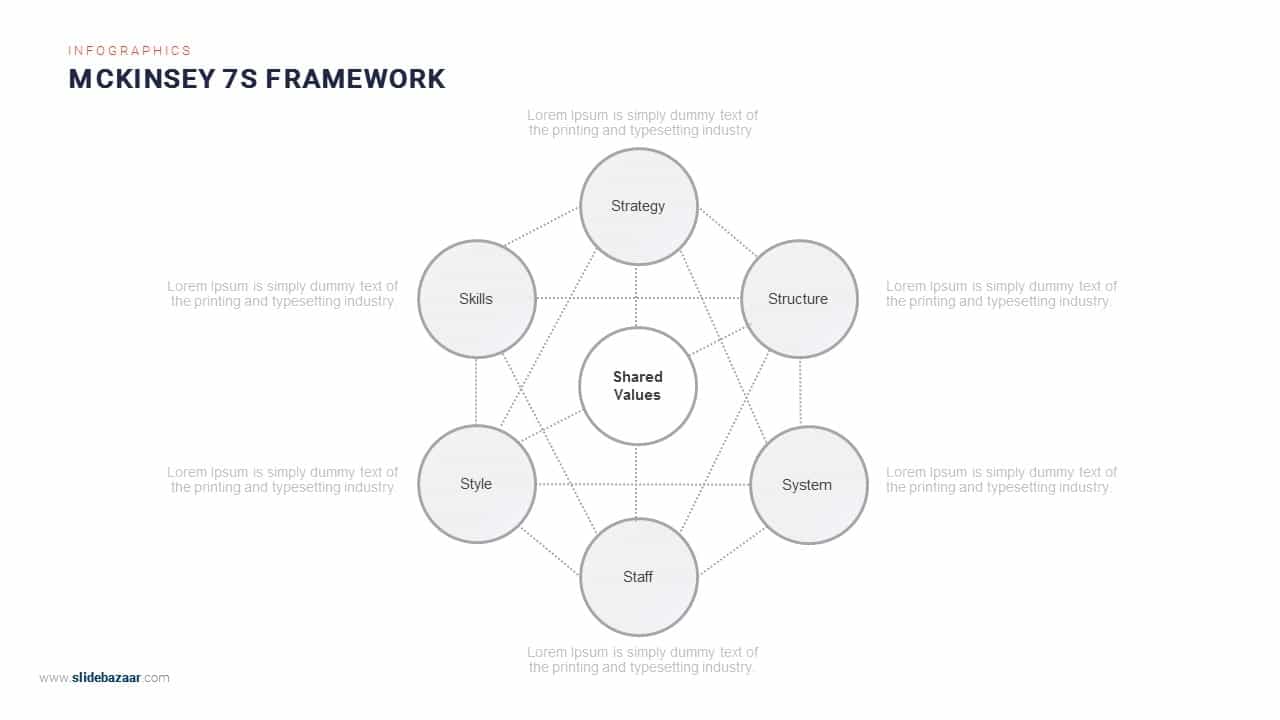
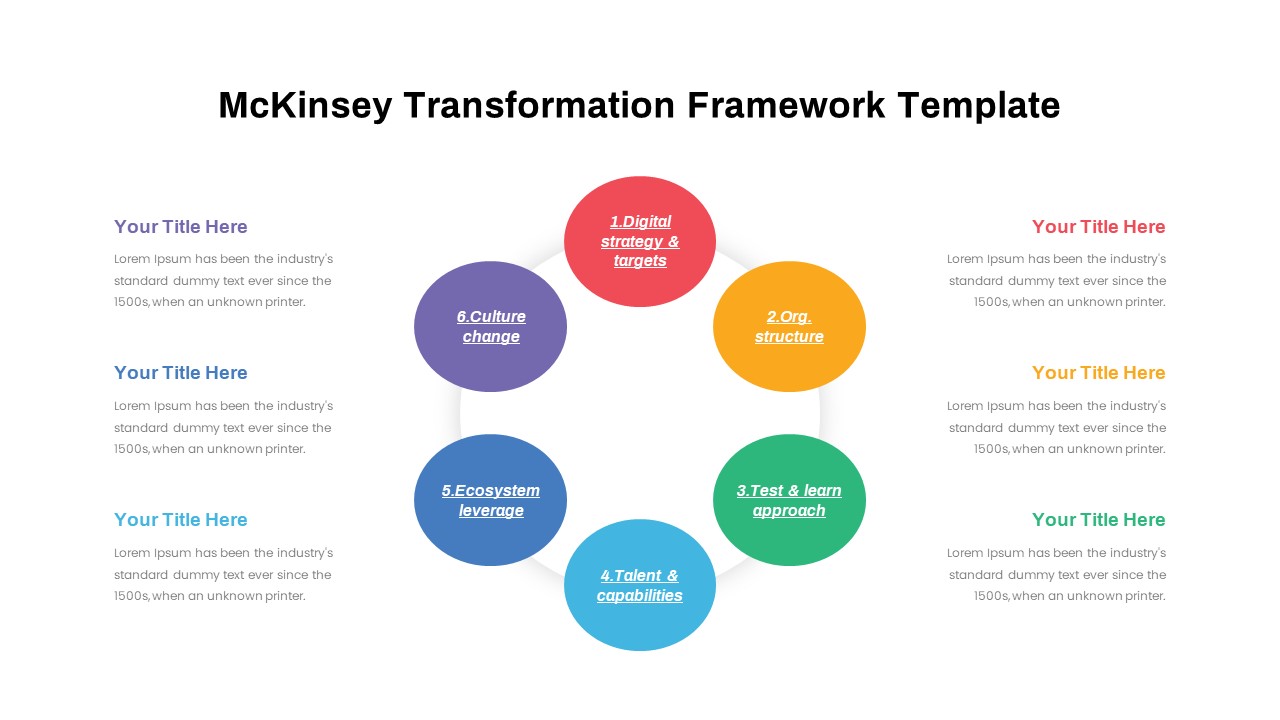
McKinsey 7S Framework Circular Diagram Template for PowerPoint & Google Slides
Circular
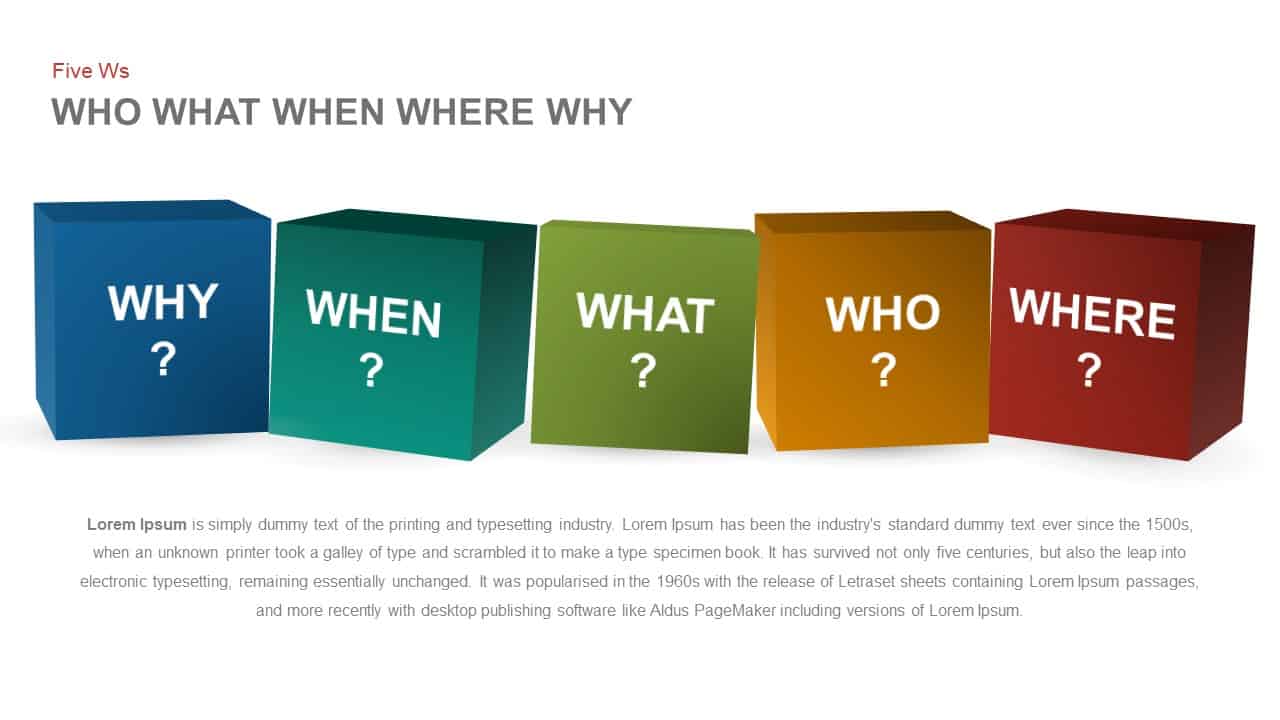
Five Ws Framework Cube Diagram Template for PowerPoint & Google Slides
Comparison
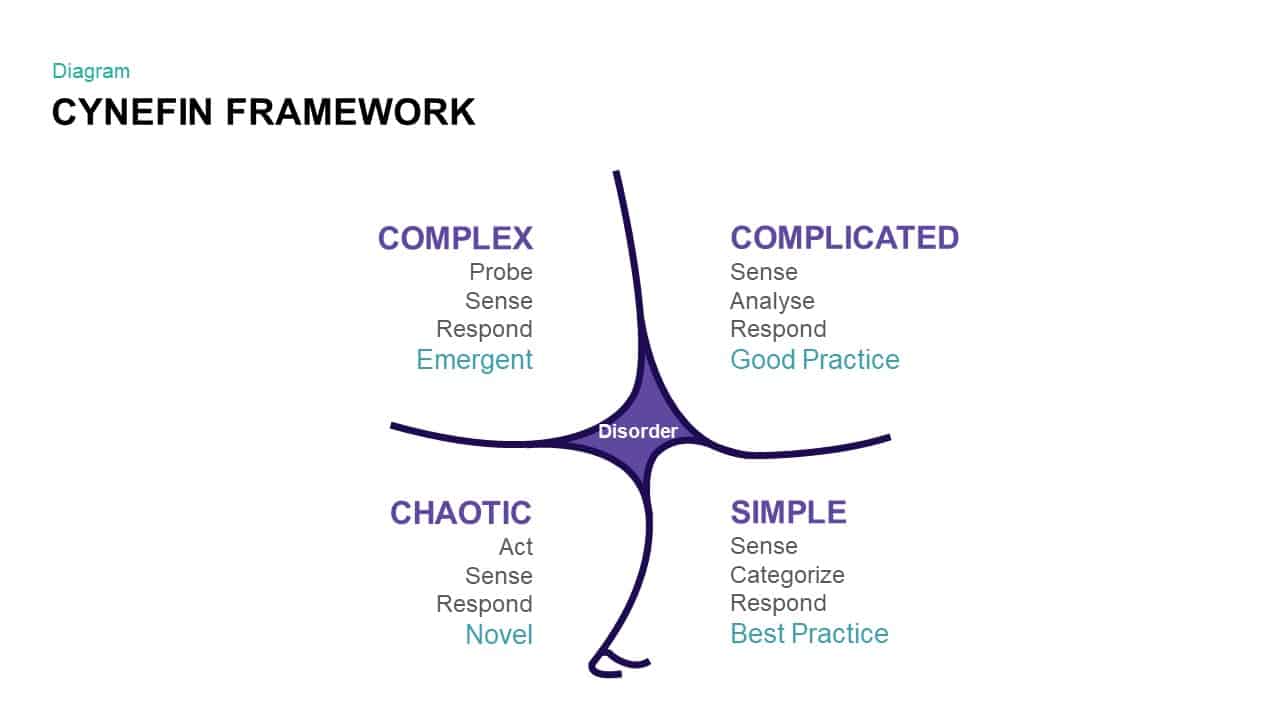
Comprehensive Cynefin Framework Diagram Template for PowerPoint & Google Slides
Opportunities Challenges
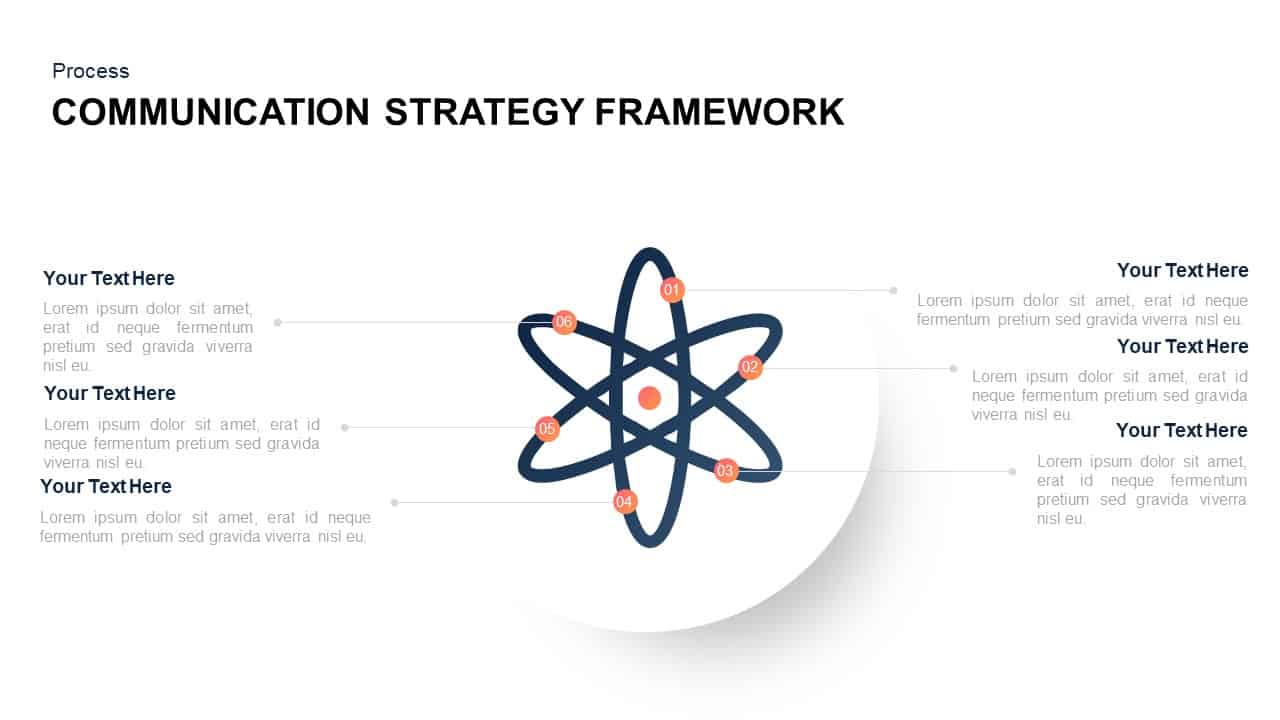
Communication Strategy Framework Diagram Template for PowerPoint & Google Slides
Circular
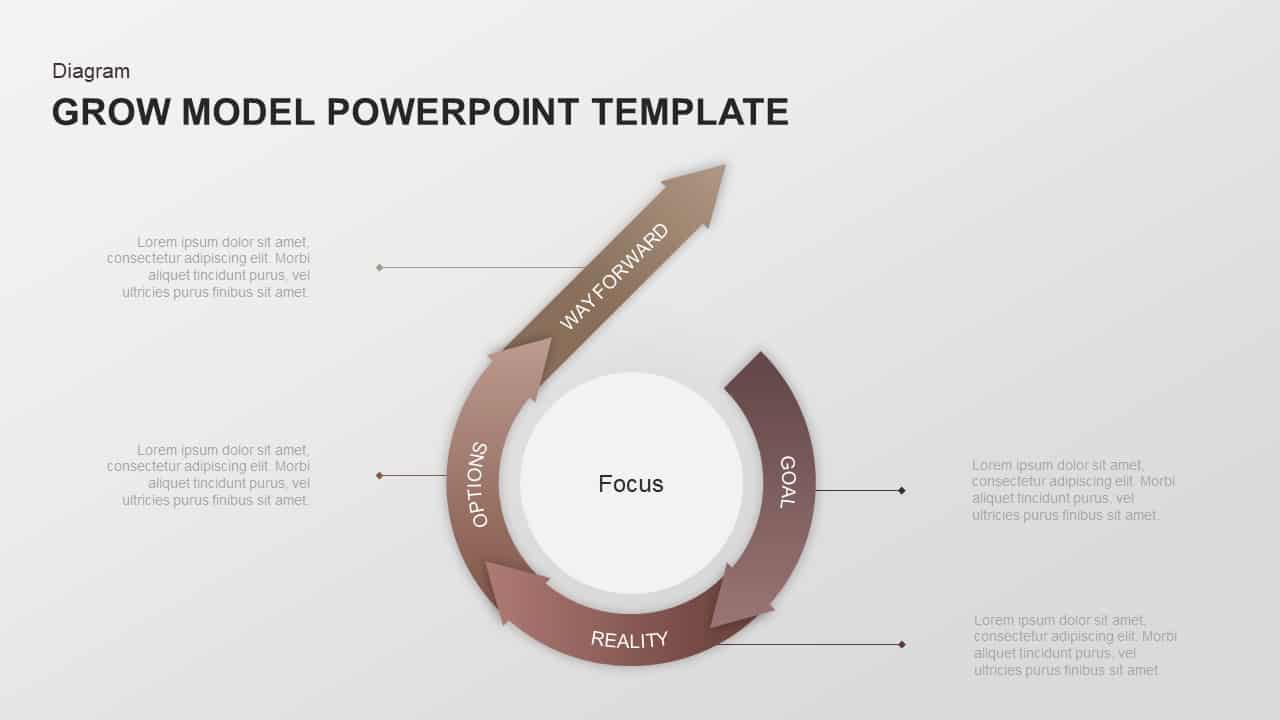
GROW Coaching Framework Diagram Template for PowerPoint & Google Slides
Process
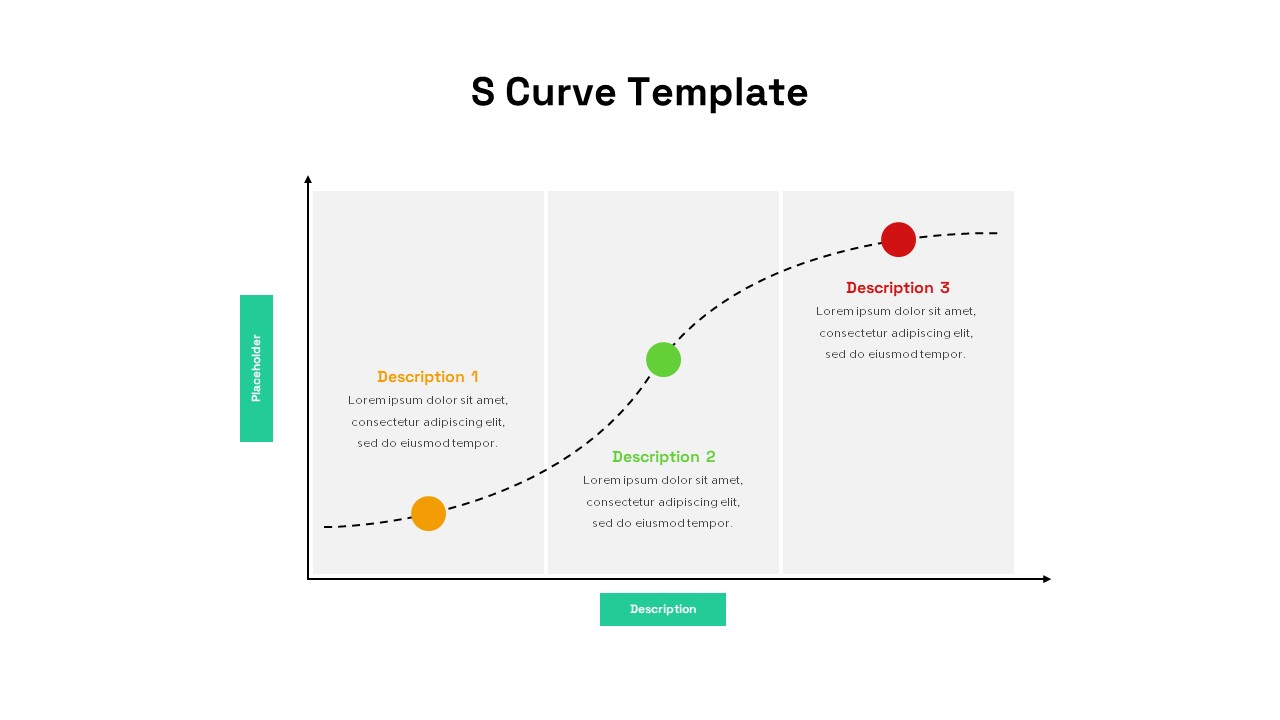
S-Curve Progression Framework Diagram Template for PowerPoint & Google Slides
Charts
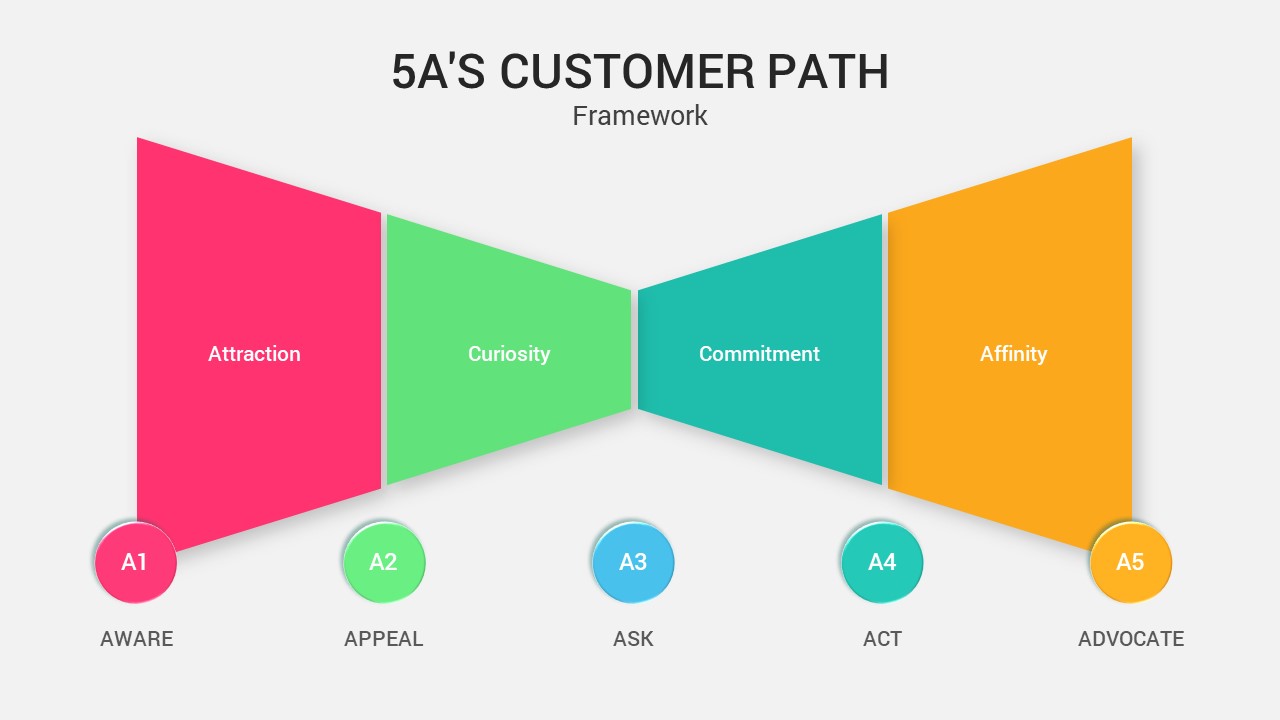
5A’s Customer Path Framework Diagram Template for PowerPoint & Google Slides
Process
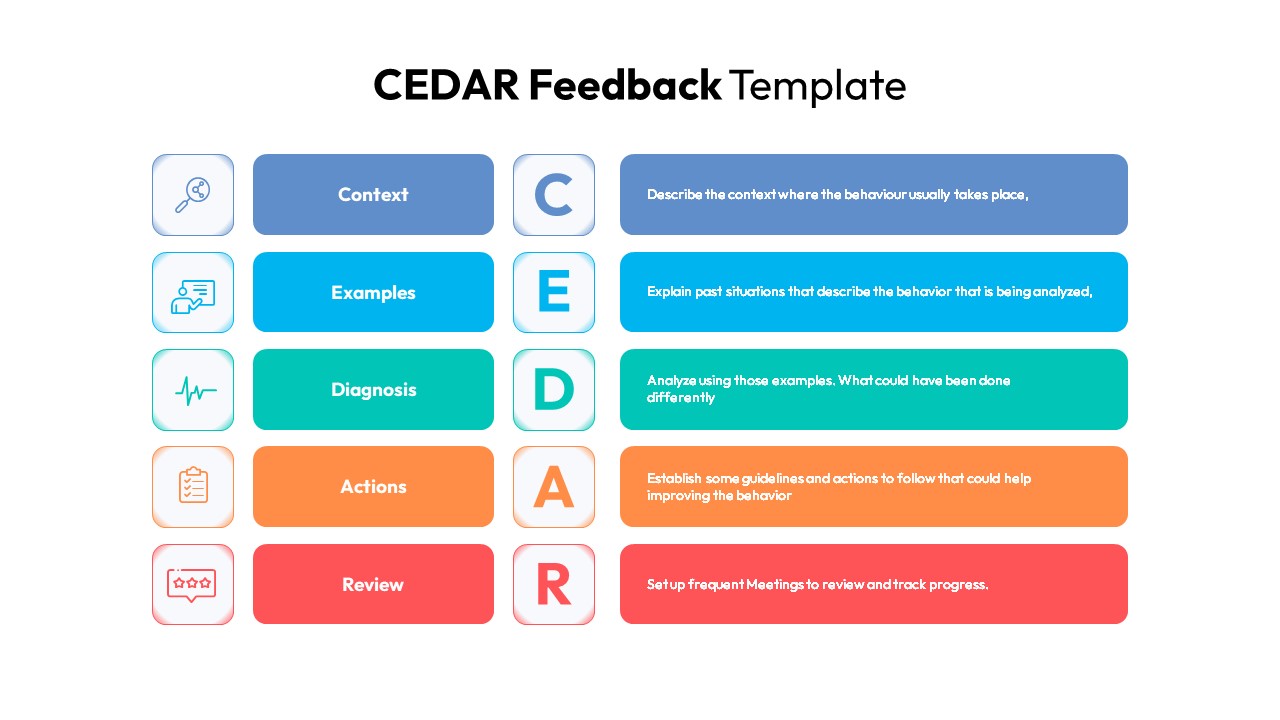
CEDAR Feedback Framework Diagram Template for PowerPoint & Google Slides
Employee Performance
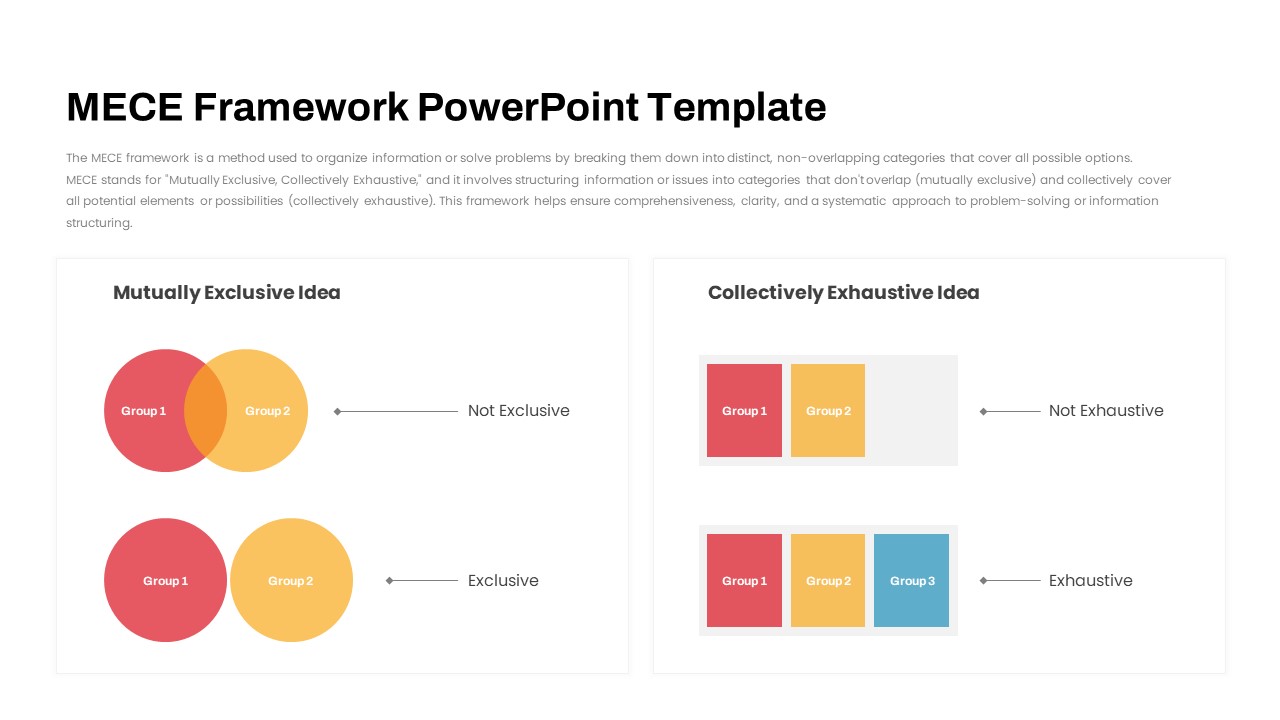
MECE Framework Venn & Block Diagram Template for PowerPoint & Google Slides
Comparison
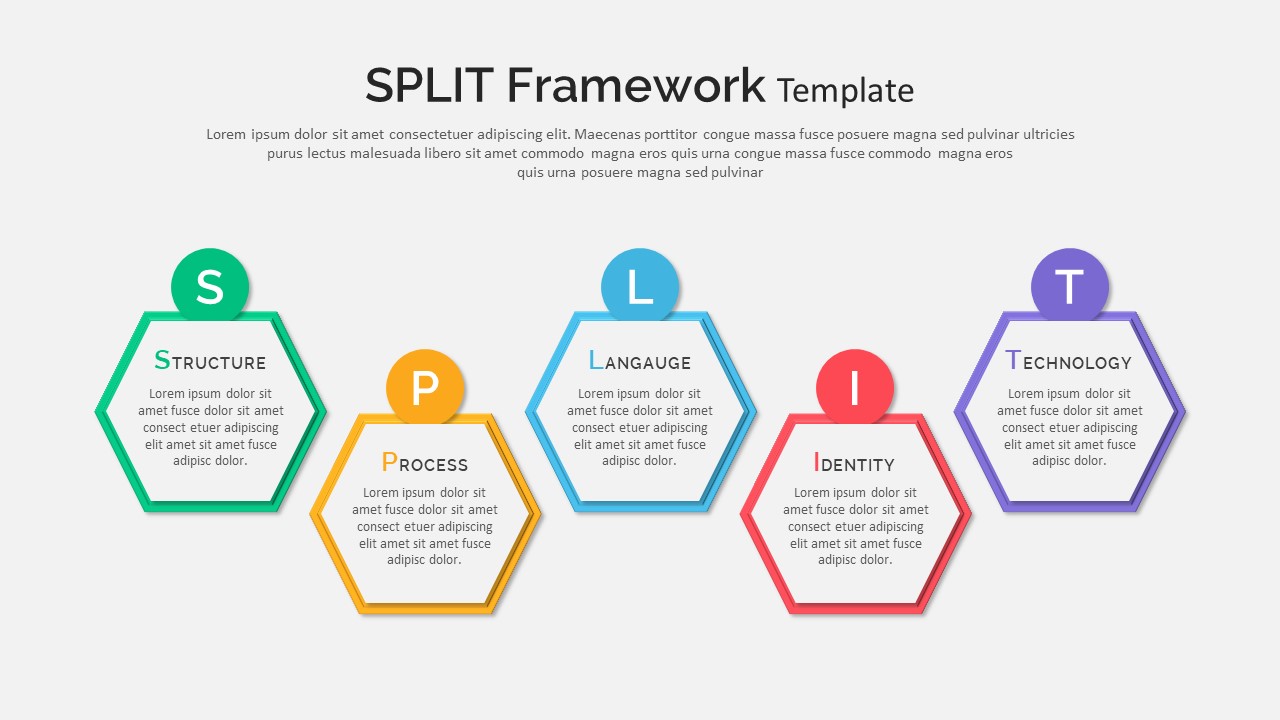
Split Framework Hexagon Diagram Slide Template for PowerPoint & Google Slides
Process
BCG Transformation Framework Diagram Template for PowerPoint & Google Slides
BCG
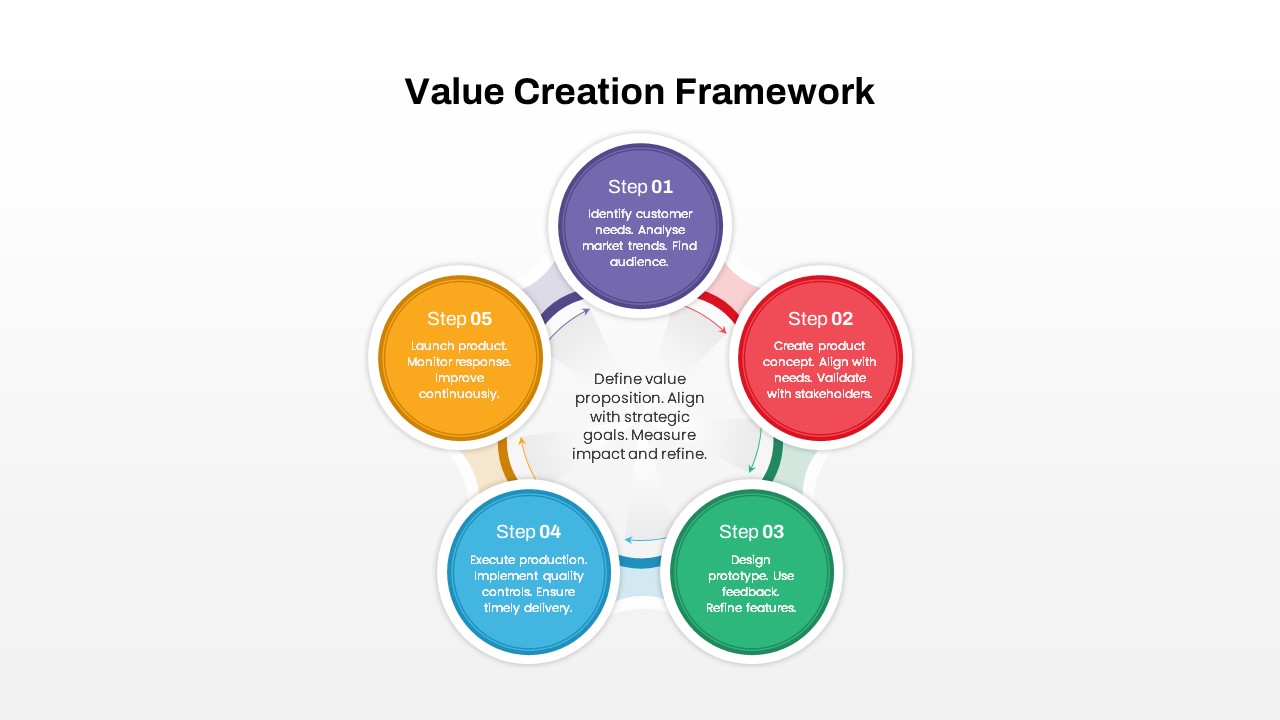
Value Creation Framework Process Diagram Template for PowerPoint & Google Slides
Business Plan
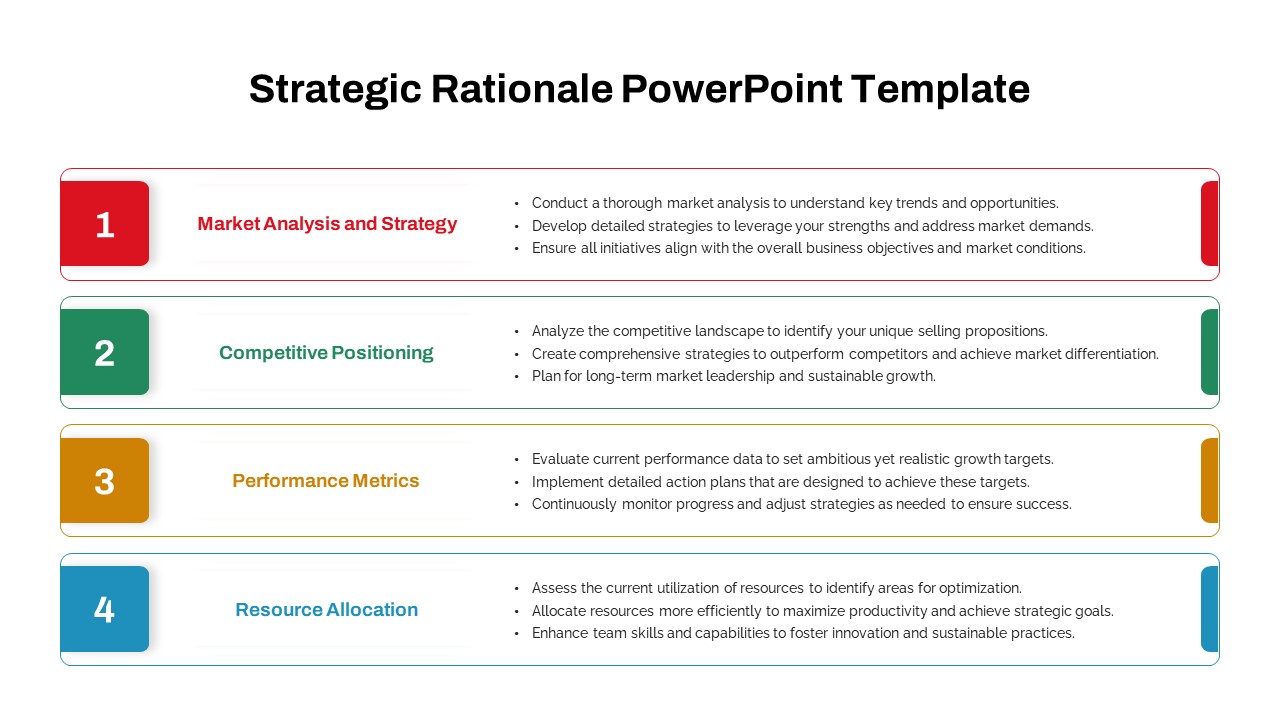
Strategic Rationale Framework Diagram Template for PowerPoint & Google Slides
Process
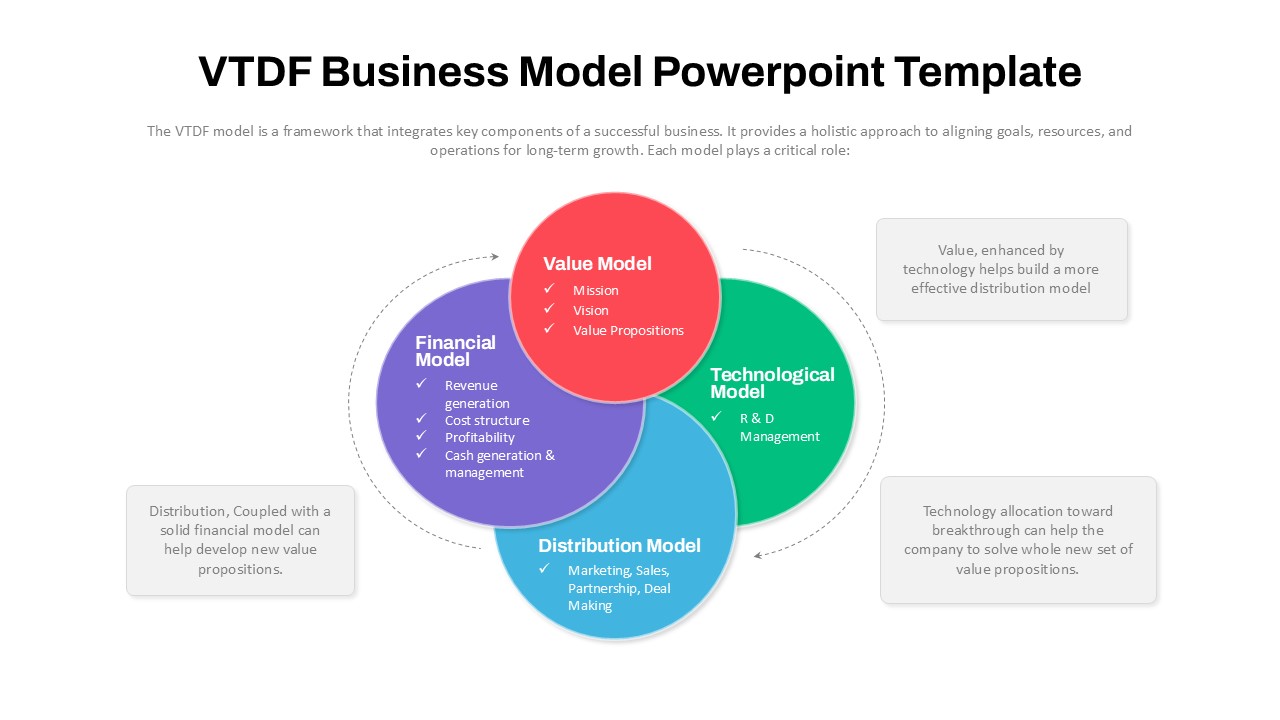
VTDF Business Model Framework Diagram Template for PowerPoint & Google Slides
Business Models
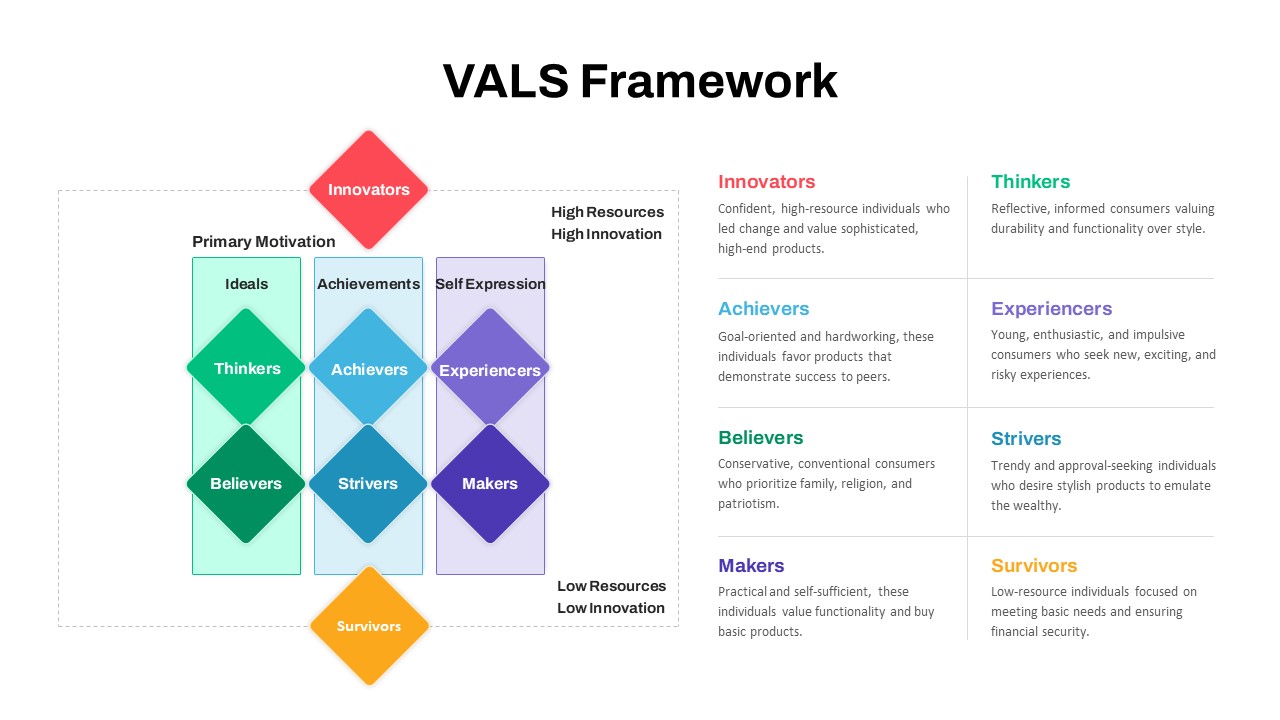
VALS Segmentation Framework Diagram Template for PowerPoint & Google Slides
Marketing
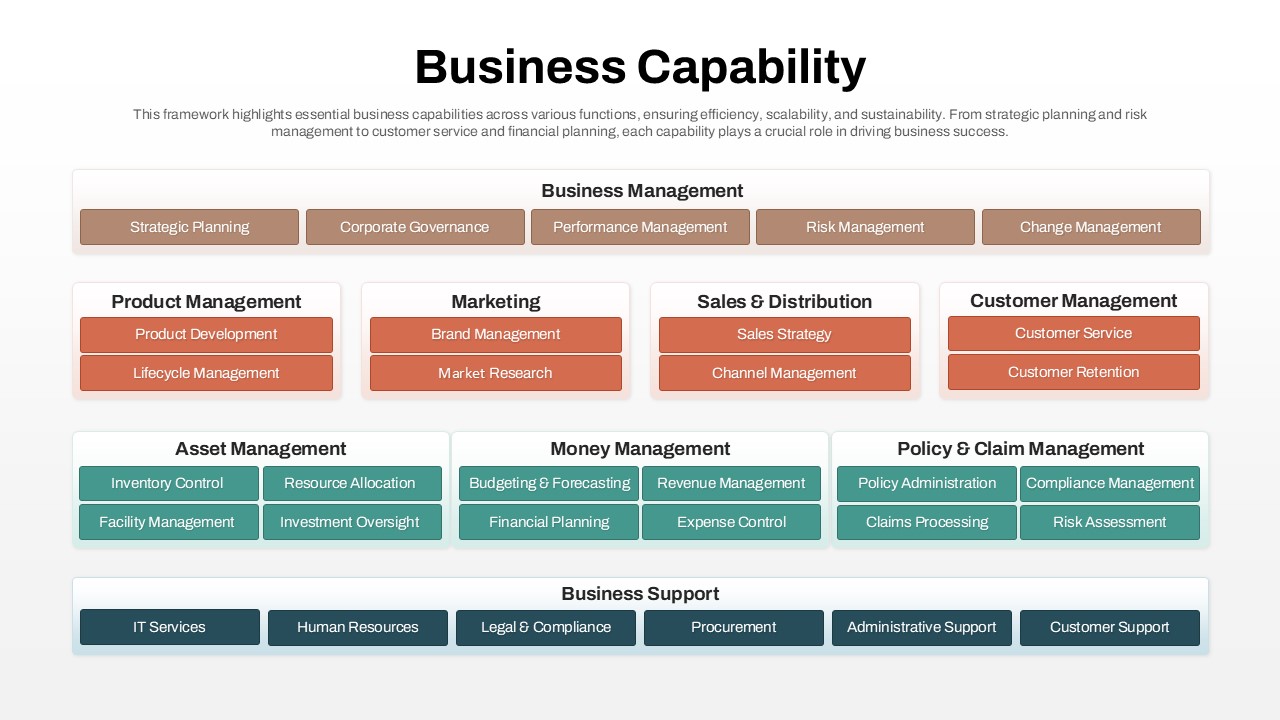
Business Capability Framework Diagram Template for PowerPoint & Google Slides
Business Models
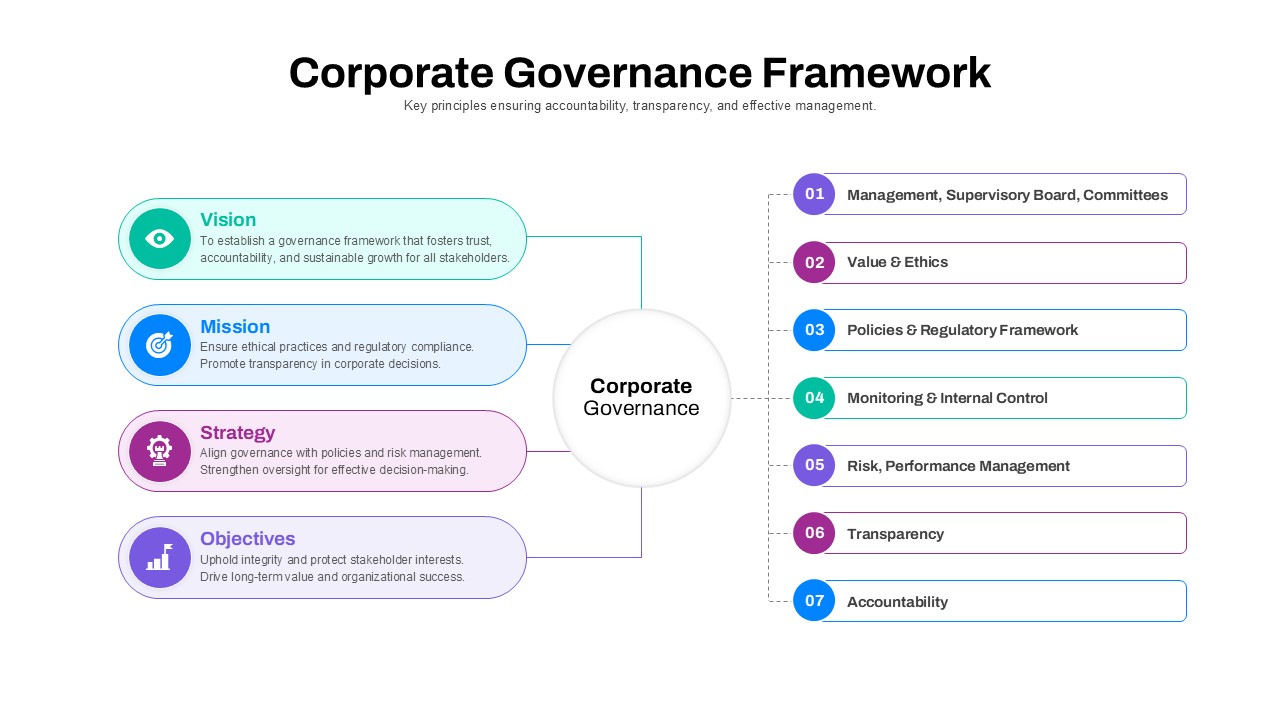
Corporate Governance Framework Diagram Template for PowerPoint & Google Slides
Process
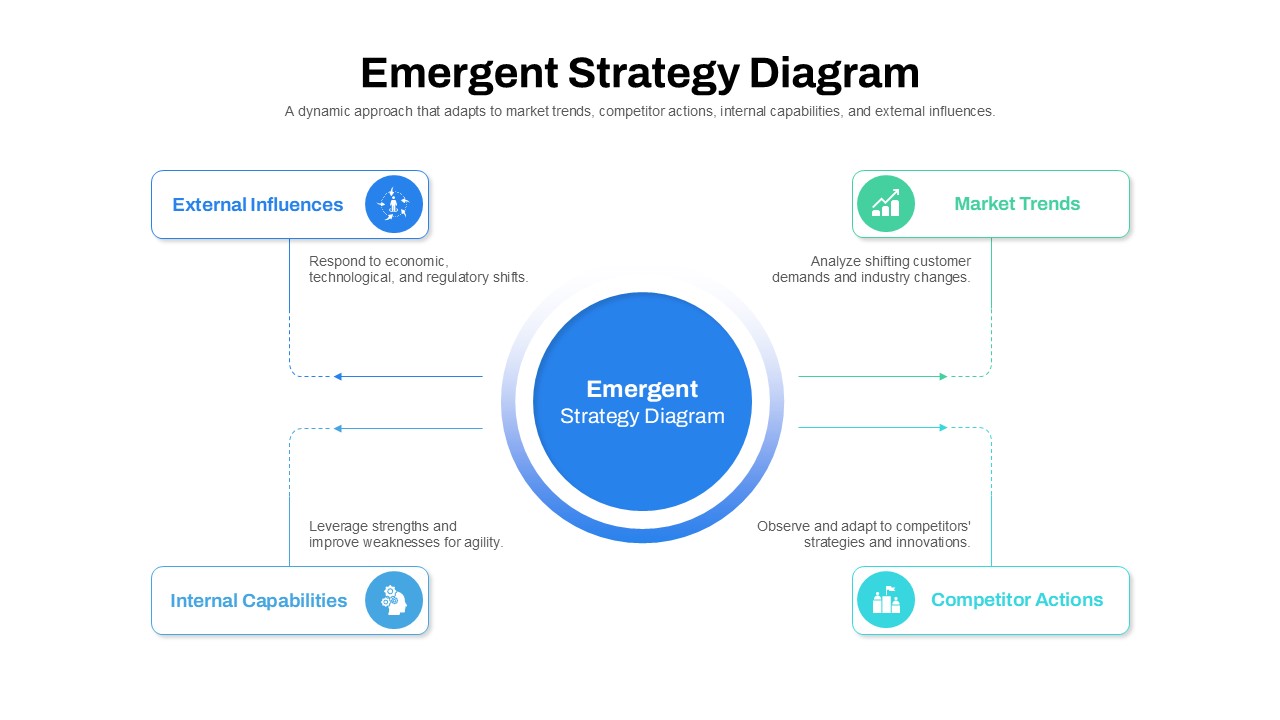
Emergent Strategy Diagram Framework Template for PowerPoint & Google Slides
Process
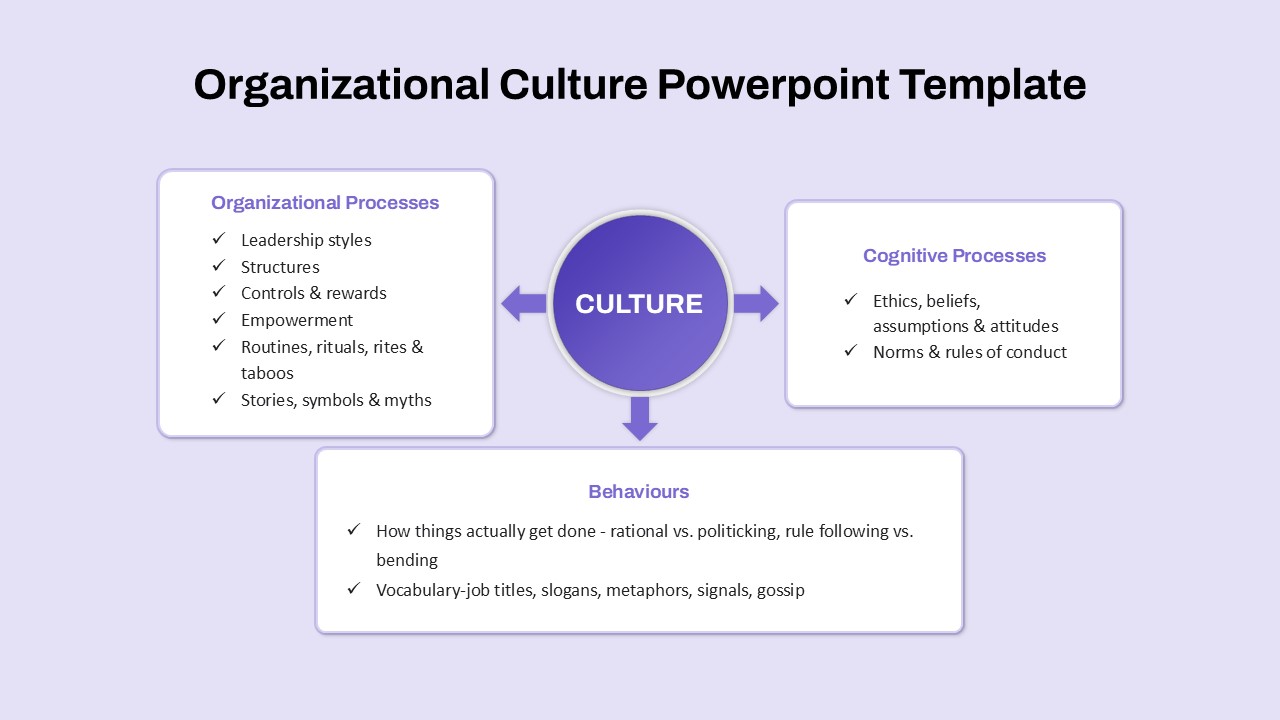
Organizational Culture Framework Diagram Template for PowerPoint & Google Slides
Arrow
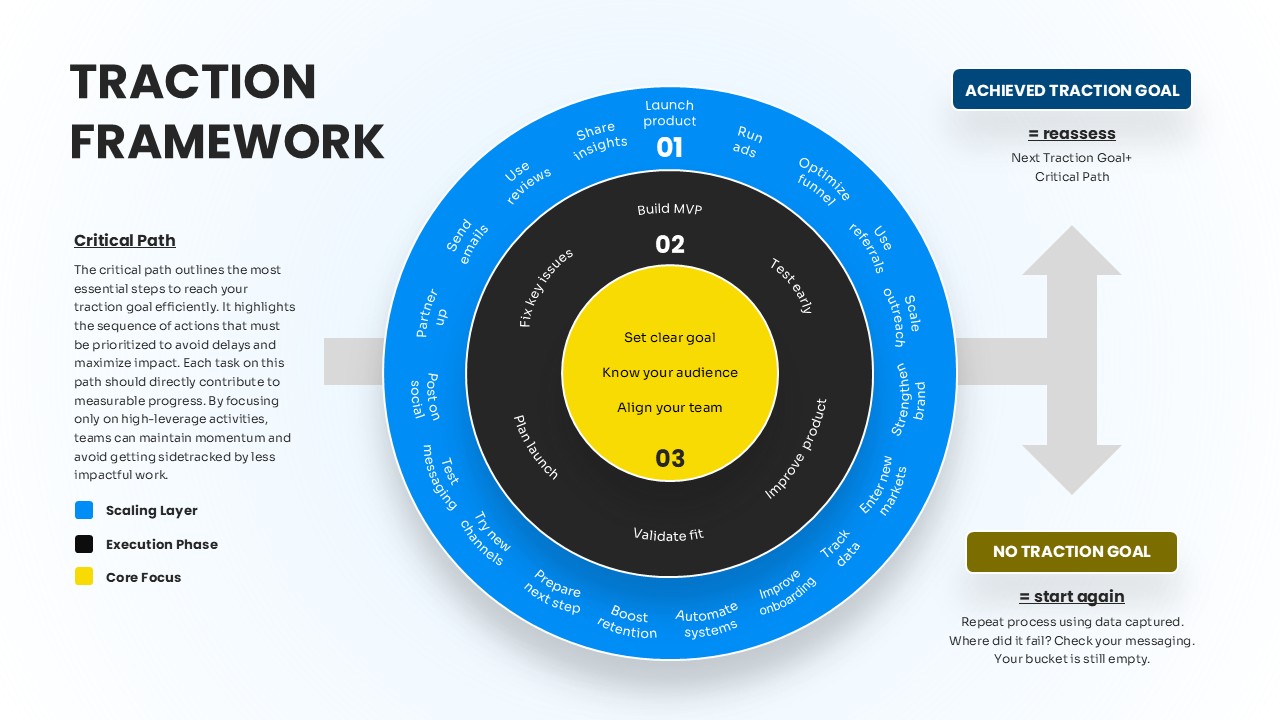
Concentric Traction Framework Diagram Template for PowerPoint & Google Slides
Process
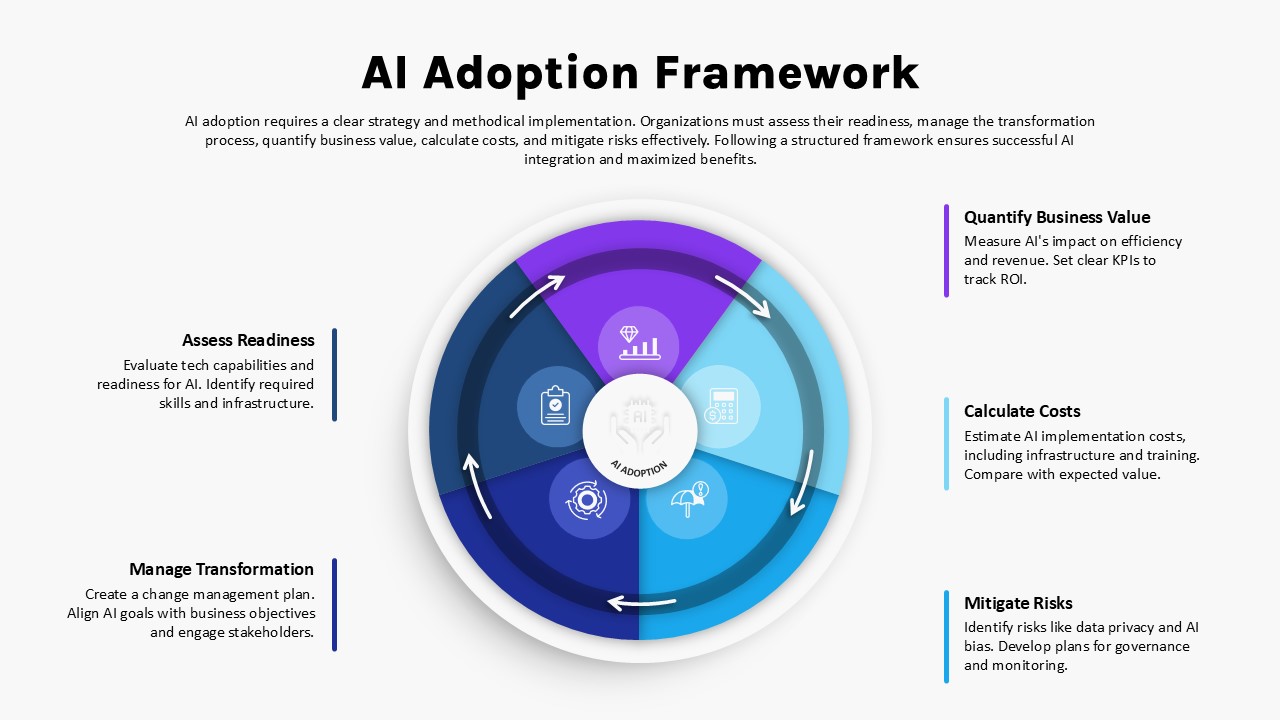
AI Adoption Framework Circular Diagram Template for PowerPoint & Google Slides
AI
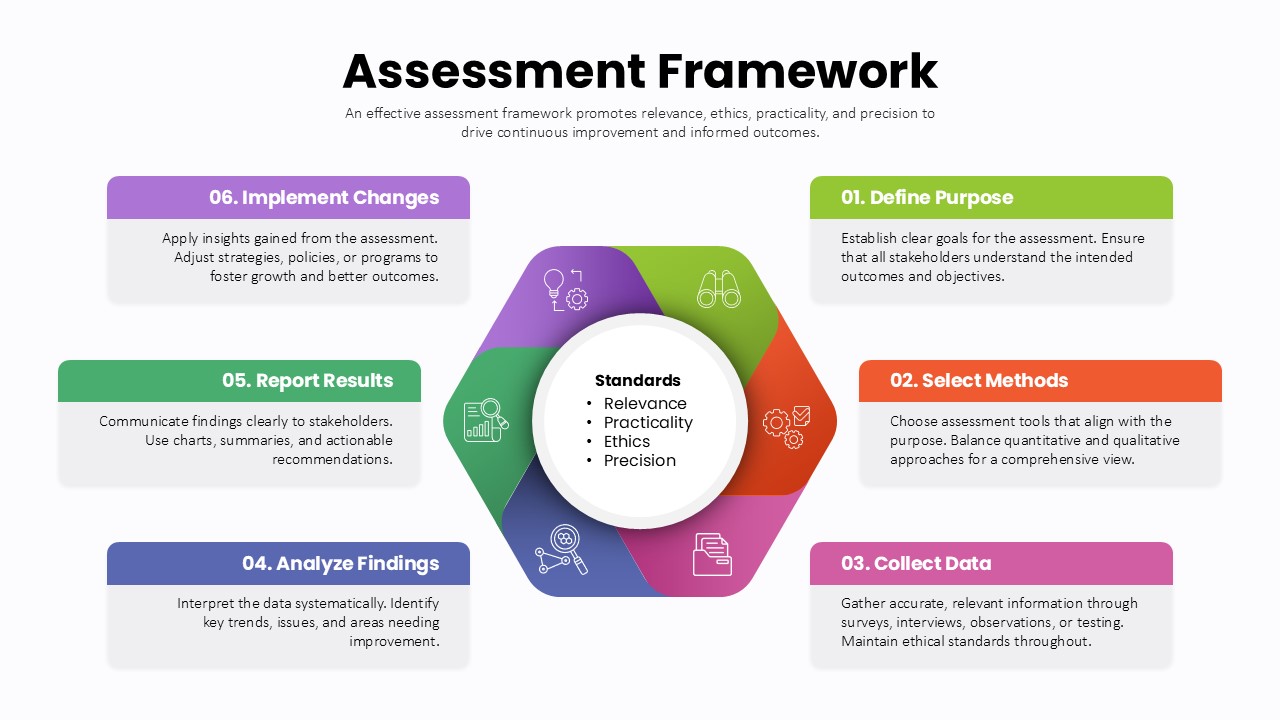
Assessment Framework Circular Diagram Template for PowerPoint & Google Slides
Circular
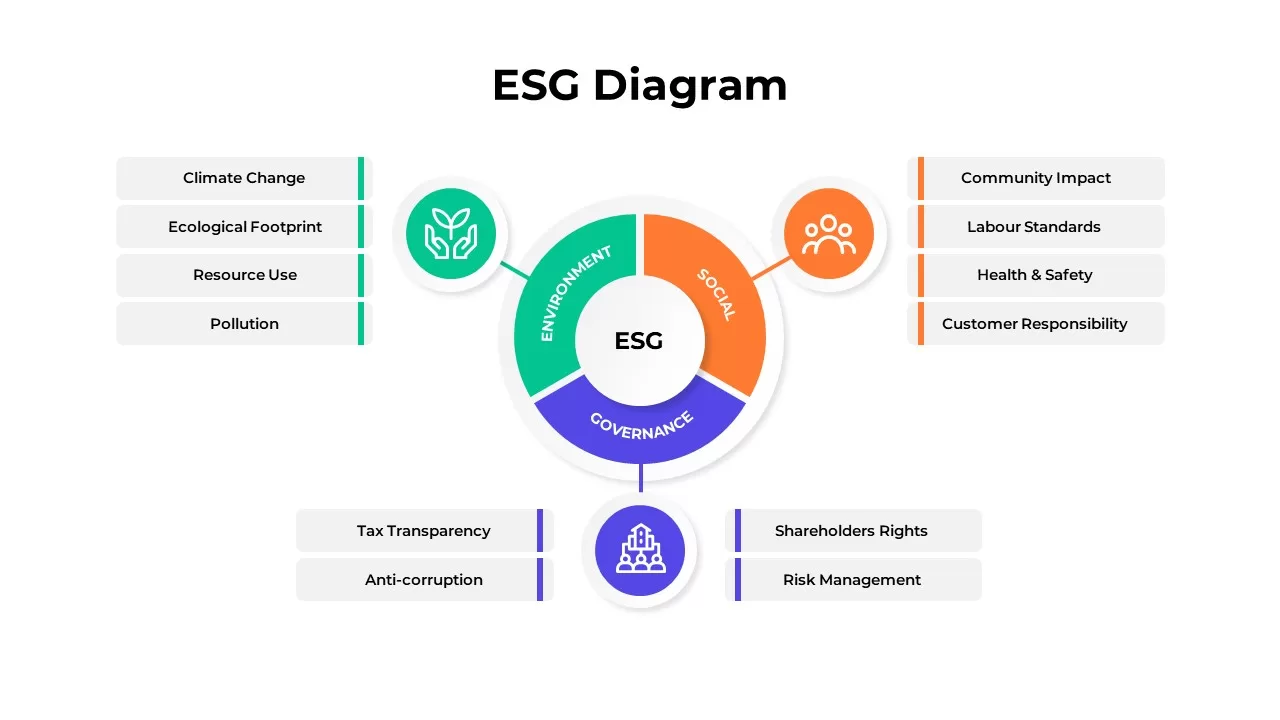
ESG Framework Segmentation Diagram for PowerPoint & Google Slides
Risk Management
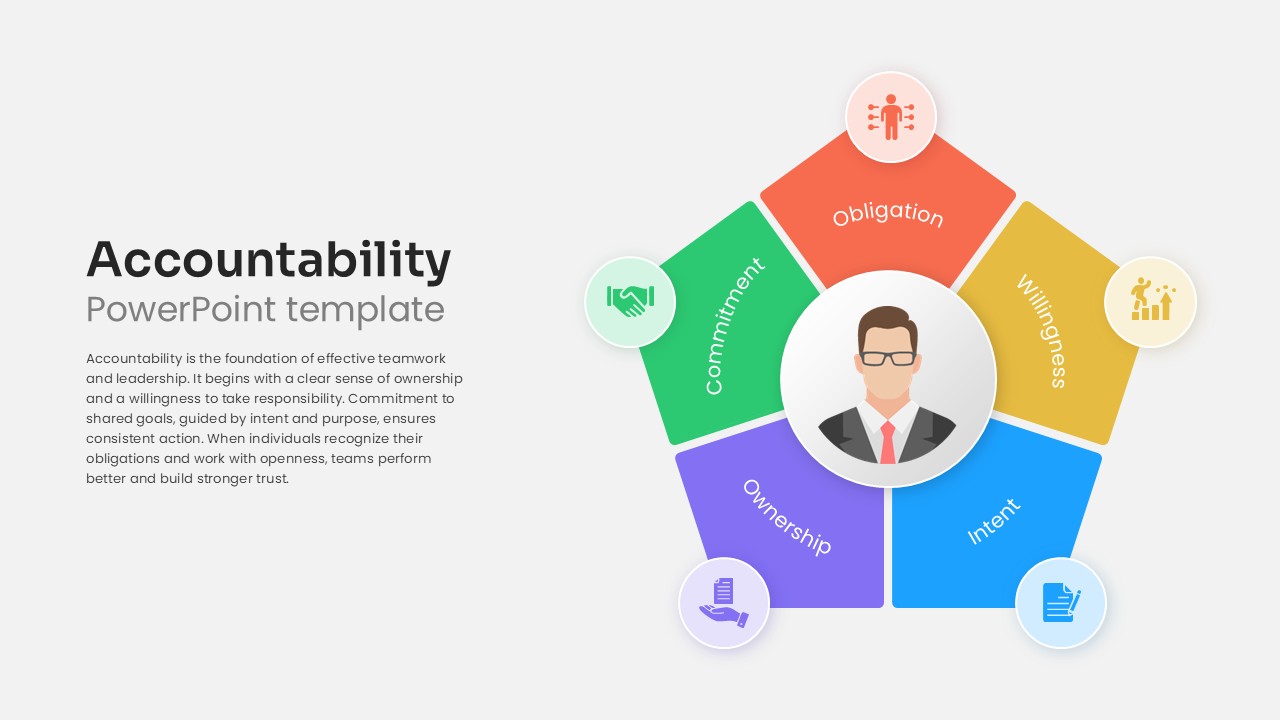
Accountability Framework PowerPoint template for PowerPoint & Google Slides
Leadership
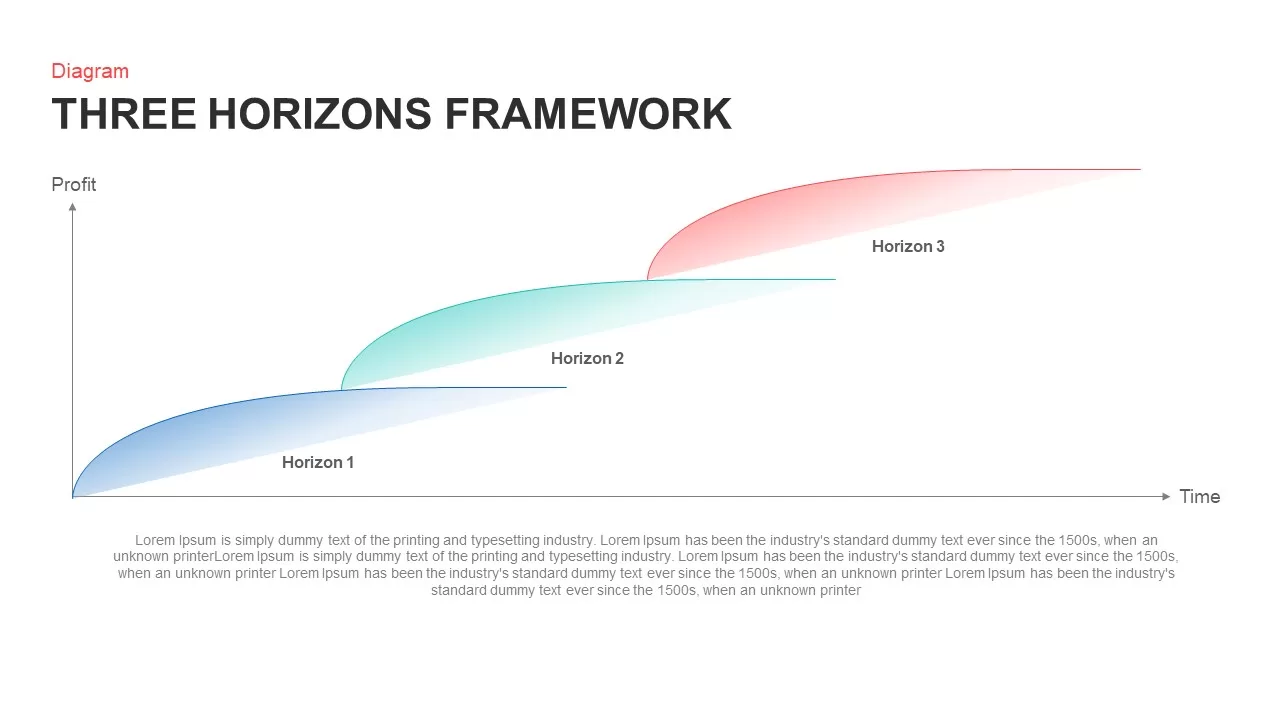
Strategic Three Horizons Framework Template for PowerPoint & Google Slides
Business Strategy
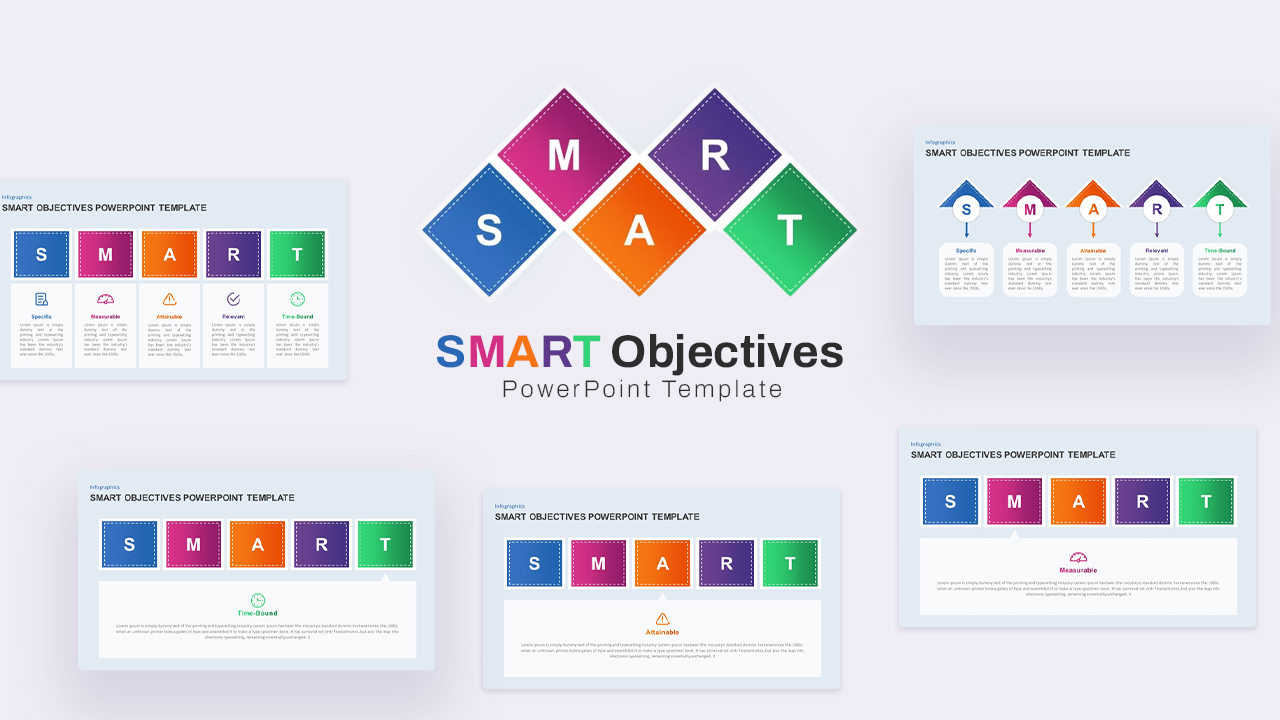
SMART Objectives – 5 Goals Framework Template for PowerPoint & Google Slides
Goals
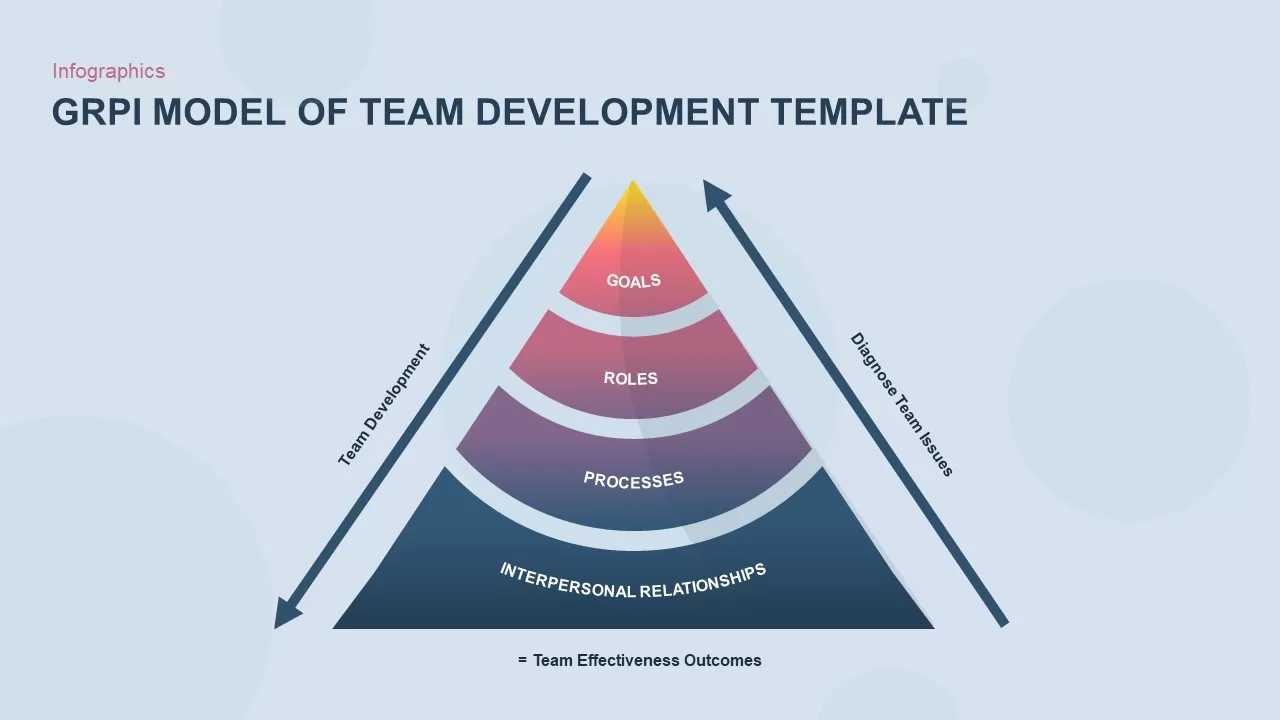
GRPI Model of Team Development Framework Template for PowerPoint & Google Slides
Leadership
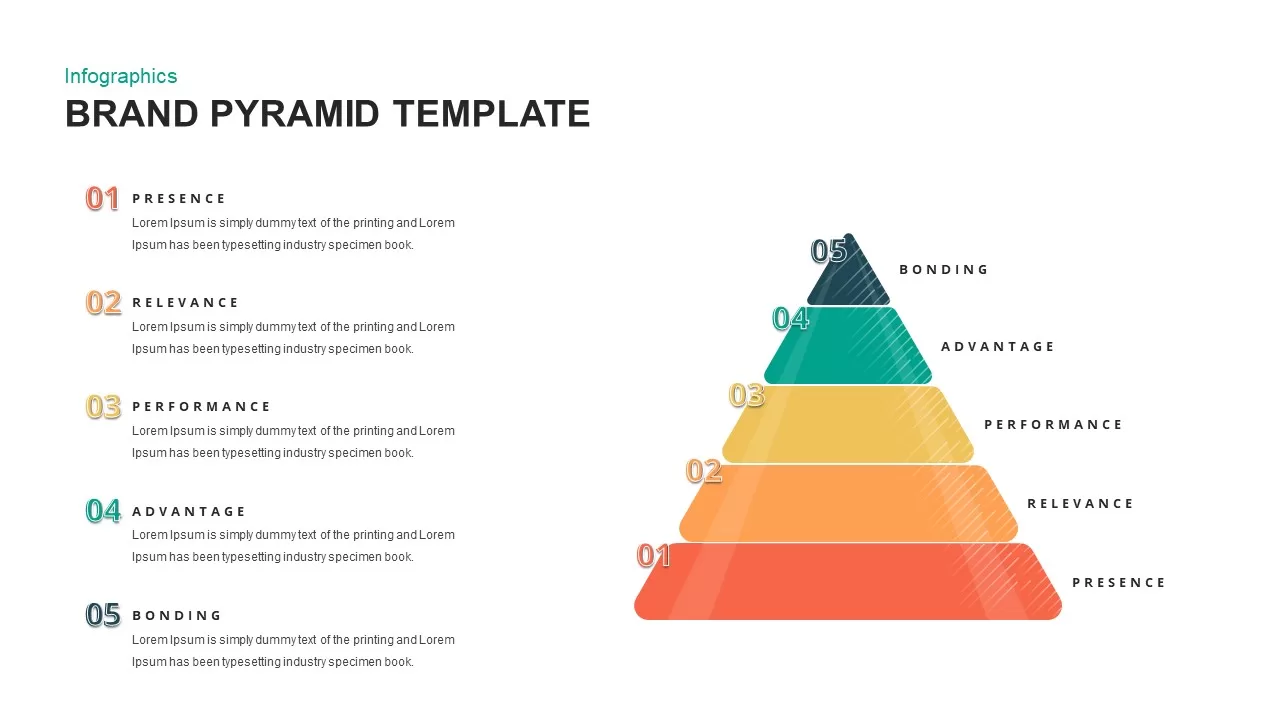
Brand Pyramid Framework template for PowerPoint & Google Slides
Pyramid
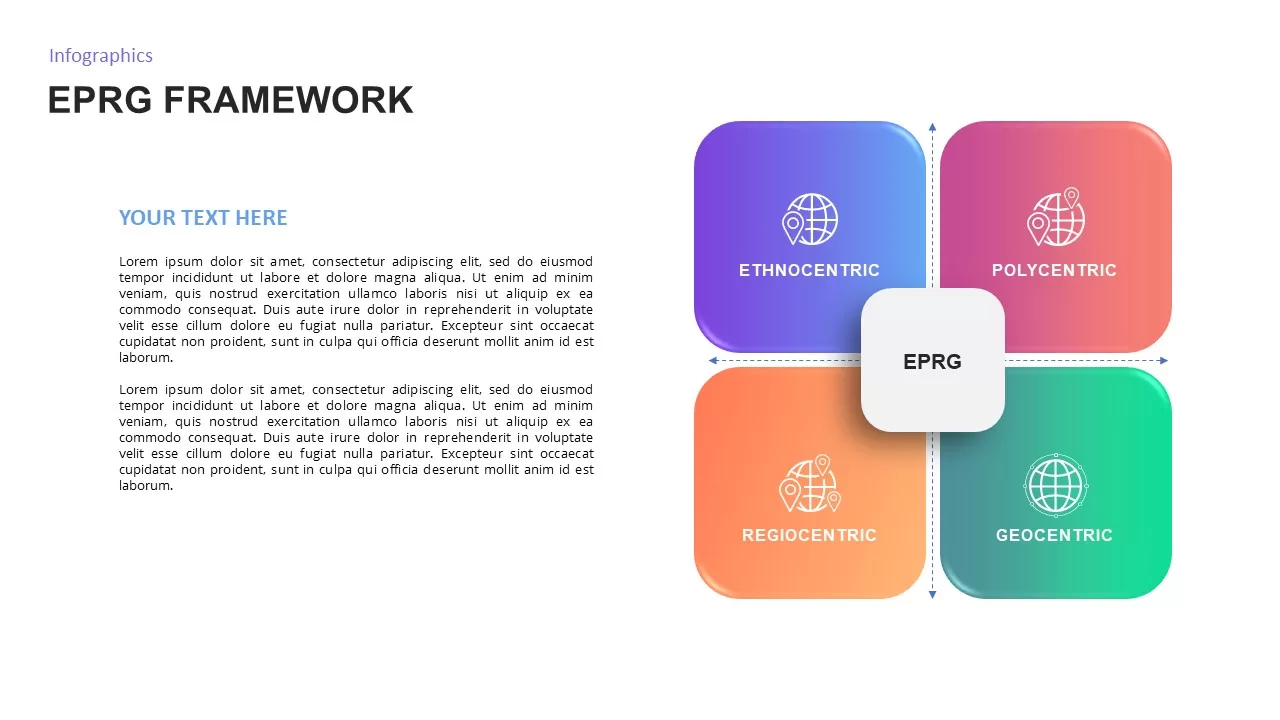
EPRG Framework Analysis template for PowerPoint & Google Slides
Business Strategy
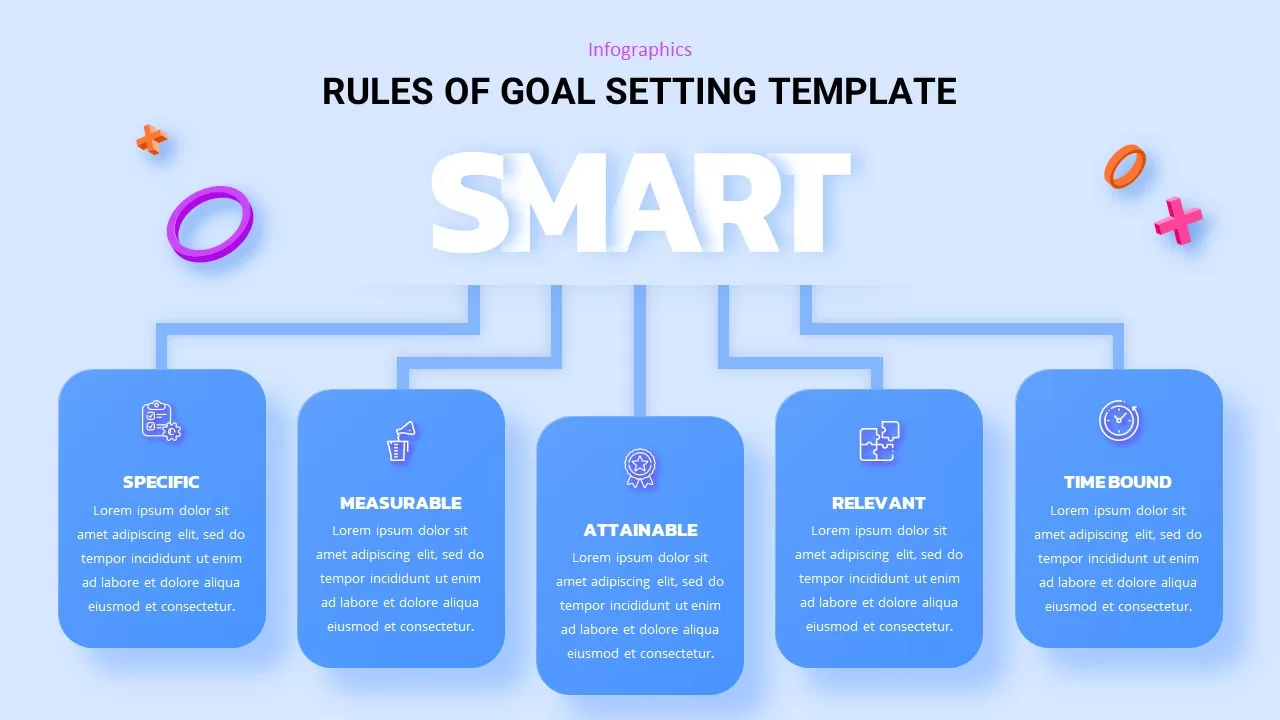
SMART Goals Framework Rules Template for PowerPoint & Google Slides
Business
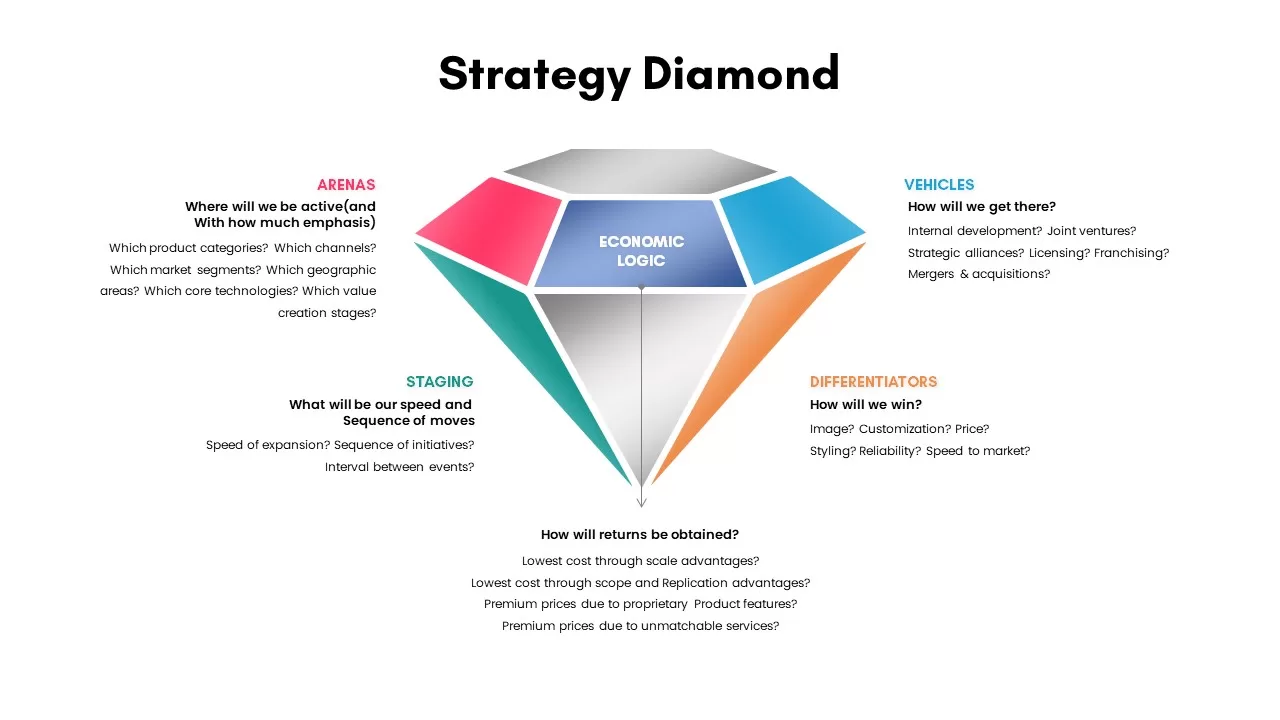
Strategy Diamond Framework Visual Template for PowerPoint & Google Slides
Competitor Analysis
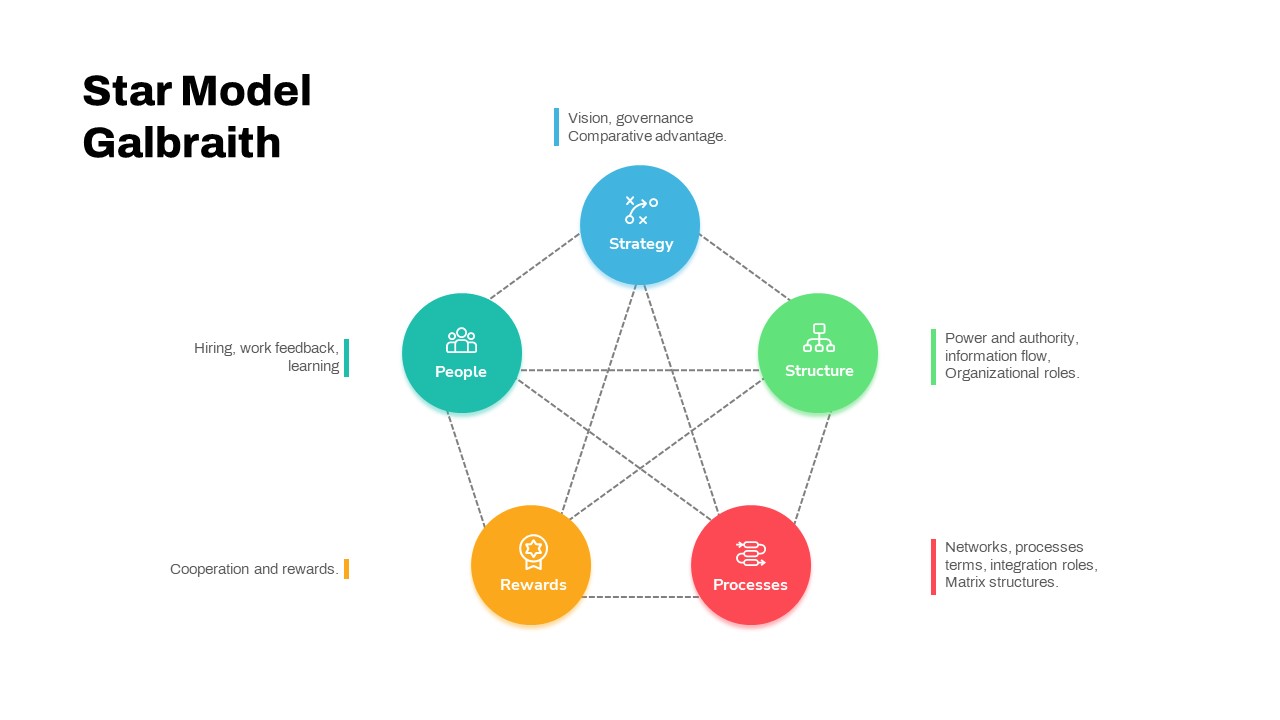
Star Model Galbraith Framework Template for PowerPoint & Google Slides
Business Strategy
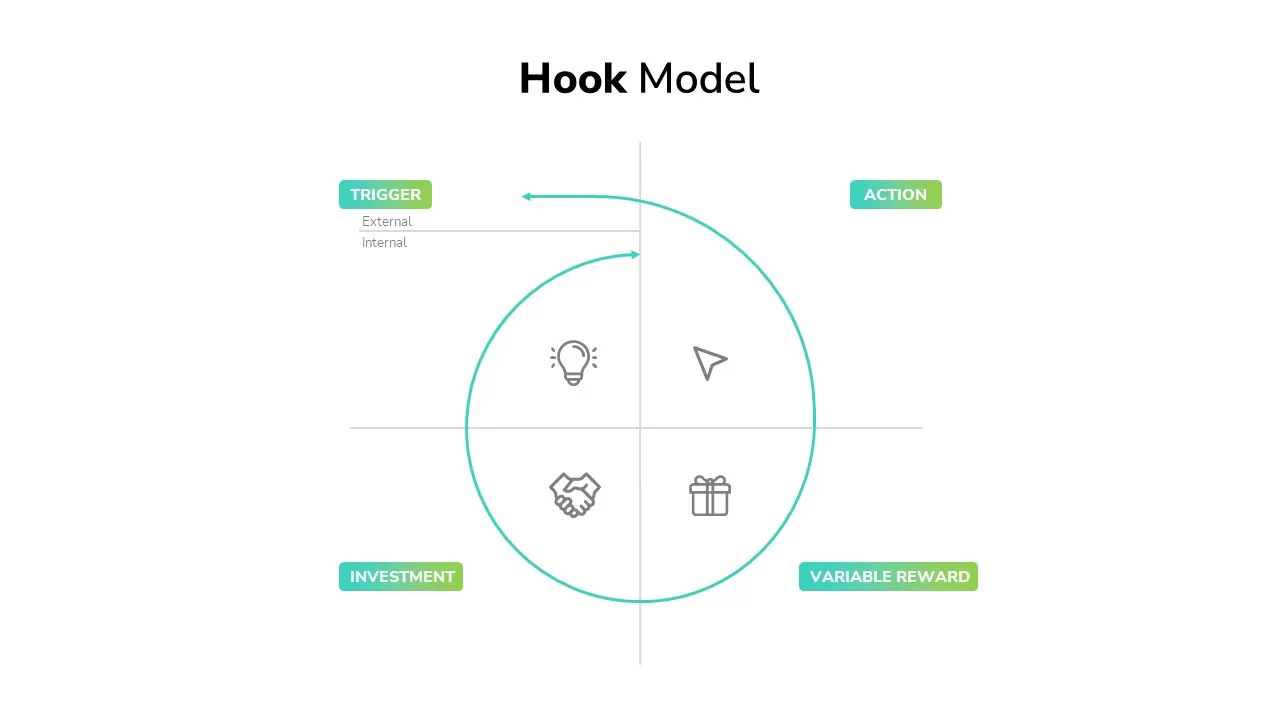
Hook Model Framework Template for PowerPoint & Google Slides
Business Strategy
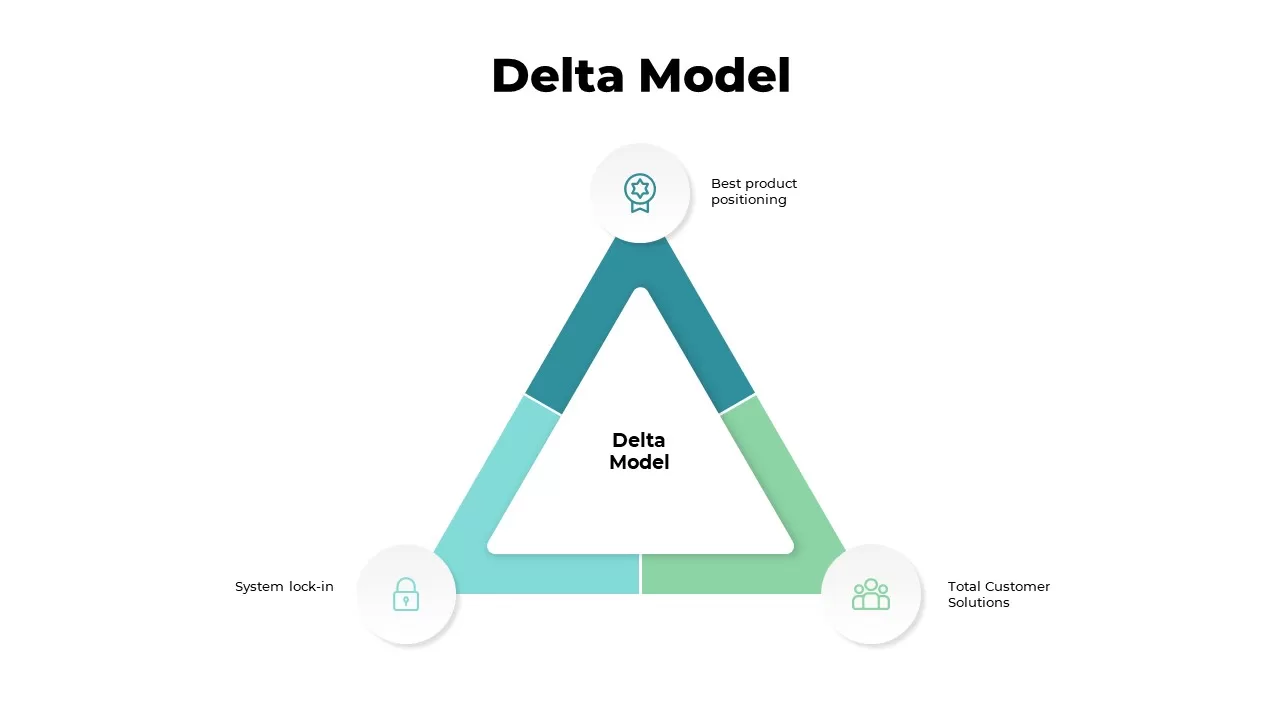
Delta Model Strategic Framework Template for PowerPoint & Google Slides
Business Strategy
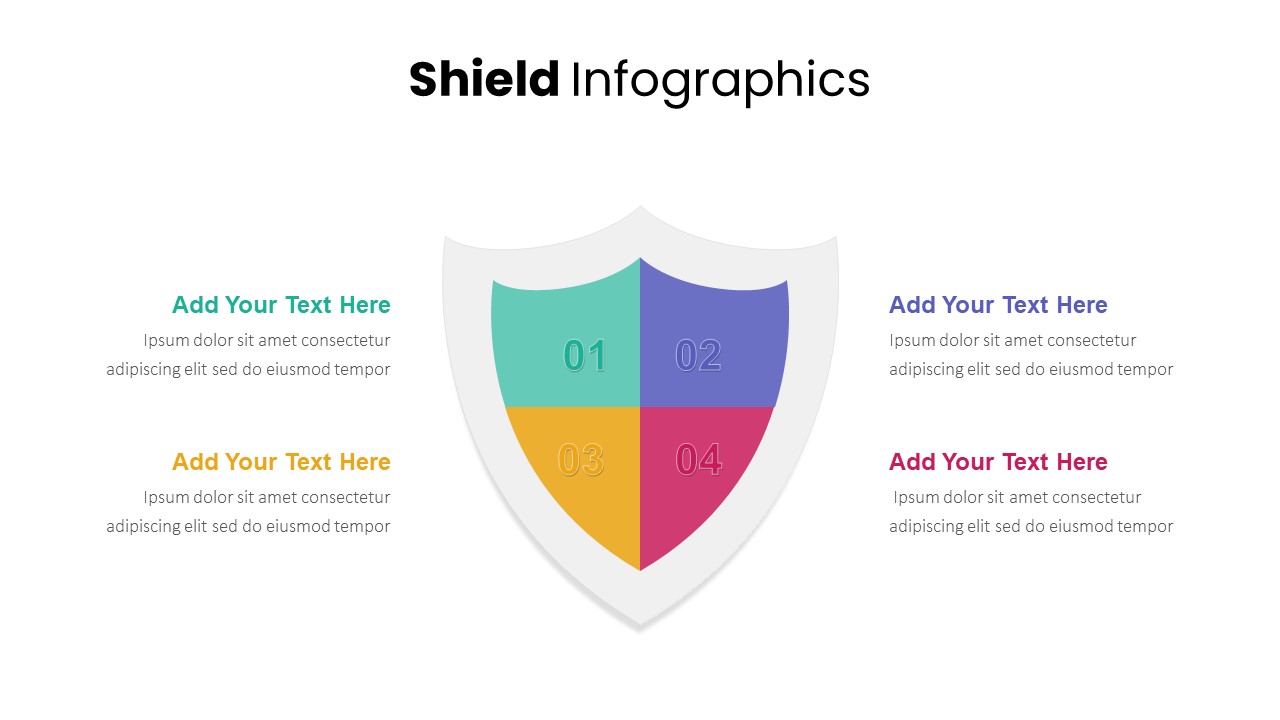
Shield Infographics Four-Part Framework Template for PowerPoint & Google Slides
Process
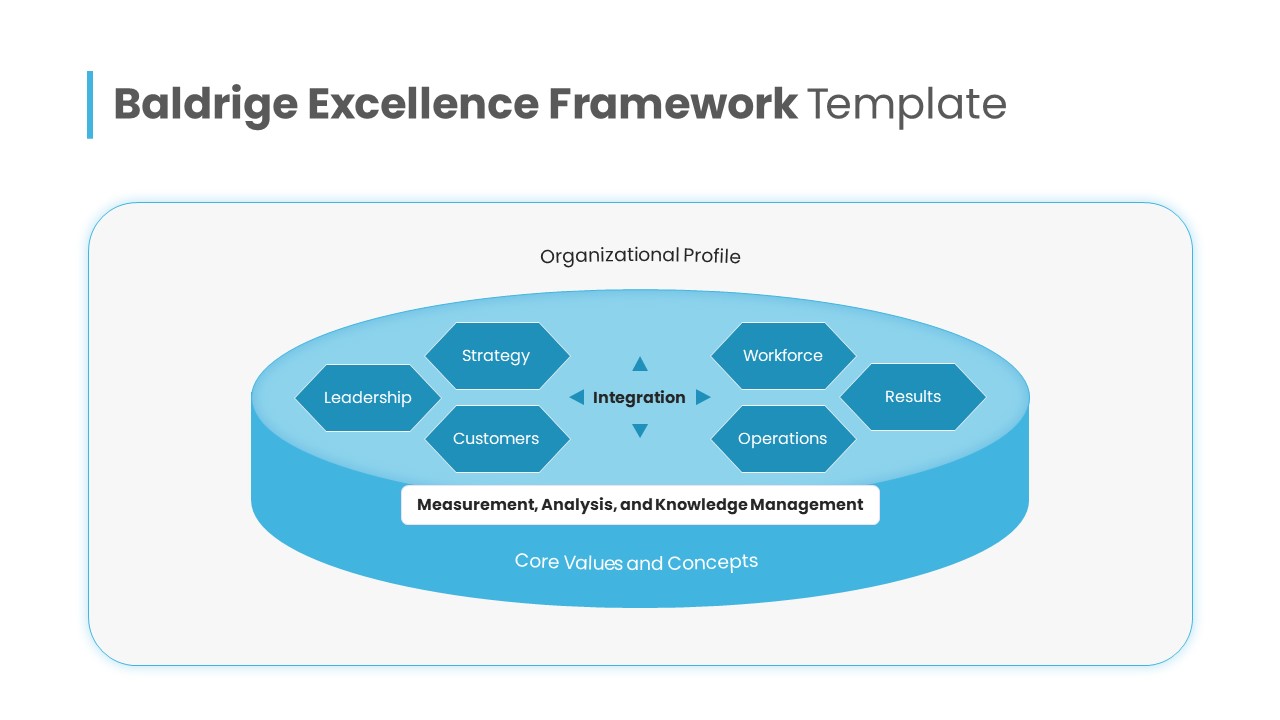
Baldrige Excellence Framework Overview Template for PowerPoint & Google Slides
Leadership
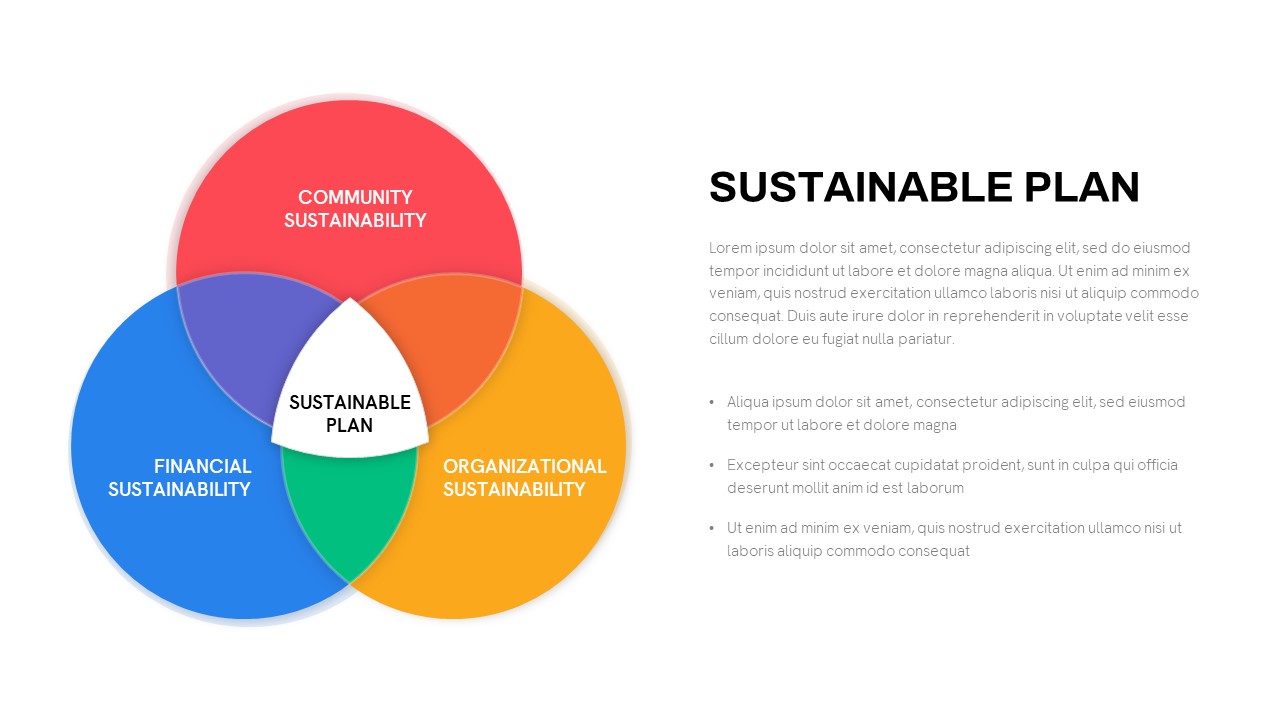
Sustainable Plan Strategy Framework Template for PowerPoint & Google Slides
Business
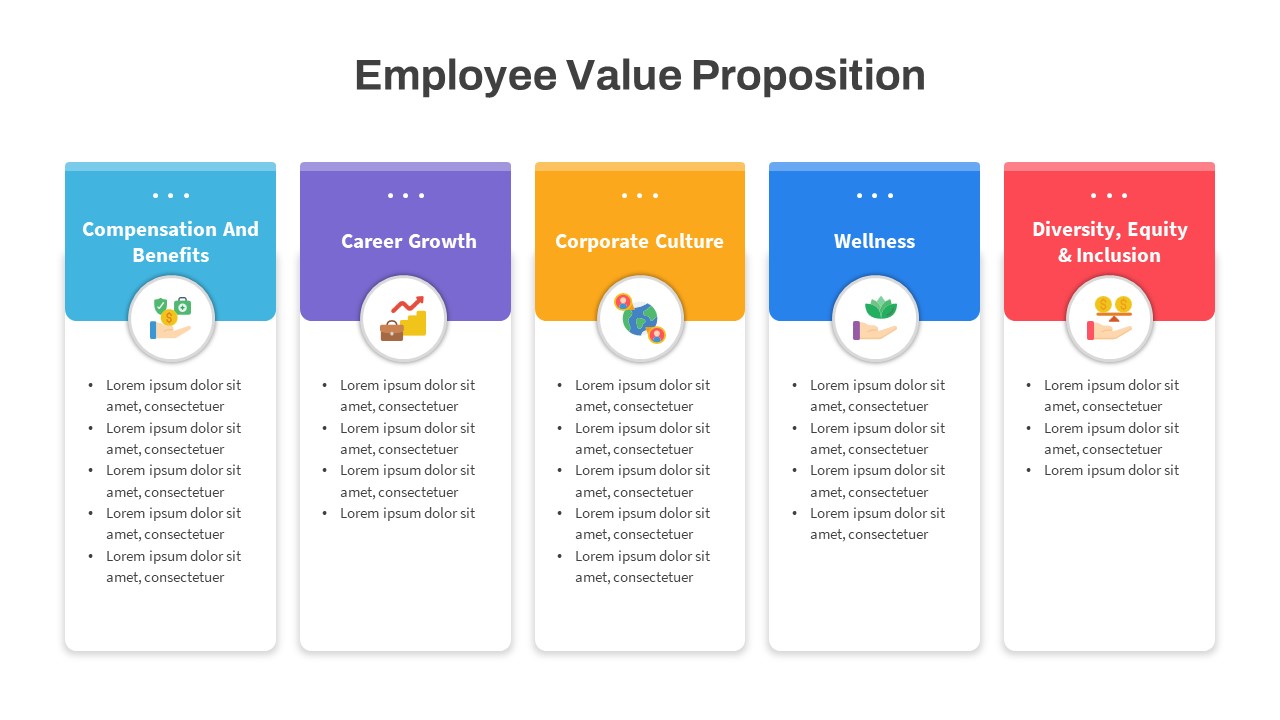
Employee Value Proposition Framework Template for PowerPoint & Google Slides
Recruitment
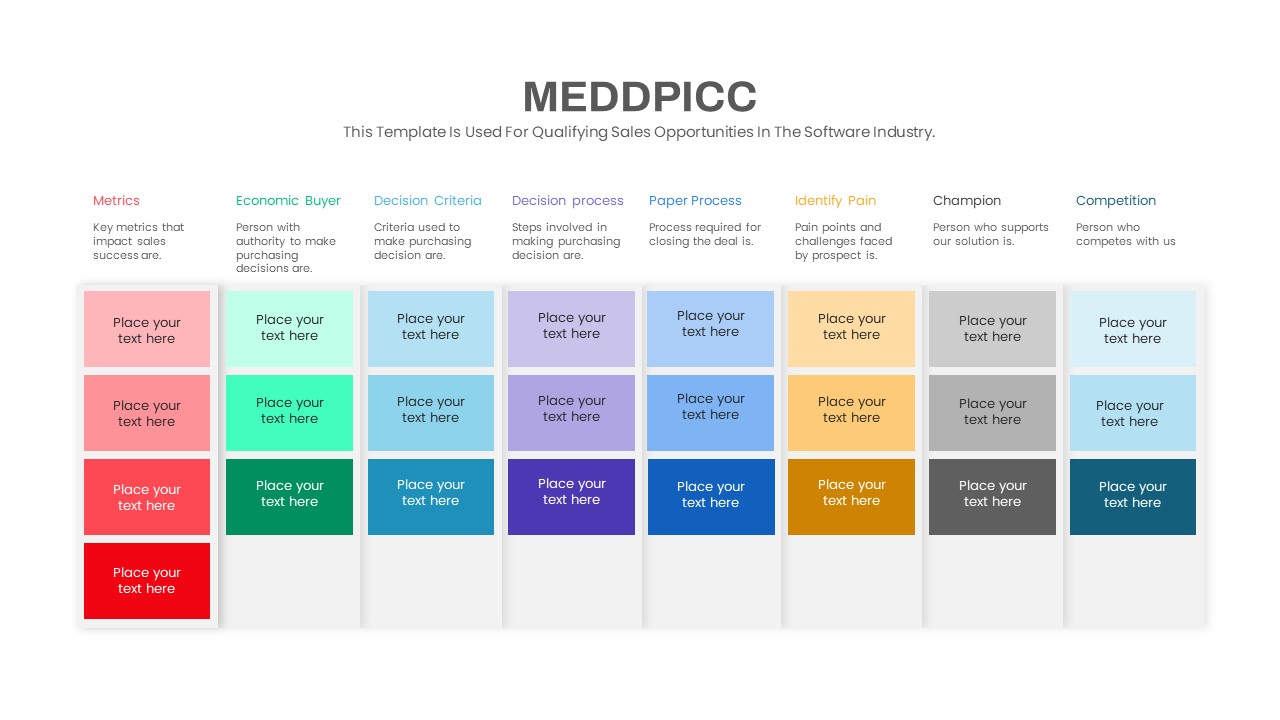
MEDDPICC Sales Qualification Framework Template for PowerPoint & Google Slides
Process
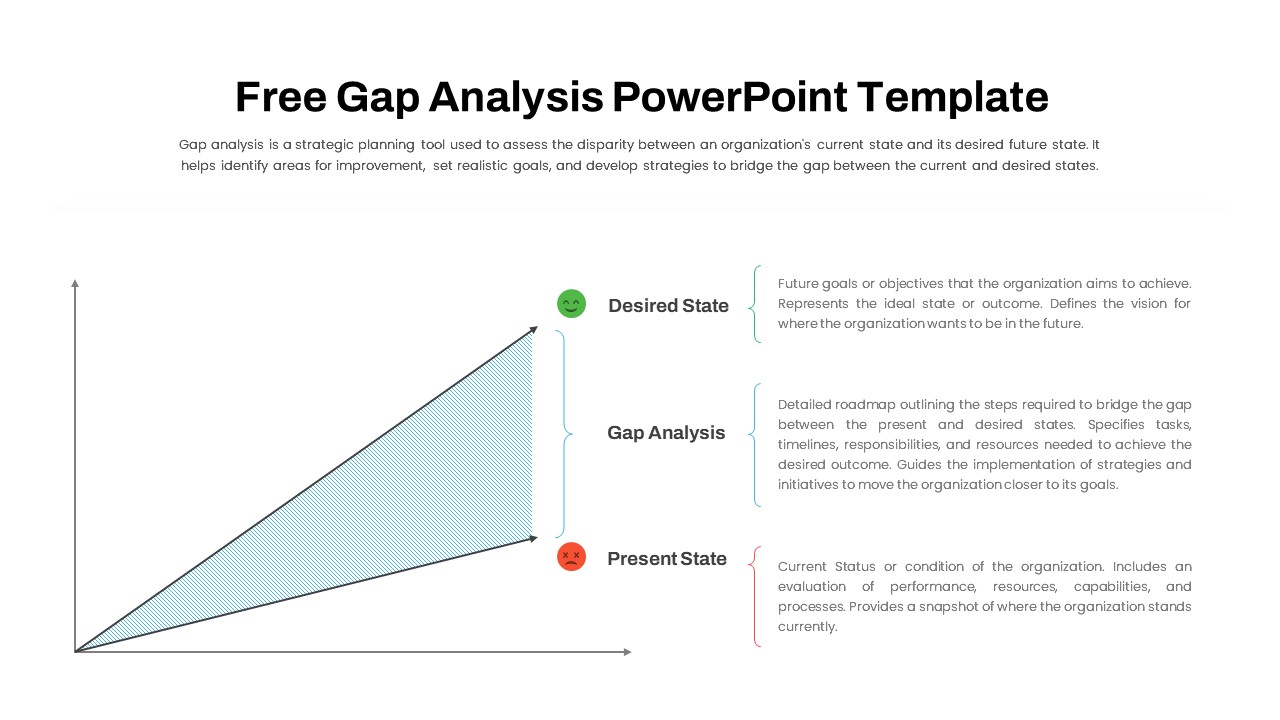
Free Comprehensive Gap Analysis Framework Template for PowerPoint & Google Slides
Opportunities Challenges
Free
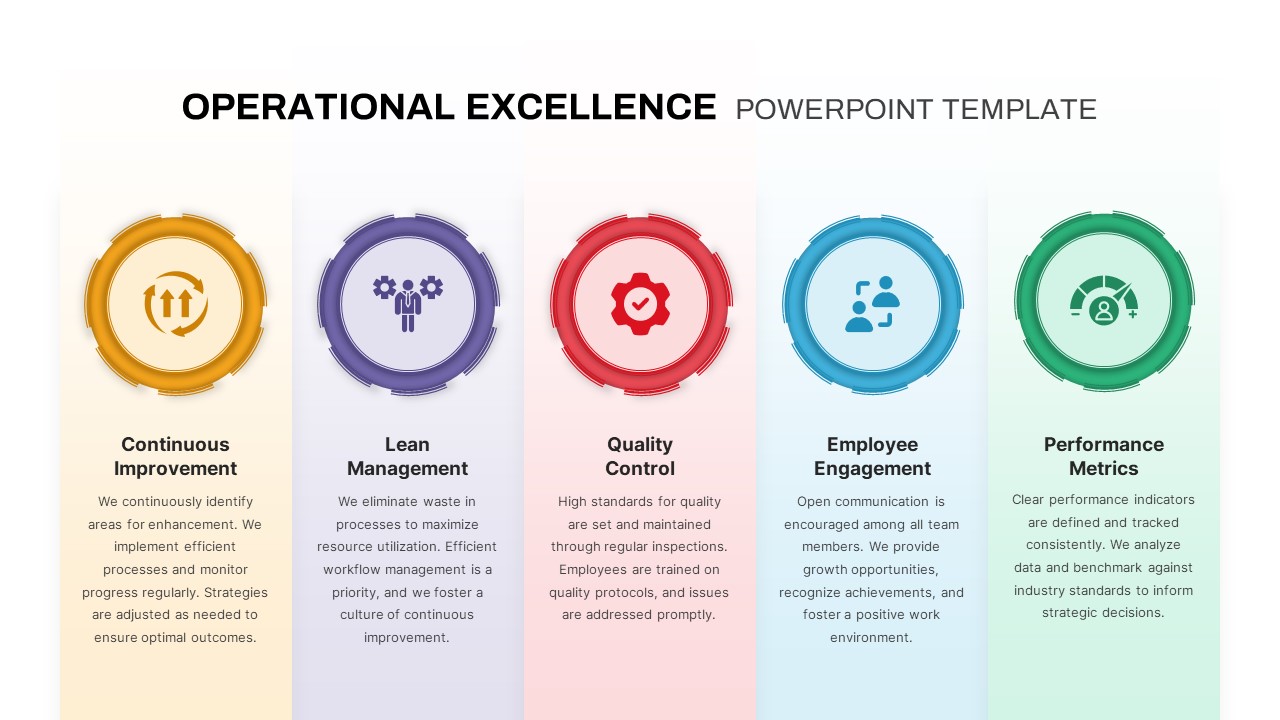
Operational Excellence Framework Template for PowerPoint & Google Slides
Business Strategy
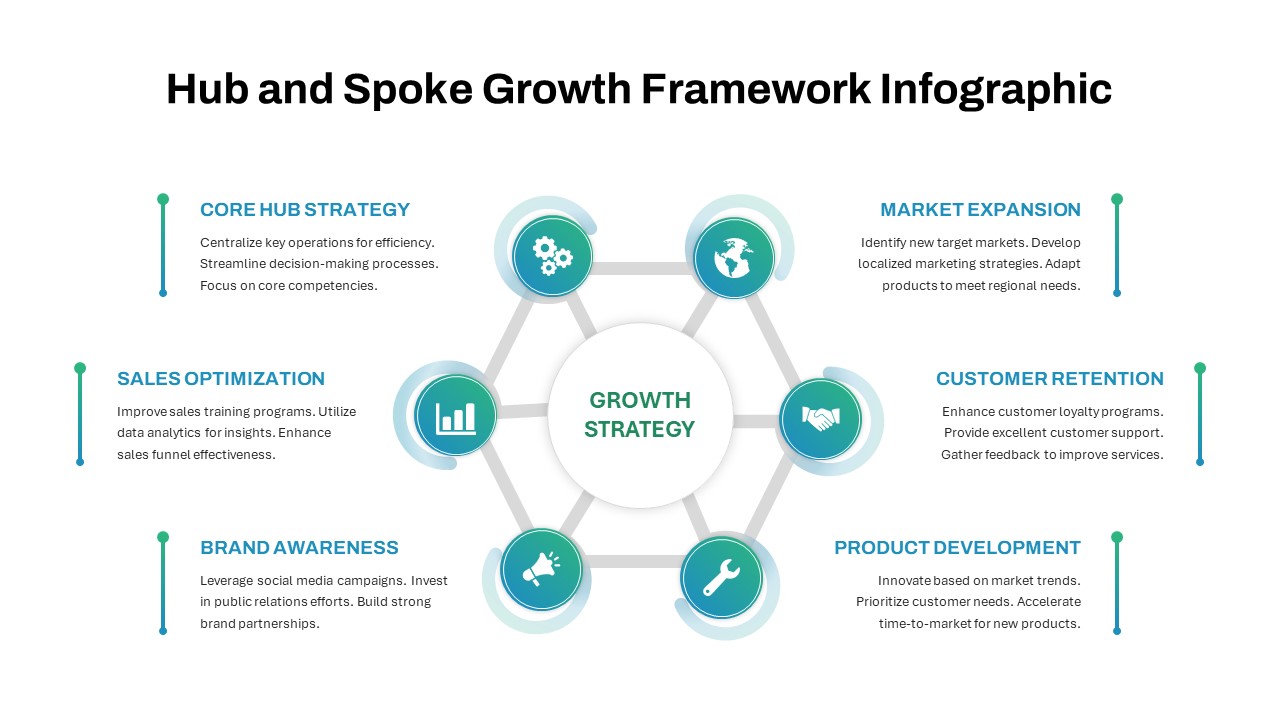
Hub and Spoke Growth Framework Template for PowerPoint & Google Slides
Circular
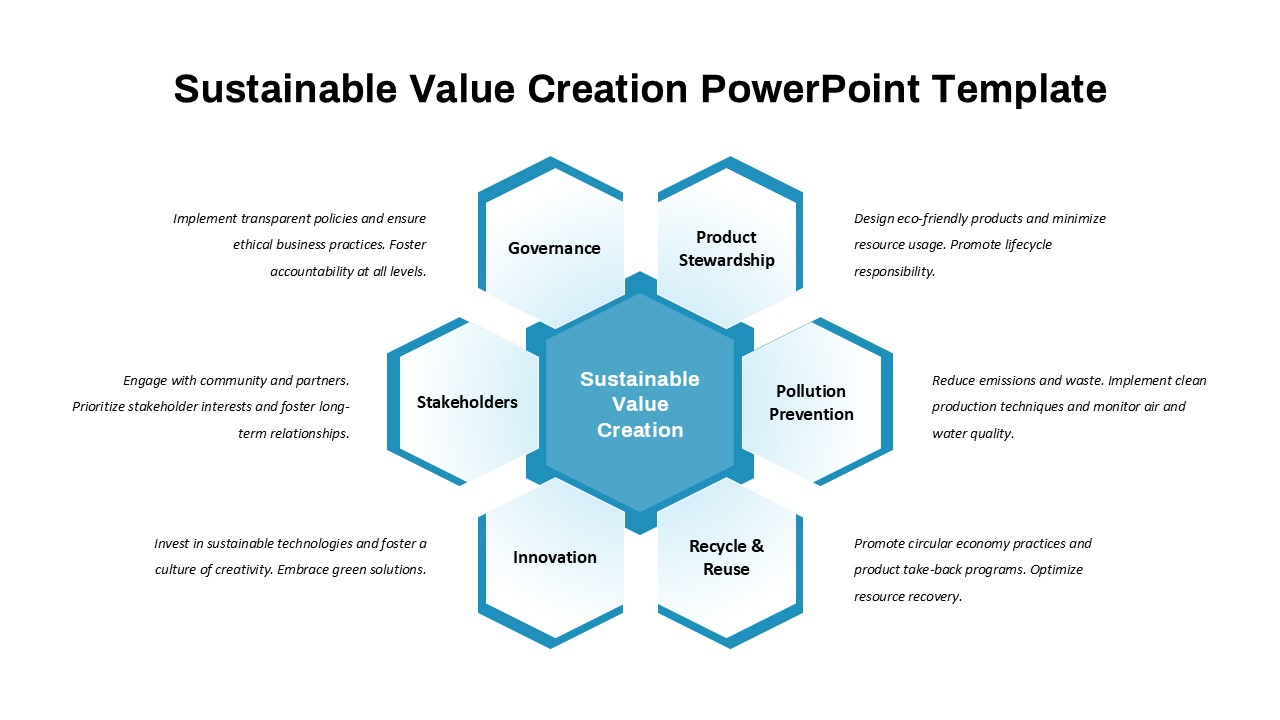
Sustainable Value Creation Framework Template for PowerPoint & Google Slides
Process
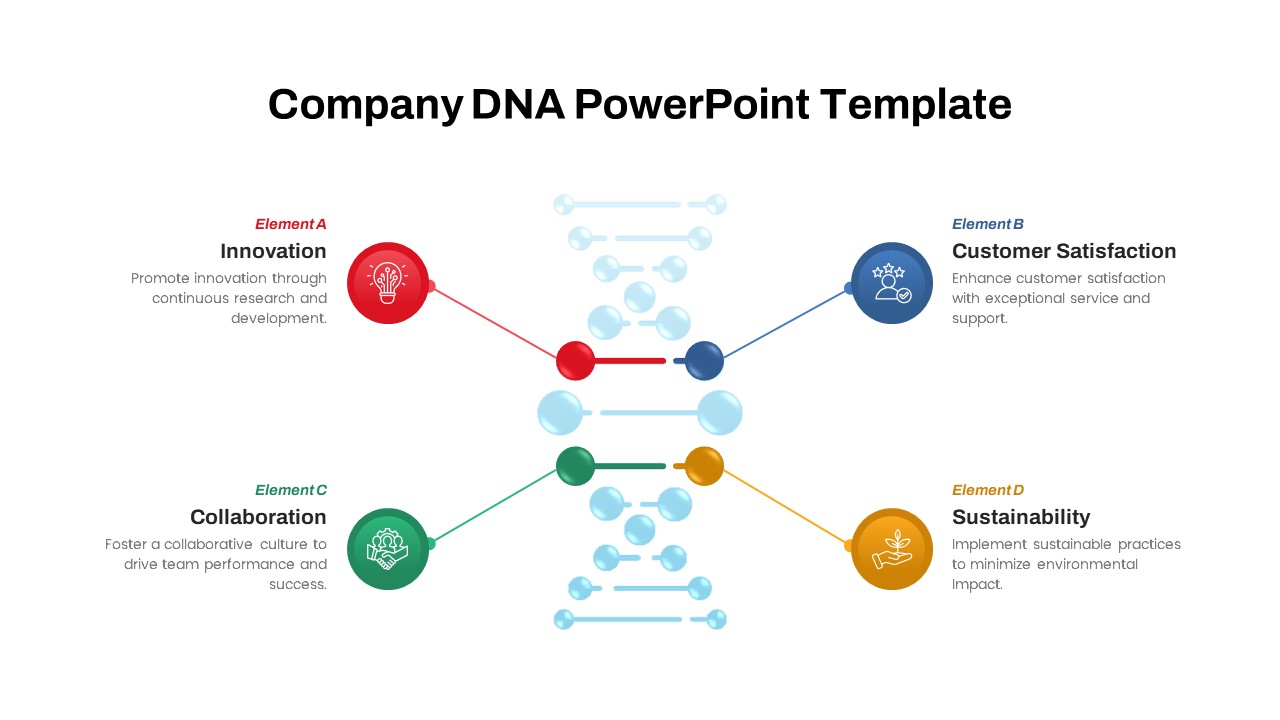
Company DNA Framework Slide Deck Template for PowerPoint & Google Slides
Circular
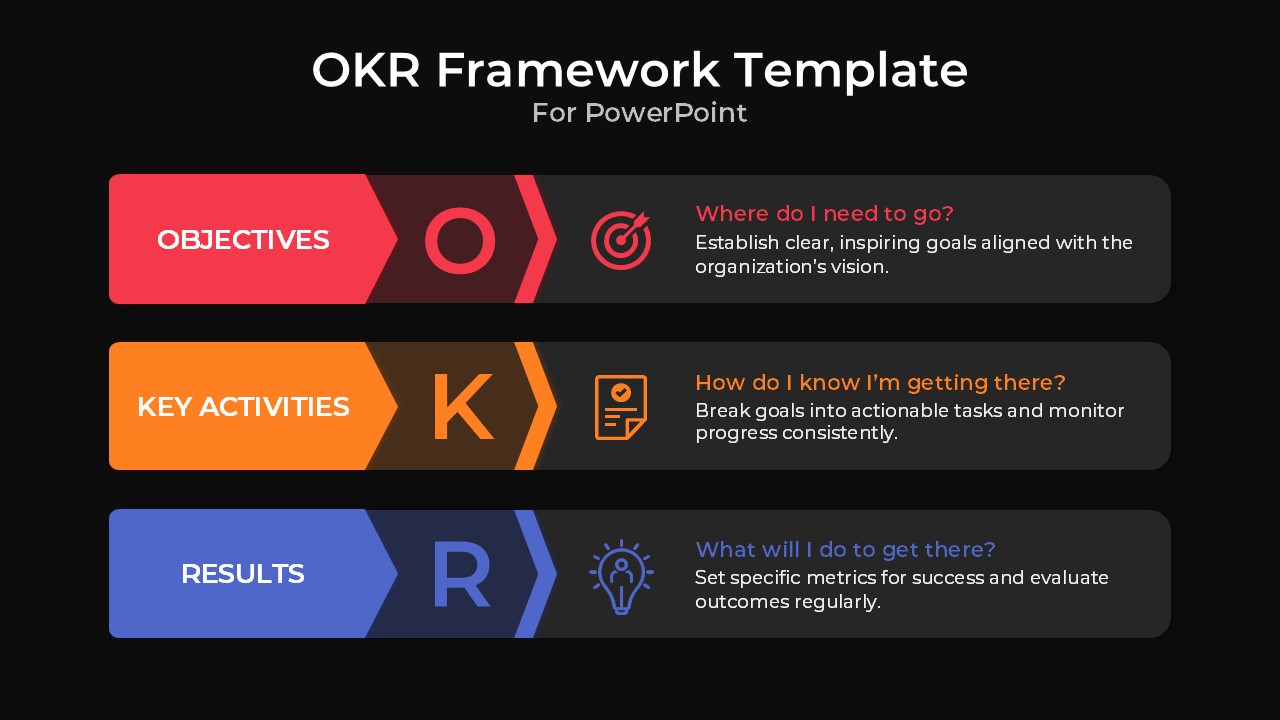
OKR Framework Template for PowerPoint & Google Slides
Process
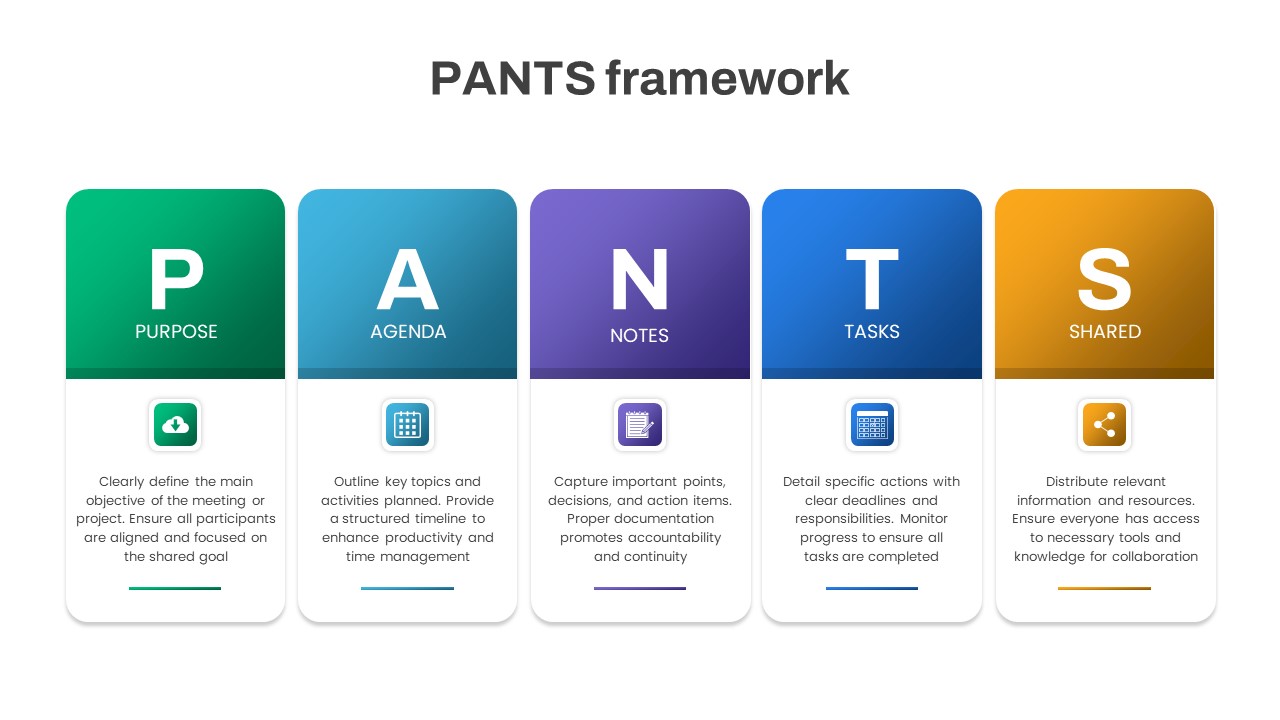
PANTS Framework for Effective Meetings Template for PowerPoint & Google Slides
Process
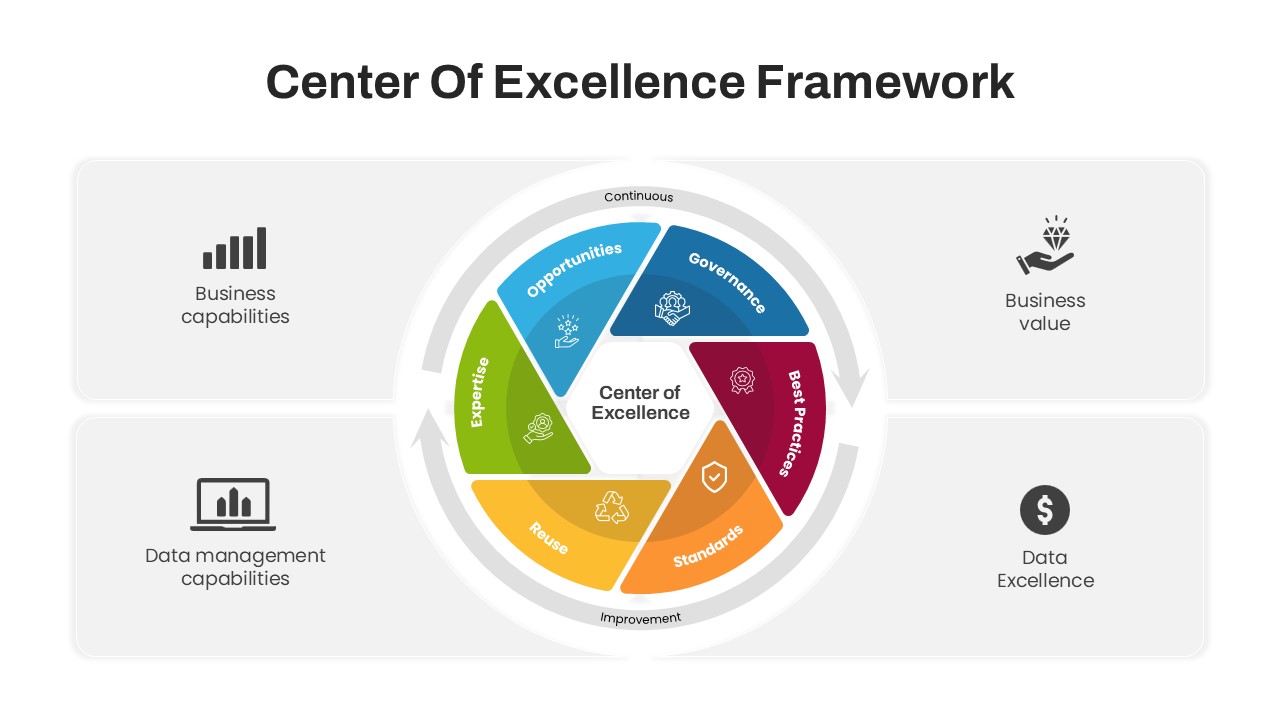
Center of Excellence Framework Template for PowerPoint & Google Slides
Circular
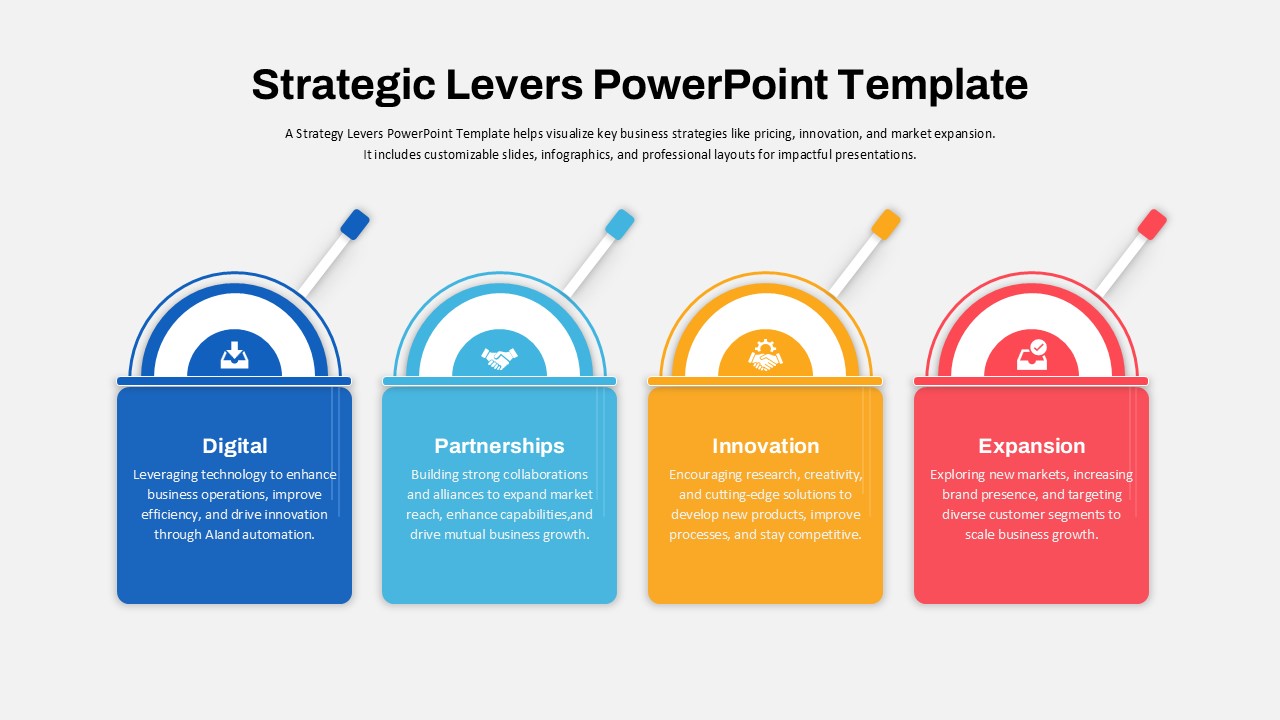
Strategic Levers Business Framework Template for PowerPoint & Google Slides
Business Strategy
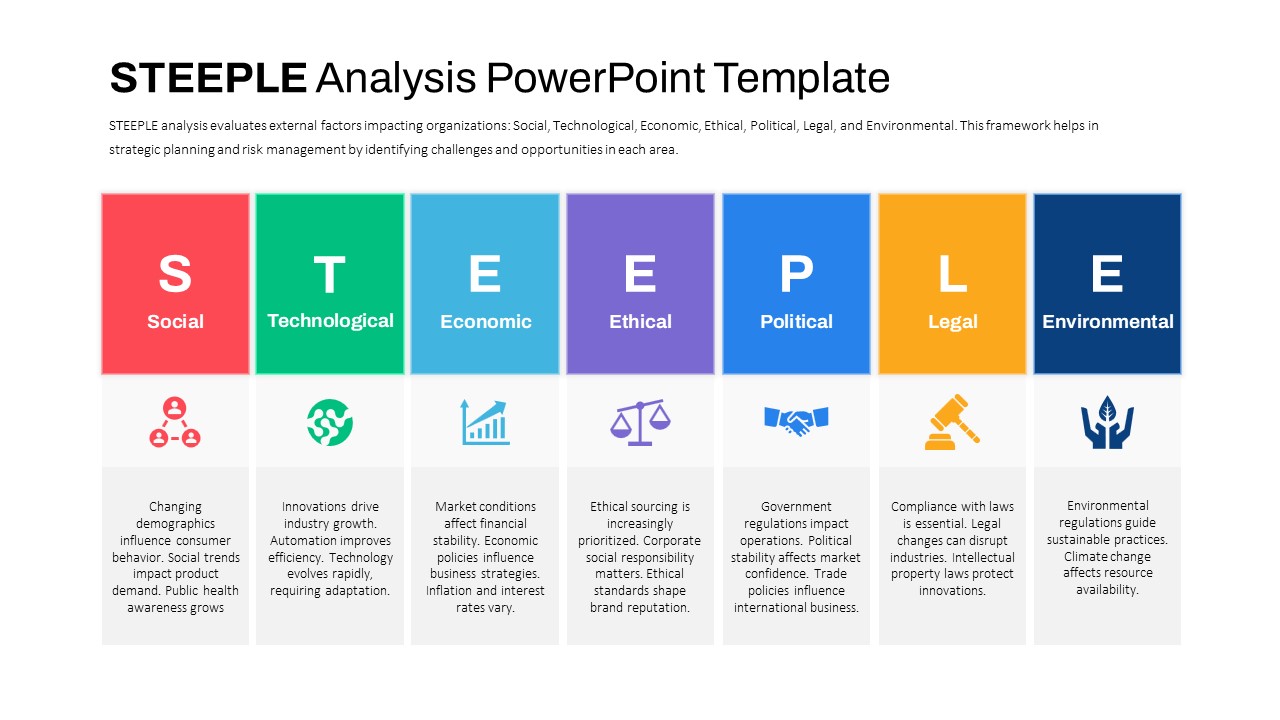
STEEPLE Analysis framework template for PowerPoint & Google Slides
Business Strategy
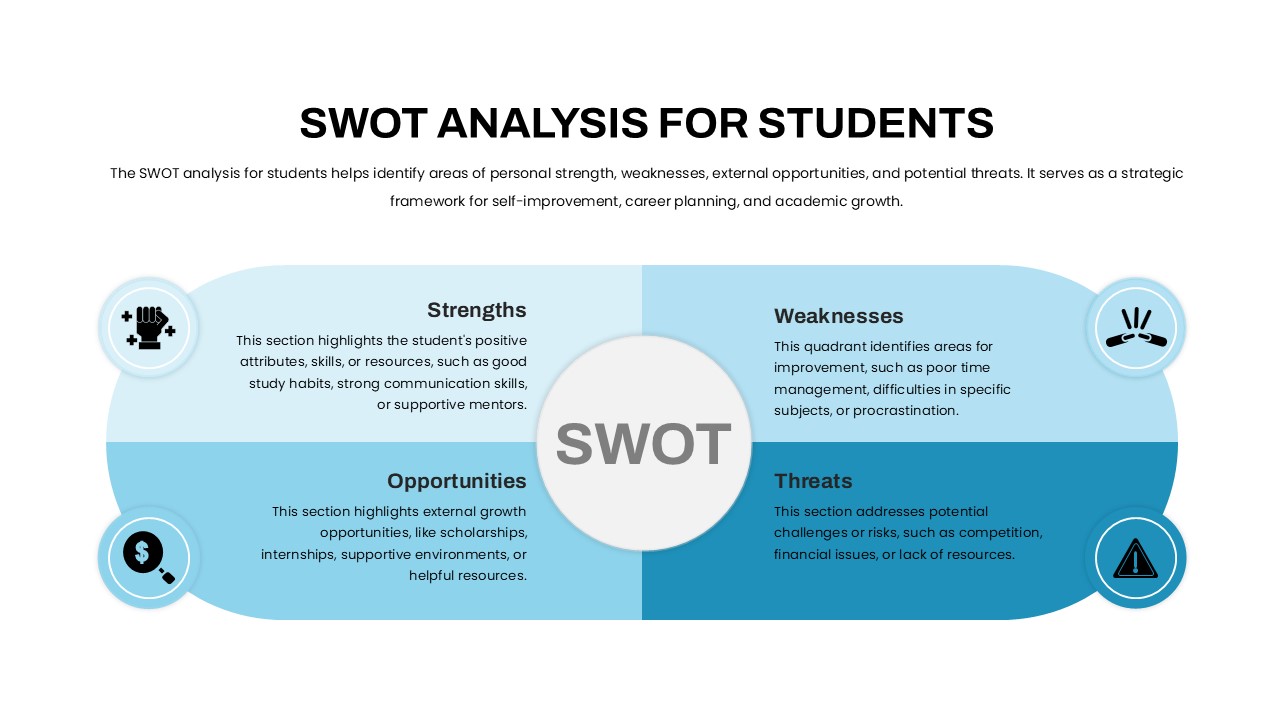
Student SWOT Analysis Framework Template for PowerPoint & Google Slides
SWOT
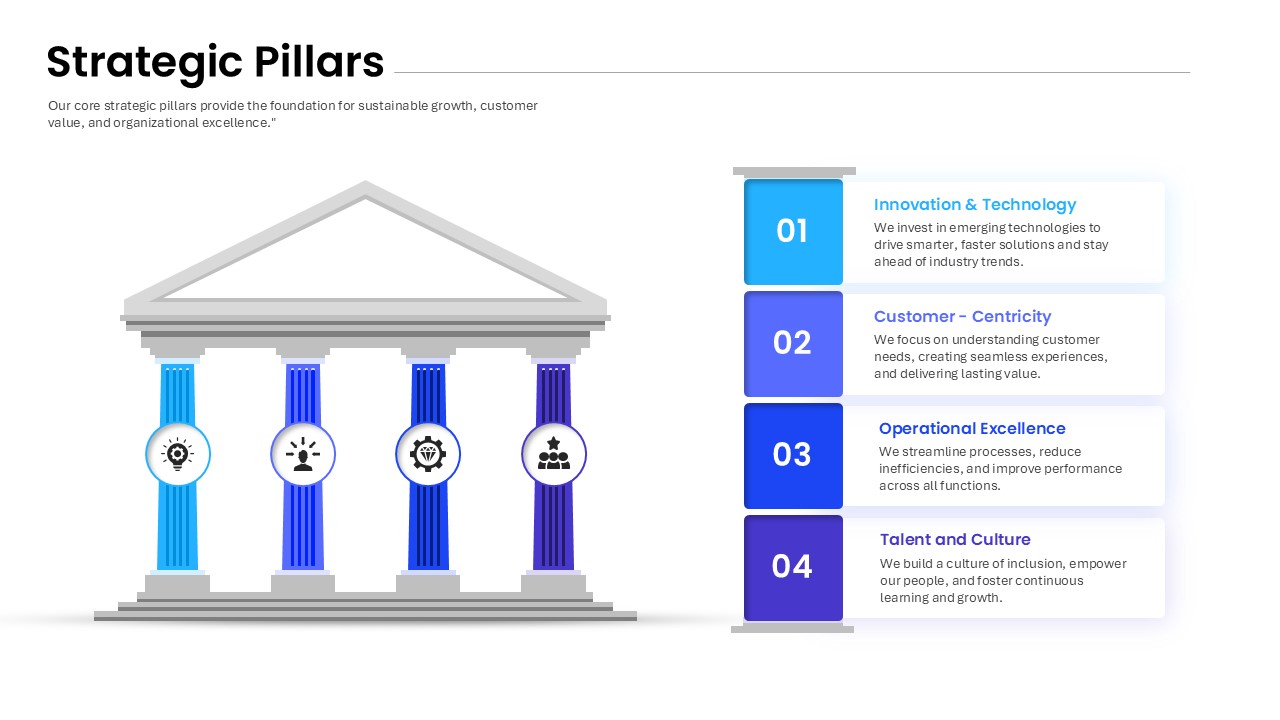
Strategic Pillars Foundation Framework Template for PowerPoint & Google Slides
Business Strategy
Personal Branding Canvas Framework Template for PowerPoint & Google Slides
Circular
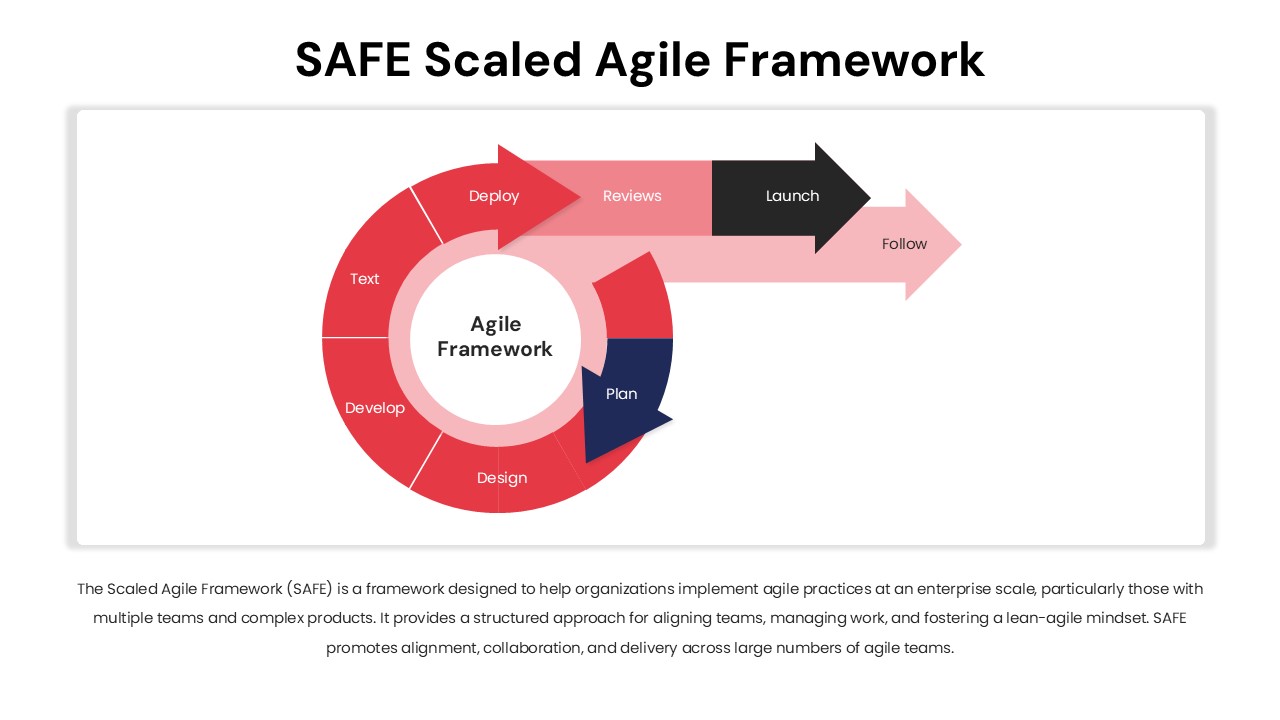
SAFE Scaled Agile Framework Template for PowerPoint & Google Slides
Process
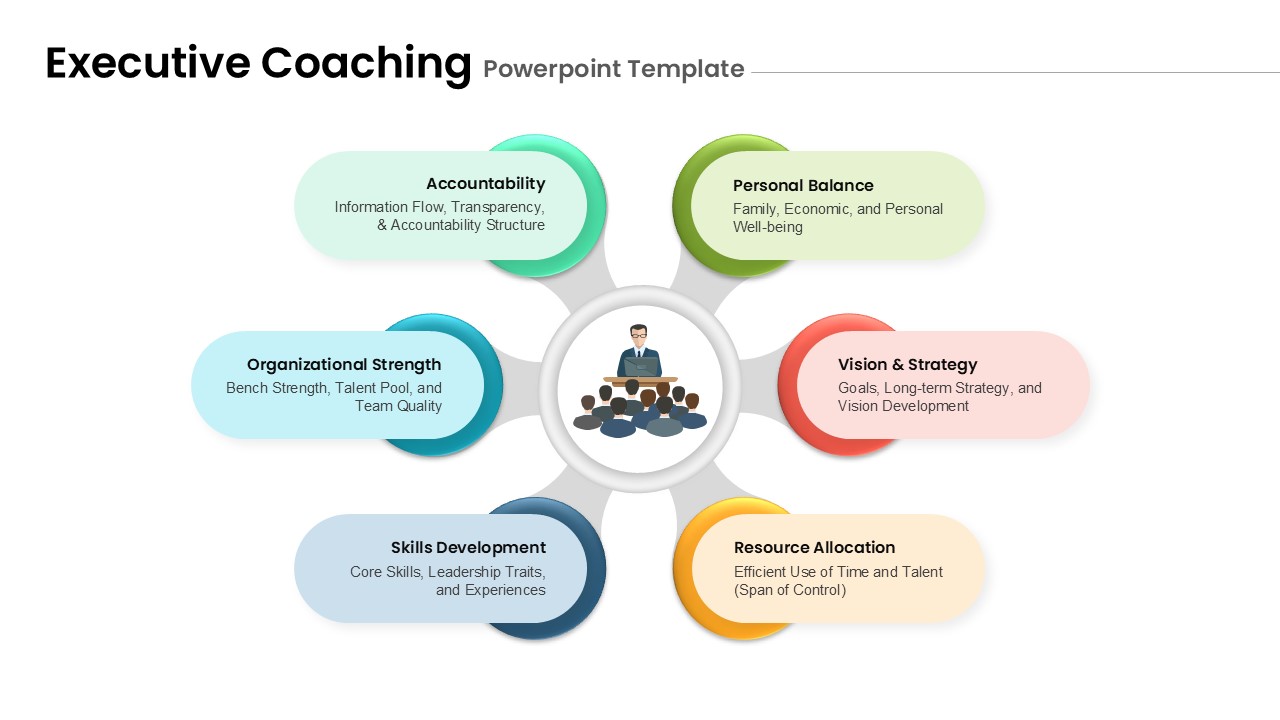
Executive Coaching Framework template for PowerPoint & Google Slides
Leadership
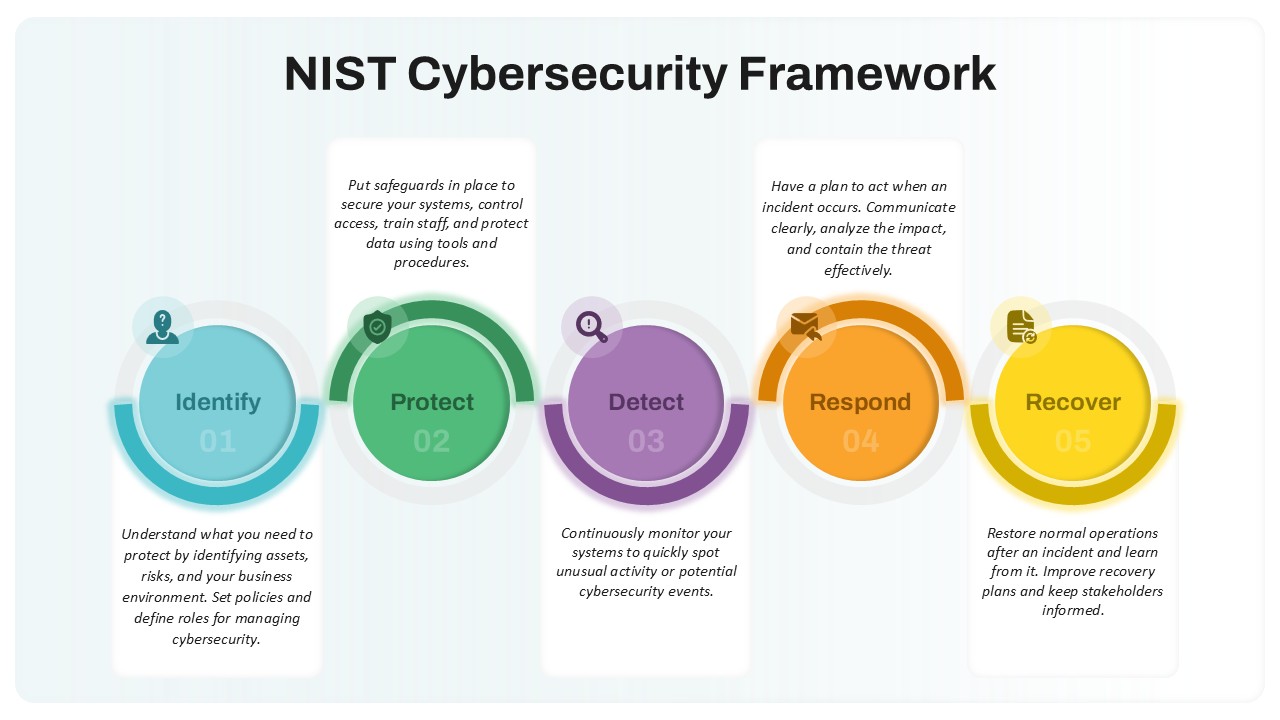
NIST Cybersecurity Framework Overview template for PowerPoint & Google Slides
Technology
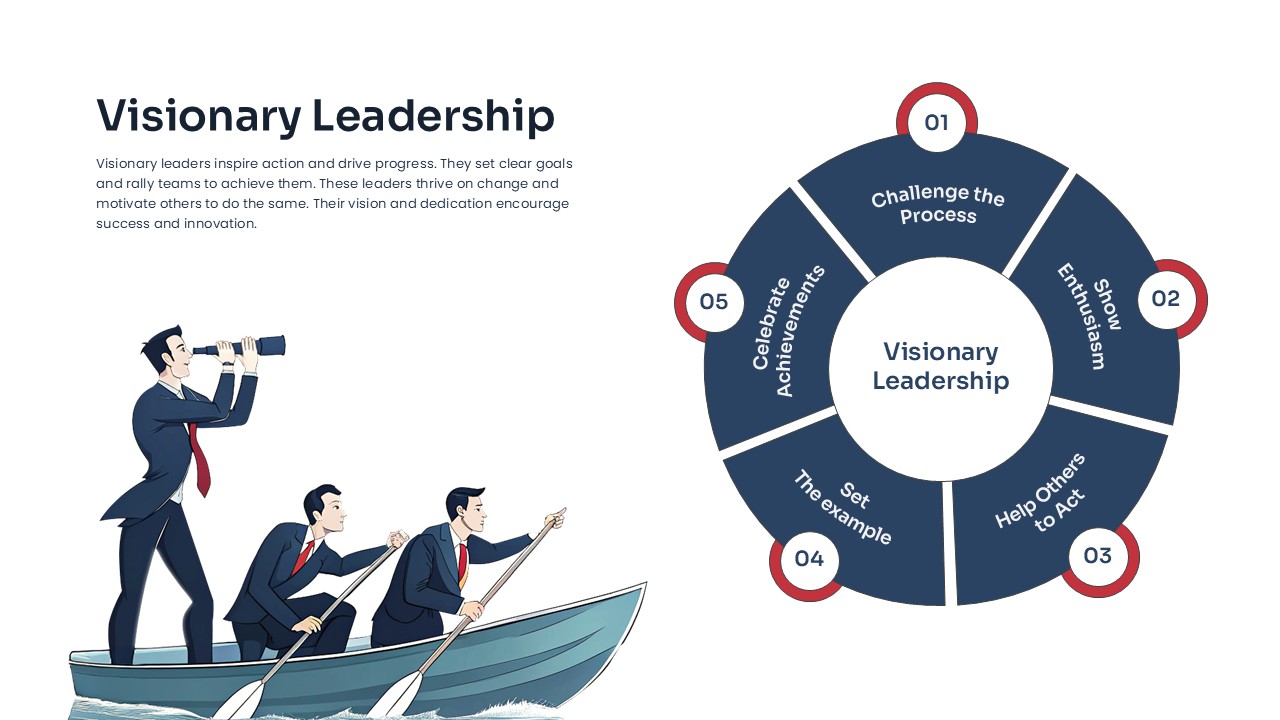
Visionary Leadership Framework template for PowerPoint & Google Slides
Business

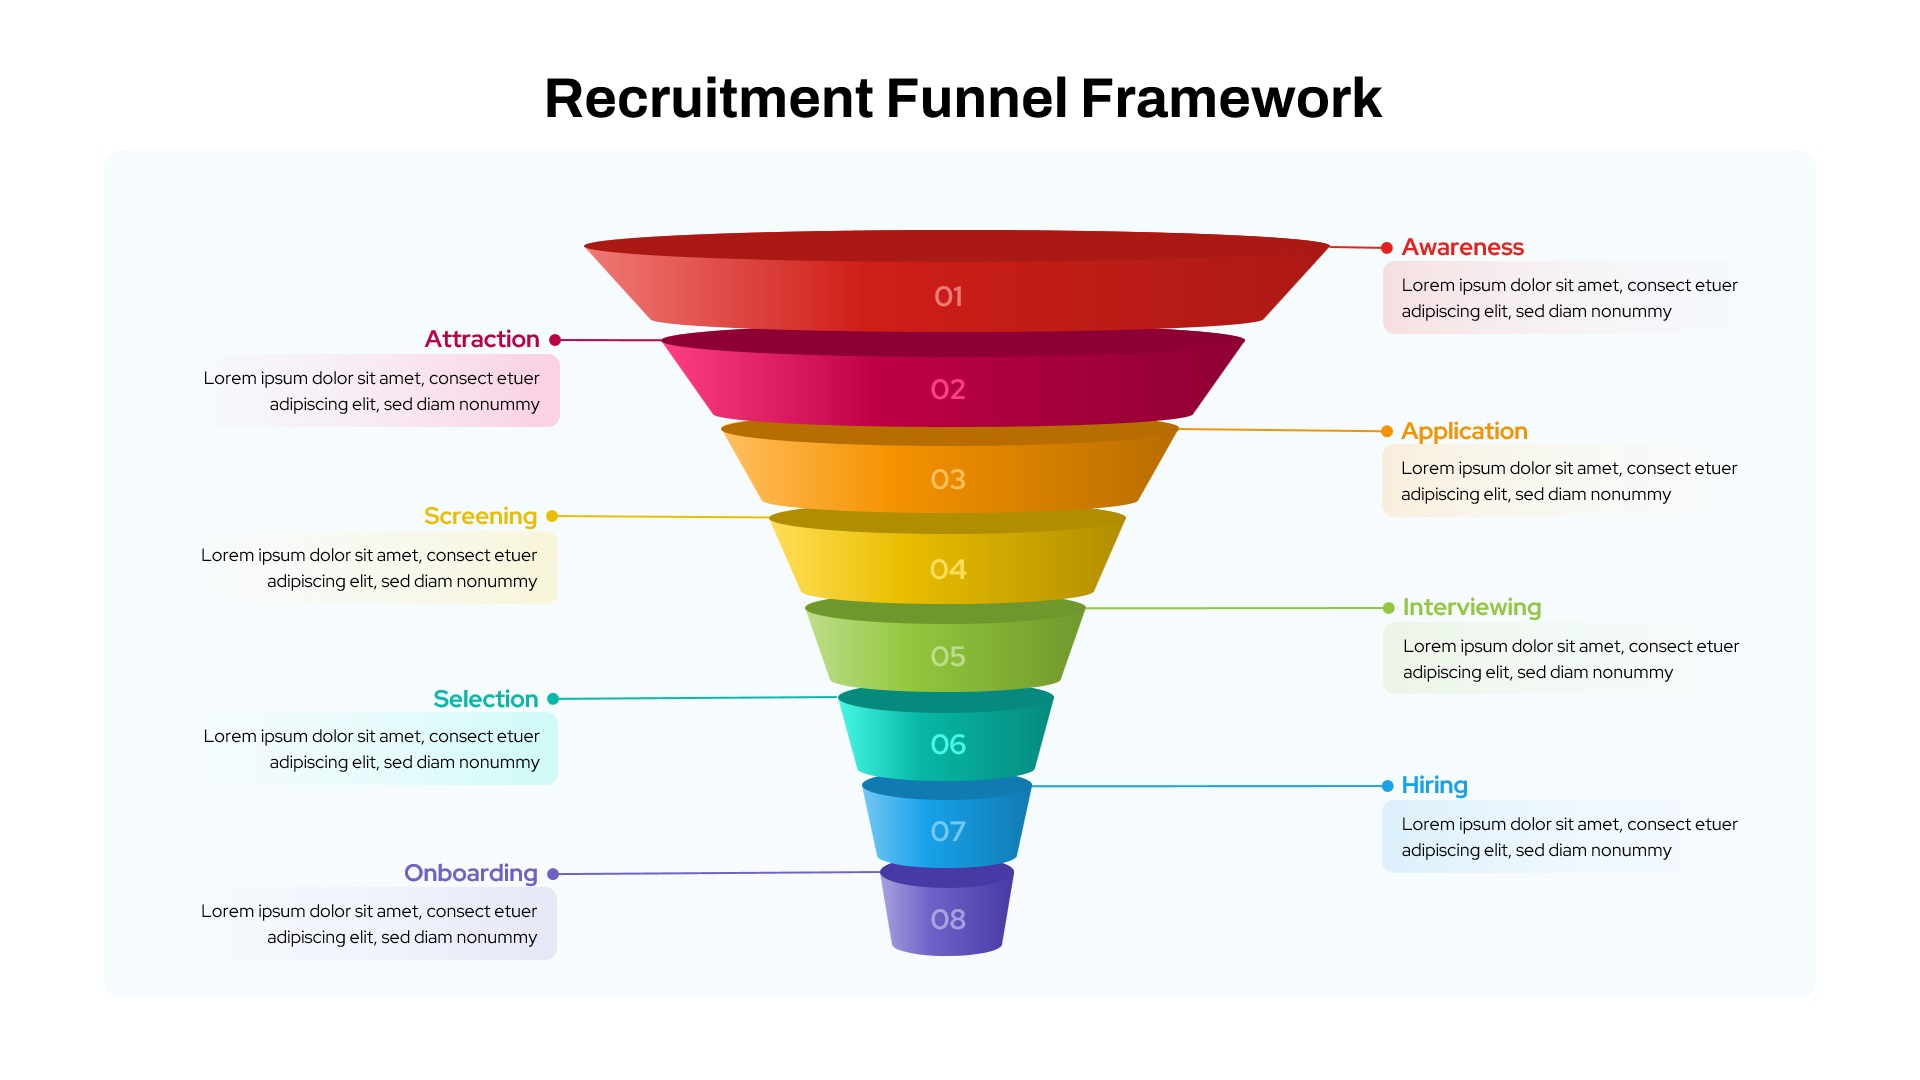
Recruitment Funnel Framework template for PowerPoint & Google Slides
Recruitment
Pirate Metrics AARRR Funnel Framework Template for PowerPoint & Google Slides
Funnel
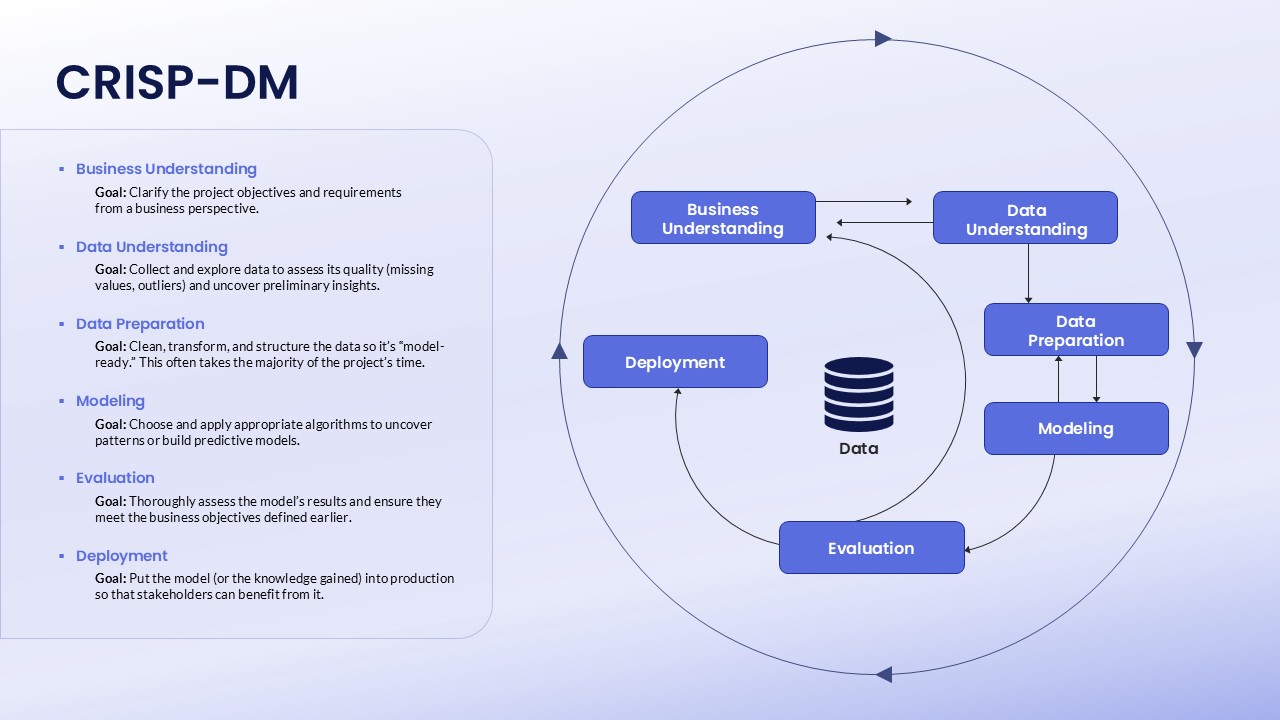
CRISP-DM Process Framework template for PowerPoint & Google Slides
Technology
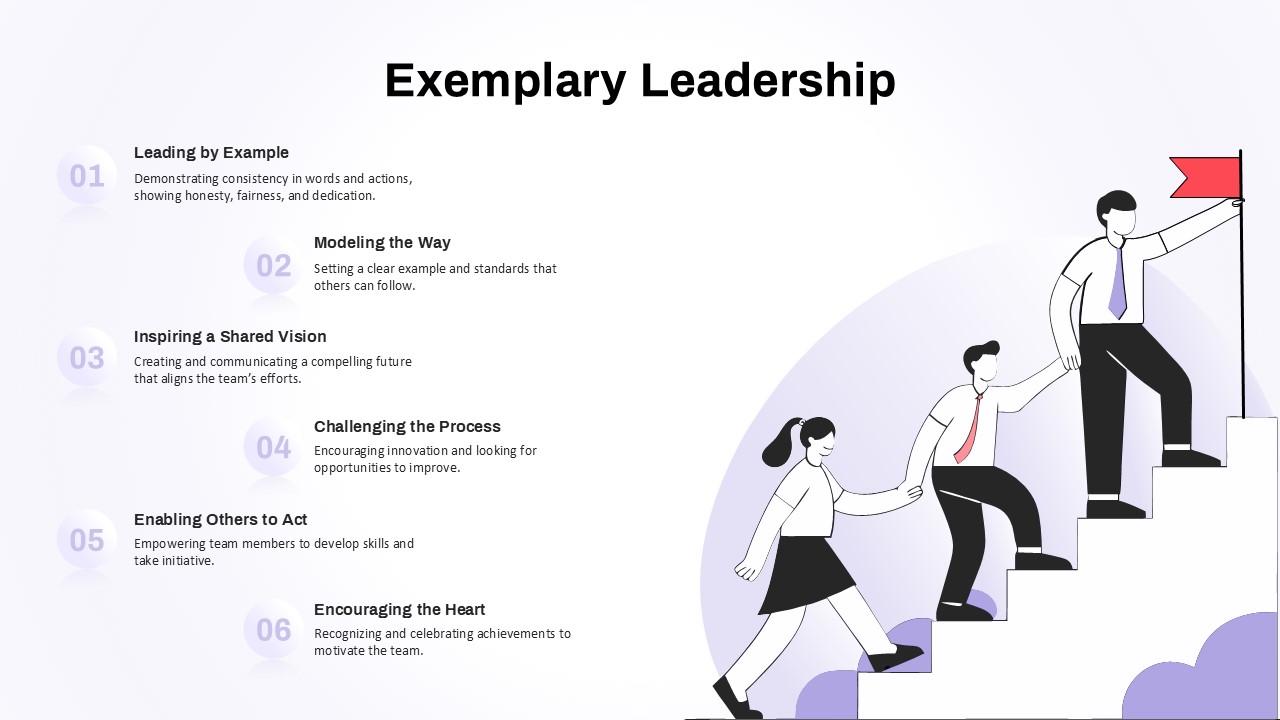
Exemplary Leadership Framework template for PowerPoint & Google Slides
Business
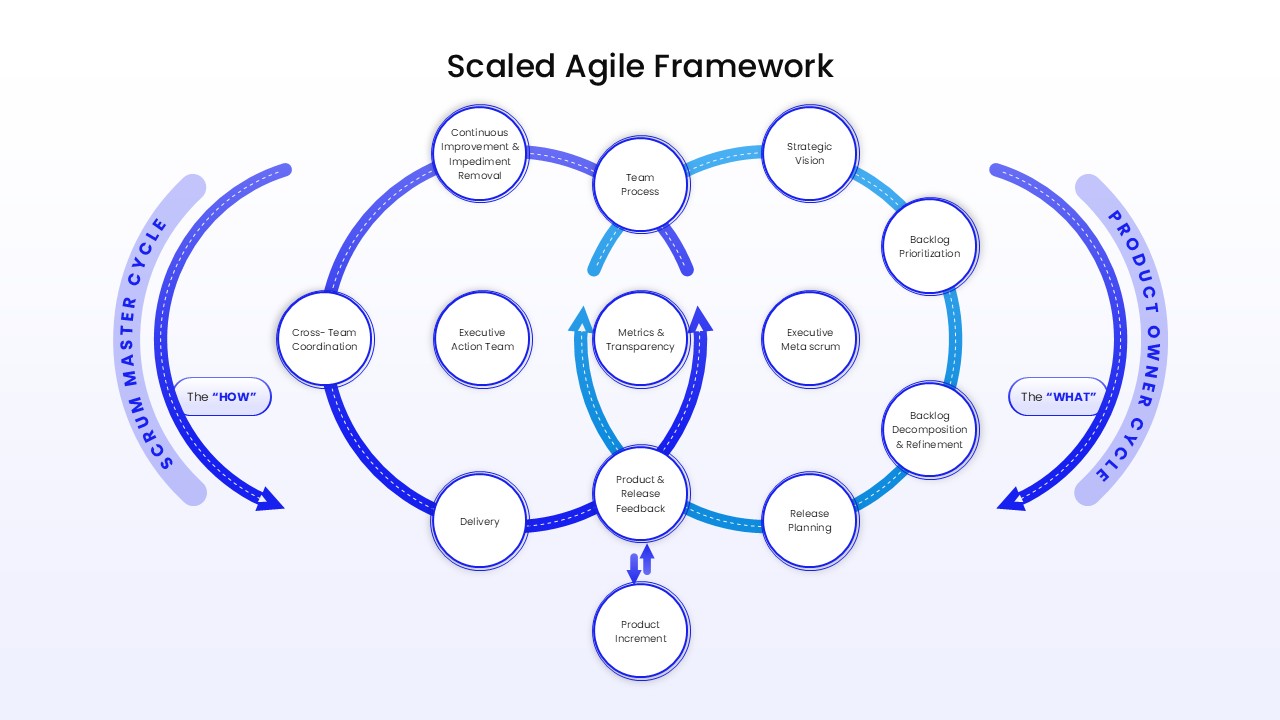
Two-Cycle Scaled Agile Framework Template for PowerPoint & Google Slides
Scrum
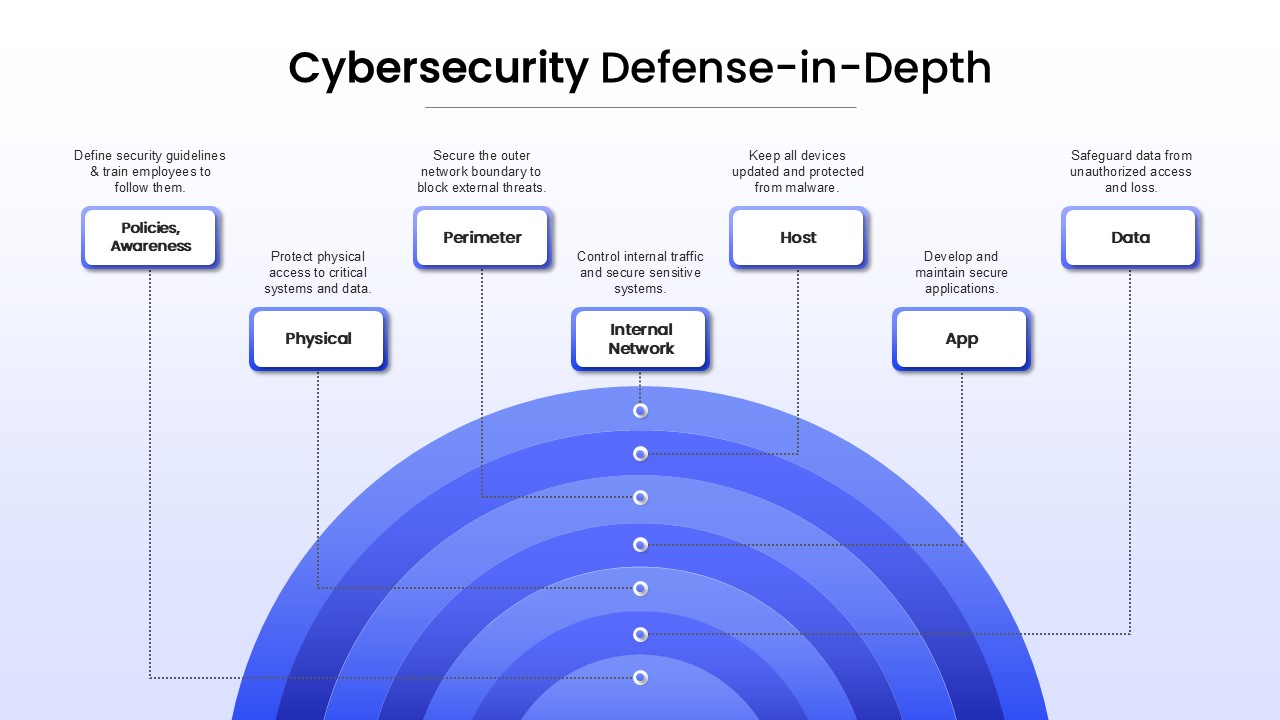
Cybersecurity Defense-in-Depth Framework template for PowerPoint & Google Slides
Technology
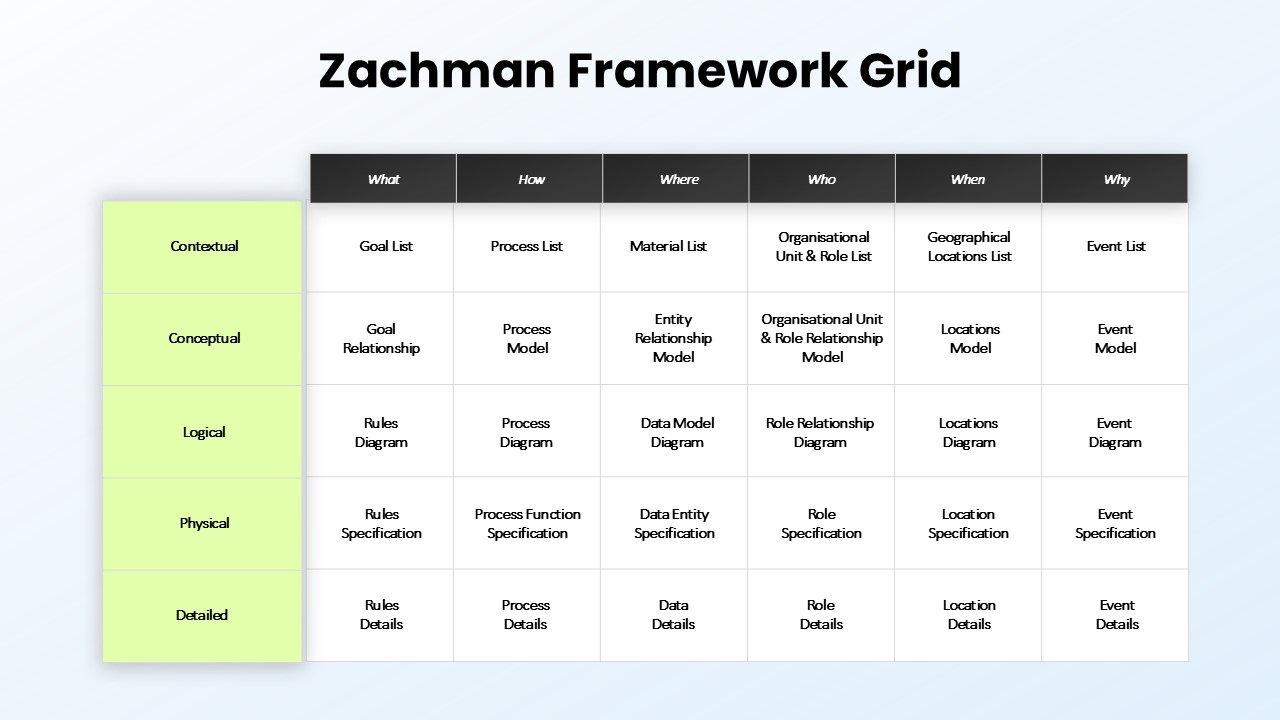
Zachman Framework Grid Overview template for PowerPoint & Google Slides
Process
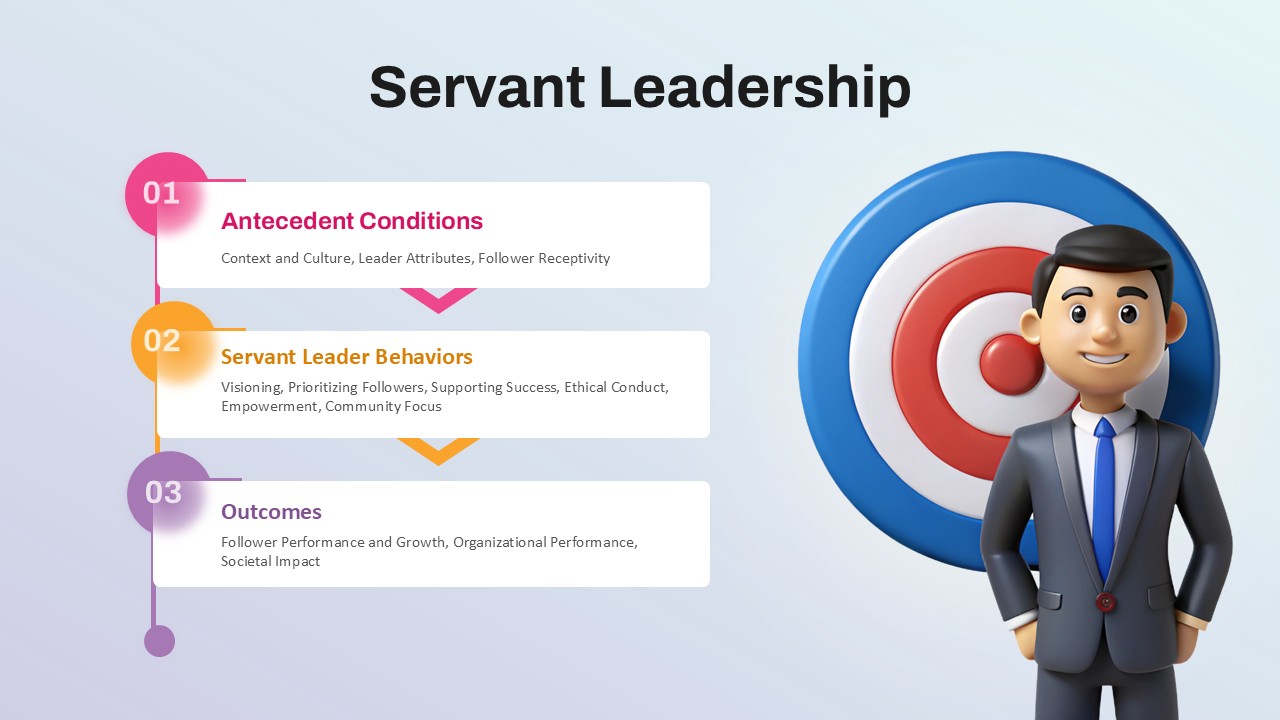
Three-Step Servant Leadership Framework Template for PowerPoint & Google Slides
Leadership
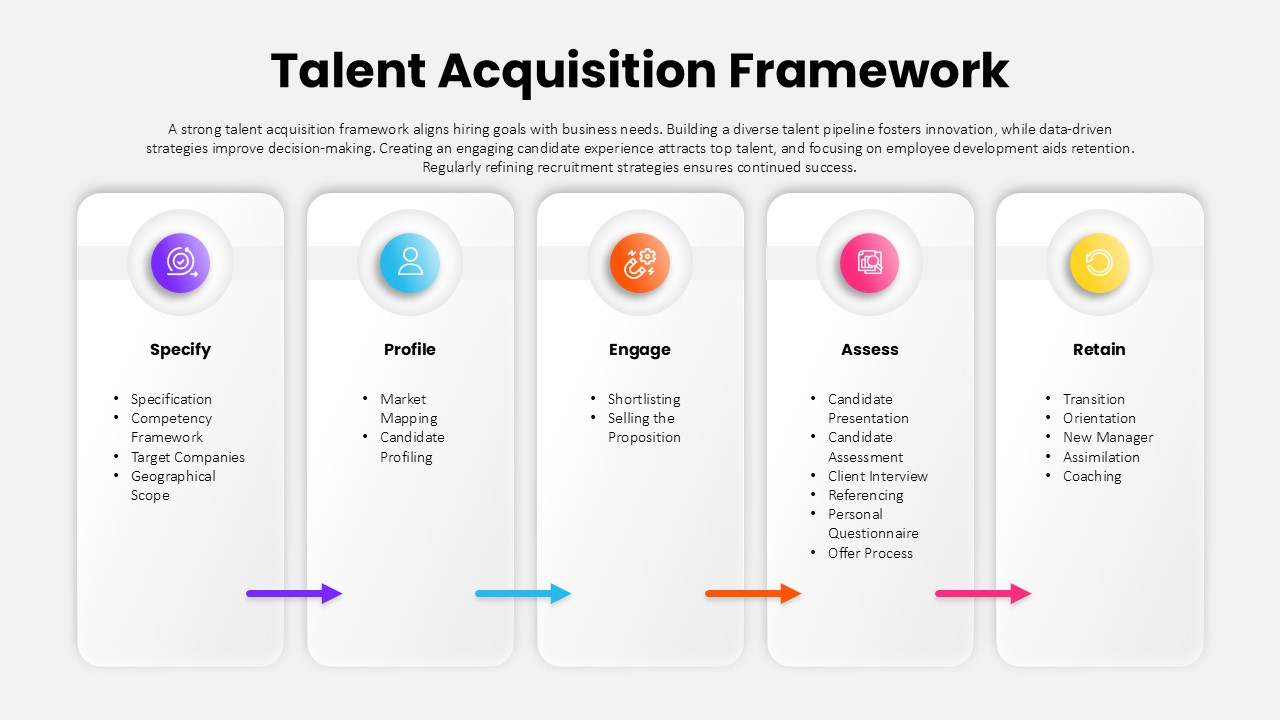
Talent Acquisition Framework Overview template for PowerPoint & Google Slides
Business Strategy
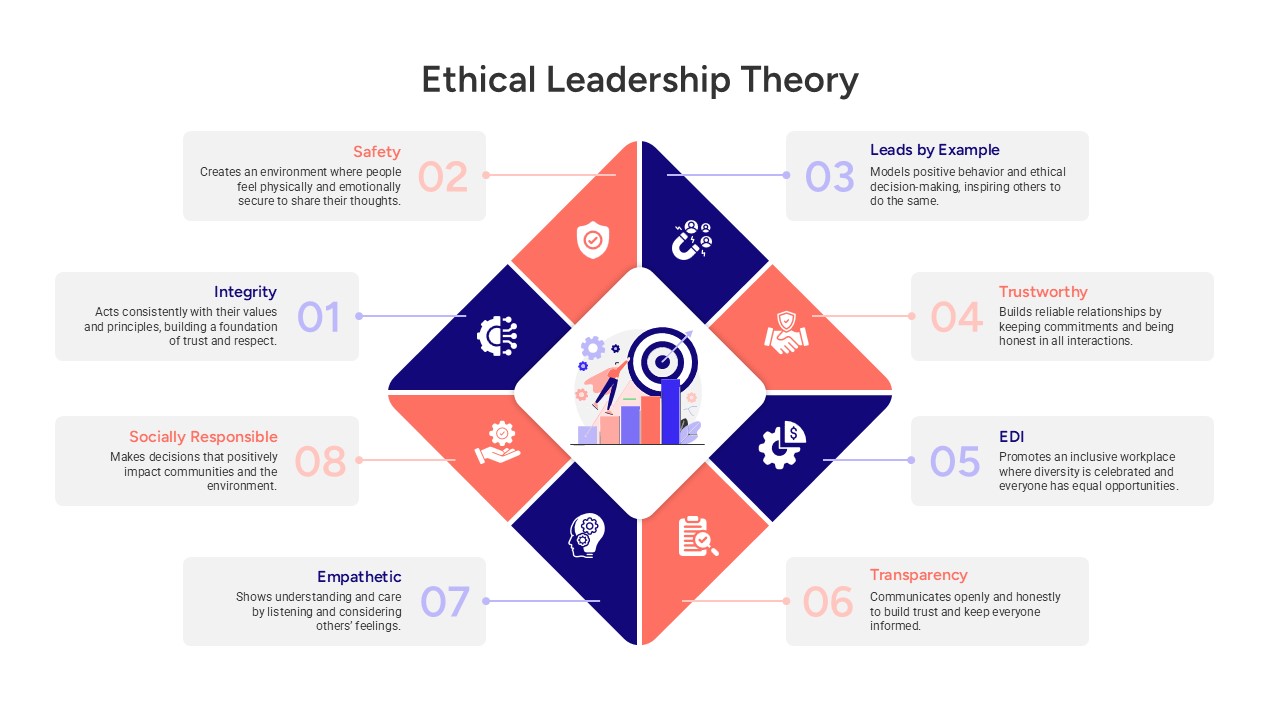
Ethical Leadership Theory Framework Template for PowerPoint & Google Slides
Leadership
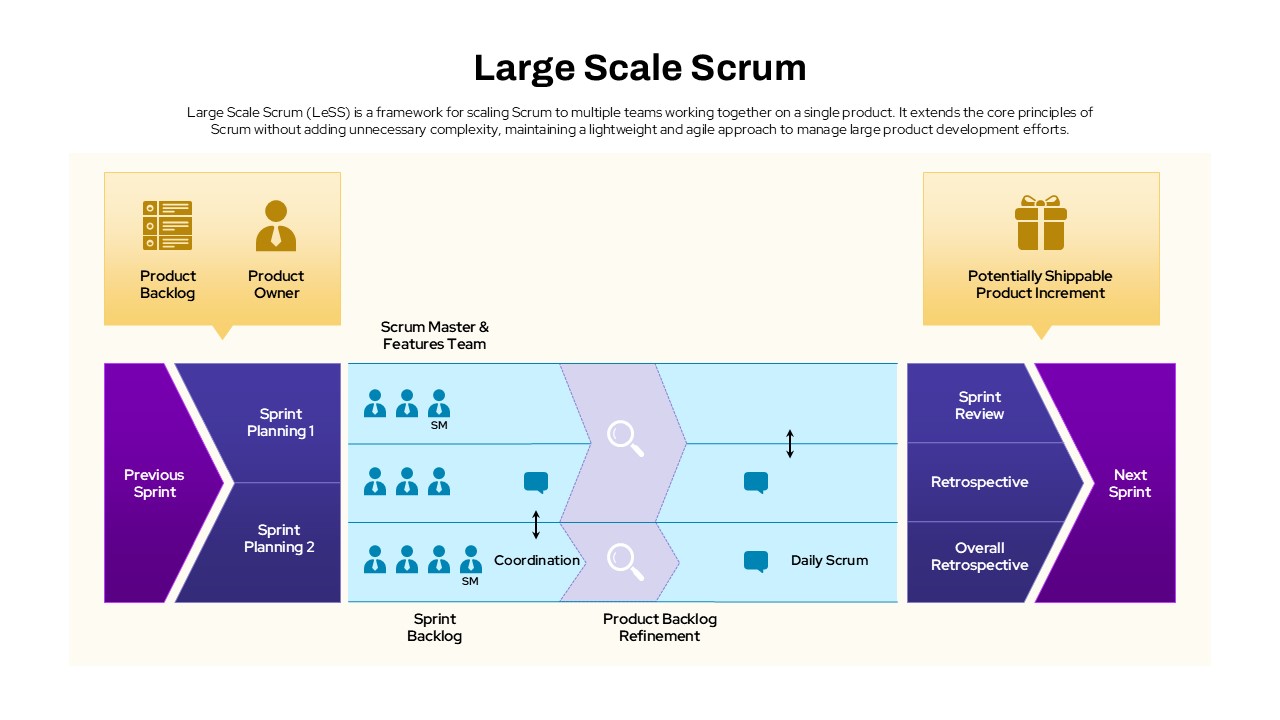
Large Scale Scrum Framework Process Template for PowerPoint & Google Slides
Scrum
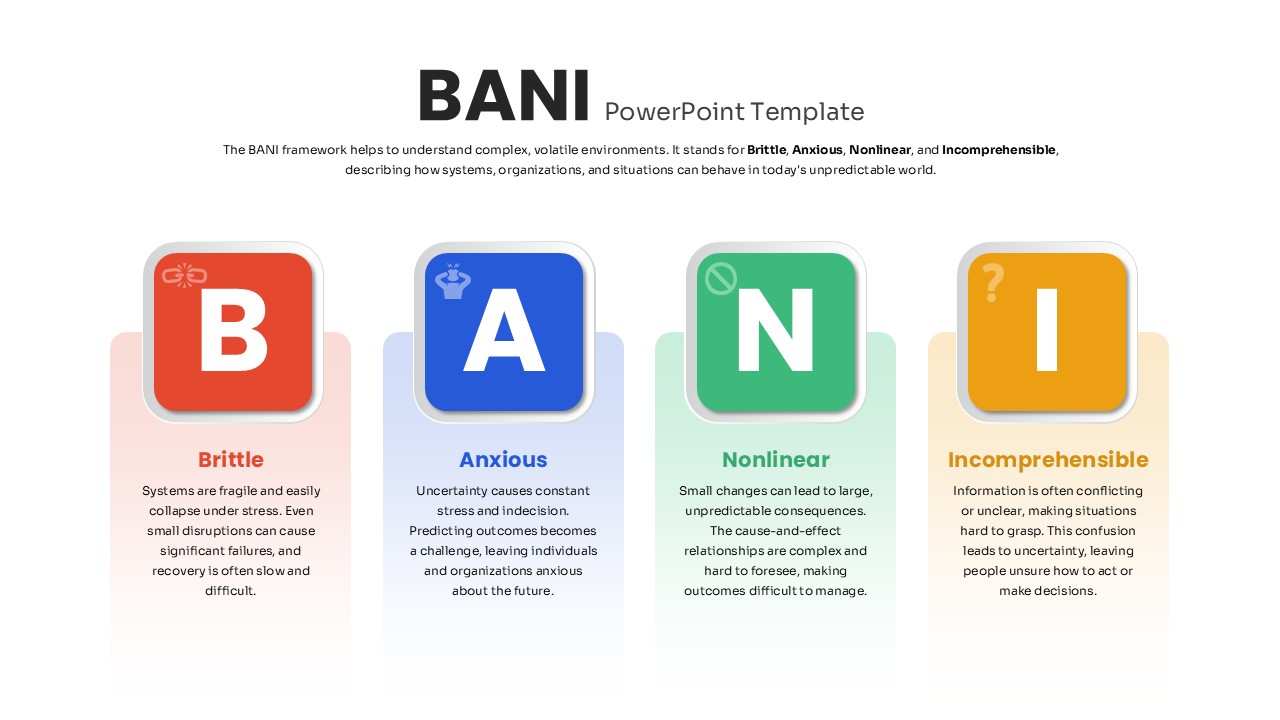
Four-Part BANI Framework Overview Template for PowerPoint & Google Slides
PEST
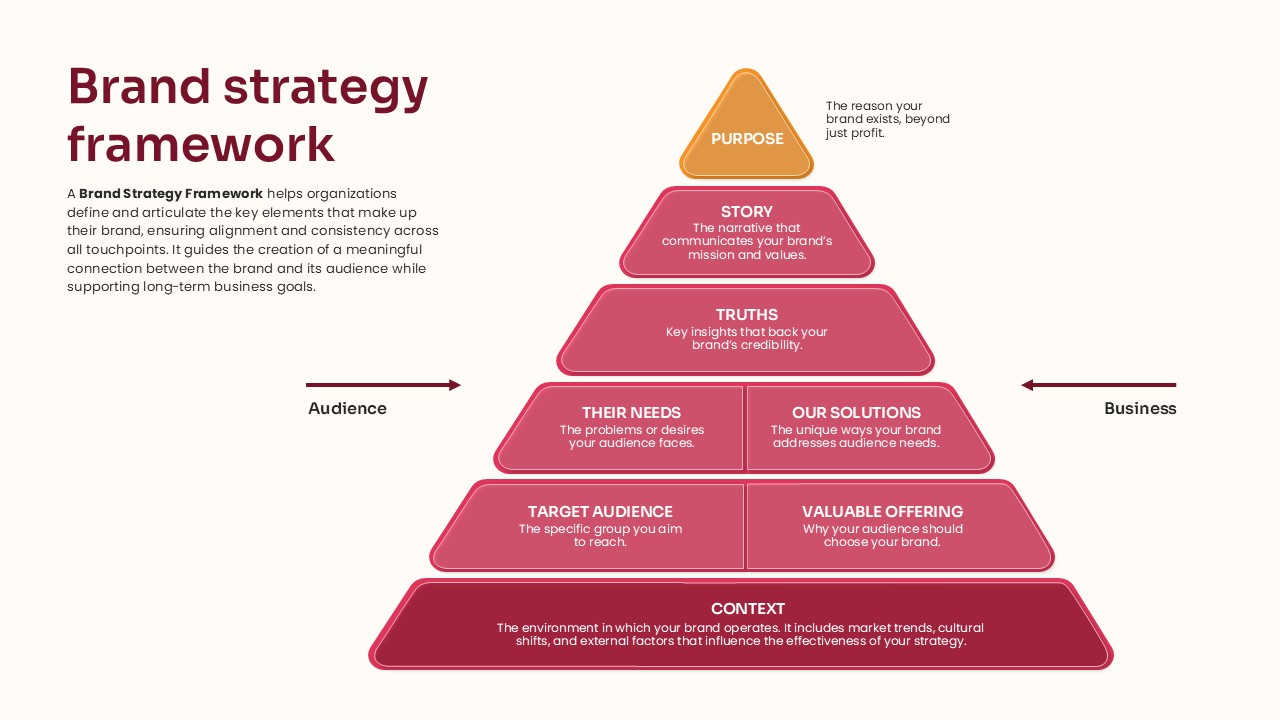
Pyramid Brand Strategy Framework Template for PowerPoint & Google Slides
Business Strategy
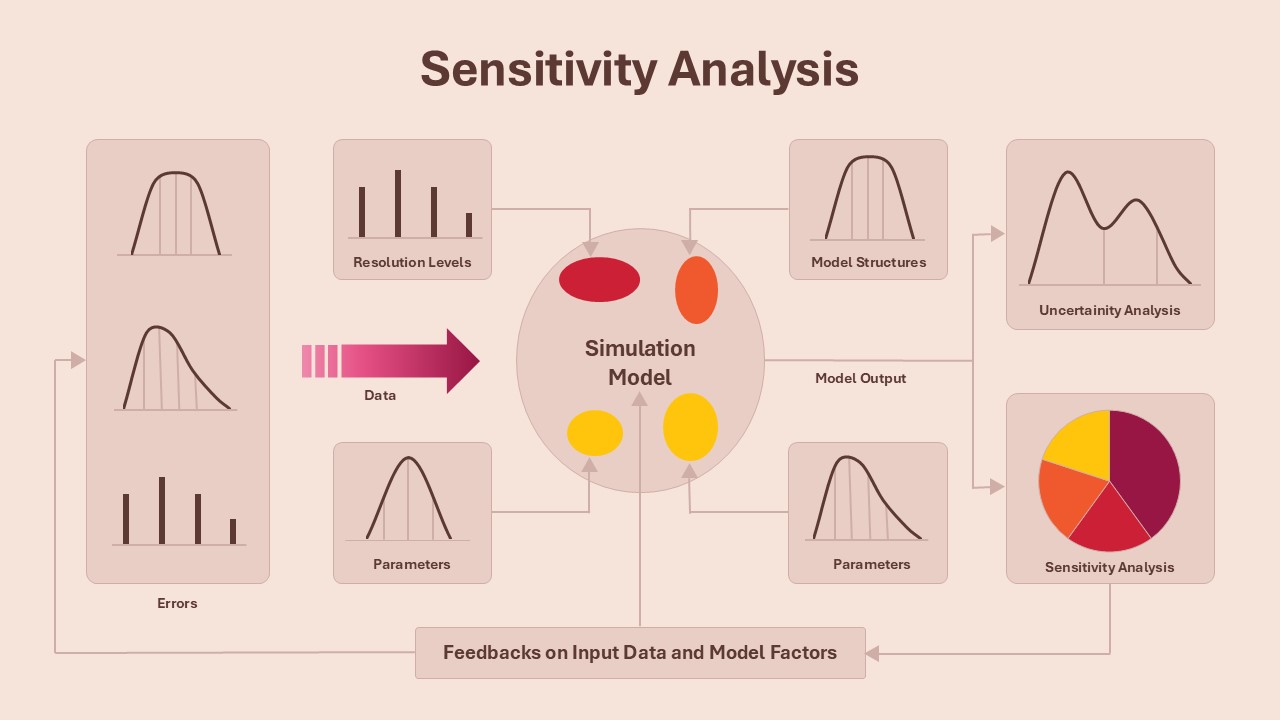
Sensitivity Analysis Framework template for PowerPoint & Google Slides
Business Strategy
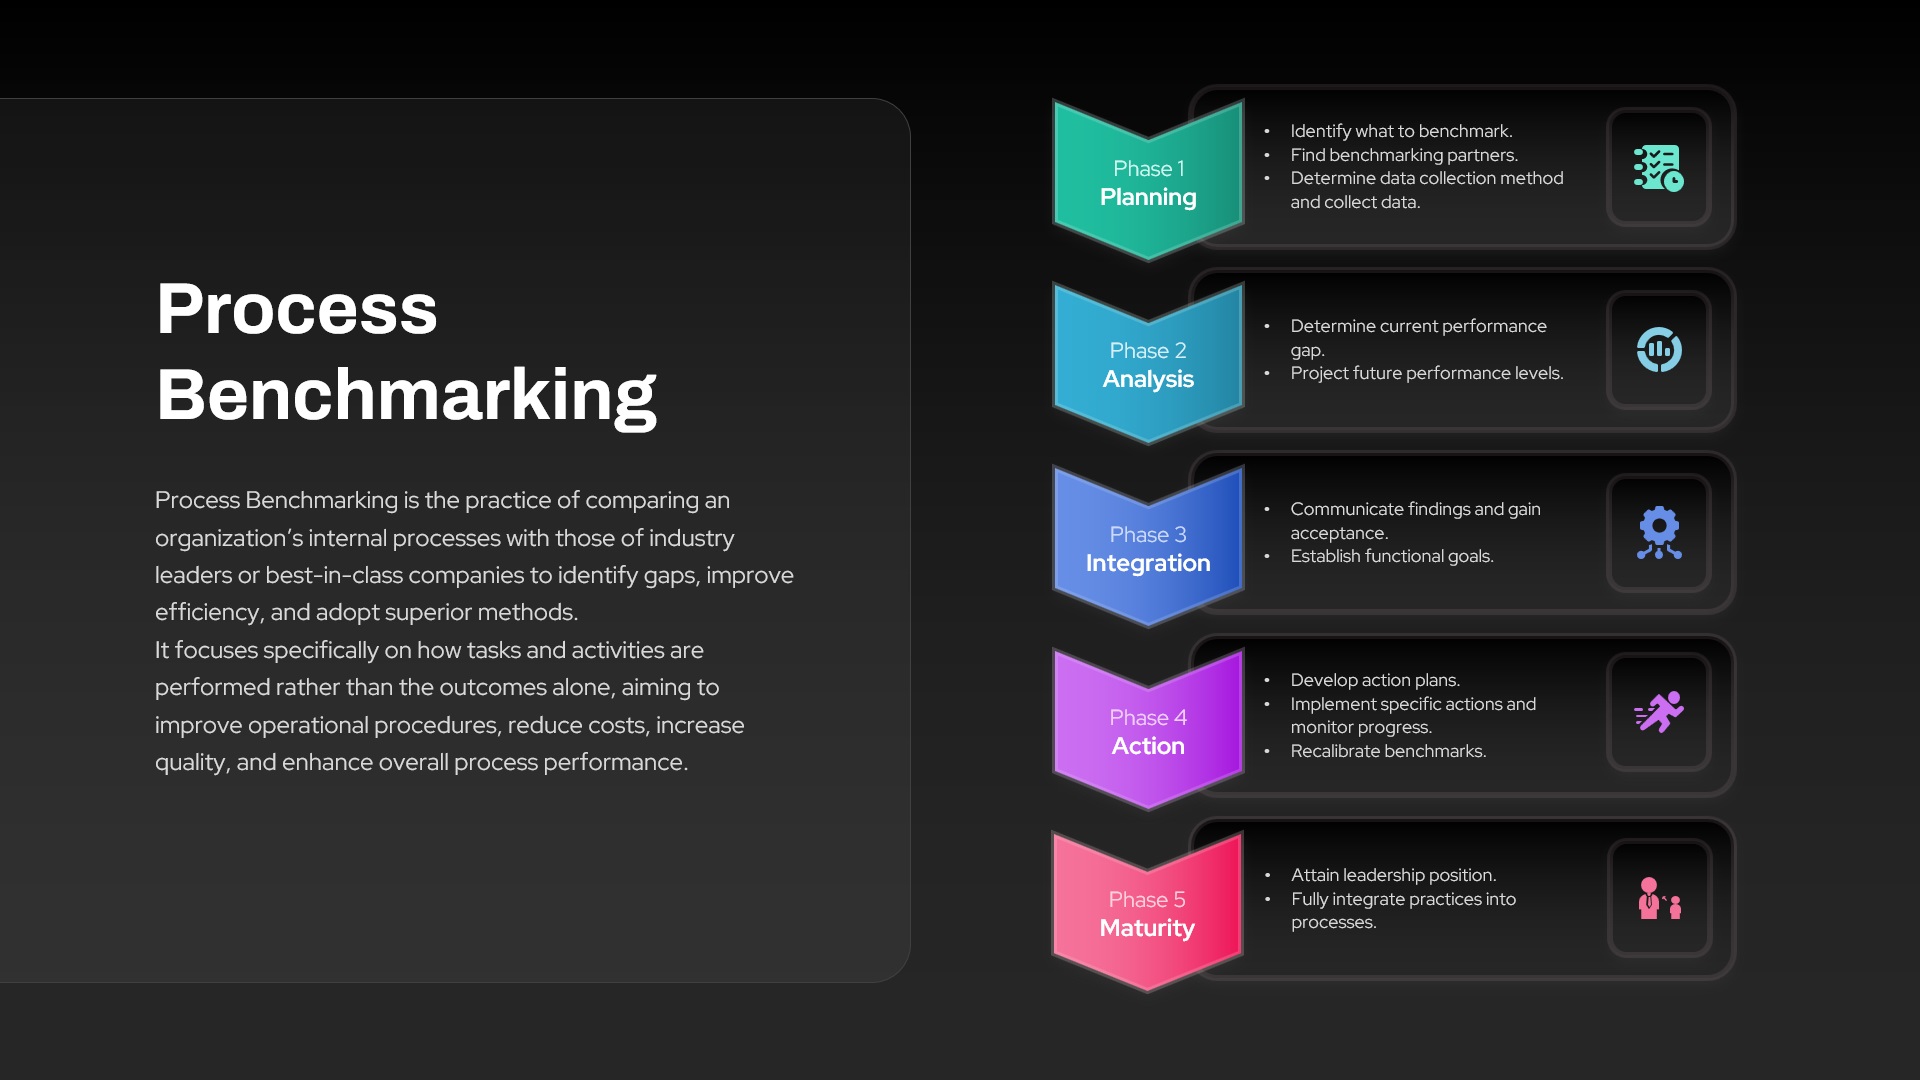
Process Benchmarking Five-Phase Framework Template for PowerPoint & Google Slides
Process
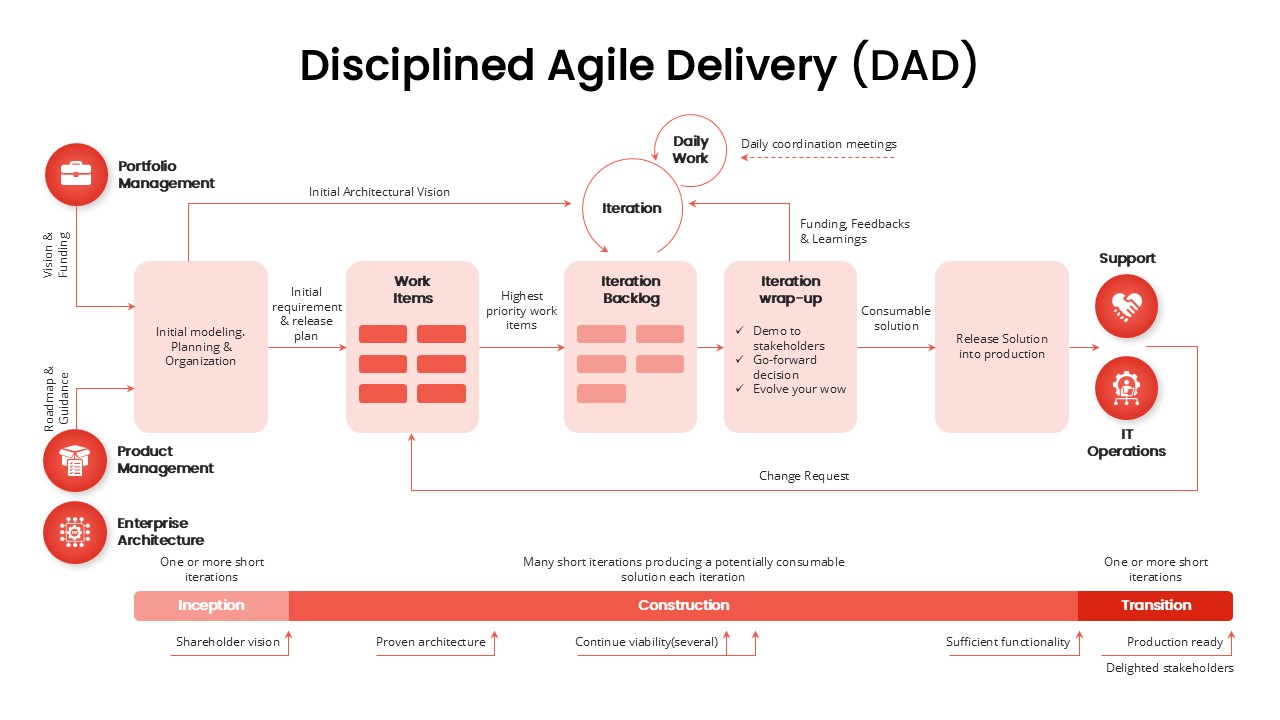
Disciplined Agile Delivery (DAD) Framework template for PowerPoint & Google Slides
Business Strategy
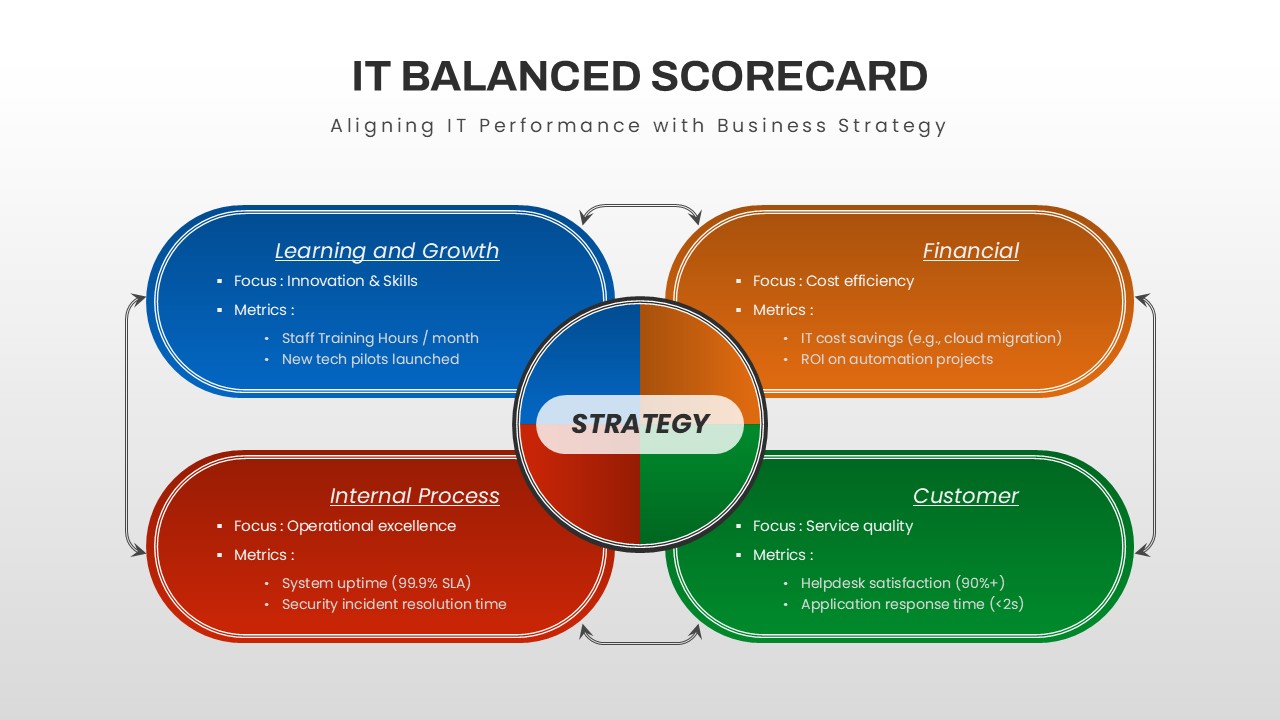
IT Balanced Scorecard Strategy Framework Template for PowerPoint & Google Slides
Business Strategy
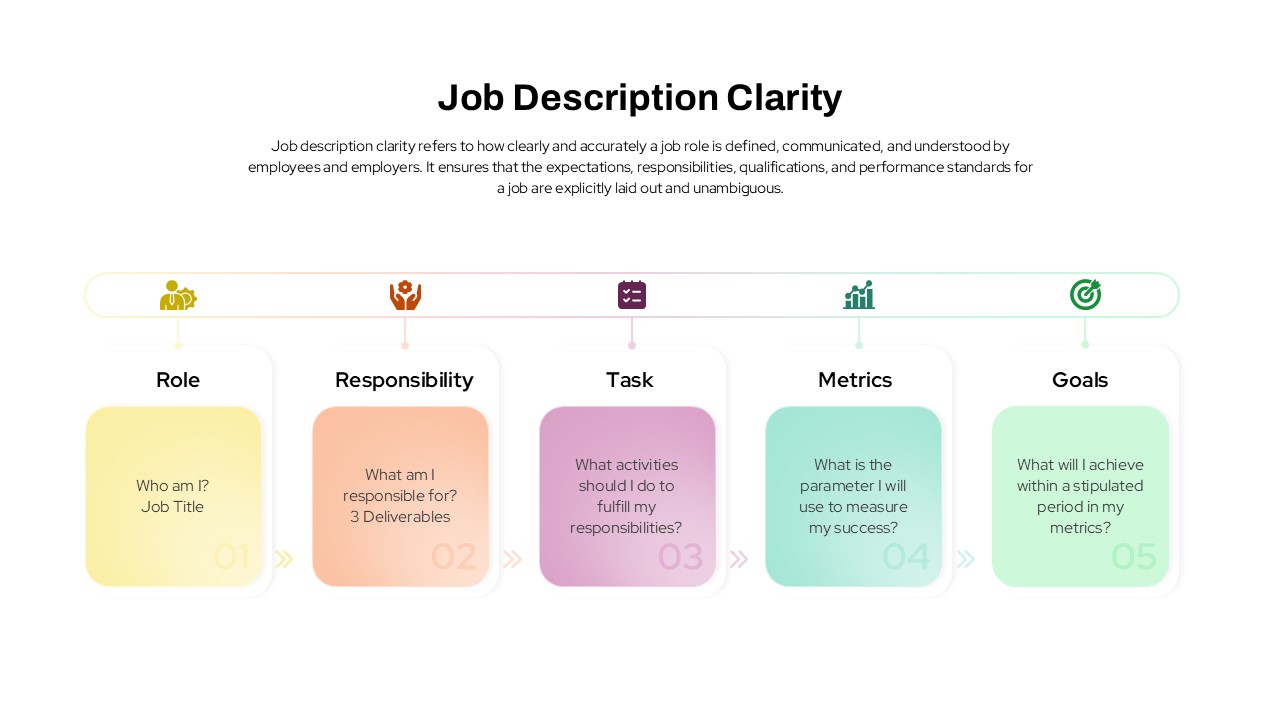
Job Description Clarity Framework template for PowerPoint & Google Slides
Business
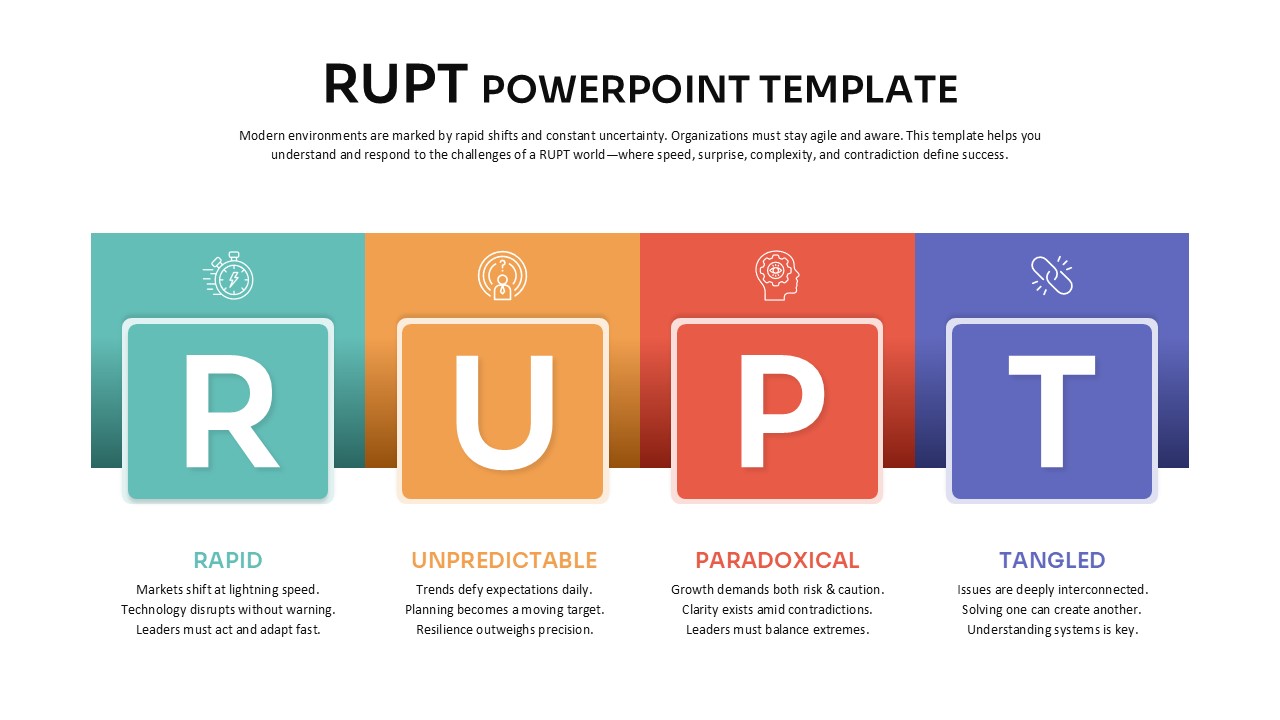
RUPT Framework template for PowerPoint & Google Slides
Business
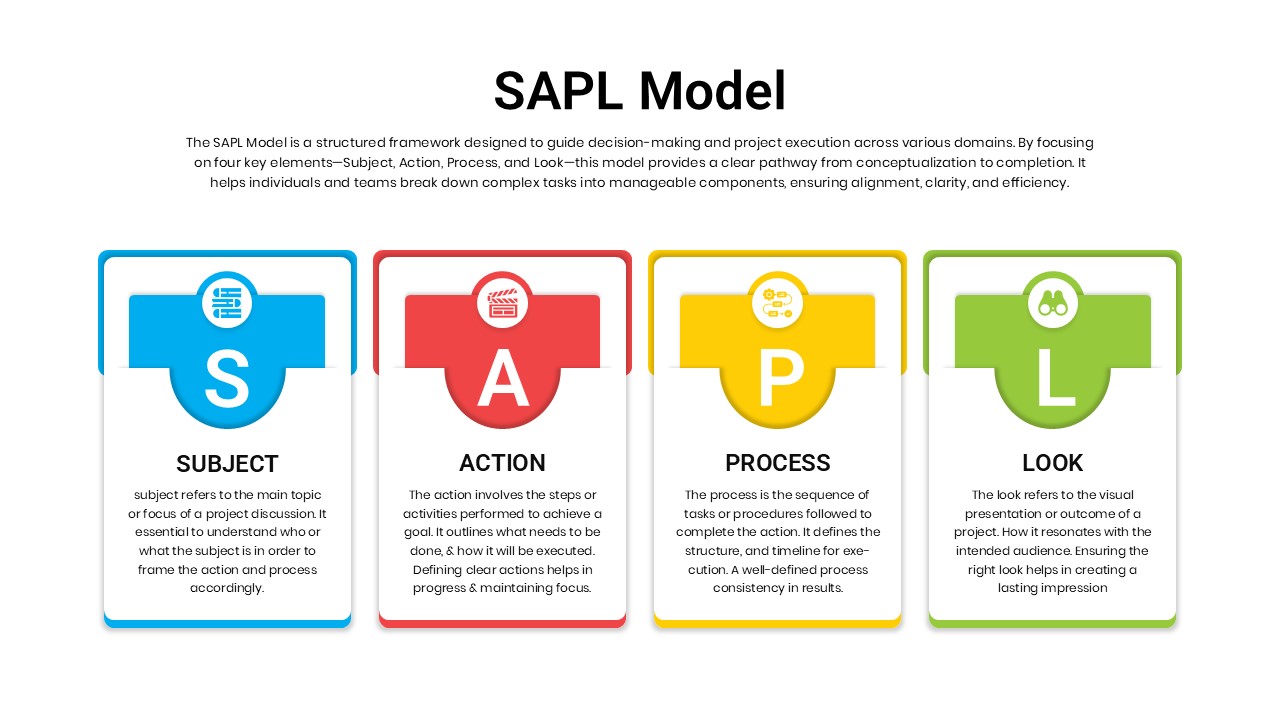
SAPL Model Framework template for PowerPoint & Google Slides
Business
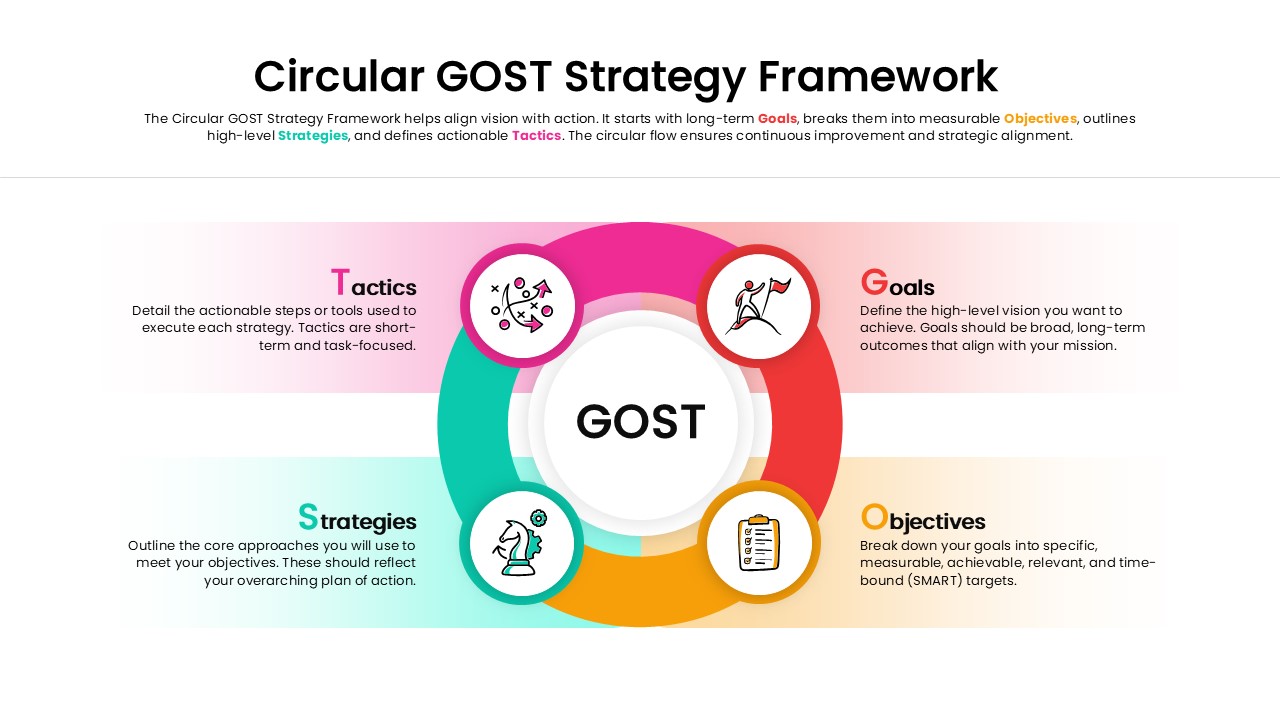
Circular GOST Strategy Framework Template for PowerPoint & Google Slides
Goals
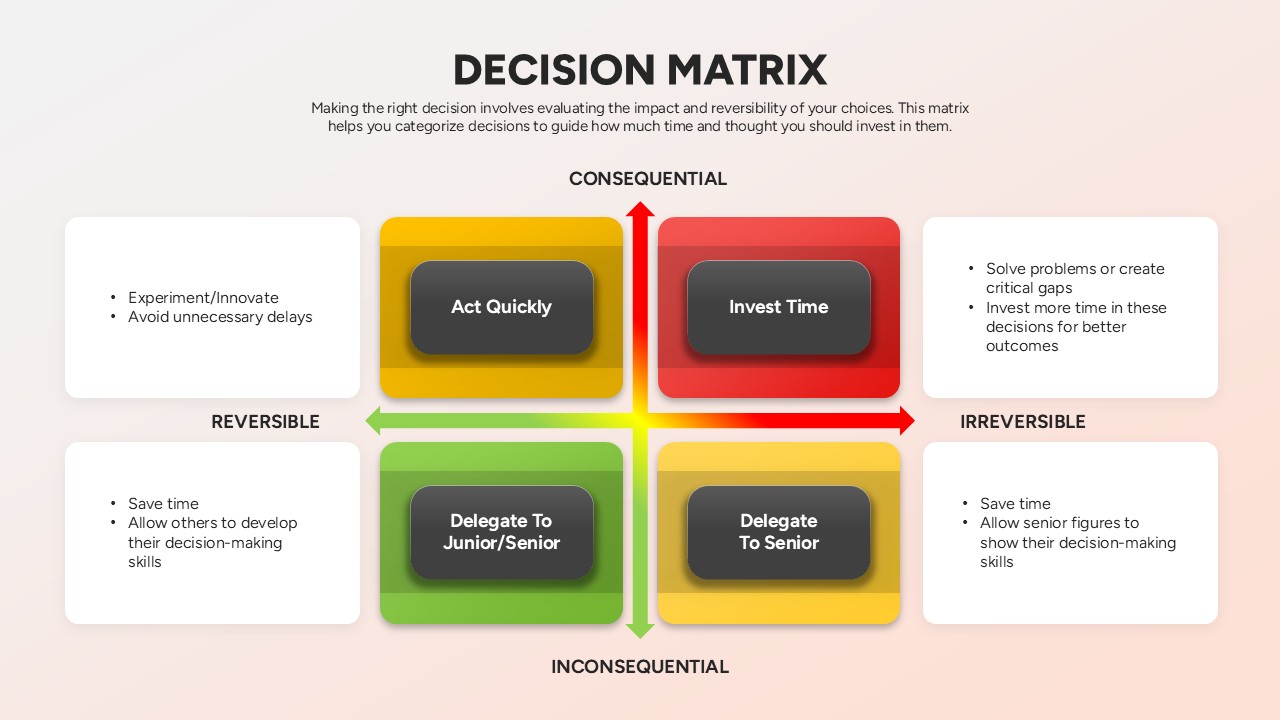
Decision Matrix Evaluation Framework Slide Template for PowerPoint & Google Slides
Leadership
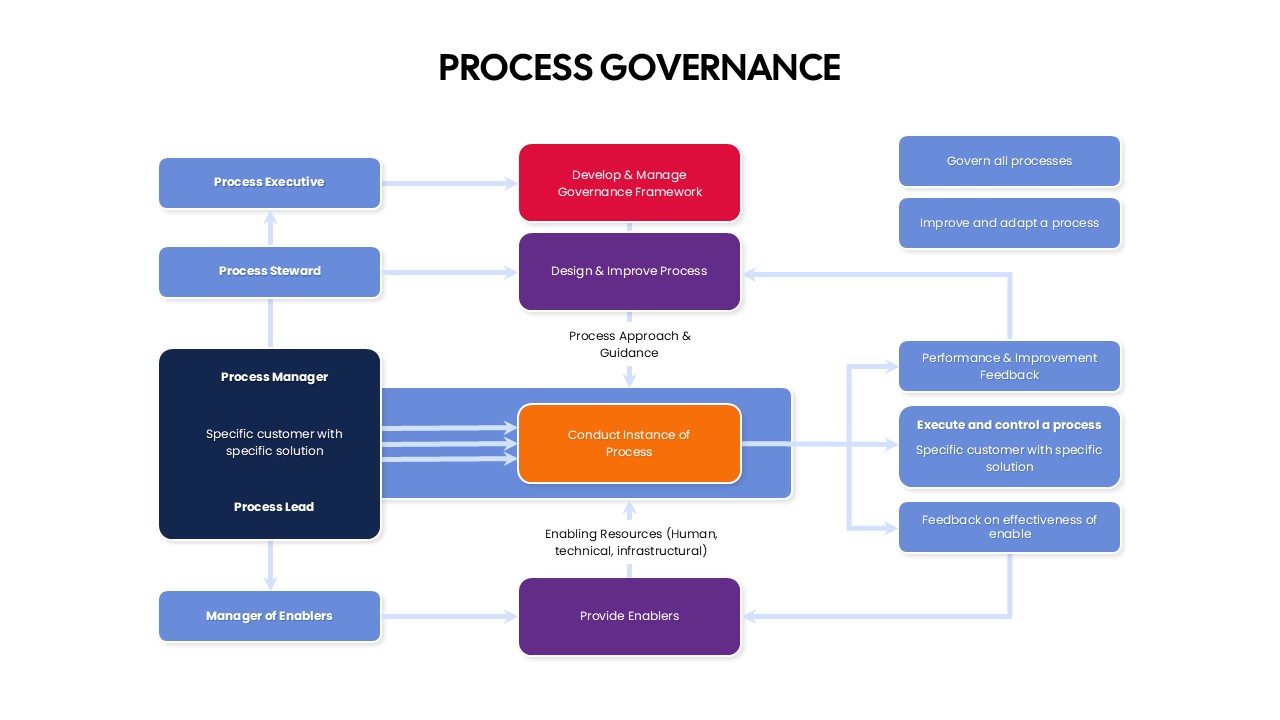
Process Governance Framework Flowchart Template for PowerPoint & Google Slides
Flow Charts
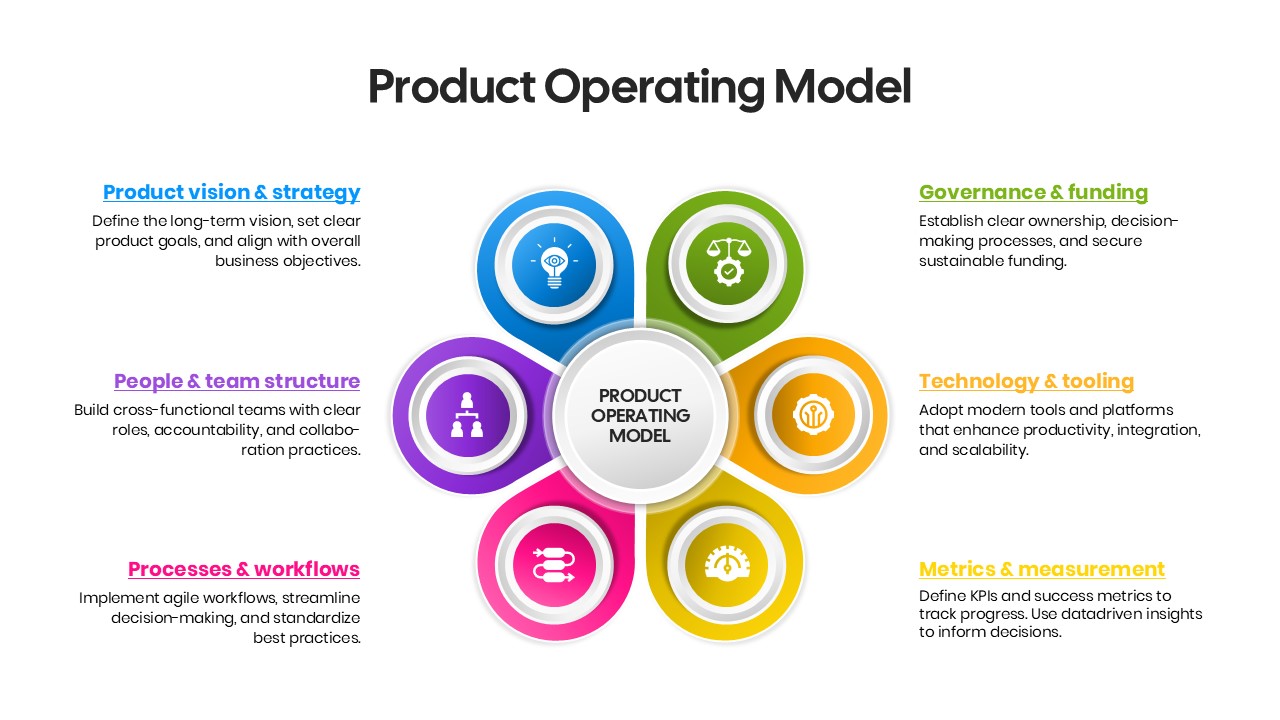
Product Operating Model Framework Template for PowerPoint & Google Slides
Business Strategy
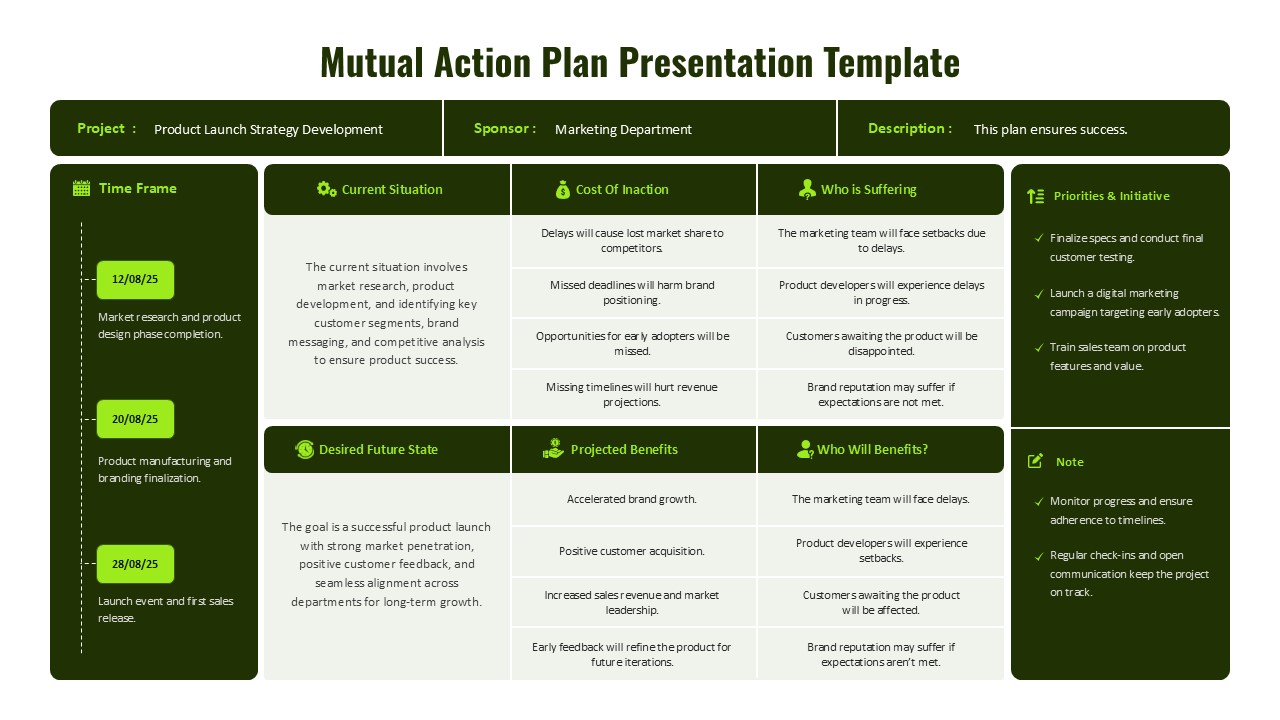
Mutual Action Plan Framework Overview Template for PowerPoint & Google Slides
Project
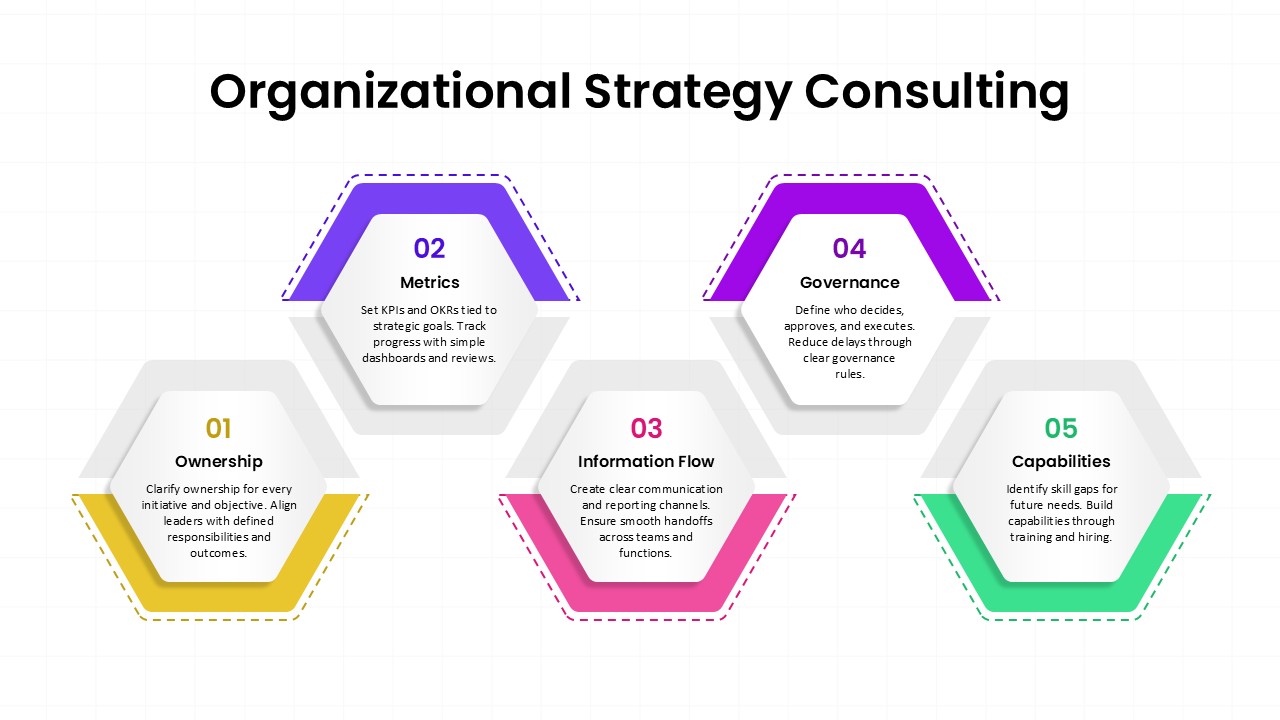
Organizational Strategy Consulting Framework Template for PowerPoint & Google Slides
Consulting
Financial Gap Analysis Framework Template for PowerPoint & Google Slides
Finance
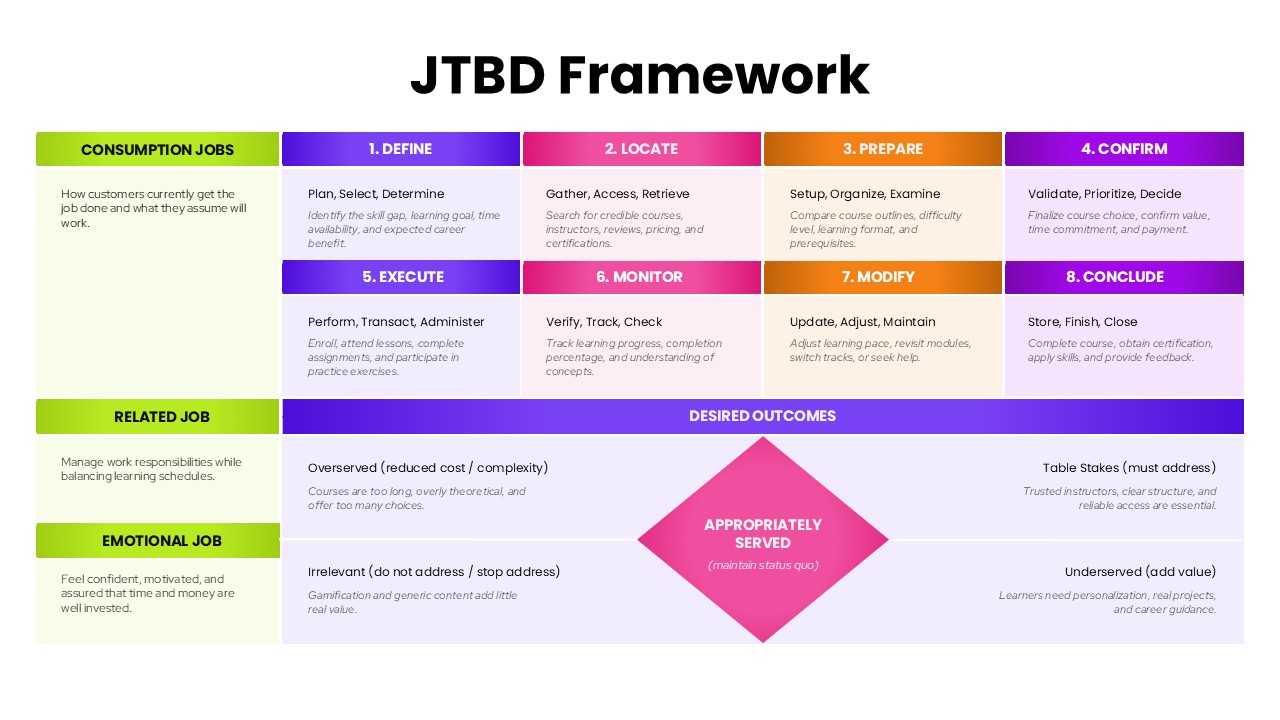
JTBD Framework Process and Outcomes Matrix Template for PowerPoint & Google Slides
Marketing