Decision Support System Diagram Template for PowerPoint & Google Slides
Description
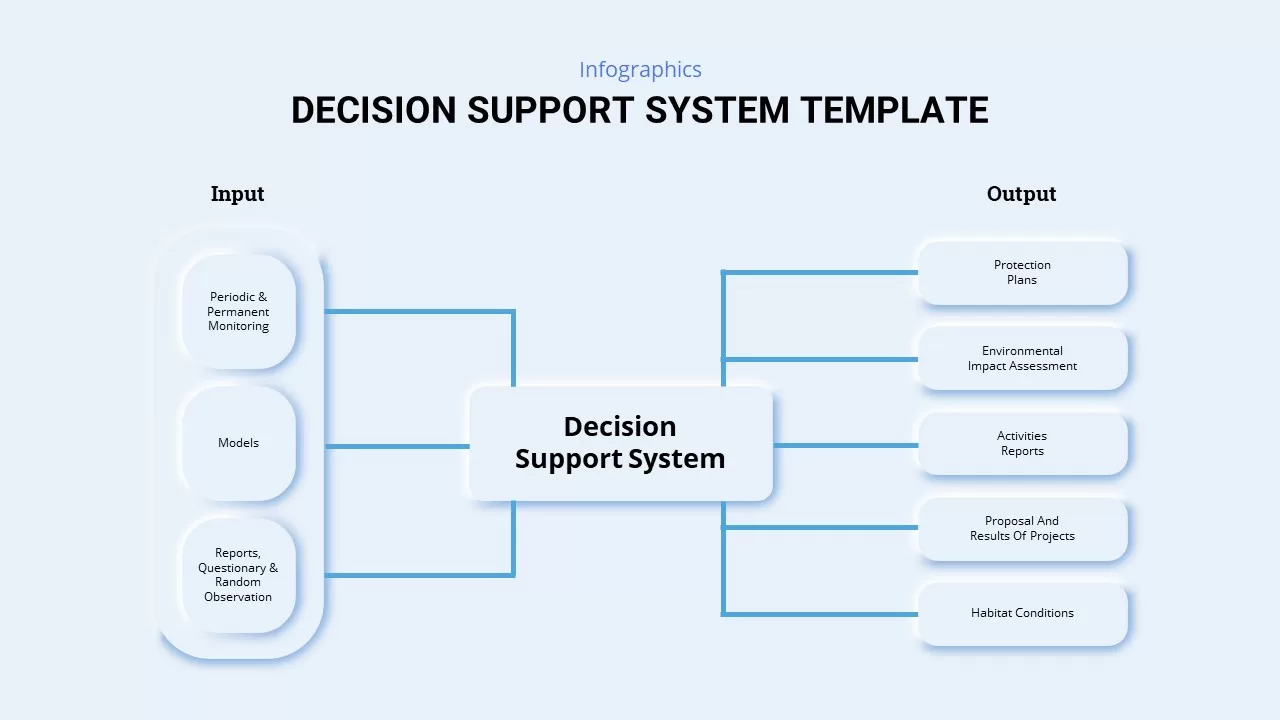
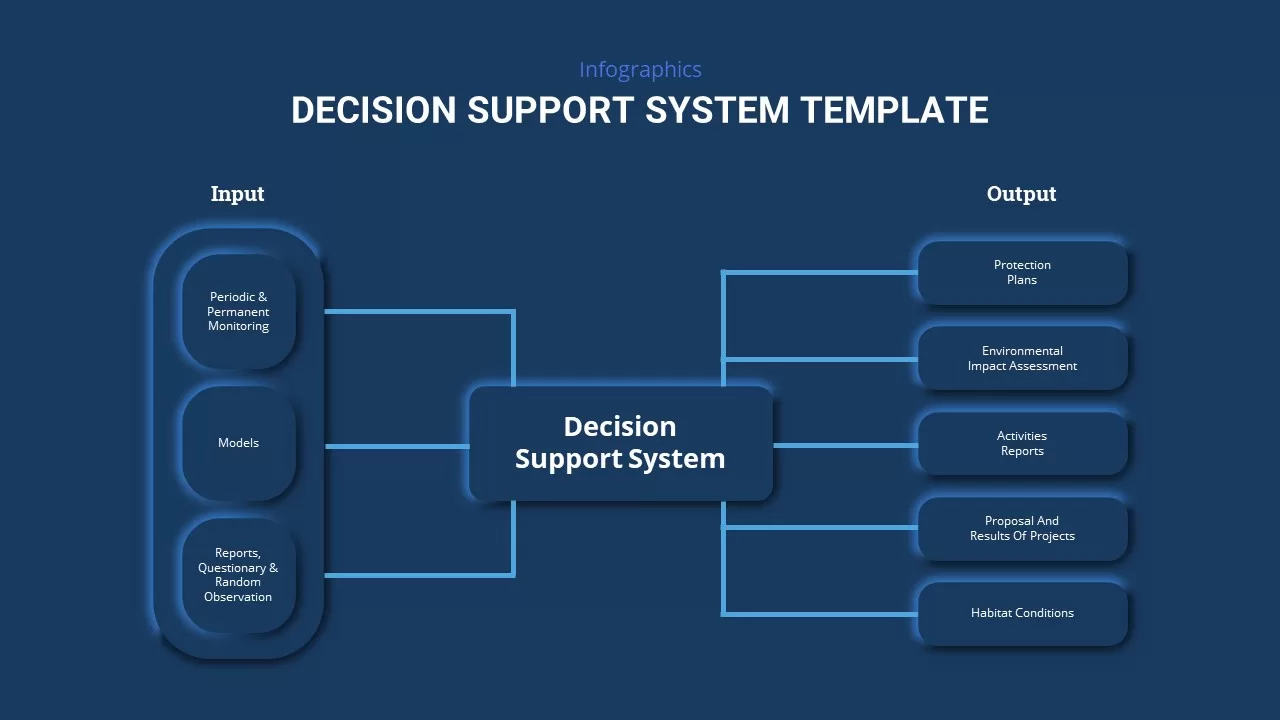
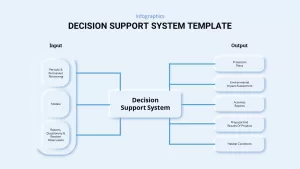
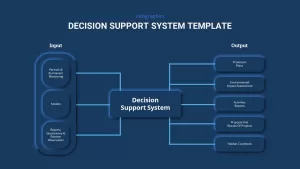
The Decision Support System Infographic template transforms complex data flows into clear, visually engaging diagrams. Set on a light blue background, this master slide features a central “Decision Support System” block connected by crisp blue lines to left-hand input nodes—Periodic & Permanent Monitoring, Models, Reports & Observations—and right-hand output nodes such as Protection Plans, Environmental Impact Assessments, Activity Reports, Project Proposals, and Habitat Conditions. Neumorphic white shapes with subtle shadows and clean typography ensure readability and a modern aesthetic.
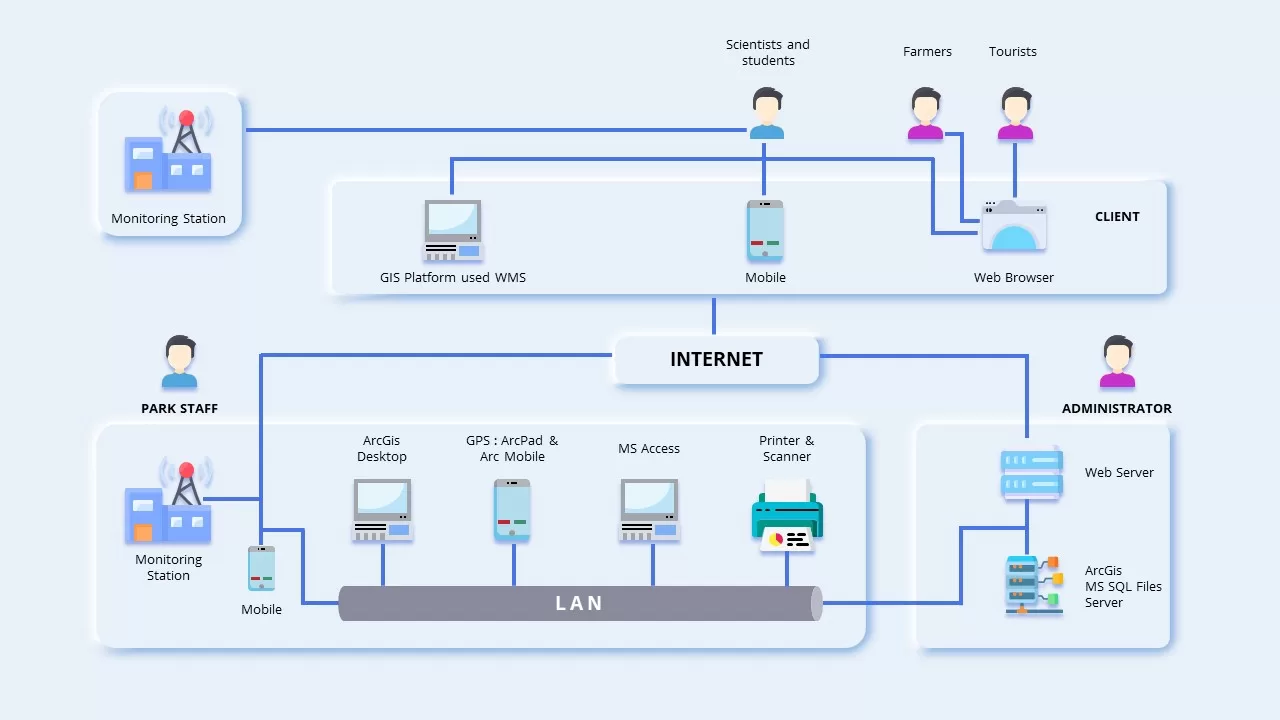
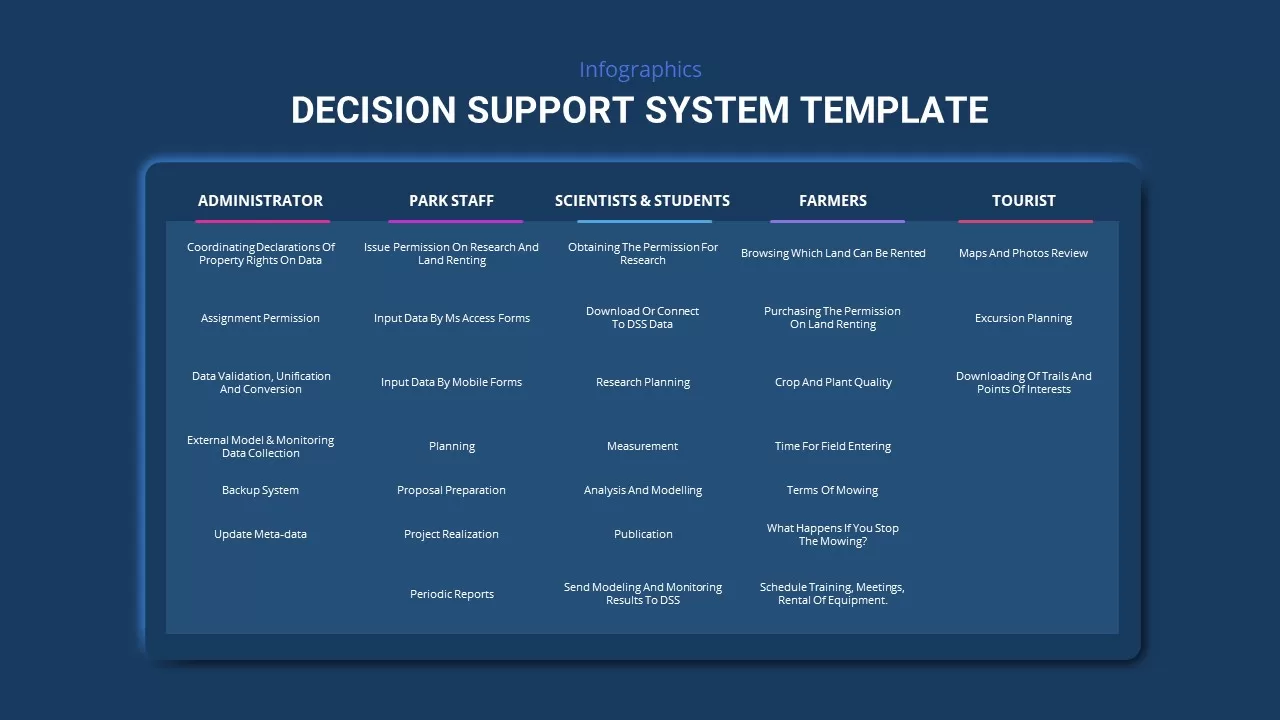
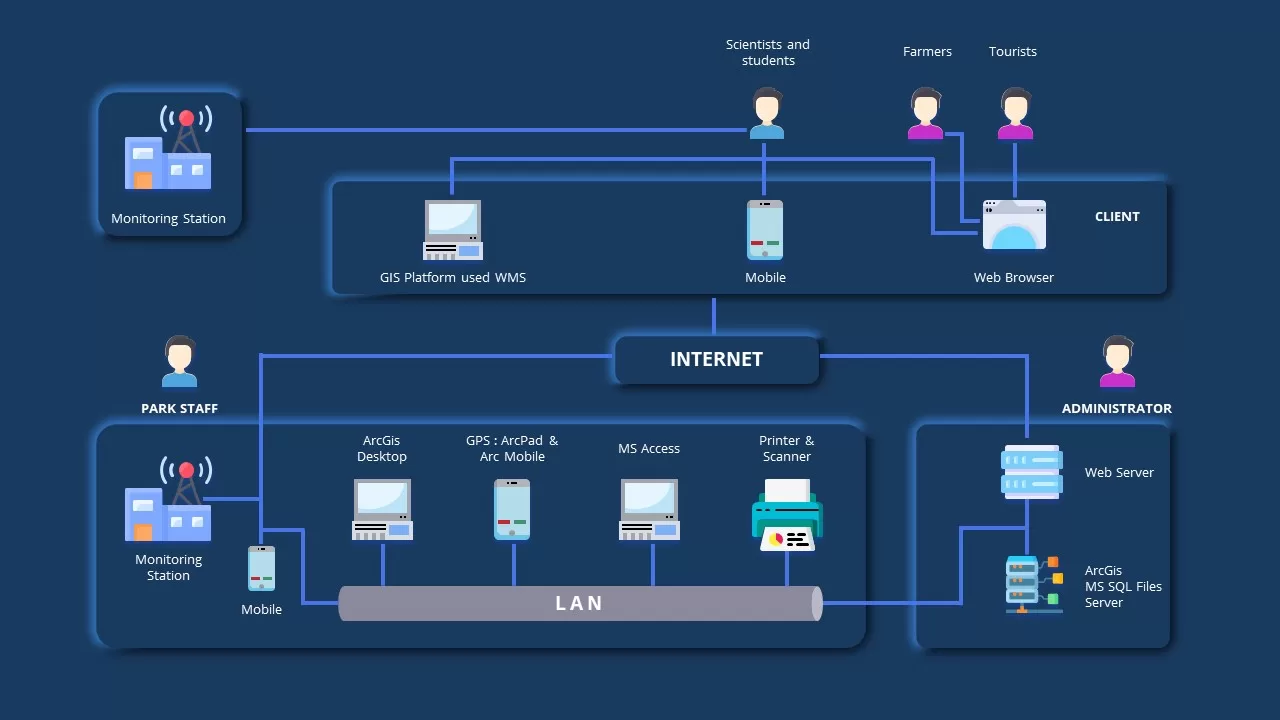
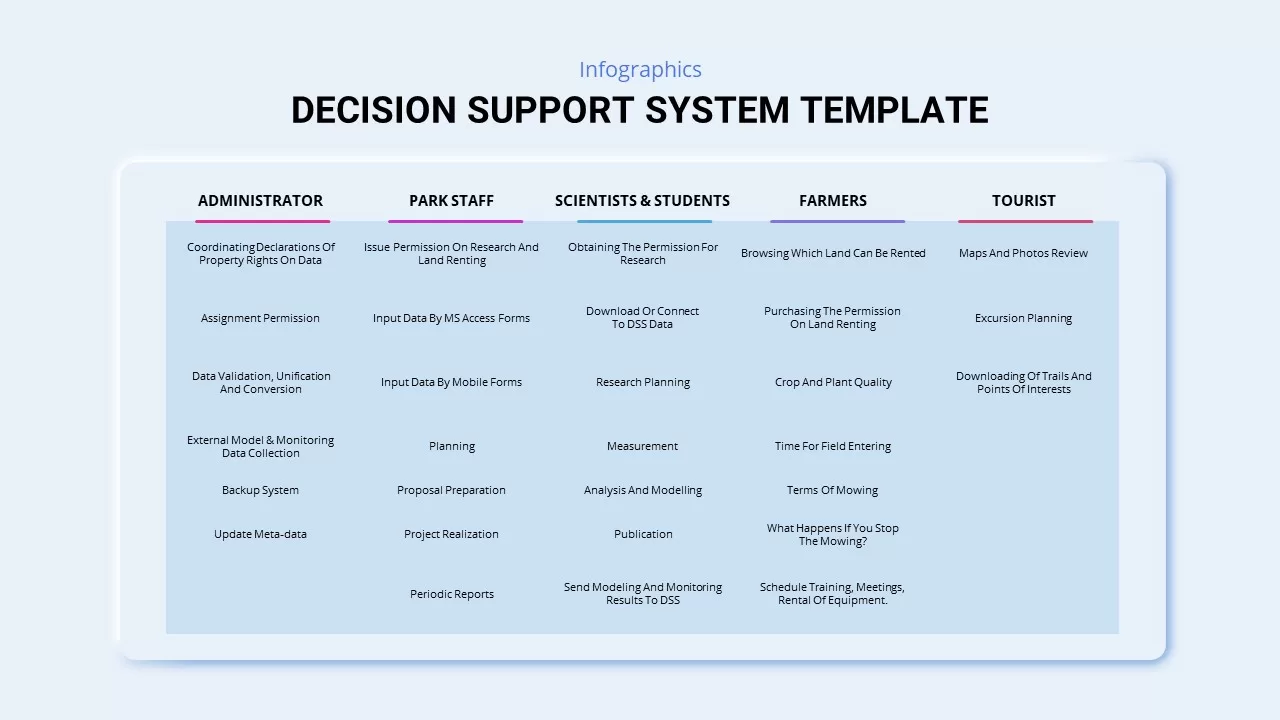
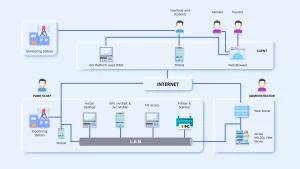
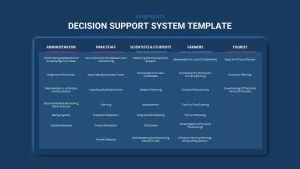
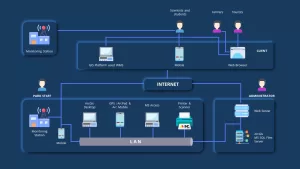
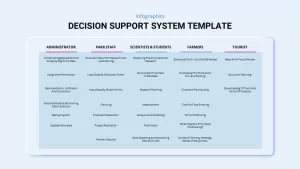
Additional layouts include a client-server architecture diagram illustrating monitoring stations, GIS platforms (WMS), mobile apps, web interfaces, and LAN components for park staff and administrators; and a multi-column role-and-task matrix detailing actions for Administrators, Park Staff, Scientists & Students, Farmers, and Tourists. Each infographic element is fully editable via built-in master slides, allowing you to swap icons, update text, or adjust connections in seconds. Preconfigured transitions and entrance animations guide your audience smoothly through the decision-making narrative.
Optimized for both PowerPoint and Google Slides, this template maintains resolution clarity across devices and screen sizes. With consistent color themes, variable font styles, and ready-to-use placeholders, you can produce polished presentations rapidly—no designer needed. Whether mapping environmental conservation workflows, IT infrastructure, or business processes, this flexible infographic set streamlines slide creation and keeps stakeholders focused on insights rather than formatting.
Enhance your presentations with drag-and-drop placeholders and theme-based color palettes. Use KPI icons to emphasize performance metrics, validation steps, and monitoring workflows. Perfect for executive briefings, stakeholder updates, or academic seminars, the template adapts to any decision-making scenario and accelerates your slide preparation.
Who is it for
Business analysts, IT managers, project leaders, and environmental professionals will benefit from this template when illustrating data-driven decision processes, system architectures, or role-based workflows. Researchers and consultants can leverage the infographic layouts for clear method presentations.
Other Uses
Repurpose these slides for process mapping, network topology overviews, organizational role charts, or KPI dashboards. Adapt the architecture diagram for IT security reviews, the input–output flow for manufacturing workflows, and the task matrix for team responsibility tracking.
Login to download this file

Item ID
SB02127
Related Templates

Elegant Process Support Arrow Diagram Template for PowerPoint & Google Slides
Arrow

Support Services Gear Infographic Template for PowerPoint & Google Slides
Business

Customer Support Template for PowerPoint & Google Slides
Customer Experience
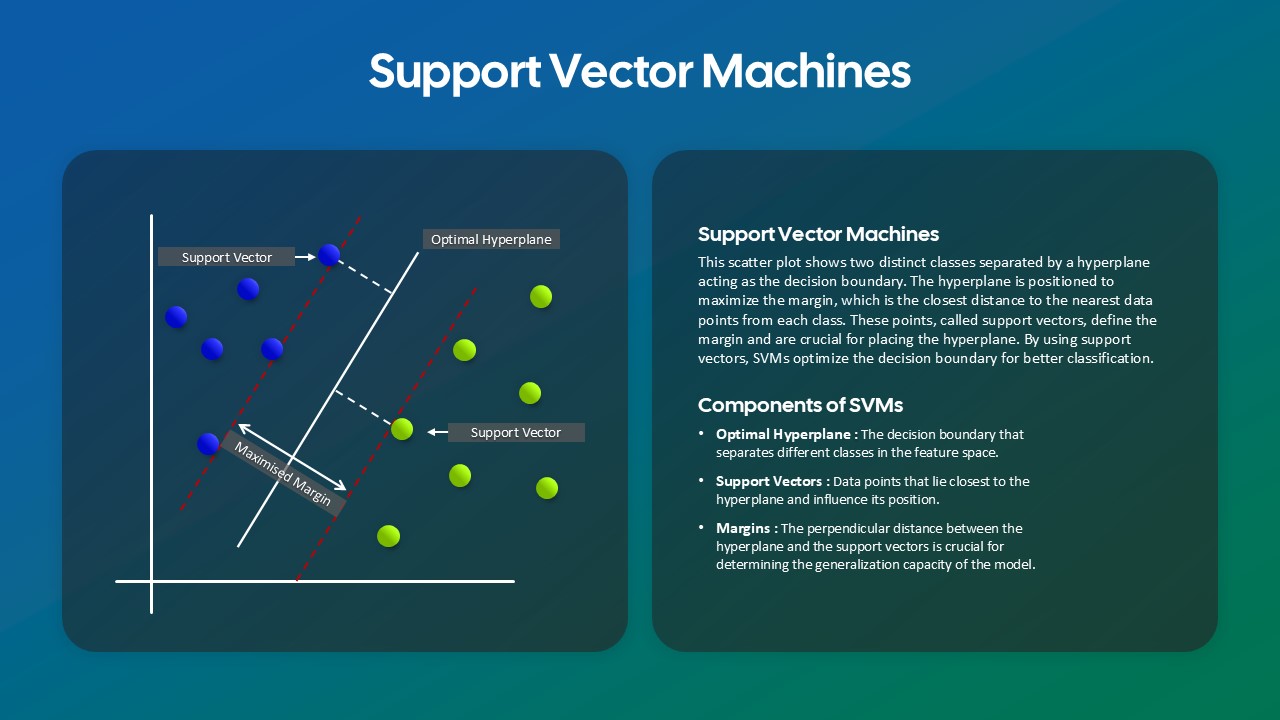
Support Vector Machines (SVM) Overview template for PowerPoint & Google Slides
Technology
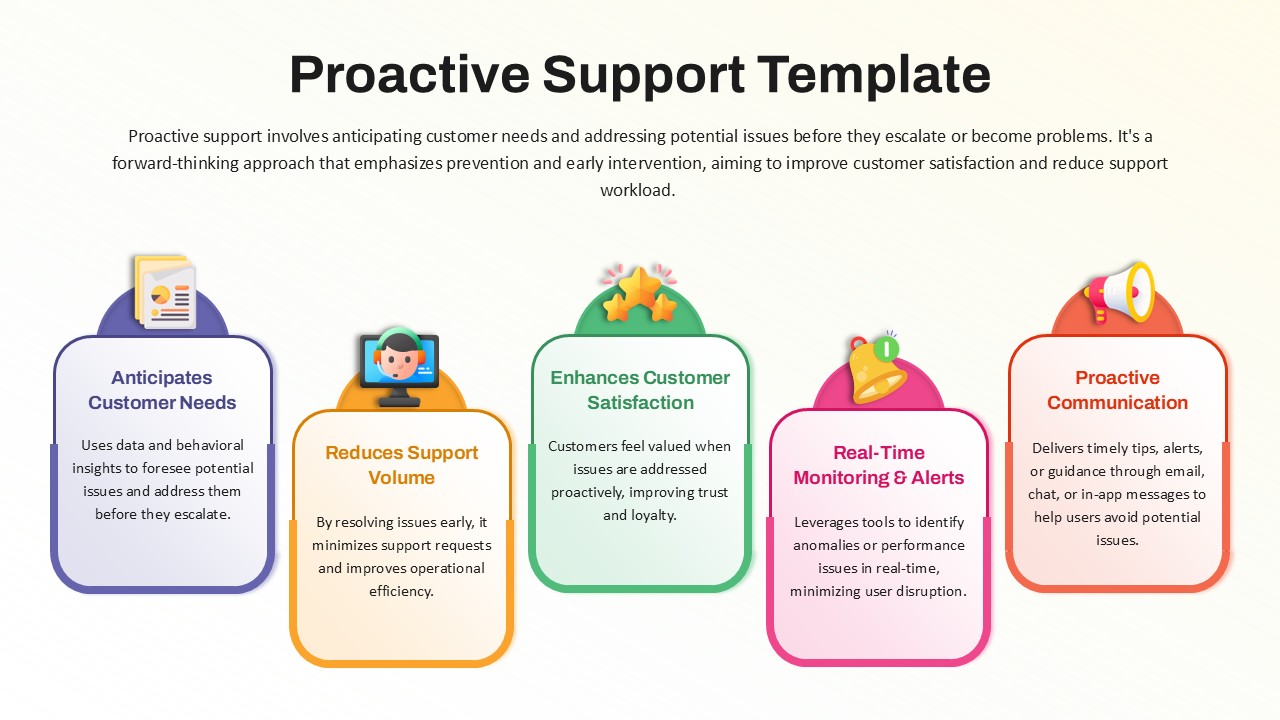
Proactive Support Overview template for PowerPoint & Google Slides
Business
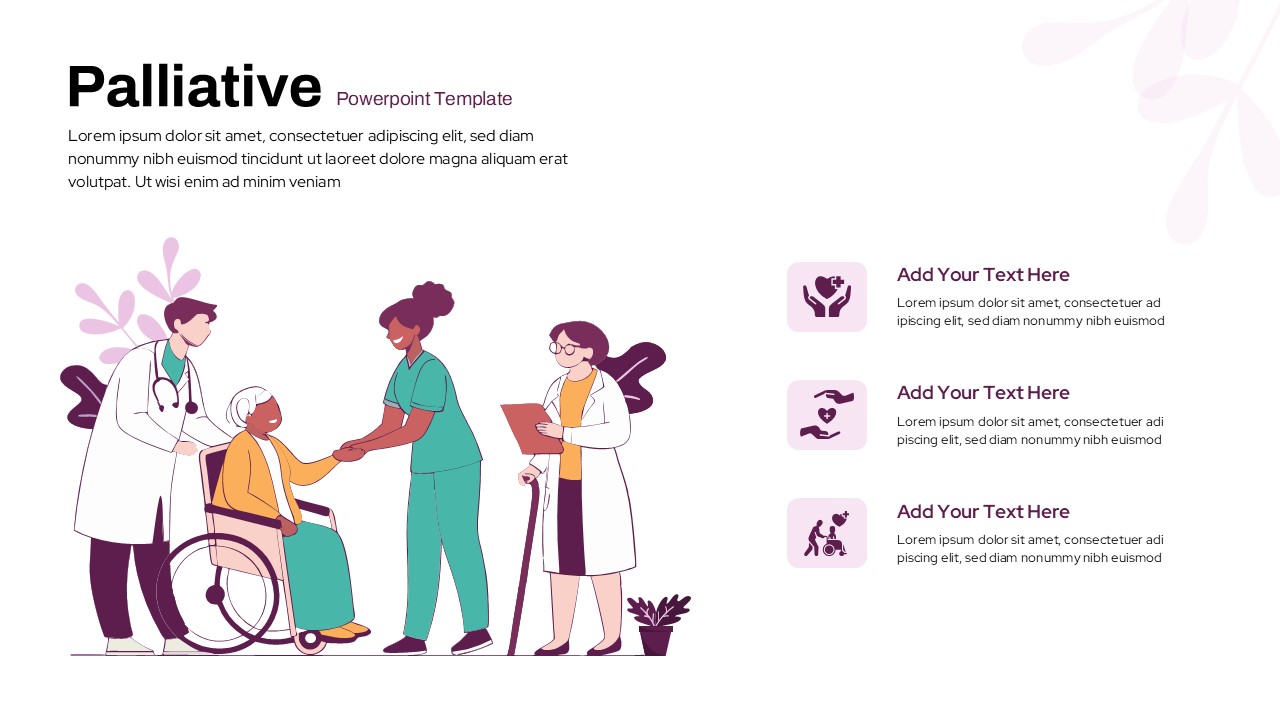
Palliative Care Support Illustration Template for PowerPoint & Google Slides
Health
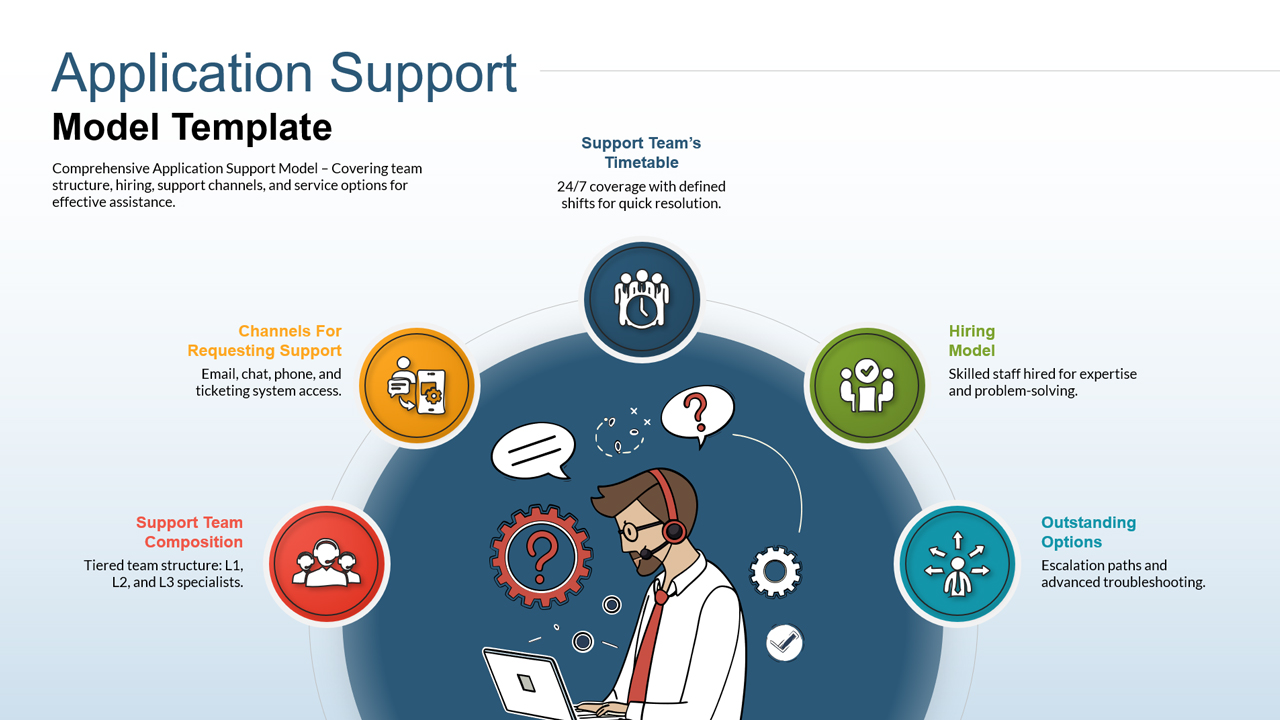
Application Support Operating Model Framework Slide Template for PowerPoint & Google Slides
Information Technology
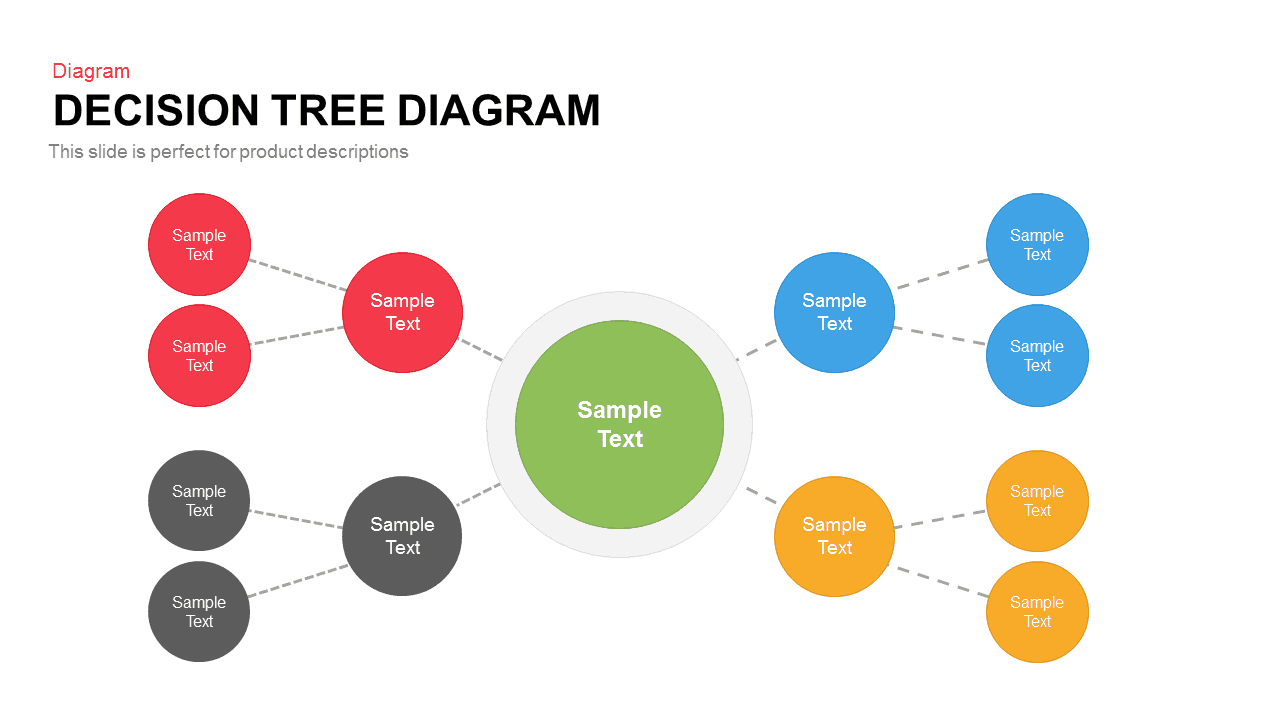
Colorful Decision Tree Diagram template for PowerPoint & Google Slides
Decision Tree
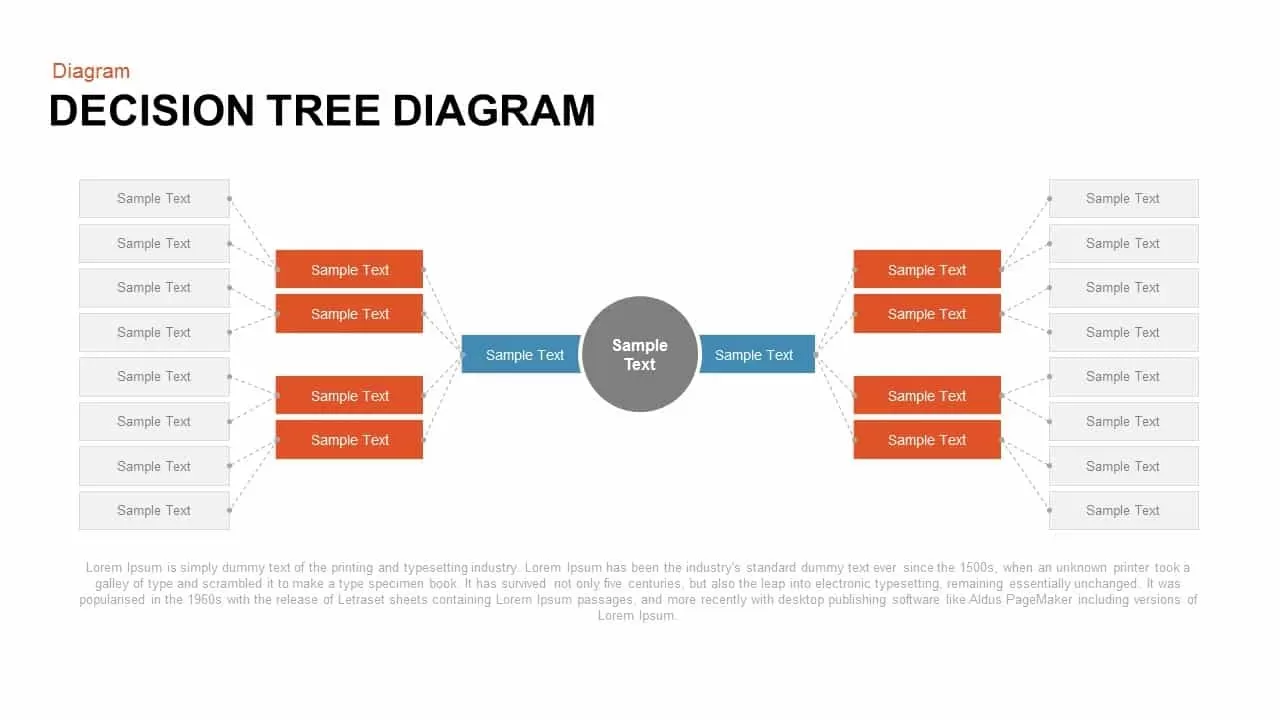
Decision Tree Diagram template for PowerPoint & Google Slides
Decision Tree
Three-Way Decision Process Arrow Diagram Template for PowerPoint & Google Slides
Arrow
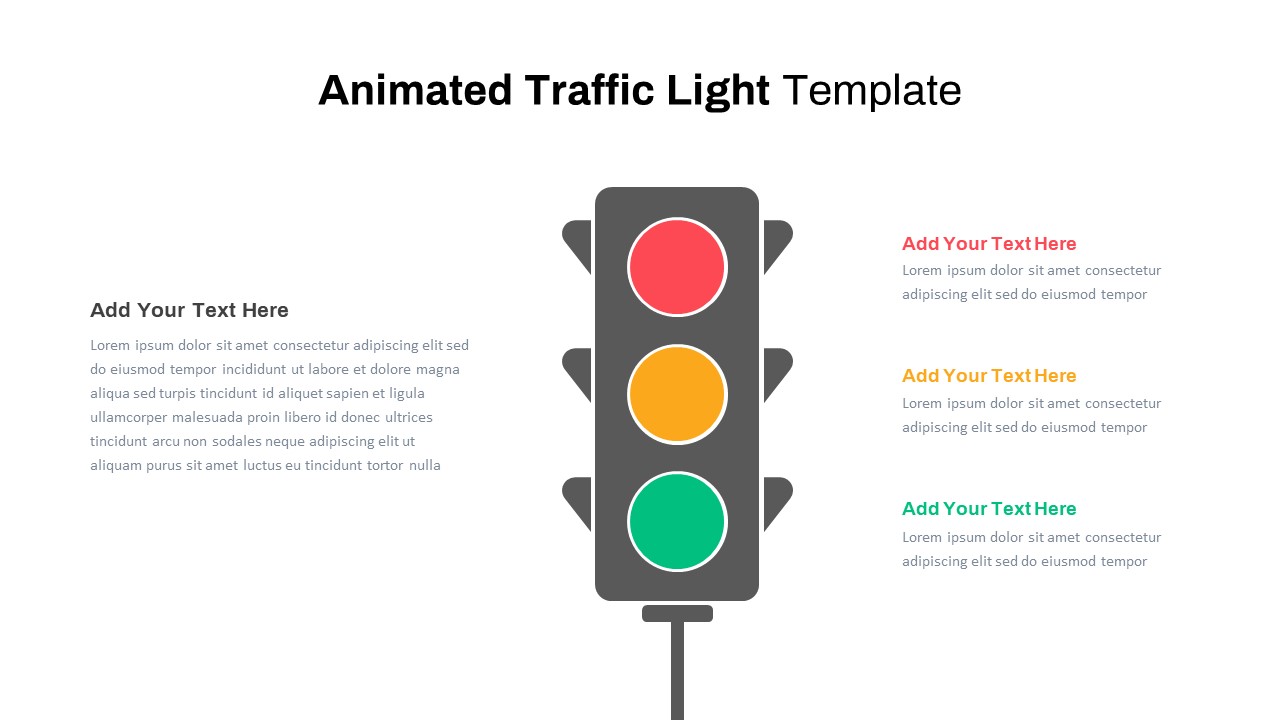
Animated Traffic Light Decision Diagram Template for PowerPoint & Google Slides
Process
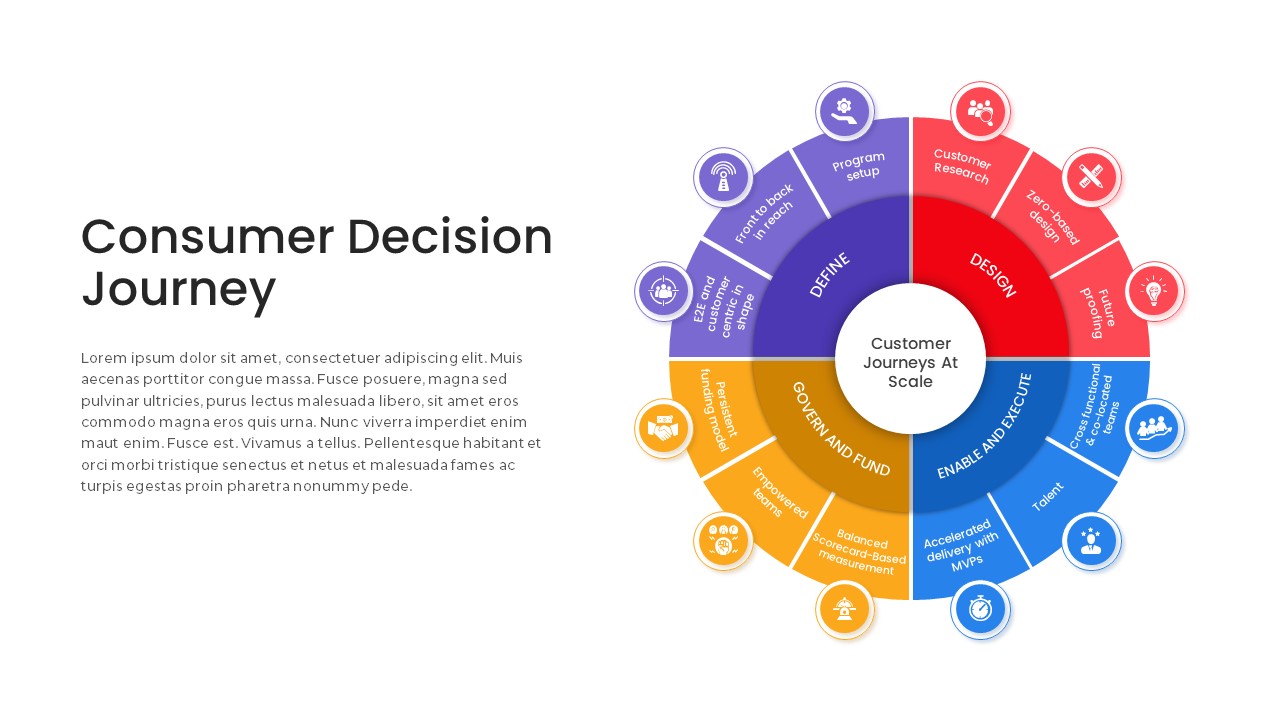
Consumer Decision Journey Radial Diagram Template for PowerPoint & Google Slides
Circular
Business Decision-Making Metaphor Template for PowerPoint & Google Slides
Leadership
Business Decision Making Metaphor Template for PowerPoint & Google Slides
Arrow
Eisenhower Matrix Decision-Making template for PowerPoint & Google Slides
Infographics
Recognition-Primed Decision Process Flow Template for PowerPoint & Google Slides
Flow Charts
Decision Making Unit template for PowerPoint & Google Slides
Business
Pugh Matrix Decision Comparison Chart Template for PowerPoint & Google Slides
Comparison Chart
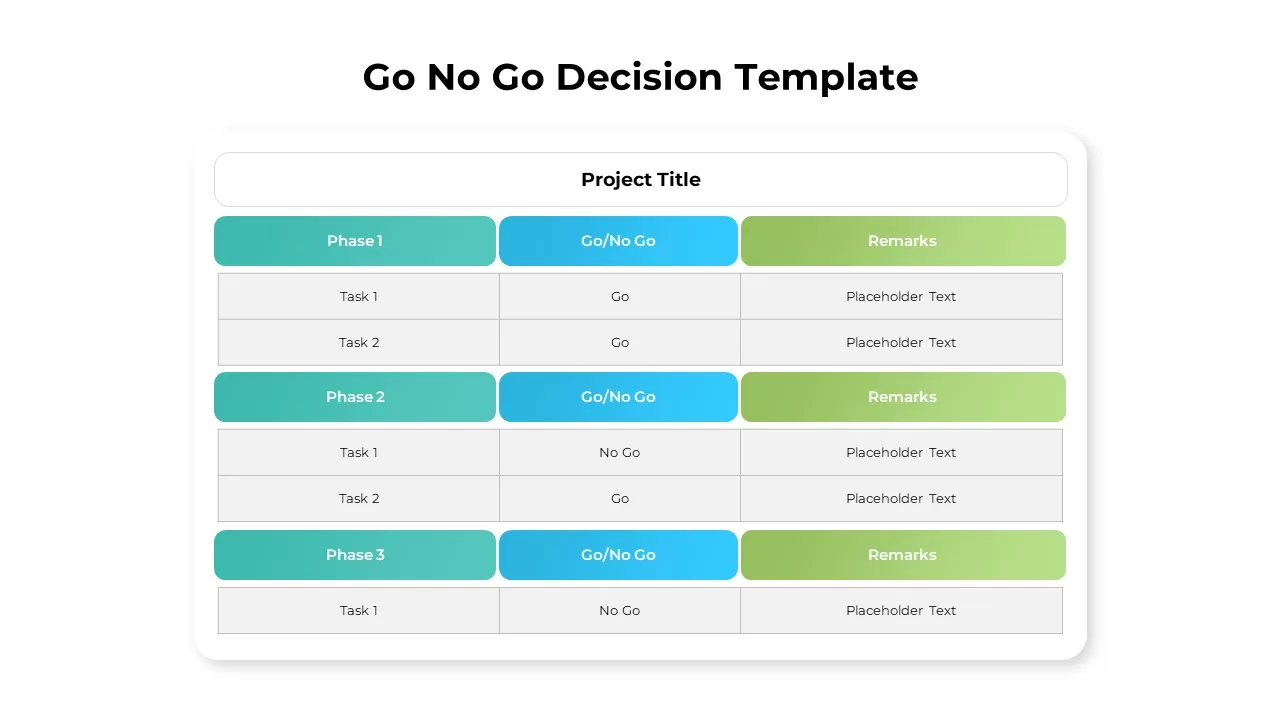
Go No Go Decision Infographic Template for PowerPoint & Google Slides
Comparison
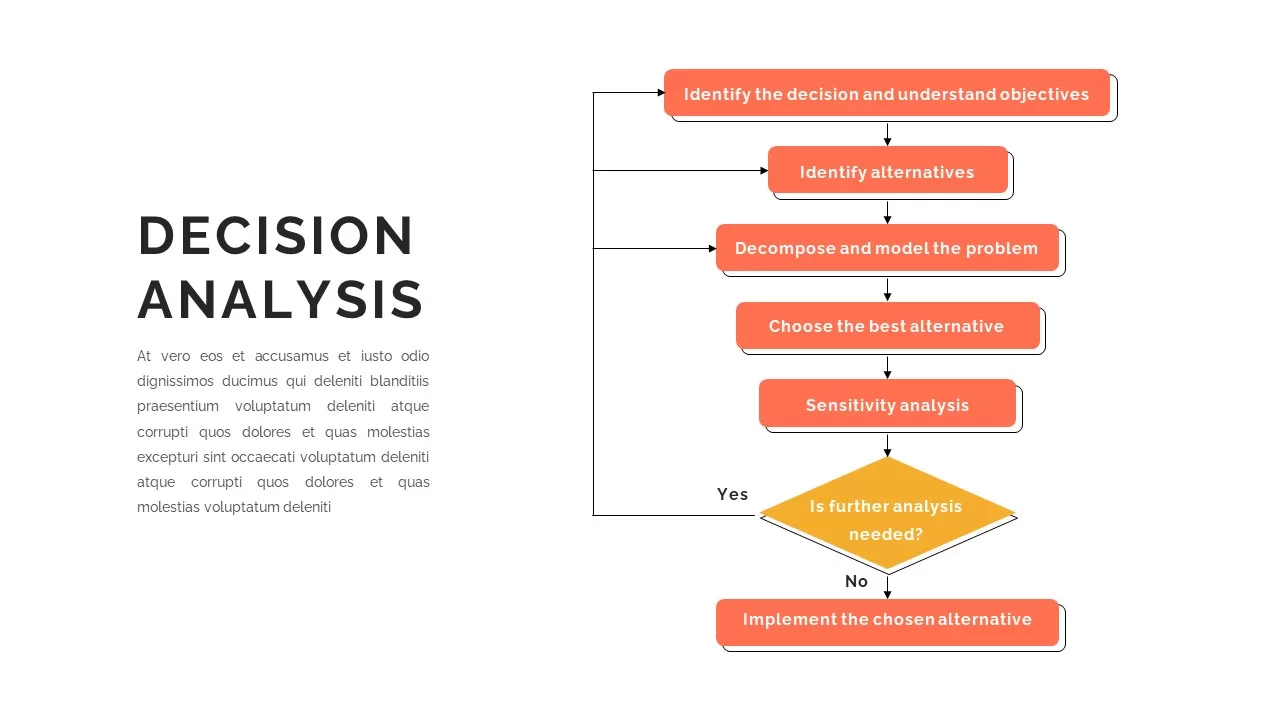
Decision Analysis Process Flowchart Template for PowerPoint & Google Slides
Flow Charts
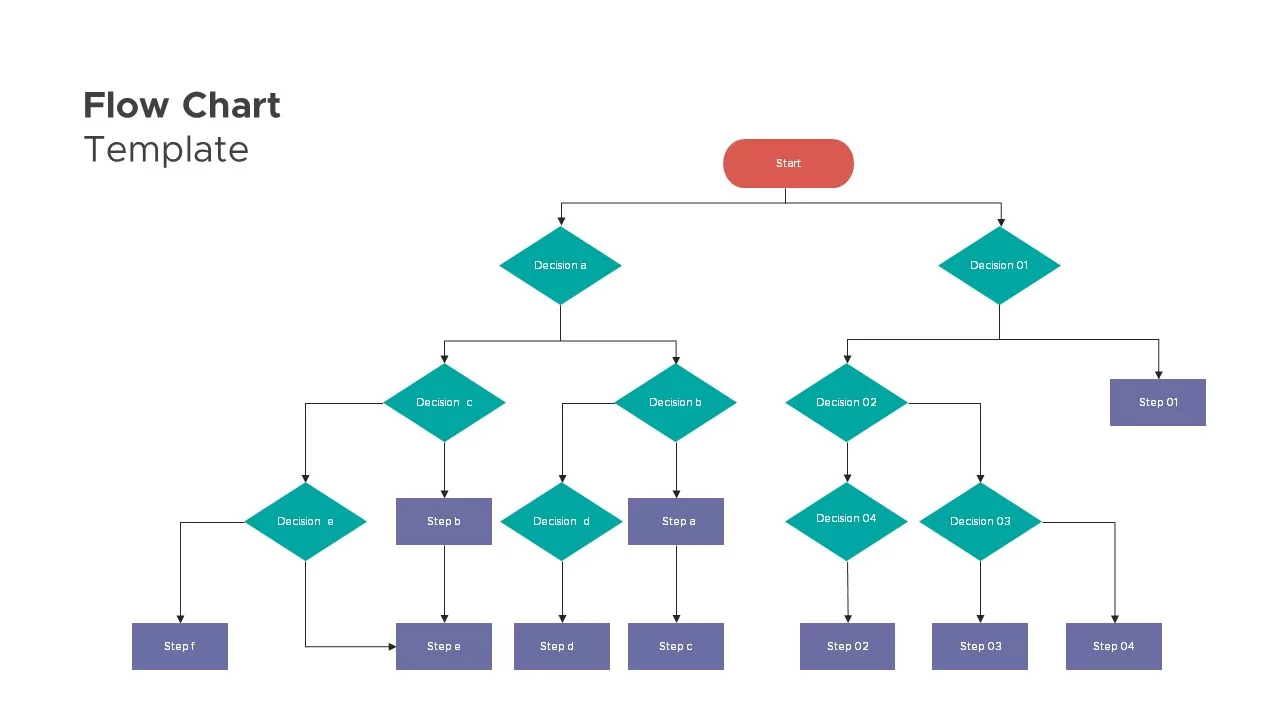
Flow Chart Decision Tree Template for PowerPoint & Google Slides
Flow Charts
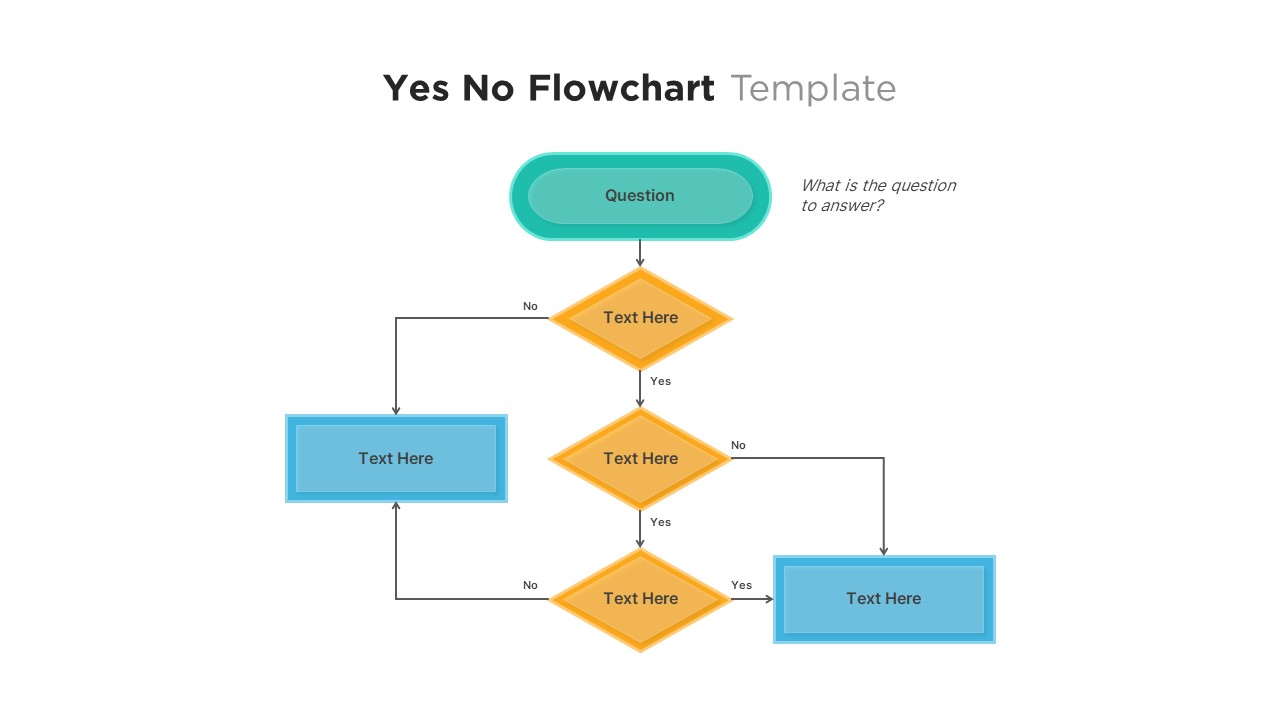
Professional Yes No Decision Flowchart Template for PowerPoint & Google Slides
Flow Charts
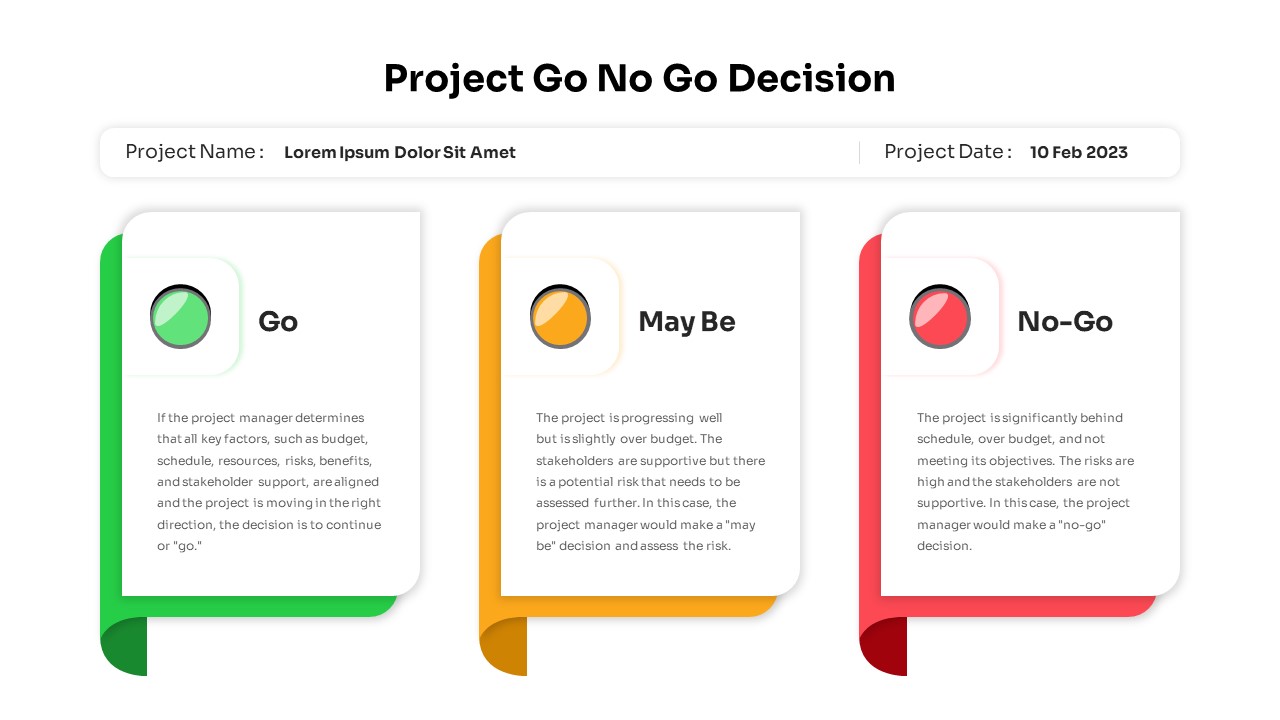
Project Go No-Go Decision Slide Template for PowerPoint & Google Slides
Process
Decision Matrix & Prioritization Chart Template for PowerPoint & Google Slides
Comparison Chart
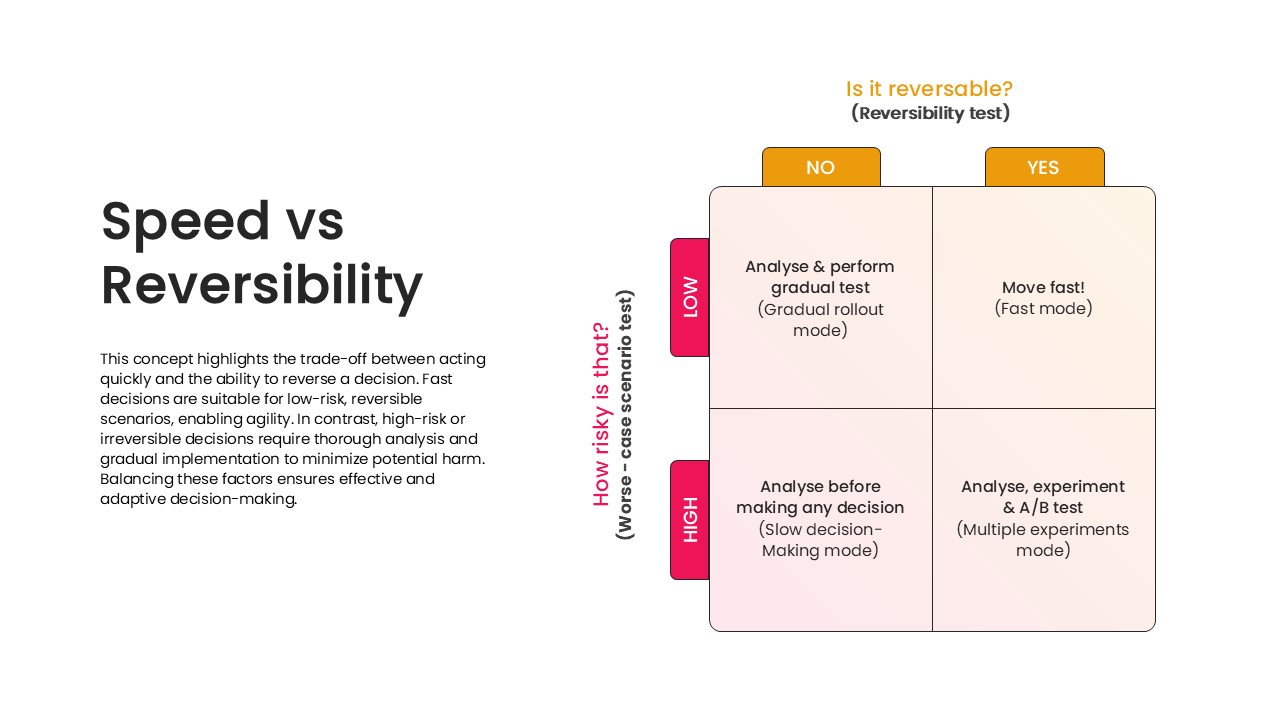
Speed vs Reversibility Decision Matrix Template for PowerPoint & Google Slides
Comparison
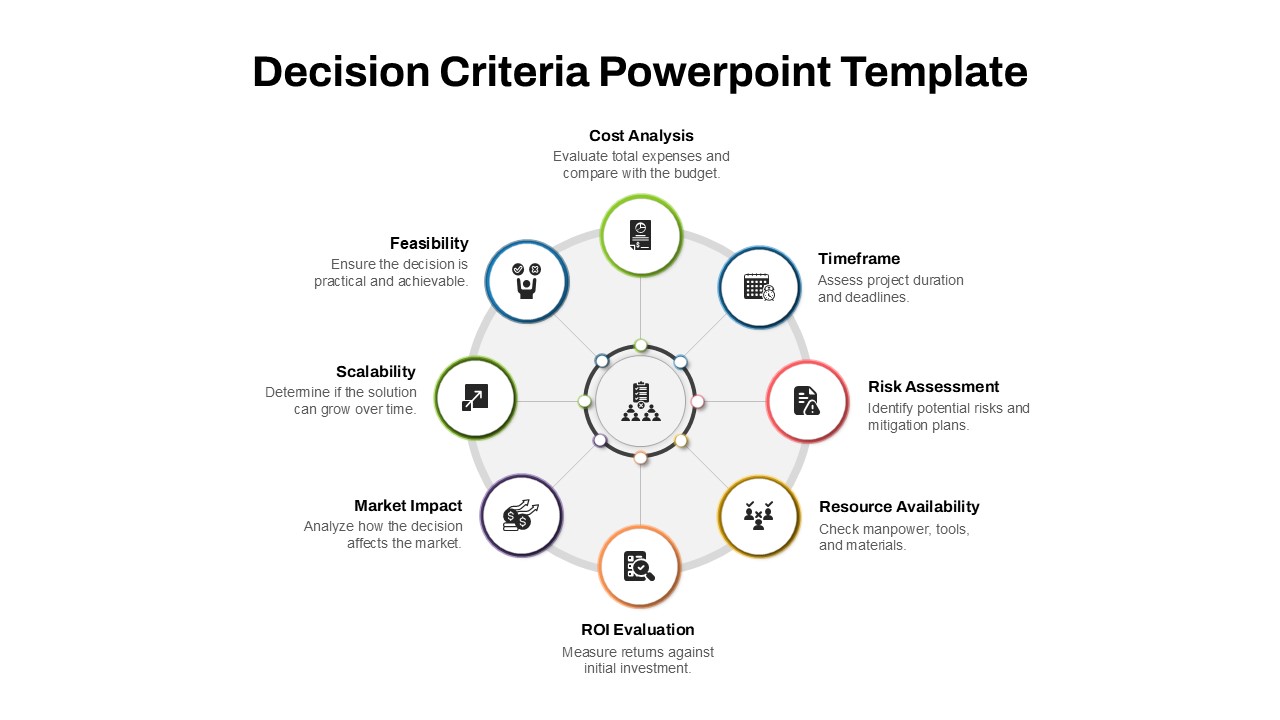
Decision Criteria Template for PowerPoint & Google Slides
Infographics
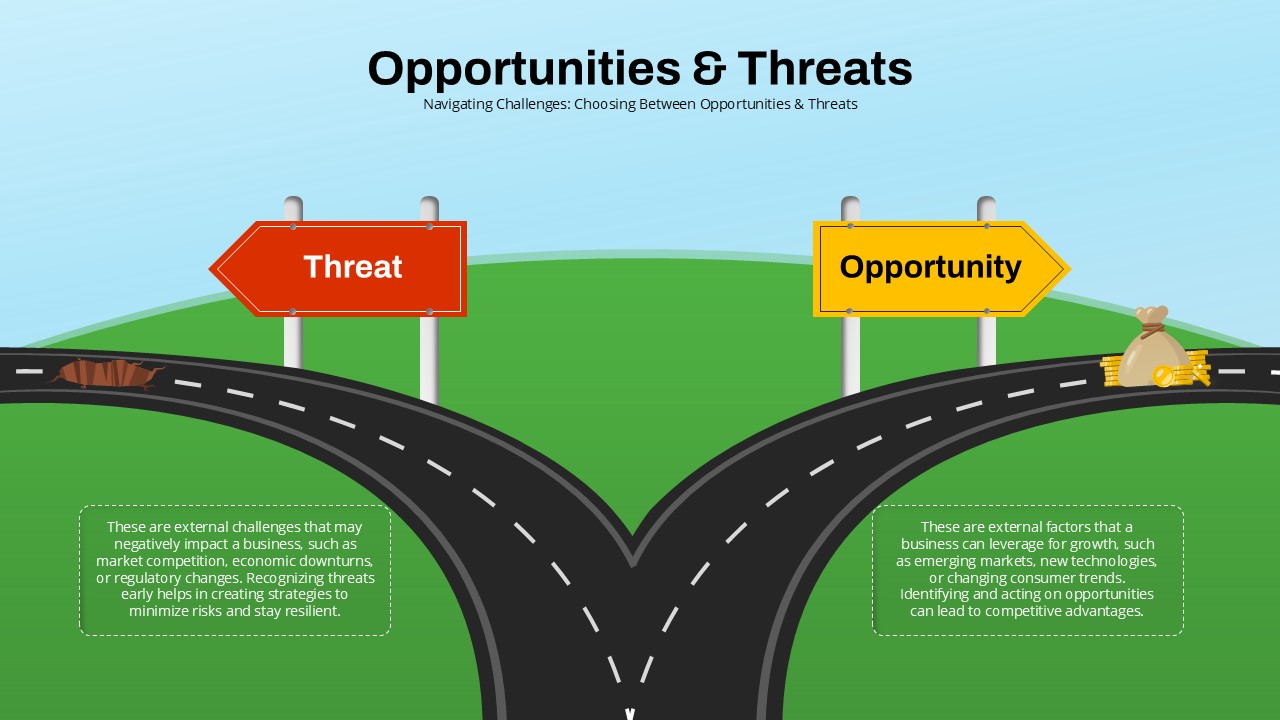
Opportunities & Threats Decision Roadmap Template for PowerPoint & Google Slides
Comparison
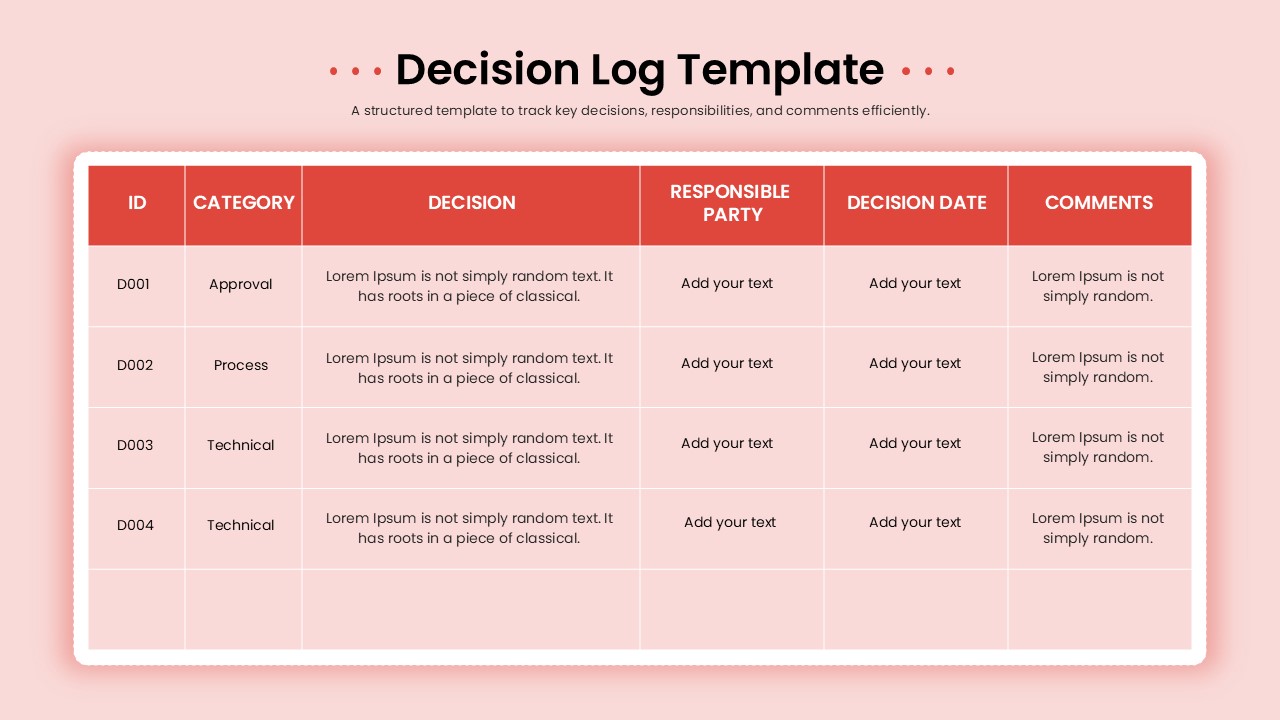
Decision Log Template for PowerPoint & Google Slides
Business
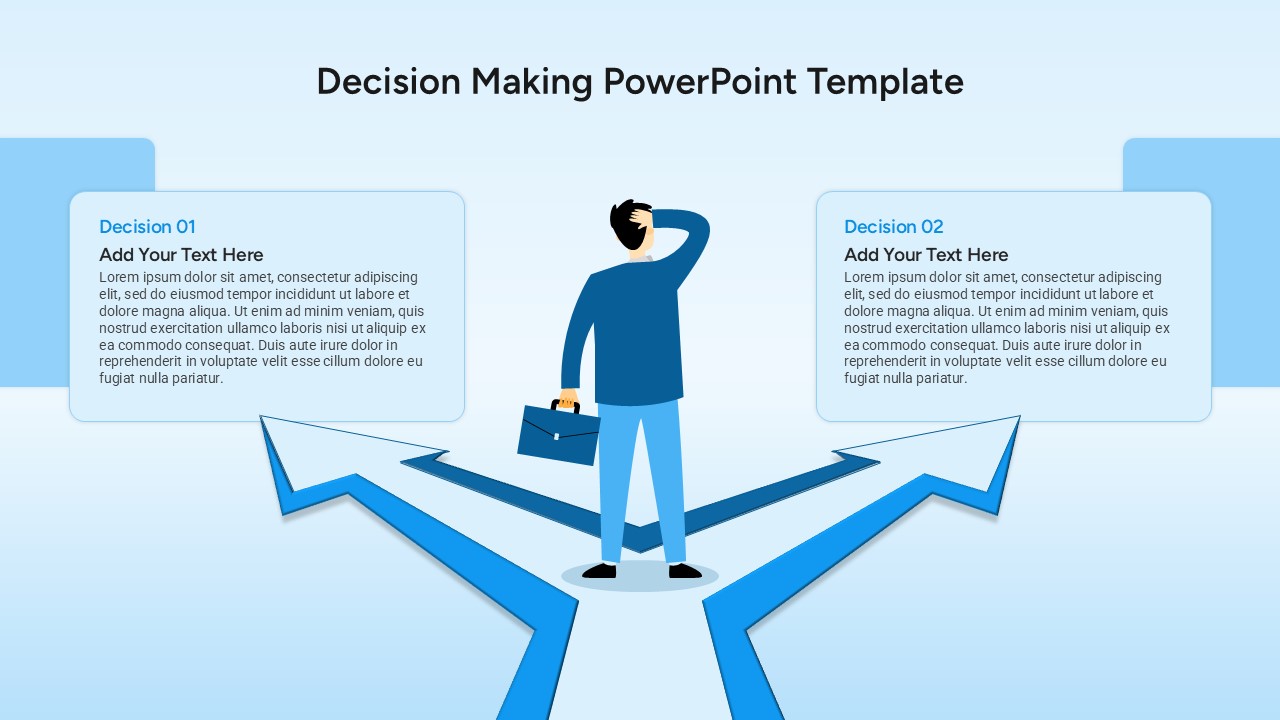
Decision Making Template for PowerPoint & Google Slides
Decision Tree
Data-Driven Decision Making overview template for PowerPoint & Google Slides
Business
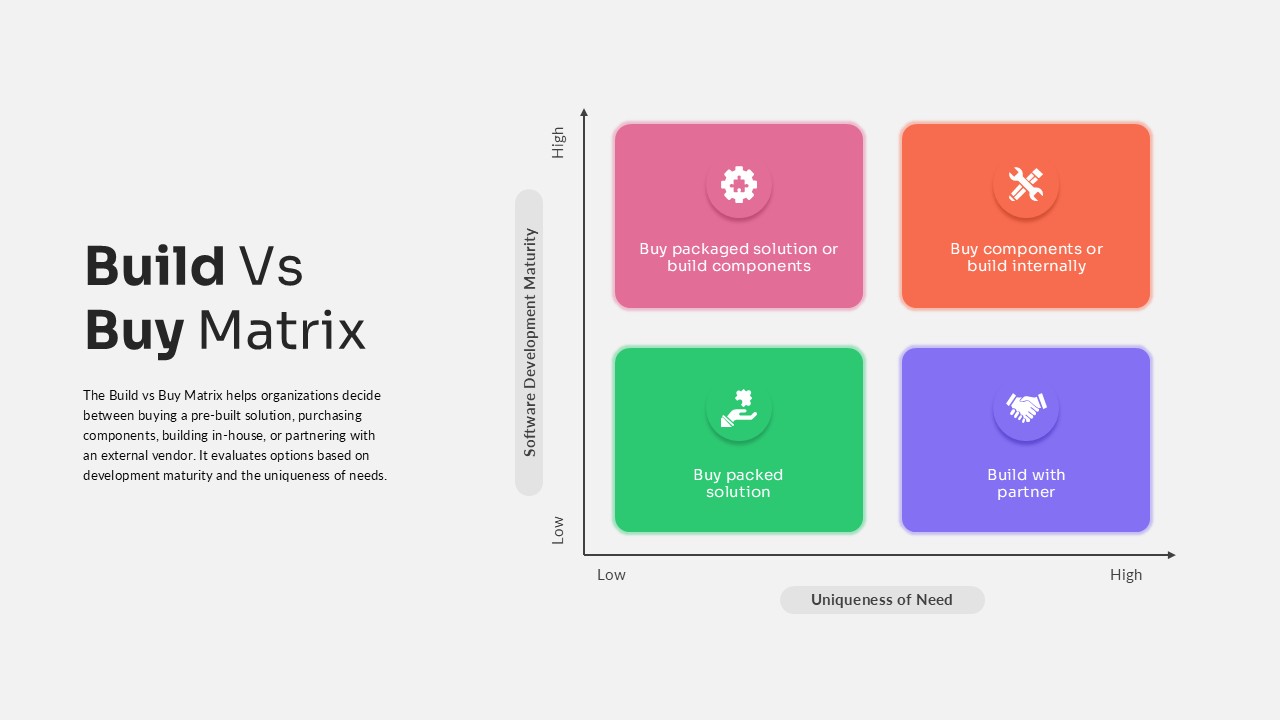
Build vs Buy Matrix Decision Framework template for PowerPoint & Google Slides
Business Strategy
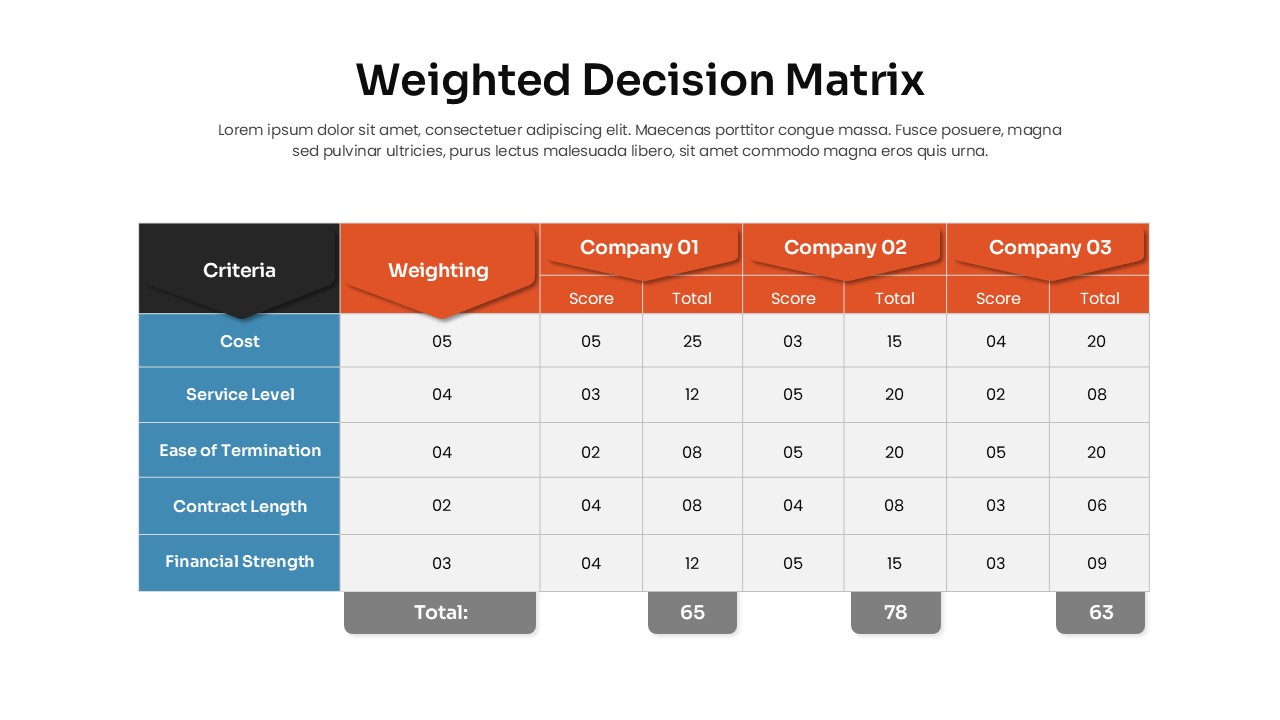
Weighted Decision Matrix template for PowerPoint & Google Slides
Business Models
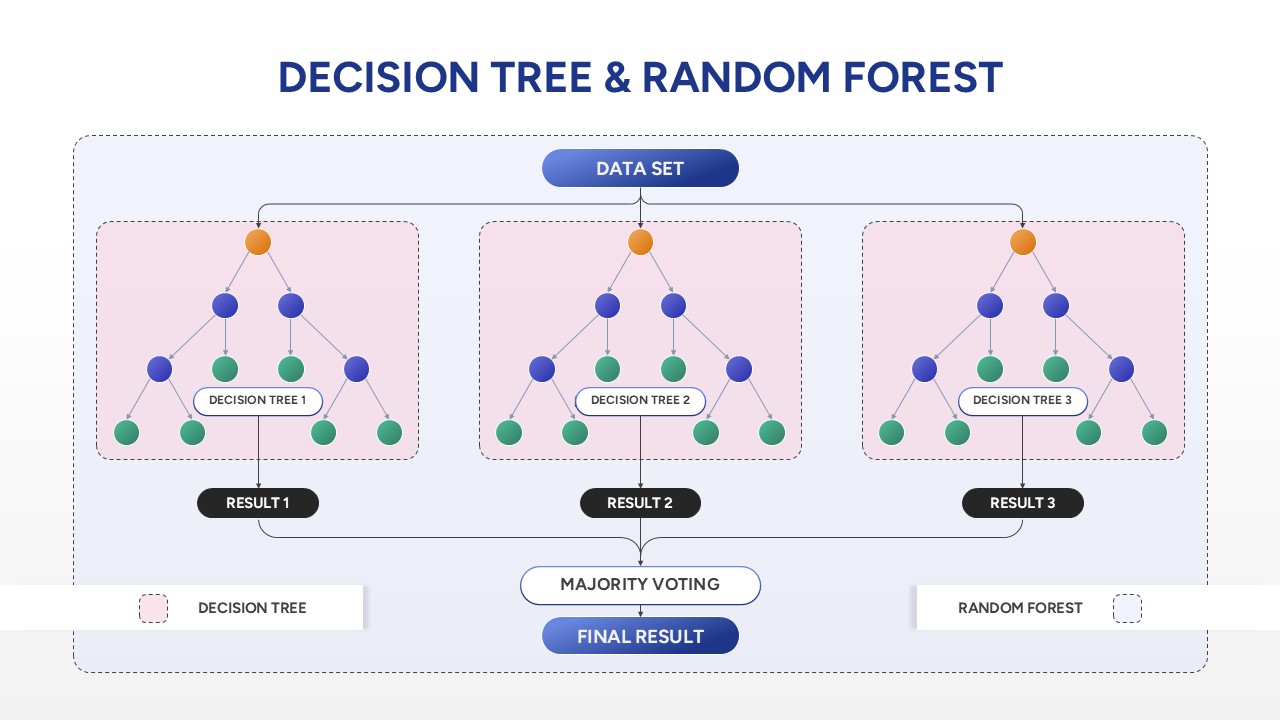
Decision Tree & Random Forest template for PowerPoint & Google Slides
Technology
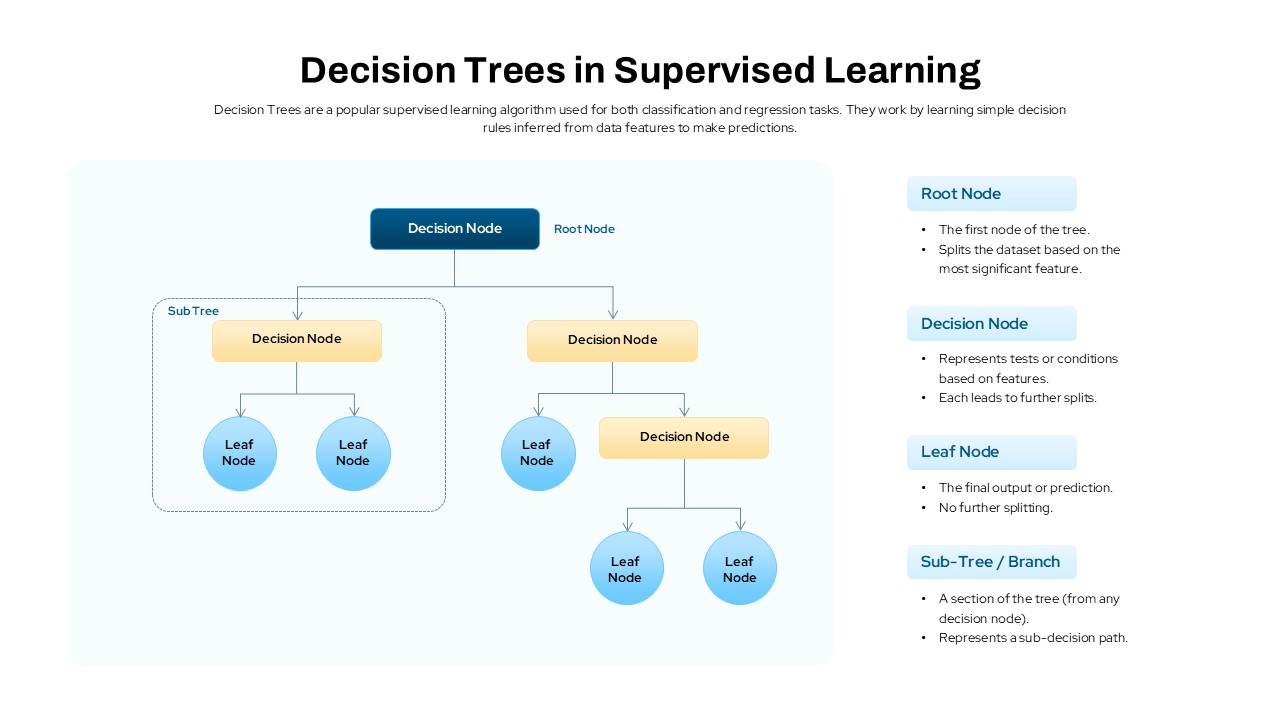
Decision Trees in Supervised Learning Template for PowerPoint & Google Slides
Machine Learning
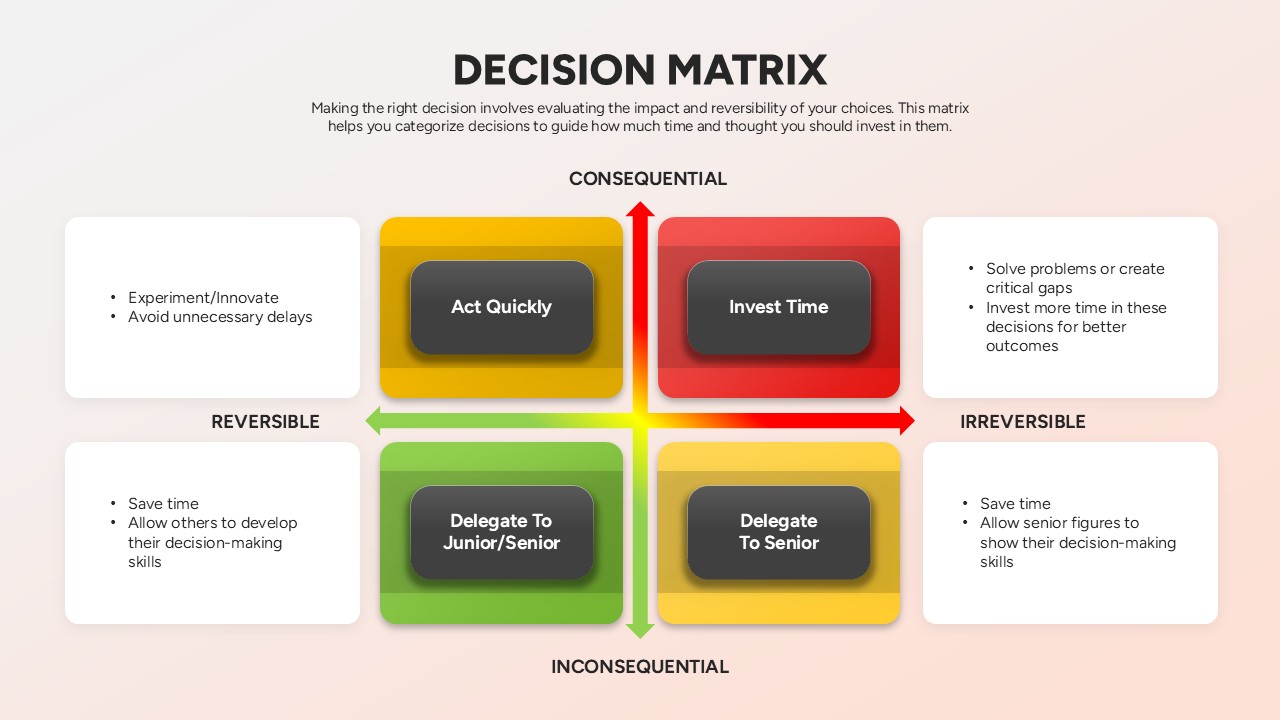
Decision Matrix Evaluation Framework Slide Template for PowerPoint & Google Slides
Leadership
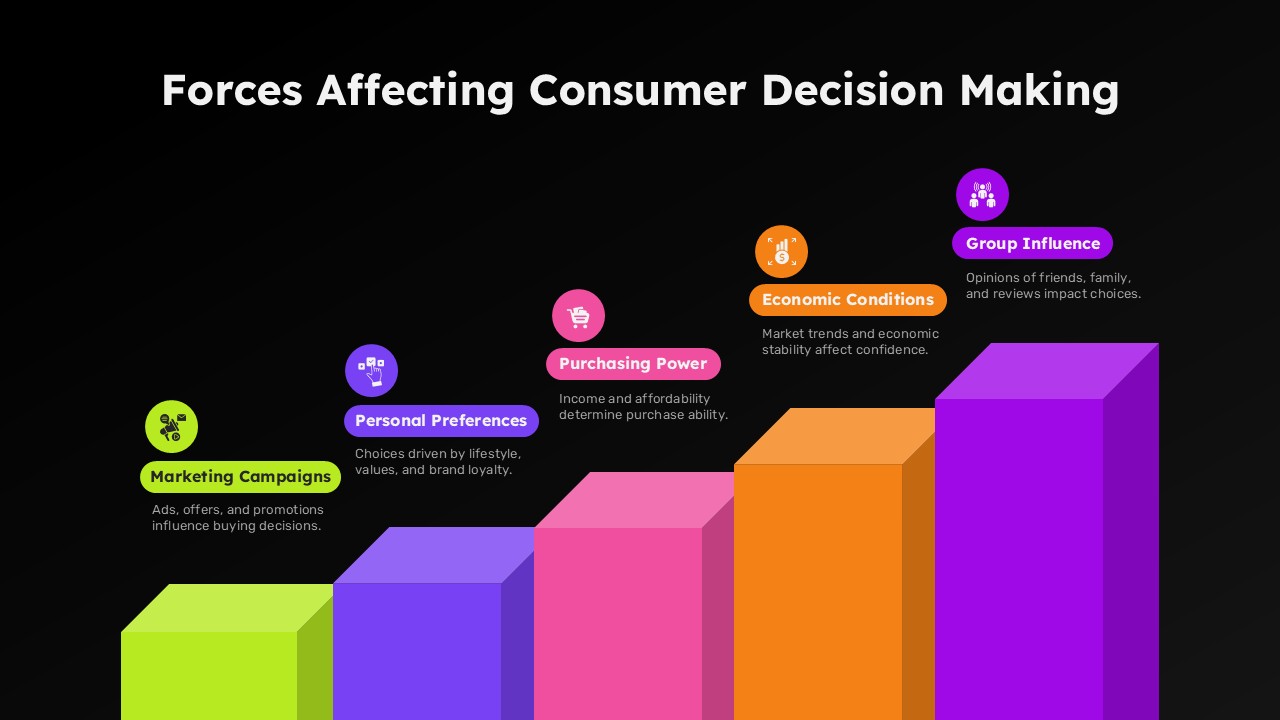
Forces Affecting Consumer Decision Making Template for PowerPoint & Google Slides
Marketing
Snake Diagram Pack of 8 Slides template for PowerPoint & Google Slides
Process
Gear Process Diagram PowerPoint Template for PowerPoint & Google Slides
Process
Sales Process Workflow Funnel Diagram PowerPoint Template for PowerPoint & Google Slides
Funnel
Puzzle Diagram PowerPoint Template for PowerPoint & Google Slides
Process
Transportation Logistics PowerPoint Diagram template for PowerPoint & Google Slides
Process
Emoji Scale PowerPoint Diagram for PowerPoint & Google Slides
Infographics
4 Step Problem Solving PowerPoint Diagram for PowerPoint & Google Slides
Process
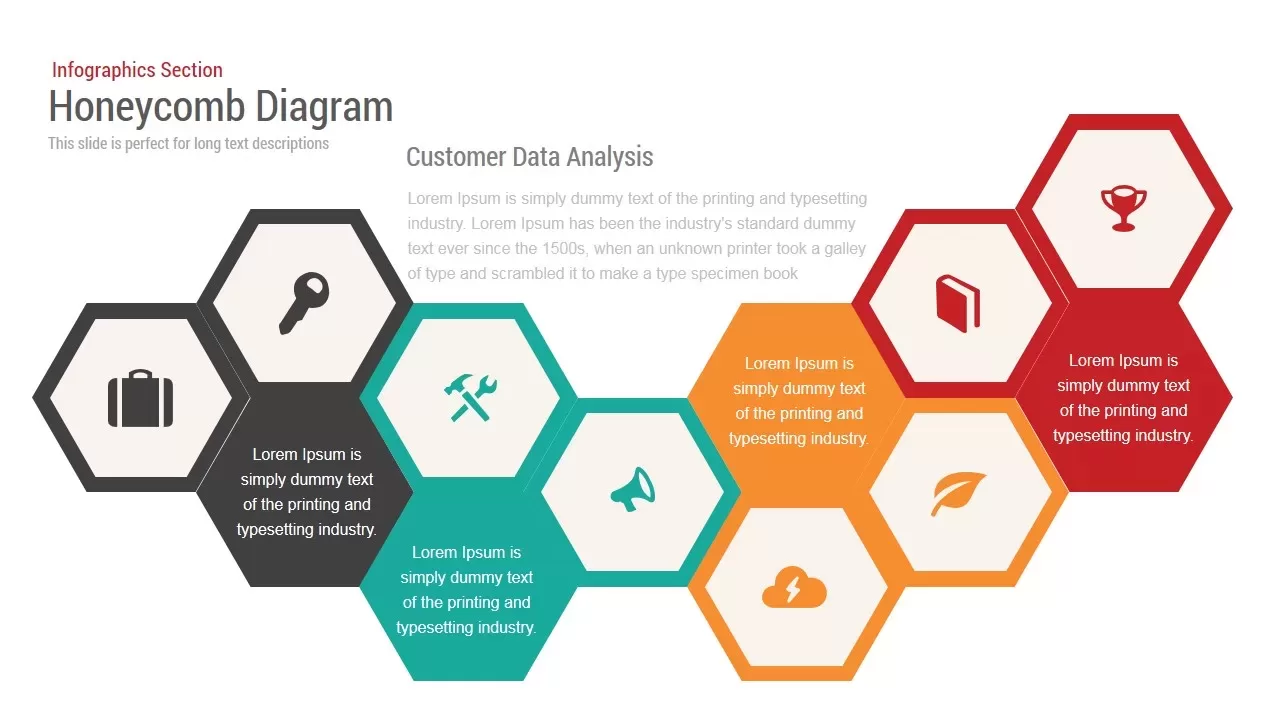
Honeycomb Diagram template for PowerPoint & Google Slides
Infographics
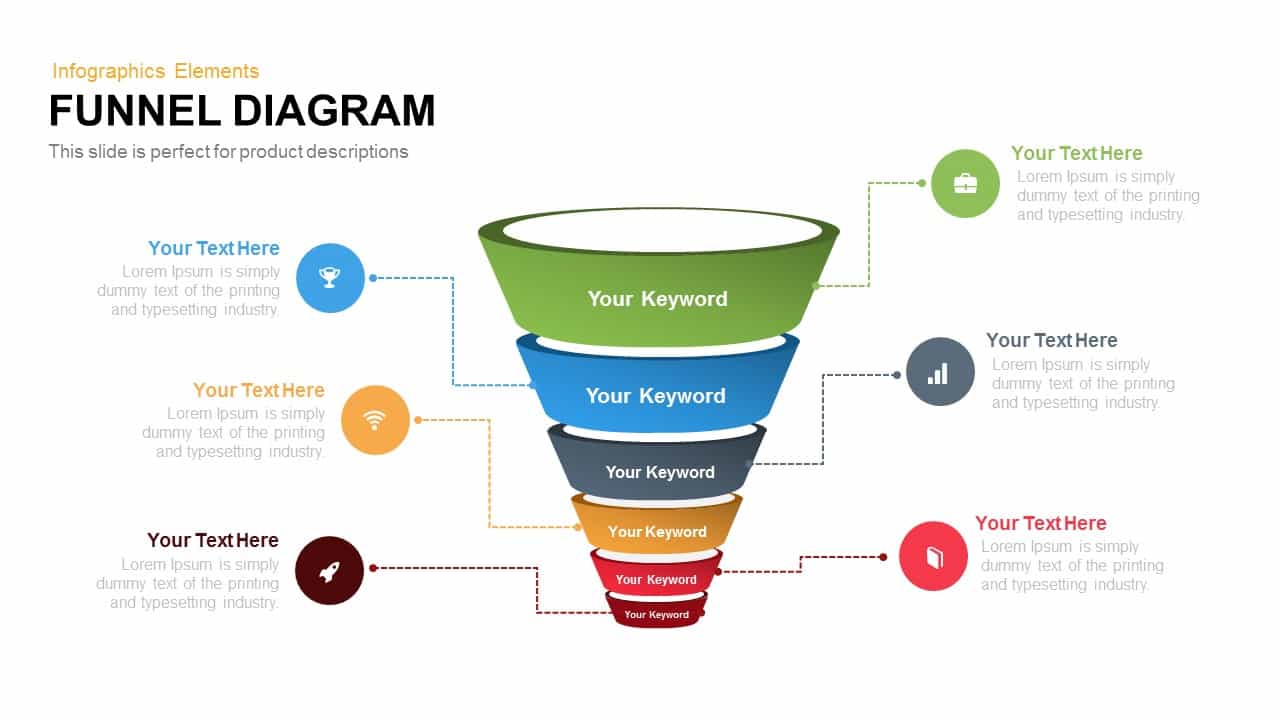
Funnel Diagram Template for PowerPoint & Google Slides
Infographics
6-Step Arrow Process Diagram Template for PowerPoint & Google Slides
Process
Colorful Arrow Process Diagram Template for PowerPoint & Google Slides
Arrow
Five Up Arrow Infographic Diagram Template for PowerPoint & Google Slides
Arrow
Gear Process Phase Diagram template for PowerPoint & Google Slides
Process
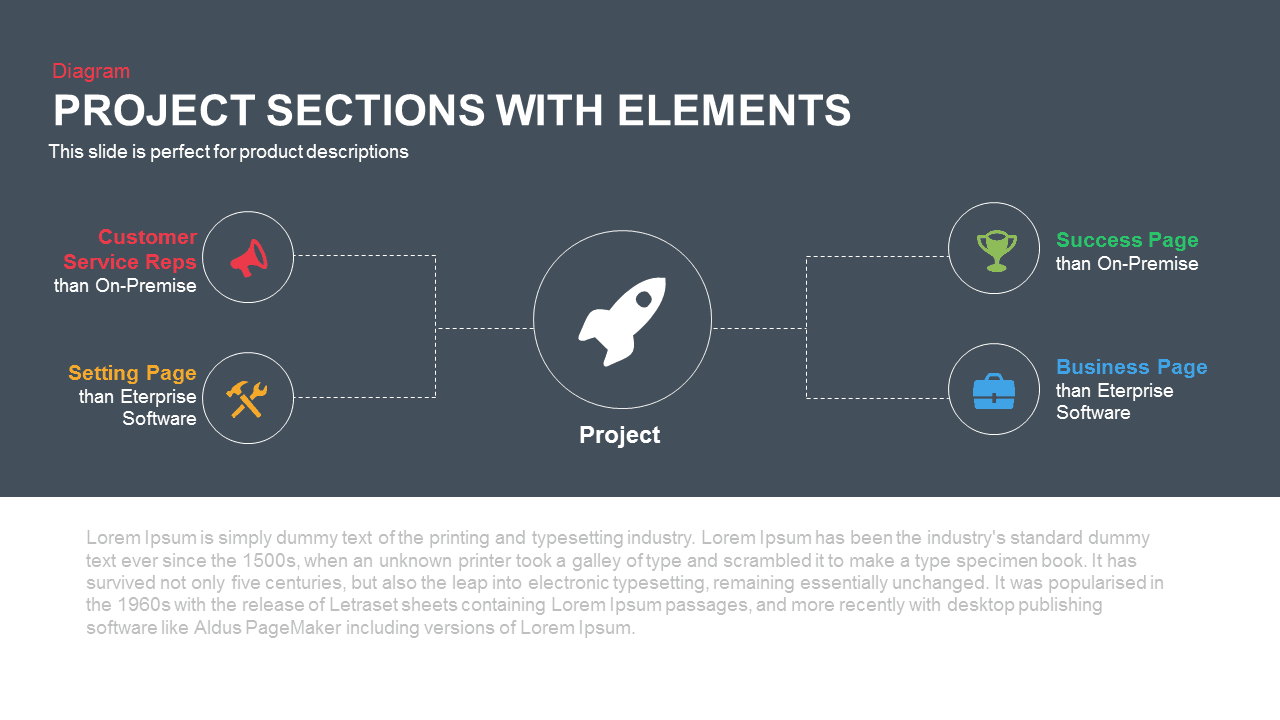
Project Sections Hub-and-Spoke Diagram template for PowerPoint & Google Slides
Flow Charts

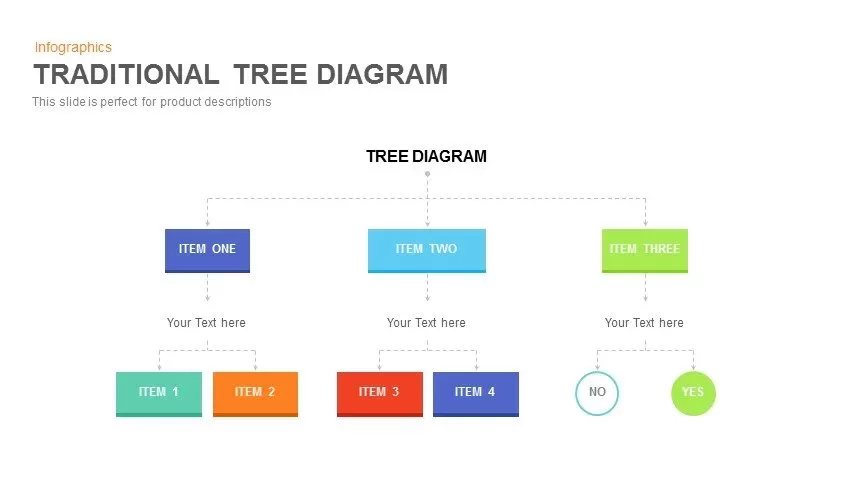
Editable Hierarchical Tree Diagram Template for PowerPoint & Google Slides
Decision Tree
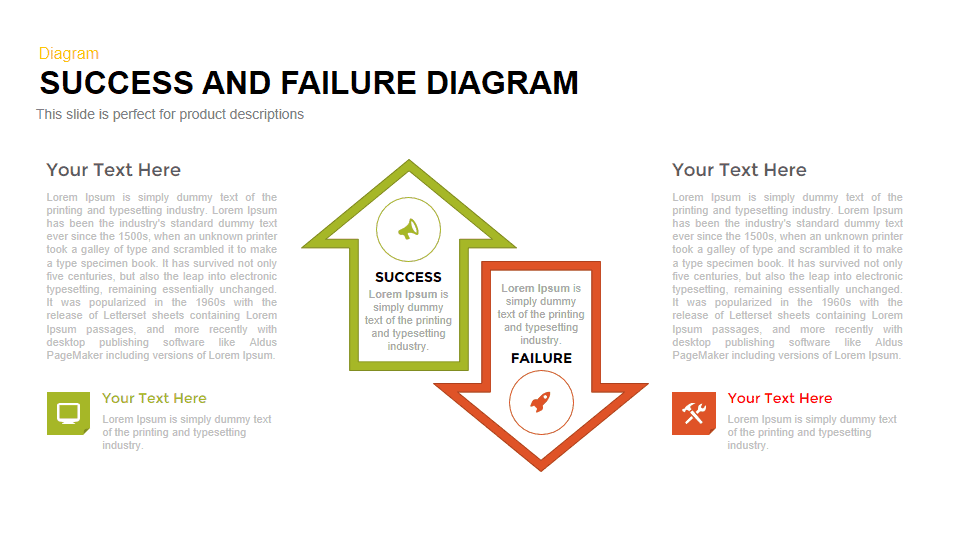
Success vs Failure Comparison Diagram Template for PowerPoint & Google Slides
Comparison
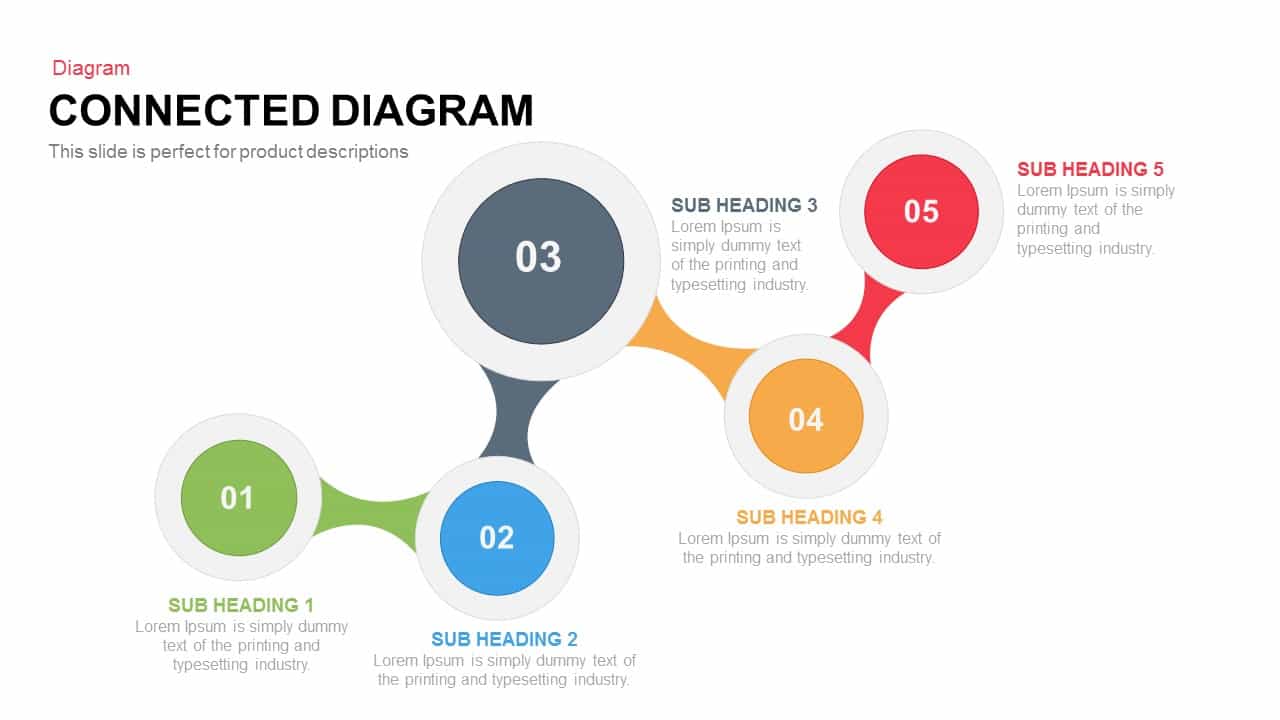
Interactive Connected Network Diagram Template for PowerPoint & Google Slides
Process
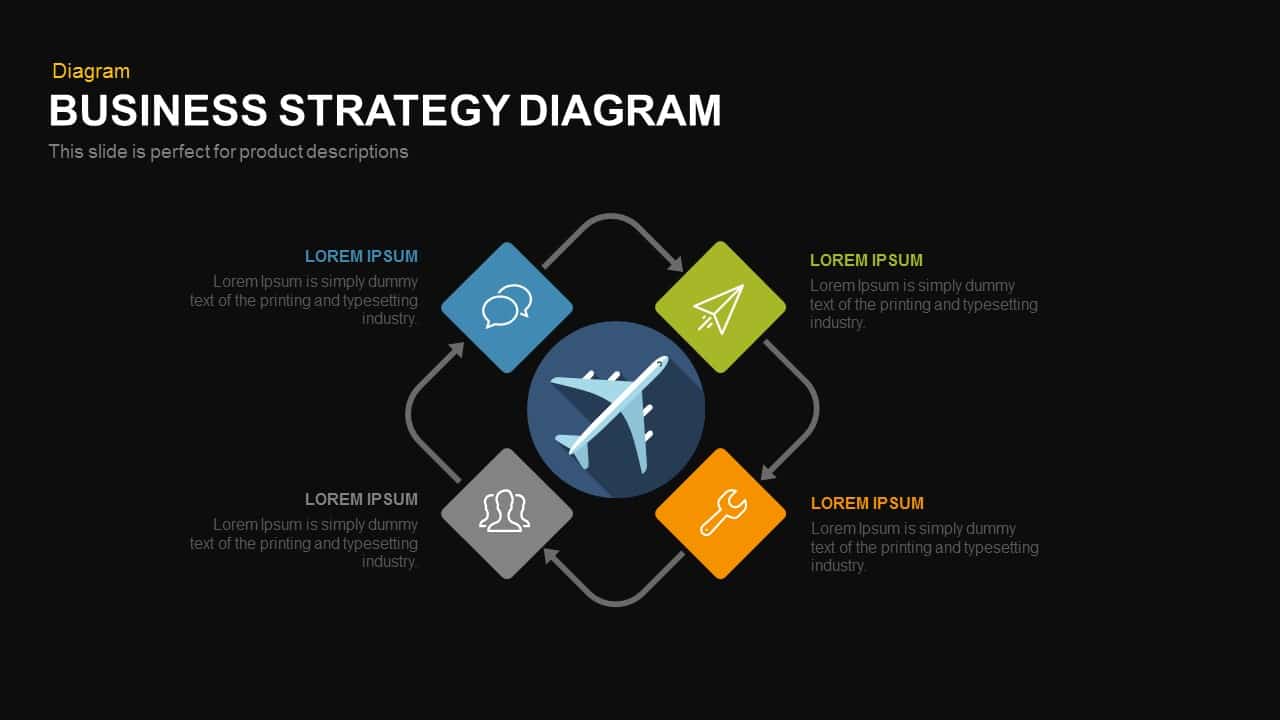
Strategic Business Diamond Diagram Template for PowerPoint & Google Slides
Business Strategy
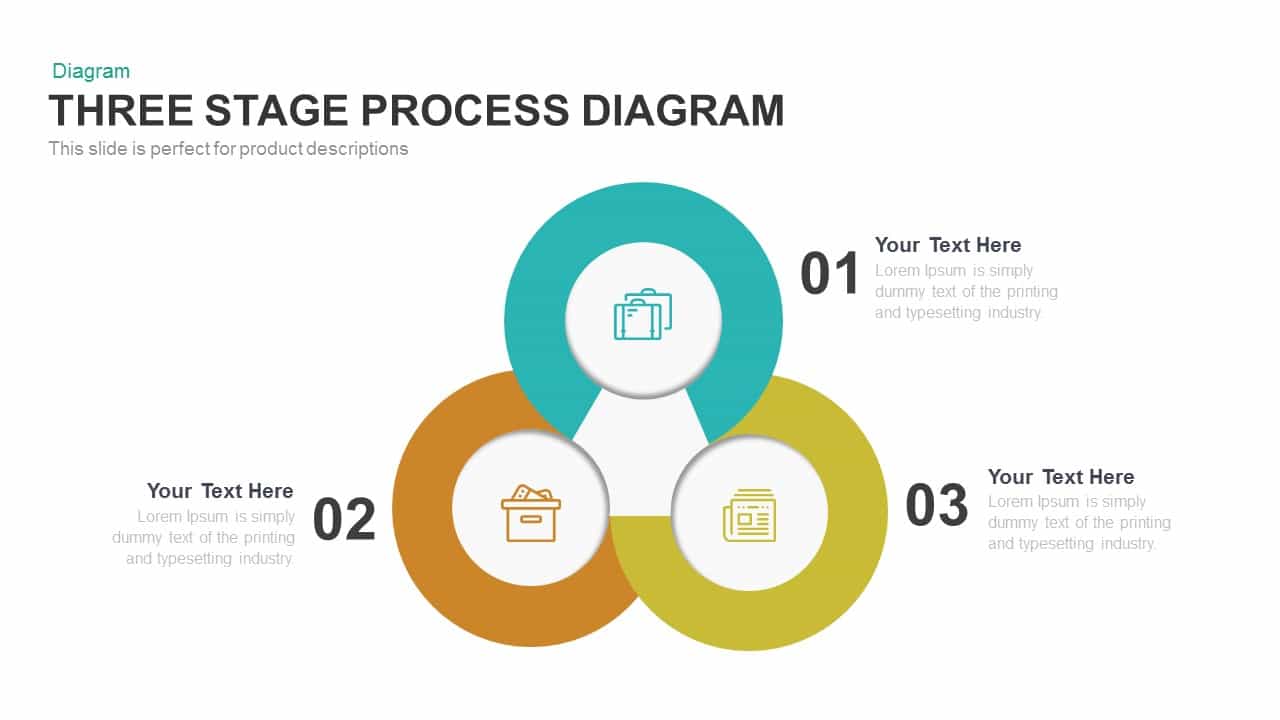
Engaging Three-Stage Process Diagram Template for PowerPoint & Google Slides
Process
Six-Sided Shutter Diagram Process Flow Template for PowerPoint & Google Slides
Process
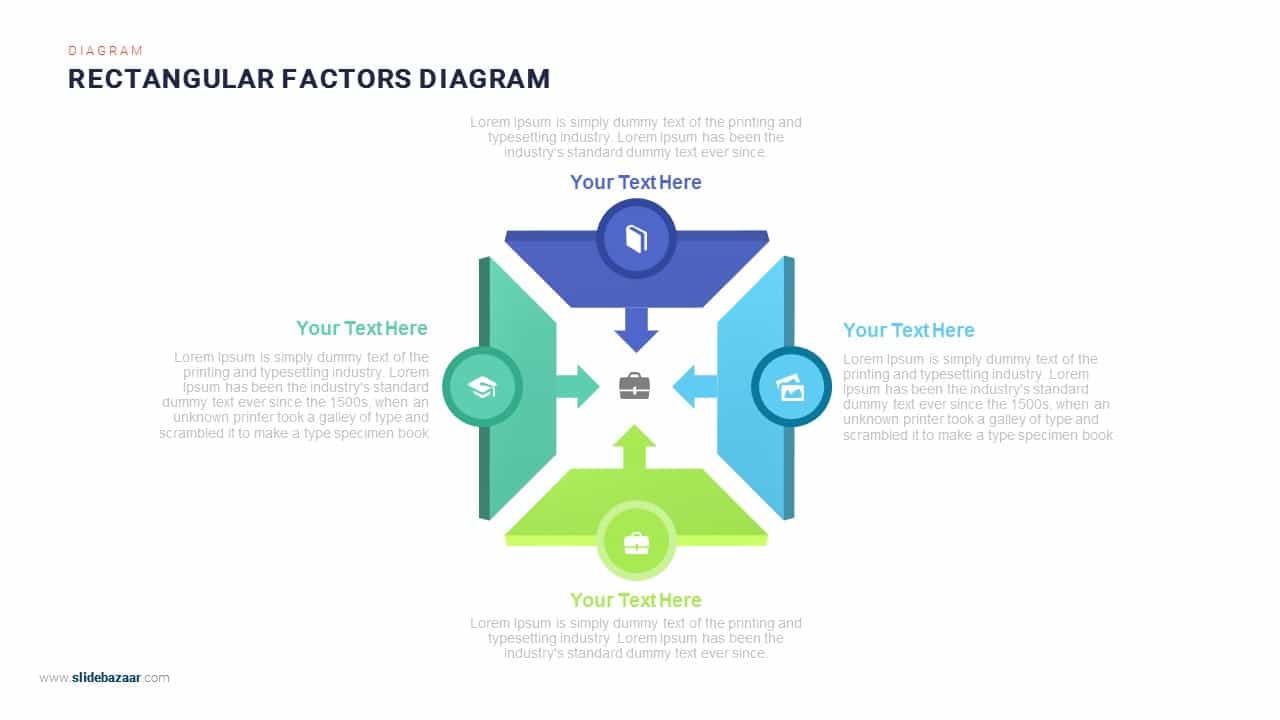
Four-Arrows Rectangular Factors Diagram Template for PowerPoint & Google Slides
Process
Six-Process Circular Arrow Diagram Template for PowerPoint & Google Slides
Circular
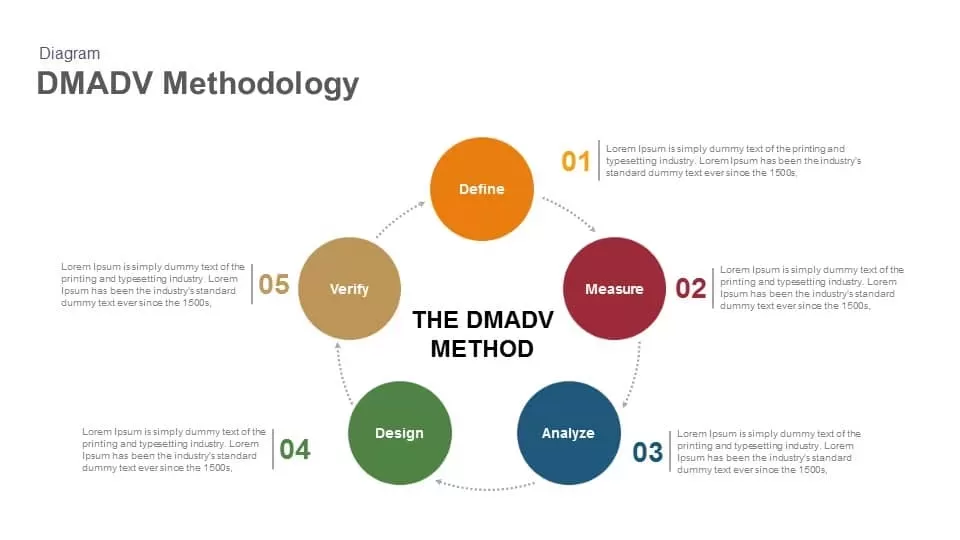
DMADV Methodology Diagram template for PowerPoint & Google Slides
Process
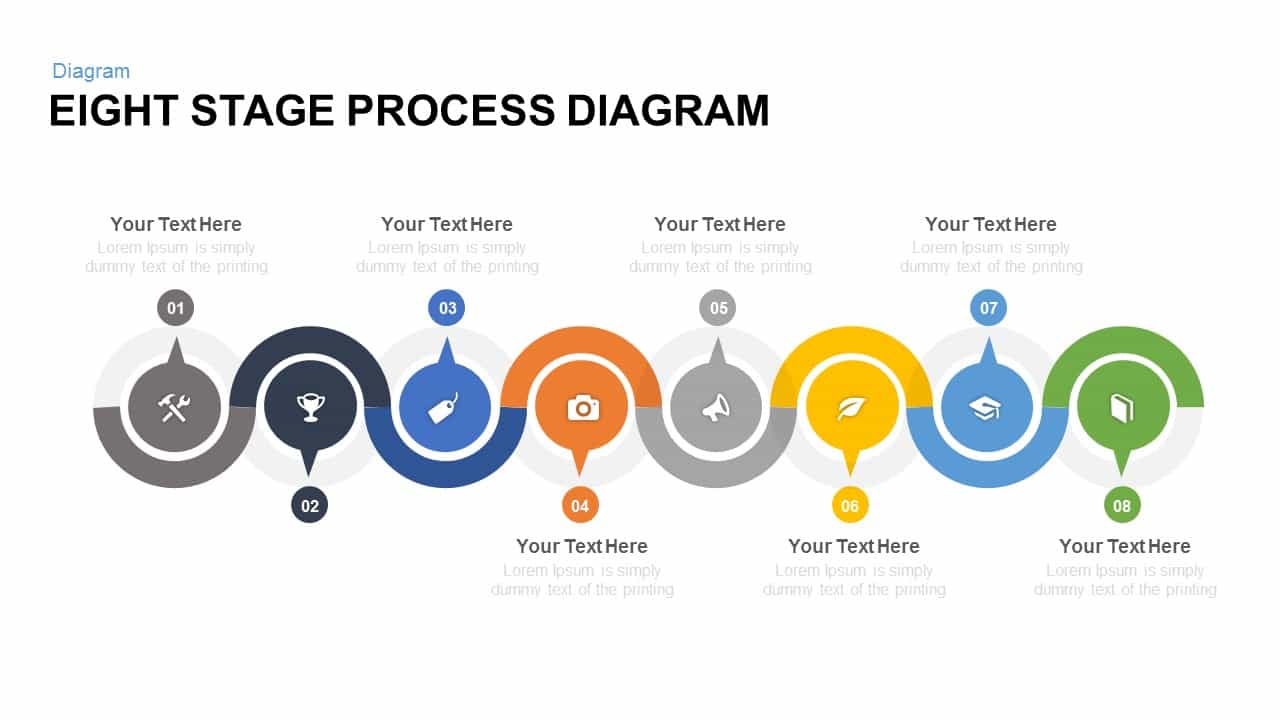
Eight Stage Process Diagram template for PowerPoint & Google Slides
Process
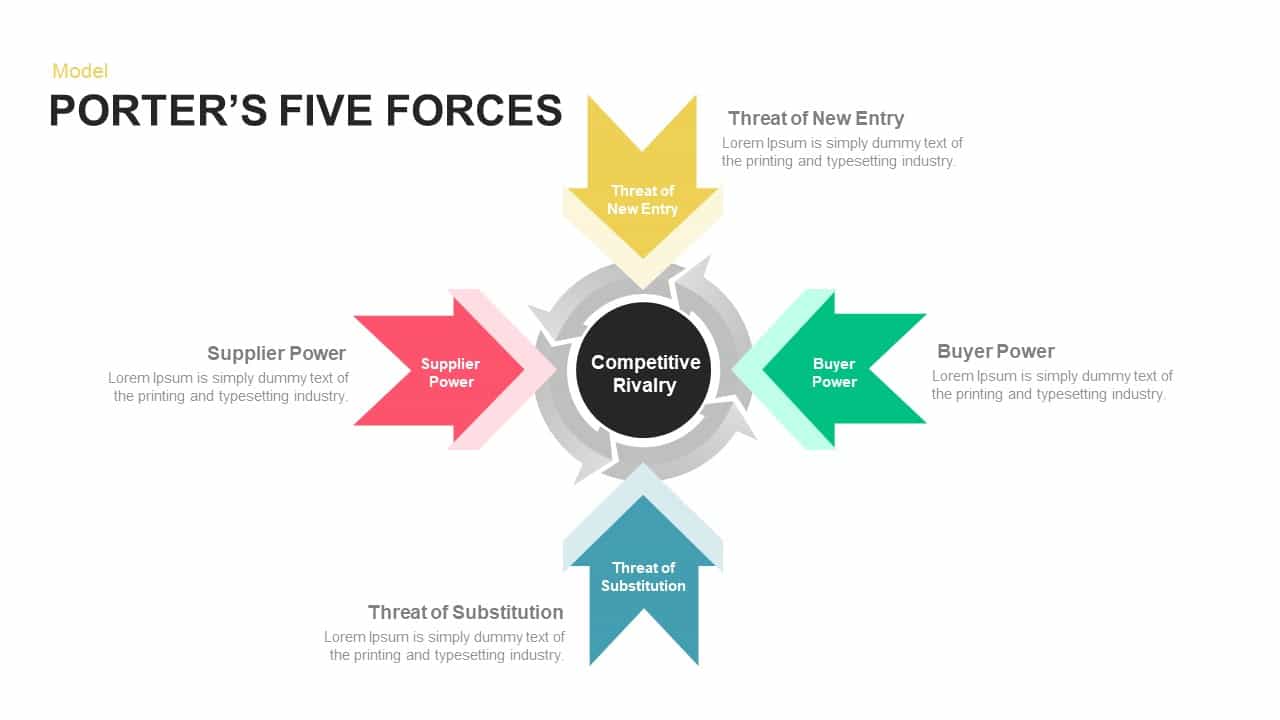
Porter’s Five Forces Model Diagram Template for PowerPoint & Google Slides
Competitor Analysis

Four-Staged Business Arrow Diagram Template for PowerPoint & Google Slides
Process
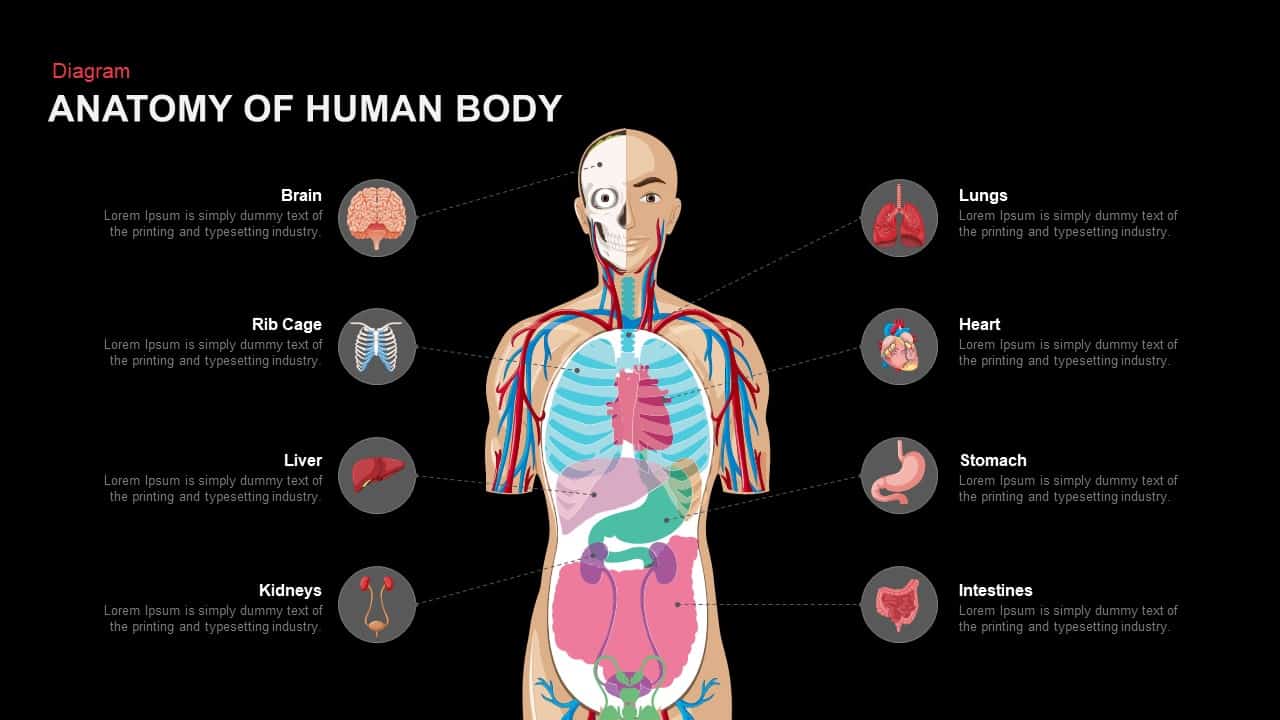
Anatomy of the Human Body Diagram Template for PowerPoint & Google Slides
Health
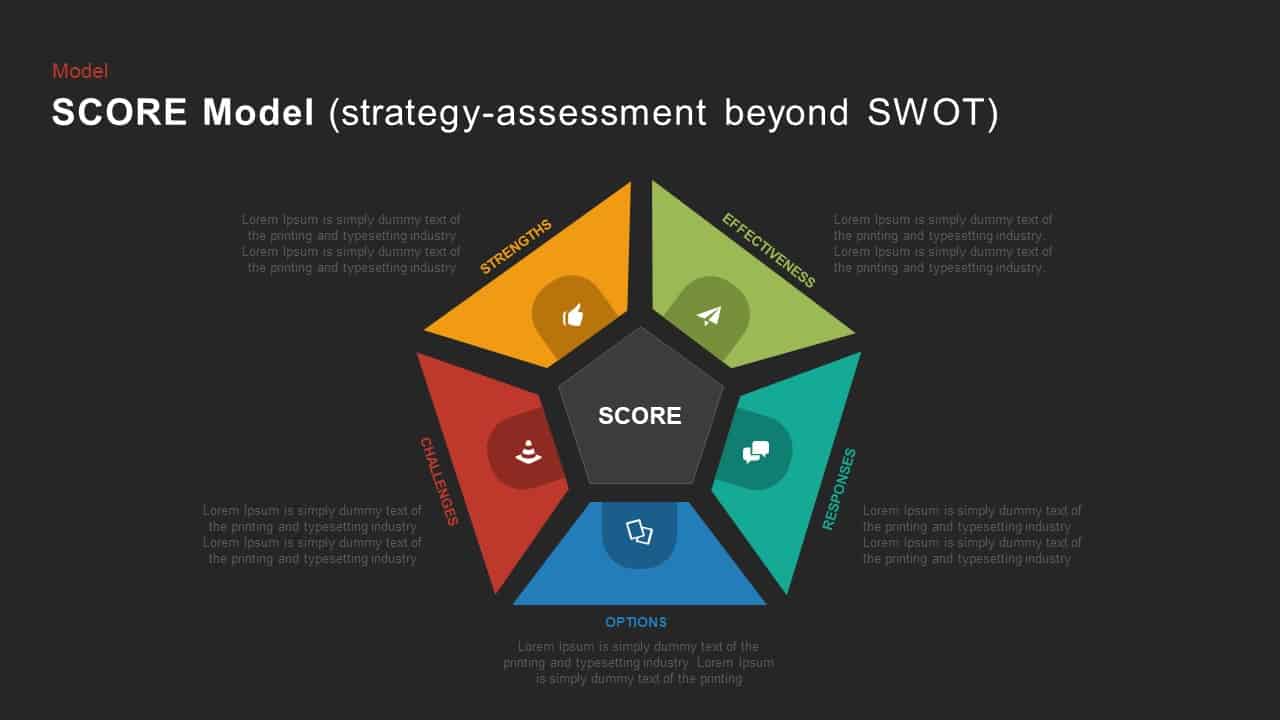
SCORE Model Pentagon Assessment Diagram Template for PowerPoint & Google Slides
Circular
4 Step Revenue Growth Flow Diagram Template for PowerPoint & Google Slides
Process
Fishbone Cause and Effect Diagram Template for PowerPoint & Google Slides
Process
Venn Diagram Infographics Pack Template for PowerPoint & Google Slides
Circular
Data Management and Analytics Diagram Template for PowerPoint & Google Slides
Circular
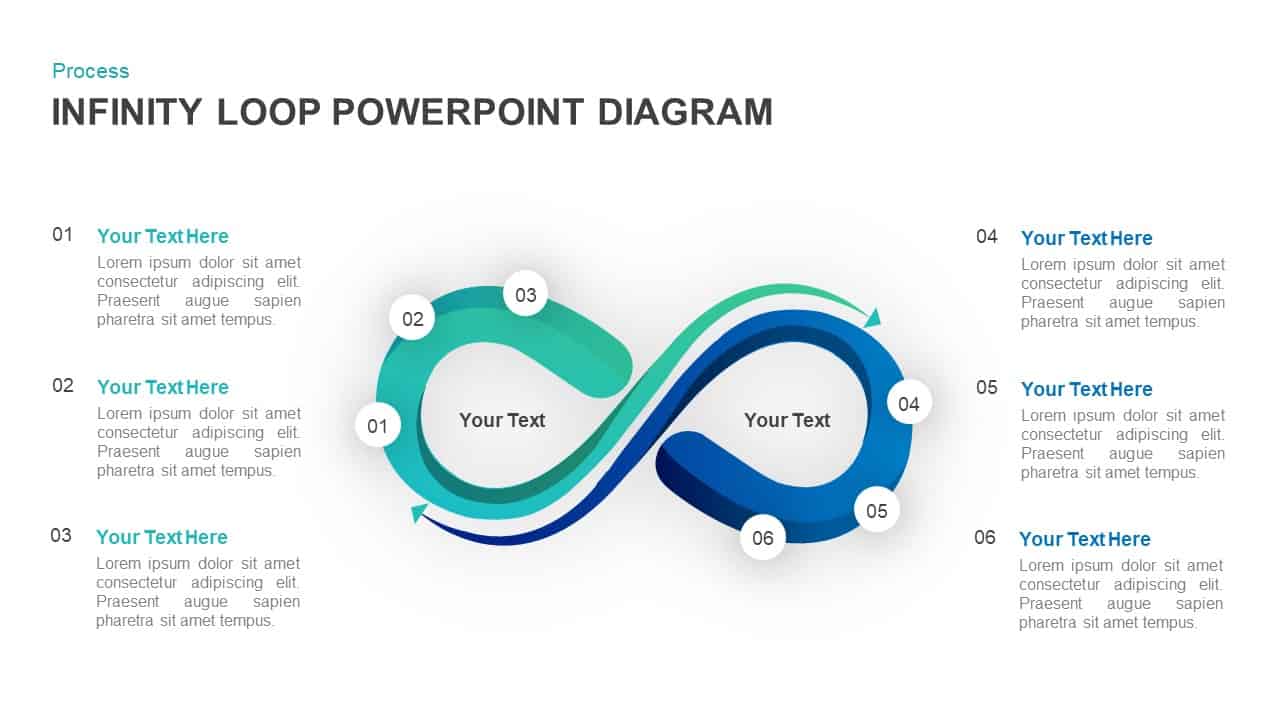
Six-Stage Infinity Loop Process Diagram Template for PowerPoint & Google Slides
Process
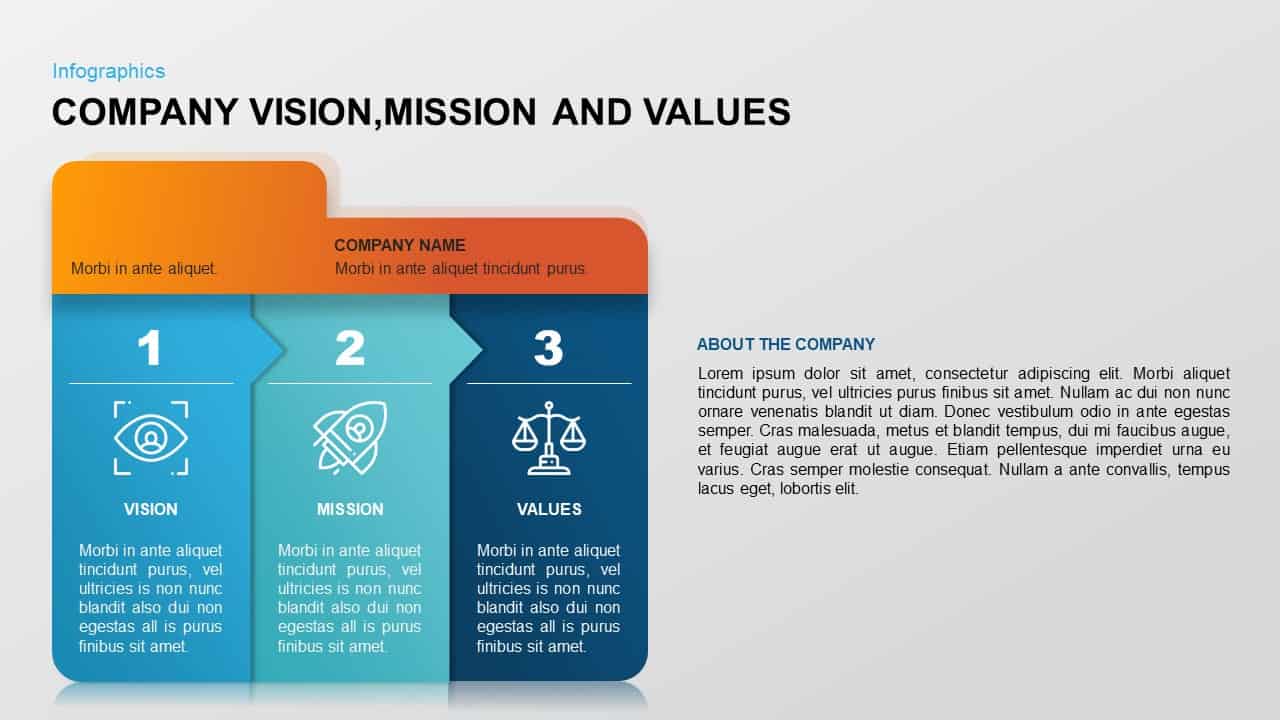
Company Vision, Mission & Values Diagram Template for PowerPoint & Google Slides
Vision and Mission
Four-Stage Circular Flow Diagram Template for PowerPoint & Google Slides
Circular
Data Migration Life Cycle Curved Diagram Template for PowerPoint & Google Slides
Process
8-Step Circular Accounting Cycle Diagram Template for PowerPoint & Google Slides
Accounting
Four-Step Spiral Funnel Diagram Template for PowerPoint & Google Slides
Funnel
Financial Agreement Signing Flow Diagram Template for PowerPoint & Google Slides
Process
6-Step Circular Diagram Infographic Template for PowerPoint & Google Slides
Circular

IT Strategic Diagram Infographic Pack Template for PowerPoint & Google Slides
Business Strategy
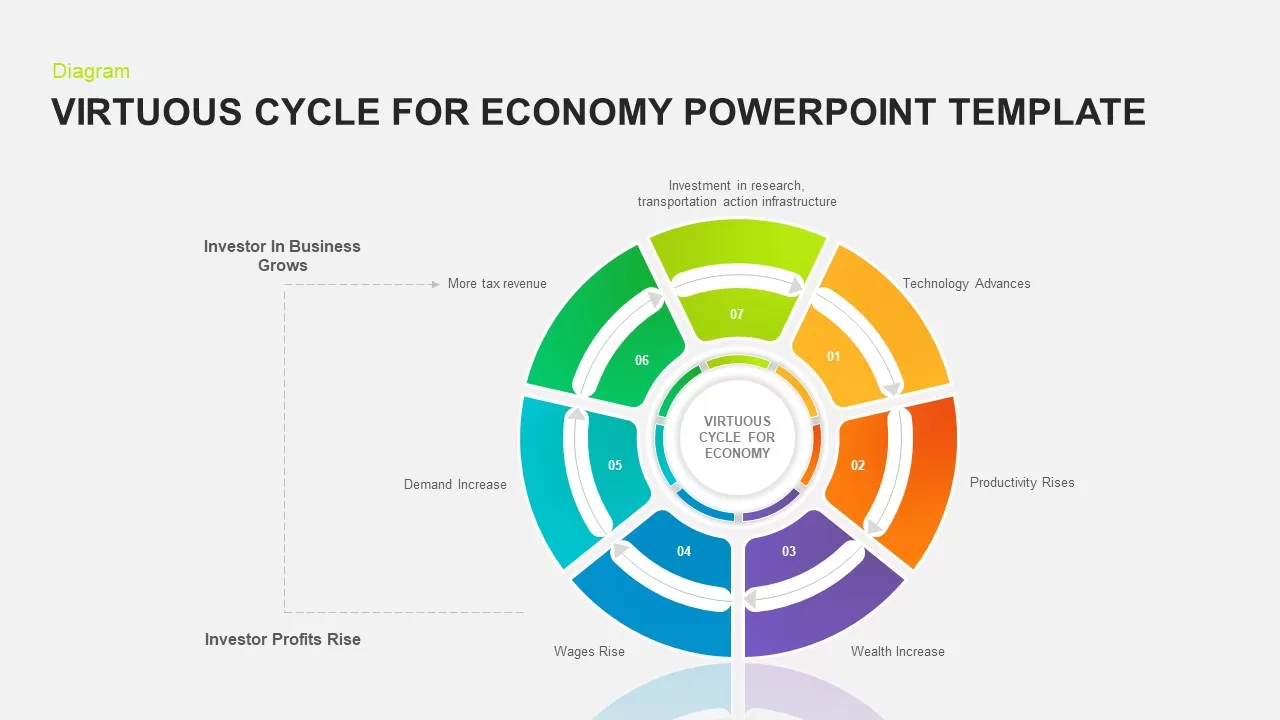
7-Step Virtuous Economy Cycle Diagram Template for PowerPoint & Google Slides
Process
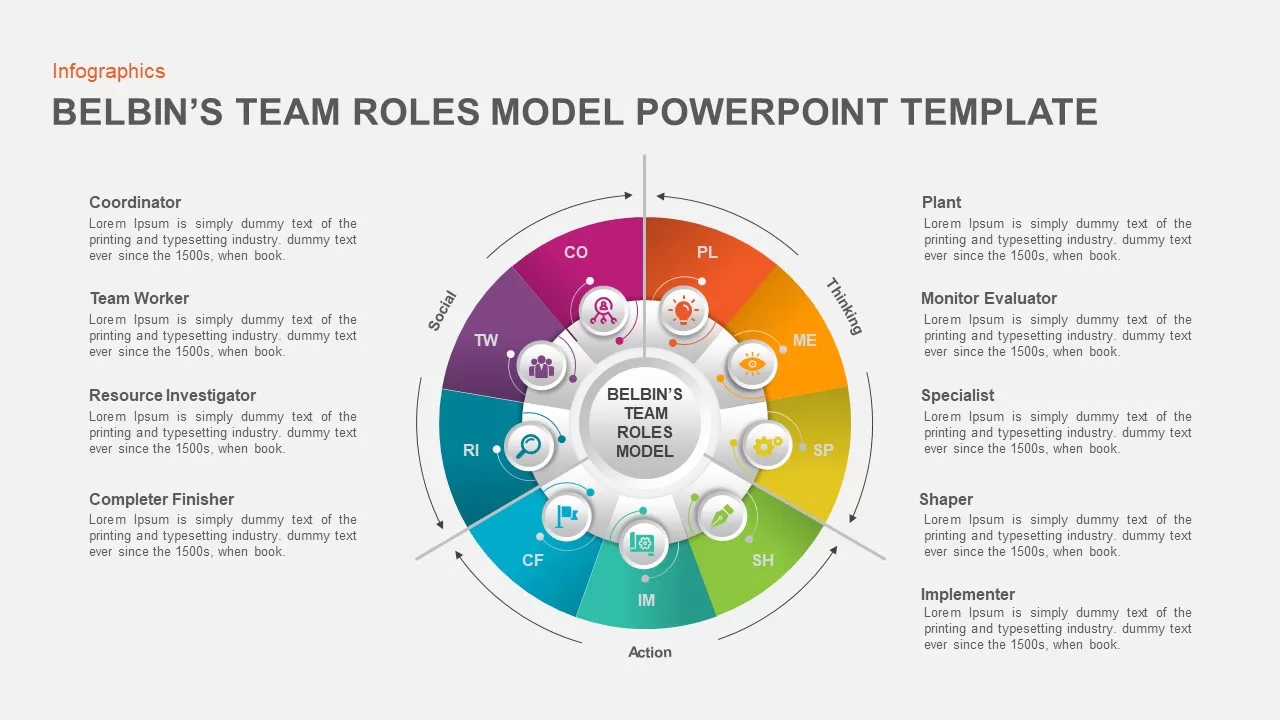
Belbin’s Team Roles Model Diagram Template for PowerPoint & Google Slides
HR
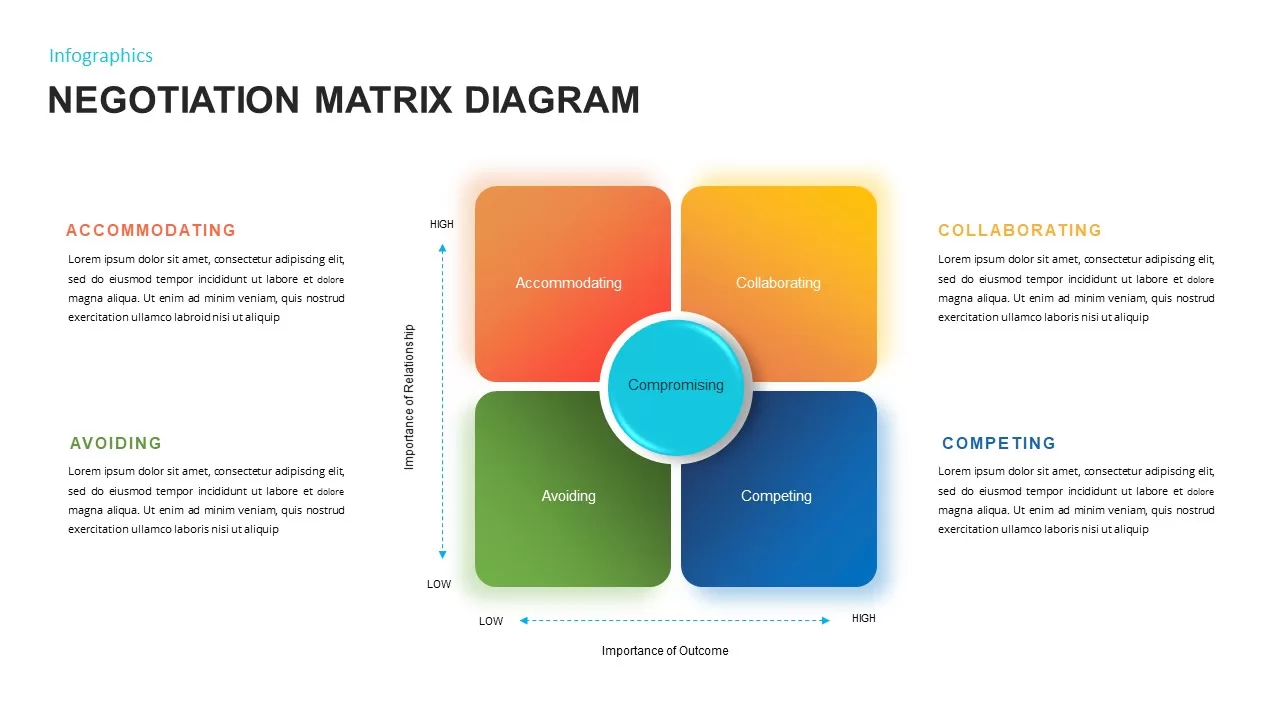
Negotiation Matrix Diagram Template for PowerPoint & Google Slides
Business
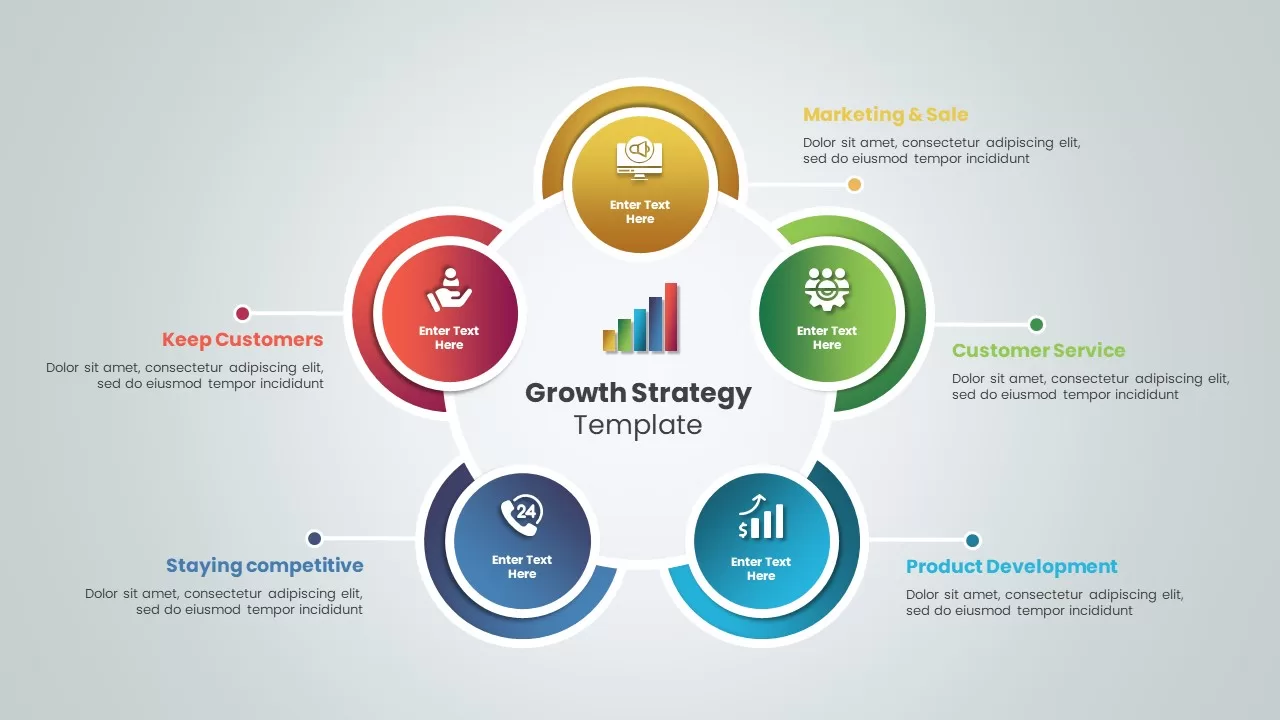
Growth Strategy Circular Diagram Template for PowerPoint & Google Slides
Circular
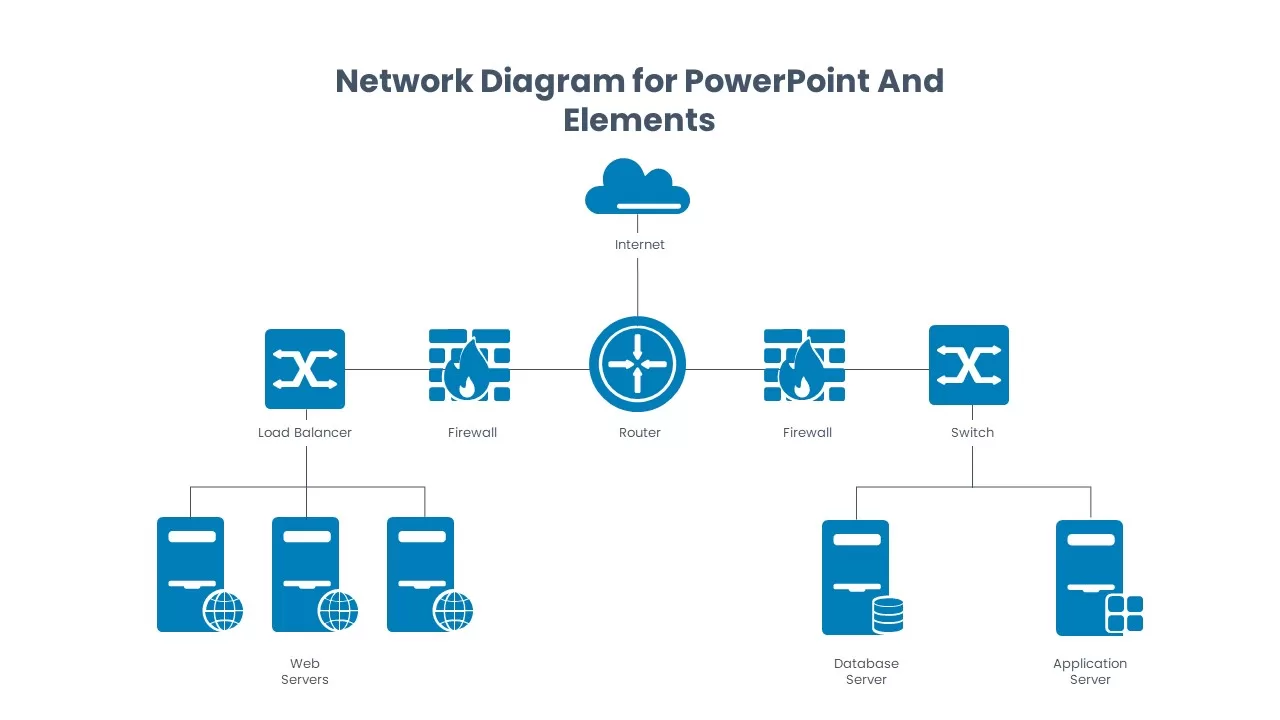
Network Diagram Elements and Icons Pack Template for PowerPoint & Google Slides
Information Technology
Curved Arrow Process Flow Diagram Template for PowerPoint & Google Slides
Process
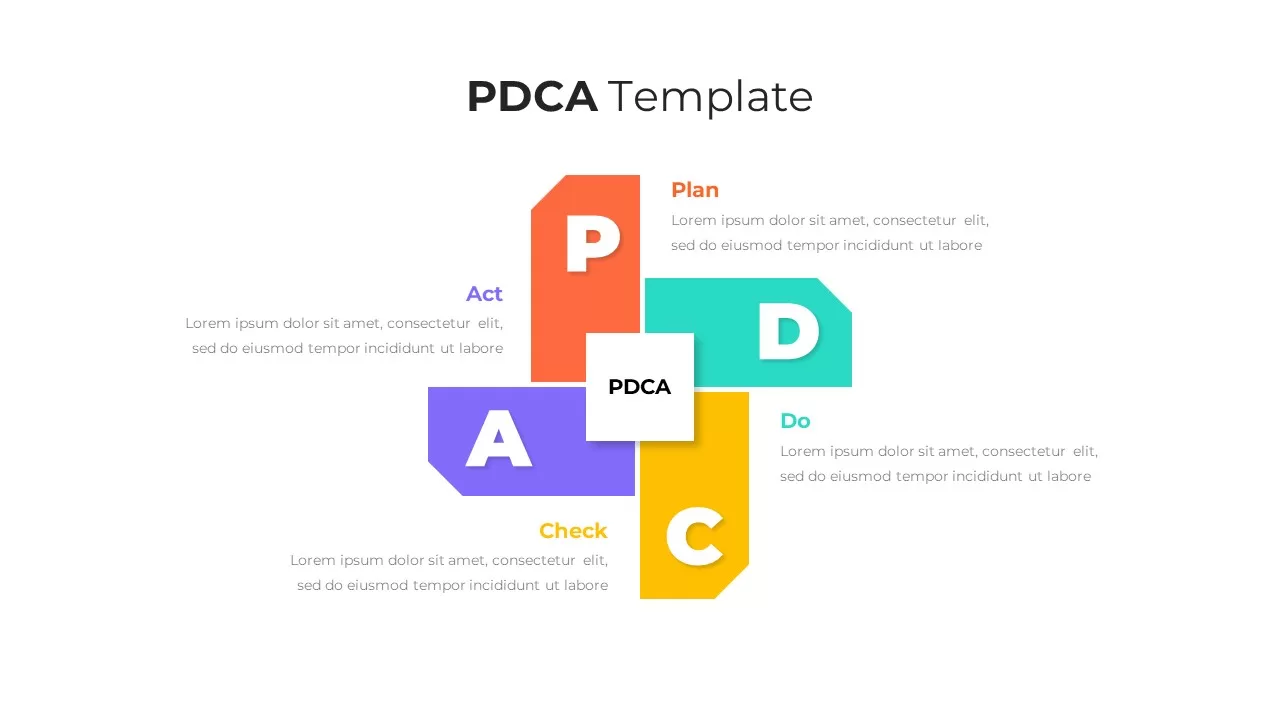
Elegant PDCA Four-Step Process Diagram Template for PowerPoint & Google Slides
Process
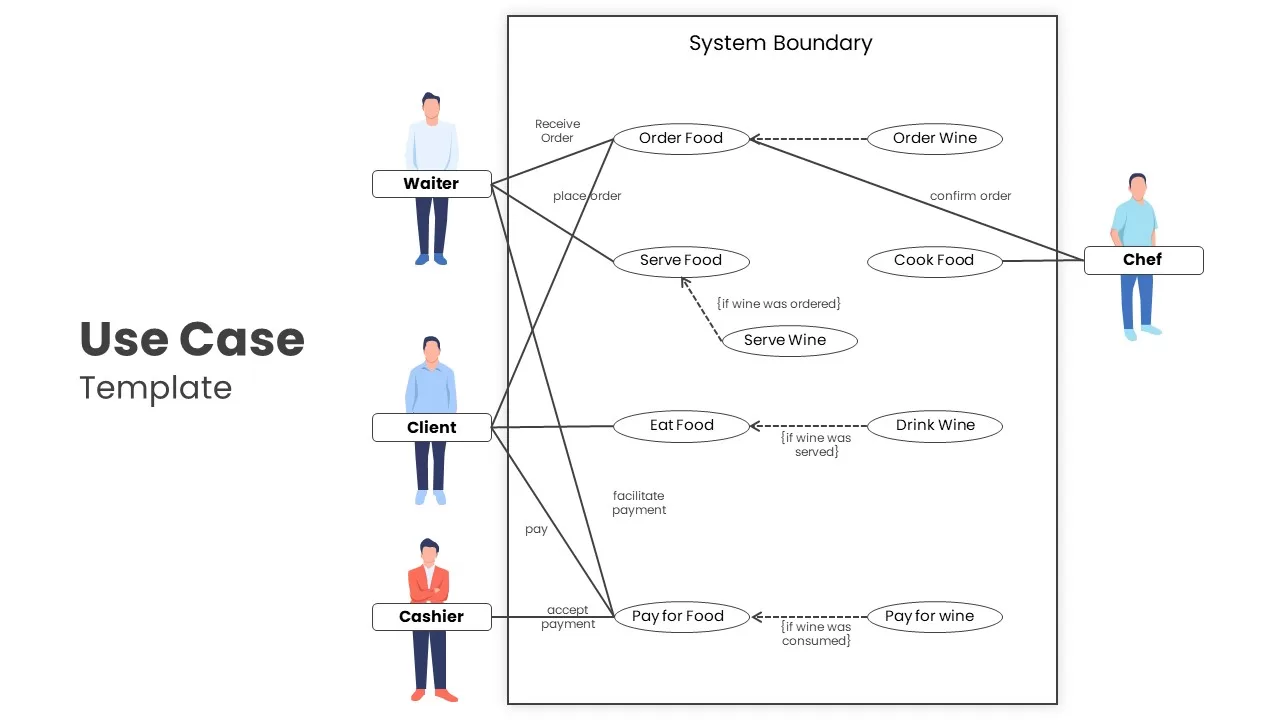
Restaurant Ordering Use Case Diagram Template for PowerPoint & Google Slides
Software Development
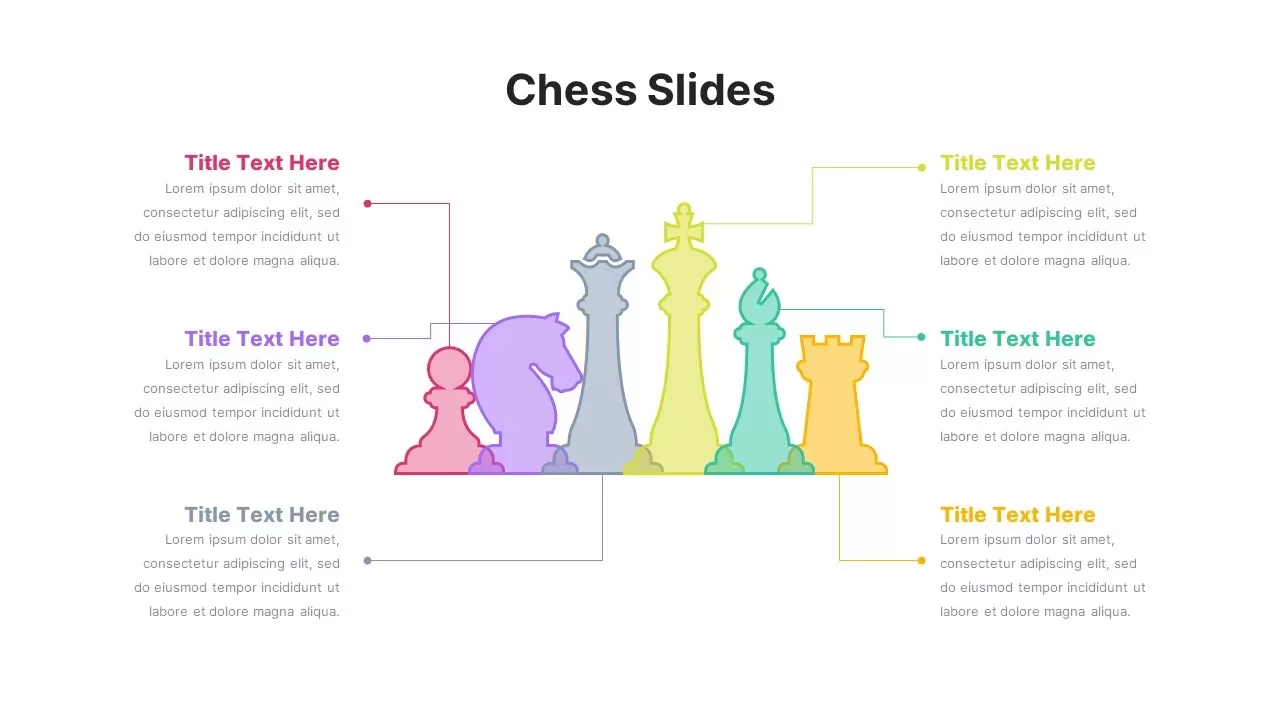
Modern Chess Infographic Diagram Template for PowerPoint & Google Slides
Comparison
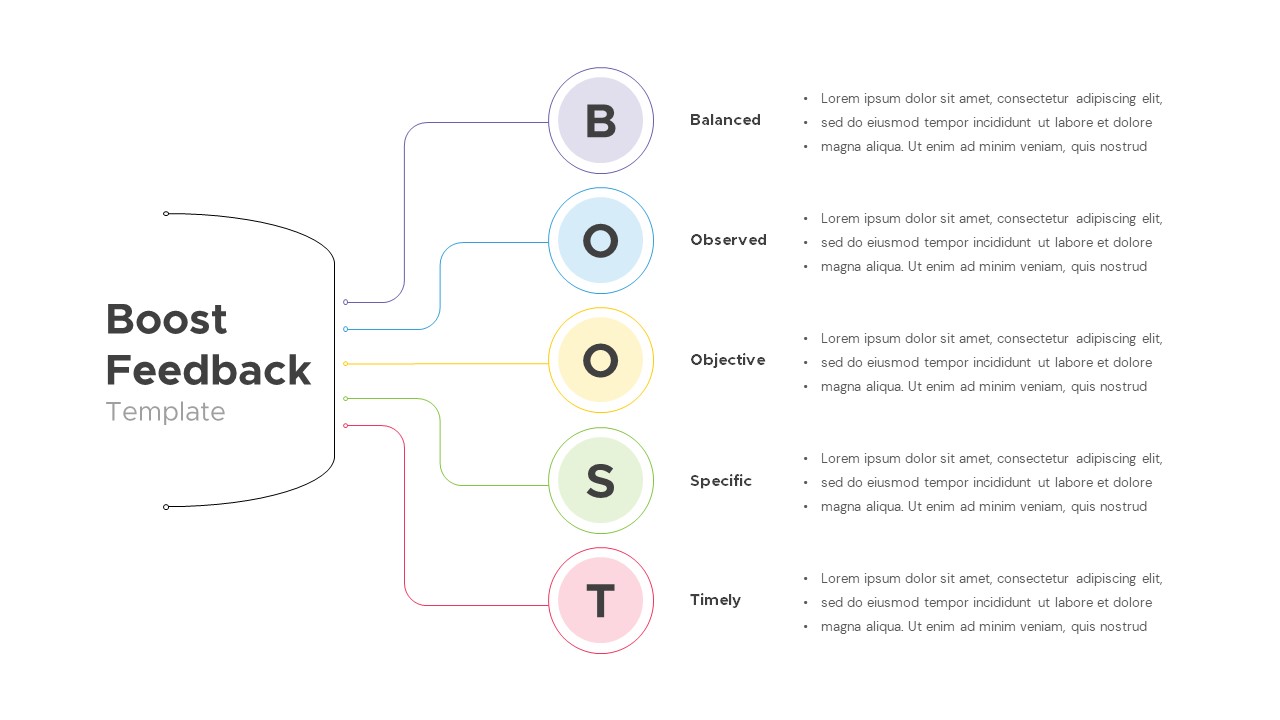
Interactive Boost Feedback Model Diagram Template for PowerPoint & Google Slides
Process
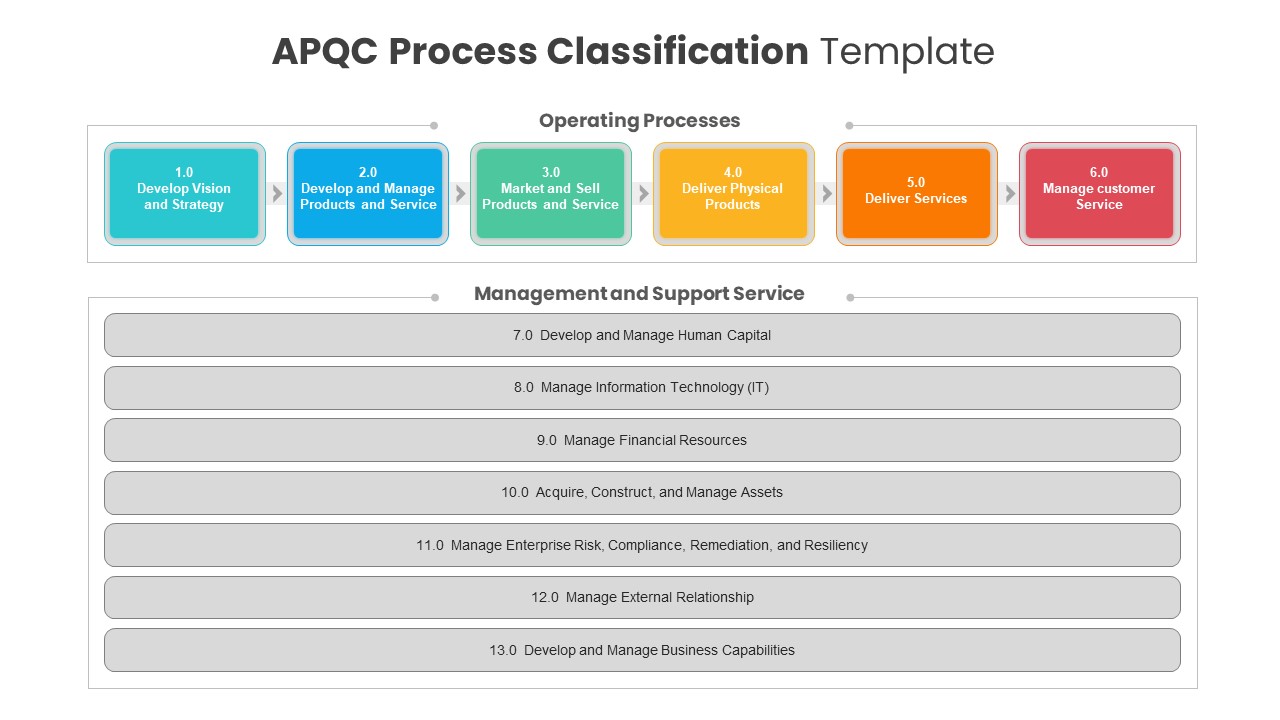
APQC Process Classification Diagram Template for PowerPoint & Google Slides
Process
Overlapping Timeline Gantt Chart Diagram Template for PowerPoint & Google Slides
Timeline
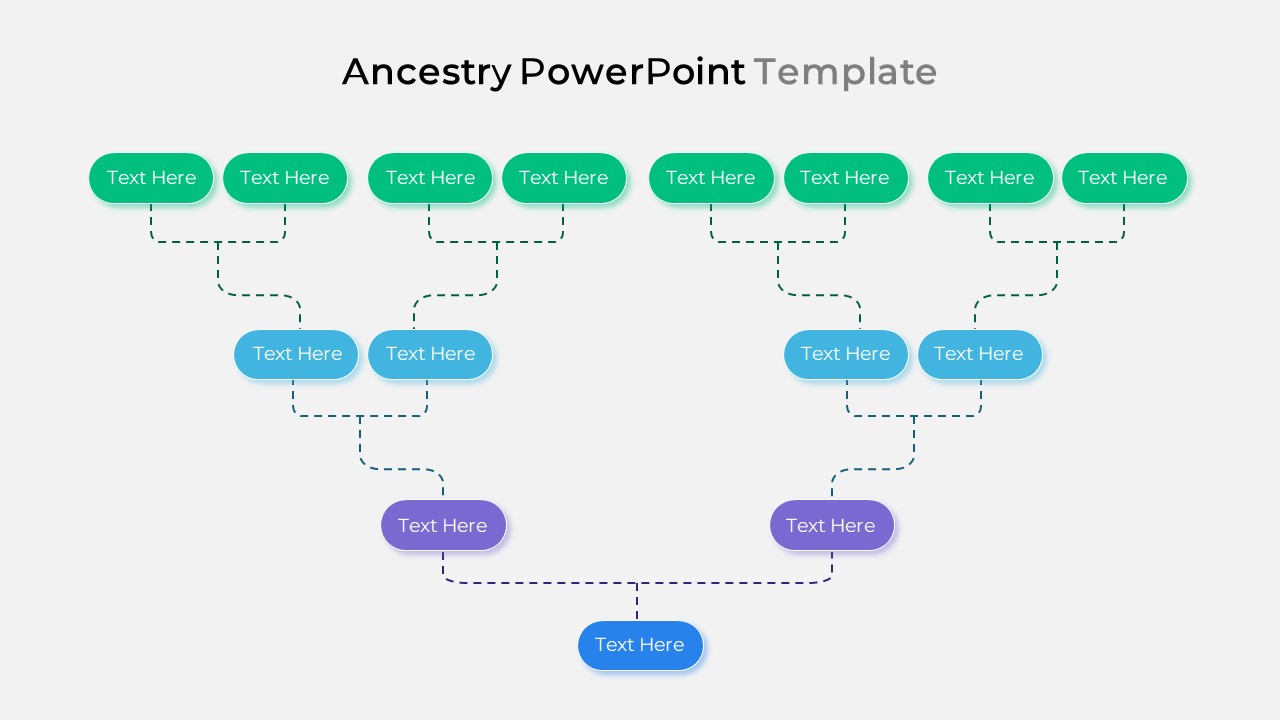
Smart Ancestry Diagram Family Tree Template for PowerPoint & Google Slides
Org Chart
Advanced Data Flow Diagram Pack Template for PowerPoint & Google Slides
Flow Charts
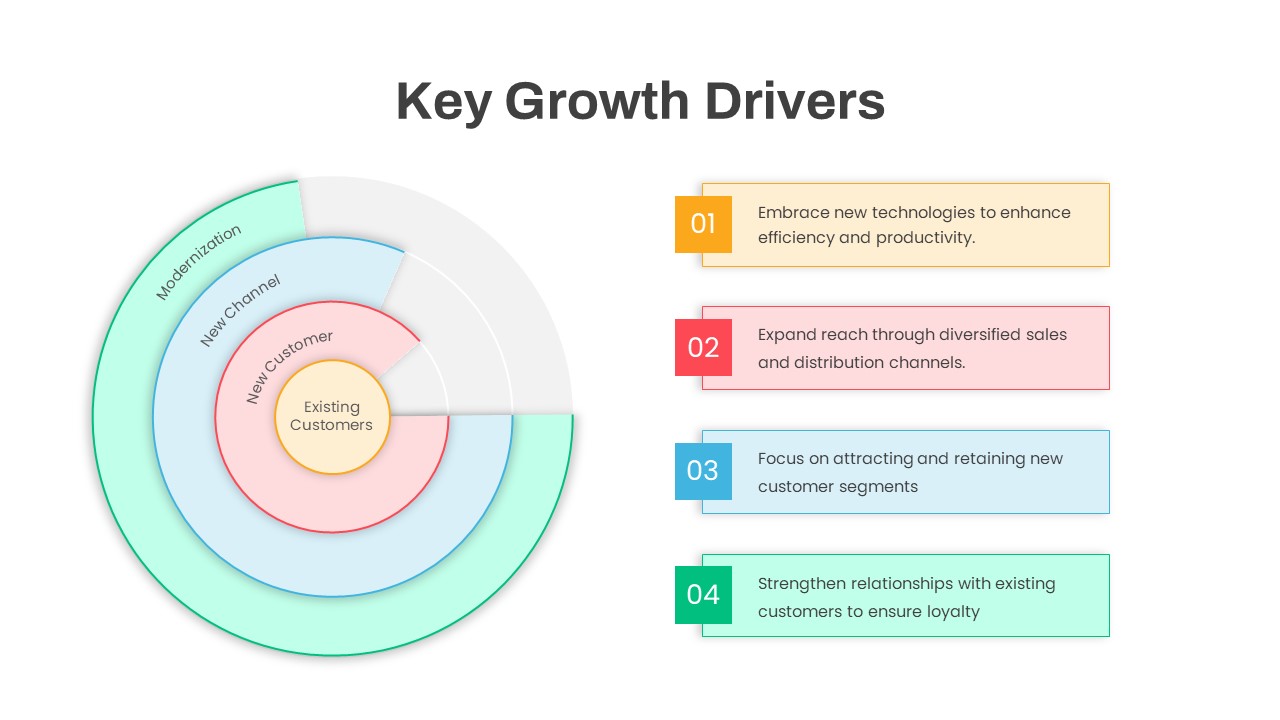
Circular Key Growth Drivers Diagram Template for PowerPoint & Google Slides
Circular
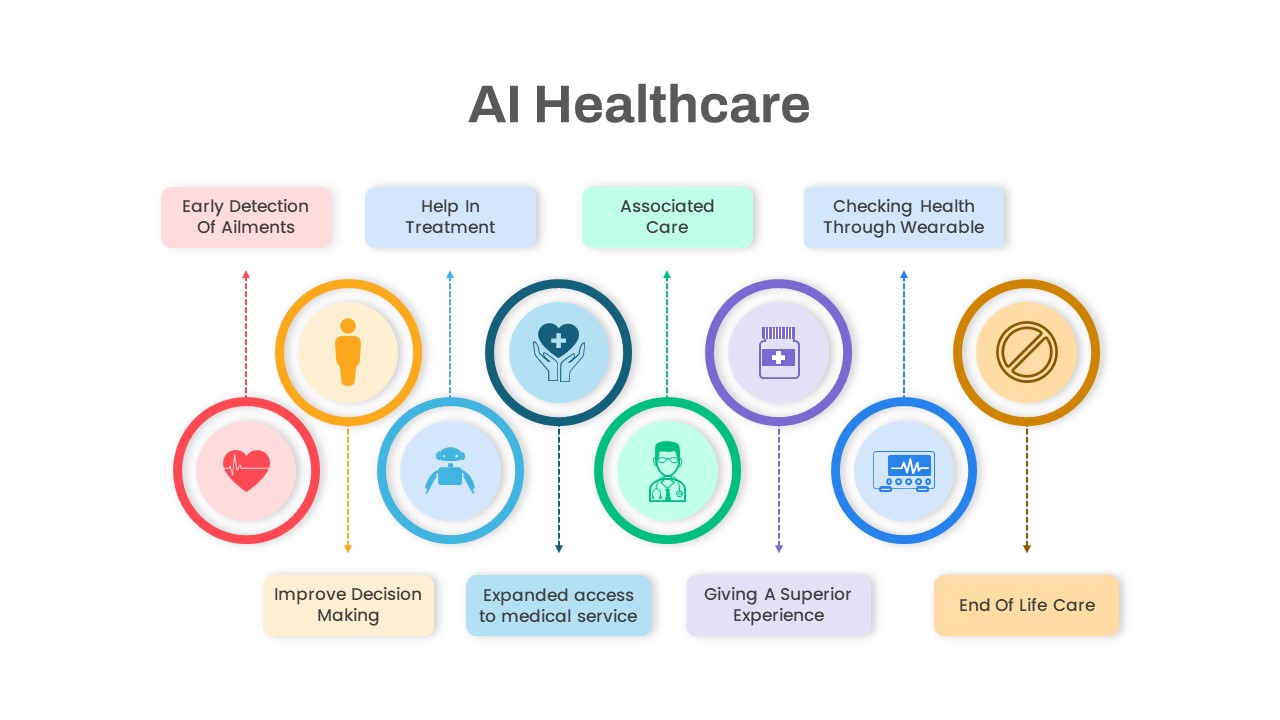
AI Healthcare Benefits Diagram Template for PowerPoint & Google Slides
Health
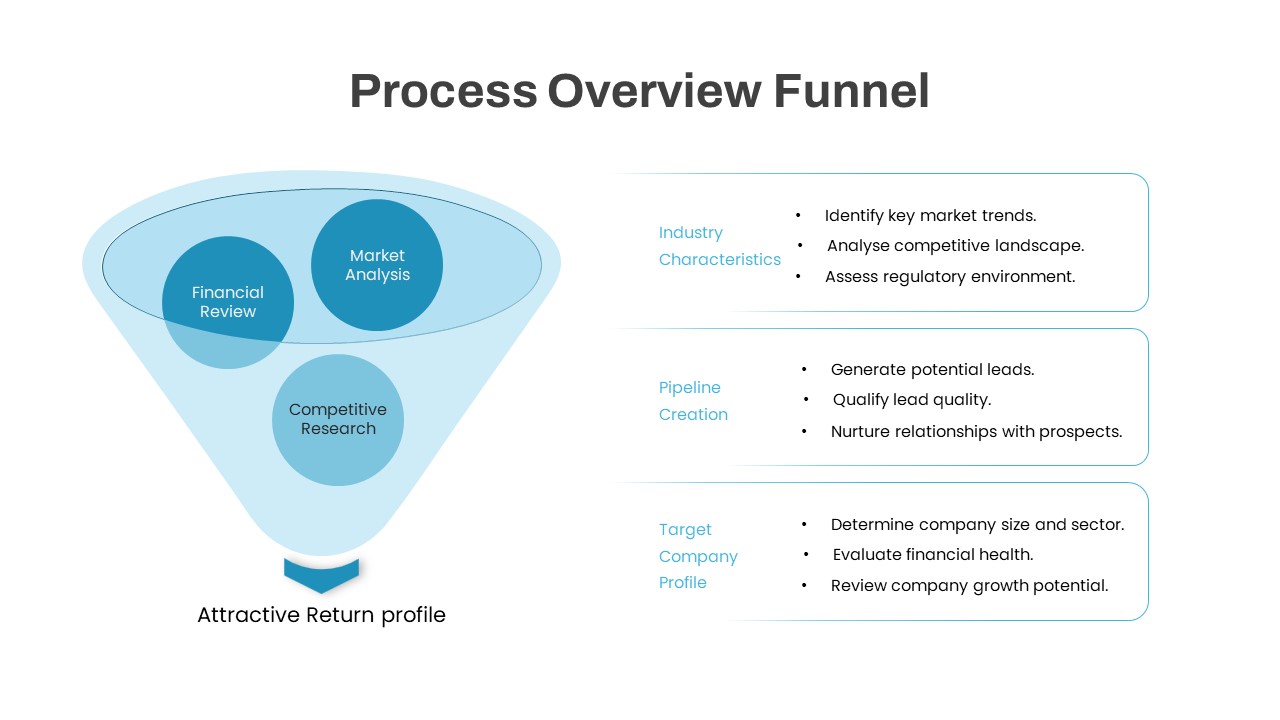
Process Overview Funnel Diagram Template for PowerPoint & Google Slides
Funnel
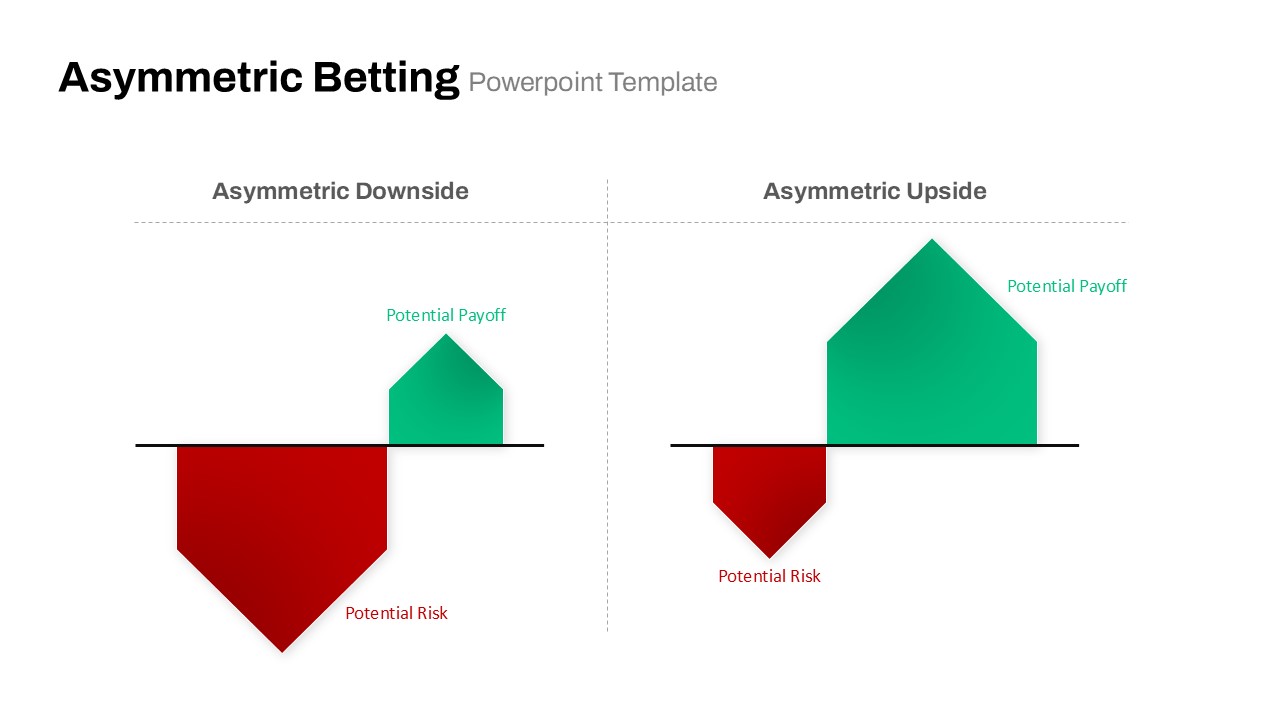
Asymmetric Betting Payoff Risk Diagram Template for PowerPoint & Google Slides
Comparison
Cultural Web Analysis Circular Diagram Template for PowerPoint & Google Slides
Circular
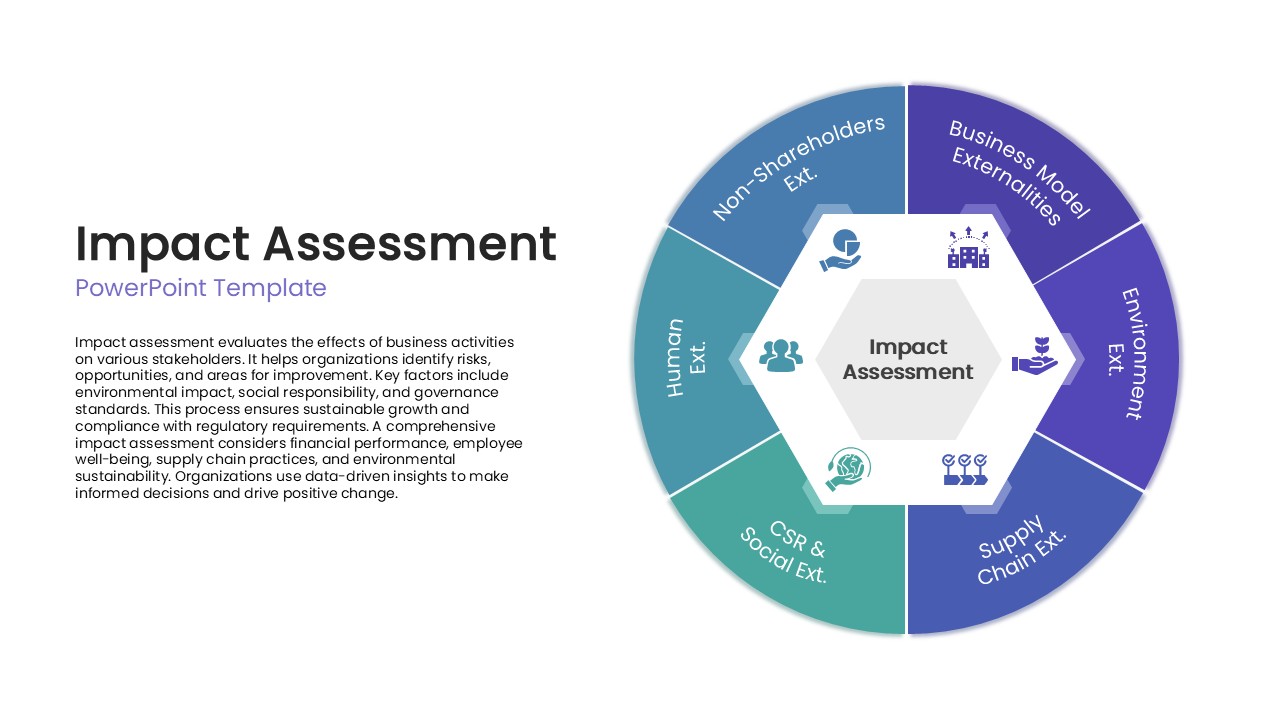
Impact Assessment Circular Diagram Template for PowerPoint & Google Slides
Circular
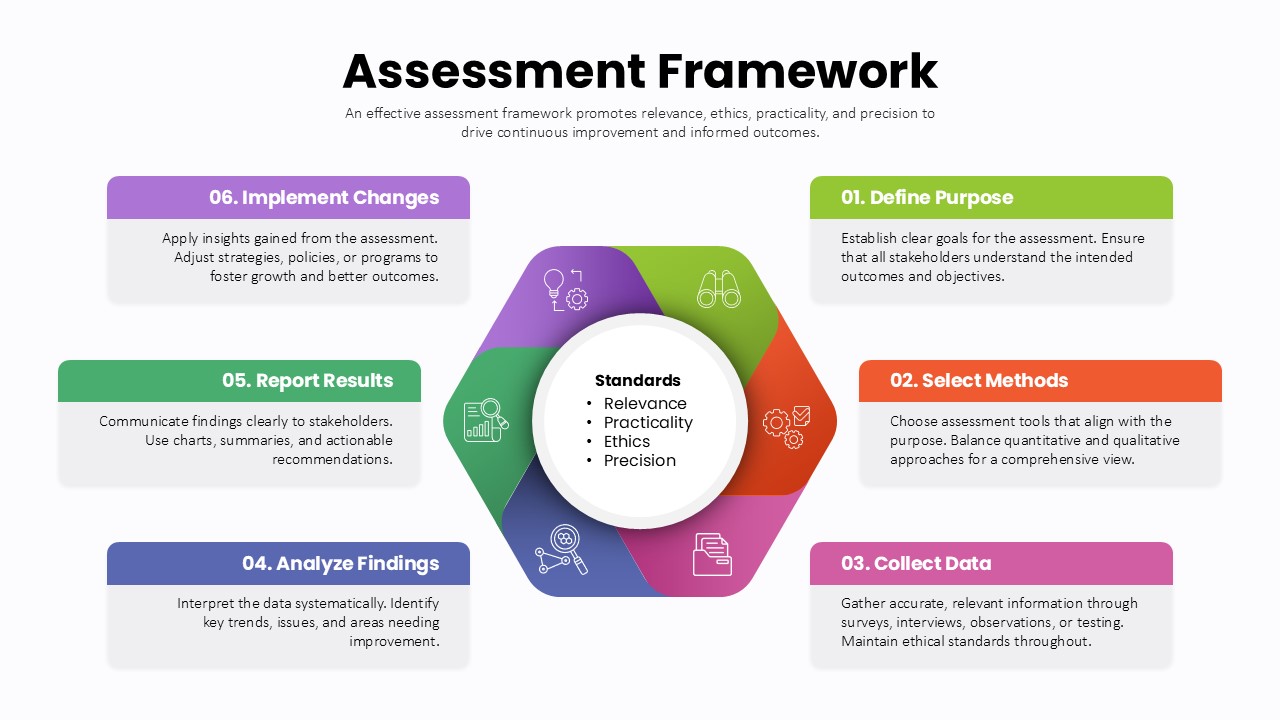
Assessment Framework Circular Diagram Template for PowerPoint & Google Slides
Circular
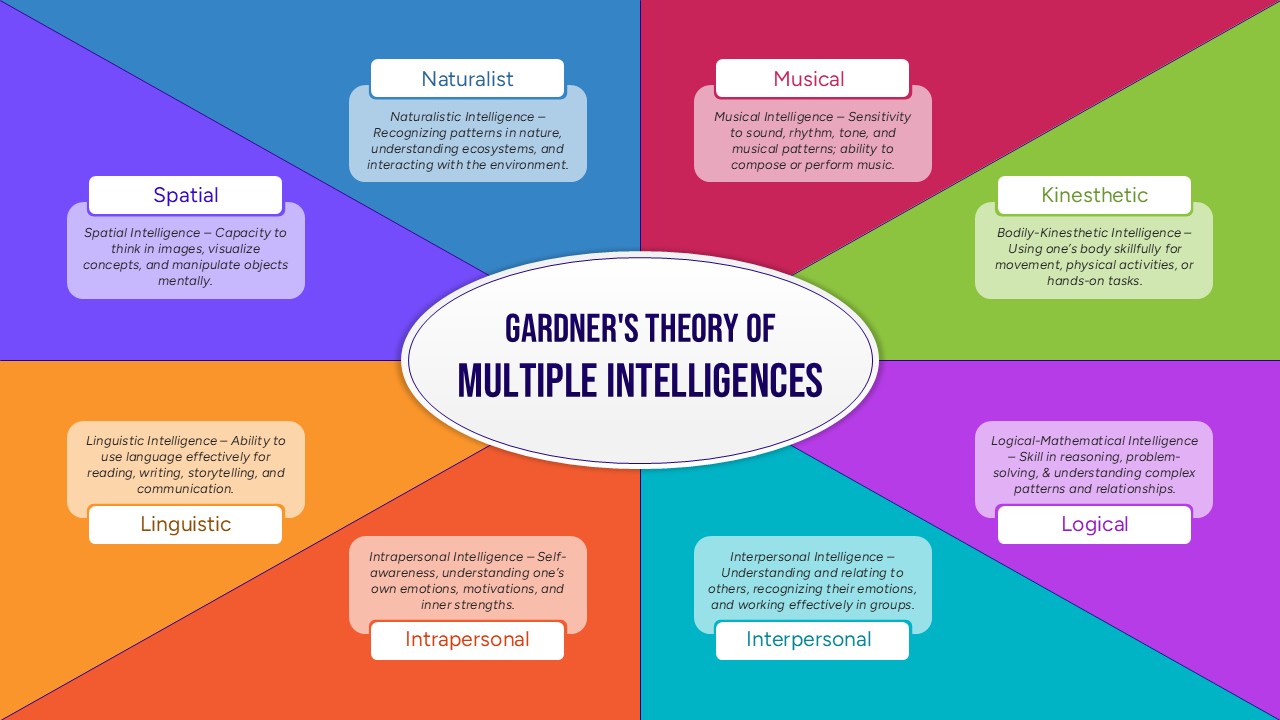
Gardner’s Theory of Multiple Intelligences Diagram Template for PowerPoint & Google Slides
Leadership
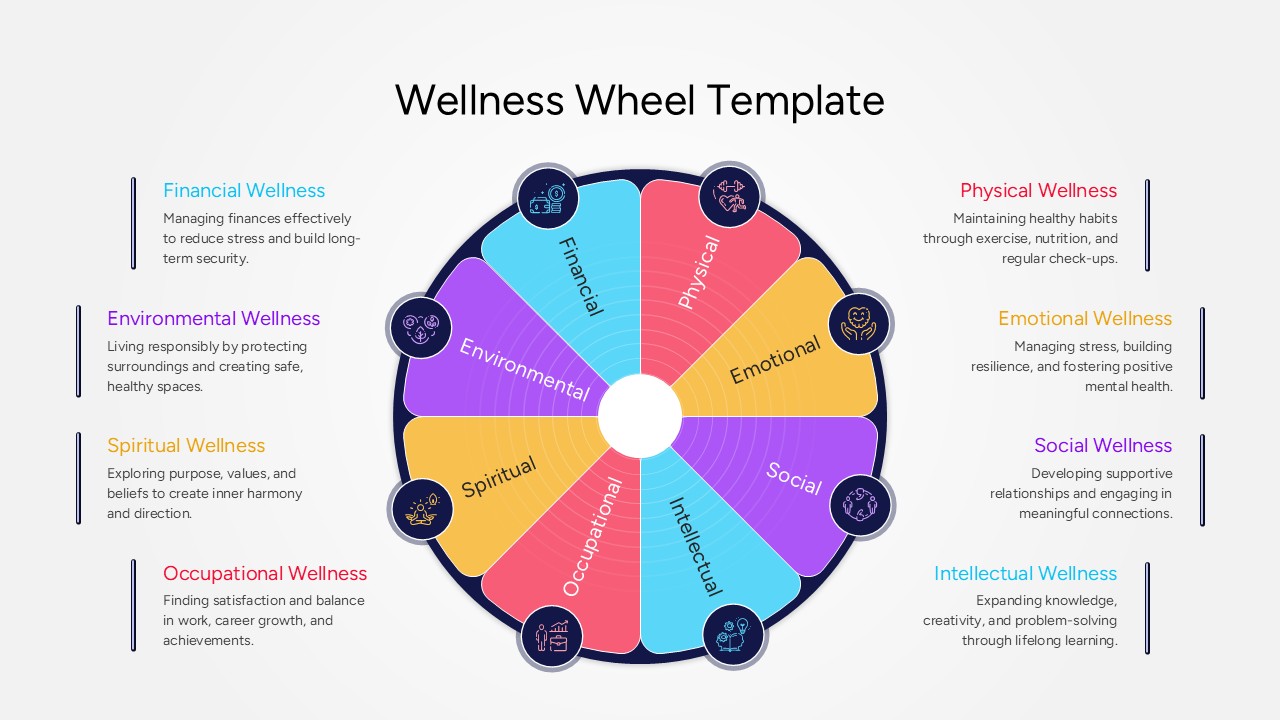
Wellness Wheel Concept Diagram Template for PowerPoint & Google Slides
Health