Dashboard Presentation Templates for PowerPoint and Google Slides
Our Dashboard Presentation Templates for PowerPoint and Google Slides are designed to help professionals from various industries transform complex data into visually appealing and easy-to-understand presentations. Whether you’re a business executive reviewing company performance, a data analyst sharing key insights, or a project manager tracking milestones, these templates simplify the process of communicating important information.
Explore our collection of Dashboard Presentation Templates to effortlessly turn raw data into meaningful insights. With clear visuals and structured layouts, your presentations will not only inform but also inspire confidence and support better decision-making.
Filter
Filter
-

Annual Financial Results Slide Deck Template for PowerPoint & Google Slides
Finance
-

Comprehensive Financial Statements Template for PowerPoint & Google Slides
Finance
-

One Pager Project Status Dashboard Template for PowerPoint & Google Slides
Project Status
-

Color-Coded Project Status Template for PowerPoint & Google Slides
Project Status
-

Project Status Dashboard Table Template for PowerPoint & Google Slides
Project Status
-

Modern Project Status Report Dashboard Template for PowerPoint & Google Slides
Project Status
-

Digital Marketing Analytics Presentation Template for PowerPoint & Google Slides
Digital Marketing
-
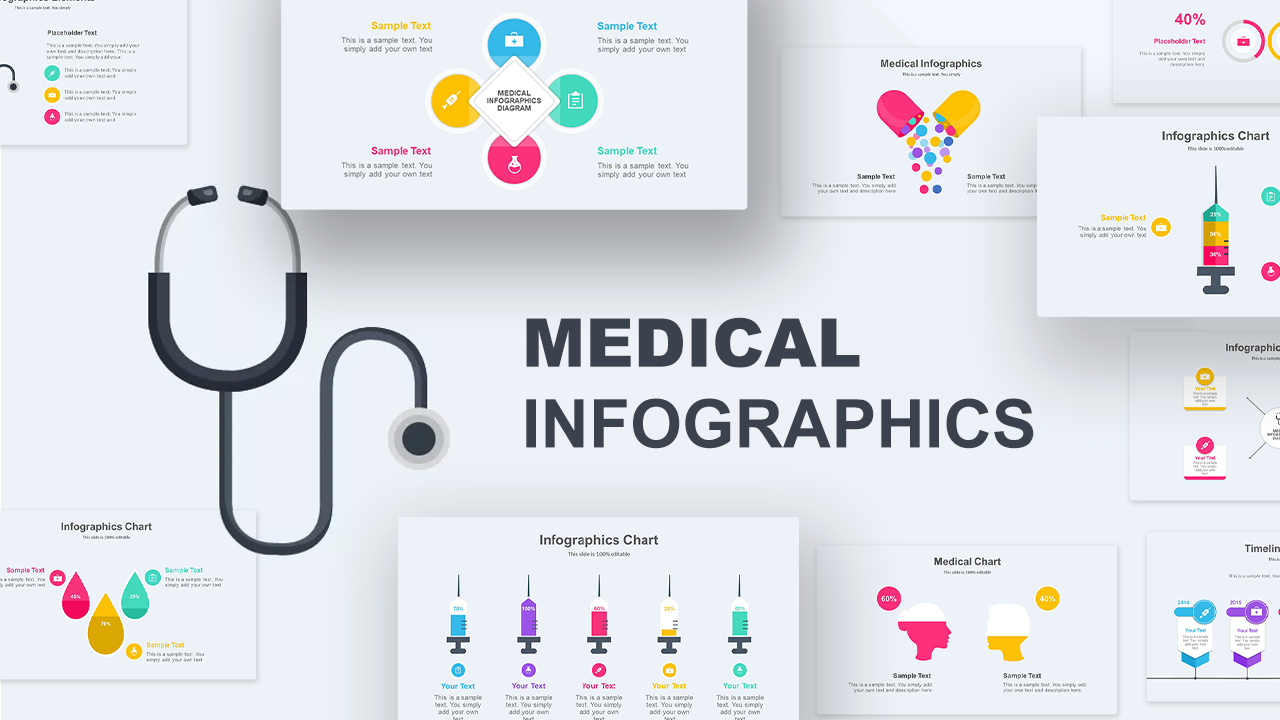
Medical Infographics Data Visualization Template for PowerPoint & Google Slides
Health
-

Comprehensive Healthcare Overview Deck Template for PowerPoint & Google Slides
Medical
-

Annual Financial Results Snapshot Template for PowerPoint & Google Slide
Finance
-

Quarterly Financial Summary Dashboard Template for PowerPoint & Google Slides
Business Report
-

Digital Marketing ROI Analysis template for PowerPoint & Google Slides
Digital Marketing
-

Project Status Table Template for PowerPoint & Google Slides
Project Status
-

Project Status Dashboard Template for PowerPoint & Google Slides
Project Status
-

Clean Minimal Project Status Update Template for PowerPoint & Google Slides
Project
-

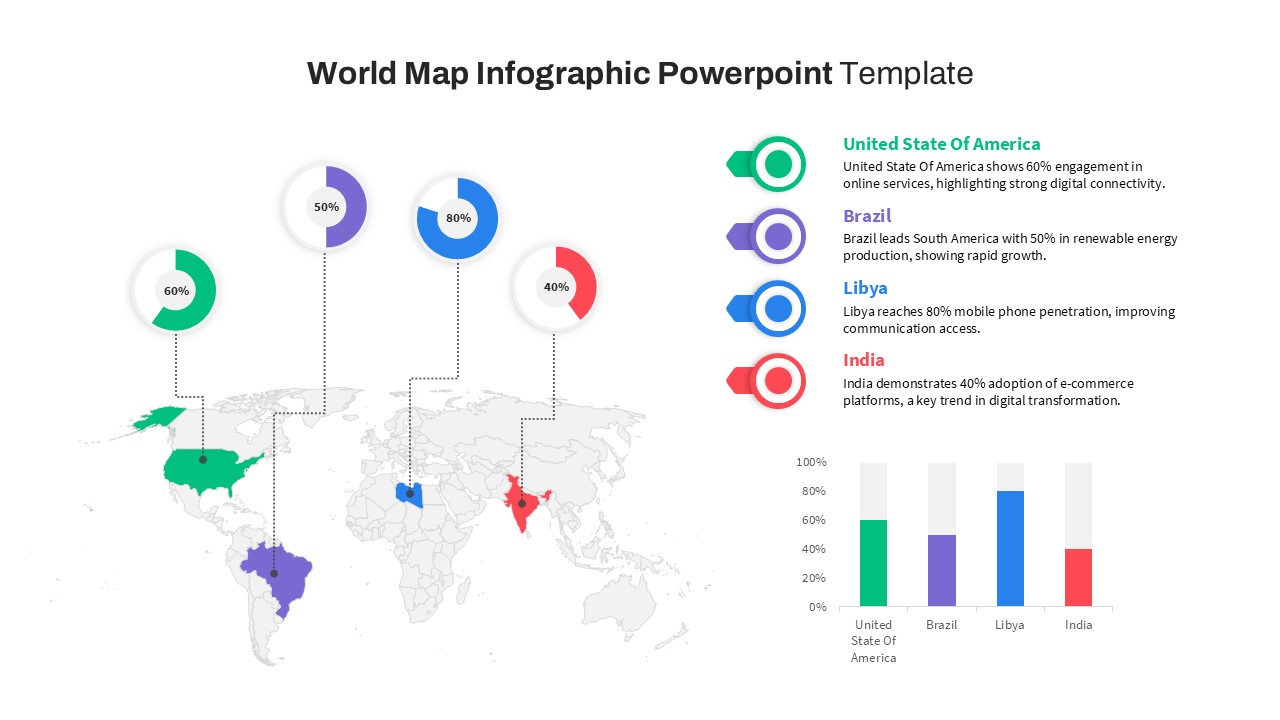
World Map Data template for PowerPoint & Google Slides
World Maps
-

Sales Growth Comparison Chart & Table Template for PowerPoint & Google Slides
Bar/Column
-

Strategy Progress Timeline Template for PowerPoint & Google Slides
Process
-

Comparison Donut Chart PowerPoint Template and Keynote
Pie/Donut
-

Net Promoter Score Dashboard Template for PowerPoint & Google Slides
Customer Experience
-

Modern Isometric Company Profile Template for PowerPoint & Google Slides
Company Profile
-

Free Education Theme Design Presentation Template for PowerPoint & Google Slides
Pitch Deck
Free
-

For and Against Vote Count Bar Chart Template for PowerPoint & Google Slides
Bar/Column
-

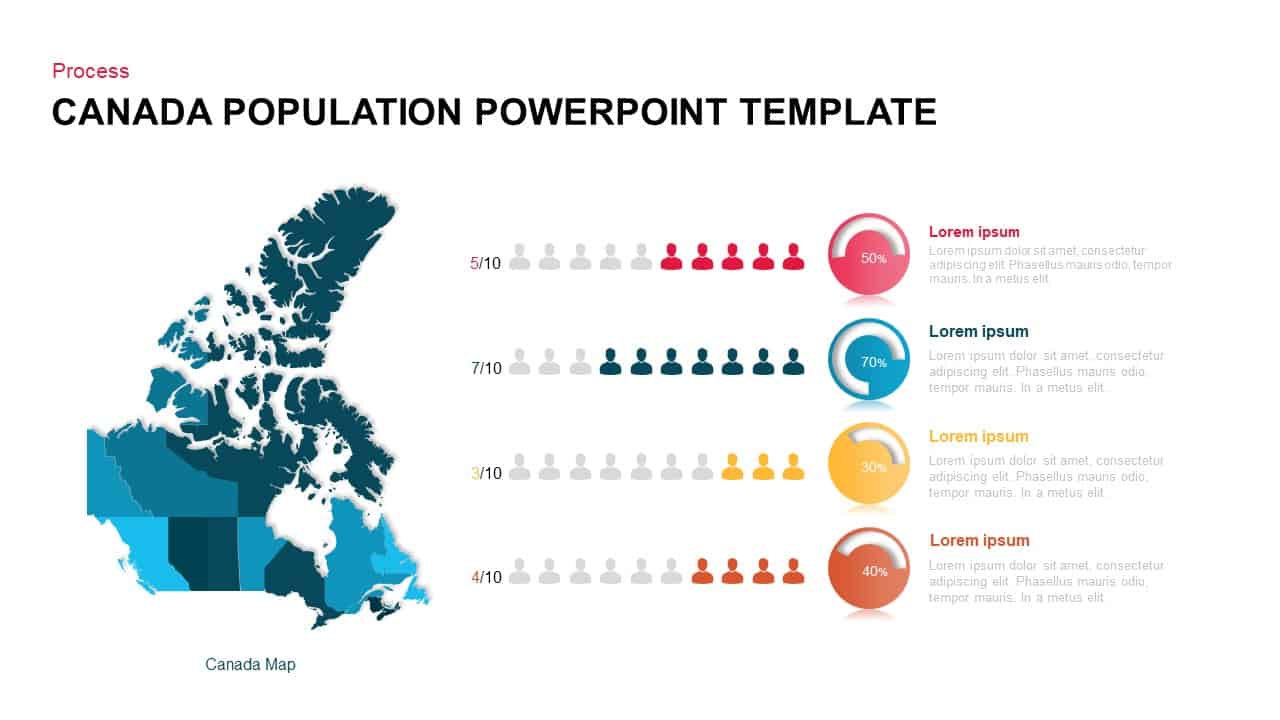
Canada Population Infographics Template for PowerPoint & Google Slides
World Maps
-

Mobile Apps Infographic Interface Template for PowerPoint & Google Slides
Software Development
-

Immigration Data Dashboard Template for PowerPoint & Google Slides
Bar/Column
-

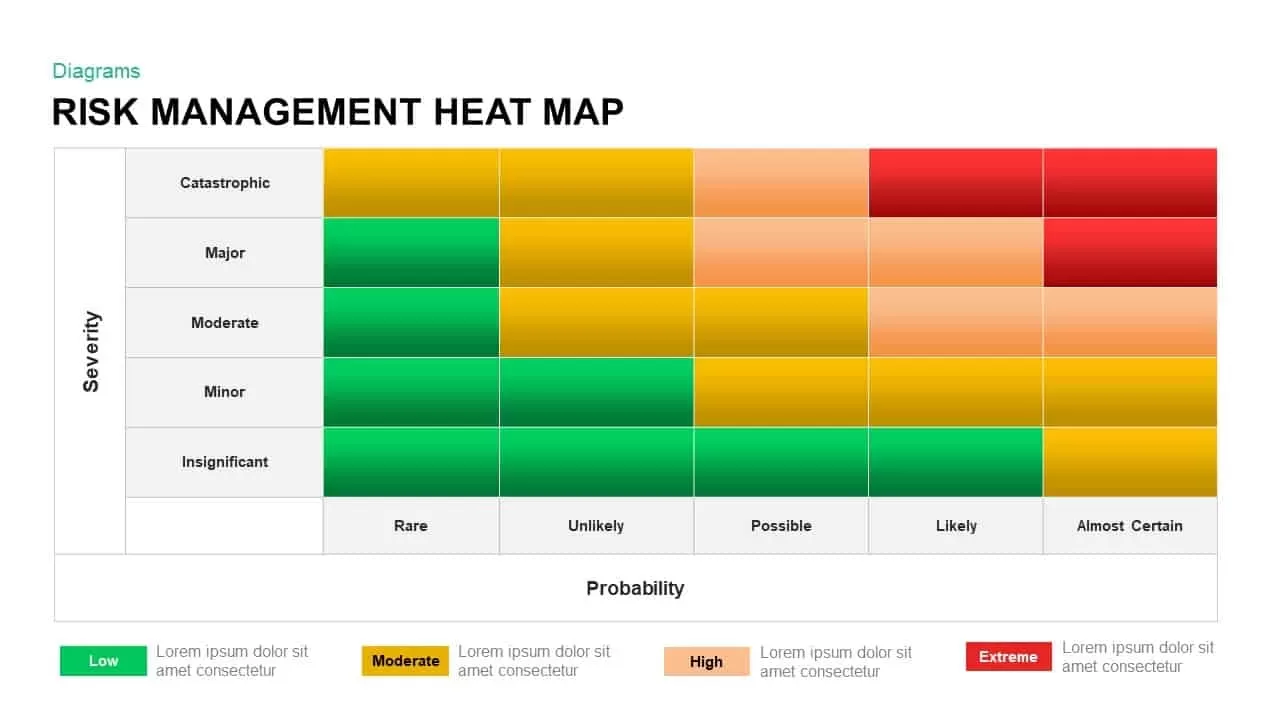
Risk Management Heat Map Diagram Template for PowerPoint & Google Slides
Comparison Chart
-

3D Cylinder Bar Chart Visualization Template for PowerPoint
Bar/Column
-

Social Media Market Share Pie Charts Template for PowerPoint & Google Slides
Pie/Donut
-

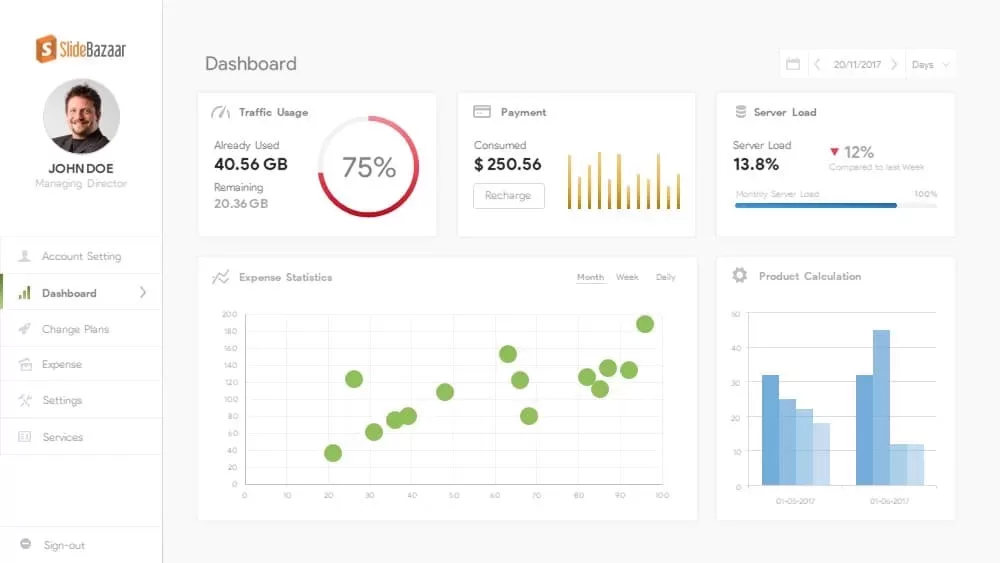
Free Data Analytics Dashboard Template for PowerPoint
Charts
Free
-

Business Dashboard Analytics & KPIs Template for PowerPoint & Google Slides
Bar/Column
-

Office Workspace Metaphor Slide Template for PowerPoint & Google Slides
Business Proposal
-

Data Analytics Dashboard Design template for PowerPoint & Google Slides
Bar/Column
-

E-commerce Purchase Funnel Report template for PowerPoint & Google Slides
Funnel
-

Product Usage Analytics Dashboard Chart Template for PowerPoint & Google Slides
Bar/Column


