Cost Volume-Profit Analysis Graph (CVP) Template for Financial Planning Presentations

Understanding how sales volume, costs, and revenue interact is essential when evaluating business performance and planning future decisions. This CVP Analysis Graph template is designed to help teams explain cost-volume-profit relationships in a visual and structured format that simplifies financial discussions. Instead of presenting raw figures or spreadsheets, the graph converts key financial metrics into a presentation-ready layout that is easier for audiences to follow and interpret. Compatible with PowerPoint and Google Slides, the template is useful across industries including finance, consulting, operations, education, retail, startups, and business strategy.
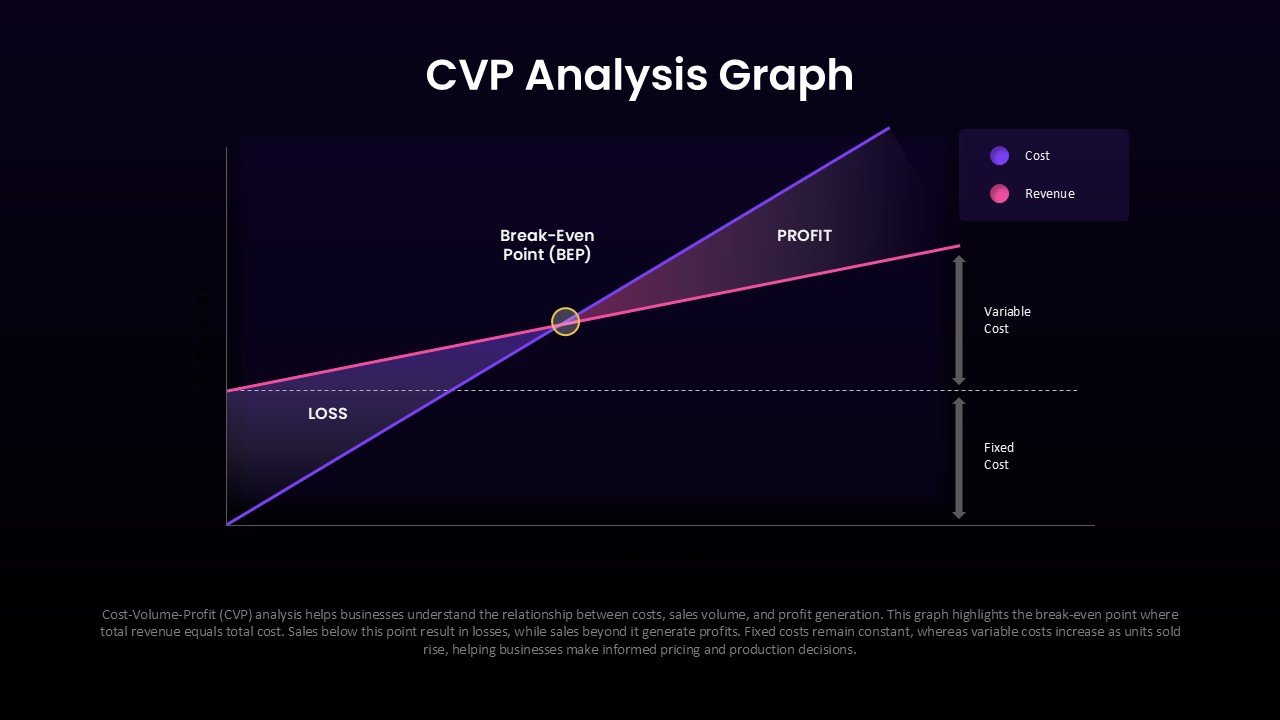
The slide is built around essential financial concepts such as break-even point calculations, fixed cost analysis, variable cost trends, profit regions, and loss zones. Each visual element works together to demonstrate how operational changes can influence financial outcomes. Users can clearly show where revenue begins to exceed costs and where profitability starts to increase, making the slide valuable for both strategic discussions and educational sessions.
Break Even Analysis Chart for Revenue and Cost Visualization
The structure also supports a logical storytelling sequence for presentations. Begin by presenting cost behavior and revenue patterns, then identify the break-even point where costs and sales intersect. Continue by explaining loss regions before moving into profit zones and growth opportunities. This progression helps audiences understand the relationship between financial decisions and business performance.
The clean chart design uses contrasting visual elements and highlighted areas to separate different financial categories without creating unnecessary complexity. Editable chart components, labels, colors, lines, and placeholders allow complete customization according to company data or academic examples. Users preparing executive reports may also integrate this layout into larger Business Reports presentations.
Frequently Asked Questions
Can I customize the cost and revenue lines in the CVP analysis graph?
Does the template include both light and dark theme versions?
Login to download this file

Item ID
SB05921Designed By
Naseeba Sithara
Related Templates

Cost-Volume-Profit Analysis Diagram Template for PowerPoint & Google Slides
Finance
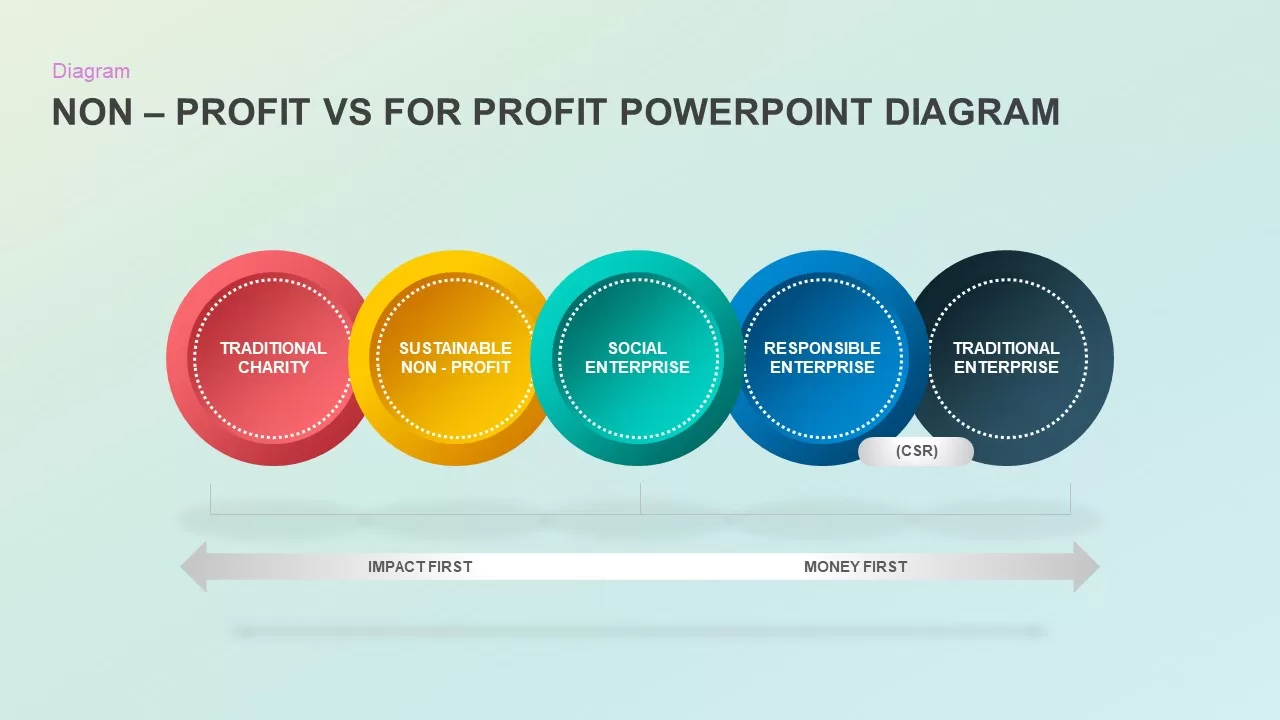
Non-Profit vs For-Profit Diagram template for PowerPoint & Google Slides
Business Models
Quarterly Network Volume Analysis Template for PowerPoint & Google Slides
Business Report
Line Graph Analysis template for PowerPoint & Google Slides
Charts
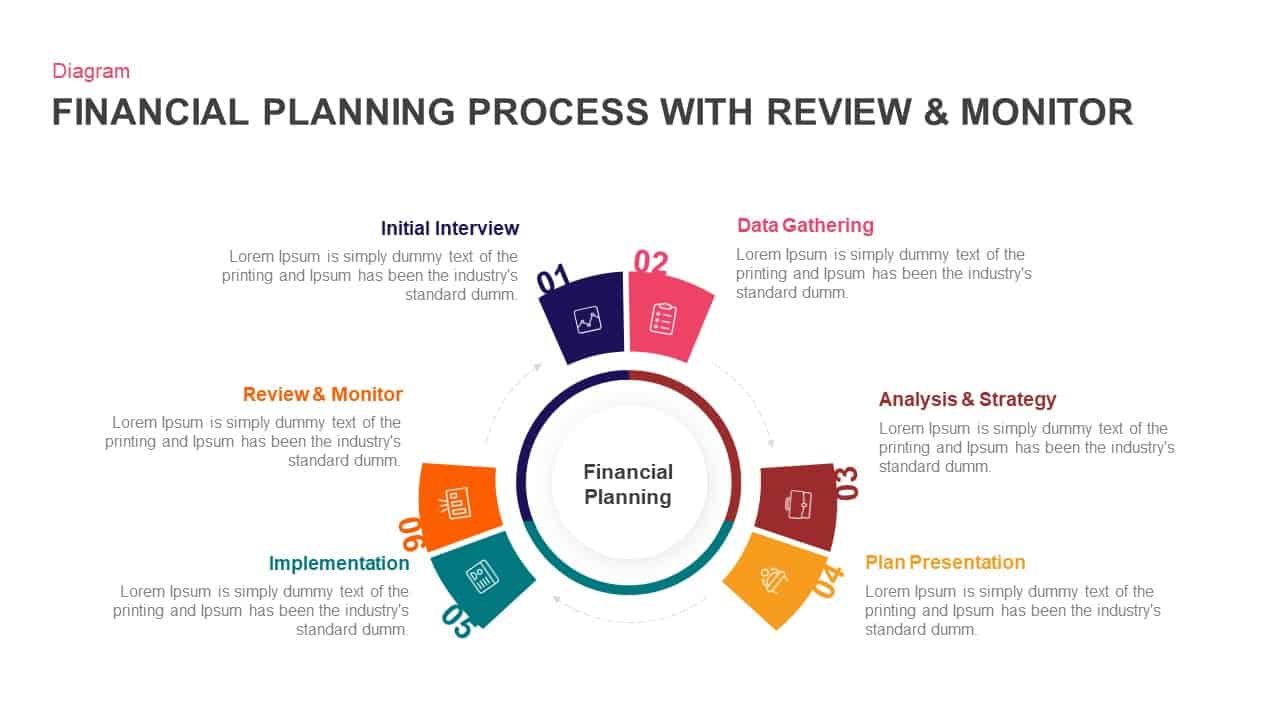
Financial Planning Circular Process Template for PowerPoint & Google Slides
Process
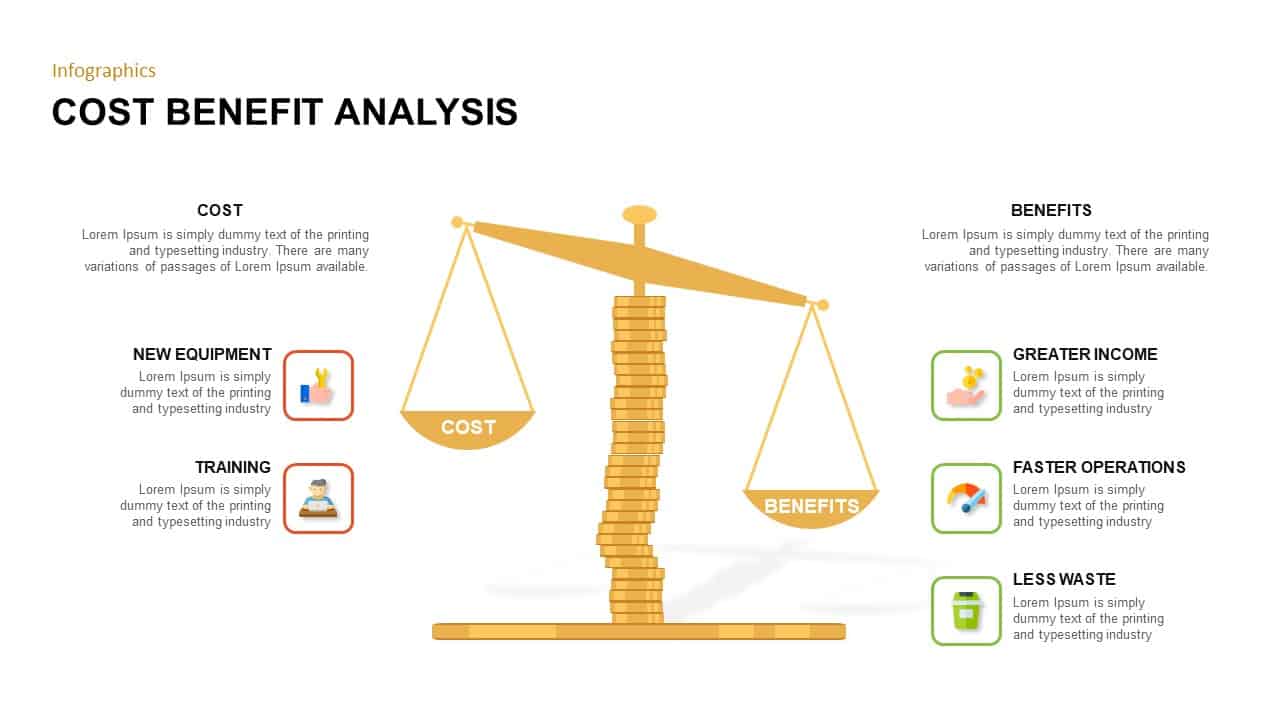
Cost Benefit Analysis PowerPoint Template
Comparison
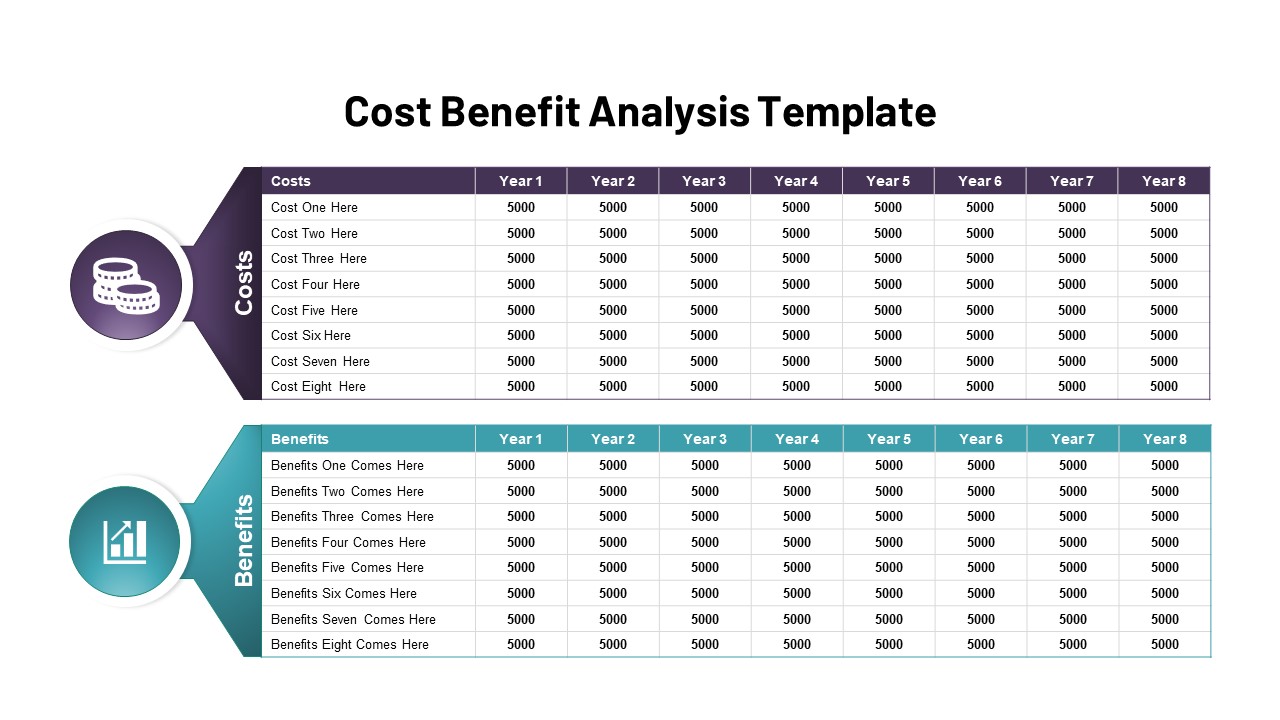
Cost Benefit Analysis Template PowerPoint and Google Slides
Comparison
Cost Benefit Analysis PowerPoint Template
Comparison
Profit Performance Trend Chart Template for PowerPoint & Google Slides
Finance
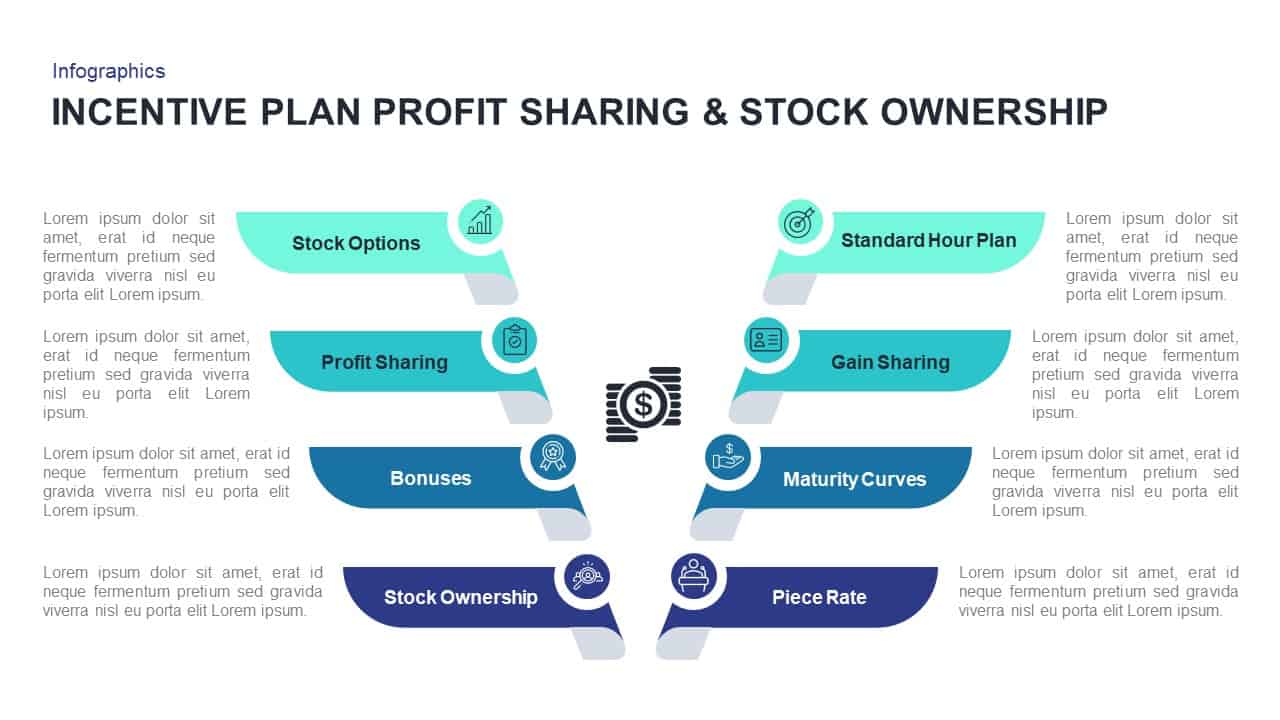
Profit Sharing & Stock Ownership Template for PowerPoint & Google Slides
Process

Non-Profit Organization PowerPoint Template
Pitch Deck
Quarterly Gross Profit Rate Chart Template for PowerPoint & Google Slides
Revenue
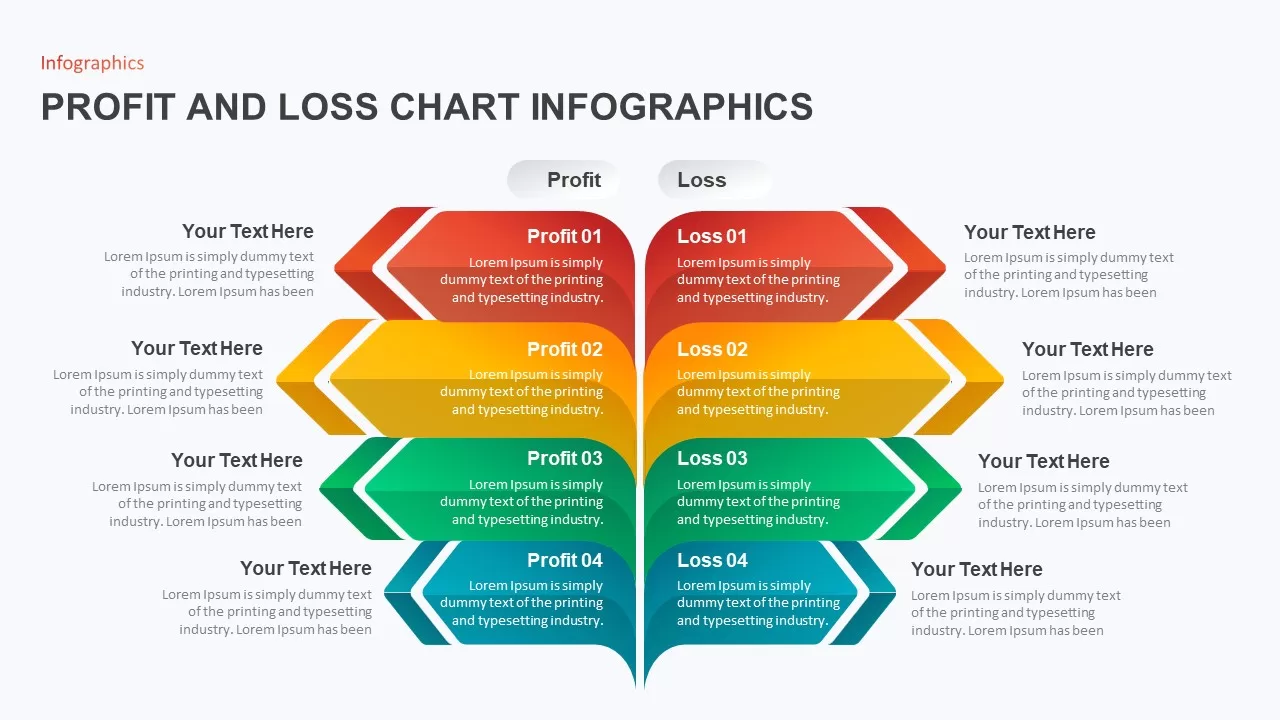
Profit and Loss Chart Infographics for PowerPoint & Google Slides
Business Report
Dynamic Financial Analysis Line Chart Template for PowerPoint & Google Slides
Finance
Financial Gap Analysis Framework Template for PowerPoint & Google Slides
Finance
Circle Graph Data Visualization Template for PowerPoint & Google Slides
Circular

3D Bar Graph Infographic Template for PowerPoint & Google Slides
Bar/Column
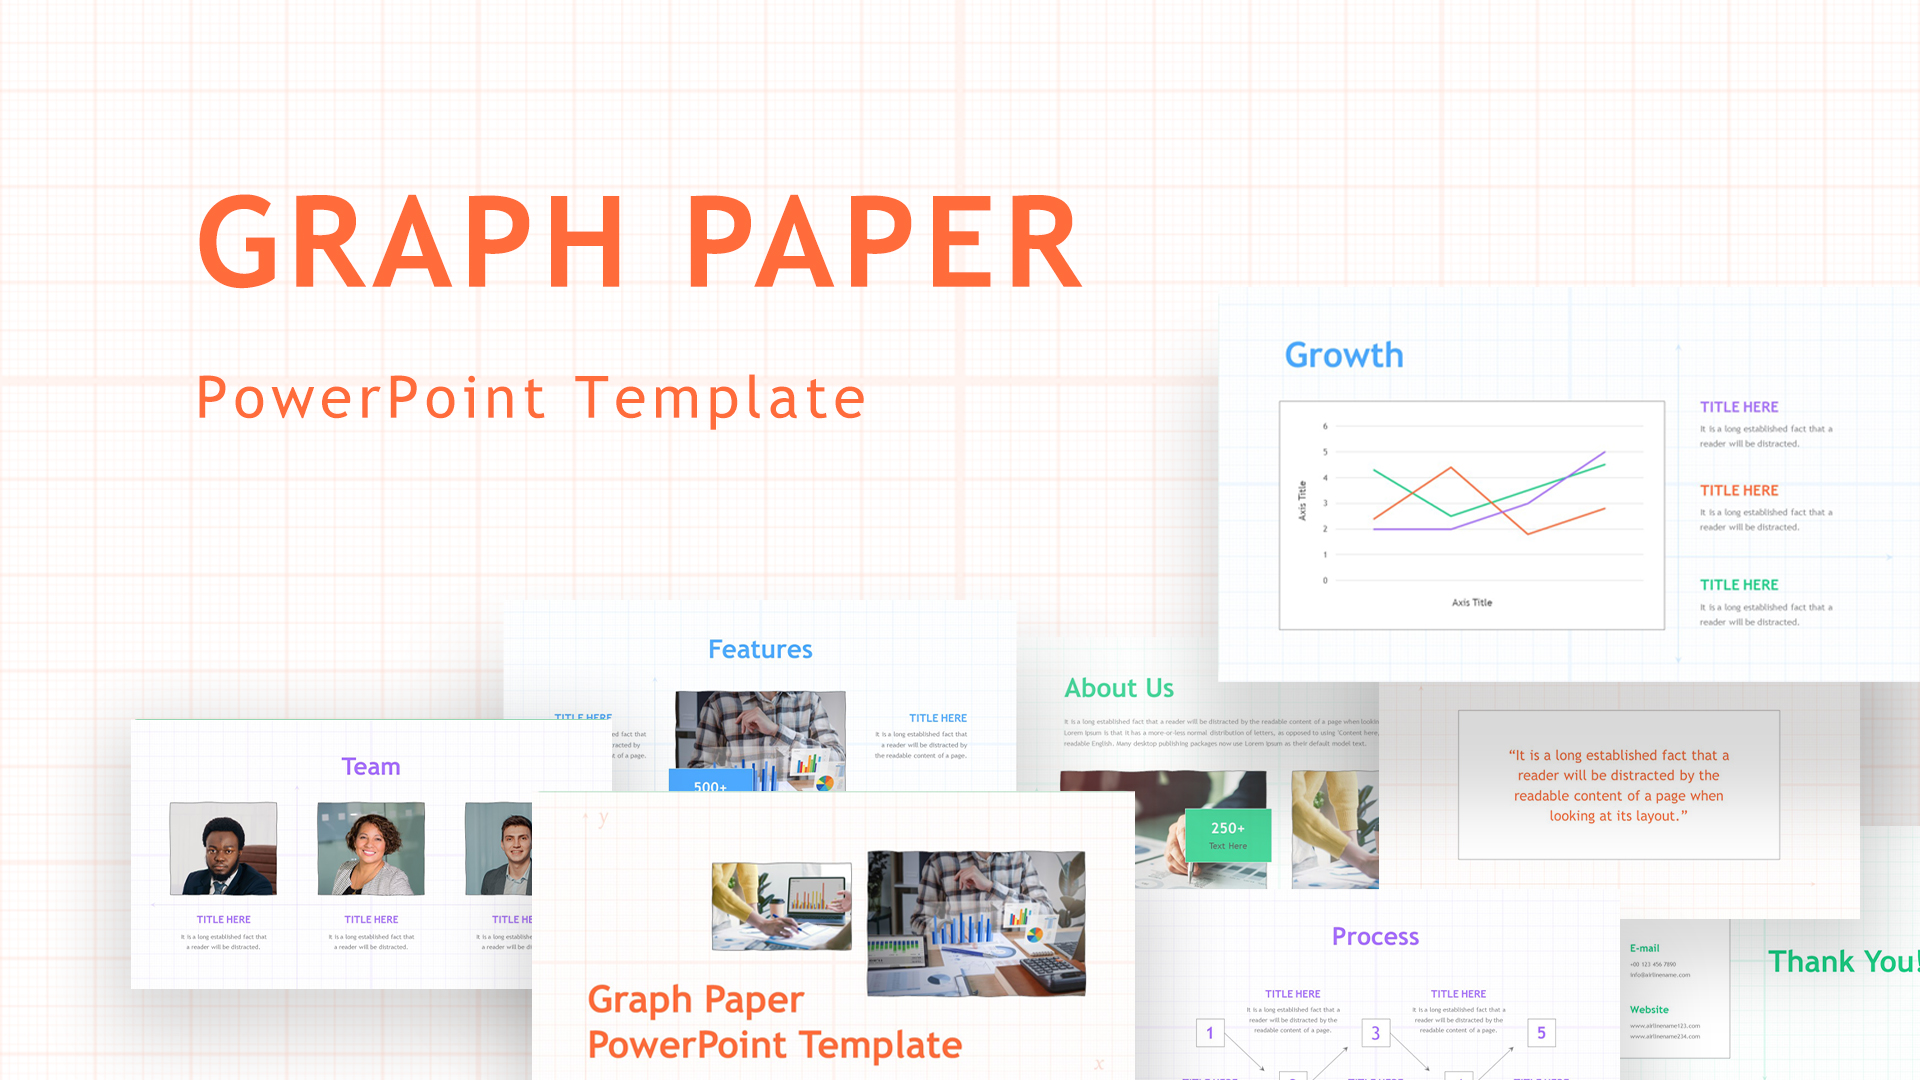
Graph Paper Background Presentation Template for PowerPoint & Google Slides
Company Profile
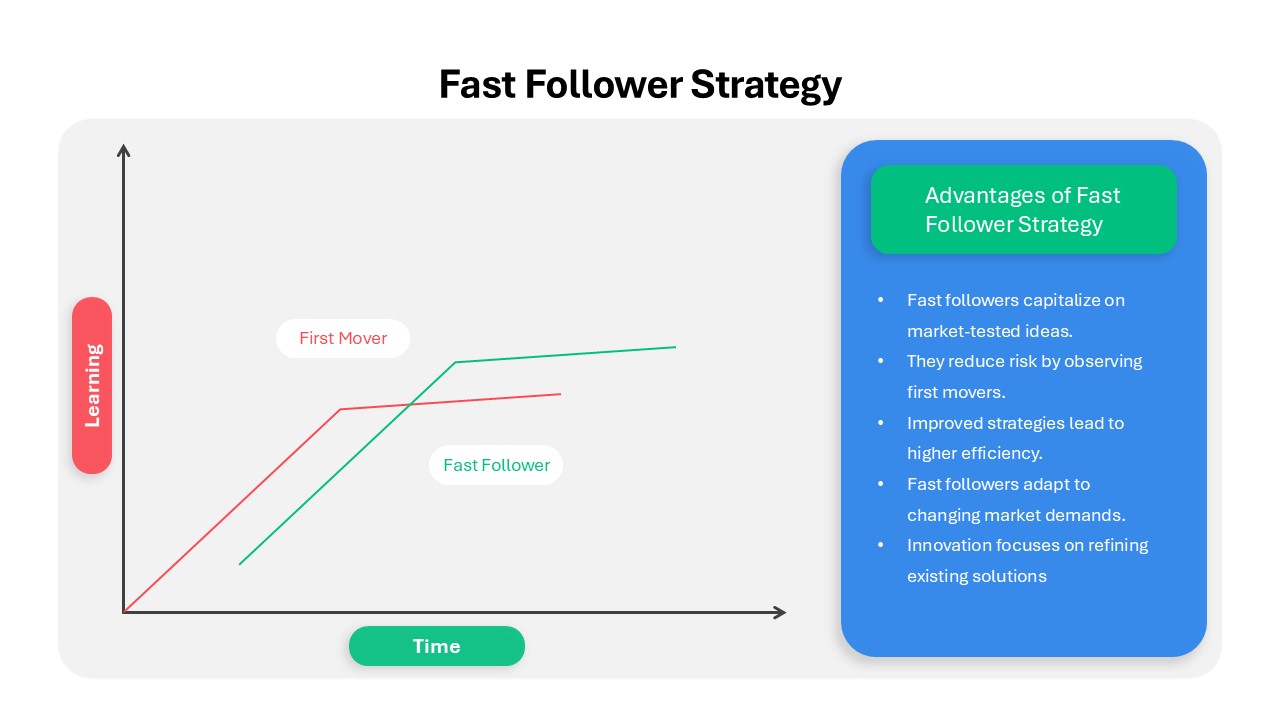
Fast Follower Strategy Line Graph Template for PowerPoint & Google Slides
Comparison Chart
Blank Bar Graph Template for PowerPoint & Google Slides
Bar/Column