CVP Analysis Graph Google Slides Template


Login to download this file
Popular Search Terms
Timeline Infographic
Business Deck
Roadmap Template
Pitch Deck
Sales Deck
Pyramid
Essentials
Must-have decks for quick wins
By Industry
Professionally tailored slides for every sector
By Style
Minimal, modern and creative designs
By Topic
Explore slides curated by purpose and theme
Timeline
Roadmap
Strategy
Goals
Table
Comparison
SWOT
Agenda
Arrow
World Map
Maps
Process
Funnel
Team
Org Chart
Pyramid
Circular
Business Plan
Business Strategy
Business Proposal
Business Models
Digital Marketing
Marketing Funnel
Customer Experience
Project Status
Gantt Chart
Recruitment
Employee Performance
Leadership
AI
Machine Learning
AI Presentation Maker
Install the Windows plugin for quick access to templates and design tools.
AI Infographics Maker
Use our Office 365 add - in to access templates directly from the cloud.
Exe Version
Install the Windows plugin for quick access to templates and design tools.
Office 365
Use our Office 365 add - in to access templates directly from the cloud.
Mac Version
Get the Mac plugin to easily browse, insert, and customize templates and visuals within PowerPoint.
Home » Cost Volume-Profit Analysis Graph (CVP) Template for Financial Planning Presentations » CVP Analysis Graph Google Slides Template


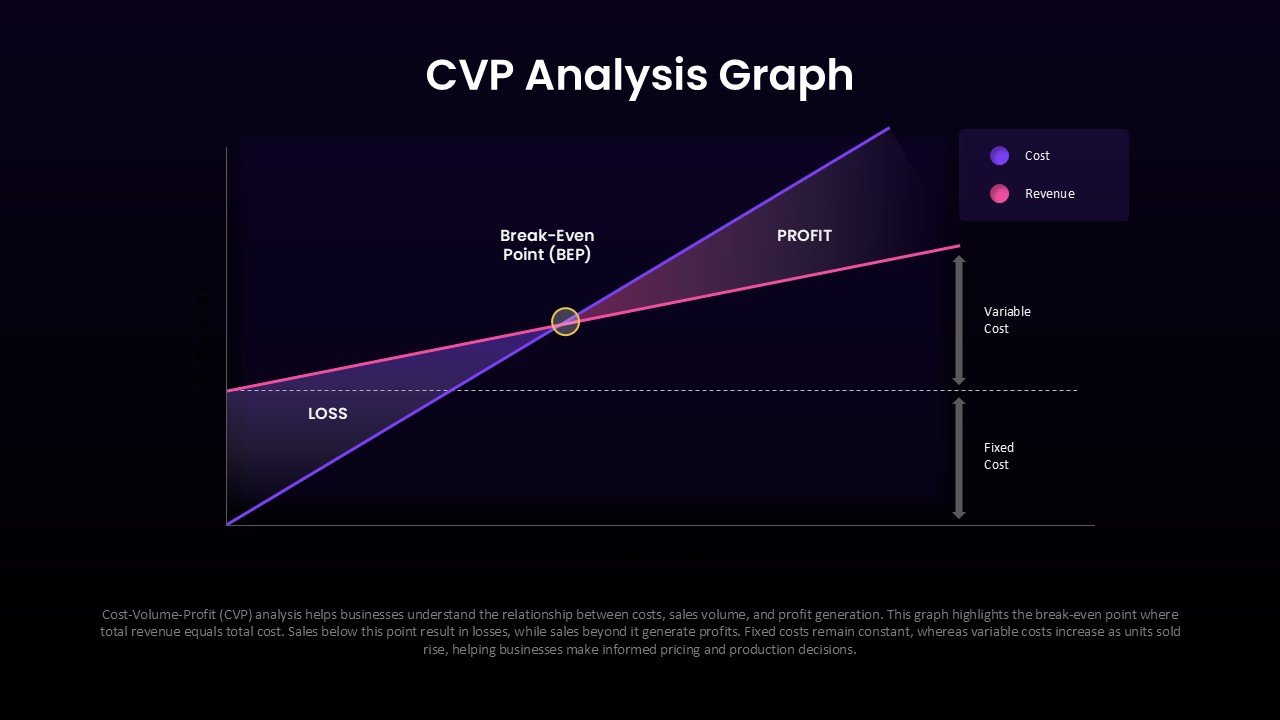
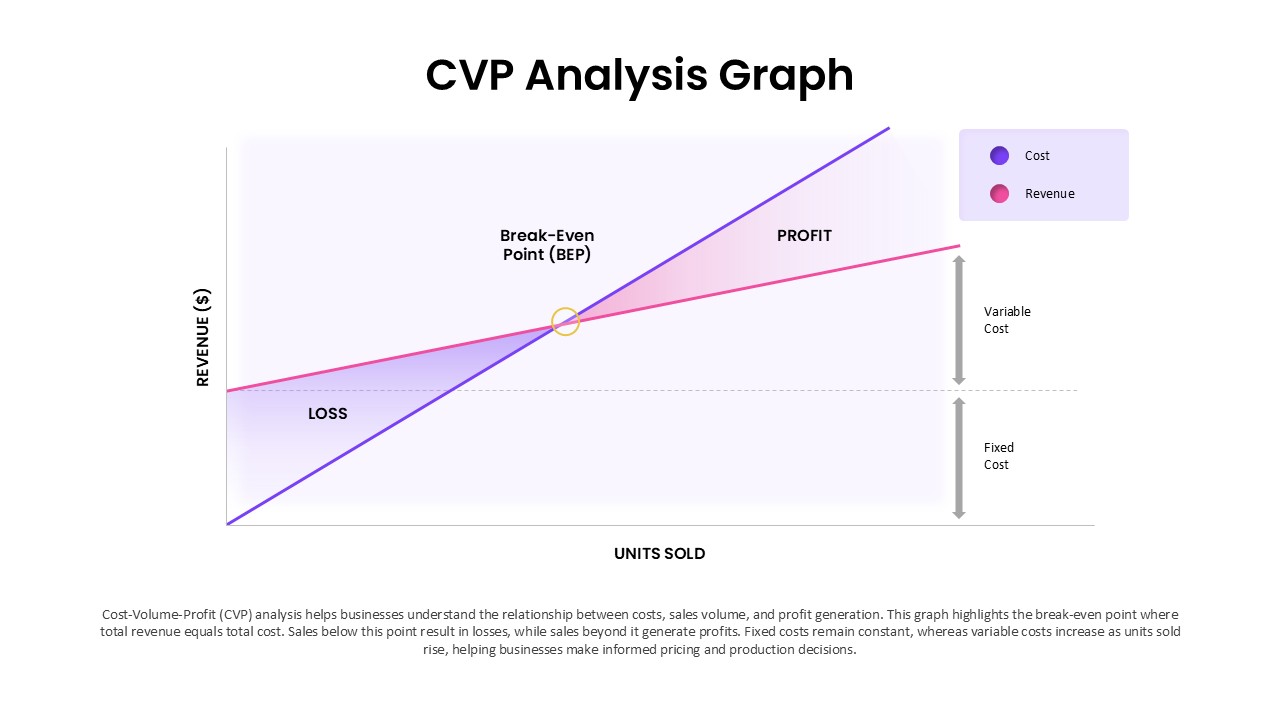
This CVP Analysis Graph Google Slides Template offers a visually powerful way to present financial performance and business profitability metrics. The slide uses a dark-themed design with contrasting graph elements to highlight cost, revenue, and profit relationships in a compelling manner. The featured break-even point and trend visualization help audiences quickly understand how sales volume affects profitability and operational outcomes. Its streamlined structure supports faster communication of key financial indicators while maintaining a modern business presentation style. Ideal for business reviews, financial reporting, management presentations, forecasting sessions, and strategic planning discussions, this template helps convert numbers into meaningful stories. Designed for Google Slides and presentation environments requiring strong visual impact, it enables professionals to communicate financial insights with greater clarity and confidence.
Login to download this file
No. of Slides
2Item ID
SB05921Designed By
Naseeba SitharaRating
0.0
(0 reviews)