Creative Organization Chart Diagram Template for PowerPoint & Google Slides

Description
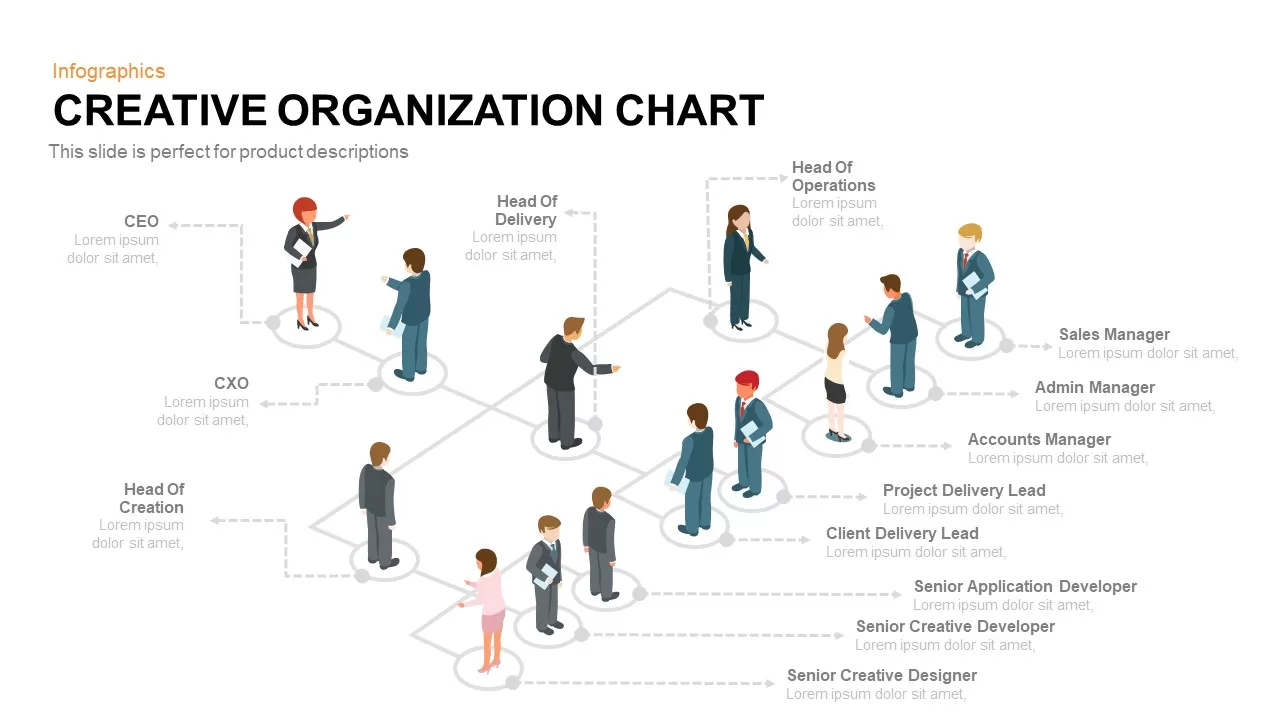
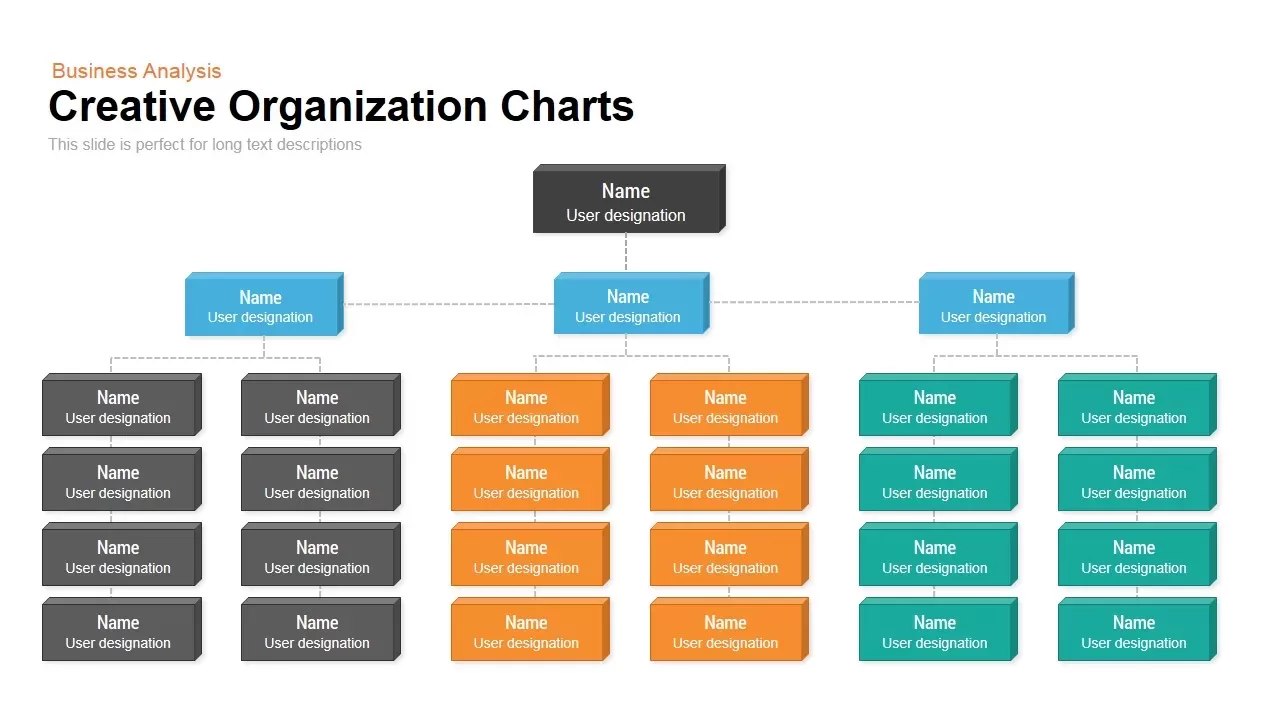
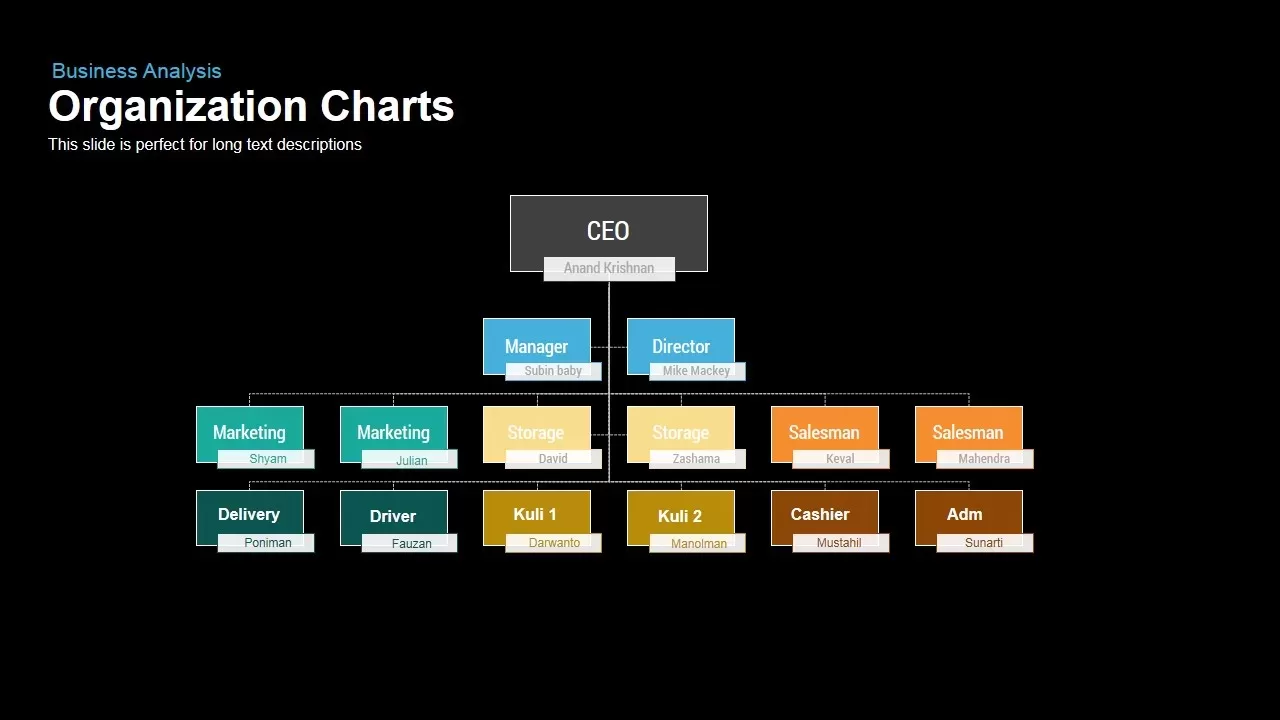
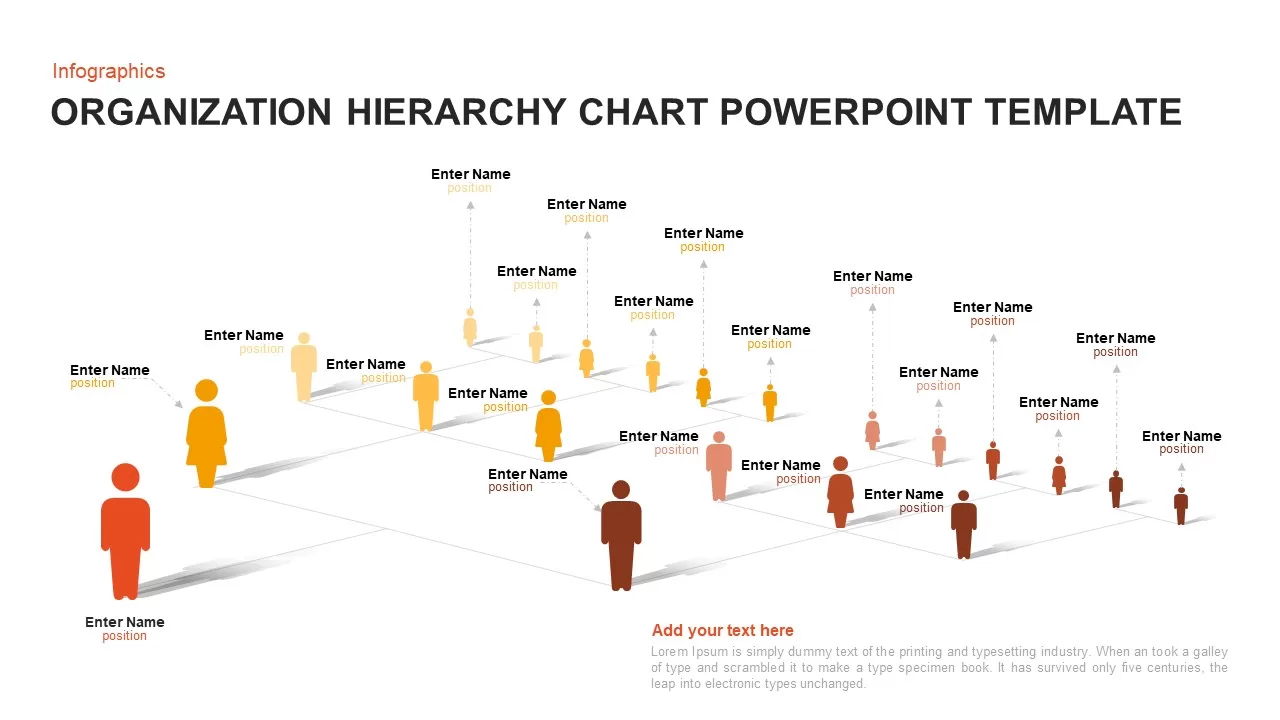
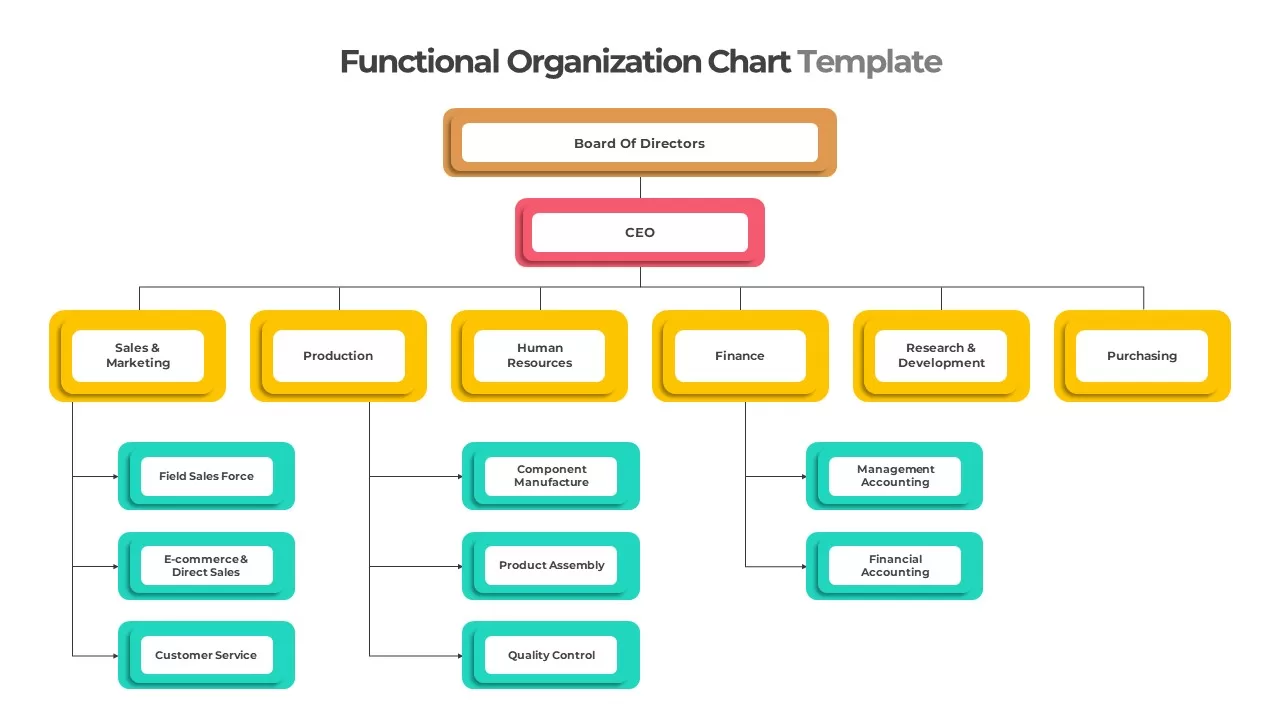
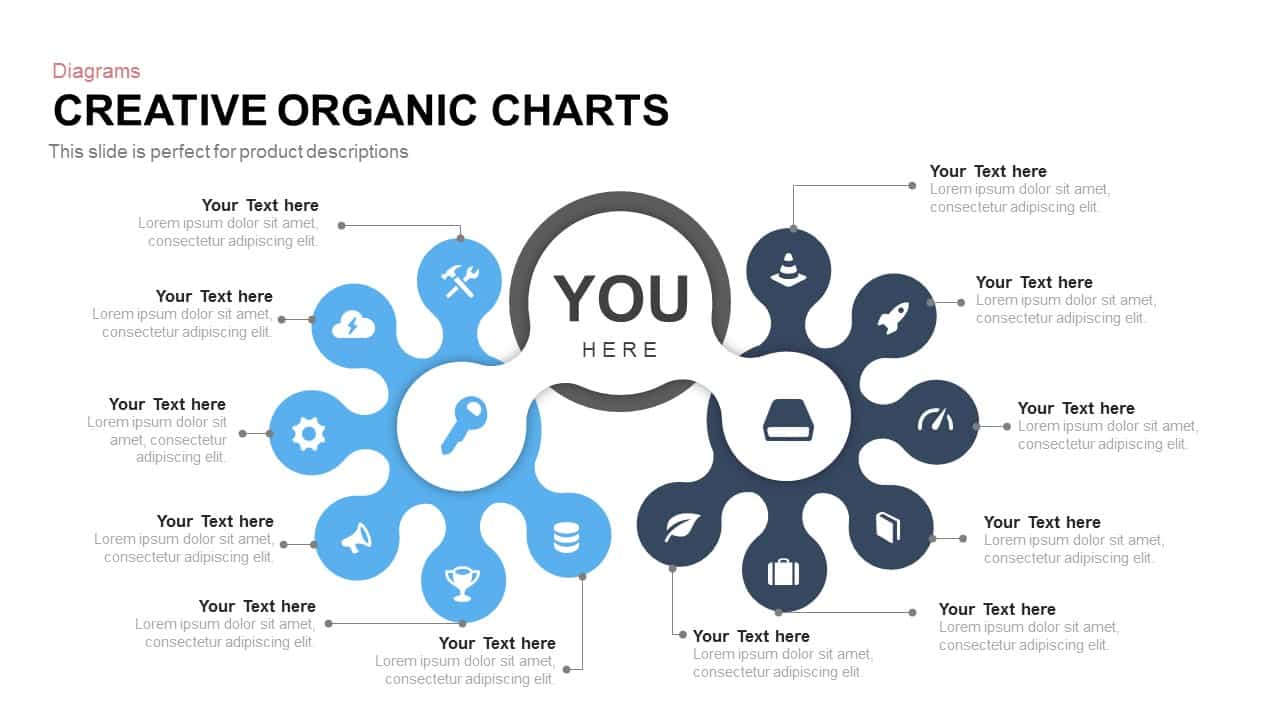
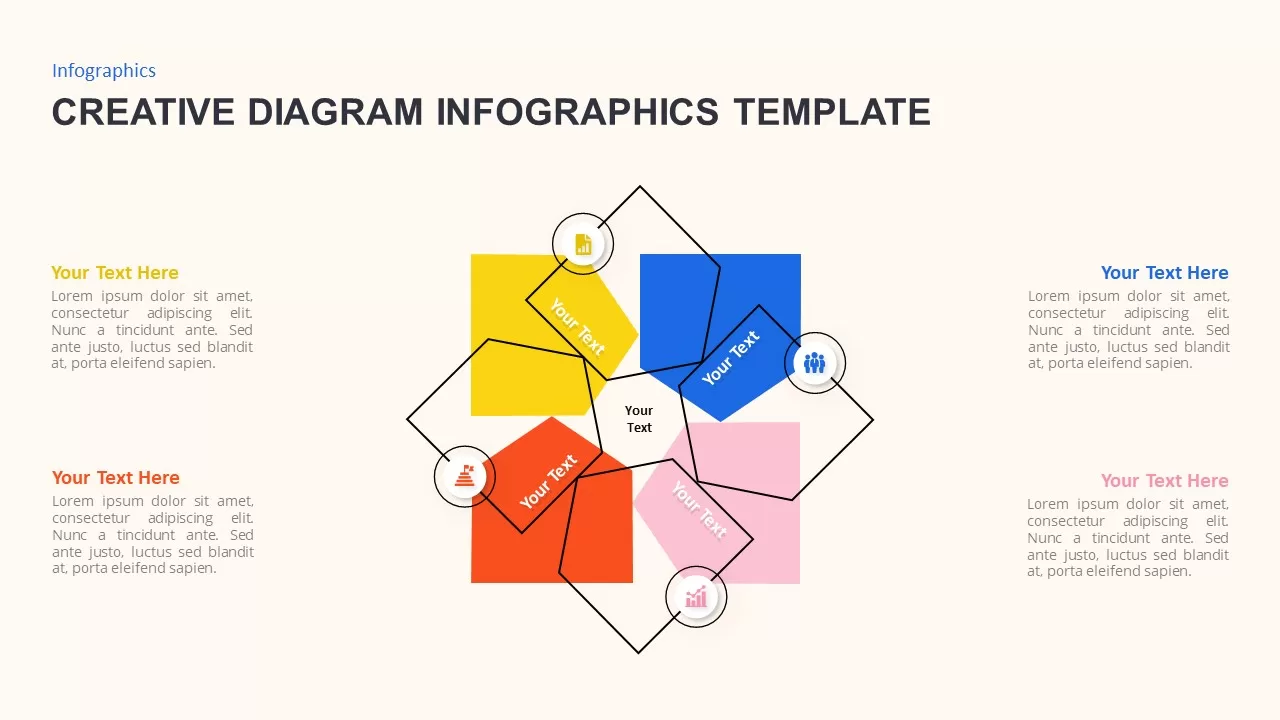
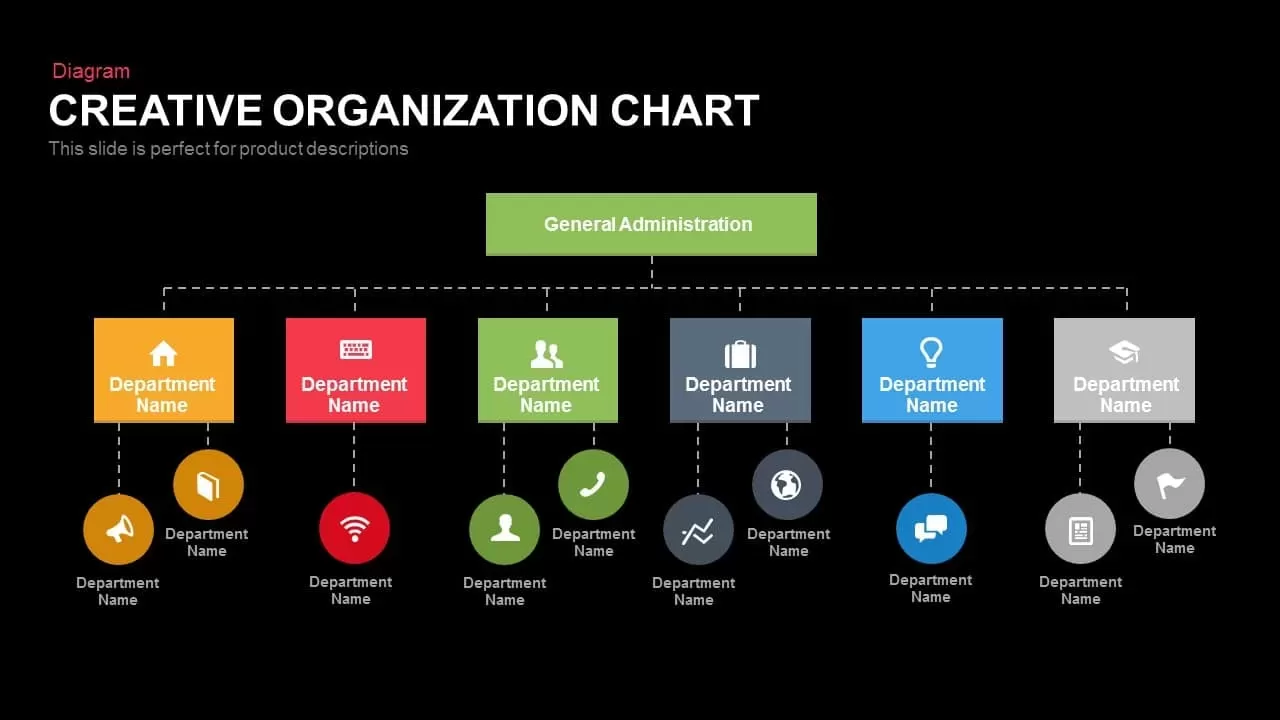
Leverage this creative organization chart slide to map out your company’s hierarchy and departmental structures with a modern flat design. A central header labeled “General Administration” branches downward into six color-coded department panels, each featuring an icon placeholder representing key functions (e.g., HR, IT, Sales, Marketing, Finance, Training). Dotted connectors link main panels to sub-nodes, allowing for two levels of detail per department. Vibrant hues of yellow, red, green, dark gray, blue, and light gray pop against a clean white background, ensuring clarity in both printed reports and digital presentations.
Built for seamless integration in PowerPoint and Google Slides, this slide utilizes editable vector shapes and master layouts to accelerate customization. Effortlessly swap icons, update department names, adjust connector styles, or recolor panels to reflect corporate branding—all without disrupting slide integrity. Intuitive alignment guides and organized layers simplify layout adjustments, while text placeholders maintain consistent formatting across decks. The flat aesthetic with subtle shadows delivers a professional look that aligns with both startup pitches and enterprise reports.
Enhance audience engagement with optional animations that reveal each branch sequentially, guiding viewers through your organizational structure step by step. Use this slide to present change-management frameworks, team introductions, or resource planning sessions. The modular design supports expansion—add or remove department panels, duplicate sub-node groups, or invert connector directions to suit diverse narratives. Combine with supporting slides like department overviews or KPI dashboards for a comprehensive deck. With high-resolution clarity across devices and aspect ratios, this infographic empowers leaders, consultants, and educators to communicate complex structures with efficiency.
Ideal for corporate onboarding, organizational restructuring presentations, and stakeholder reporting, this chart can also serve as a baseline for role mapping, committee assignments, or compliance audits. Duplicate across multiple slides to illustrate timeline changes, compare past and current structures, or track headcount growth over time.
Who is it for
Project managers, product teams, and business analysts will find this slide invaluable for mapping component workflows, illustrating system architectures, or presenting department overviews. Marketing strategists, consultants, and educators can also leverage the radial layout for training modules, audit frameworks, or operational dashboards.
Other Uses
Repurpose this diagram to depict organizational structures, audit cycles, risk-management processes, or customer-journey touchpoints. Duplicate spokes to expand beyond six segments, reorder or stack segments for alternative flows, or integrate data callouts to highlight KPIs and metrics. Ideal for executive dashboards, quarterly planning, or stakeholder workshops.
Login to download this file

Item ID
SB00266
Related Templates

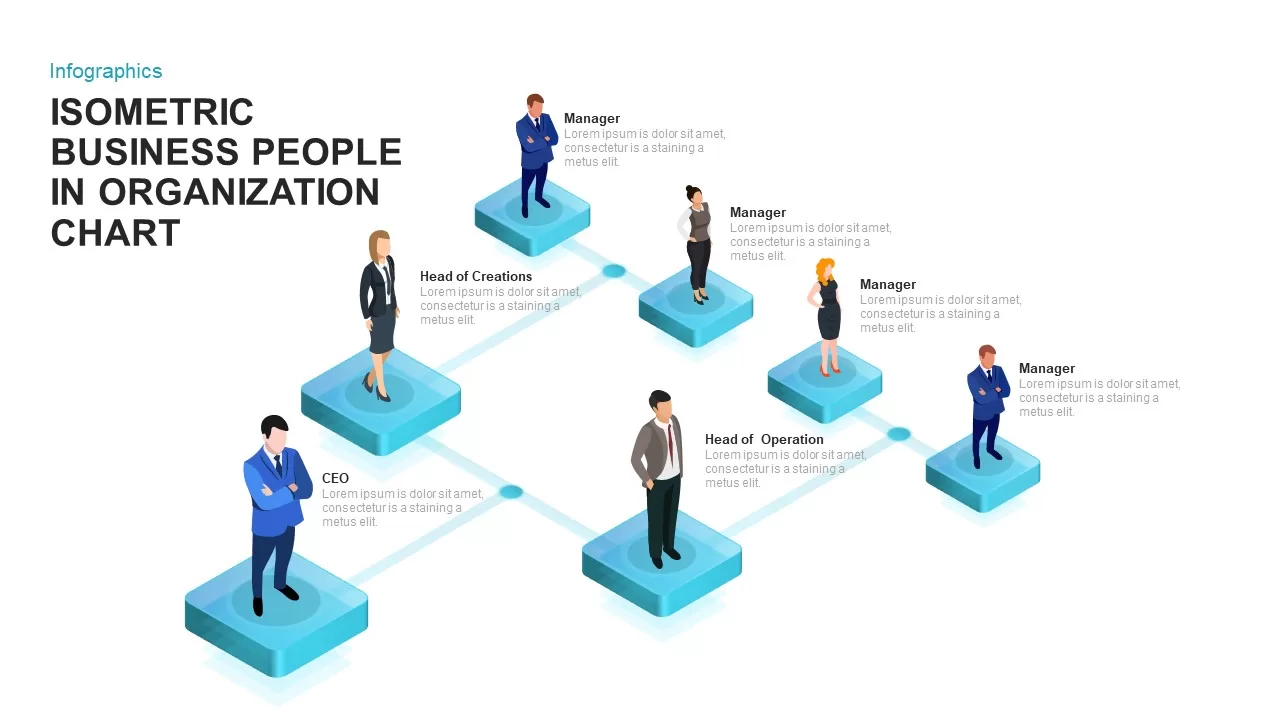
Isometric Organization Chart Diagram Template for PowerPoint & Google Slides
Org Chart
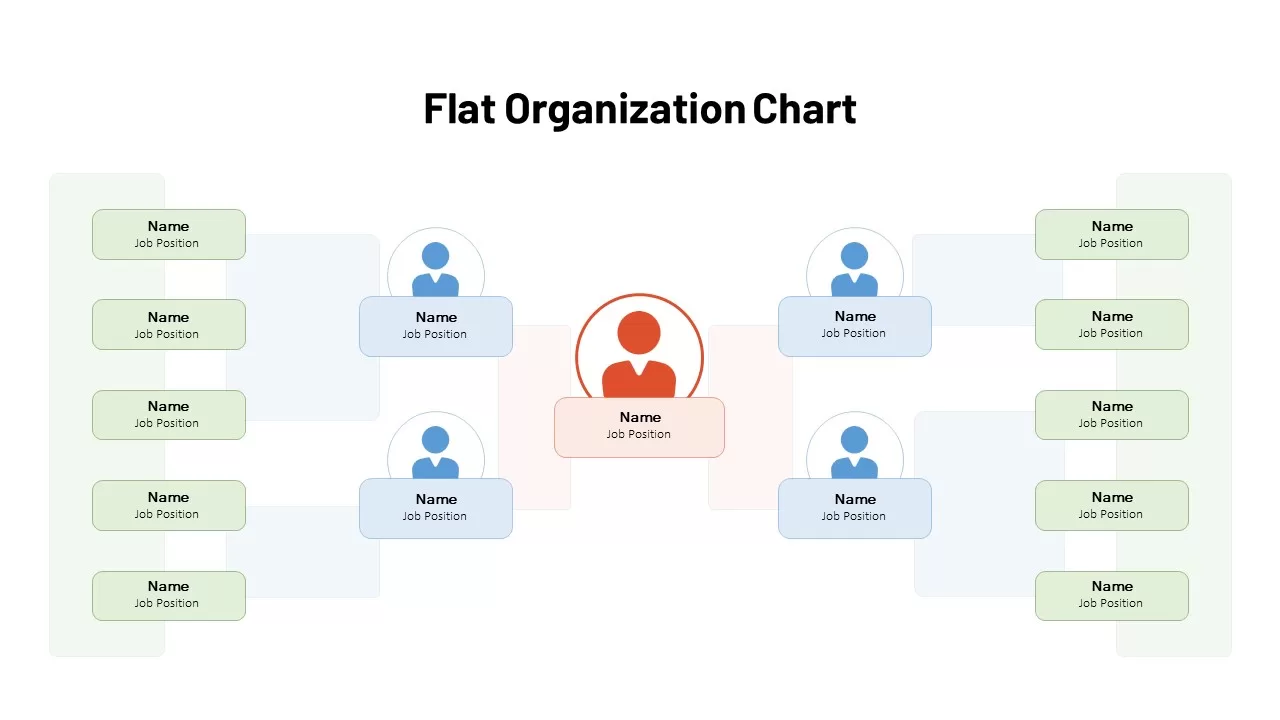
Flat Organization Chart Diagram Template for PowerPoint & Google Slides
Org Chart
Flat Organization Chart Diagram Template for PowerPoint & Google Slides
Org Chart
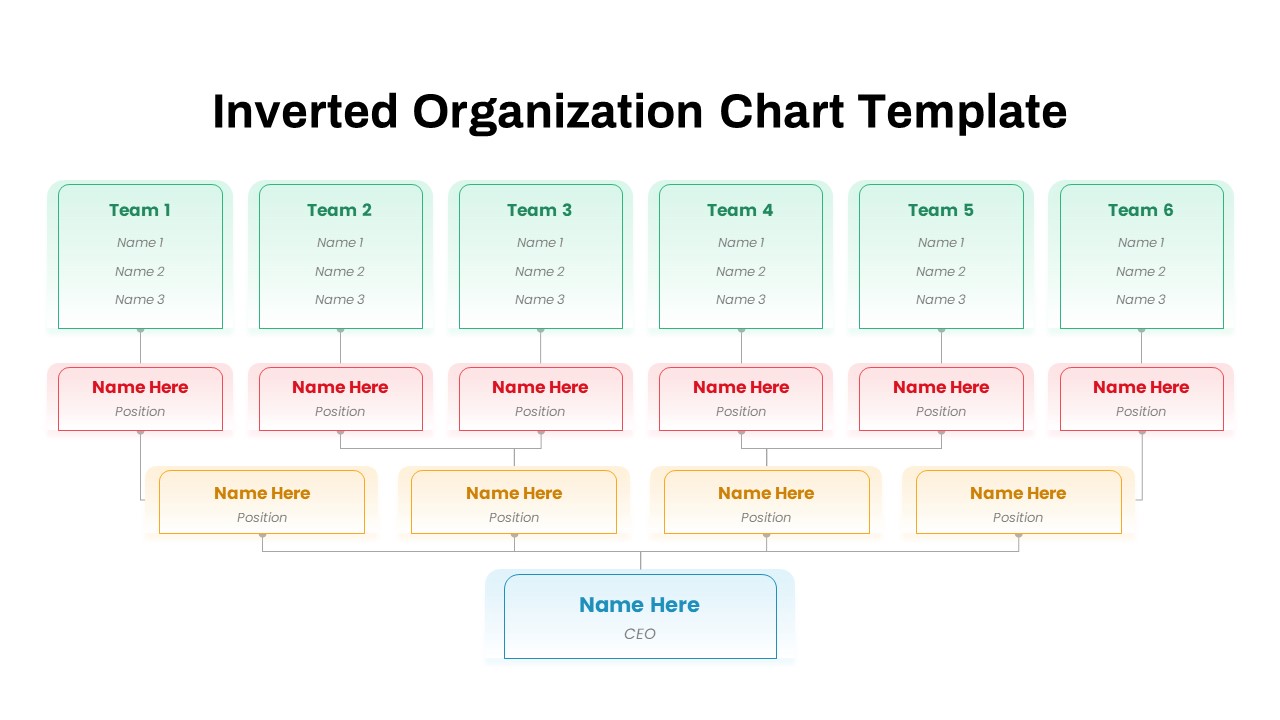
Inverted Organization Chart Diagram Template for PowerPoint & Google Slides
Org Chart

Corporate Organization Chart template for PowerPoint & Google Slides
Org Chart
Organization Chart template for PowerPoint & Google Slides
Org Chart
Business Organization Chart Hierarchy Template for PowerPoint & Google Slides
Org Chart

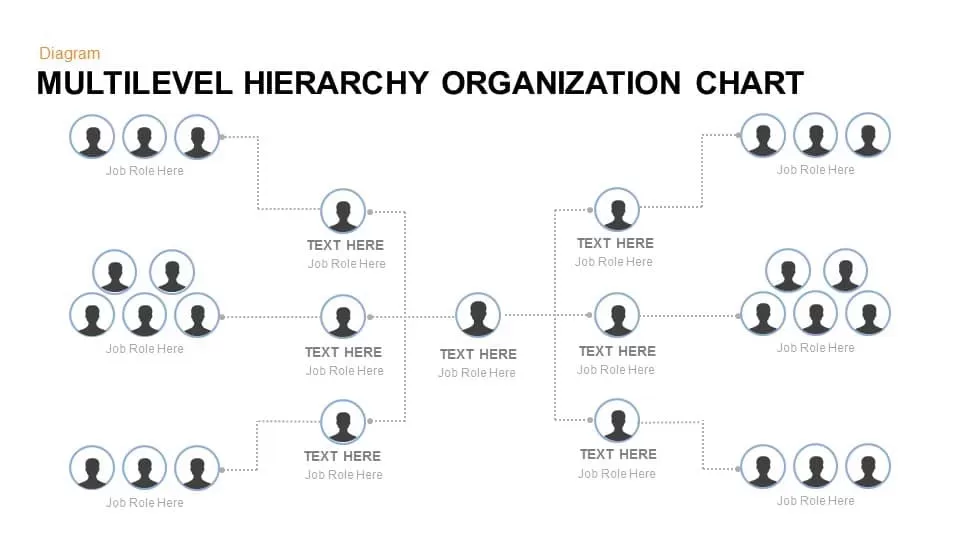
Multilevel Hierarchy Organization Chart template for PowerPoint & Google Slides
Org Chart
Organization Chart Overview template for PowerPoint & Google Slides
Org Chart
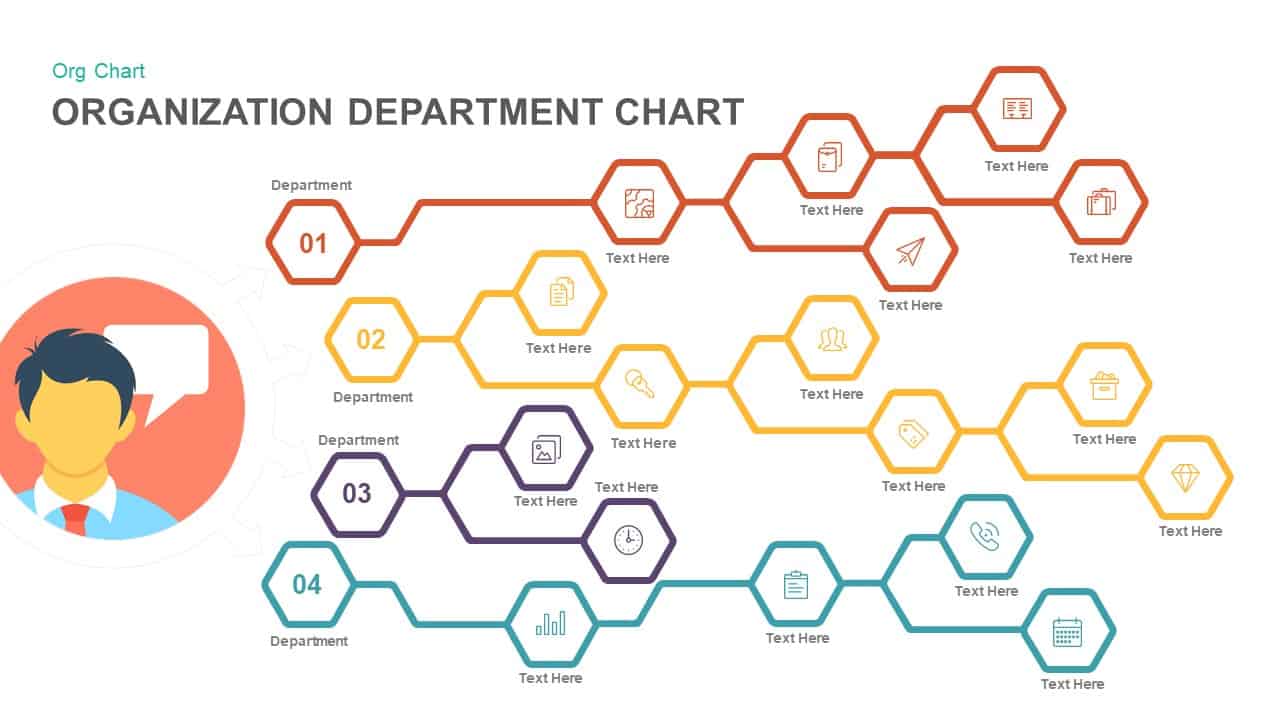
Organization Department Hexagon Chart Template for PowerPoint & Google Slides
Org Chart
3D Organization Hierarchy Chart Template for PowerPoint & Google Slides
Org Chart
Isometric Business Organization Chart Template for PowerPoint & Google Slides
Org Chart
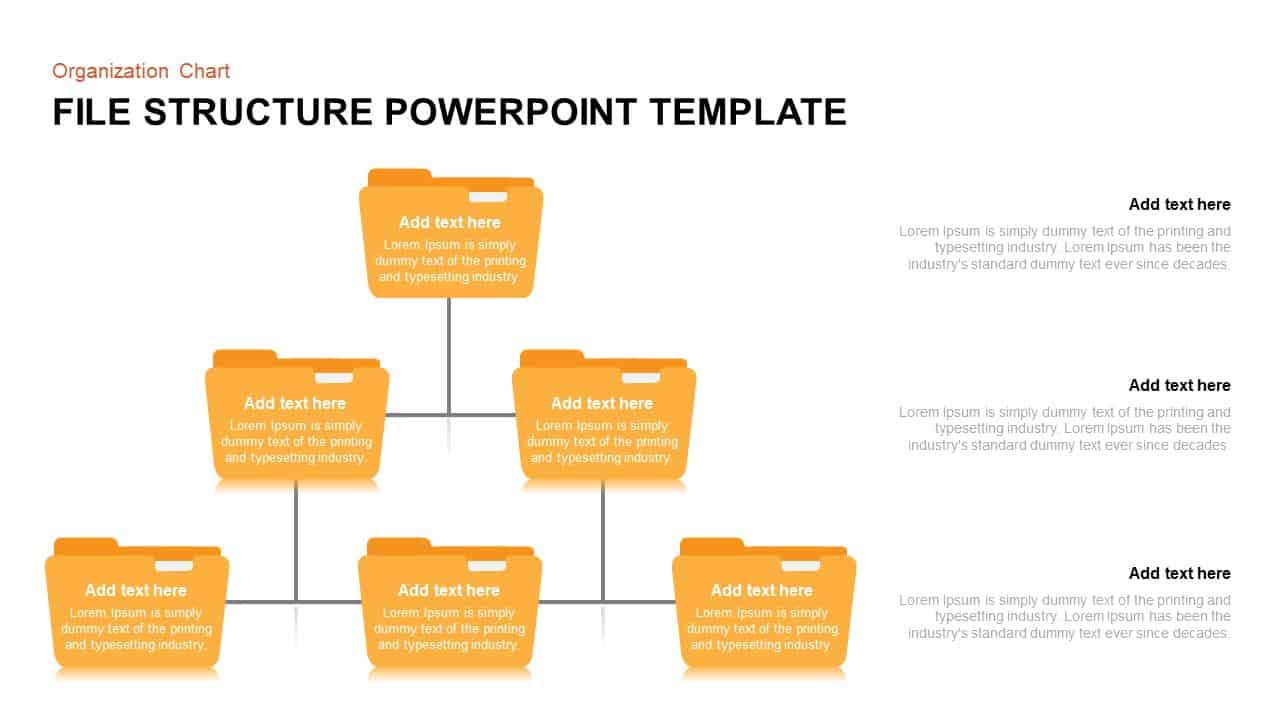
File Structure Organization Chart Template for PowerPoint & Google Slides
Org Chart
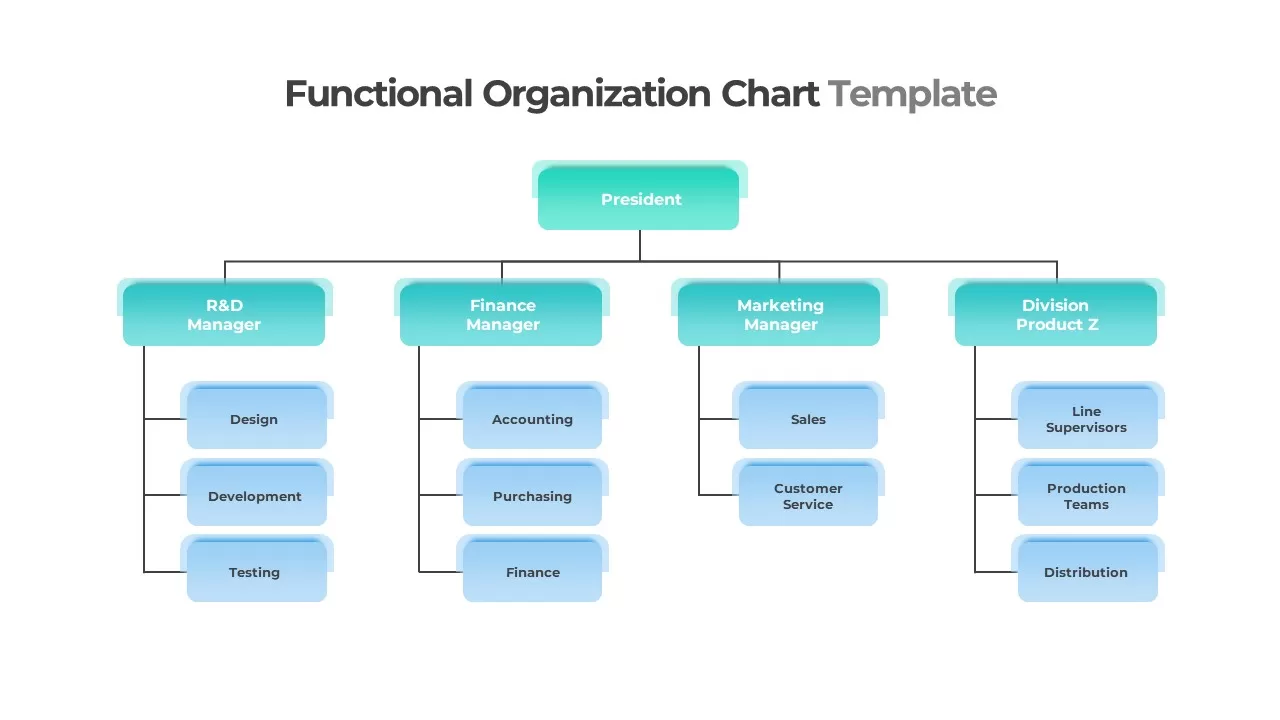
Functional Organization Chart Structure Template for PowerPoint & Google Slides
Org Chart
Colorful Functional Organization Chart Template for PowerPoint & Google Slides
Org Chart
Modern Divisional Organization Chart Template for PowerPoint & Google Slides
Org Chart
Divisional Organization Chart Template for PowerPoint & Google Slides
Org Chart
Professional HR Organization Chart Template for PowerPoint & Google Slides
Org Chart
Professional Table of Organization Chart Template for PowerPoint & Google Slides
Org Chart
Learning Organization PowerPoint Template for PowerPoint & Google Slides
Business Strategy
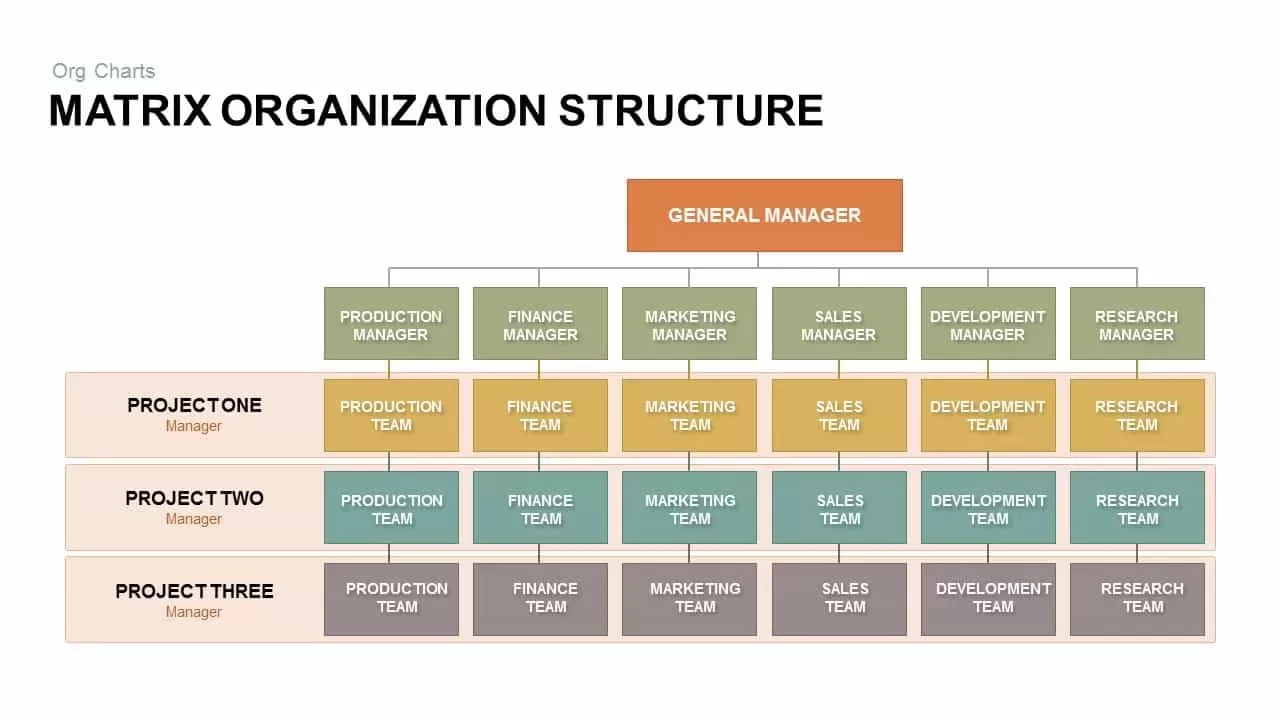
Matrix Organization Structure template for PowerPoint & Google Slides
Org Chart

Non-Profit Organization Profile Deck Template for PowerPoint & Google Slides
Pitch Deck
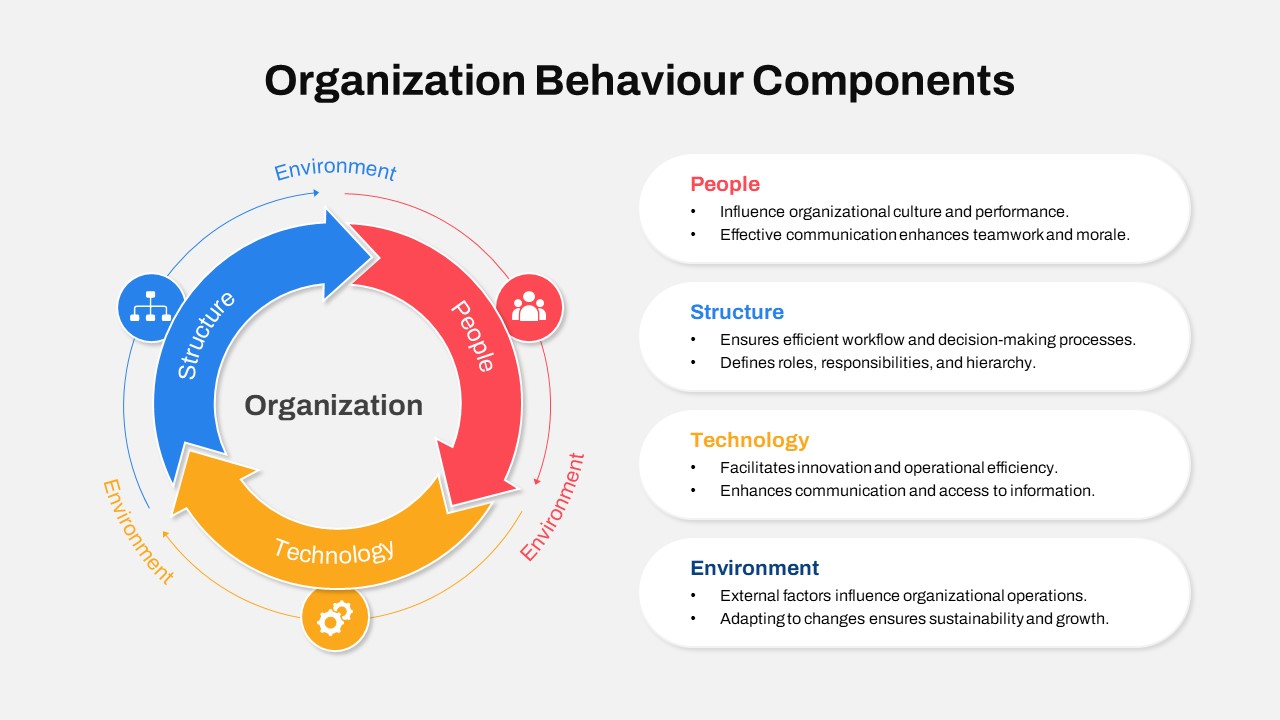
Organization Behaviour Circular Template for PowerPoint & Google Slides
Circular
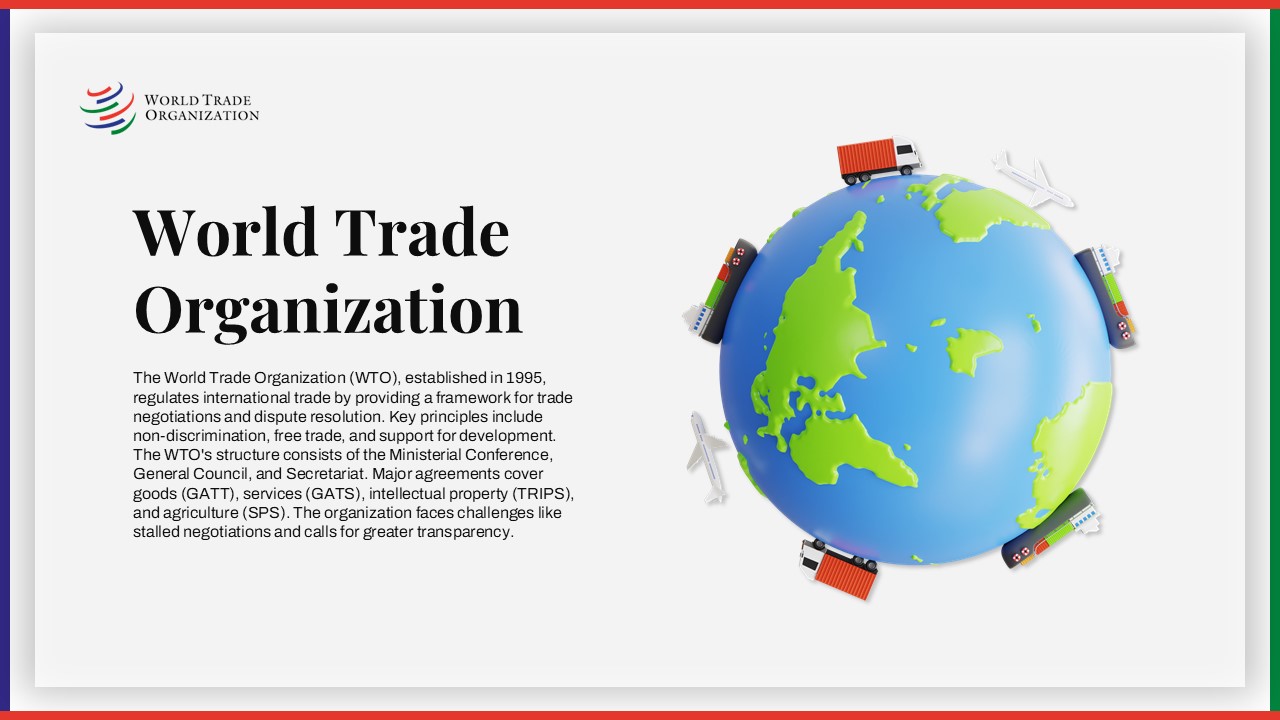
World Trade Organization Profile Template for PowerPoint & Google Slides
Business
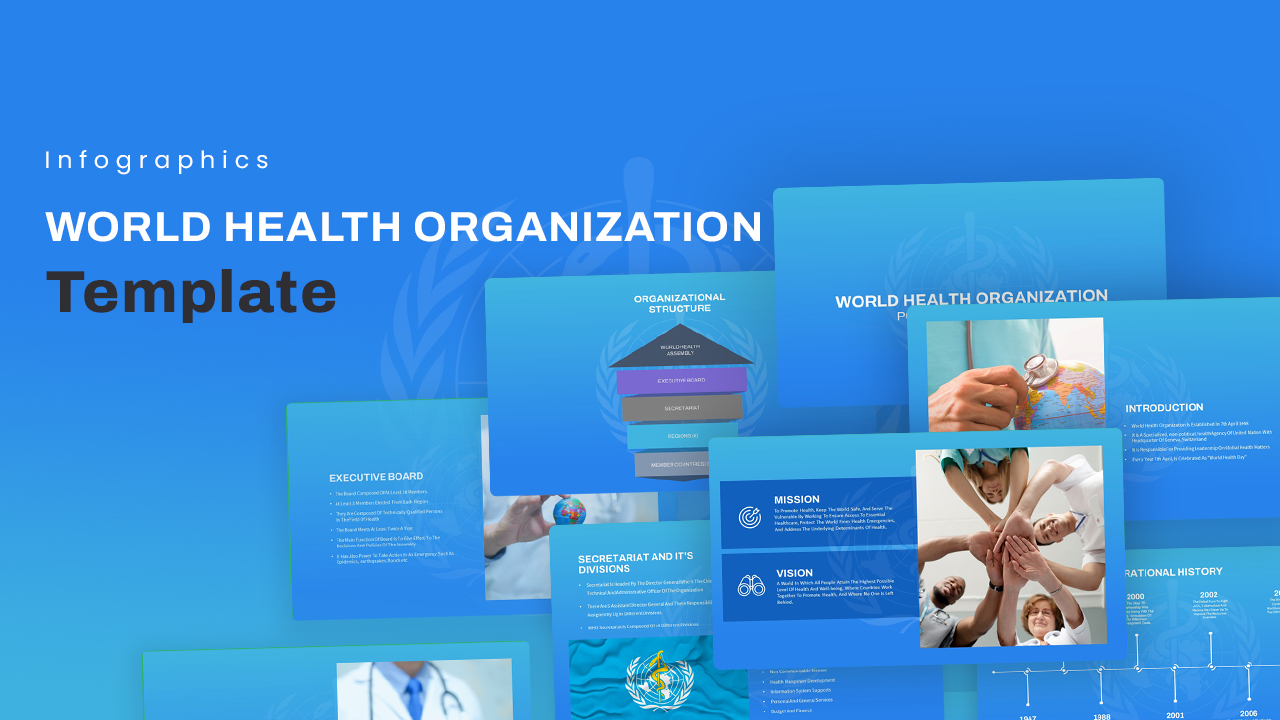
Free World Health Organization Presentation Deck for PowerPoint & Google Slides
Decks
Free
Circle Strategy Creative Chart template for PowerPoint & Google Slides
Business Strategy

Creative data chart analytics template for PowerPoint & Google Slides
Charts
Creative Data Analysis Bar Chart template for PowerPoint & Google Slides
Bar/Column
Creative SWOT Chart template for PowerPoint & Google Slides
SWOT
Creative Dynamic Gantt Chart Timeline Template for PowerPoint & Google Slides
Timeline
Creative Bar Chart template for PowerPoint & Google Slides
Charts
Creative Organizational Chart Template for PowerPoint & Google Slides
Org Chart
Free Eight Circle Creative Diagram template for PowerPoint & Google Slides
Circular
Free
Creative flow diagram template for PowerPoint & Google Slides
Process
4 Step Creative Process Diagram Template for PowerPoint & Google Slides
Infographics
4 Step Creative Circular Diagram Template for PowerPoint & Google Slides
Infographics
Six Step Creative Circular Diagram Template for PowerPoint & Google Slides
Circular
Engaging Creative Tree Diagram Slide Template for PowerPoint & Google Slides
Flow Charts
Annual Creative Hexagon Timeline Diagram Template for PowerPoint & Google Slides
Timeline
Creative Layered Oval Infographic Diagram Template for PowerPoint & Google Slides
Process
Creative Organic Hub-and-Spoke Diagram template for PowerPoint & Google Slides
Circular
Colorful Creative Mind Map Diagram template for PowerPoint & Google Slides
Mind Maps
Creative Tree Diagram with Percentages Template for PowerPoint & Google Slides
Decision Tree
Creative Tree Infographic Diagram Template for PowerPoint & Google Slides
Infographics
Creative Three-Circle Venn Diagram Template for PowerPoint & Google Slides
Comparison
Creative Tree Diagram Infographic Template for PowerPoint & Google Slides
Decision Tree
Creative Mind Mapping Diagram with Icons Template for PowerPoint & Google Slides
Mind Maps
Creative Tree Diagram template for PowerPoint & Google Slides
Process
Creative Strategy Diagram Template for PowerPoint & Google Slides
Business Strategy
Creative Tree Diagram Infographic Template for PowerPoint & Google Slides
Decision Tree
Creative Infinity Loop Process Diagram Template for PowerPoint & Google Slides
Process
Versatile Creative Diagram Infographics Template for PowerPoint & Google Slides
Process
Creative Brainstorming Process Diagram Template for PowerPoint & Google Slides
Process
3 Step Creative Circular Diagram for PowerPoint & Google Slides
Process
Creative Section Divider Slides Template for PowerPoint & Google Slides
Decks

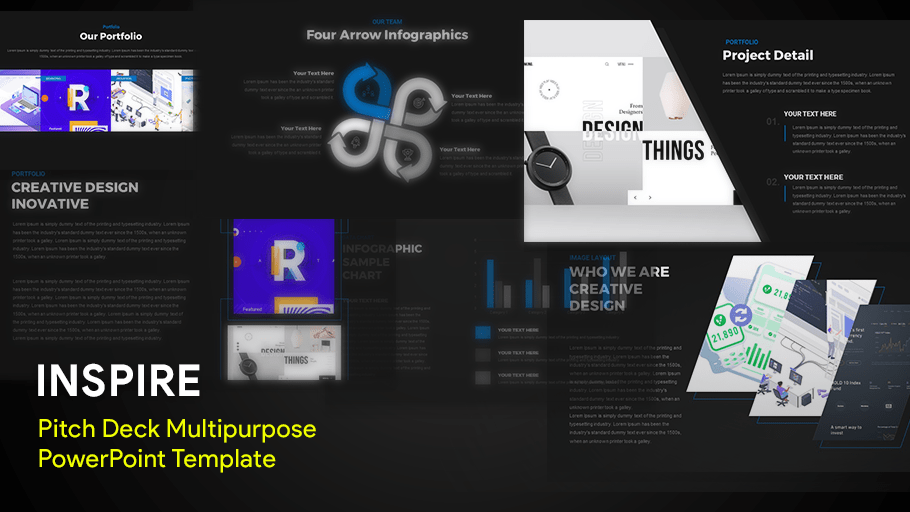
Inspire Multipurpose Creative Deck PowerPoint Template for PowerPoint & Google Slides
Pitch Deck
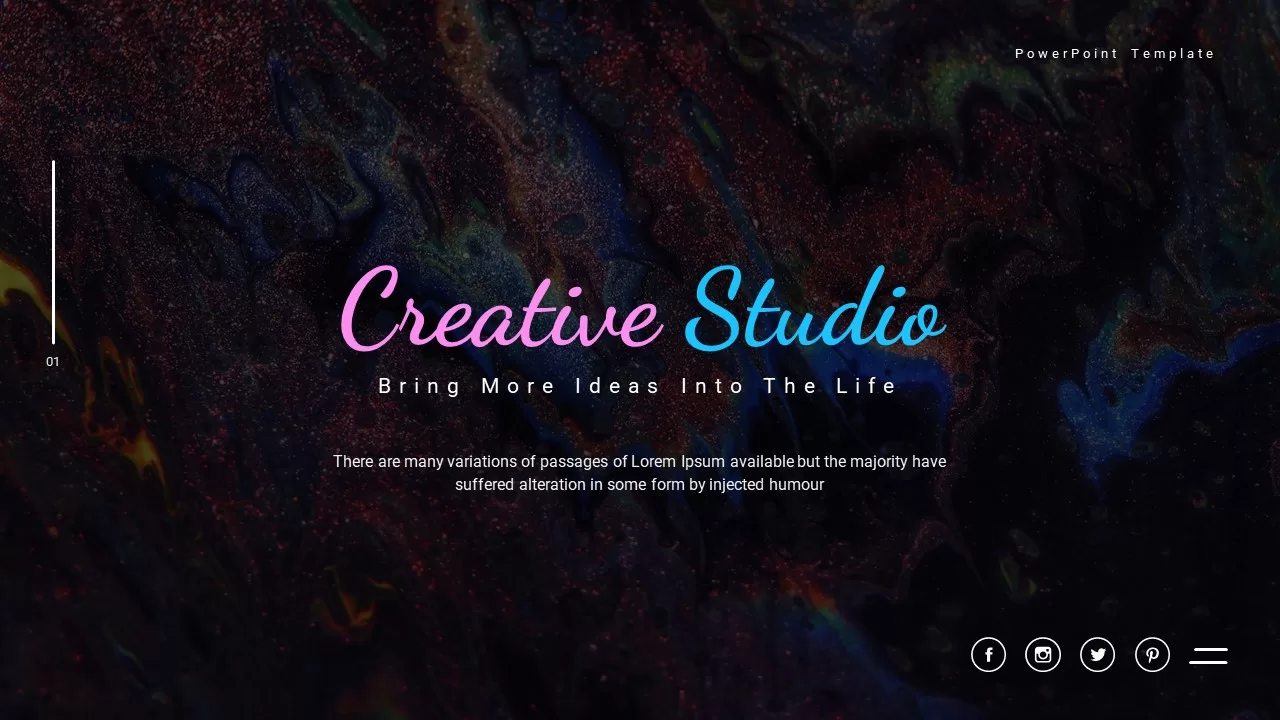
Creative Studio PowerPoint Template for PowerPoint & Google Slides
Decks
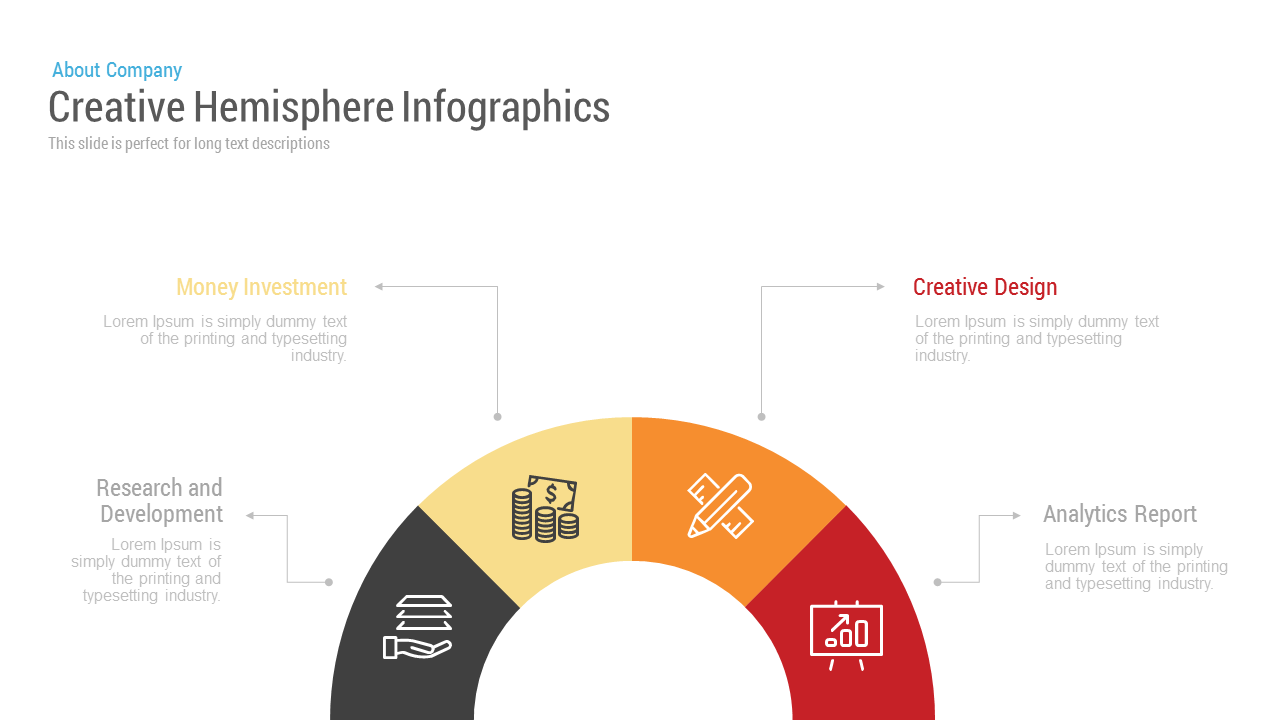
Free Creative Hemisphere Infographics template for PowerPoint & Google Slides
Infographics
Free
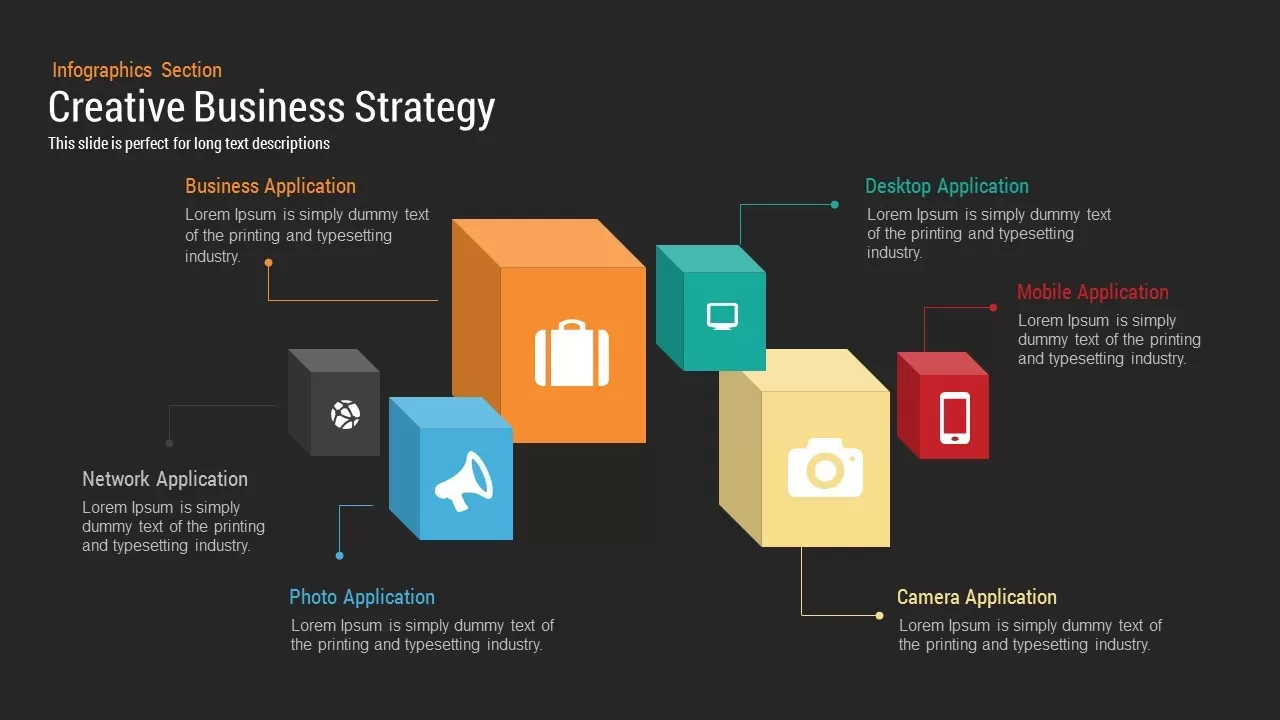
Creative Business Strategy Template for PowerPoint & Google Slides
Business Strategy
Creative Flow Infographic template for PowerPoint & Google Slides
Process
Creative Step By Step Workflow template for PowerPoint & Google Slides
Process
Creative World Map template for PowerPoint & Google Slides
World Maps
Dynamic Creative Head Infographics Template for PowerPoint & Google Slides
Circular
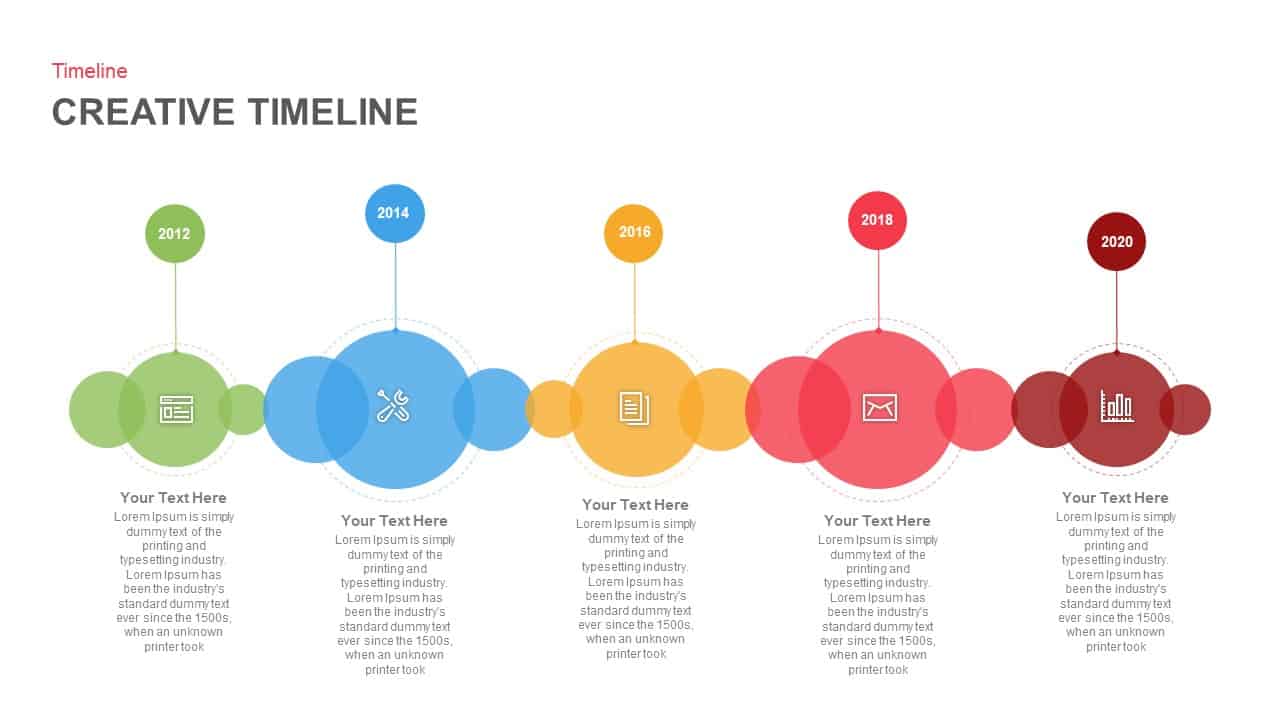
Creative Timeline template for PowerPoint & Google Slides
Timeline
Animated Creative Timeline template for PowerPoint & Google Slides
Timeline
Creative Roadmap template for PowerPoint & Google Slides
Infographics
Creative Pencil Timeline Infographic Template for PowerPoint & Google Slides
Timeline
Creative Lab Beakers Data Infographic template for PowerPoint & Google Slides
Infographics

Creative Zigzag Circle Service Steps Template for PowerPoint & Google Slides
Process
Creative Brush Stroke Image Layouts Template for PowerPoint & Google Slides
Decks
Creative Bubble Timeline Infographic Template for PowerPoint & Google Slides
Timeline

PIXELS – Free Creative Presentation Template for PowerPoint & Google Slides
Pitch Deck
Free

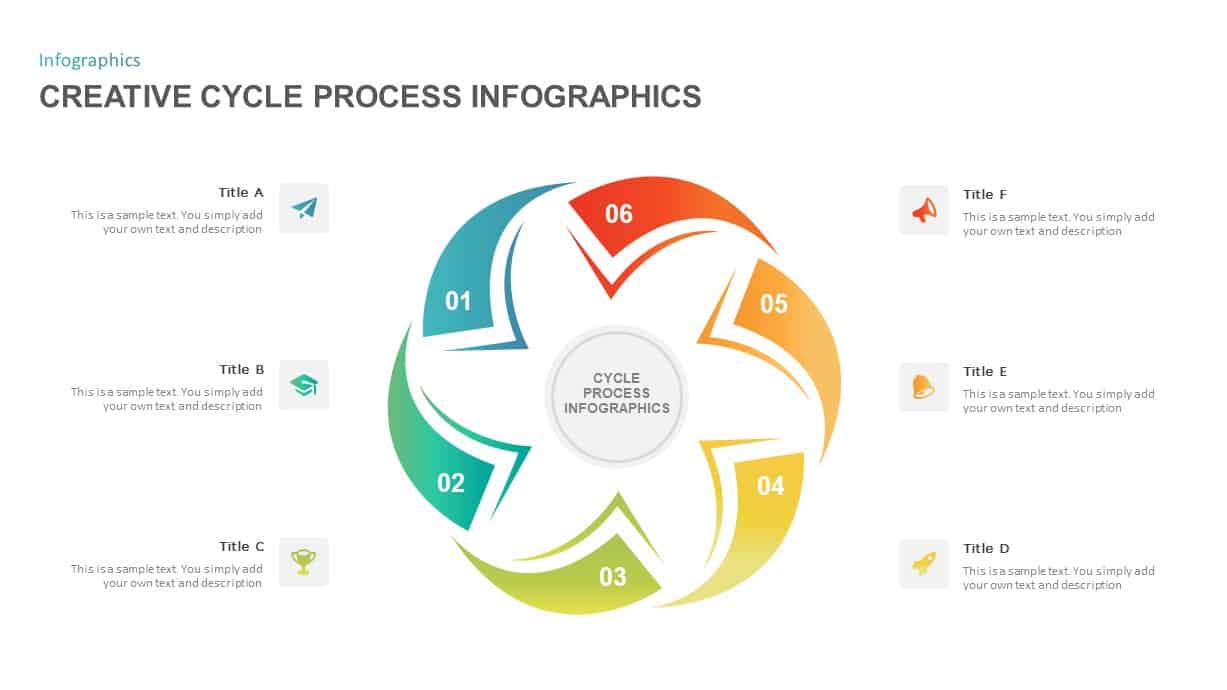
Creative Cycle Process Infographics Template for PowerPoint & Google Slides
Process
Animated Business Trends Creative Deck Template for PowerPoint & Google Slides
Pitch Deck
Creative Tips Slide Template for PowerPoint & Google Slides
Business
Free Helooo Creative Company Profile Template for PowerPoint & Google Slides
Company Profile
Free
Creative Blue Blobs Abstract Title Slide Template for PowerPoint & Google Slides
Company Profile
Pop Art Creative Presentation Template for PowerPoint & Google Slides
Decks
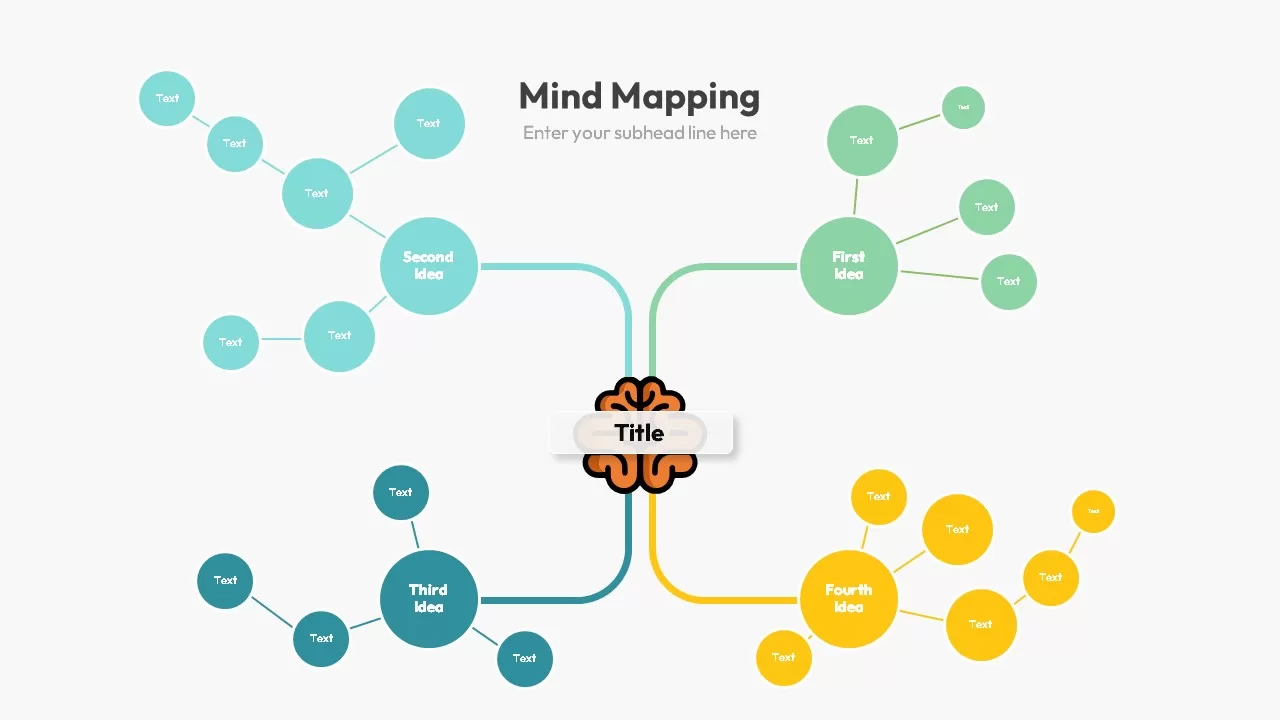
Creative Mind Mapping Template for PowerPoint & Google Slides
Mind Maps
Creative Polaroid Collage Photo Slide Template for PowerPoint & Google Slides
Graphics
Creative Photo Collage Grid Layout Template for PowerPoint & Google Slides
Graphics
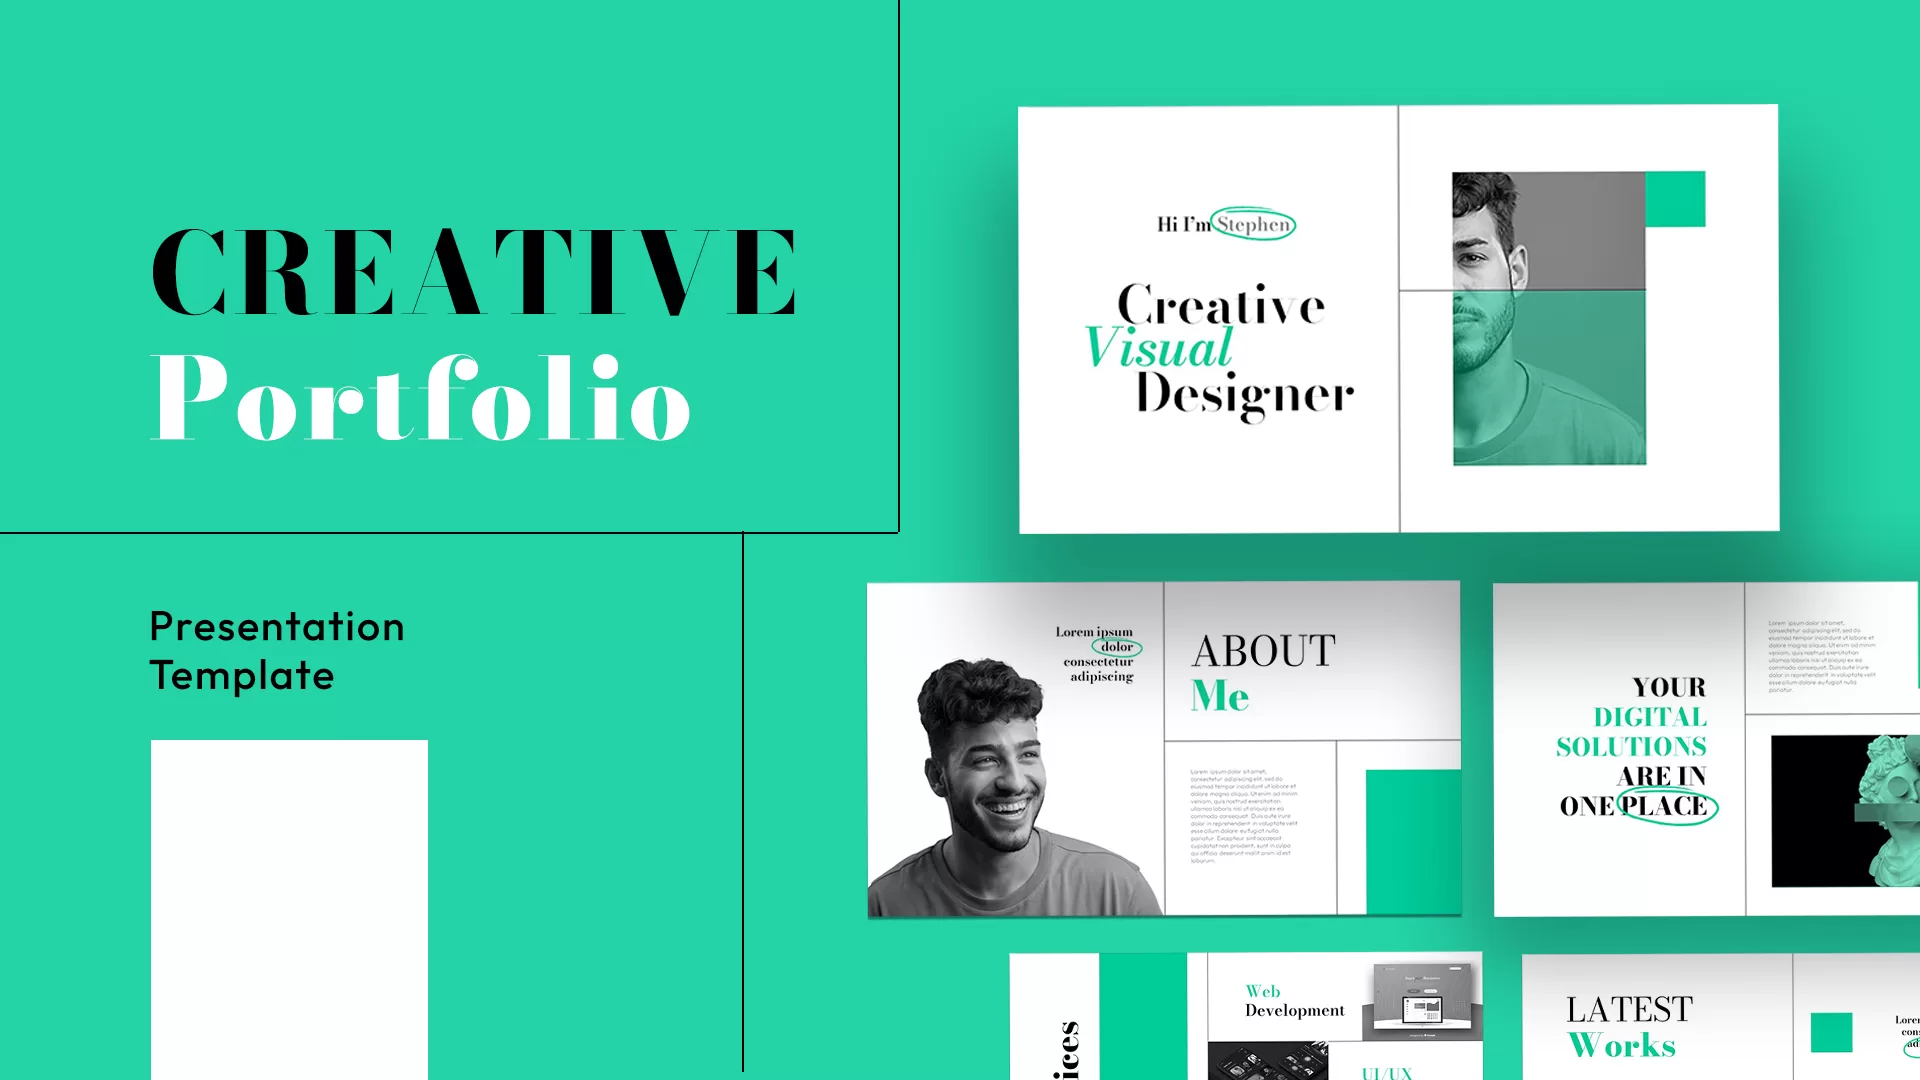
Creative Portfolio Showcase Presentation Template for PowerPoint & Google Slides
Decks
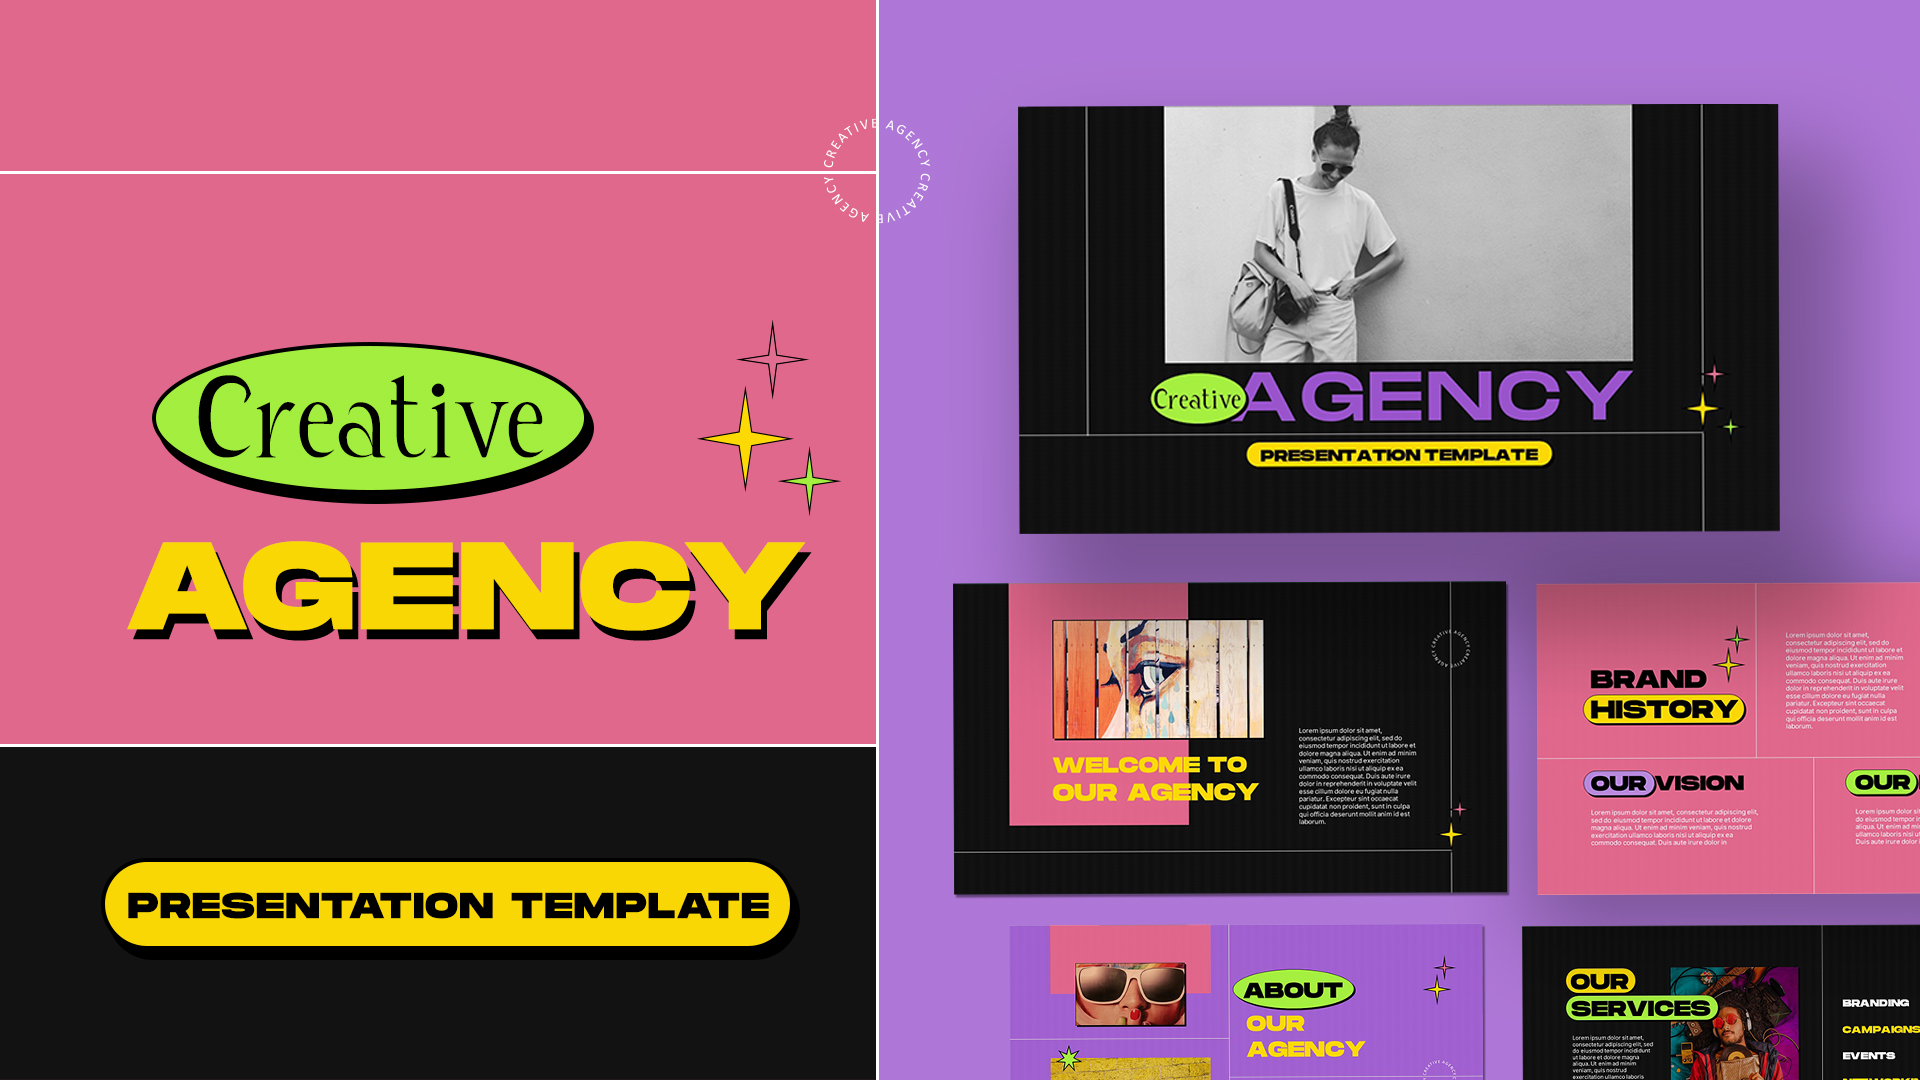
Creative Agency Visual Portfolio Template for PowerPoint & Google Slides
Company Profile
Creative Team Introduction template for PowerPoint & Google Slides
Our Team

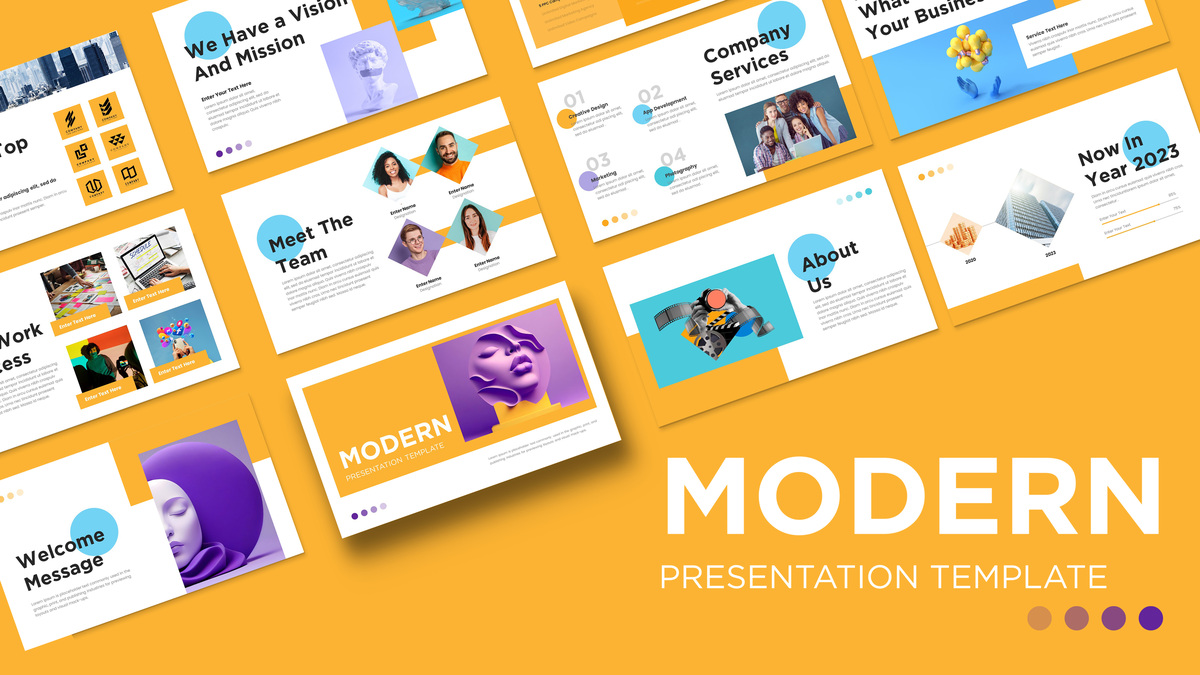
Modern Creative Business Pitch Deck Template for PowerPoint & Google Slides
Pitch Deck
Memphis Style Creative Presentation Template for PowerPoint & Google Slides
Pitch Deck
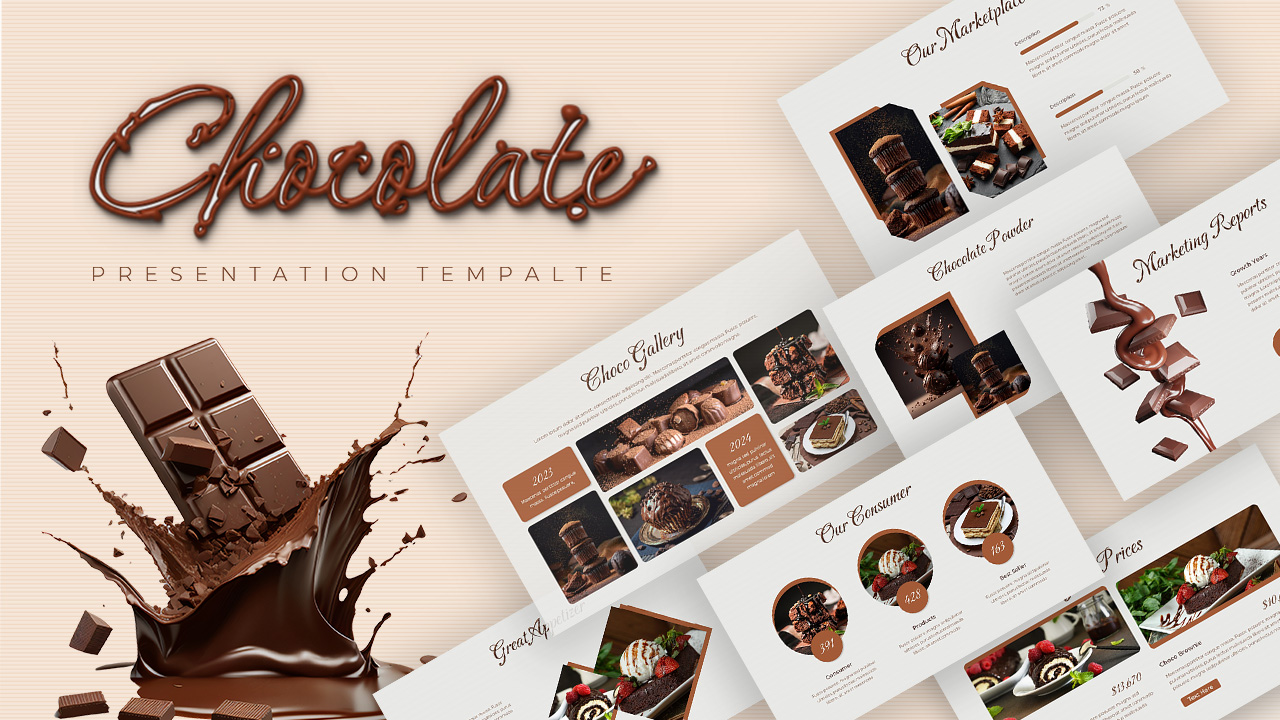
Creative Chocolate Marketing Deck Template for PowerPoint & Google Slides
Company Profile
Creative Books Theme Presentation Template for PowerPoint & Google Slides
Pitch Deck
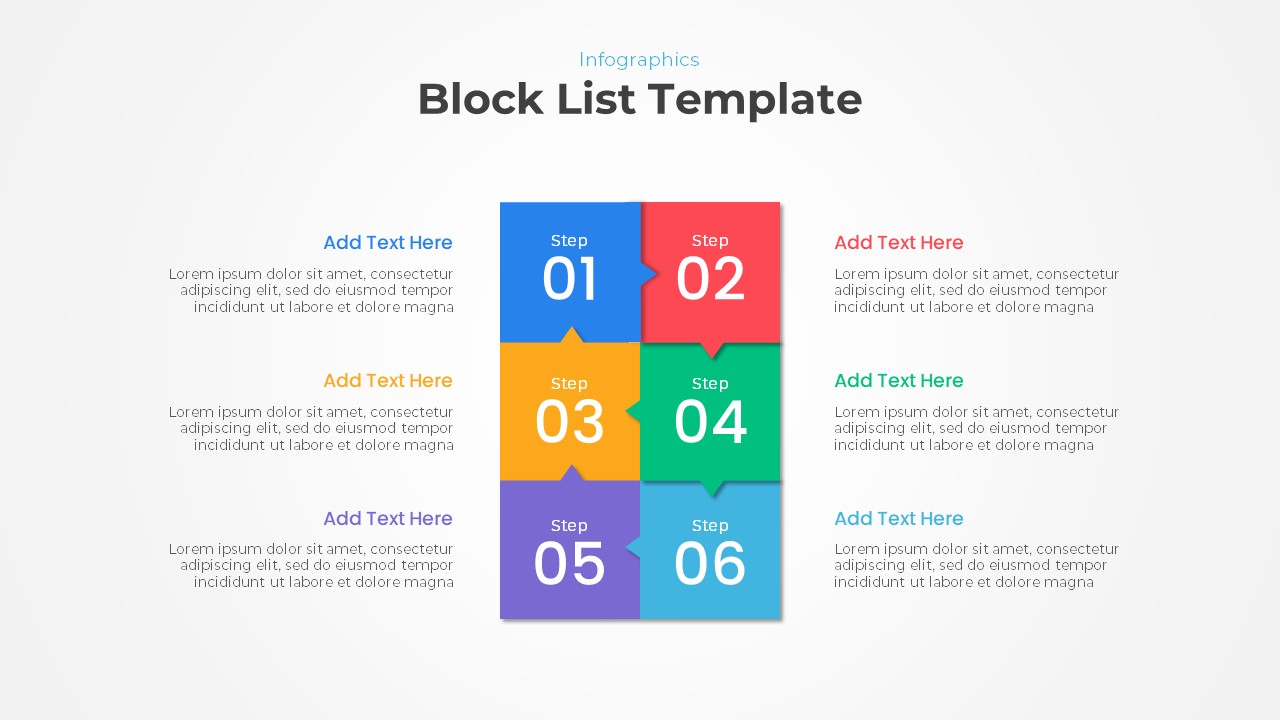
Creative Block List Infographic Template for PowerPoint & Google Slides
Agenda
Creative Power Analogy Metaphor Slide Template for PowerPoint & Google Slides
Leadership
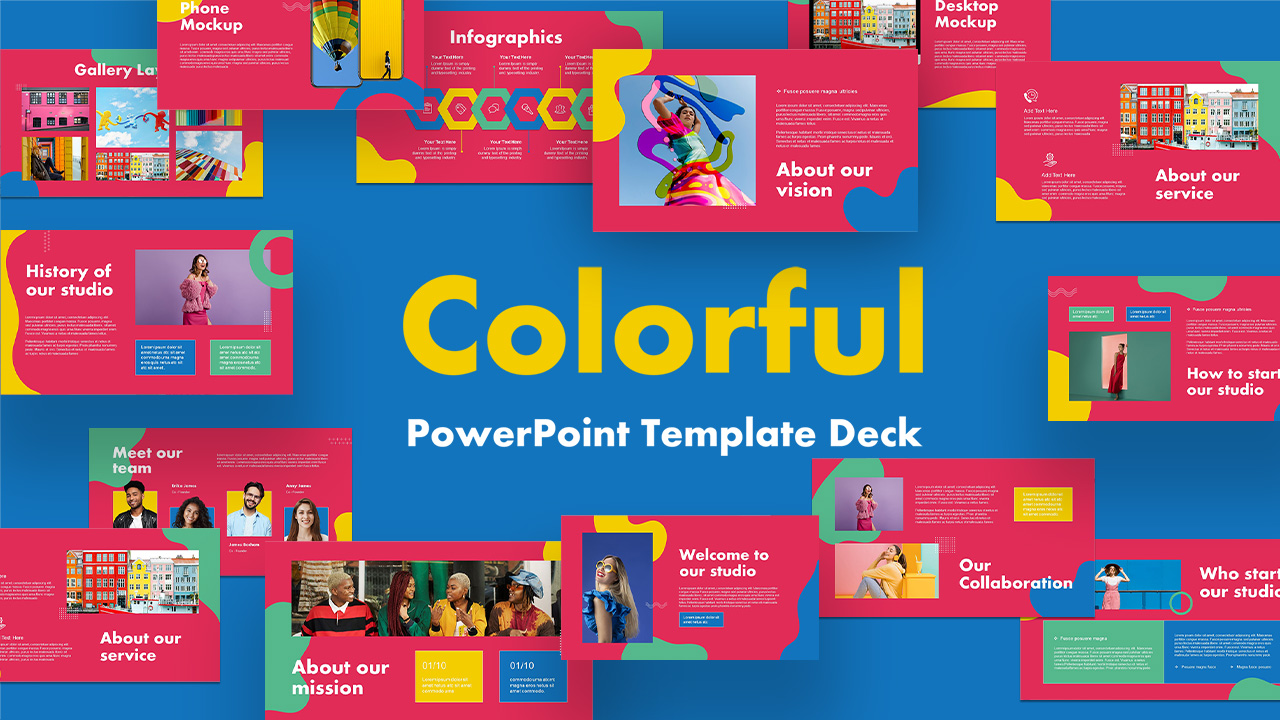
Colorful Creative Presentation Deck Template for PowerPoint & Google Slides
Company Profile
Creative Doodle Transportation Theme Template for PowerPoint & Google Slides
Pitch Deck
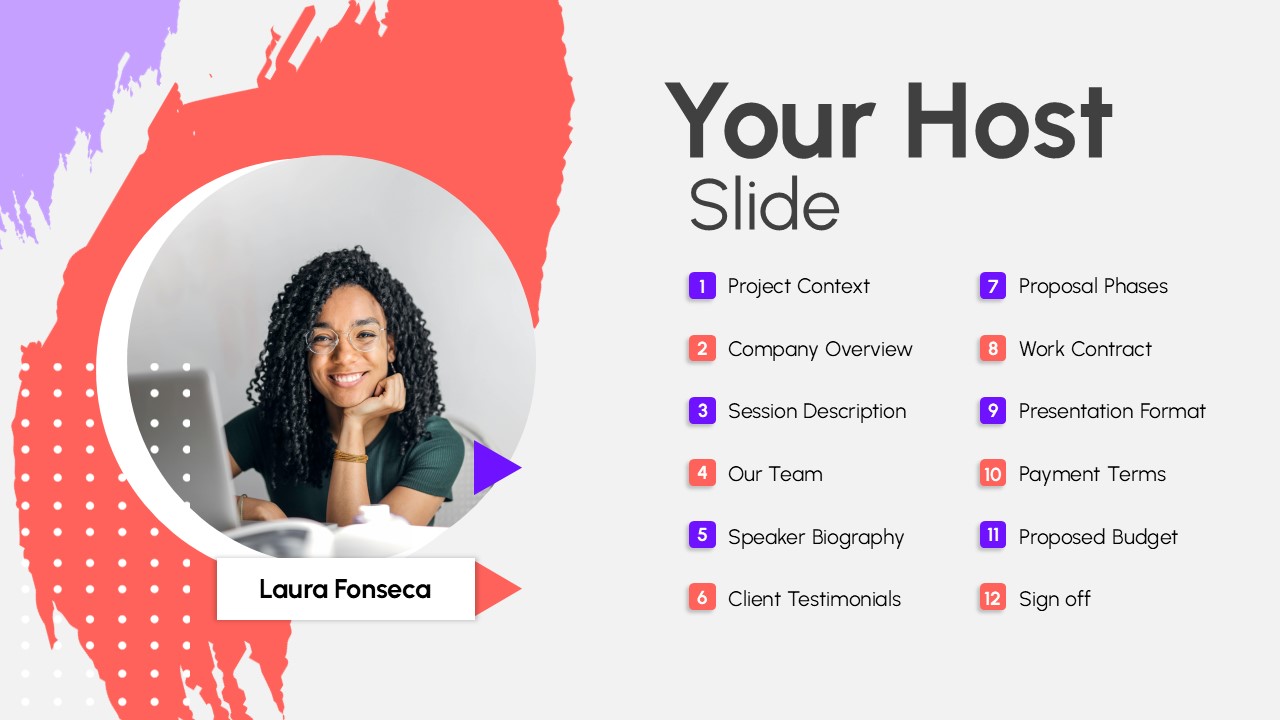
Creative Host Introduction Slide Template for PowerPoint & Google Slides
Our Team
Creative Clothing Line Presentation Template for PowerPoint & Google Slides
Pitch Deck
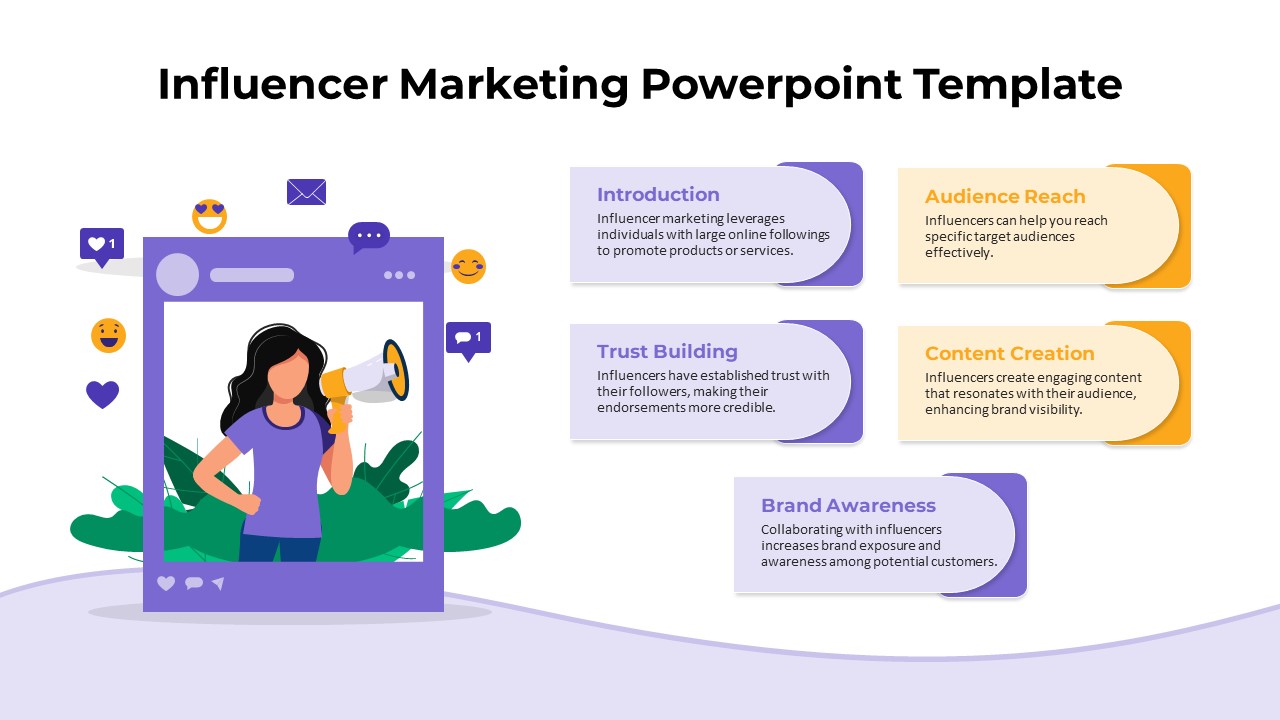
Creative Influencer Marketing Framework Template for PowerPoint & Google Slides
Digital Marketing
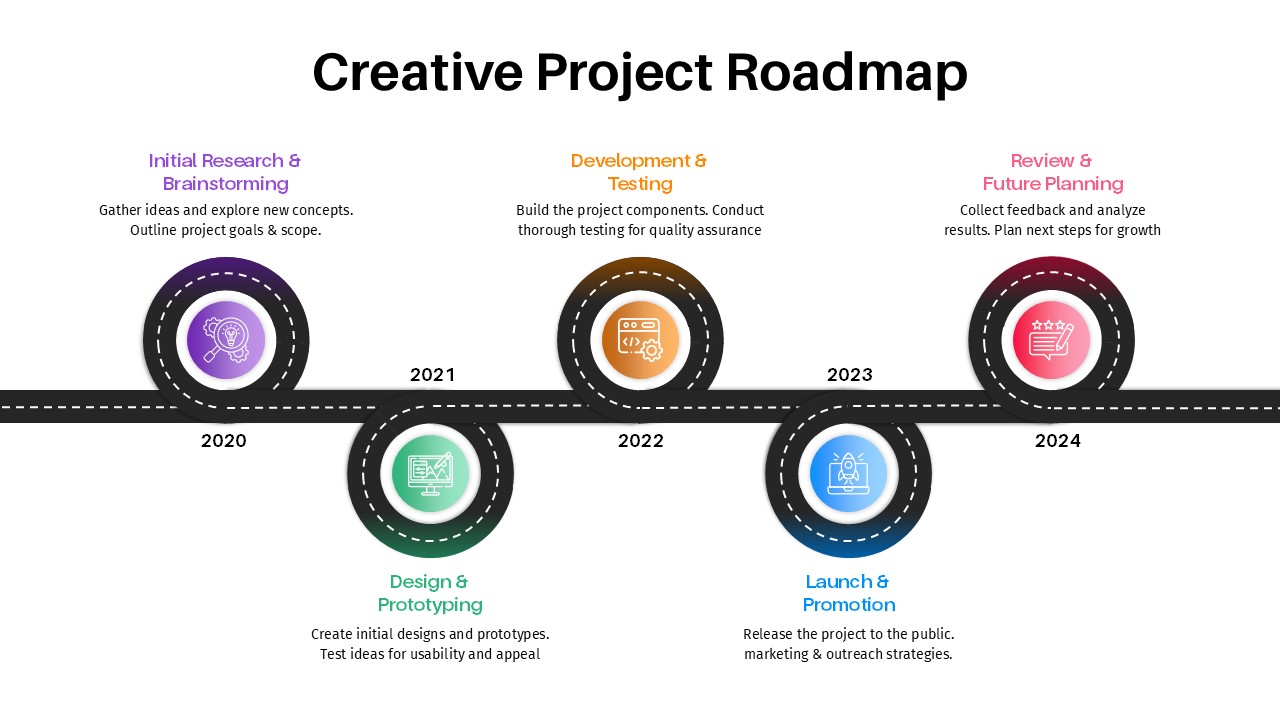
Creative Project Roadmap template for PowerPoint & Google Slides
Business
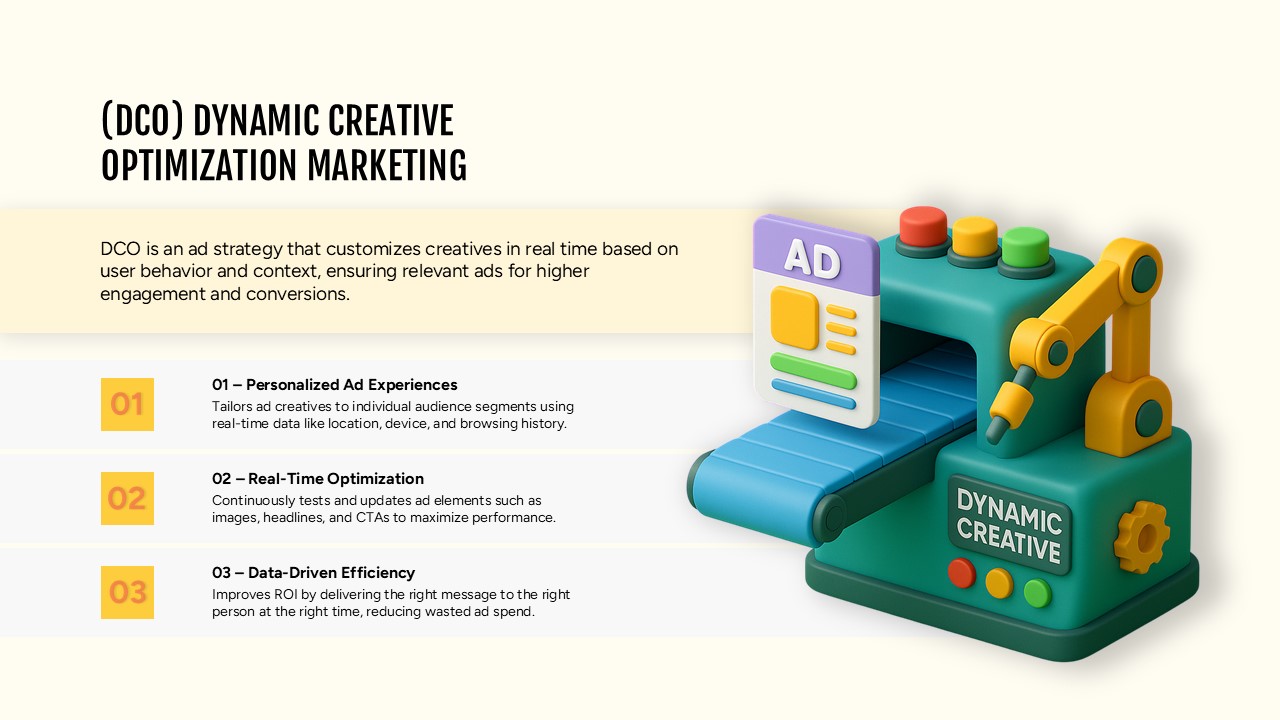
Dynamic Creative Optimization Marketing Template for PowerPoint & Google Slides
Digital Marketing
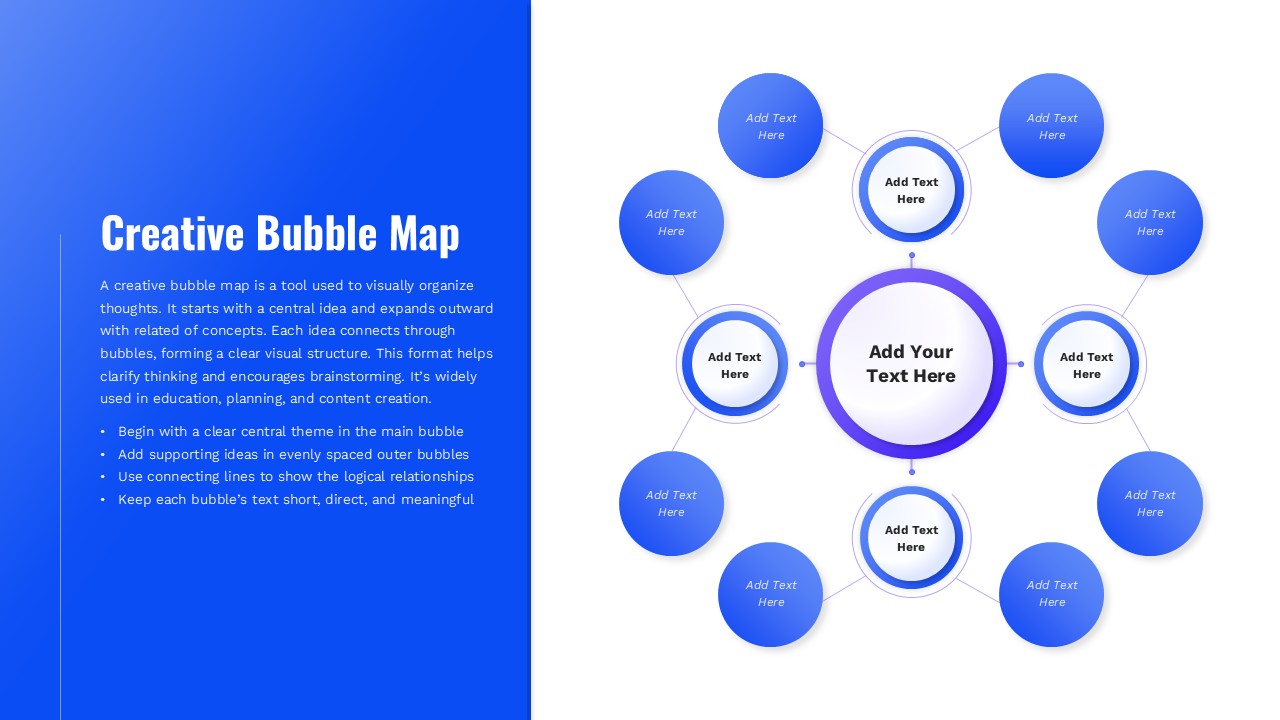
Creative Bubble Mind Map Template for PowerPoint & Google Slides
Mind Maps
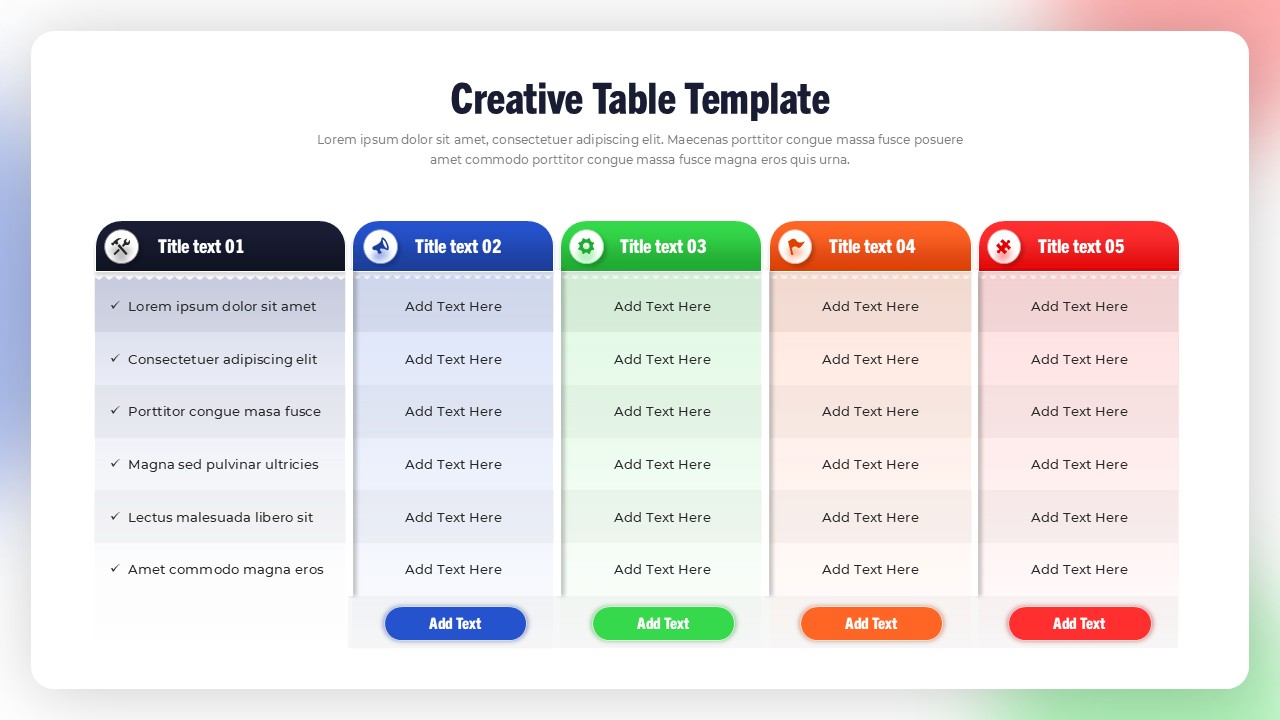
Creative Table Template for PowerPoint & Google Slides
Table
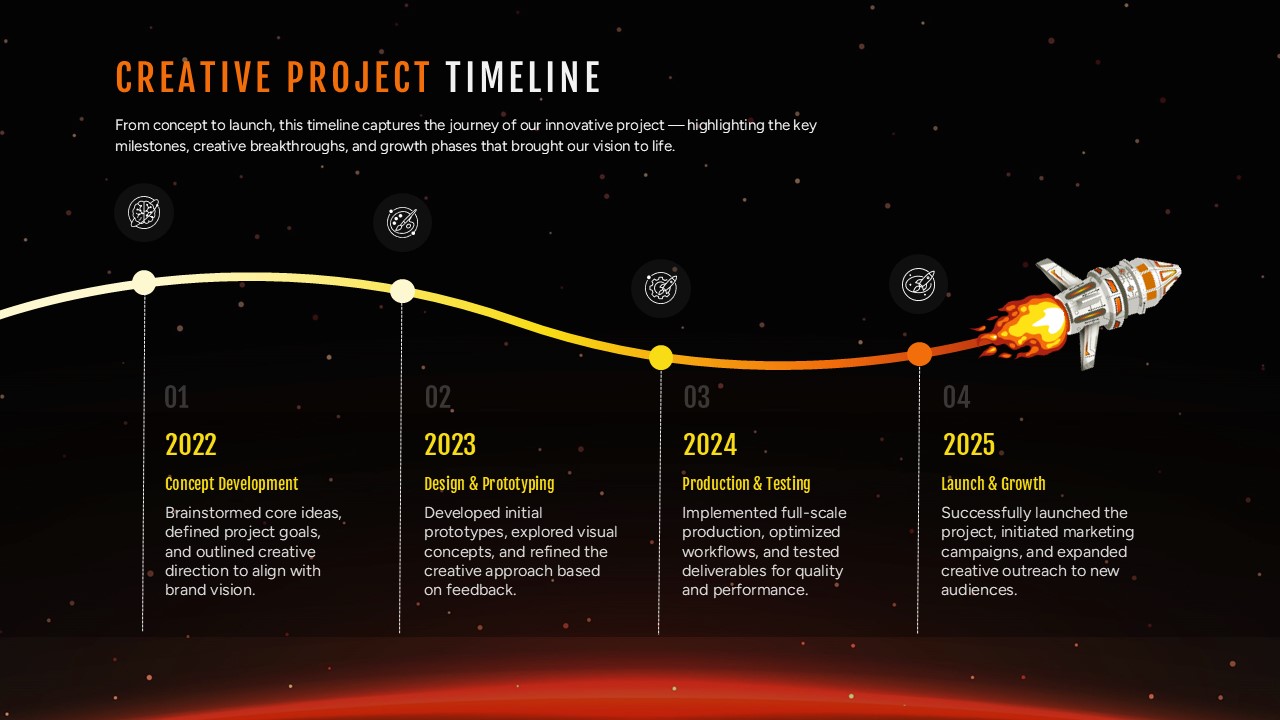
Creative Project Timeline Roadmap Template for PowerPoint & Google Slides
Timeline