Free Creative Hemisphere Infographics template for PowerPoint & Google Slides
Infographics Hemisphere Free PowerPoint Template
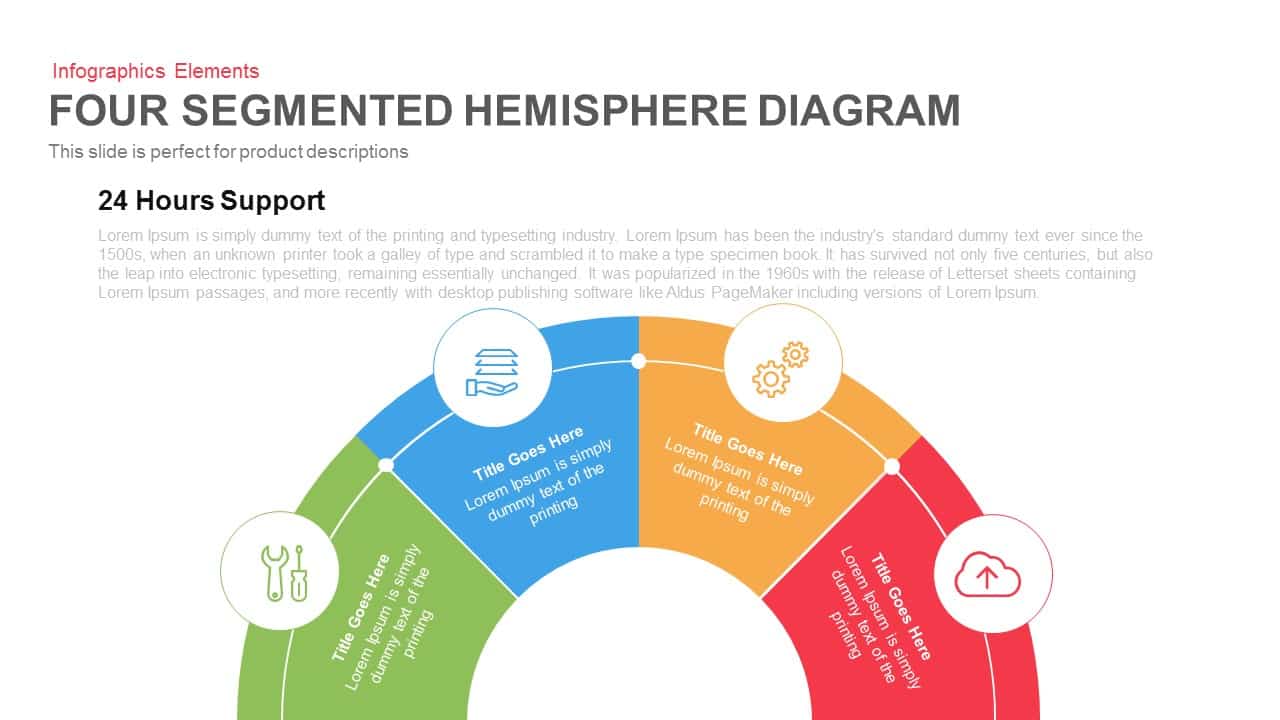
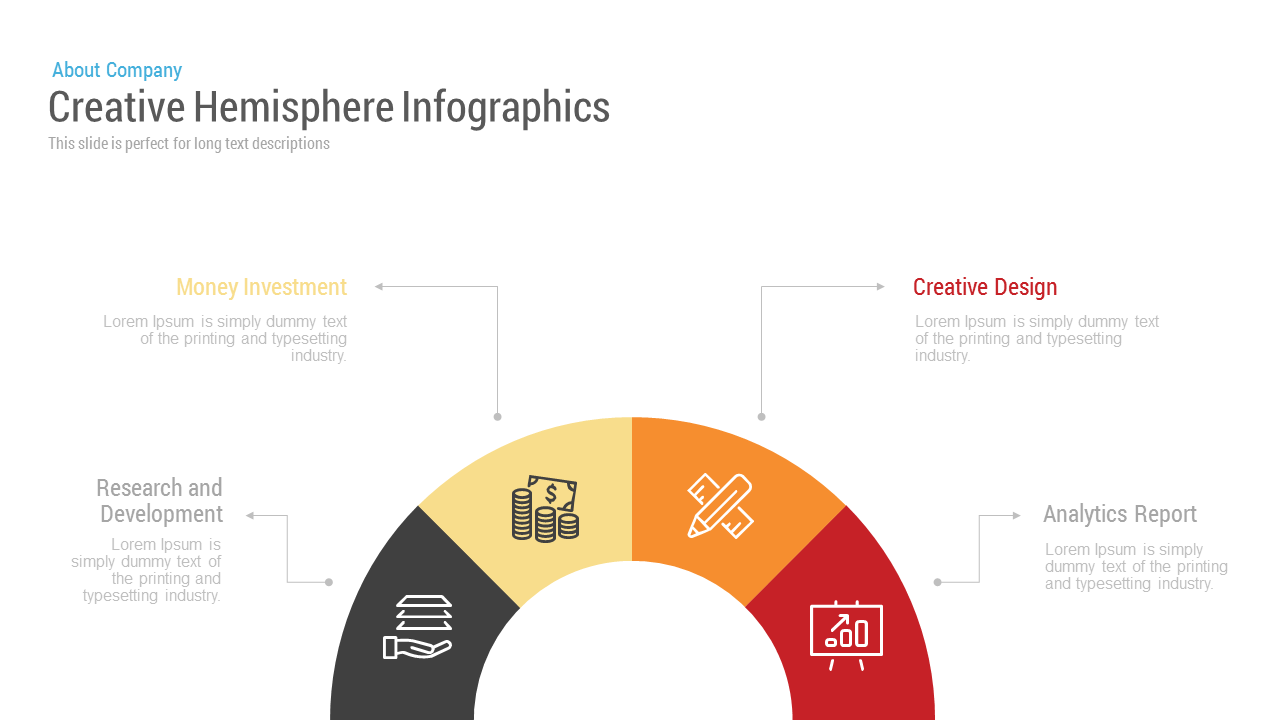
Creative infographics hemisphere PowerPoint template and Keynote template is used to show how the services which is having four segments with icons you can change the colour of the template in just a click. Use the slide and rock your audience. Download the free Google Slide themes version of this template.
The flat vector design of creative infographics hemisphere PowerPoint templates can be used to present any content which has a professional value. Business plans, strategy, financial reports, agenda, objectives, business process and any data or information may pass through this minimal layout. To lessen the objects and junk of concepts enable the audiences to give more focus to the content. This makes the presentation more effective in providing maximum information while showing the audience an overview of the concept if they wish to look. New business ideas and the way to success can be illustrated.
Infographics Hemisphere PowerPoint Templates and Keynote template will keep the presentation simple and fresh. Hemisphere contains four segments, each segment carrying meaningful PowerPoint clipart icons, which represents some area of knowledge and practice. Hemisphere design is in the bottom of the slide, so the style allows enough place for the text descriptions and provide a smart look to the presentation theme. The color combination of each segments enable the viewer to extract presentation content with relaxed convenience. User can utilize these PowerPoint icons in a representative manner. For example, hand with books symbolizes the amount of knowledge and exploration required to start a project or a new business venture. Each and every business need extensive enquiry about the market, availability of raw materials, nearest competitor, history and nature of the business, revenue requirements, peoples attitude towards the particular product, fast and slow moving territories and so on. Hence, startups required better research and development. Similarly, presenter can give meaning to other icons include; money, pencil and bar chart. Creative Infographics Hemisphere PowerPoint Templates is fully customizable, user can add more segments, delete or move icons change and alter the color codes and text zones are common features of PowerPoint. Users can utilize this diagram to show product descriptions and quality of a particular service. We have further semi circles diagrams that can download instantly from slidebazaar.com.
Download more free PowerPoint templates here
Login to download this file

Item ID
SBF00007
Related Templates

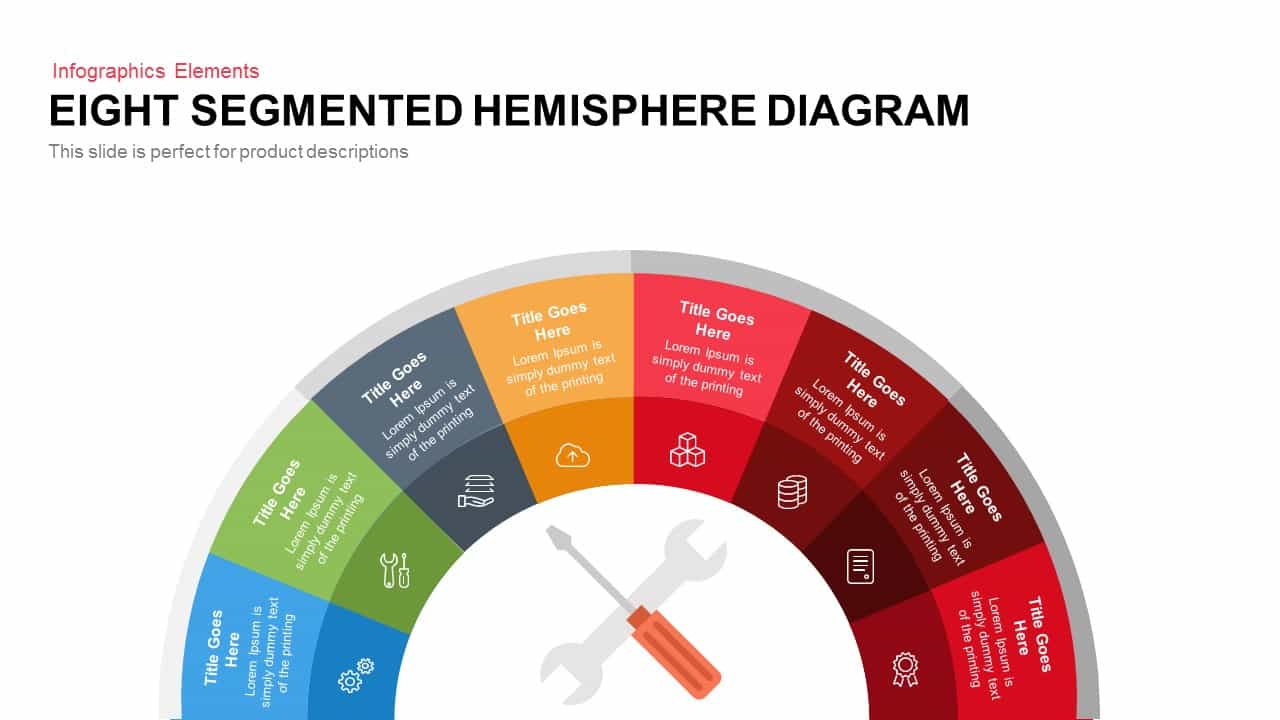
Eight Segmented Hemisphere Diagram Template for PowerPoint & Google Slides
Process
Four Segmented Hemisphere Diagram Template for PowerPoint & Google Slides
Process
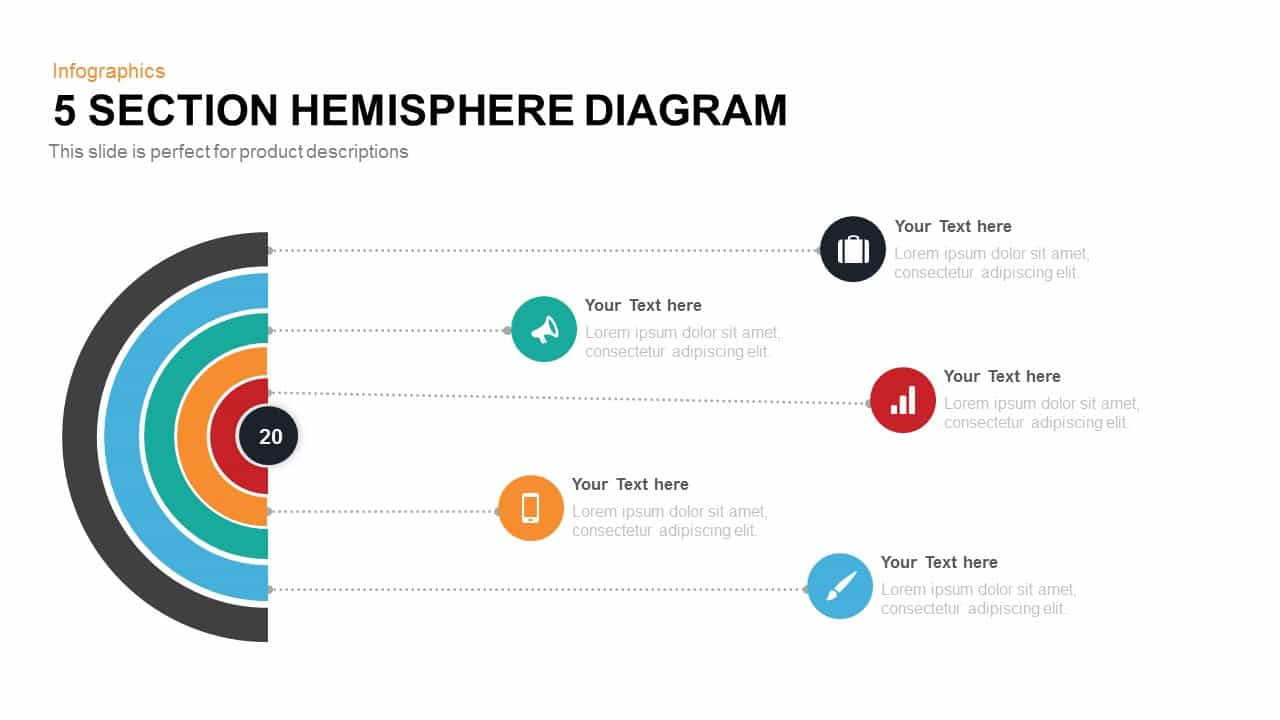
Hemisphere Diagram template for PowerPoint & Google Slides
Infographics
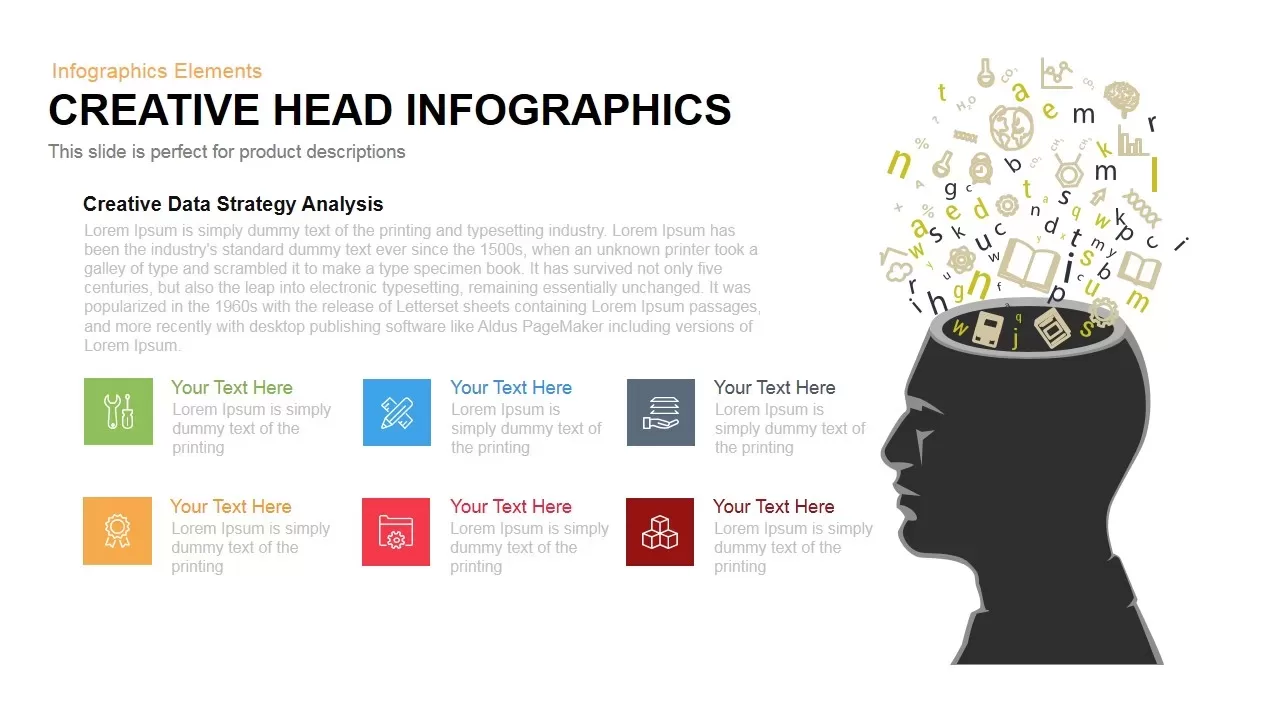
Dynamic Creative Head Infographics Template for PowerPoint & Google Slides
Circular

Creative Cycle Process Infographics Template for PowerPoint & Google Slides
Process
Versatile Creative Diagram Infographics Template for PowerPoint & Google Slides
Process
Free Eight Circle Creative Diagram template for PowerPoint & Google Slides
Circular
Free

PIXELS – Free Creative Presentation Template for PowerPoint & Google Slides
Pitch Deck
Free
Free Helooo Creative Company Profile Template for PowerPoint & Google Slides
Company Profile
Free
Free Helios Creative Business Deck for PowerPoint & Google Slides
Business
Free
Creative Section Divider Slides Template for PowerPoint & Google Slides
Decks

Inspire Multipurpose Creative Deck PowerPoint Template for PowerPoint & Google Slides
Pitch Deck
Creative Studio PowerPoint Template for PowerPoint & Google Slides
Decks
Circle Strategy Creative Chart template for PowerPoint & Google Slides
Business Strategy
Creative Business Strategy Template for PowerPoint & Google Slides
Business Strategy

Creative data chart analytics template for PowerPoint & Google Slides
Charts
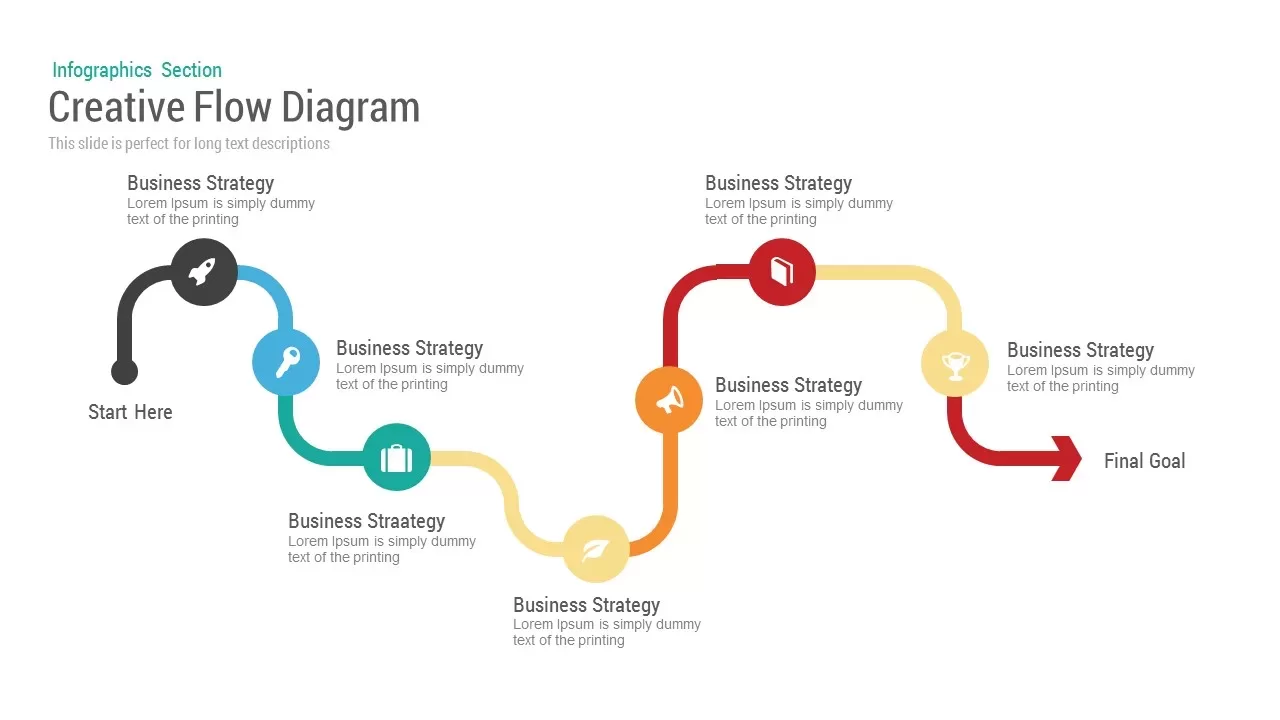
Creative flow diagram template for PowerPoint & Google Slides
Process
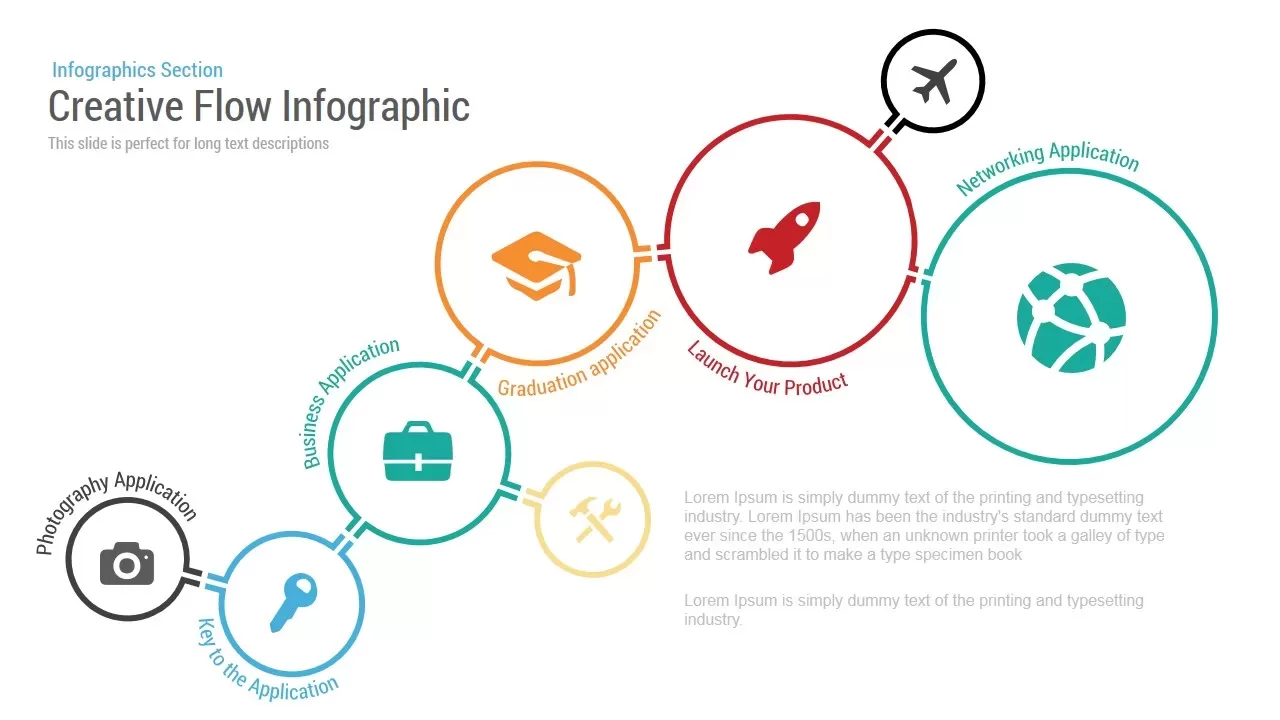
Creative Flow Infographic template for PowerPoint & Google Slides
Process
Creative Data Analysis Bar Chart template for PowerPoint & Google Slides
Bar/Column
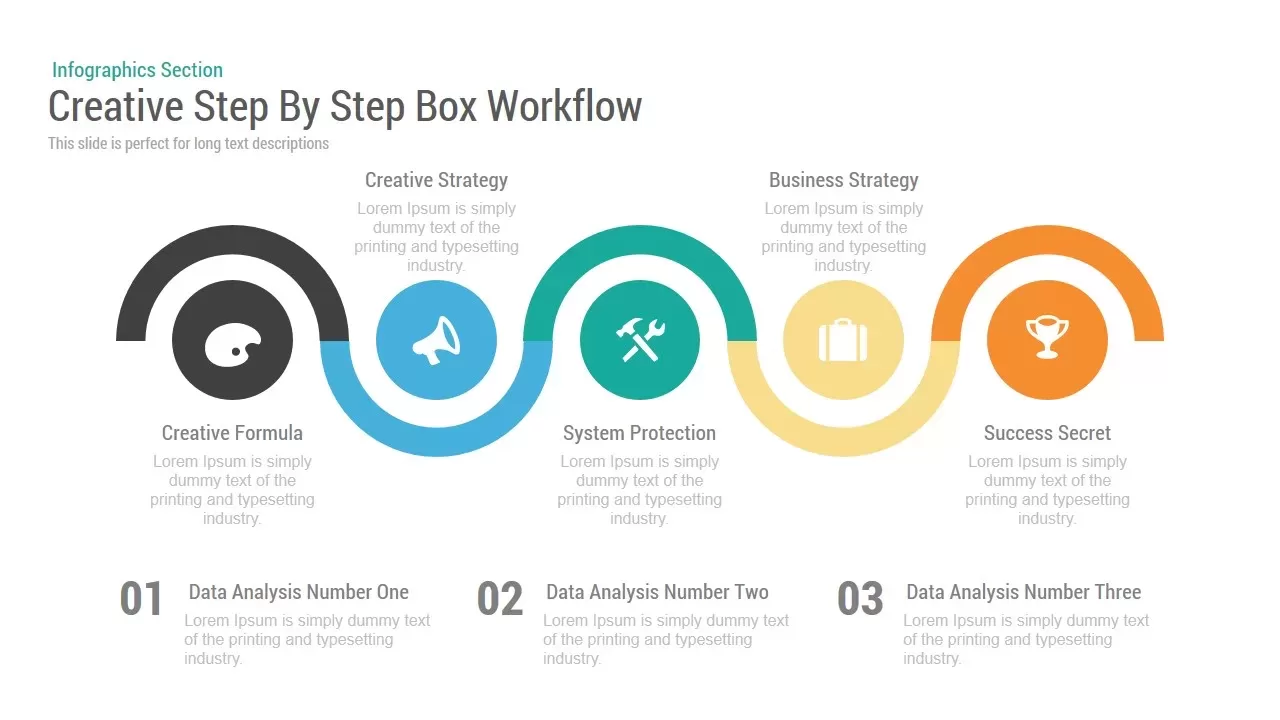
Creative Step By Step Workflow template for PowerPoint & Google Slides
Process
Creative SWOT Chart template for PowerPoint & Google Slides
SWOT
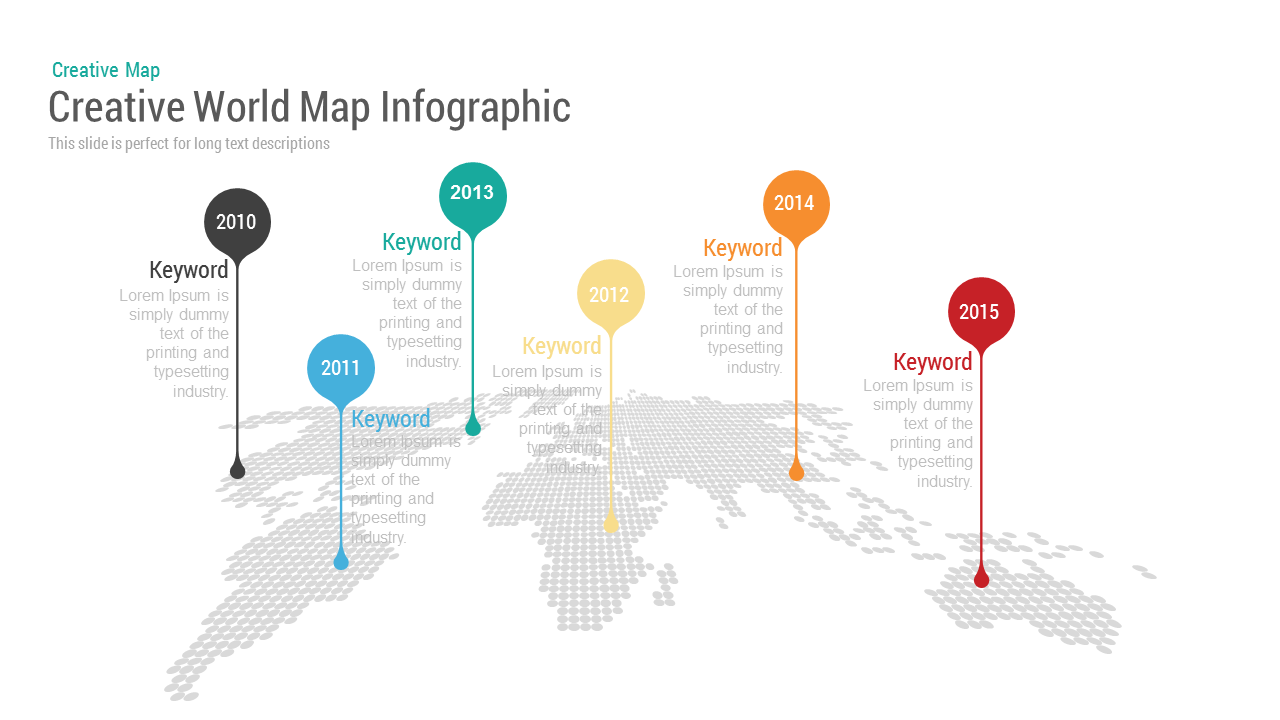
Creative World Map template for PowerPoint & Google Slides
World Maps
Creative Dynamic Gantt Chart Timeline Template for PowerPoint & Google Slides
Timeline
Creative Bar Chart template for PowerPoint & Google Slides
Charts
Creative Timeline template for PowerPoint & Google Slides
Timeline
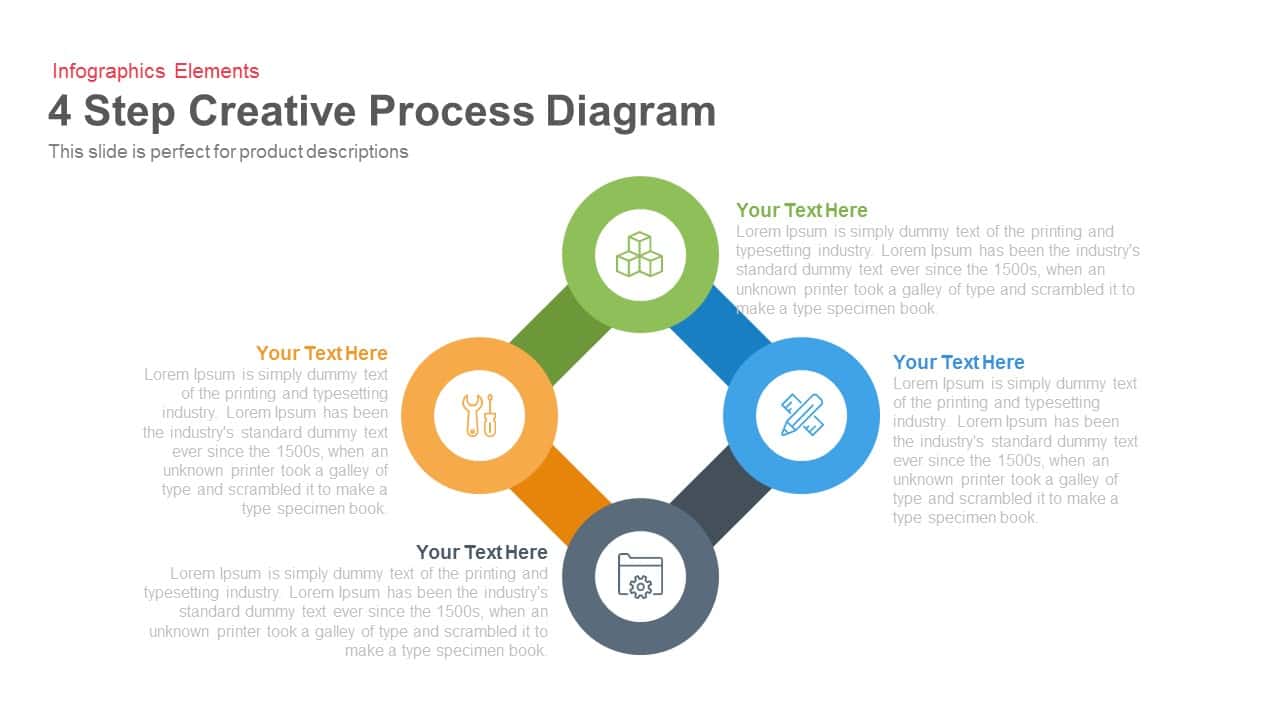
4 Step Creative Process Diagram Template for PowerPoint & Google Slides
Infographics
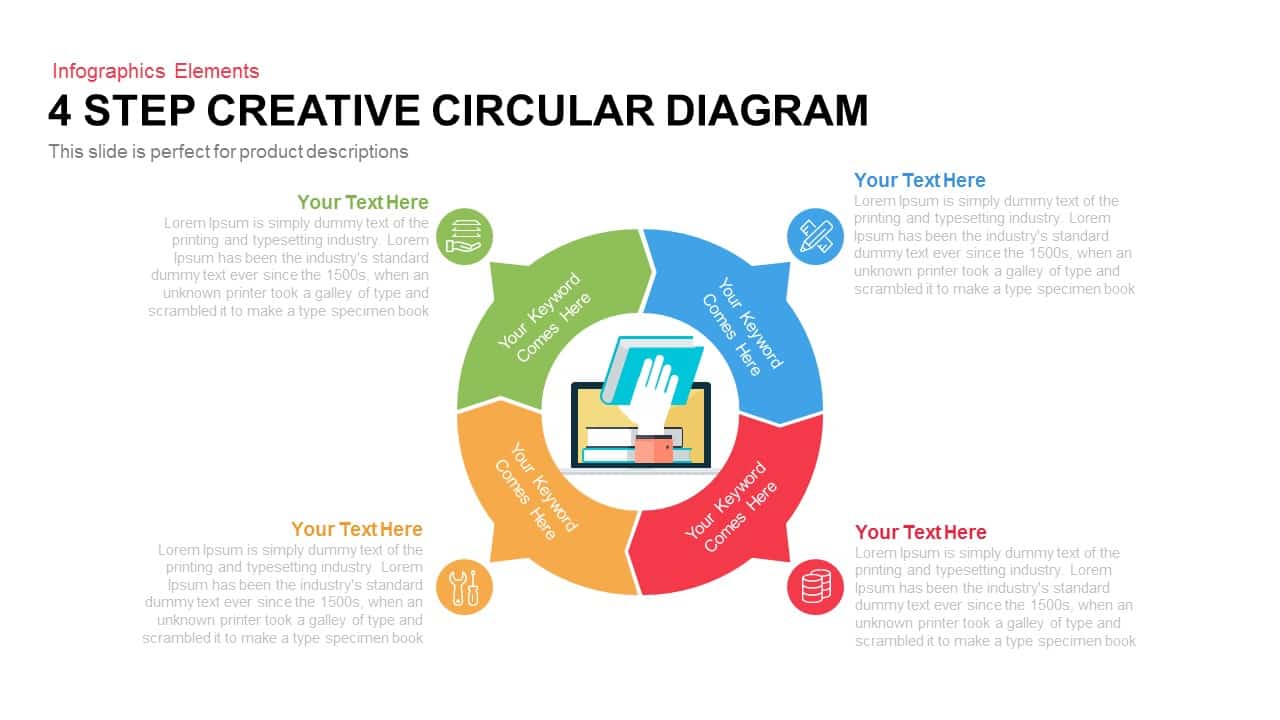
4 Step Creative Circular Diagram Template for PowerPoint & Google Slides
Infographics
Six Step Creative Circular Diagram Template for PowerPoint & Google Slides
Circular
Animated Creative Timeline template for PowerPoint & Google Slides
Timeline
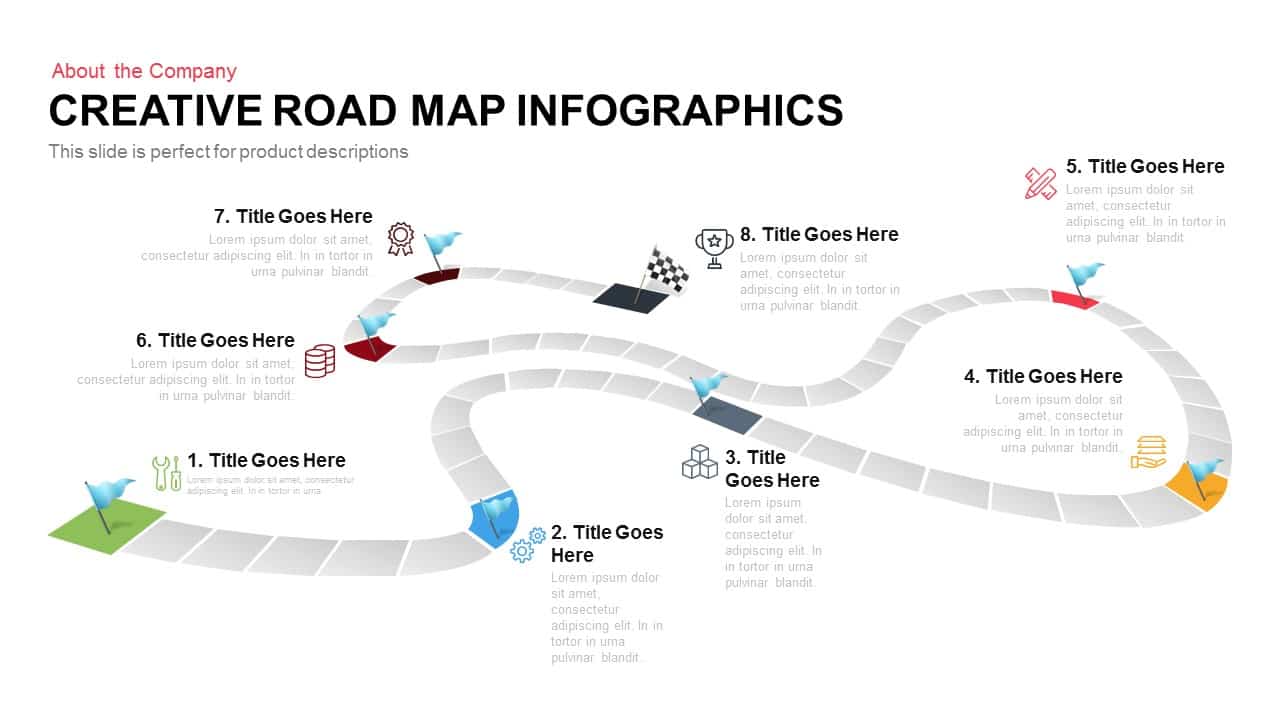
Creative Roadmap template for PowerPoint & Google Slides
Infographics
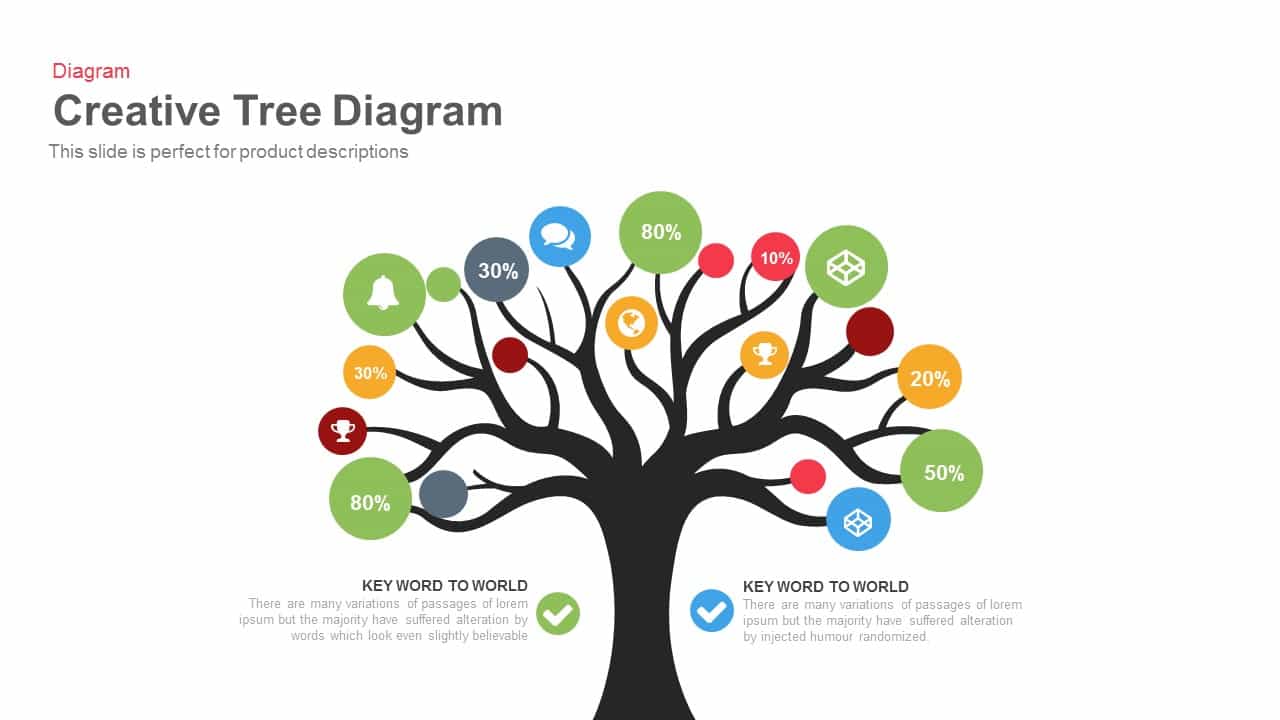
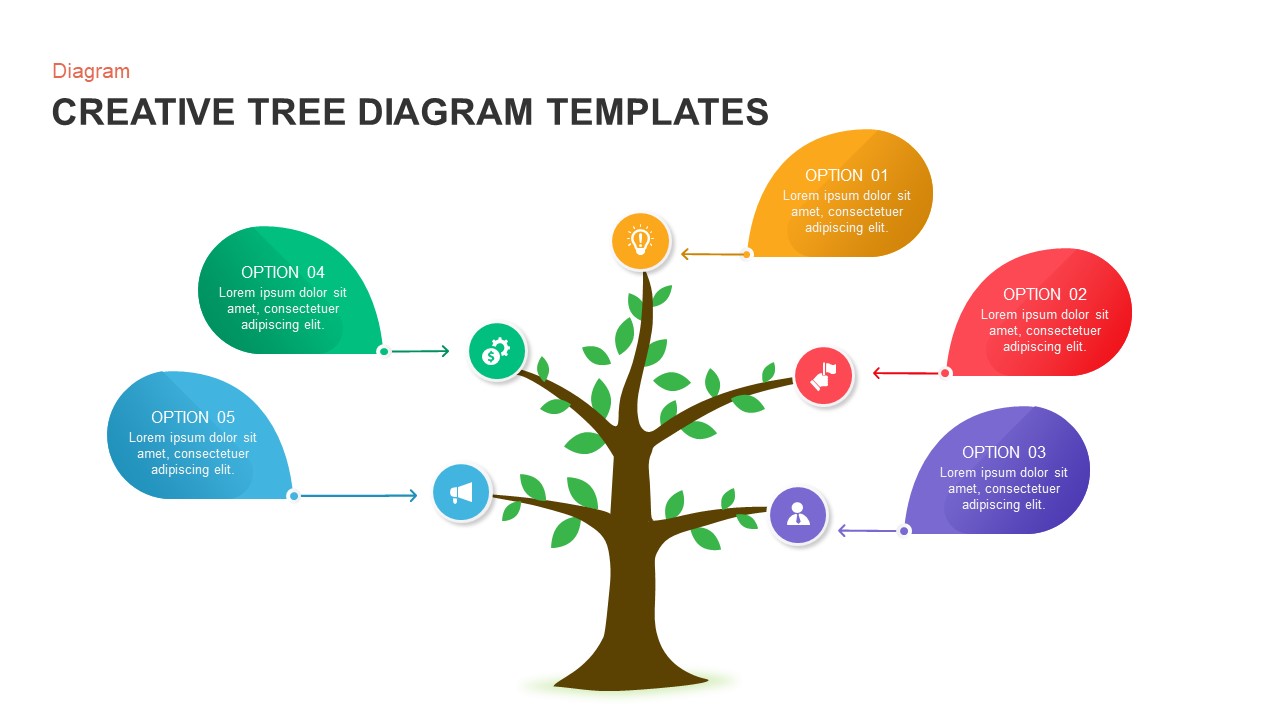
Engaging Creative Tree Diagram Slide Template for PowerPoint & Google Slides
Flow Charts
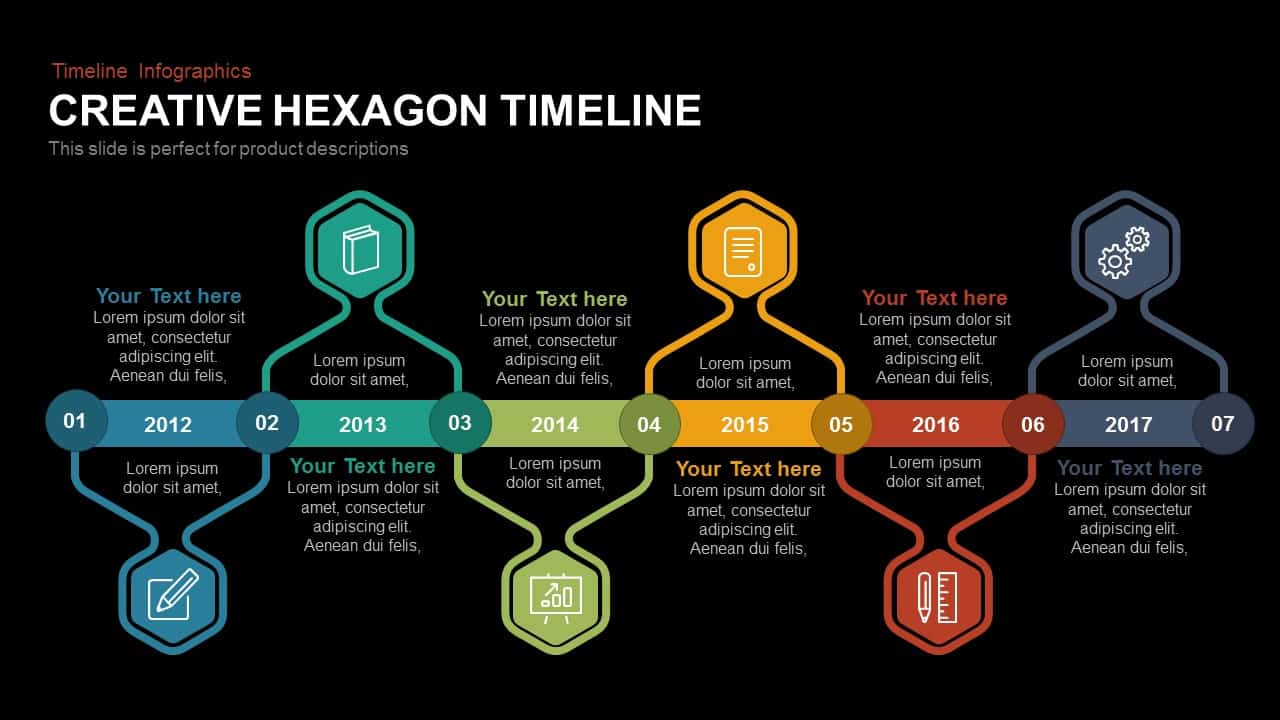
Annual Creative Hexagon Timeline Diagram Template for PowerPoint & Google Slides
Timeline
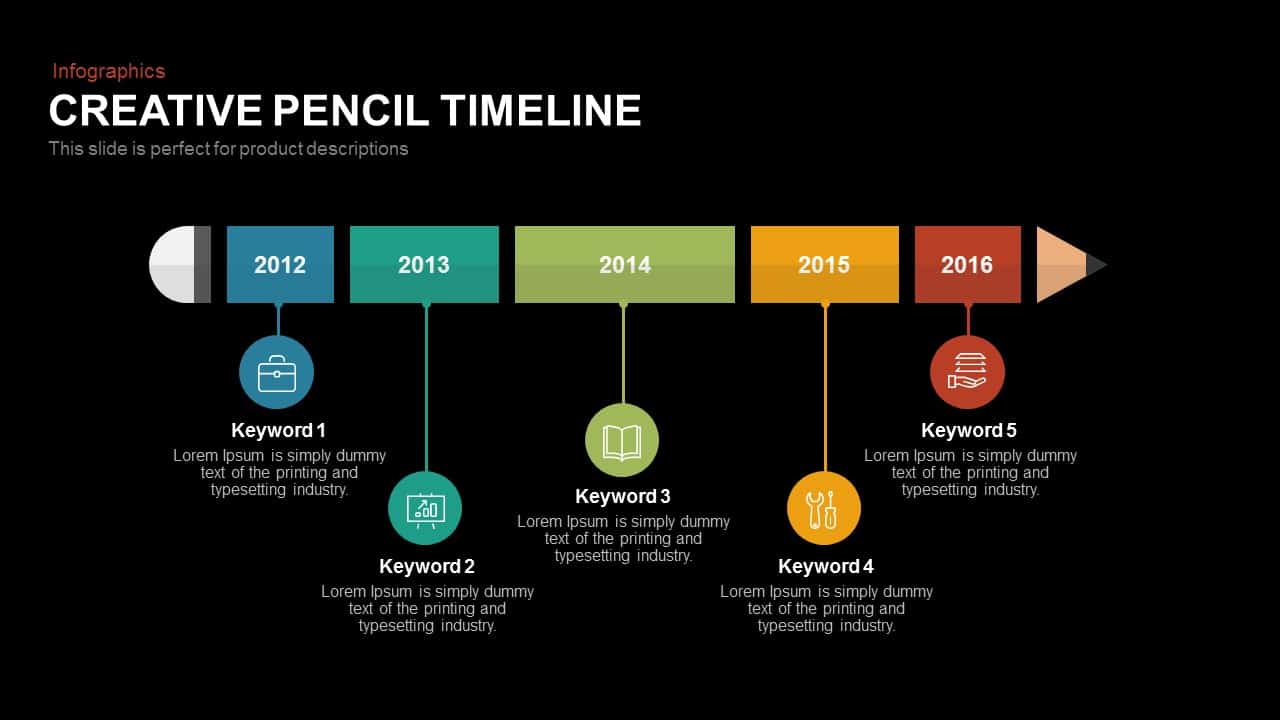
Creative Pencil Timeline Infographic Template for PowerPoint & Google Slides
Timeline
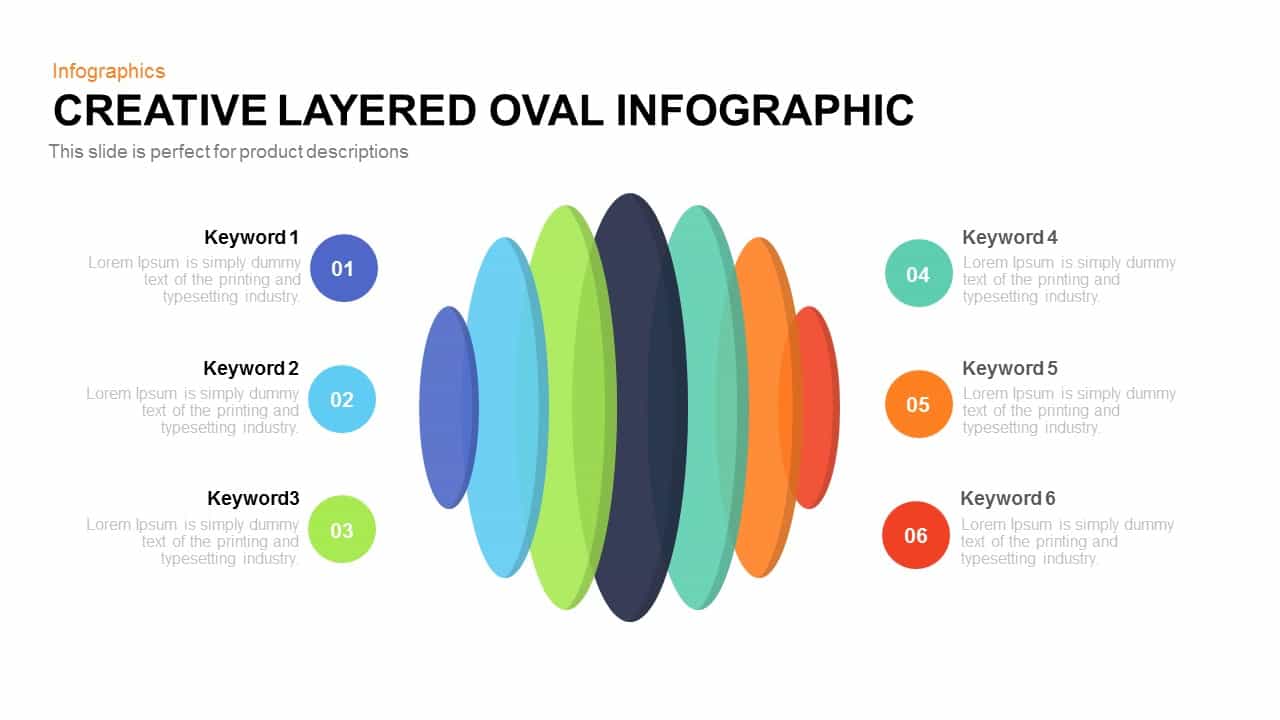
Creative Layered Oval Infographic Diagram Template for PowerPoint & Google Slides
Process
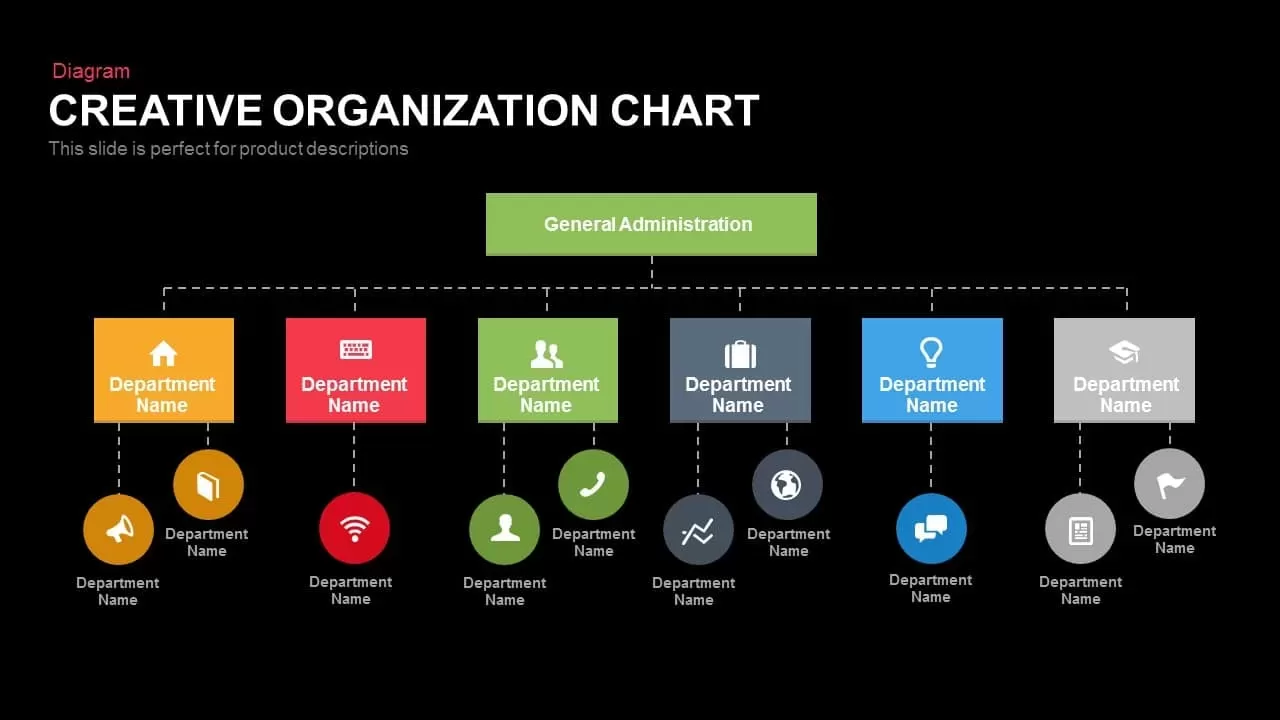
Creative Organization Chart Diagram Template for PowerPoint & Google Slides
Org Chart
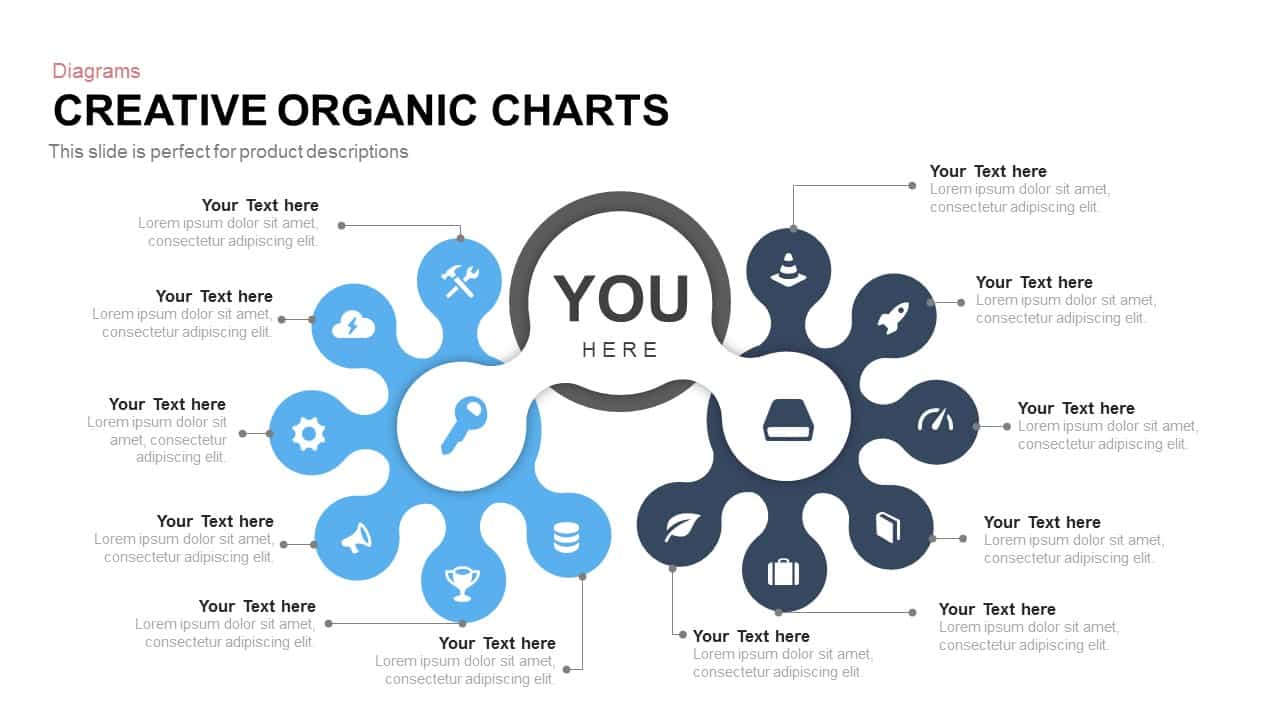
Creative Organic Hub-and-Spoke Diagram template for PowerPoint & Google Slides
Circular
Creative Lab Beakers Data Infographic template for PowerPoint & Google Slides
Infographics
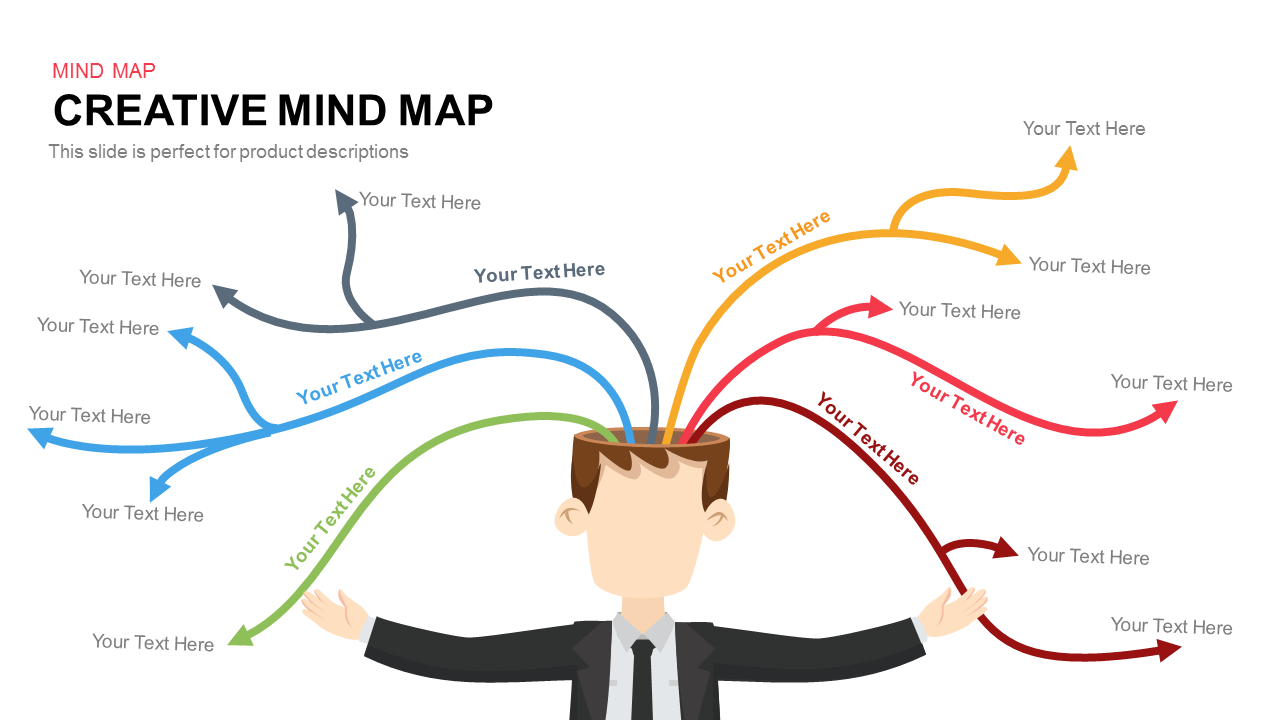
Colorful Creative Mind Map Diagram template for PowerPoint & Google Slides
Mind Maps

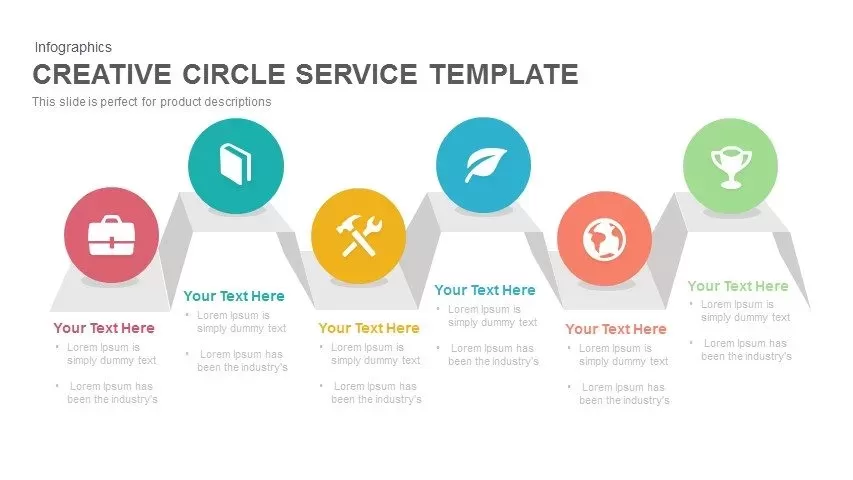
Creative Zigzag Circle Service Steps Template for PowerPoint & Google Slides
Process
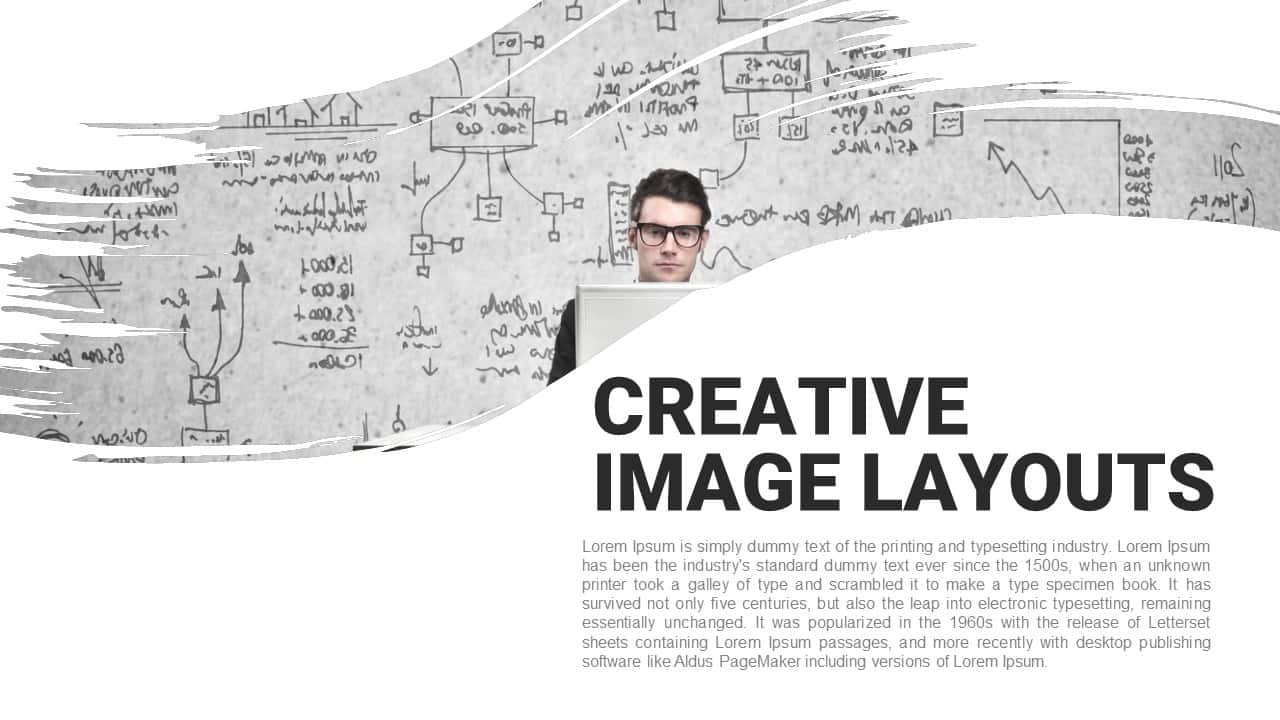
Creative Brush Stroke Image Layouts Template for PowerPoint & Google Slides
Decks
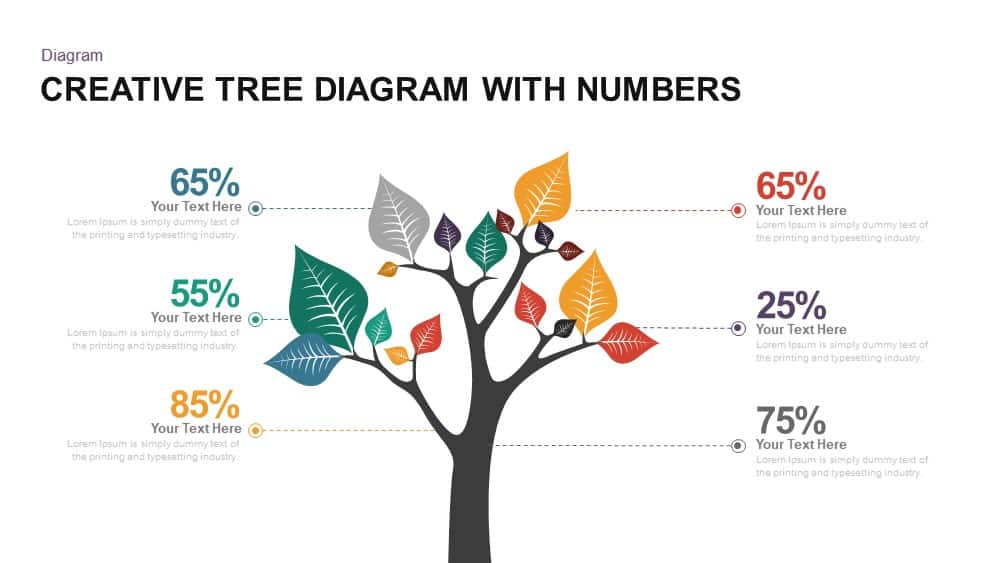
Creative Tree Diagram with Percentages Template for PowerPoint & Google Slides
Decision Tree
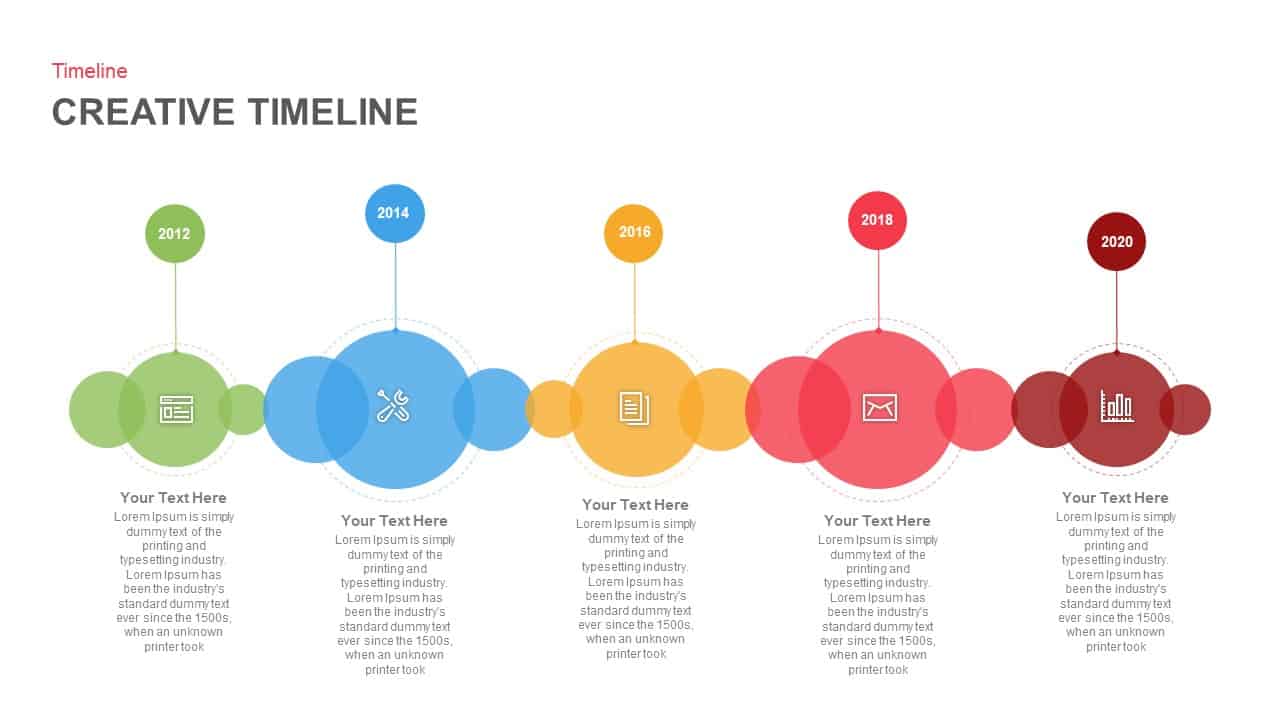
Creative Bubble Timeline Infographic Template for PowerPoint & Google Slides
Timeline
Creative Tree Infographic Diagram Template for PowerPoint & Google Slides
Infographics
Creative Three-Circle Venn Diagram Template for PowerPoint & Google Slides
Comparison
Creative Tree Diagram Infographic Template for PowerPoint & Google Slides
Decision Tree
Creative Mind Mapping Diagram with Icons Template for PowerPoint & Google Slides
Mind Maps
Creative Tree Diagram template for PowerPoint & Google Slides
Process
Creative Strategy Diagram Template for PowerPoint & Google Slides
Business Strategy
Creative Tree Diagram Infographic Template for PowerPoint & Google Slides
Decision Tree
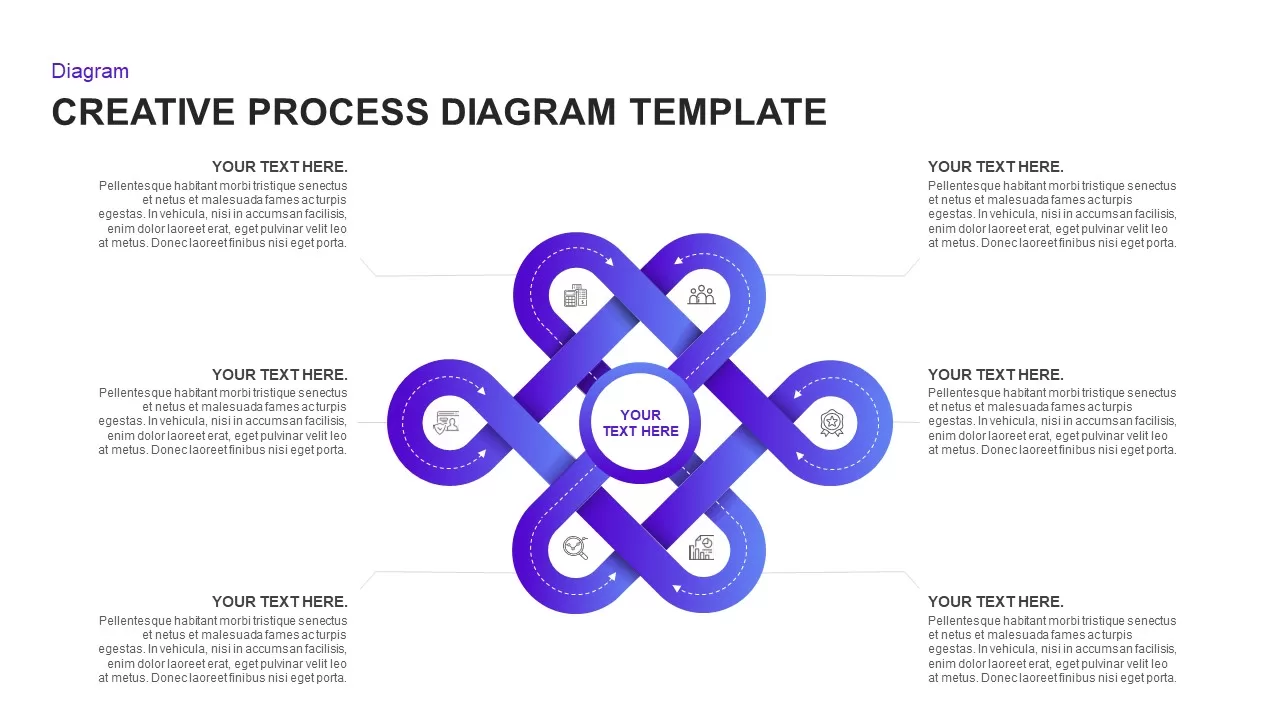
Creative Infinity Loop Process Diagram Template for PowerPoint & Google Slides
Process
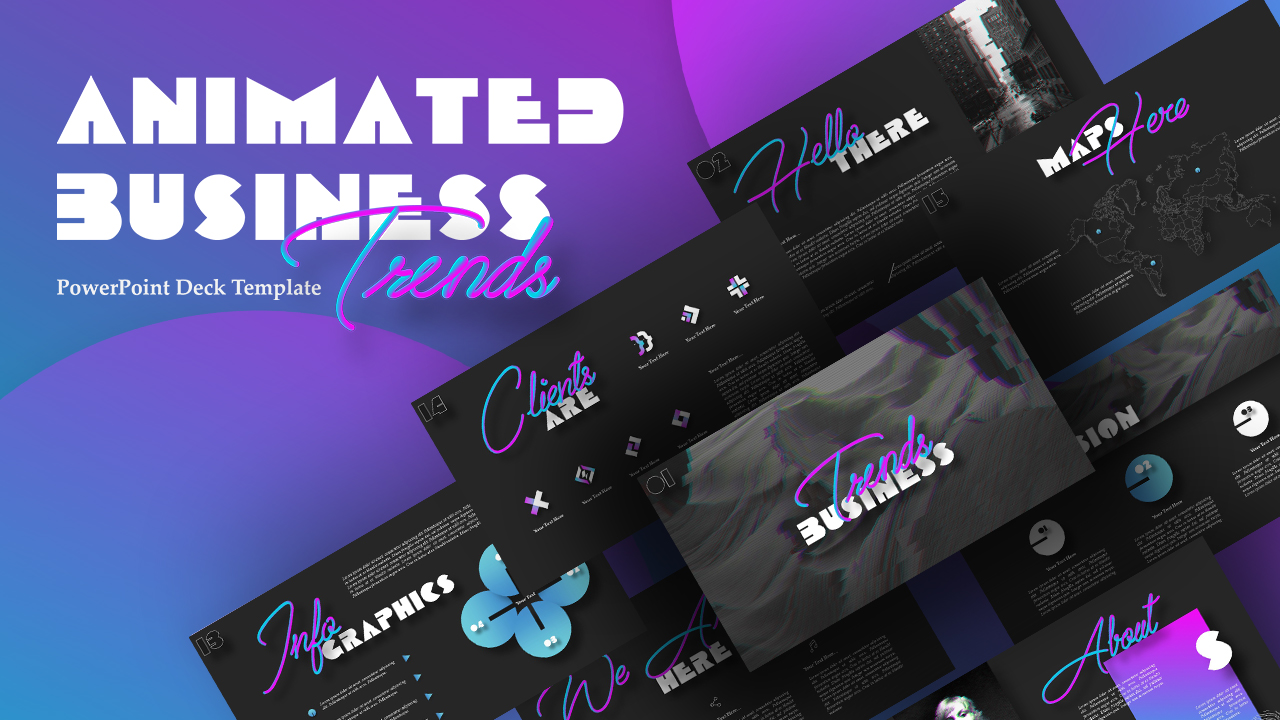
Animated Business Trends Creative Deck Template for PowerPoint & Google Slides
Pitch Deck
Creative Tips Slide Template for PowerPoint & Google Slides
Business
Creative Organizational Chart Template for PowerPoint & Google Slides
Org Chart
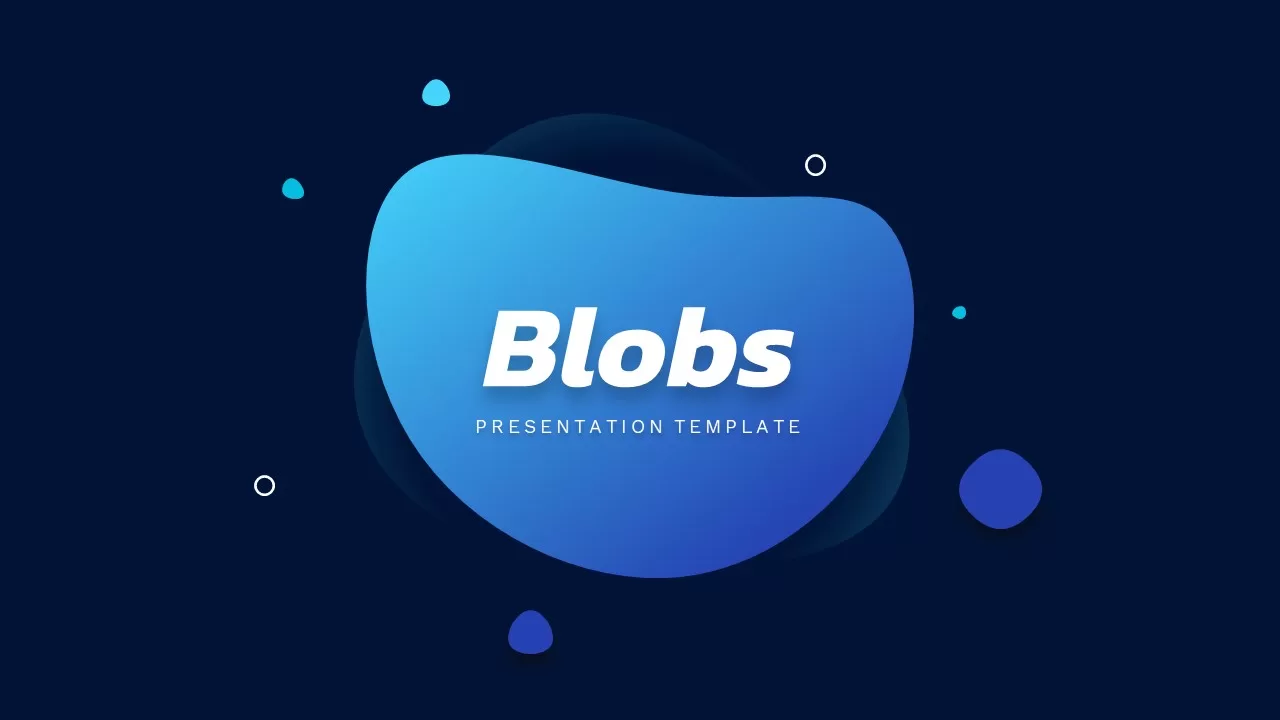
Creative Blue Blobs Abstract Title Slide Template for PowerPoint & Google Slides
Company Profile
Pop Art Creative Presentation Template for PowerPoint & Google Slides
Decks
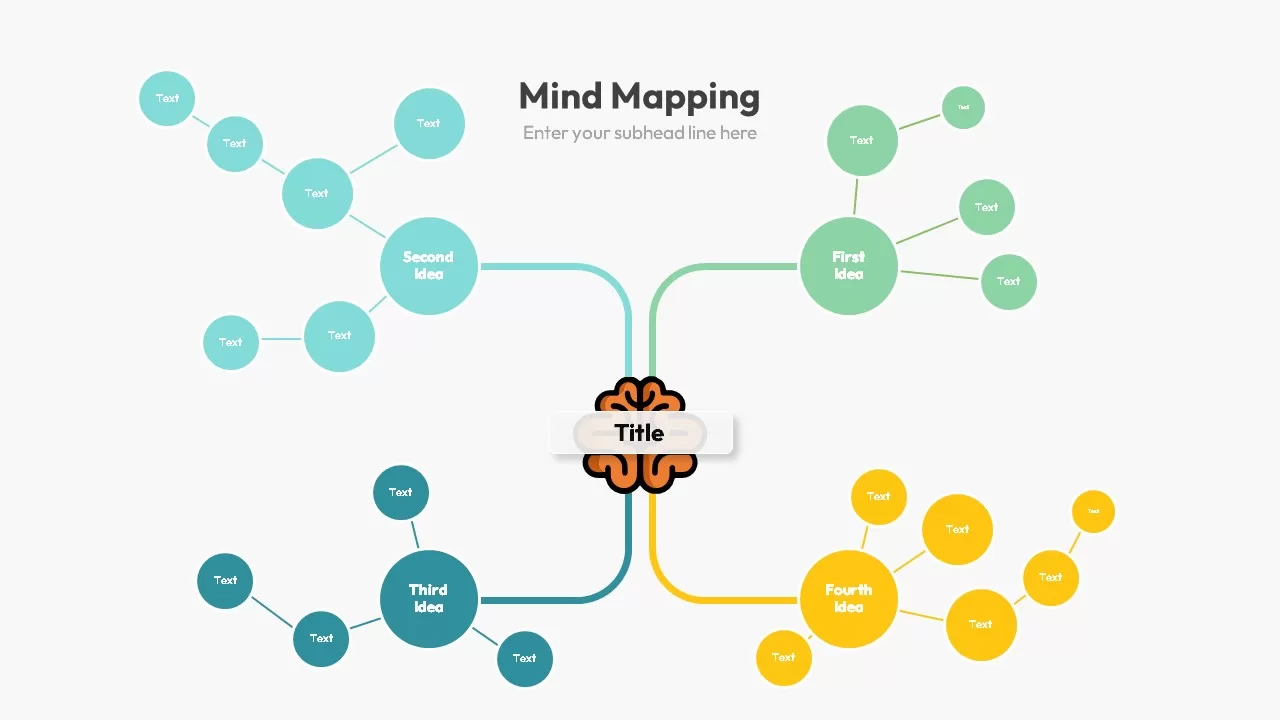
Creative Mind Mapping Template for PowerPoint & Google Slides
Mind Maps
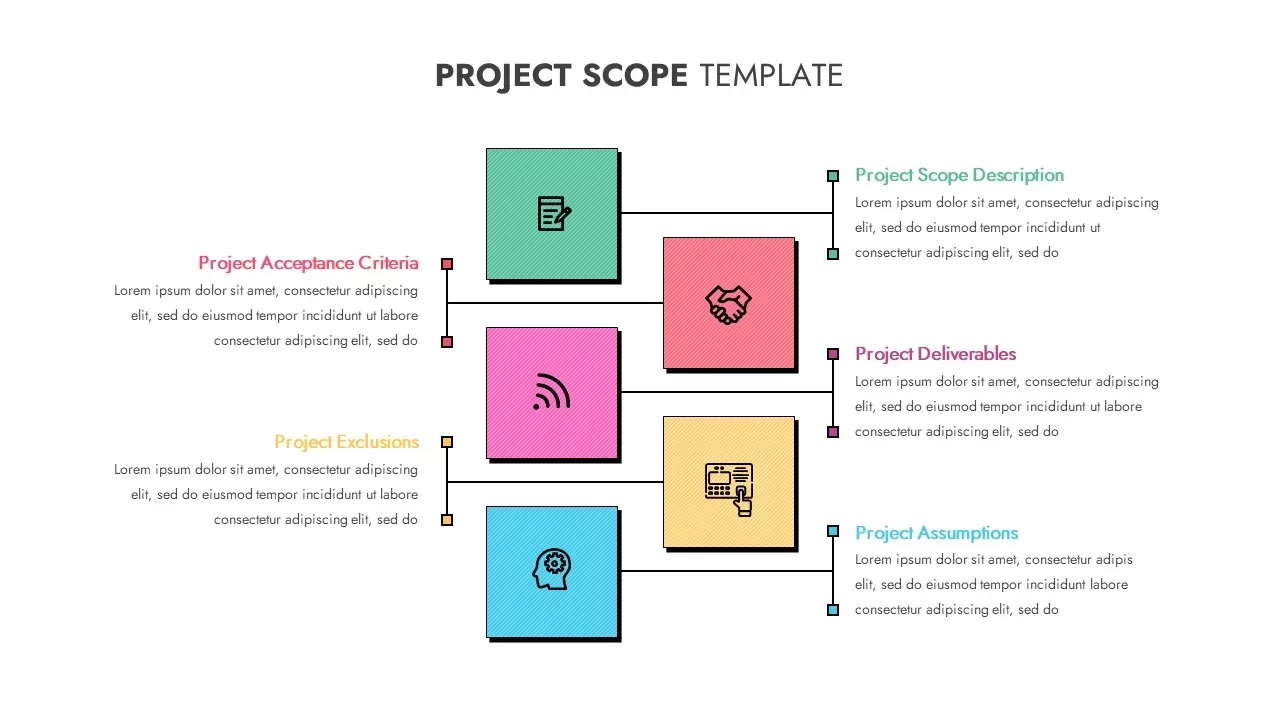
Creative Project Scope Template for PowerPoint & Google Slides
Project
Creative Polaroid Collage Photo Slide Template for PowerPoint & Google Slides
Graphics
Creative Photo Collage Grid Layout Template for PowerPoint & Google Slides
Graphics

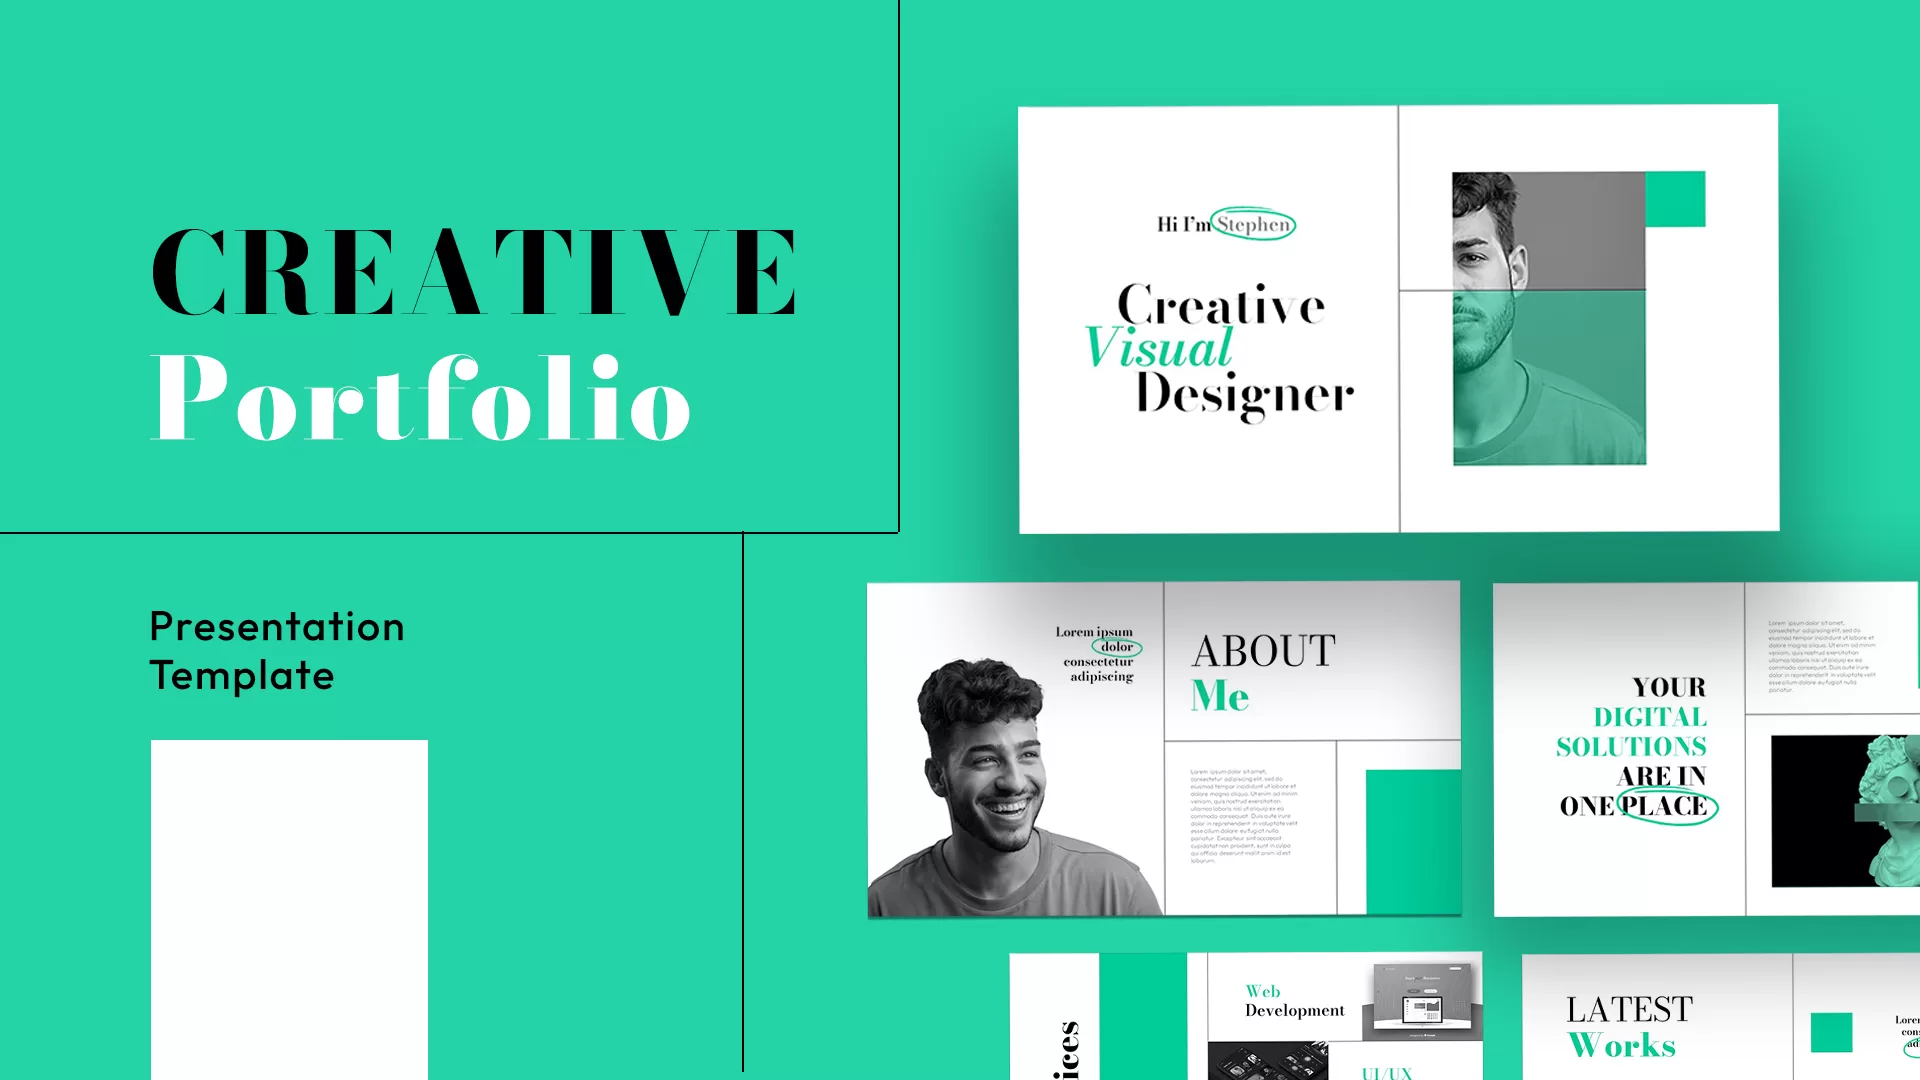
Creative Portfolio Showcase Presentation Template for PowerPoint & Google Slides
Decks
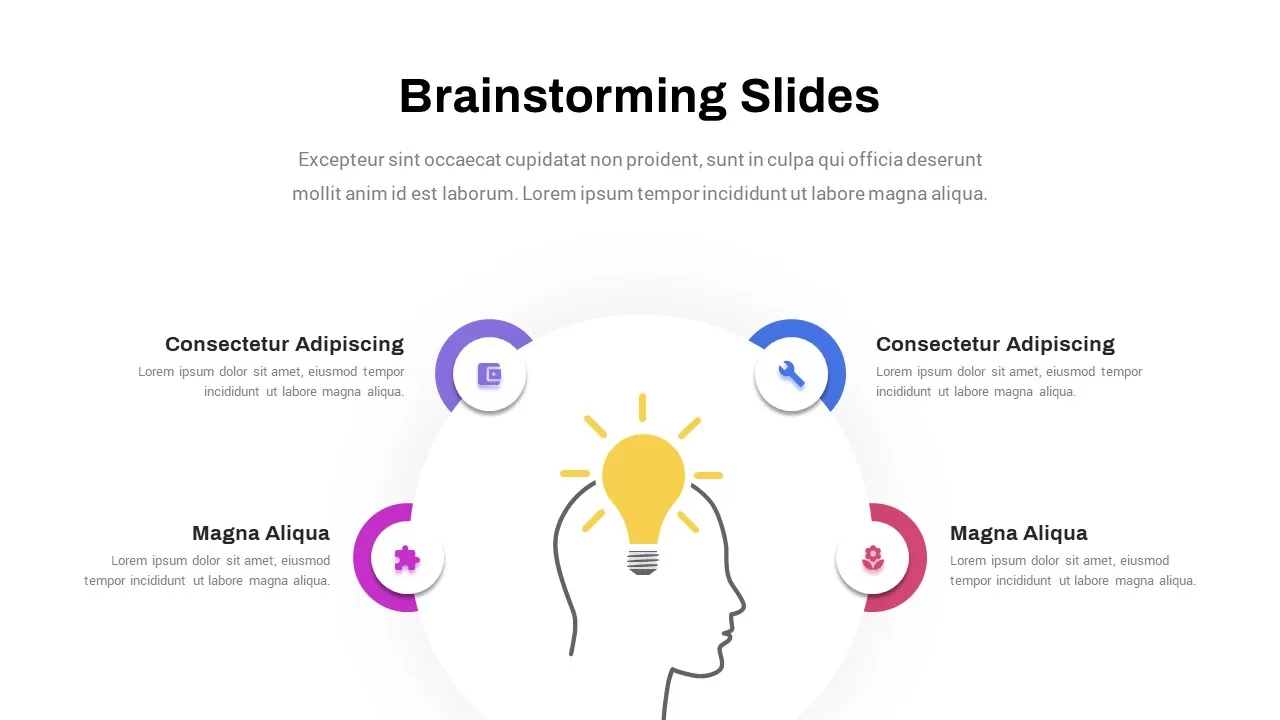
Creative Brainstorming Process Diagram Template for PowerPoint & Google Slides
Process
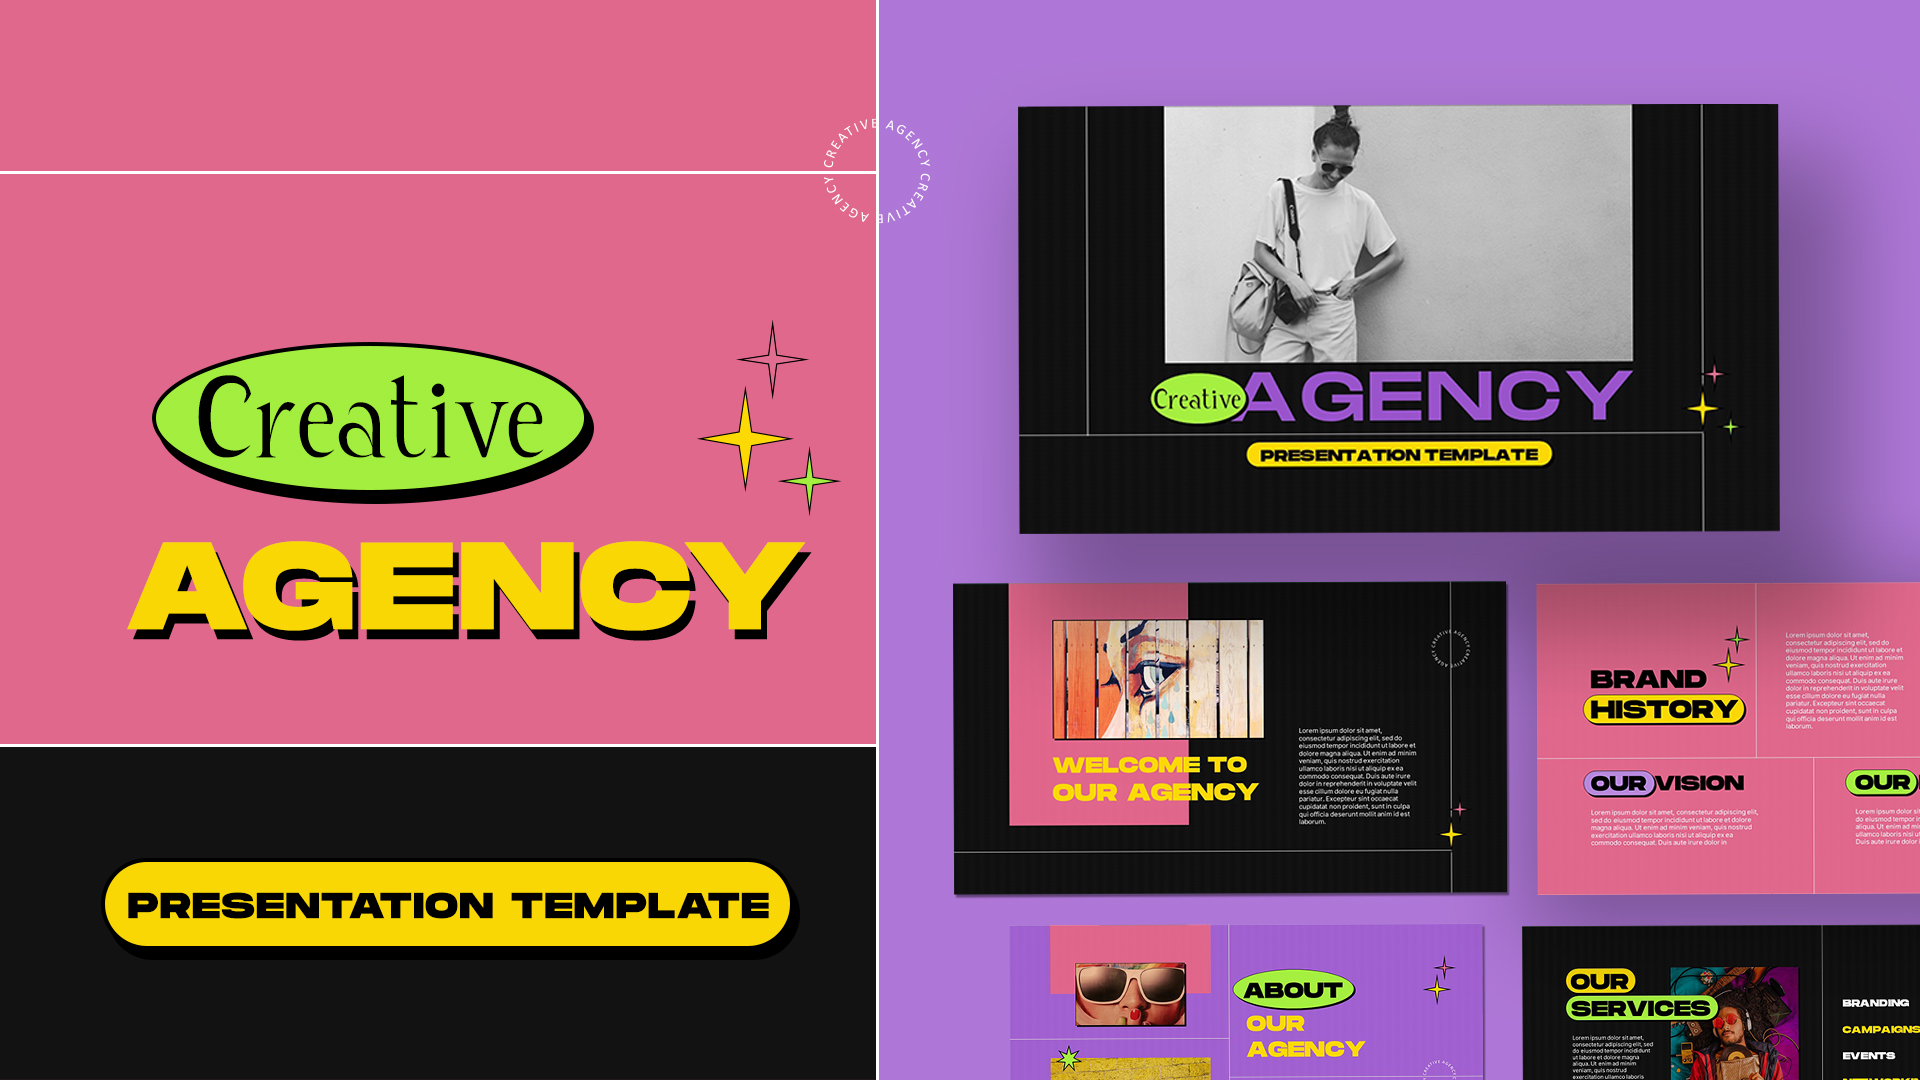
Creative Agency Visual Portfolio Template for PowerPoint & Google Slides
Company Profile
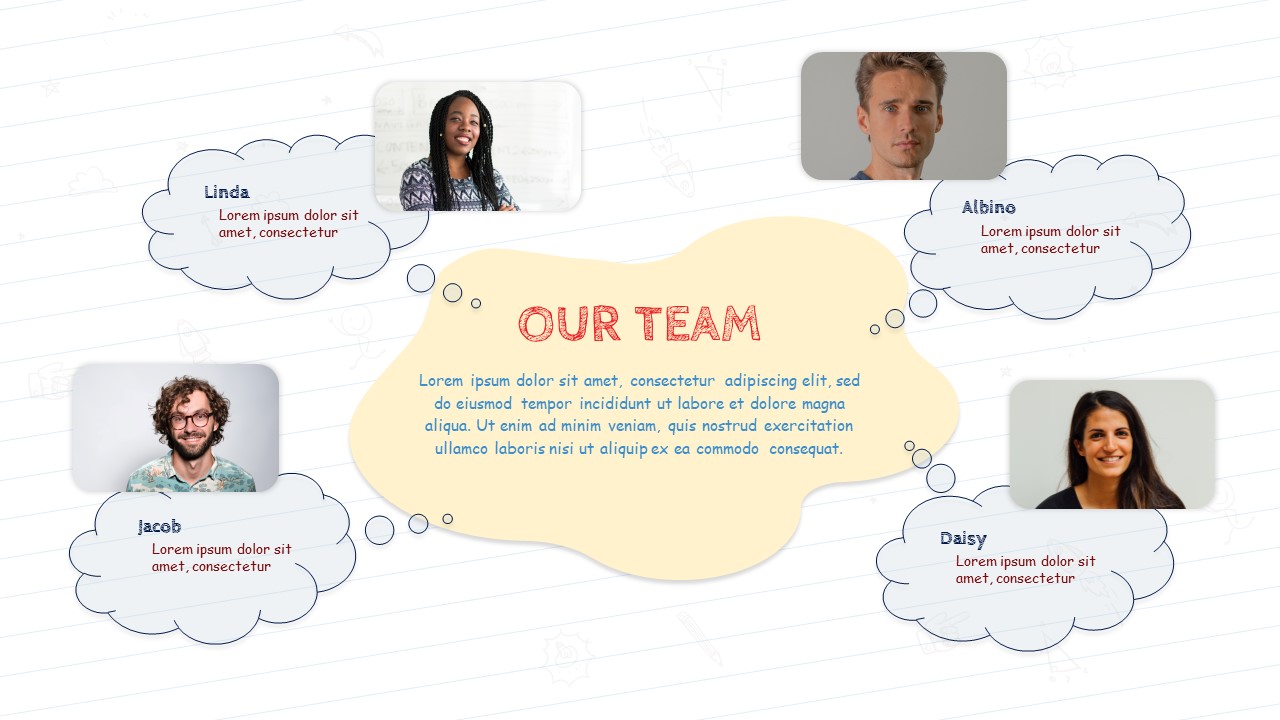
Creative Team Introduction template for PowerPoint & Google Slides
Our Team

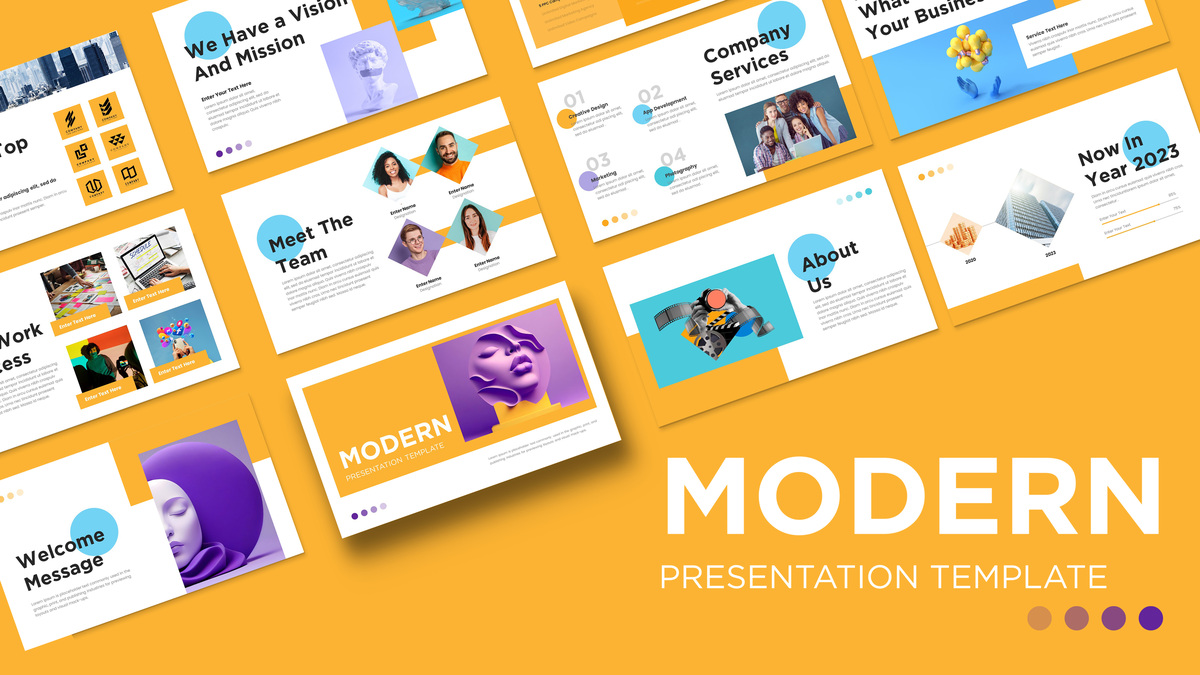
Modern Creative Business Pitch Deck Template for PowerPoint & Google Slides
Pitch Deck
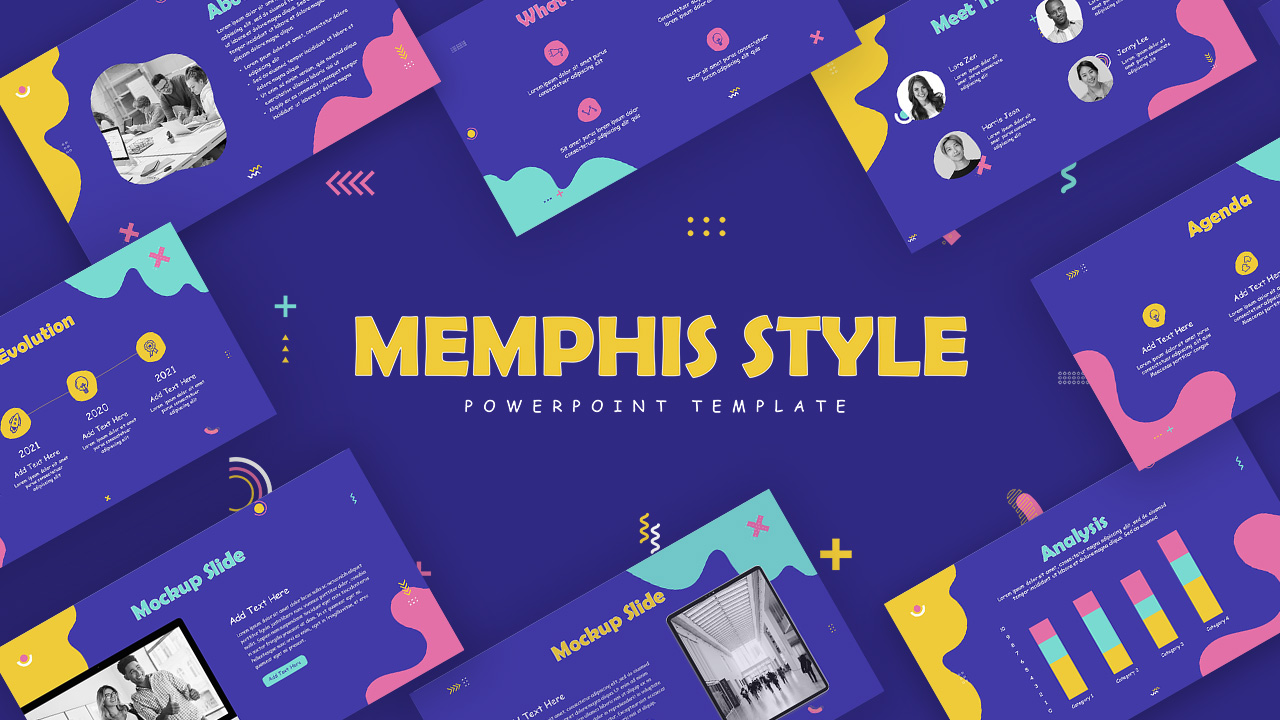
Memphis Style Creative Presentation Template for PowerPoint & Google Slides
Pitch Deck
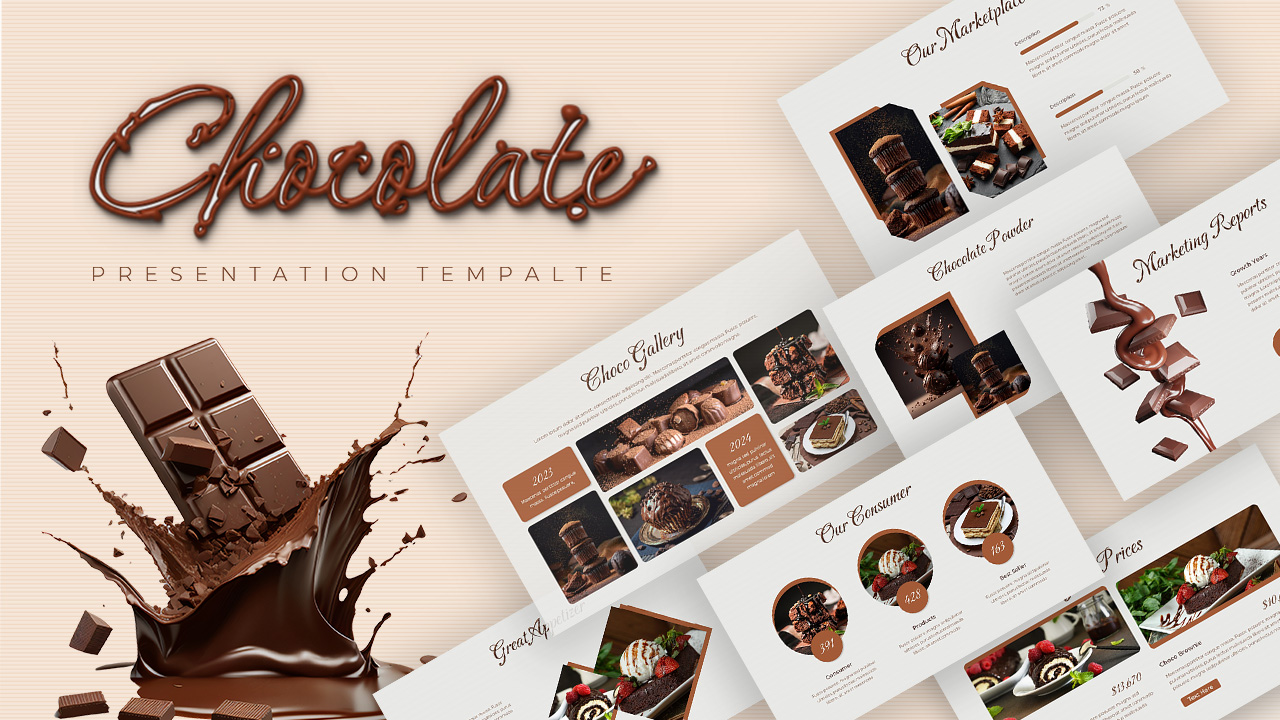
Creative Chocolate Marketing Deck Template for PowerPoint & Google Slides
Company Profile
Creative Books Theme Presentation Template for PowerPoint & Google Slides
Pitch Deck
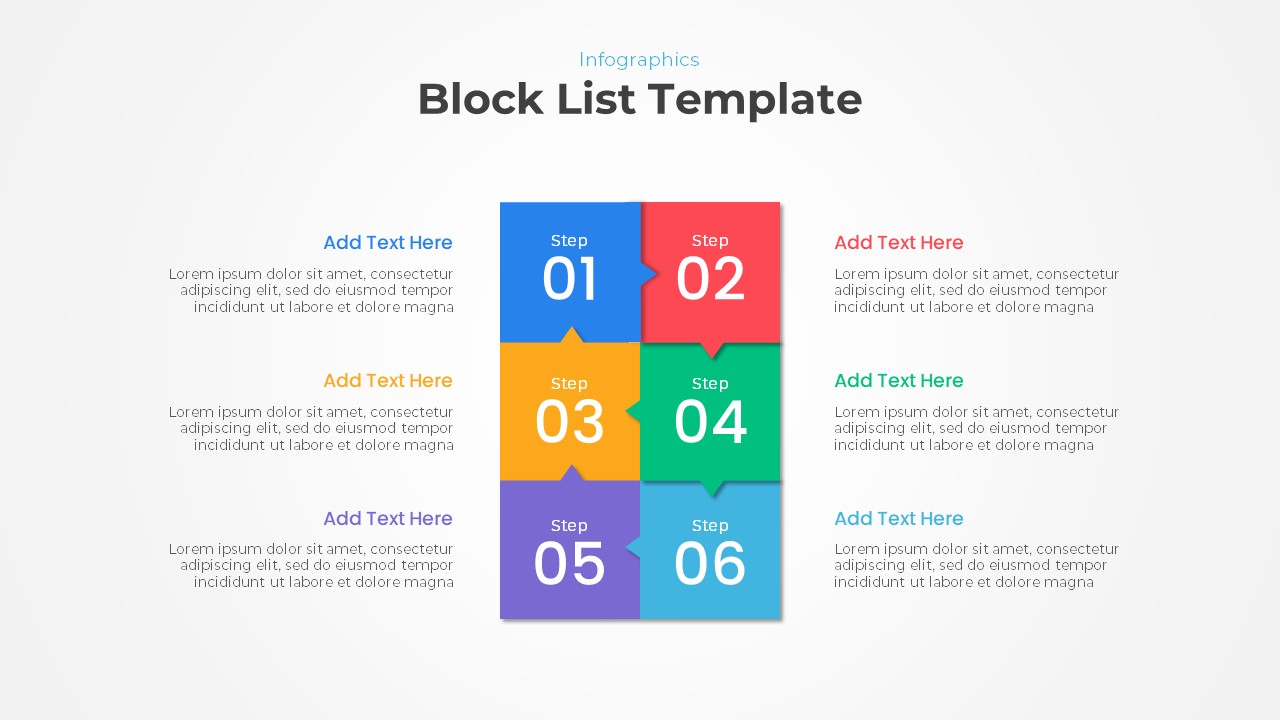
Creative Block List Infographic Template for PowerPoint & Google Slides
Agenda
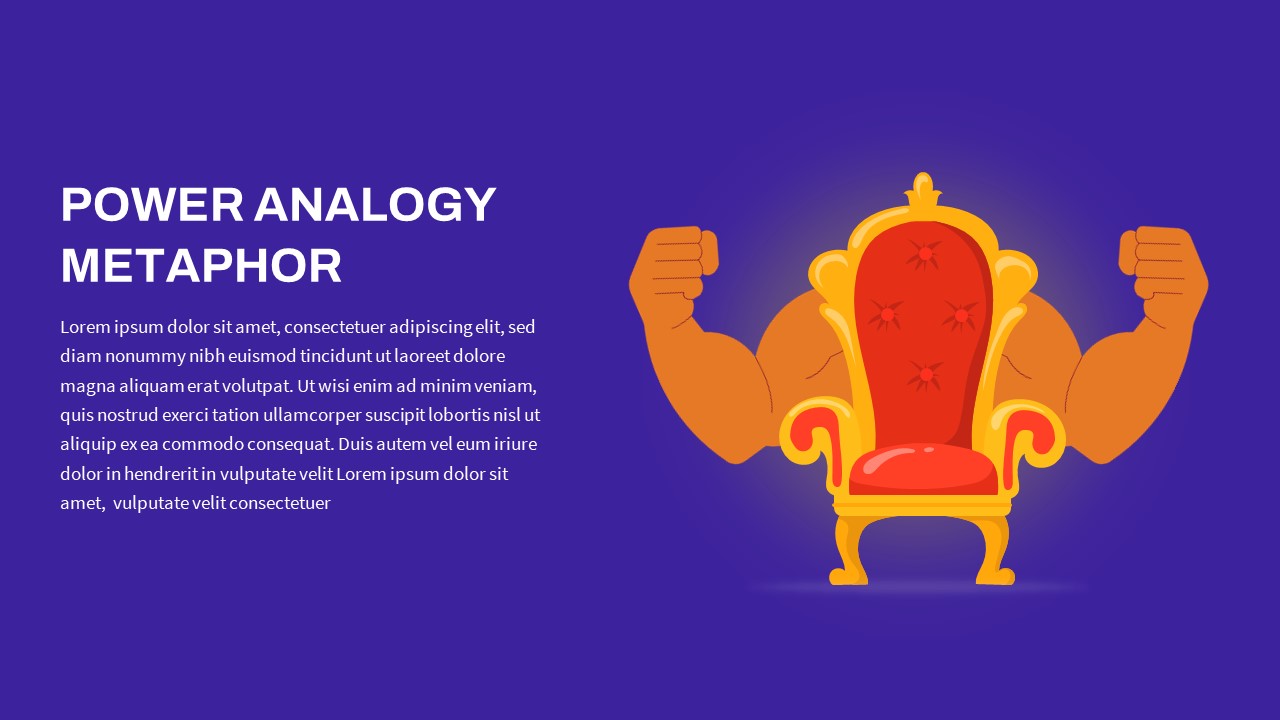
Creative Power Analogy Metaphor Slide Template for PowerPoint & Google Slides
Leadership
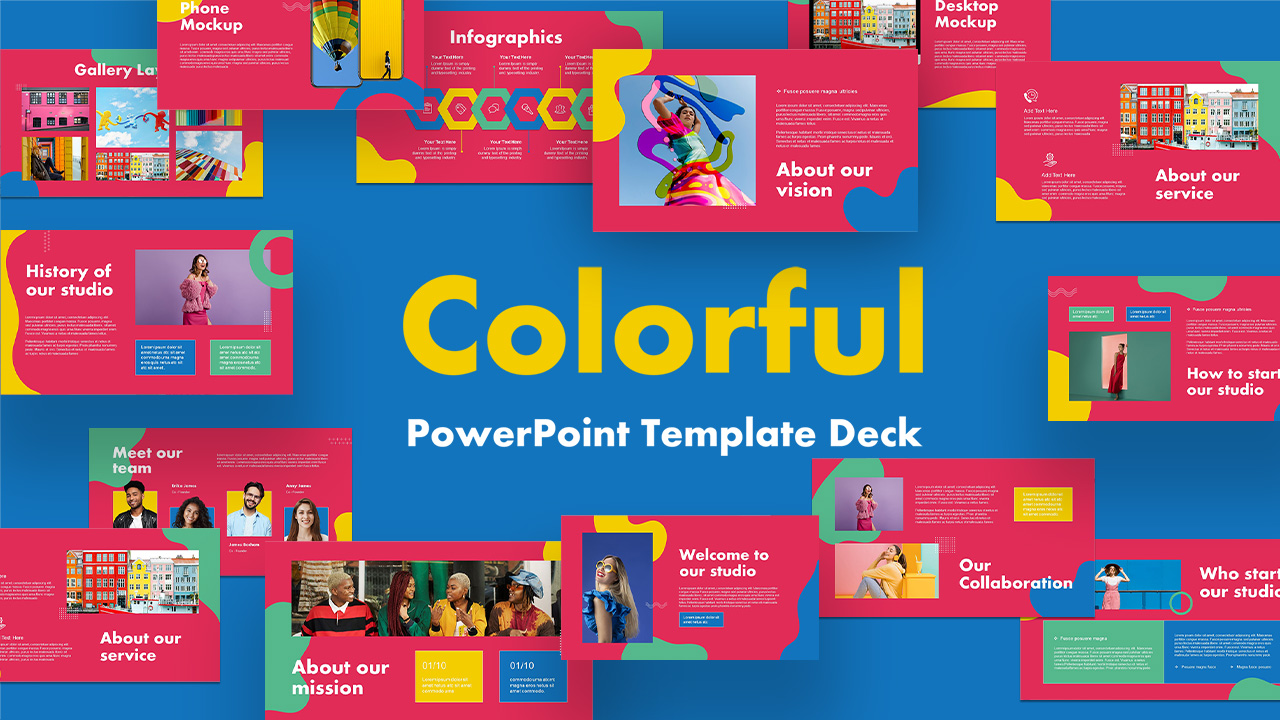
Colorful Creative Presentation Deck Template for PowerPoint & Google Slides
Company Profile
Creative Doodle Transportation Theme Template for PowerPoint & Google Slides
Pitch Deck
Creative Host Introduction Slide Template for PowerPoint & Google Slides
Our Team
Creative Clothing Line Presentation Template for PowerPoint & Google Slides
Pitch Deck
Creative Influencer Marketing Framework Template for PowerPoint & Google Slides
Digital Marketing
Creative Project Roadmap template for PowerPoint & Google Slides
Business
Dynamic Creative Optimization Marketing Template for PowerPoint & Google Slides
Digital Marketing
Creative Bubble Mind Map Template for PowerPoint & Google Slides
Mind Maps
Creative Table Template for PowerPoint & Google Slides
Table
Creative Project Timeline Roadmap Template for PowerPoint & Google Slides
Timeline
Creative Circle Elements for PowerPoint & Google Slides
Infographics
3 Step Creative Circular Diagram for PowerPoint & Google Slides
Process
Creative Abstract Theme for PowerPoint & Google Slides
Decks
Creative Meet Our Team Presentation Slide for PowerPoint & Google Slides
Our Team
Creative New Year Resolution Planner for PowerPoint & Google Slides
Leadership
Free
Free Gear Infographics template for PowerPoint & Google Slides
Process
Free
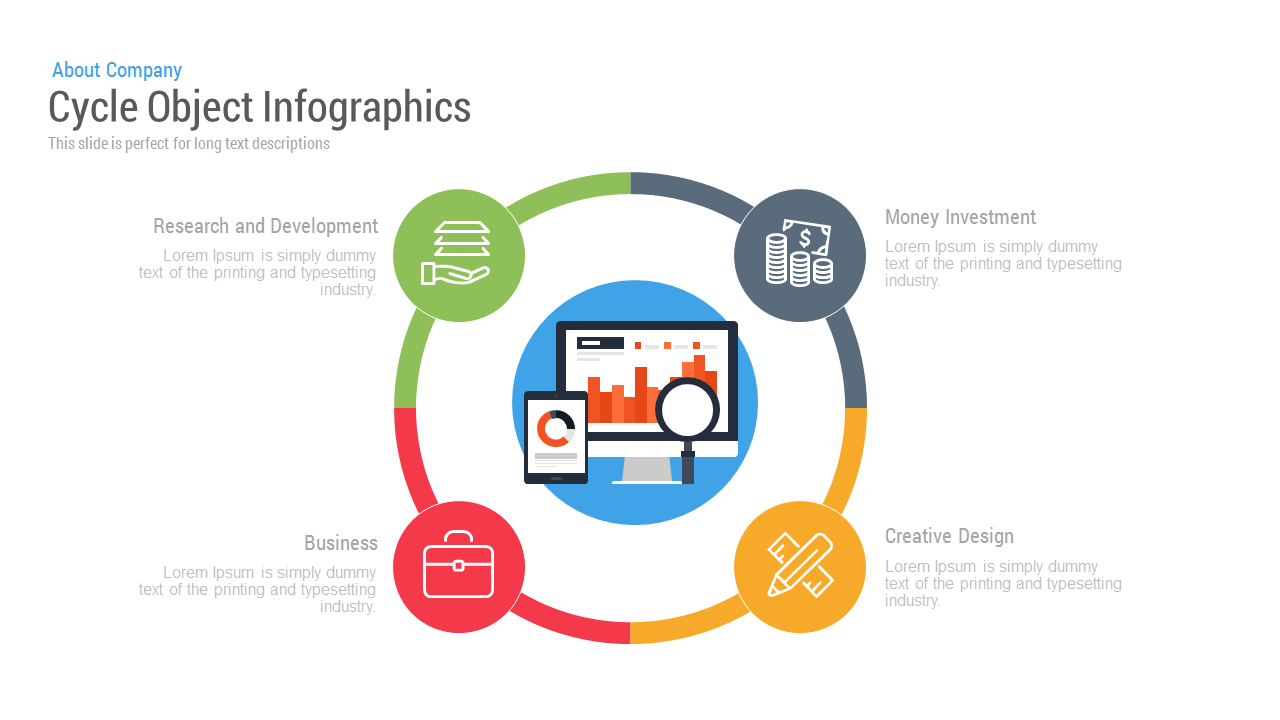
Free Cycle Object Infographics template for PowerPoint & Google Slides
Process
Free
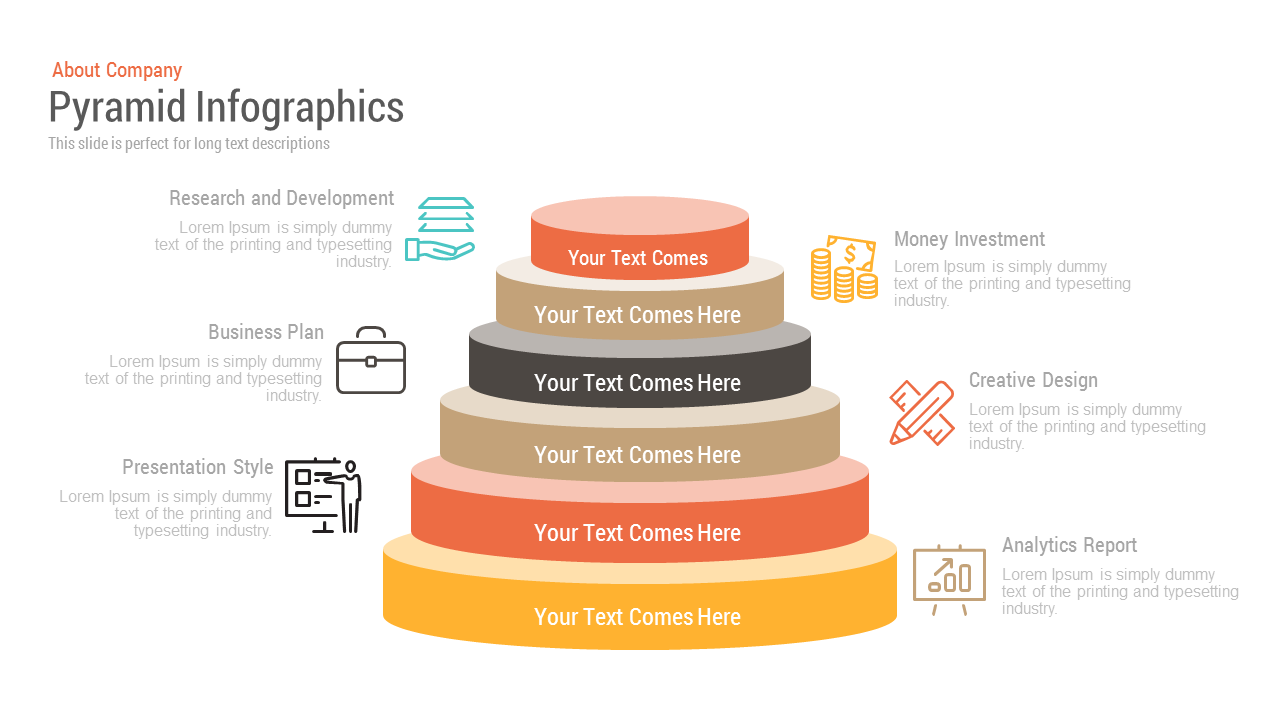
Free Pyramid Infographics template for PowerPoint & Google Slides
Pyramid
Free
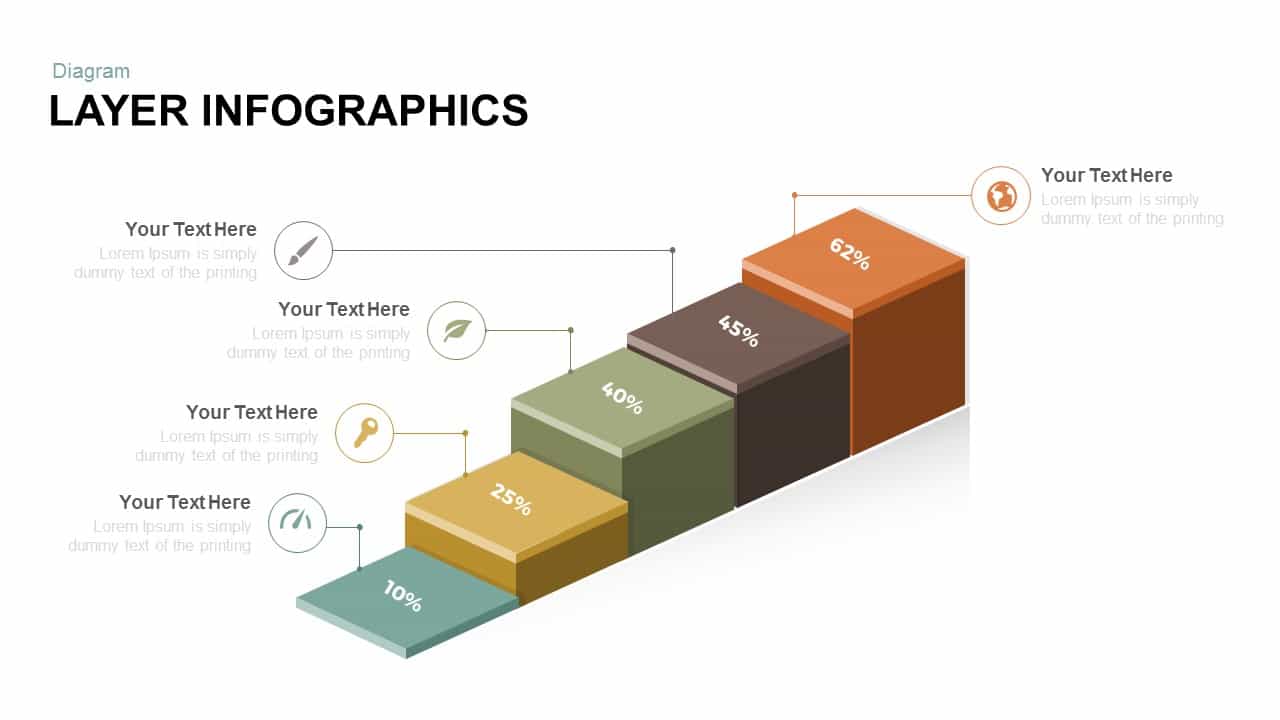
Free Layer Infographics template for PowerPoint & Google Slides
Process
Free
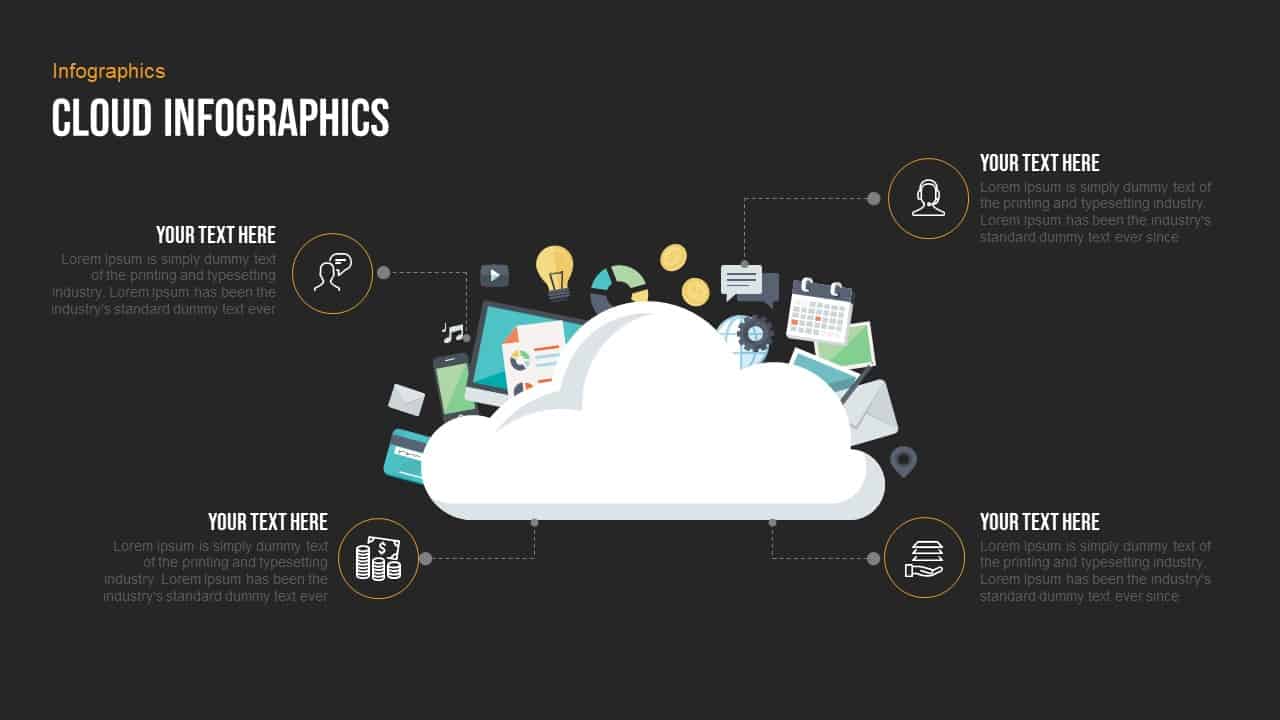
Free Professional Cloud Infographics Template for PowerPoint & Google Slides
Process
Free
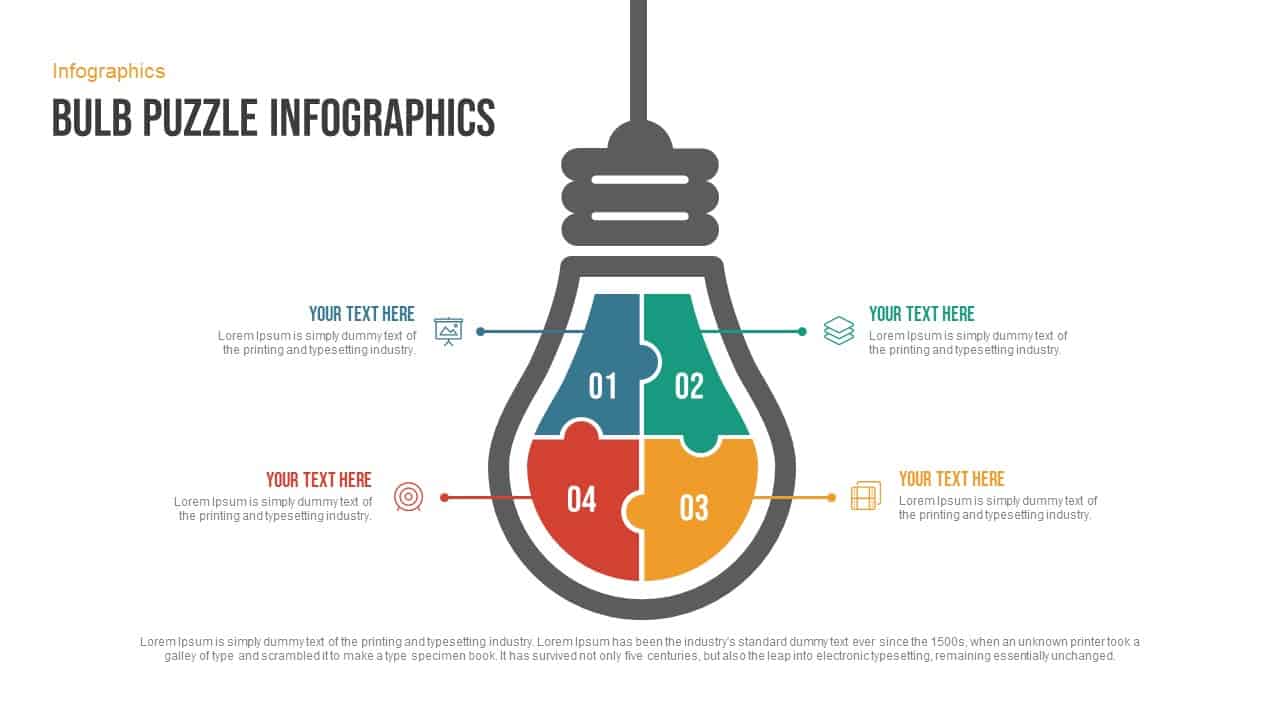
Free Bulb Puzzle Infographics Diagram Template for PowerPoint & Google Slides
Process
Free

Free Colorful Process Flow Infographics Template for PowerPoint & Google Slides
Process
Free
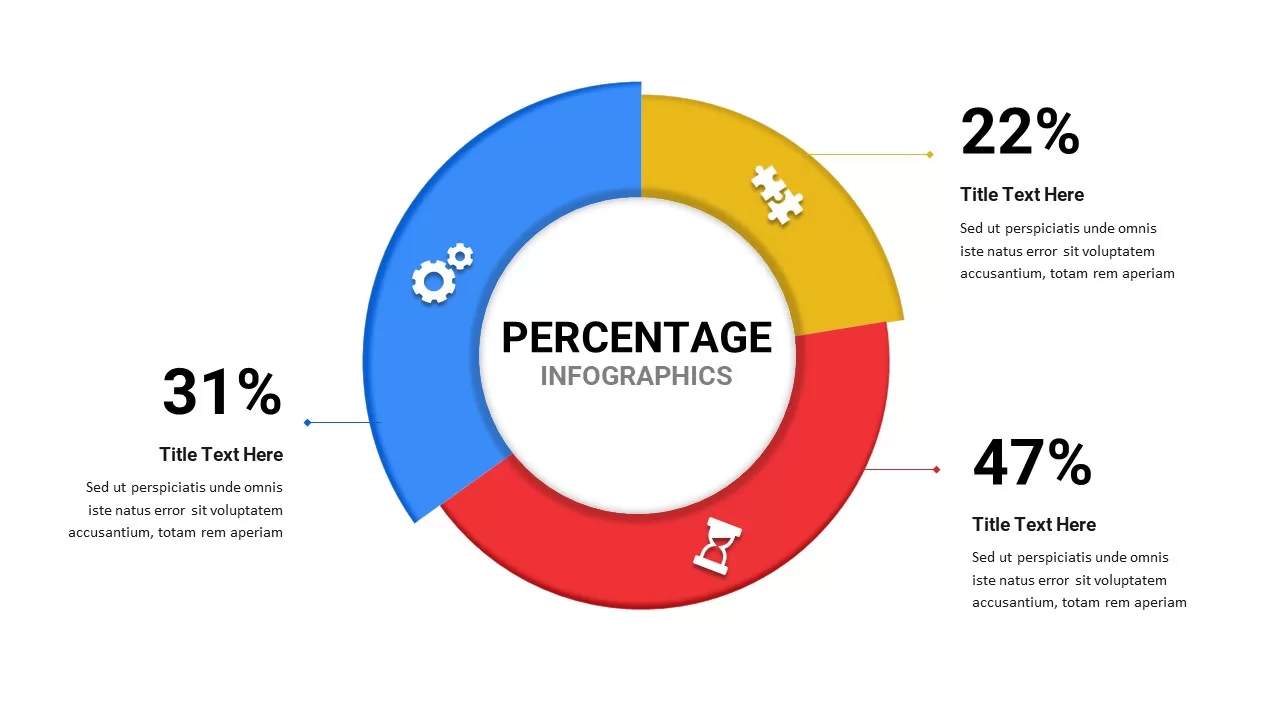
Free Percentage Infographics template for PowerPoint & Google Slides
Comparison
Free
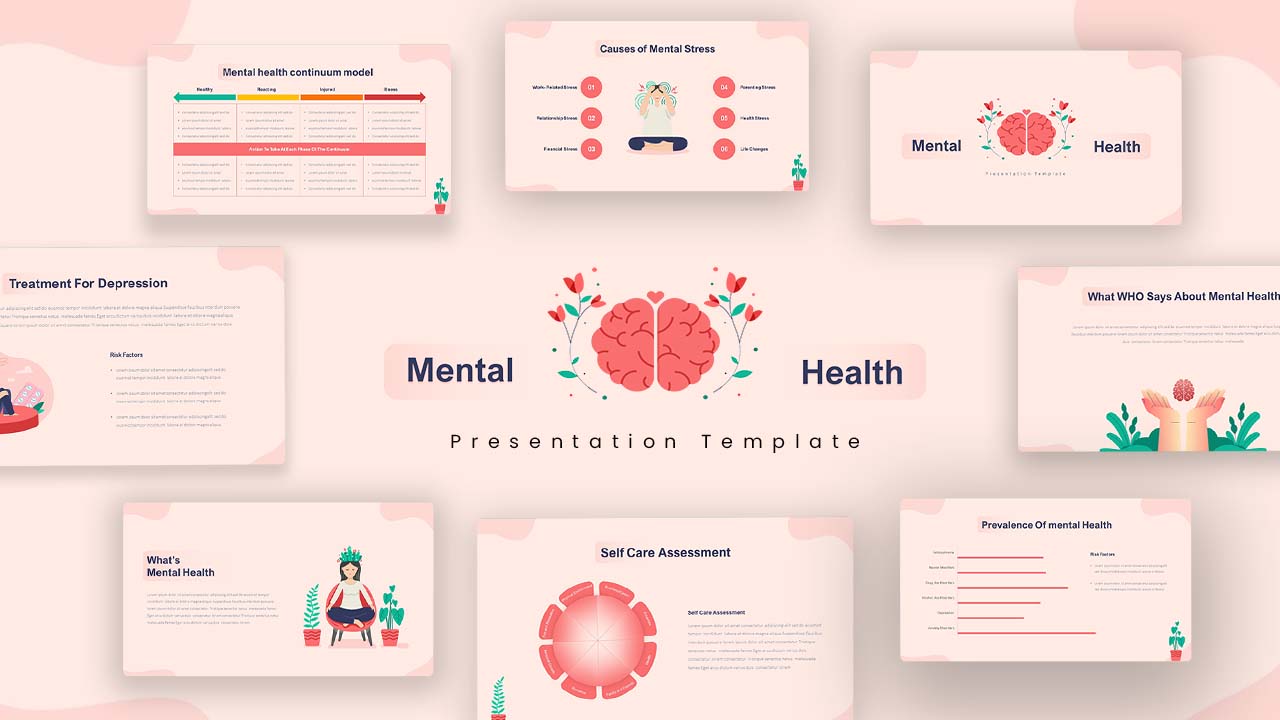
Free Mental Health Awareness & Infographics Presentation Template for PowerPoint & Google Slides
Health
Free
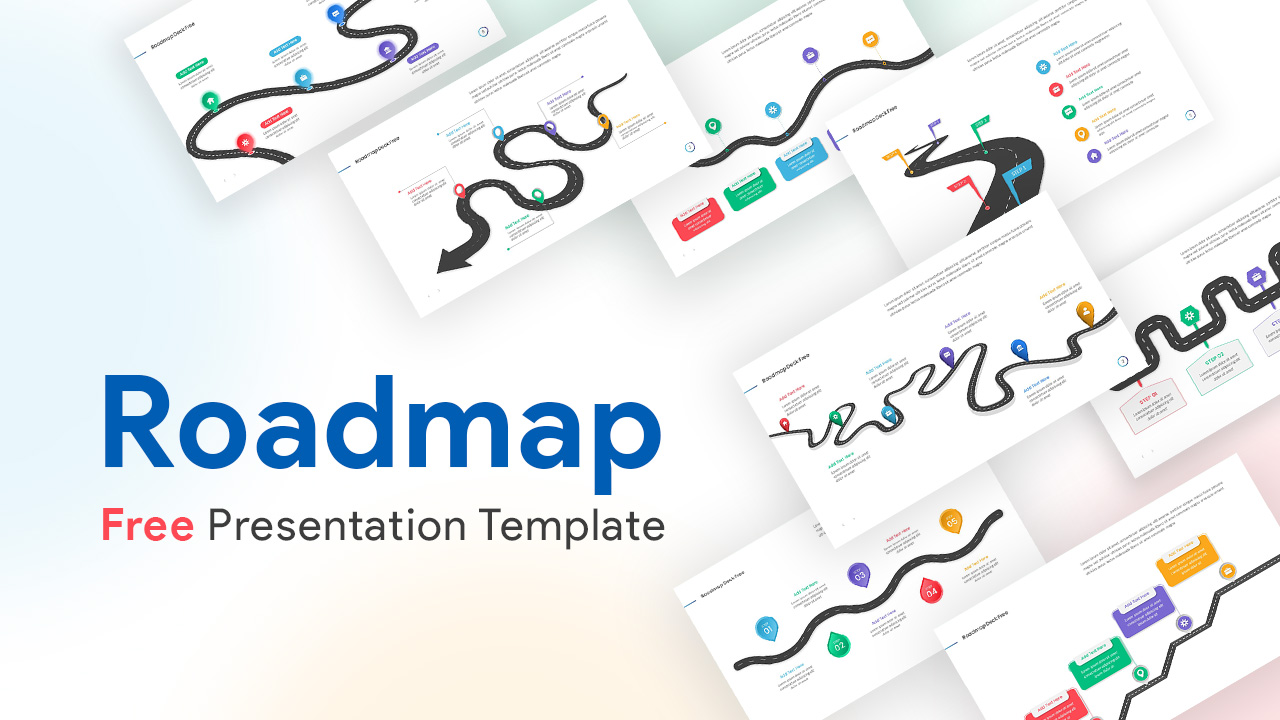
Free Roadmap Infographics Pack Template for PowerPoint & Google Slides
Pitch Deck
Free
Free Colorful Timeline Infographics Template for PowerPoint & Google Slides
Timeline
Free
Free Law Infographics Slide Pack Collection Template for PowerPoint & Google Slides
Infographics
Free
Free Biology Theme Infographics Deck Template for PowerPoint & Google Slides
Health
Free
Box Services Infographics template for PowerPoint & Google Slides
Process
Flywheel Infographics template for PowerPoint & Google Slides
Business Strategy
Conflict Infographics Comparison Template for PowerPoint & Google Slides
Infographics