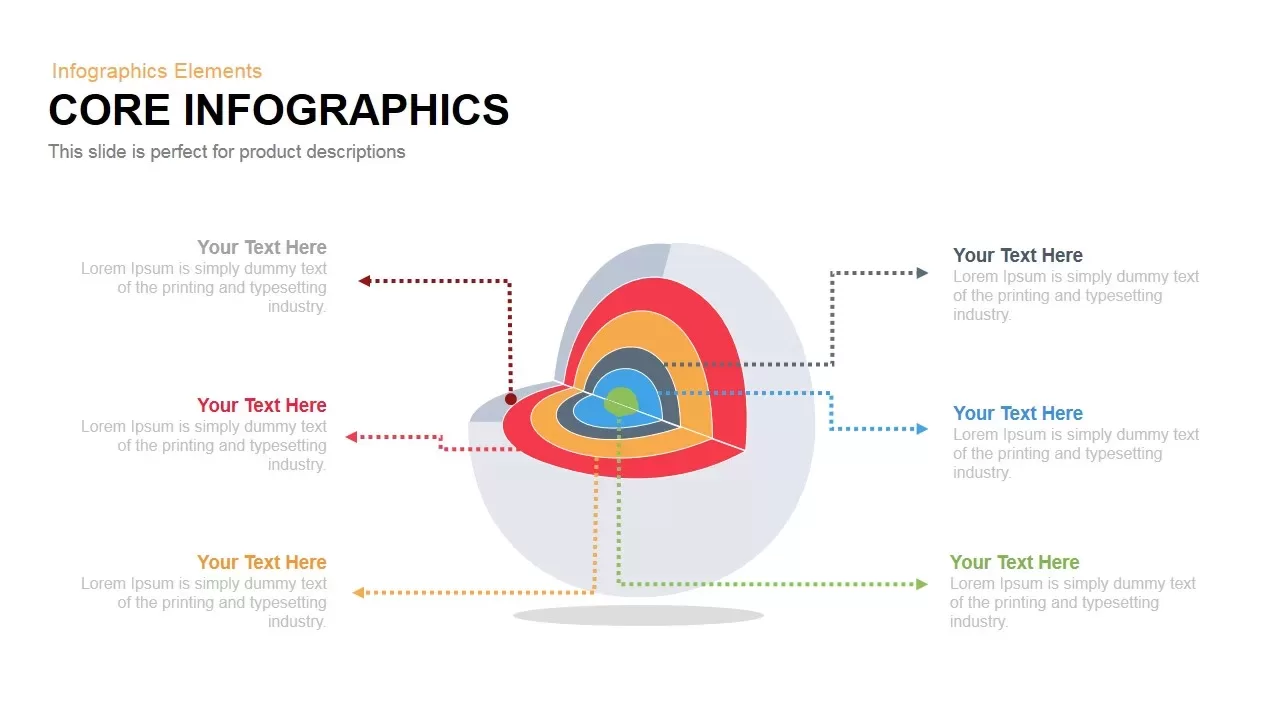
Multilayer Core Infographic Diagram Template for PowerPoint & Google Slides
Description
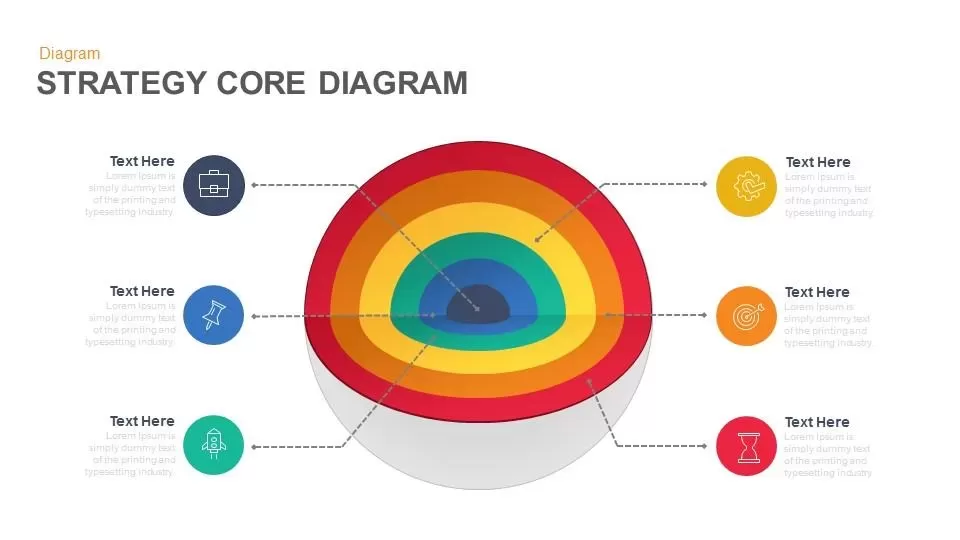
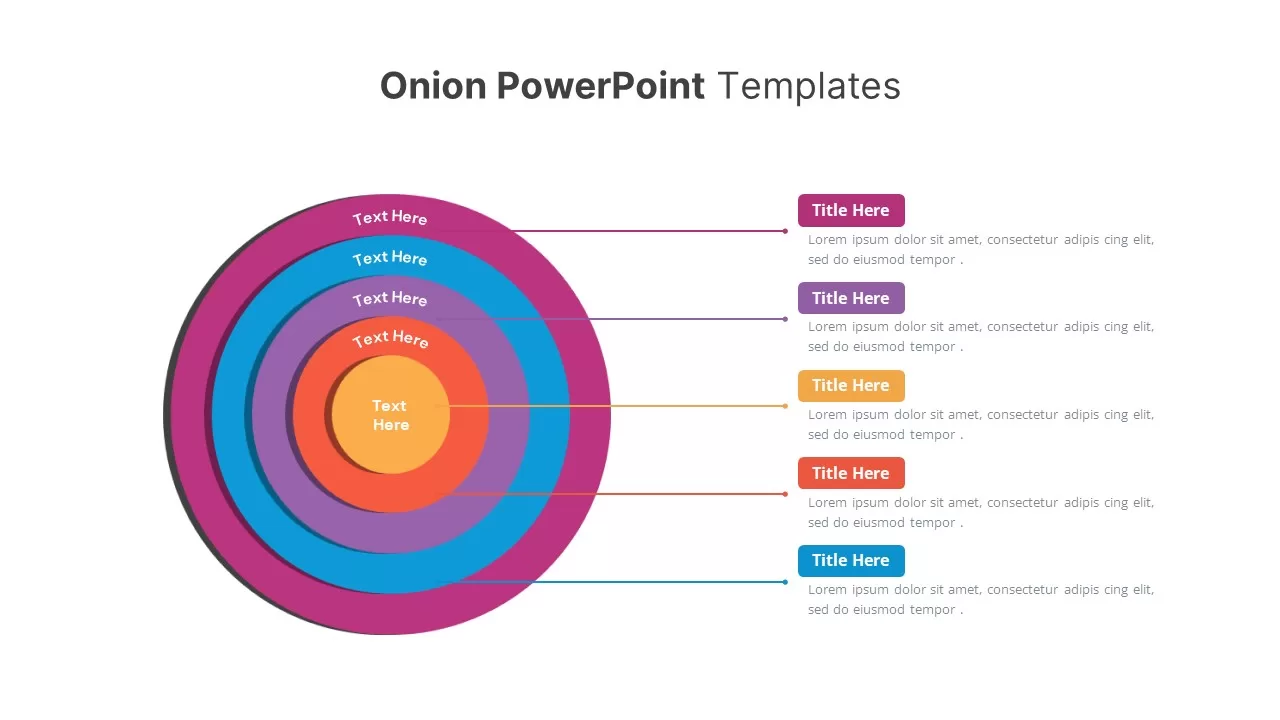
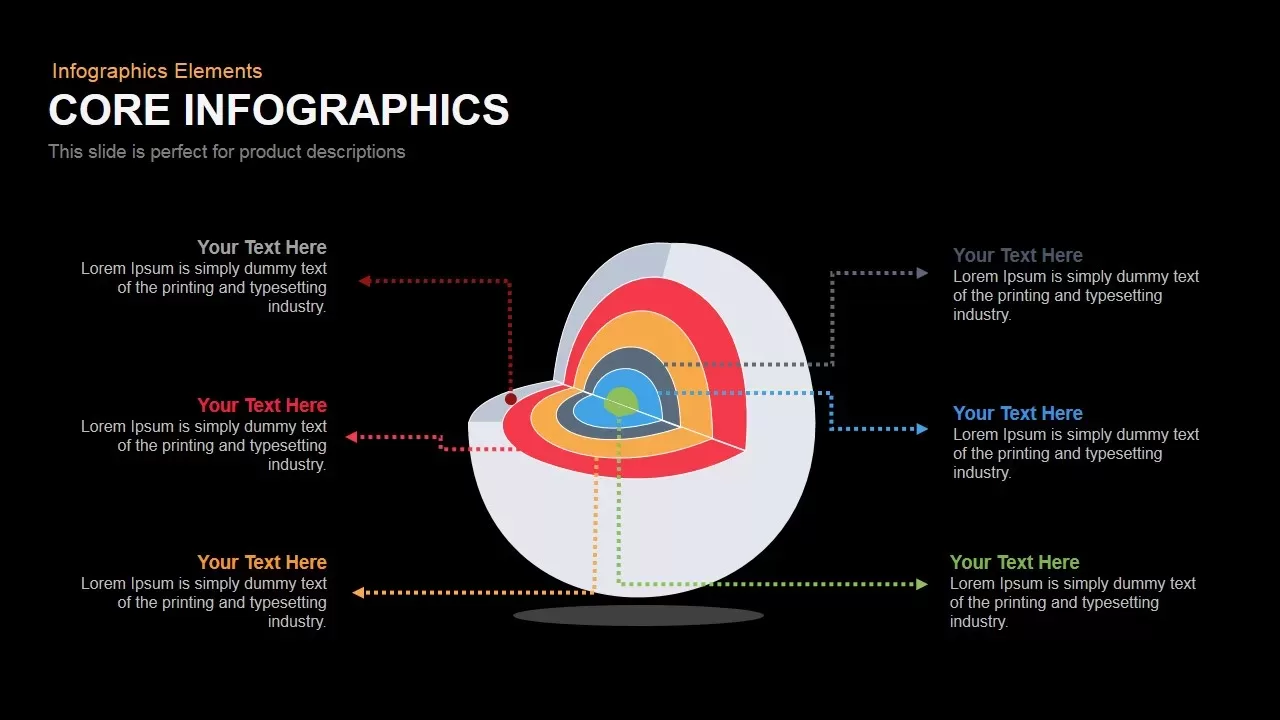
Leverage this core infographic slide featuring a layered 3D diagram of nested concentric rings to illustrate hierarchical relationships, process stages, or data segmentation with depth and clarity. A central green core sits at the heart of five multicolored rings—light blue, dark gray, orange, and red—set against a subtle pale-gray circular backdrop. Six dotted-line callouts with matching colored headings connect directly to designated layers, providing clear placeholders for descriptive text, metrics, or icons. Semi-transparent gradient arrows flanking the sides hint at carousel navigation or step-by-step storytelling, guiding audiences through each layer in sequence.
Built on master slides and composed of fully editable vector shapes, this template enables rapid customization: adjust ring thickness, modify gradient shading, swap accent colors, update callout text, or replace icons to suit your brand identity. The 3D shading and crisp outlines maintain visual hierarchy and scale seamlessly across screen sizes without loss of fidelity. A clean white background and modern typography ensure legibility, while balanced whitespace and consistent alignment deliver a polished, professional aesthetic.
Whether you’re mapping organizational hierarchies, illustrating multi-phase roadmaps, or visualizing product feature layers, this core infographic offers a cohesive framework. Duplicate callouts or add additional layers to expand your narrative, then rearrange colors and text placeholders with a few clicks. Full compatibility with both PowerPoint and Google Slides means you can collaborate across platforms and export without formatting headaches. Use this slide to drive strategic discussions, highlight key insights, or break down complex systems into digestible segments—all within a single, visually engaging asset.
Who is it for
Business analysts, project managers, product strategists, and process engineers will leverage this layered core diagram to present hierarchical data, workflow stages, or strategic frameworks in boardroom meetings, stakeholder briefings, or training workshops.
Other Uses
Beyond corporate presentations, repurpose this slide for educational modules, research methodologies, risk-assessment layers, or marketing funnel breakdowns. Replace the core graphic to match diverse themes, expand layers for deeper analyses, or connect callouts to showcase comparative insights across any domain.
Login to download this file

Item ID
SB00119
Related Templates

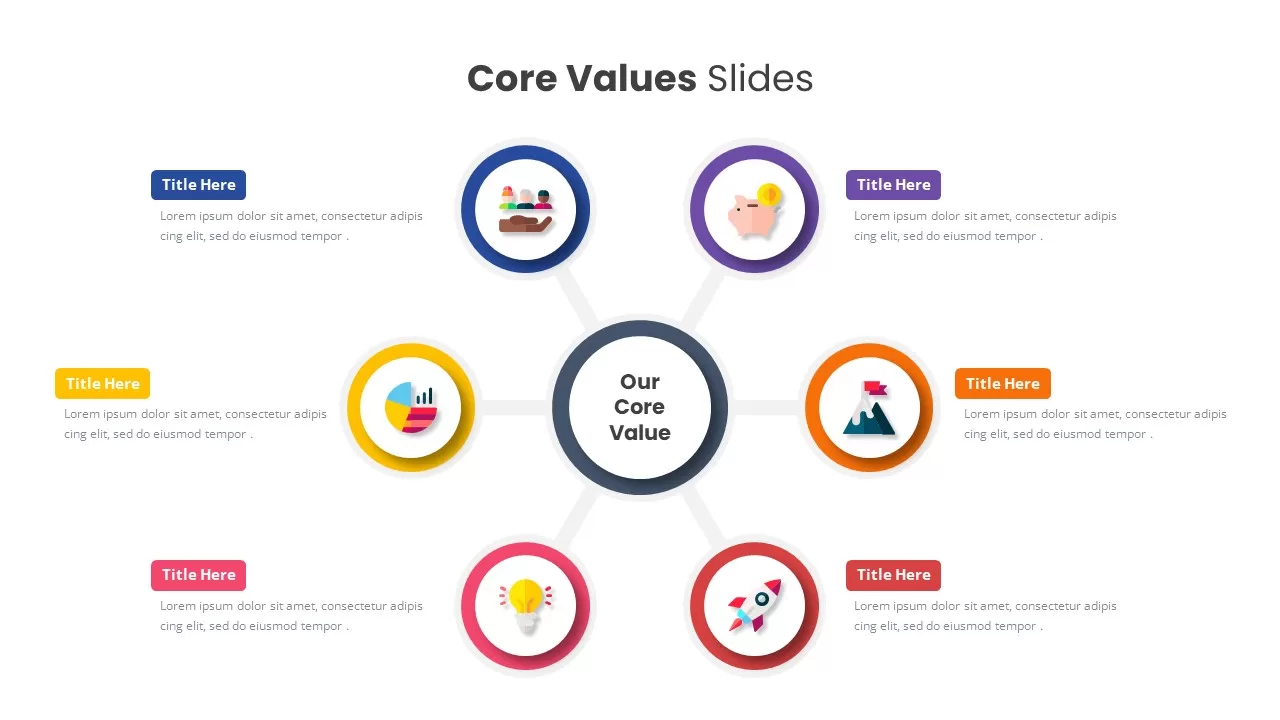
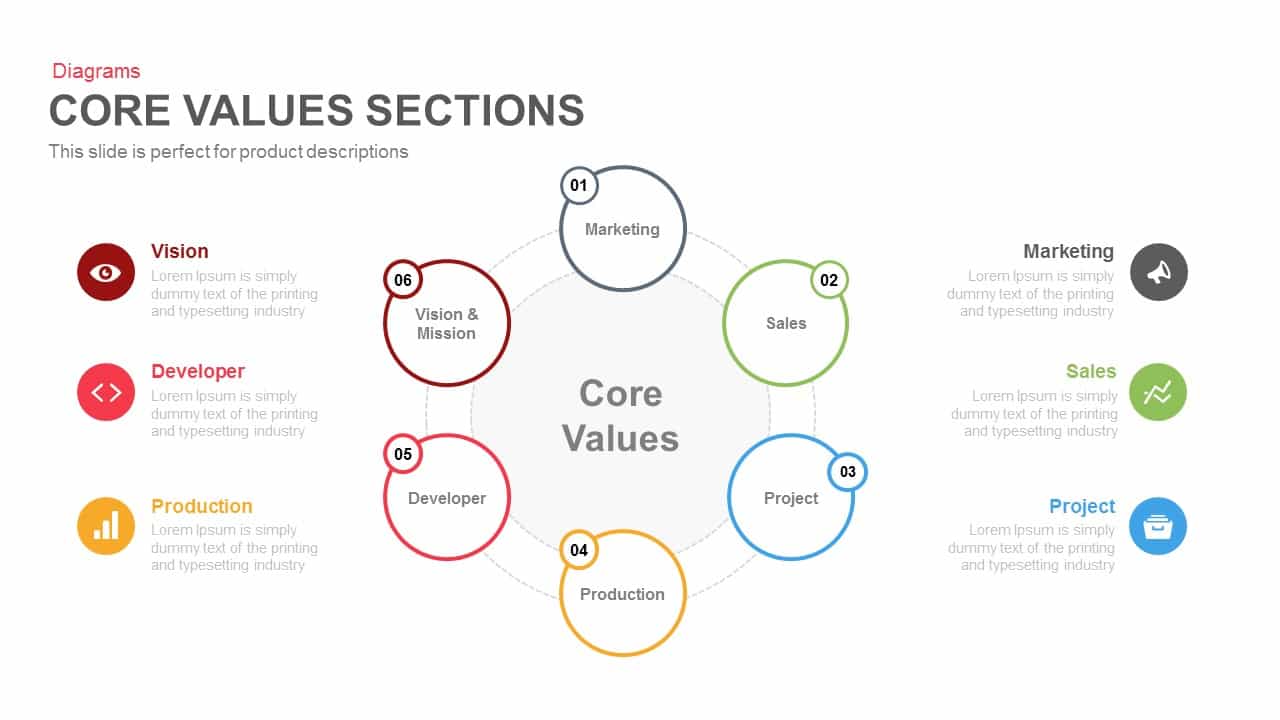
Core Values Infographic Diagram Template for PowerPoint & Google Slides
Circular
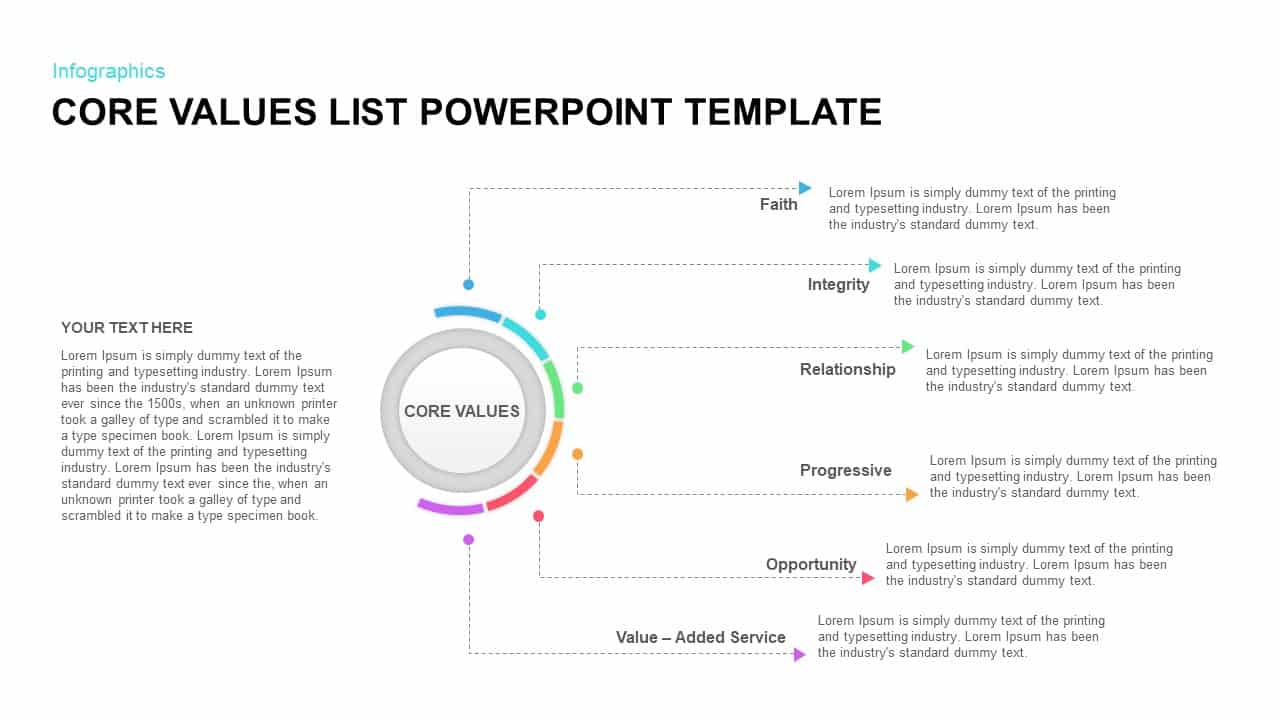
Circular Core Values Infographic List Template for PowerPoint & Google Slides
Circular
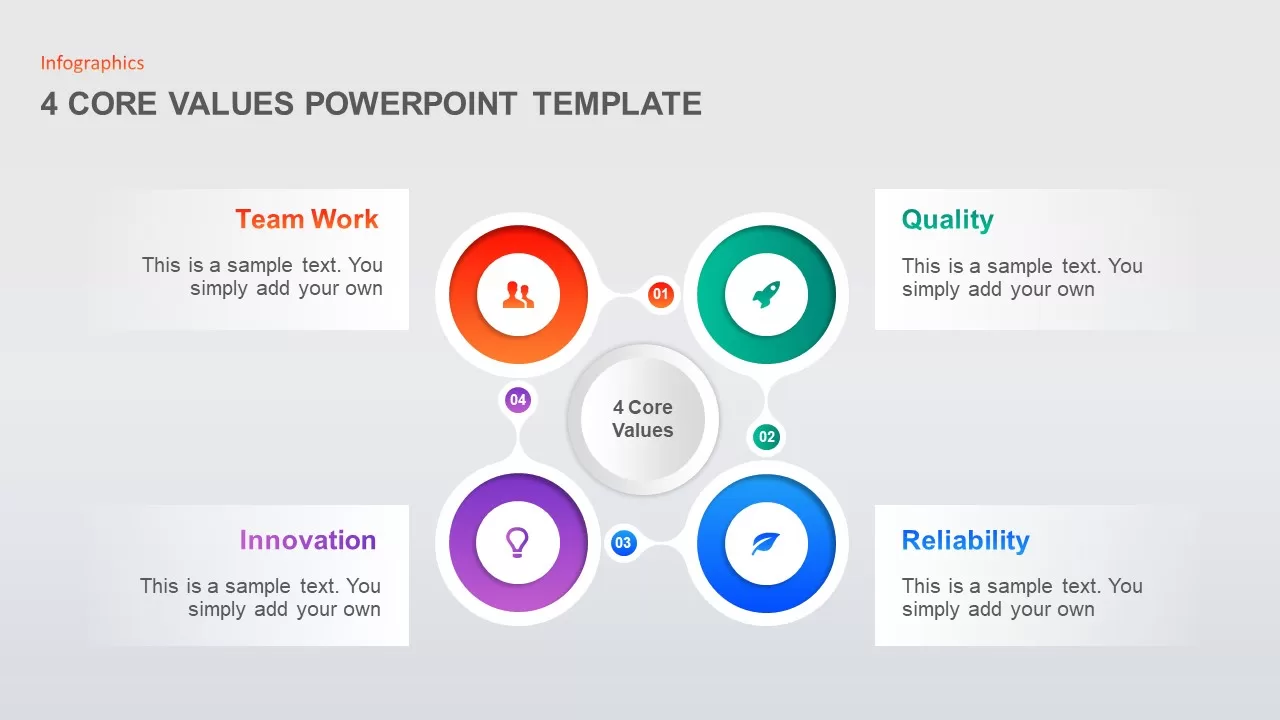
4 Core Values Infographic Template for PowerPoint & Google Slides
Infographics
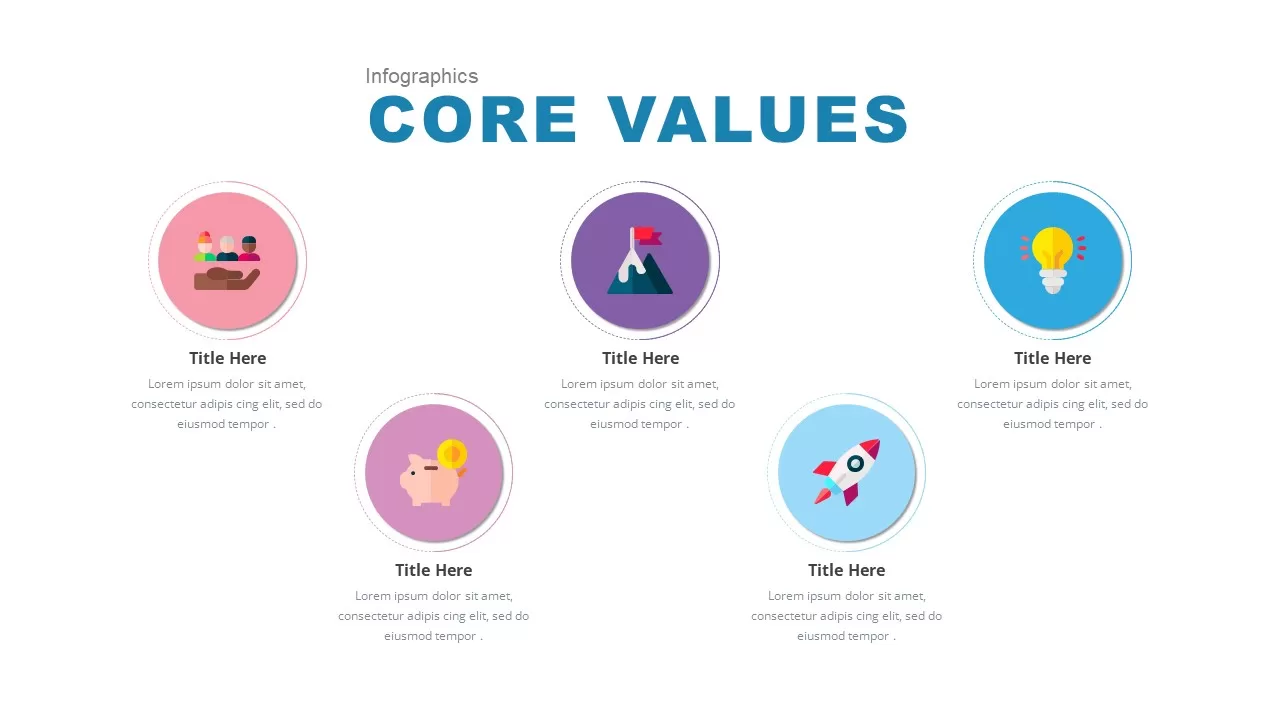
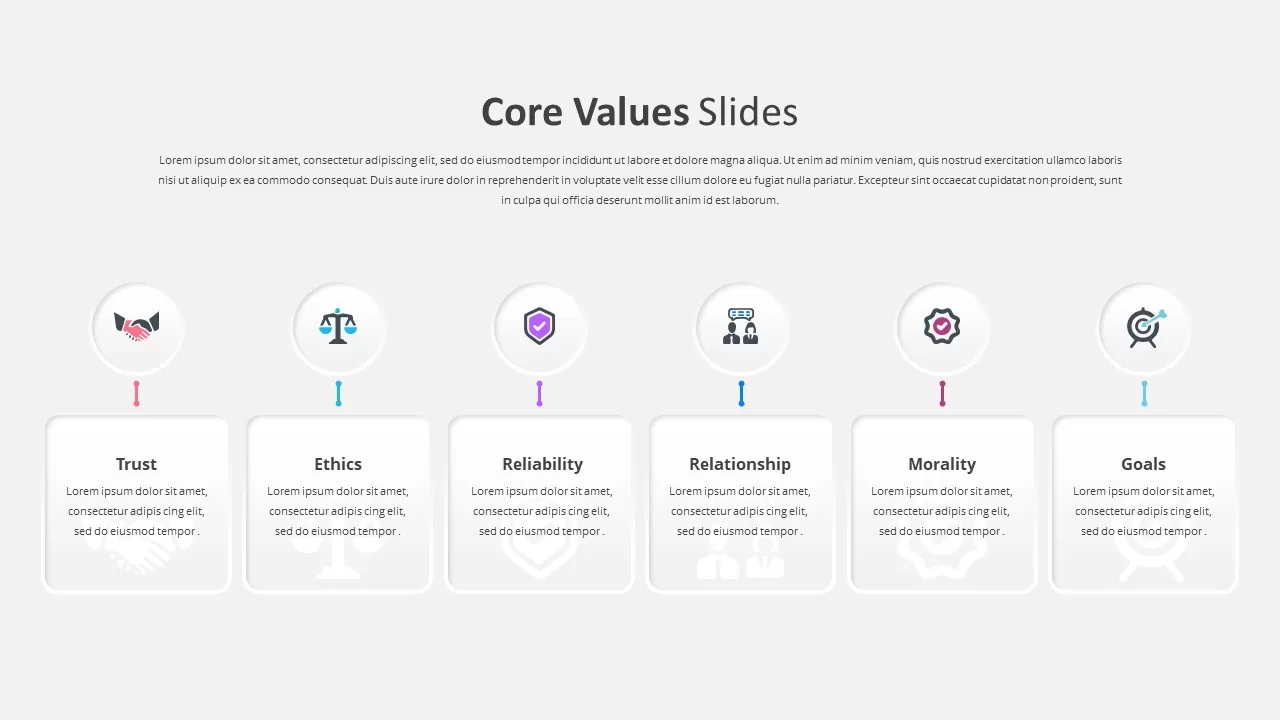
Core Values Infographic Slide Template for PowerPoint & Google Slides
Comparison
Six Core Values Infographic Timeline Template for PowerPoint & Google Slides
Comparison
Six-Part Core Values Circular Diagram Template for PowerPoint & Google Slides
Circular

Strategy Core Diagram template for PowerPoint & Google Slides
Process
Concentric Four-Layer Core Diagram Template for PowerPoint & Google Slides
Circular
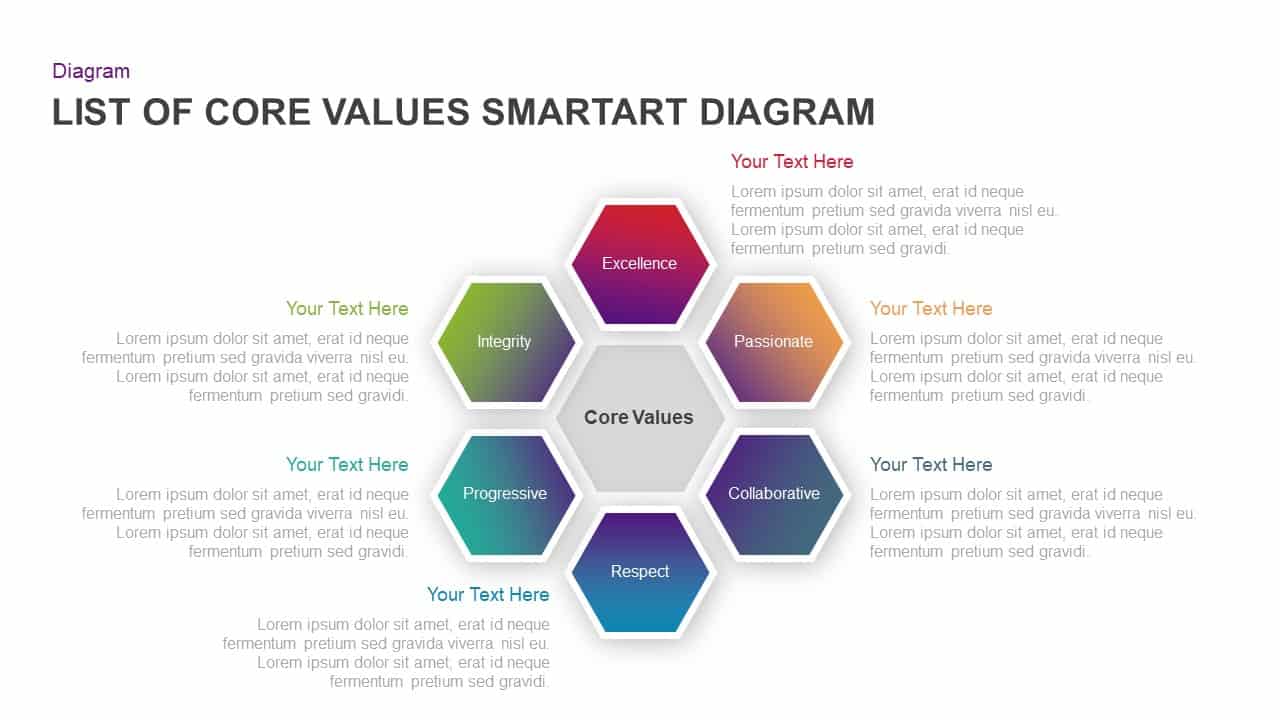
Core Values SmartArt Hexagon Diagram Template for PowerPoint & Google Slides
Circular
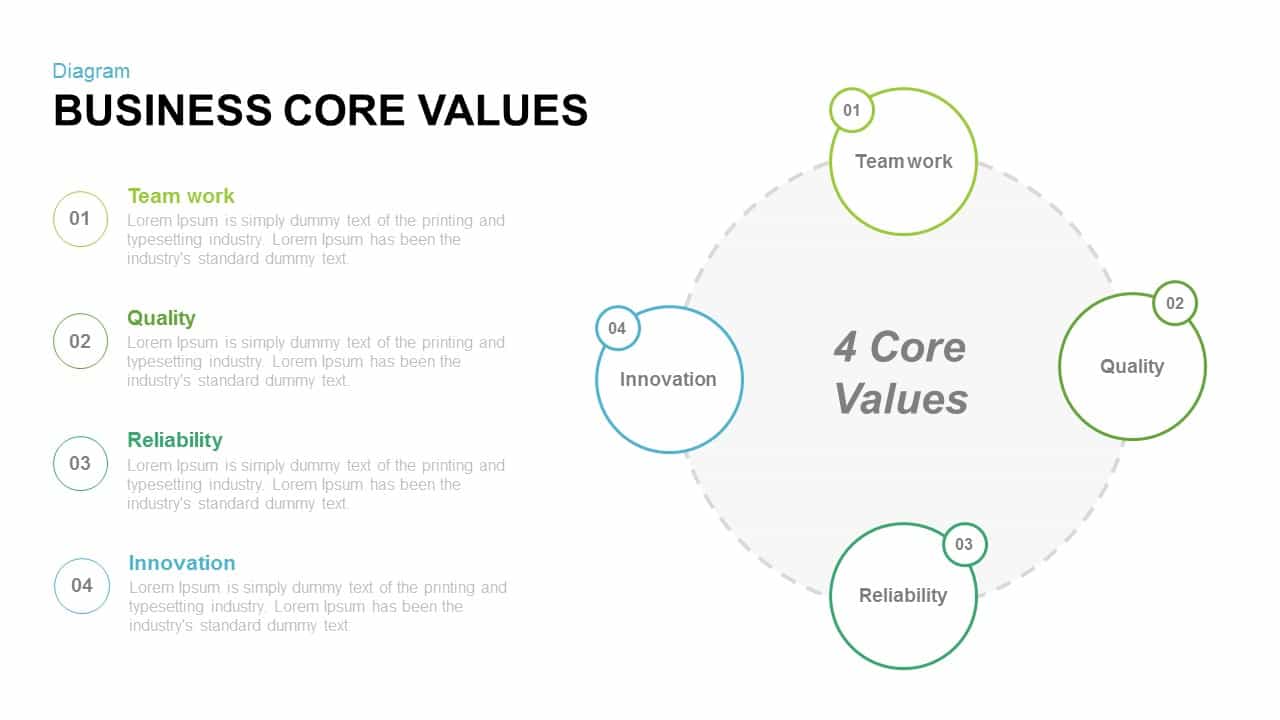
Business Core Values Diagram for PowerPoint & Google Slides
Process
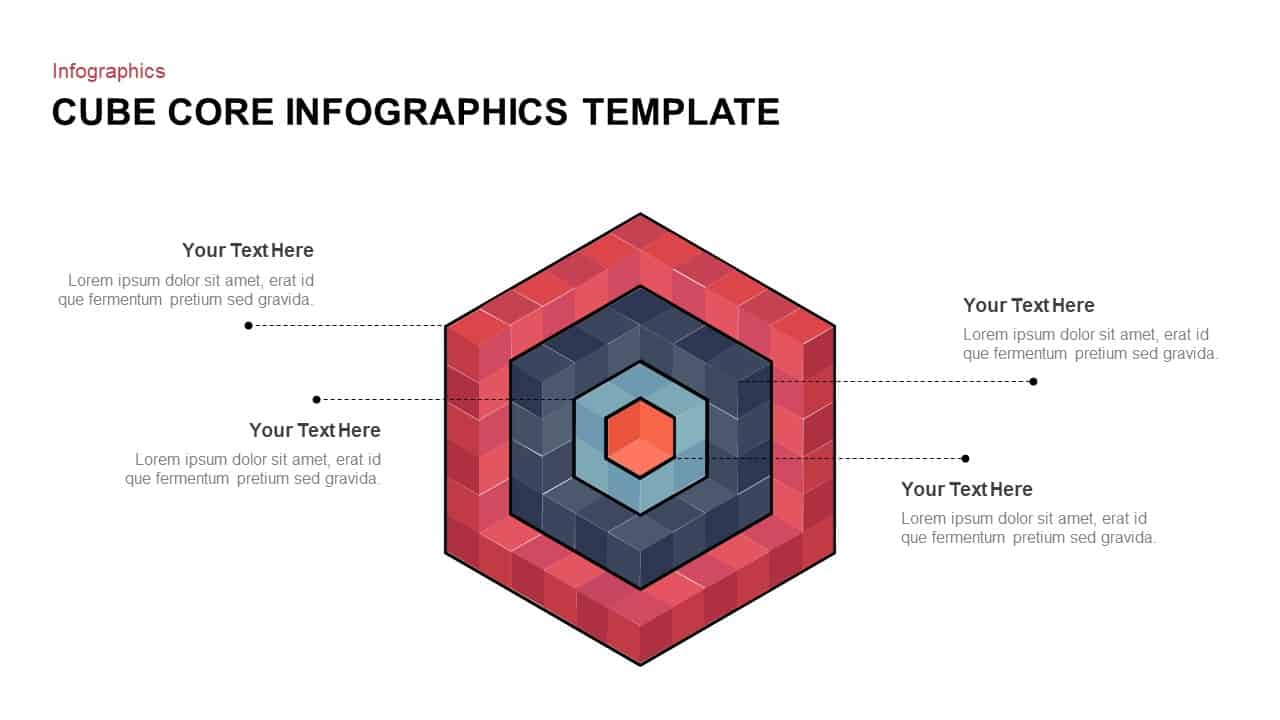
Cube Core Infographics Template for PowerPoint & Google Slides
Process
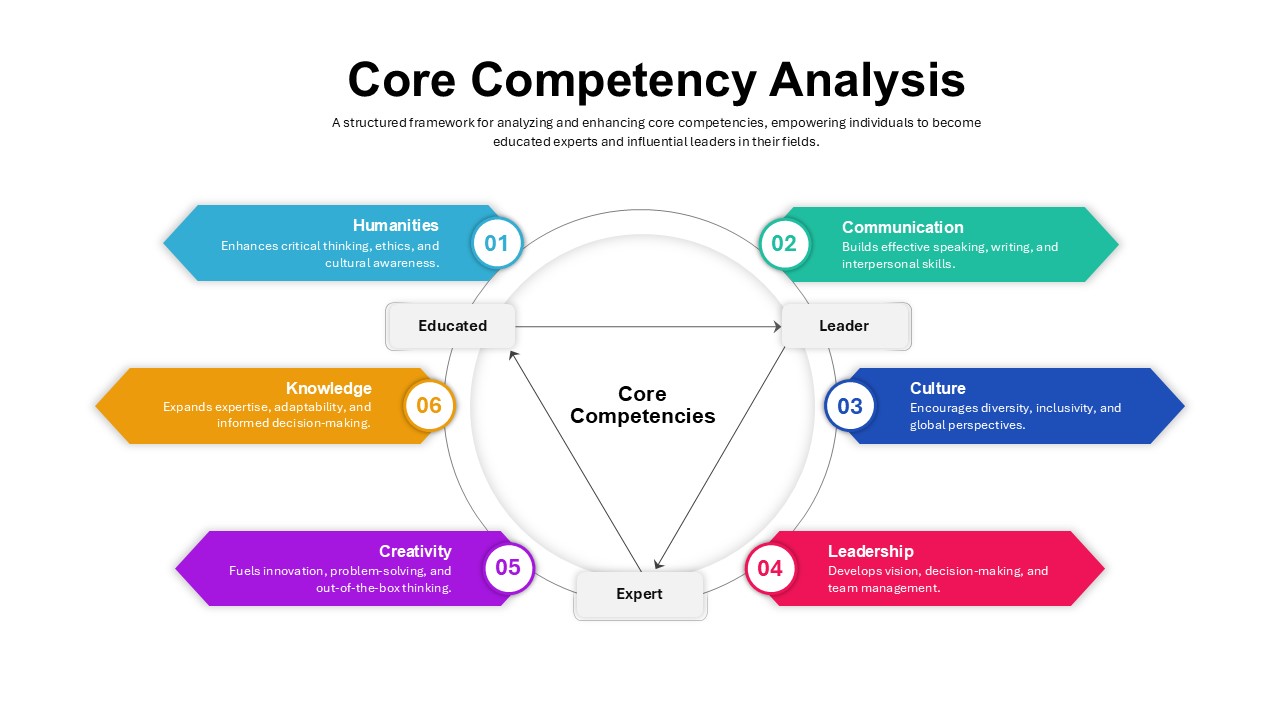
Core Competency Analysis Circular Template for PowerPoint & Google Slides
Circular
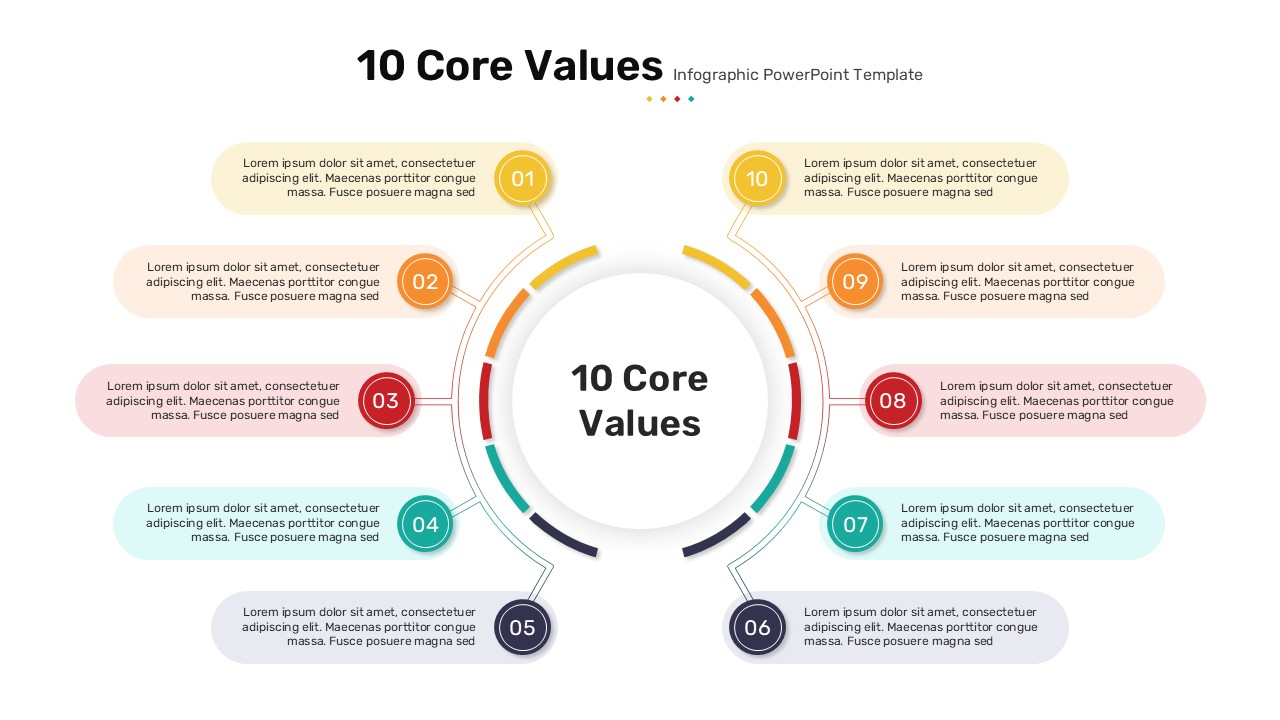
10 Core Values template for PowerPoint & Google Slides
Infographics
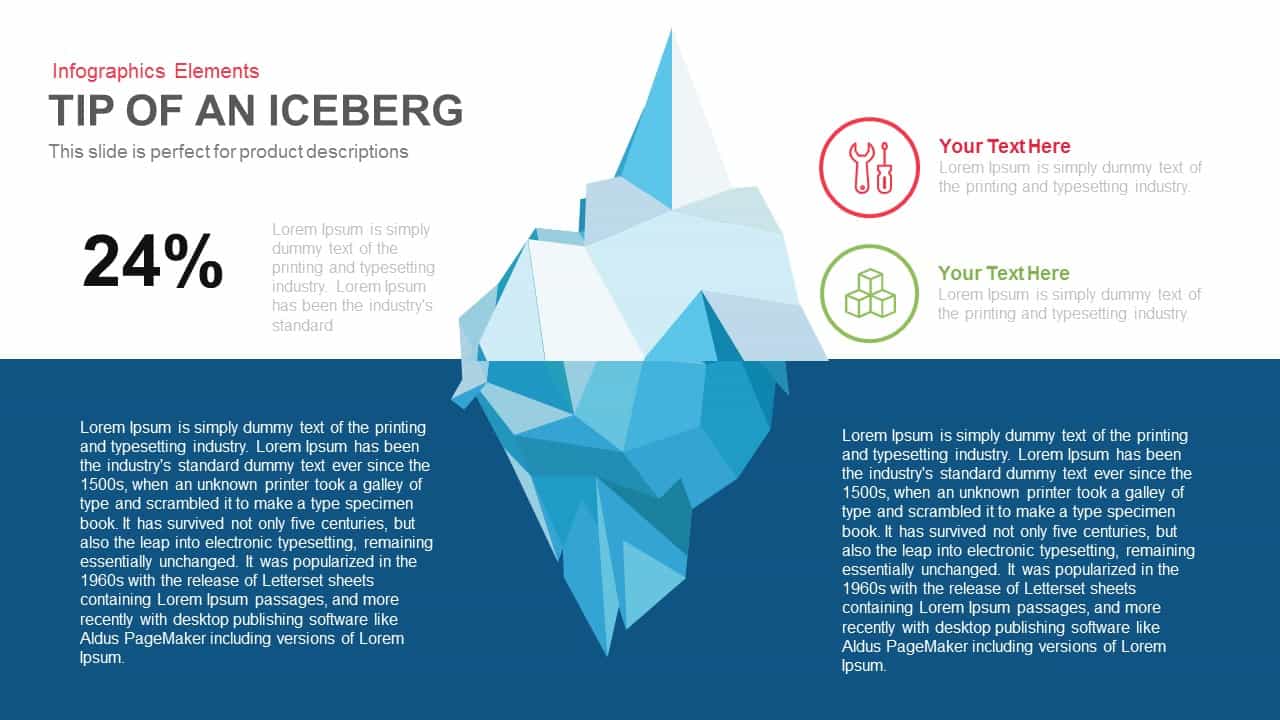
Tip of an Iceberg Infographic Diagram template for PowerPoint & Google Slides
Iceberg Charts
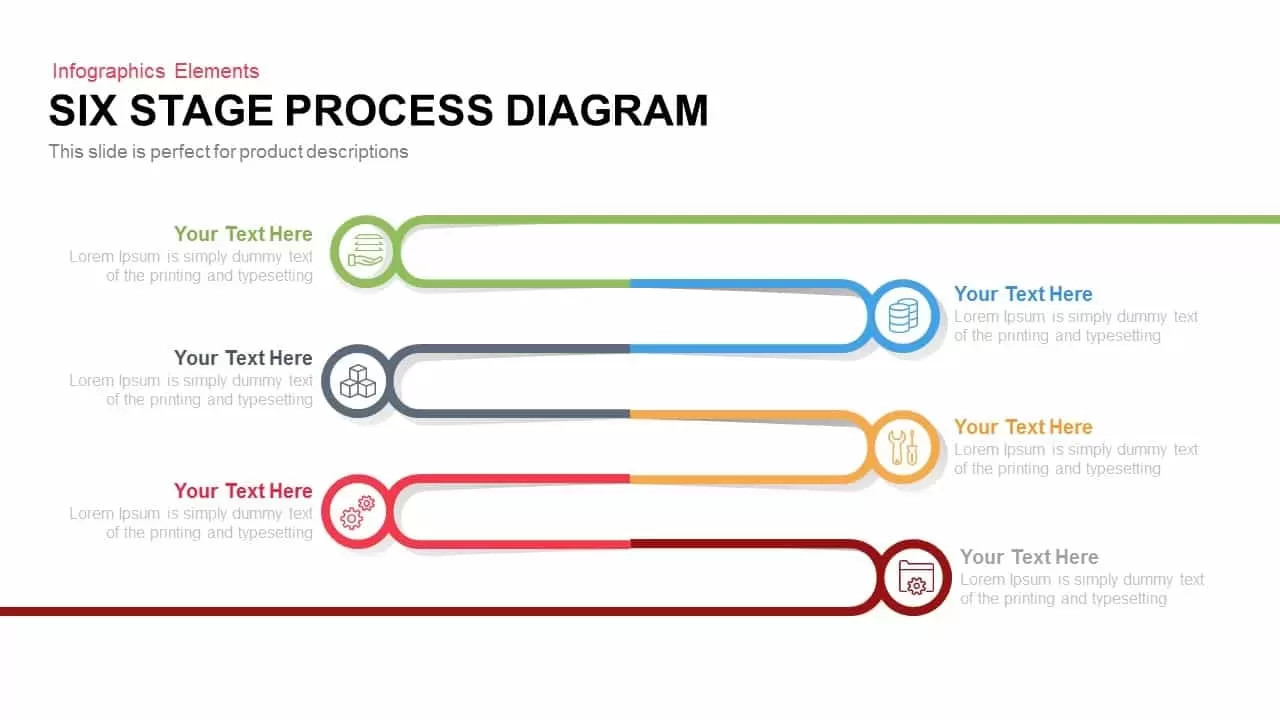
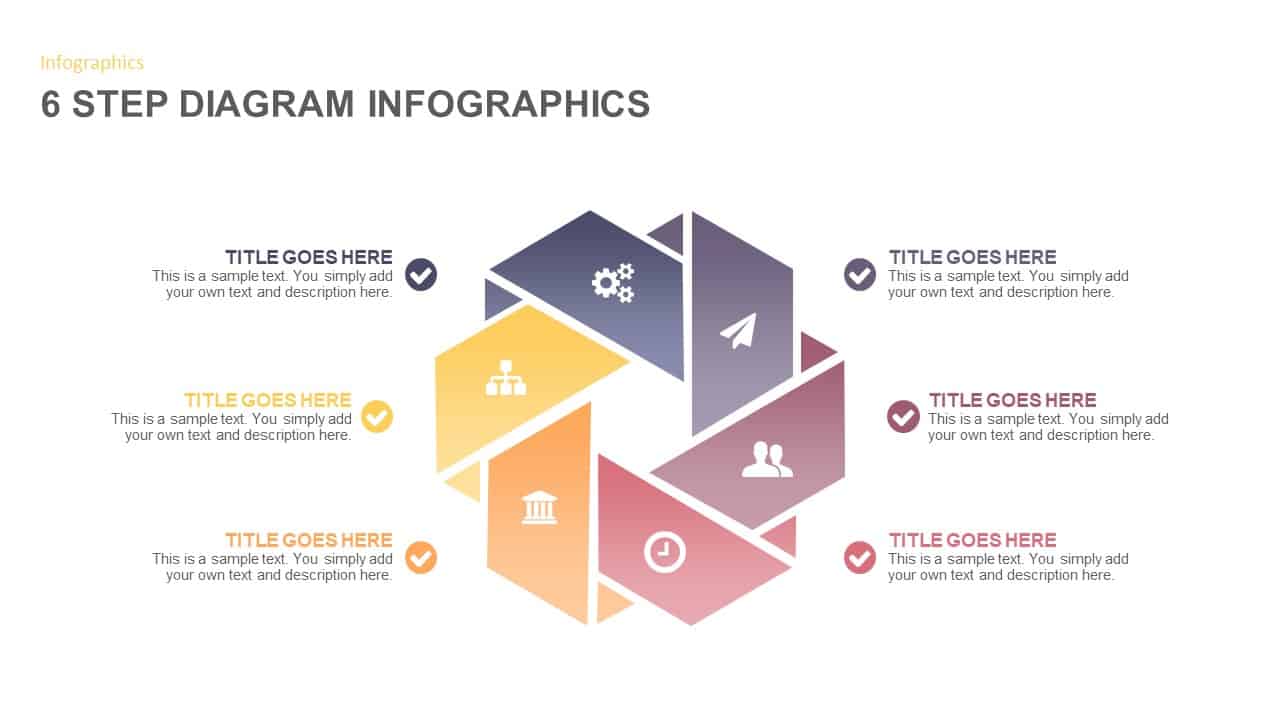
6 Stage Process Diagram Infographic Template for PowerPoint & Google Slides
Process
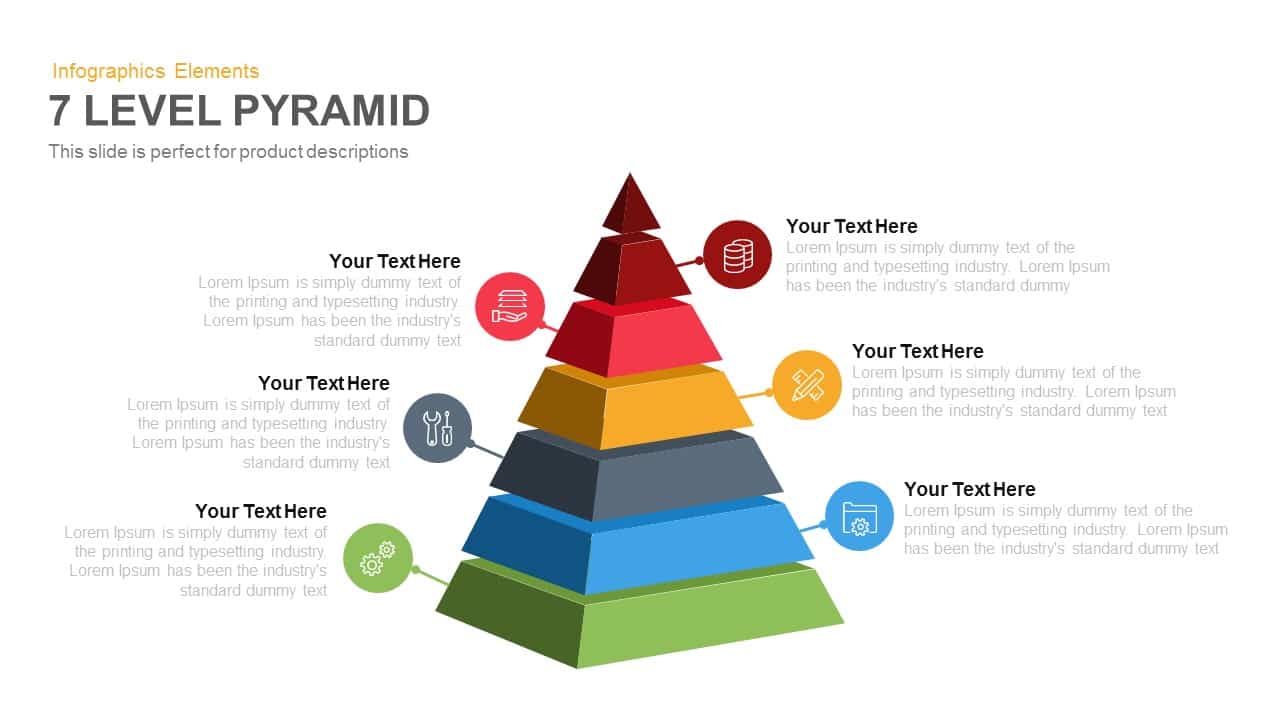
7-Level 3D Pyramid Infographic Diagram Template for PowerPoint & Google Slides
Pyramid
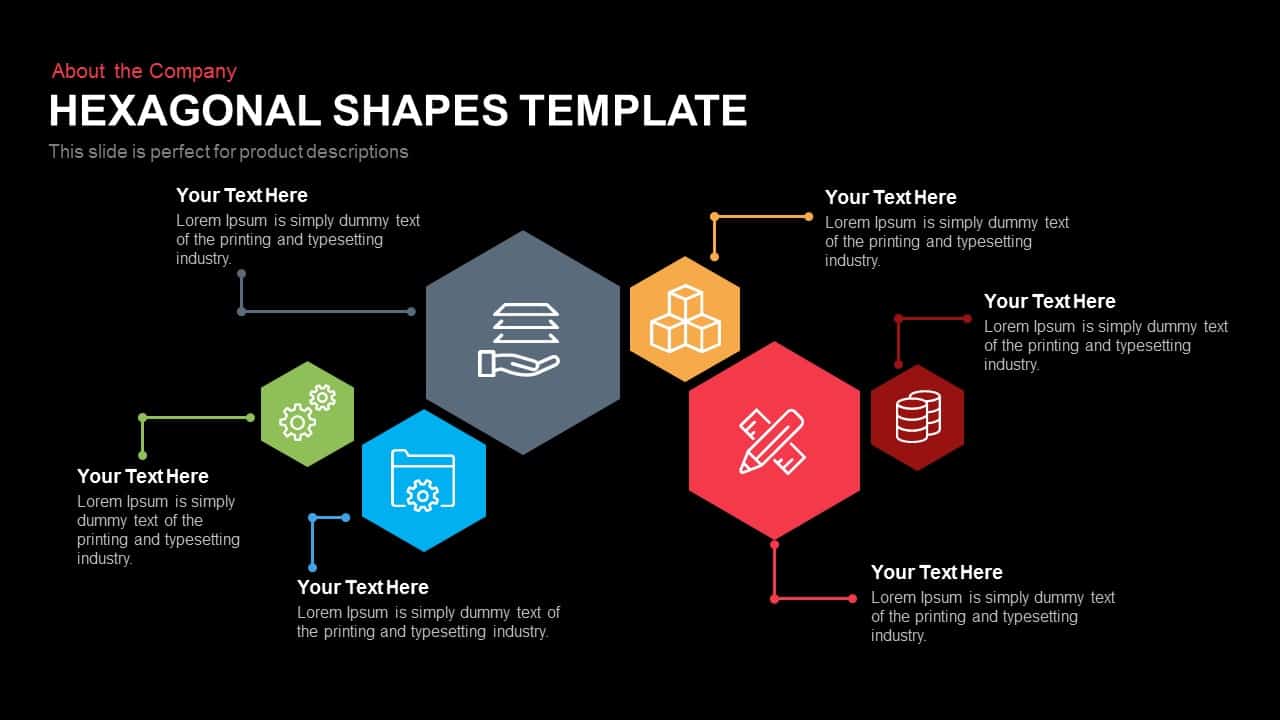
Hexagonal Shapes Infographic Diagram Template for PowerPoint & Google Slides
Process
Five Up Arrow Infographic Diagram Template for PowerPoint & Google Slides
Arrow
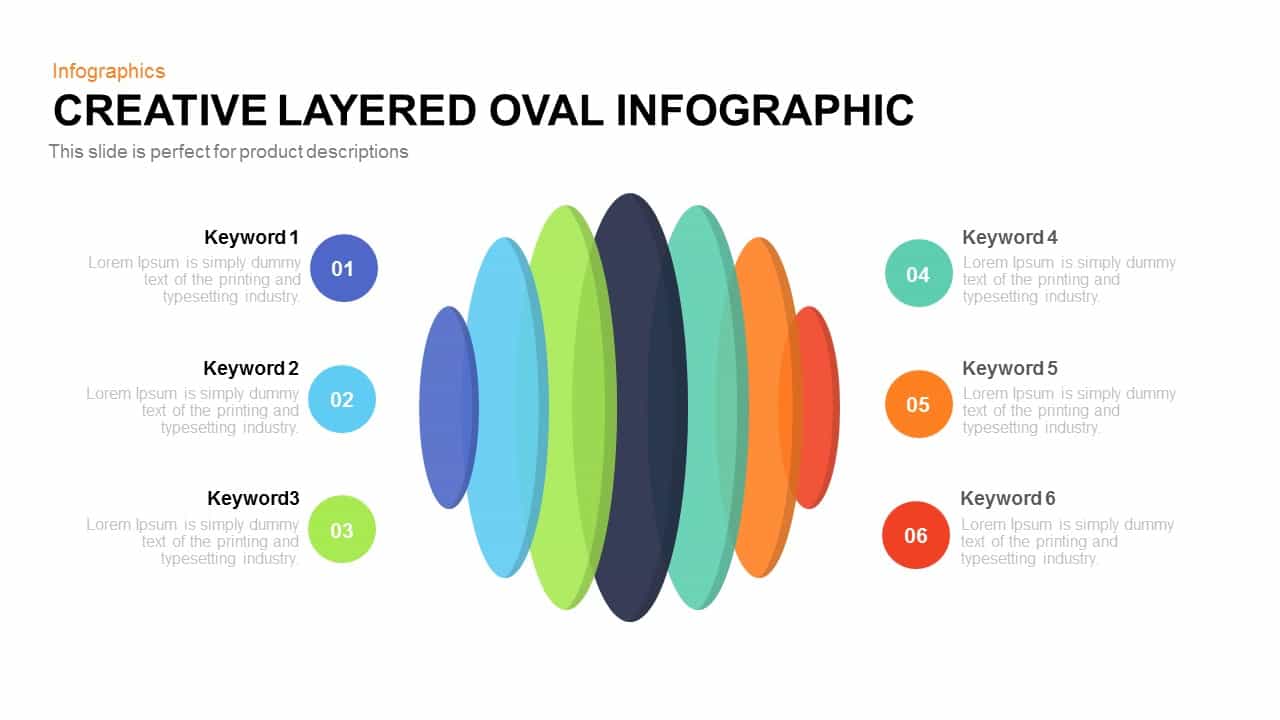
Creative Layered Oval Infographic Diagram Template for PowerPoint & Google Slides
Process
Six Section Circular Infographic Diagram Template for PowerPoint & Google Slides
Circular
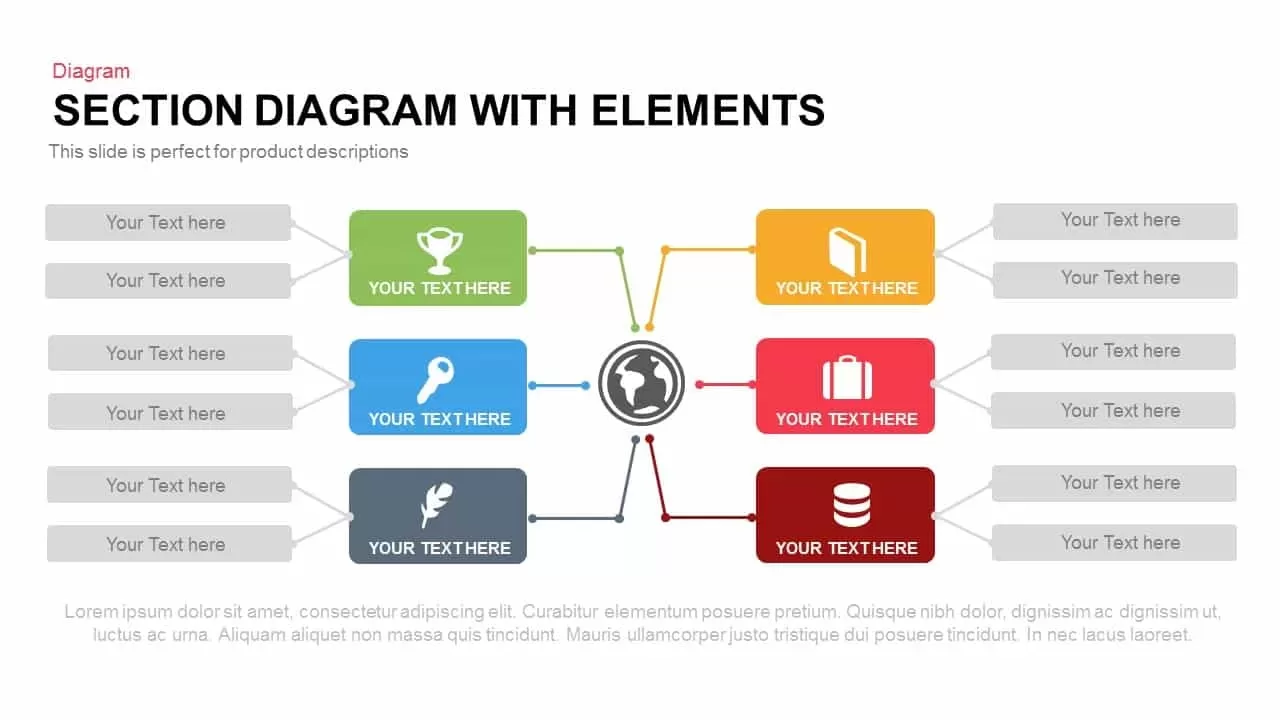
Section Diagram Elements Infographic Template for PowerPoint & Google Slides
Process

Cause and Effect Diagram Infographic Template for PowerPoint & Google Slides
Bar/Column
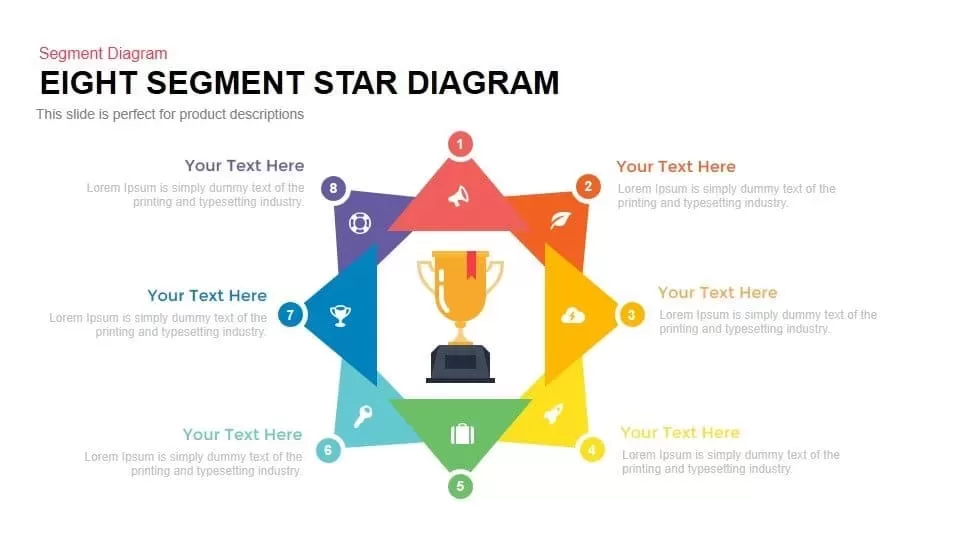
Eight Segment Star Diagram Infographic Template for PowerPoint & Google Slides
Process
Four-Stage Linear Infographic Diagram Template for PowerPoint & Google Slides
Process
Three-Circle Diagram Infographic Template for PowerPoint & Google Slides
Circular
Five Stage Process Diagram Infographic Template for PowerPoint & Google Slides
Process
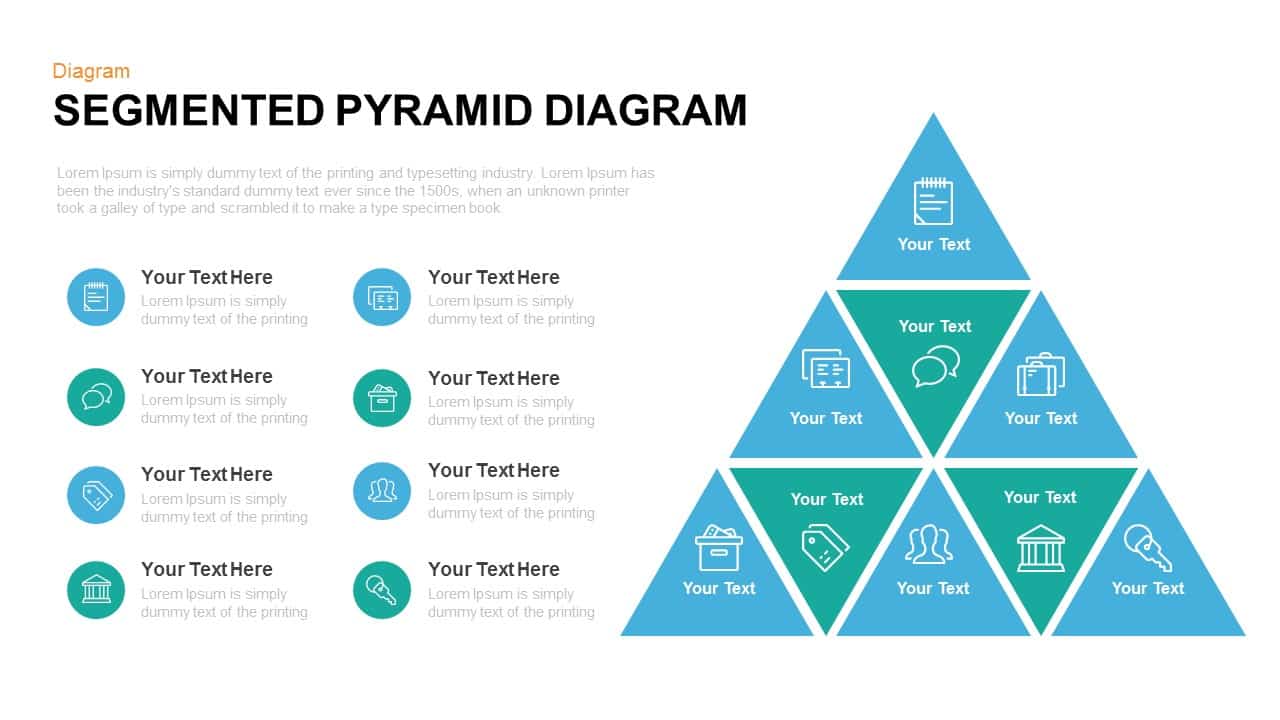
Segmented Pyramid Diagram Infographic Template for PowerPoint & Google Slides
Pyramid
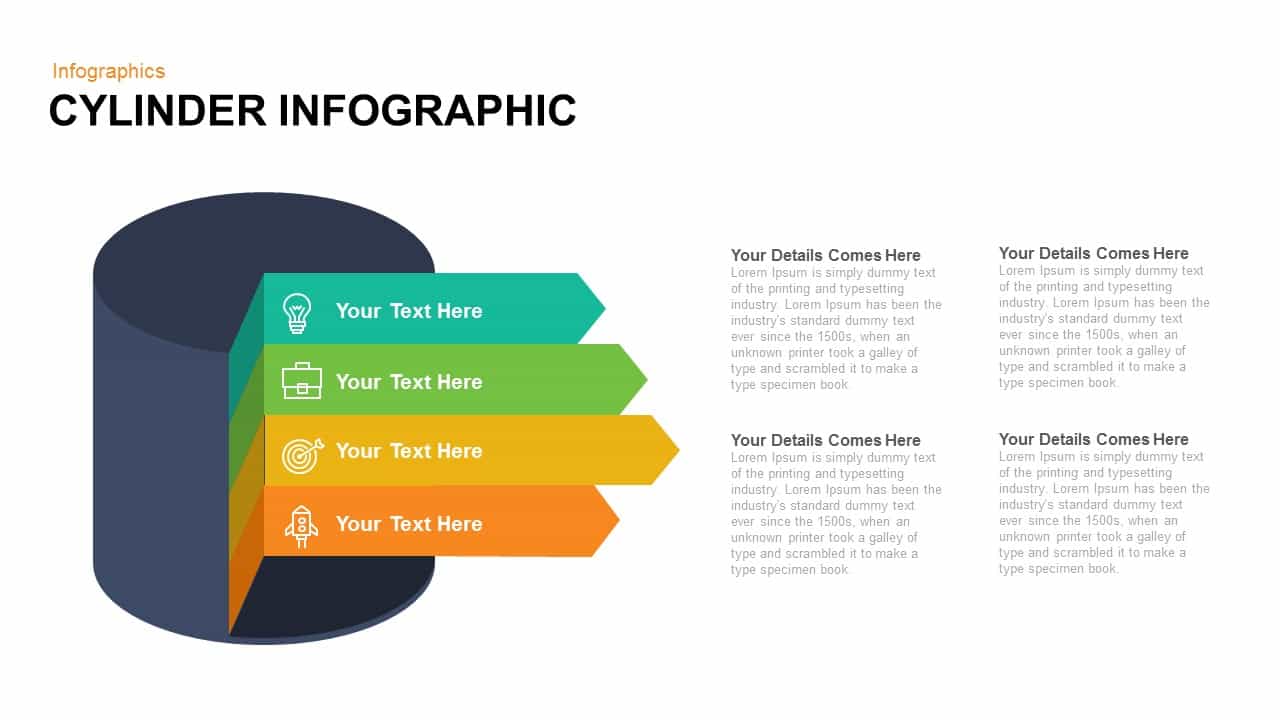
Cylinder Infographic Diagram template for PowerPoint & Google Slides
Process
Four-Section Arrow Infographic Diagram Template for PowerPoint & Google Slides
Arrow
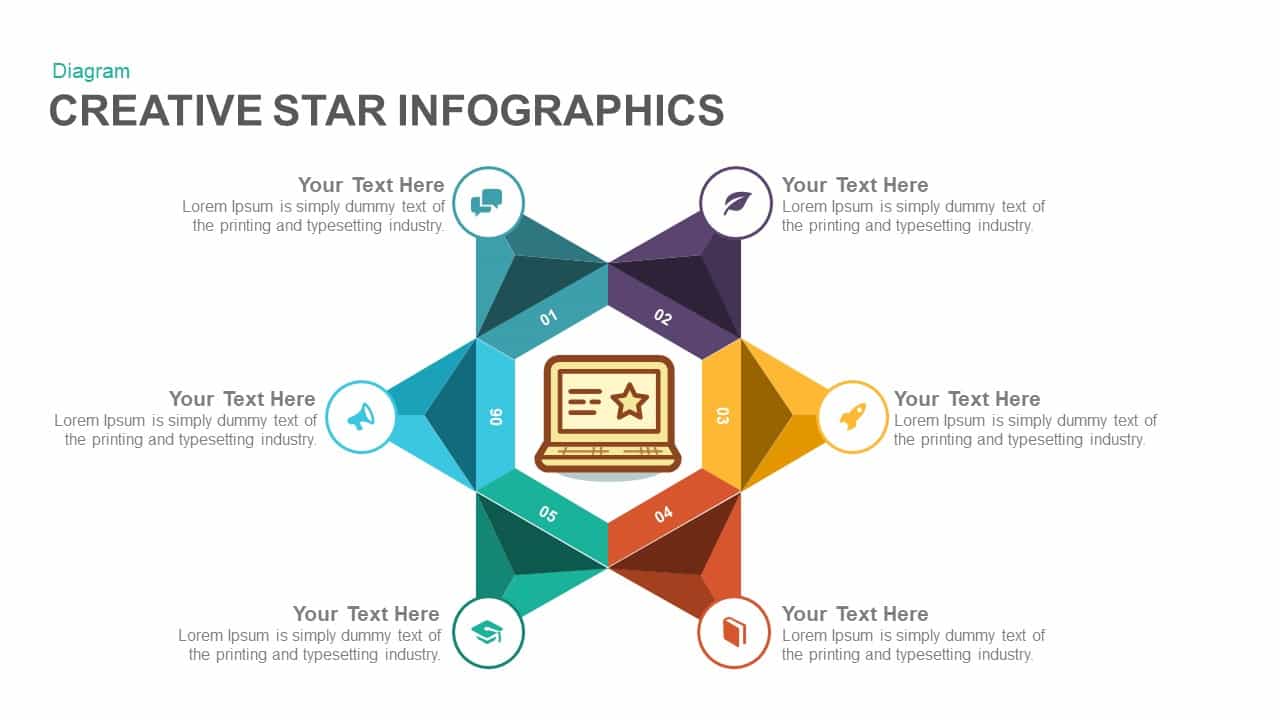
Six-Section Star Infographic Diagram Template for PowerPoint & Google Slides
Circular
Eight-Step Circular Diagram Infographic Template for PowerPoint & Google Slides
Circular
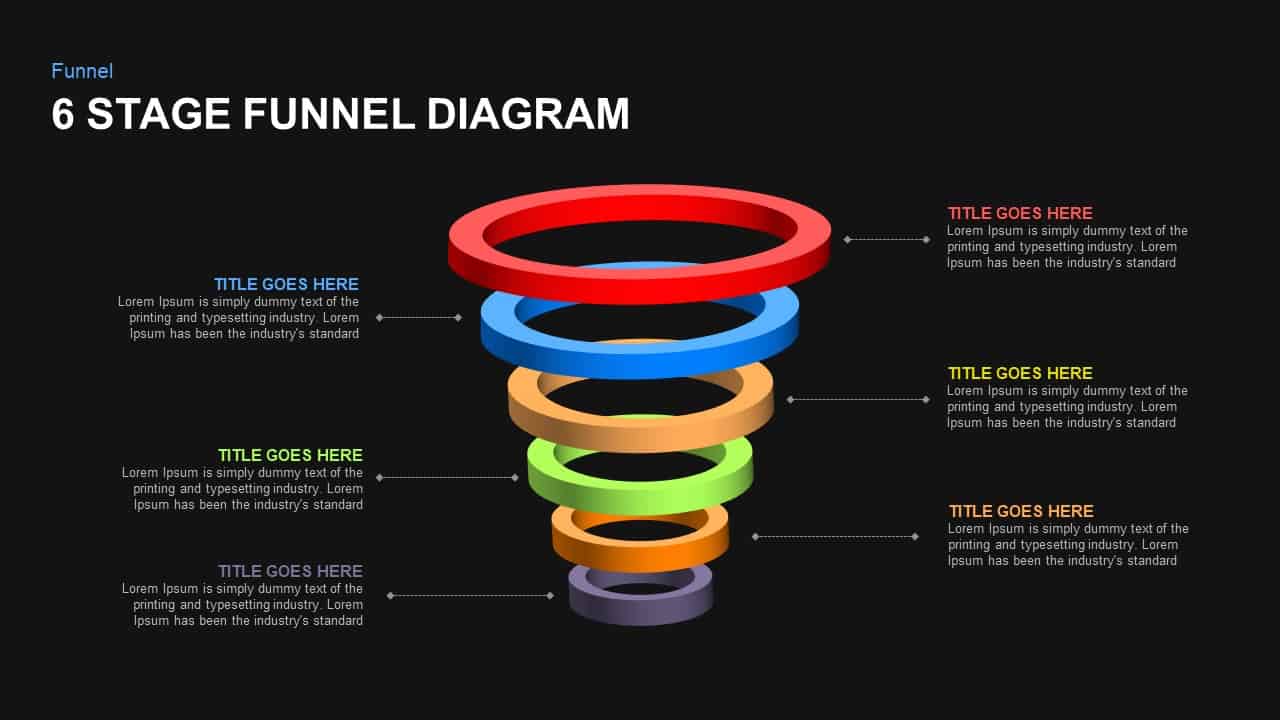
6-Stage Funnel Diagram Infographic Template for PowerPoint & Google Slides
Funnel
Cluster Analysis Infographic Diagram Template for PowerPoint & Google Slides
Business
3D Conversion Funnel Diagram Infographic Template for PowerPoint & Google Slides
Funnel
Social Network Infographic Diagram Template for PowerPoint & Google Slides
Digital Marketing
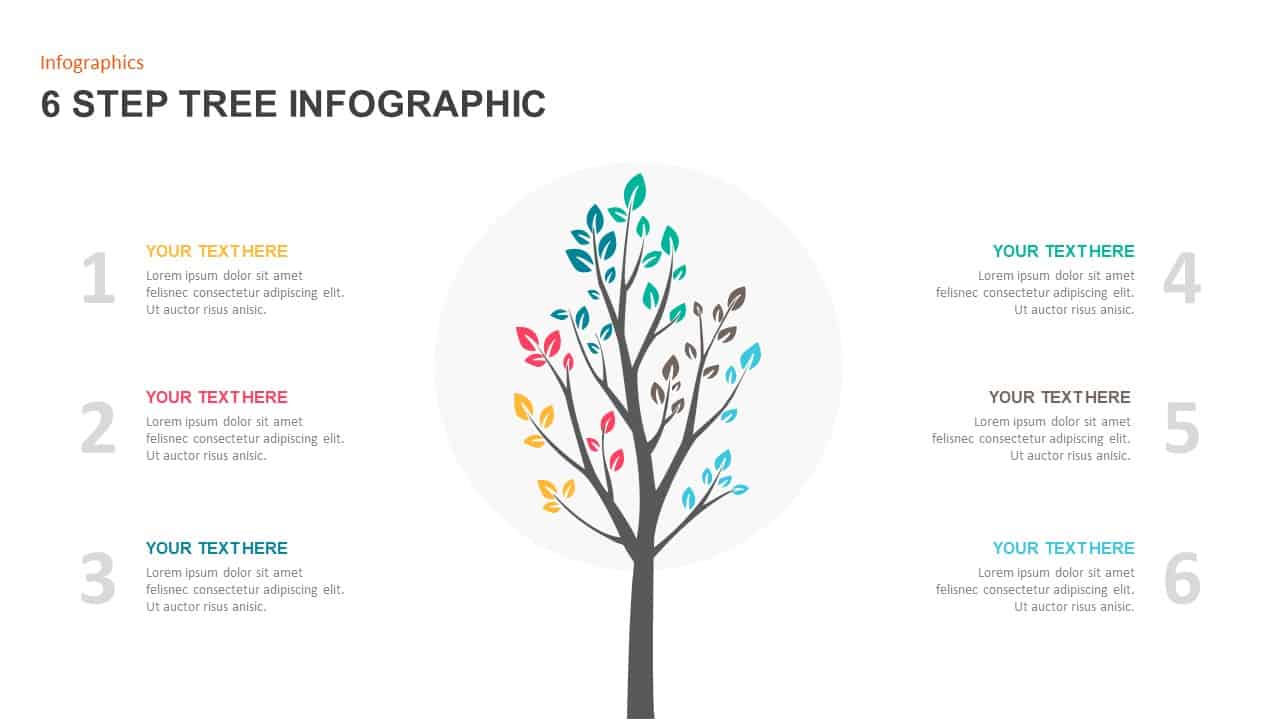
Creative Tree Infographic Diagram Template for PowerPoint & Google Slides
Infographics
Five-Stage Circular Infographic Diagram Template for PowerPoint & Google Slides
Process
Four-Stage Circular Diagram Infographic Template for PowerPoint & Google Slides
Circular
Business Services Infographic Diagram Template for PowerPoint & Google Slides
Infographics
4 Factors Circular Diagram Infographic Template for PowerPoint & Google Slides
Circular
Circular CRM Process Diagram Infographic Template for PowerPoint & Google Slides
Circular
5 Key Points Infographic Diagram Template for PowerPoint & Google Slides
Process
Circular Three-Step Infographic Diagram Template for PowerPoint & Google Slides
Circular
Six-Stage Star Diagram Infographic Template for PowerPoint & Google Slides
Process
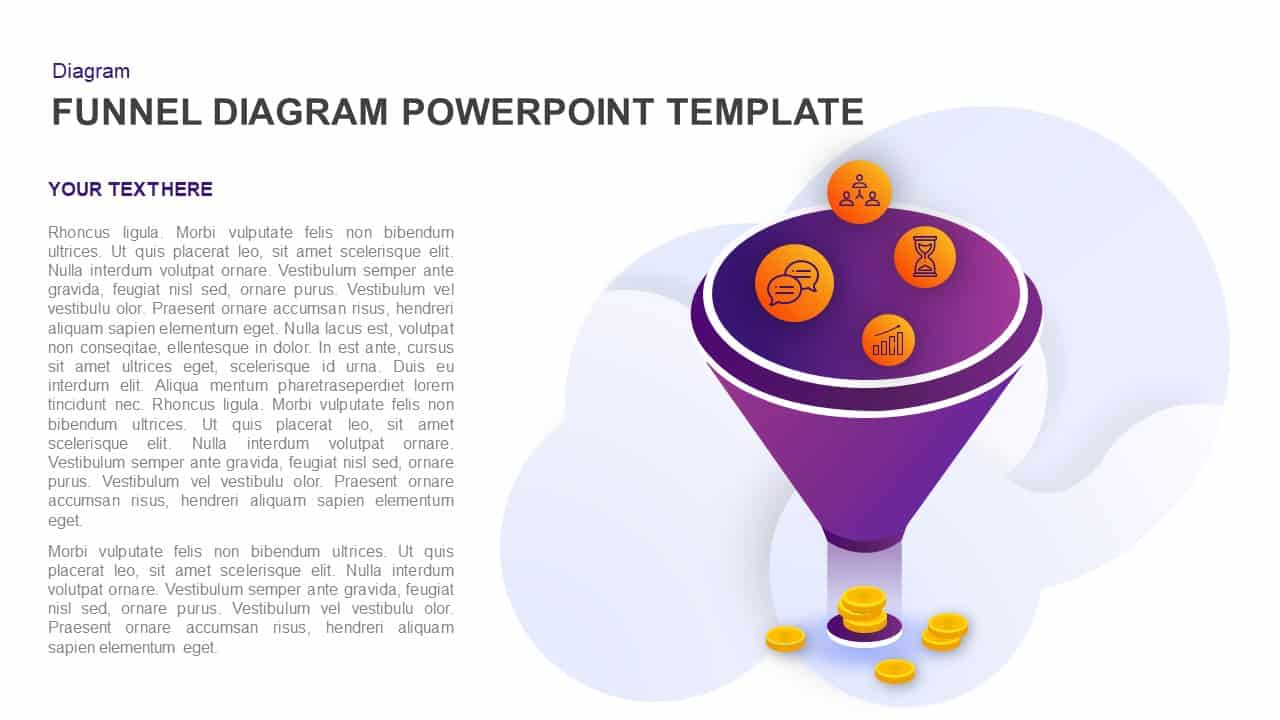
Four-Stage Funnel Diagram Infographic Template for PowerPoint & Google Slides
Funnel
3D Block Arrow Infographic Diagram Template for PowerPoint & Google Slides
Arrow
6-Step Circular Diagram Infographic Template for PowerPoint & Google Slides
Circular
8-Step Circular Gear Infographic Diagram Template for PowerPoint & Google Slides
Circular
Creative Tree Diagram Infographic Template for PowerPoint & Google Slides
Decision Tree
Six Sigma 6S Process Infographic Diagram Template for PowerPoint & Google Slides
Process
Six-Step Tree Diagram Infographic Template for PowerPoint & Google Slides
Infographics
Six-Circle Process Infographic Diagram Template for PowerPoint & Google Slides
Circular
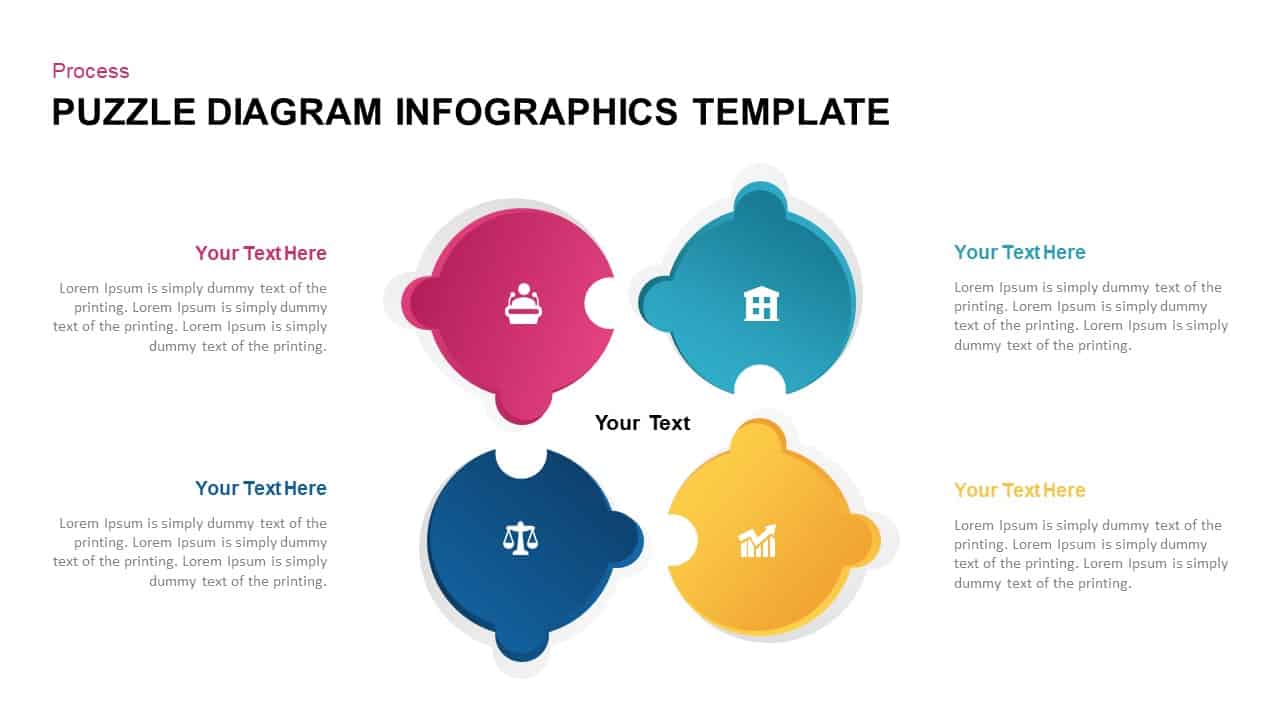
Four-Step Puzzle Diagram Infographic Template for PowerPoint & Google Slides
Process
Four-Stage Funnel Diagram Infographic Template for PowerPoint & Google Slides
Funnel
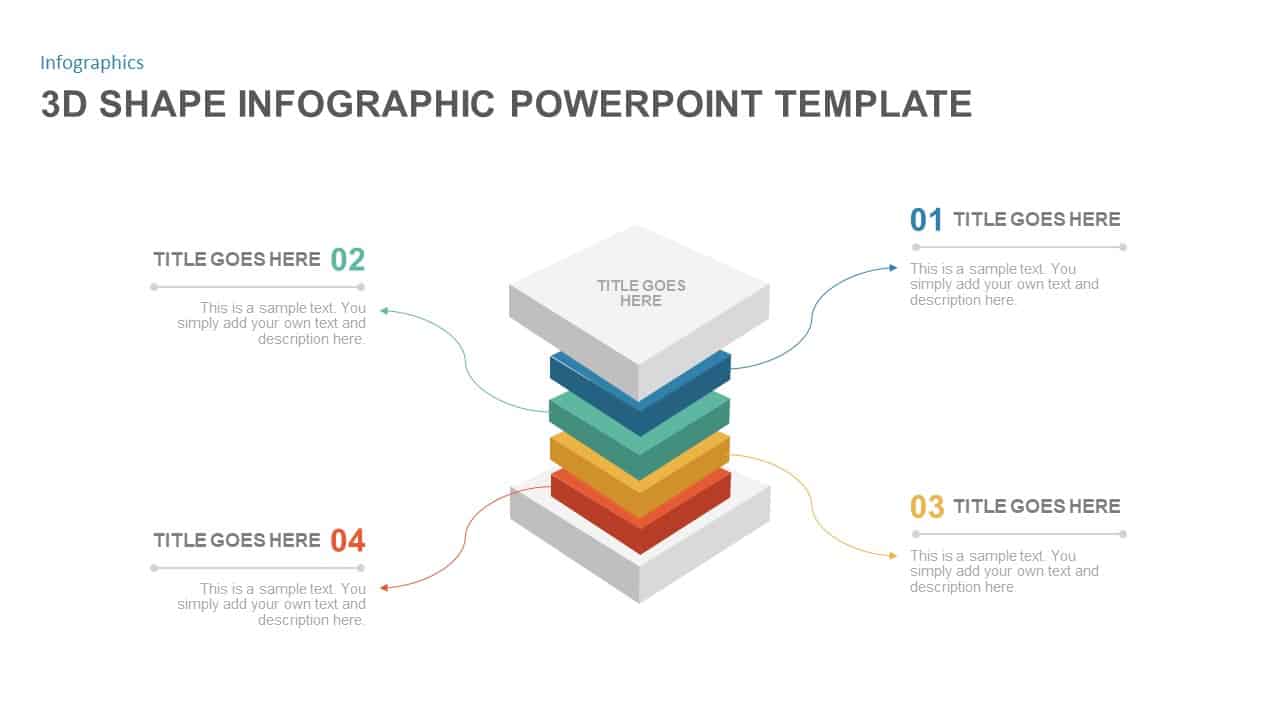
3D Layered Infographic Diagram Template for PowerPoint & Google Slides
Infographics
Modern Gear Venn Diagram Infographic Template for PowerPoint & Google Slides
Comparison
6-Part Circular Gear Infographic Diagram Template for PowerPoint & Google Slides
Process

Four Section Infographic Diagram Template for PowerPoint & Google Slides
Circular
SWOT Analysis Infographic Diagram Template for PowerPoint & Google Slides
SWOT
Circular CRM Process Infographic Diagram Template for PowerPoint & Google Slides
Circular
3 Section Infographic Diagram Template for PowerPoint & Google Slides
Process
IT Strategic Diagram Infographic Pack Template for PowerPoint & Google Slides
Business Strategy
4-Step Circular Infographic Diagram Template for PowerPoint & Google Slides
Circular
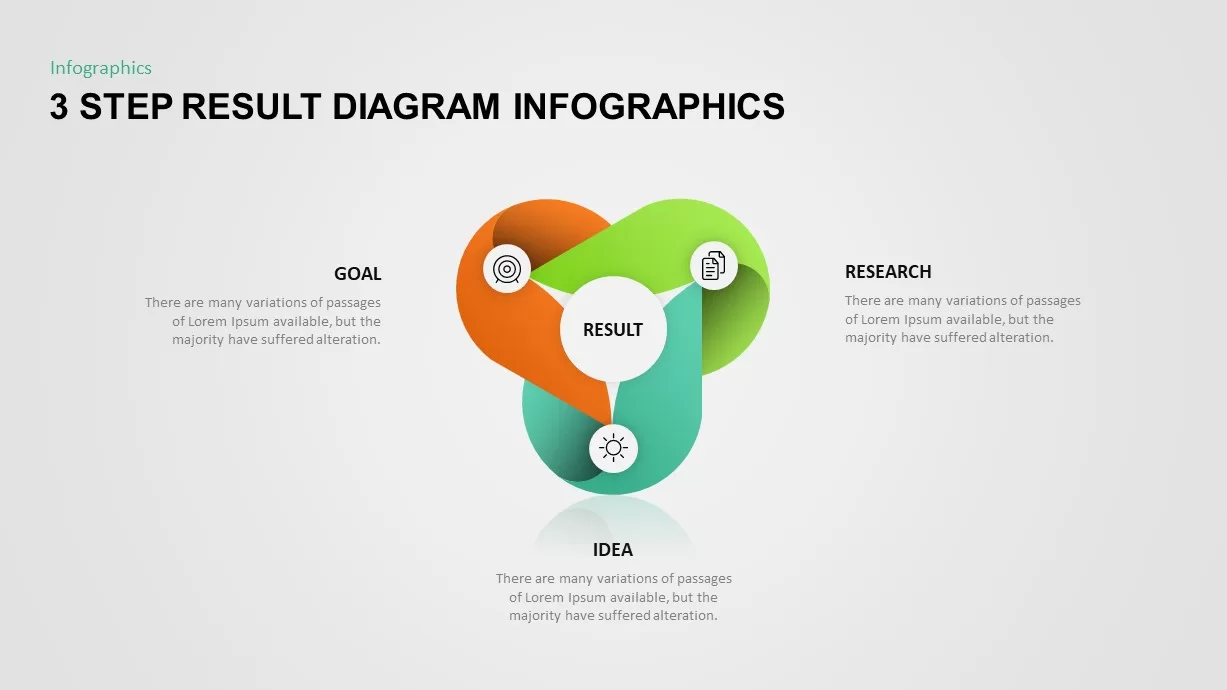
Three-Step Result Diagram Infographic Template for PowerPoint & Google Slides
Process
Eight-Node Mind Map Infographic Diagram Template for PowerPoint & Google Slides
Mind Maps
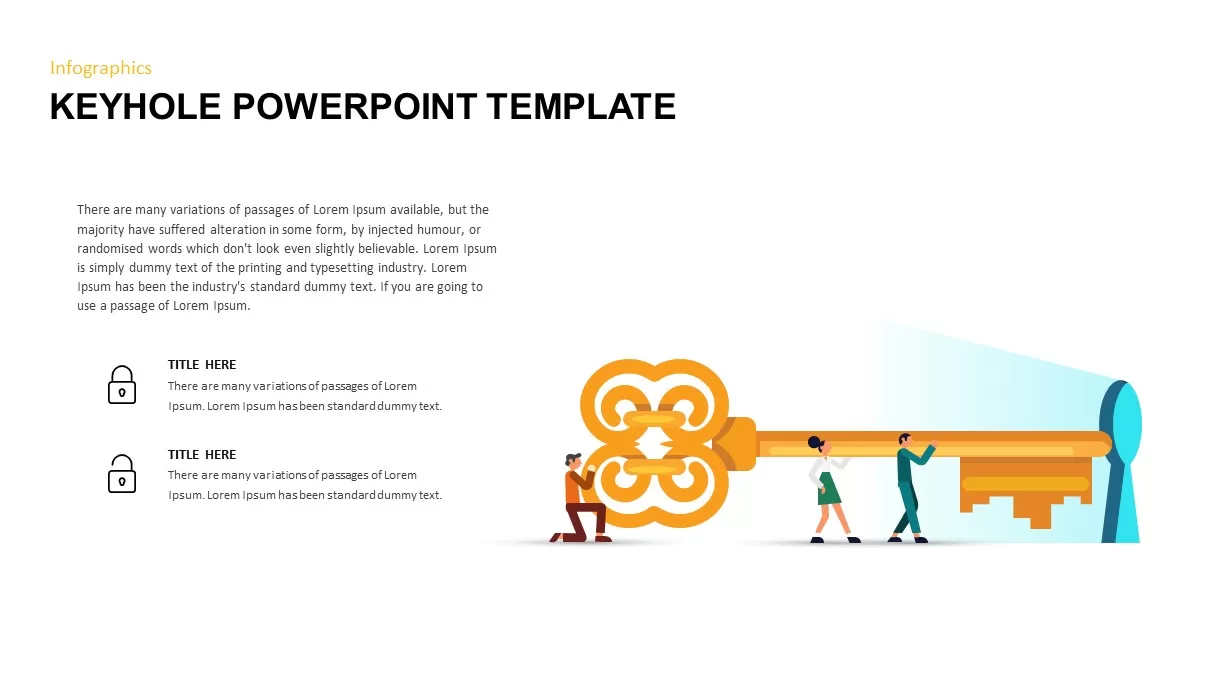
Keyhole Infographic Process Diagram Template for PowerPoint & Google Slides
Process
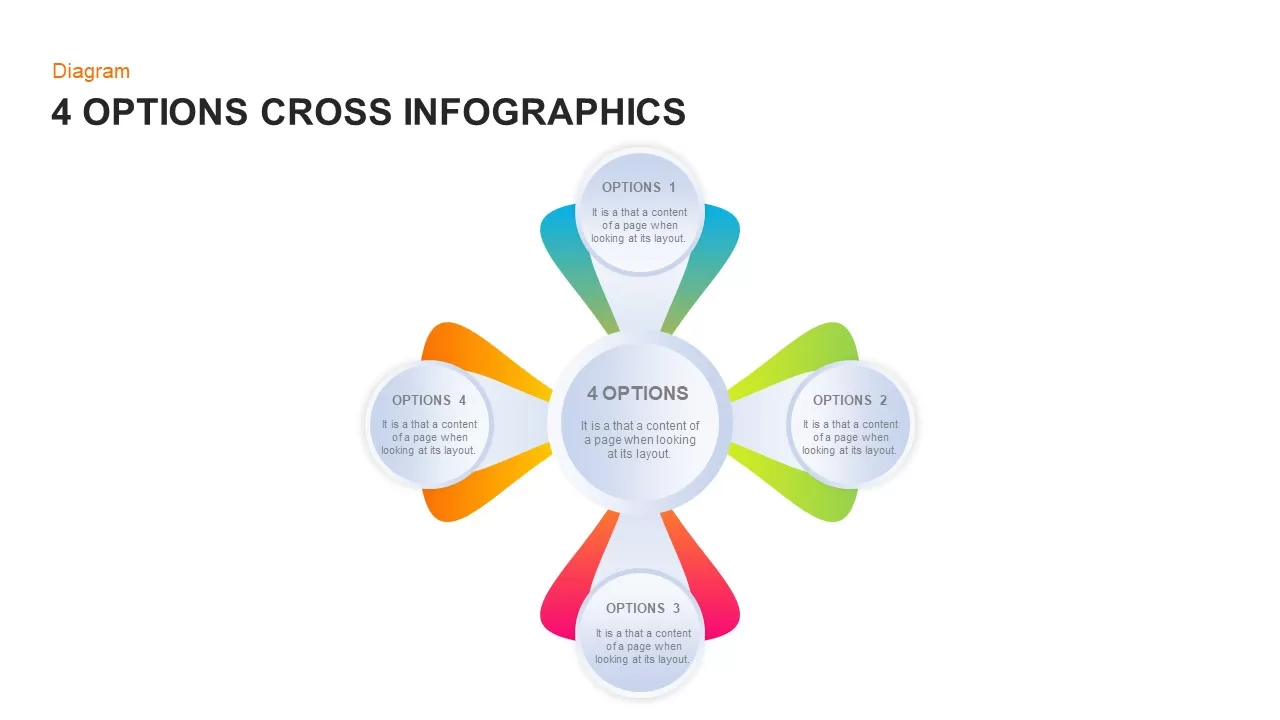
Four-Option Cross Infographic Diagram Template for PowerPoint & Google Slides
Comparison
Modern 6 Step Infographic Diagram template for PowerPoint & Google Slides
Process
Gauge Shape 5-Step Infographic Diagram Template for PowerPoint & Google Slides
Process
Creative Tree Diagram Infographic Template for PowerPoint & Google Slides
Decision Tree
Sales Funnel Infographic Diagram Template for PowerPoint & Google Slides
Funnel
Affinity Diagram Infographic Template for PowerPoint & Google Slides
Business
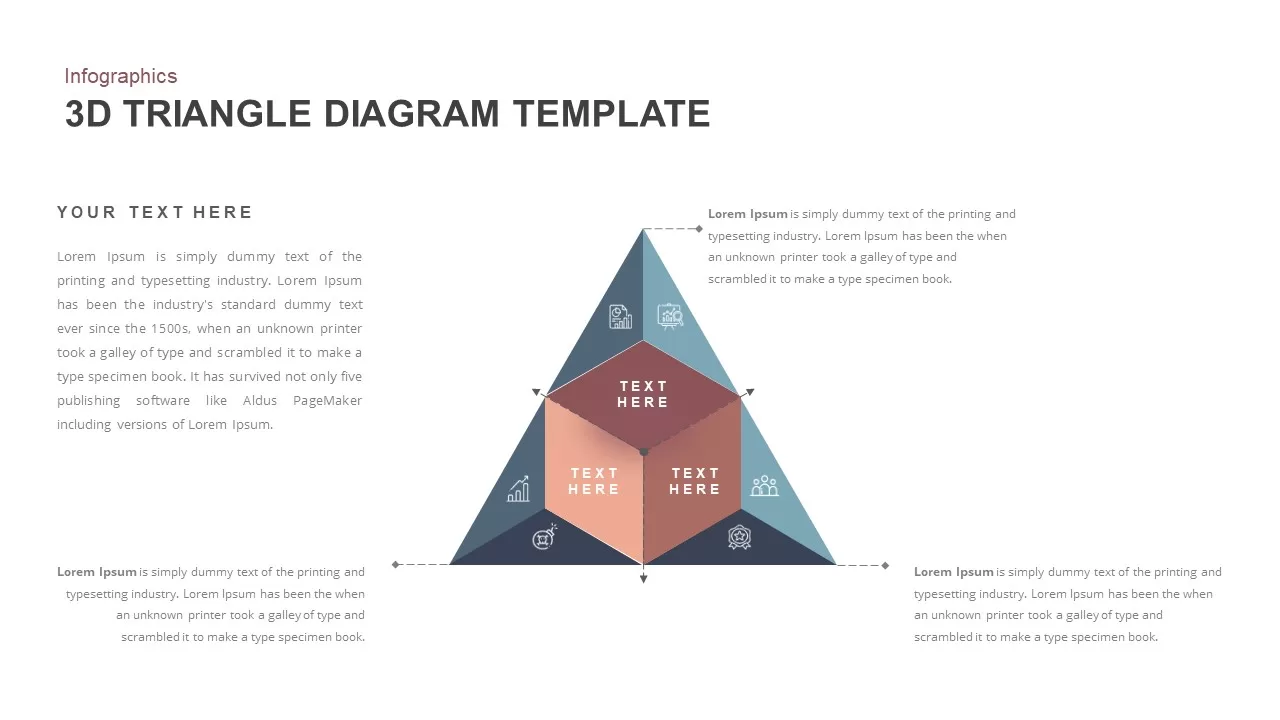
3D Triangle Diagram Infographic Template for PowerPoint & Google Slides
Pyramid
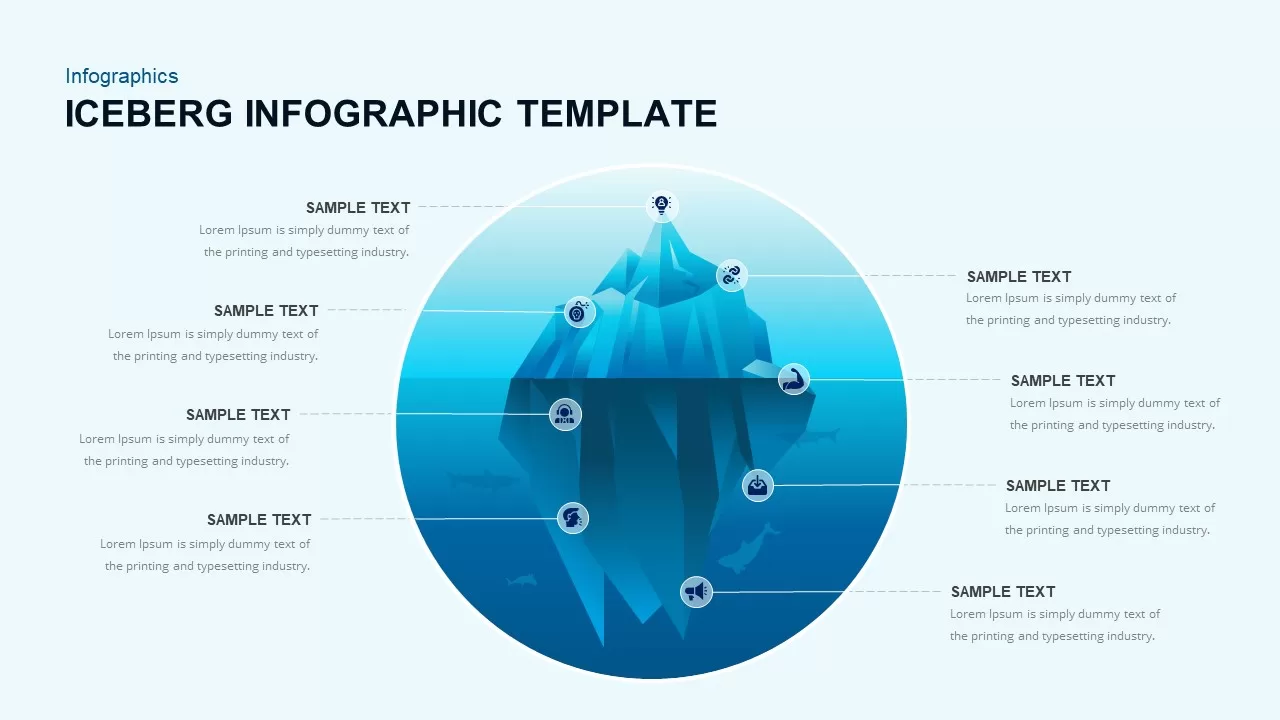
Iceberg Infographic Diagram template for PowerPoint & Google Slides
Opportunities Challenges
Structured Mind Map Infographic Diagram Template for PowerPoint & Google Slides
Mind Maps
Minimal Process Flow Diagram Infographic Template for PowerPoint & Google Slides
Process
Free Curved Arrow Infographic Diagram Template for PowerPoint & Google Slides
Arrow
Free
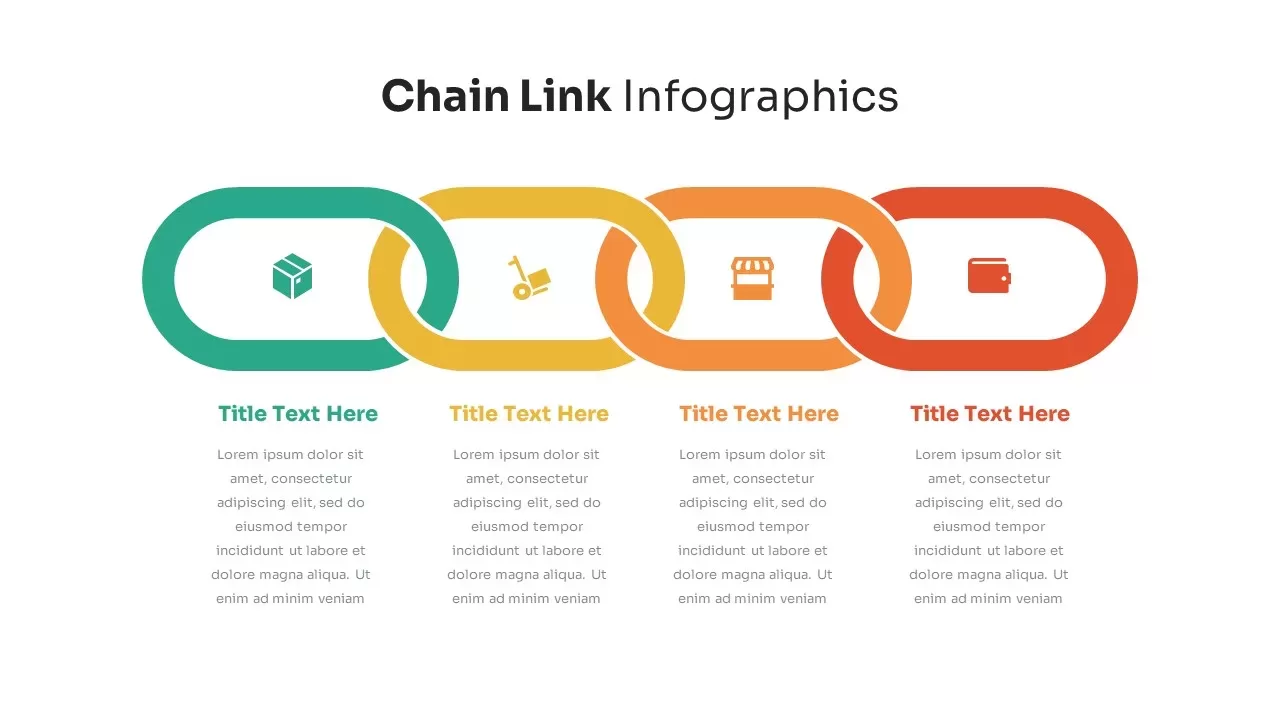
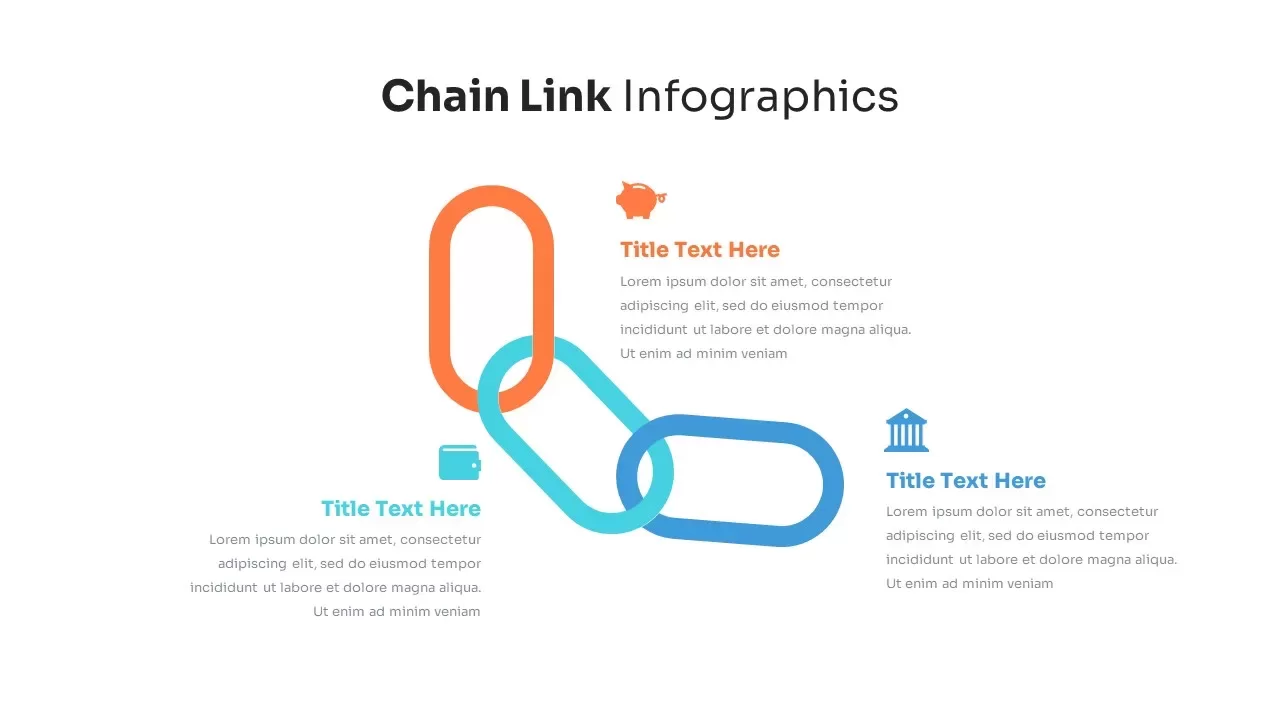
Chain Link Process Infographic Diagram Template for PowerPoint & Google Slides
Process
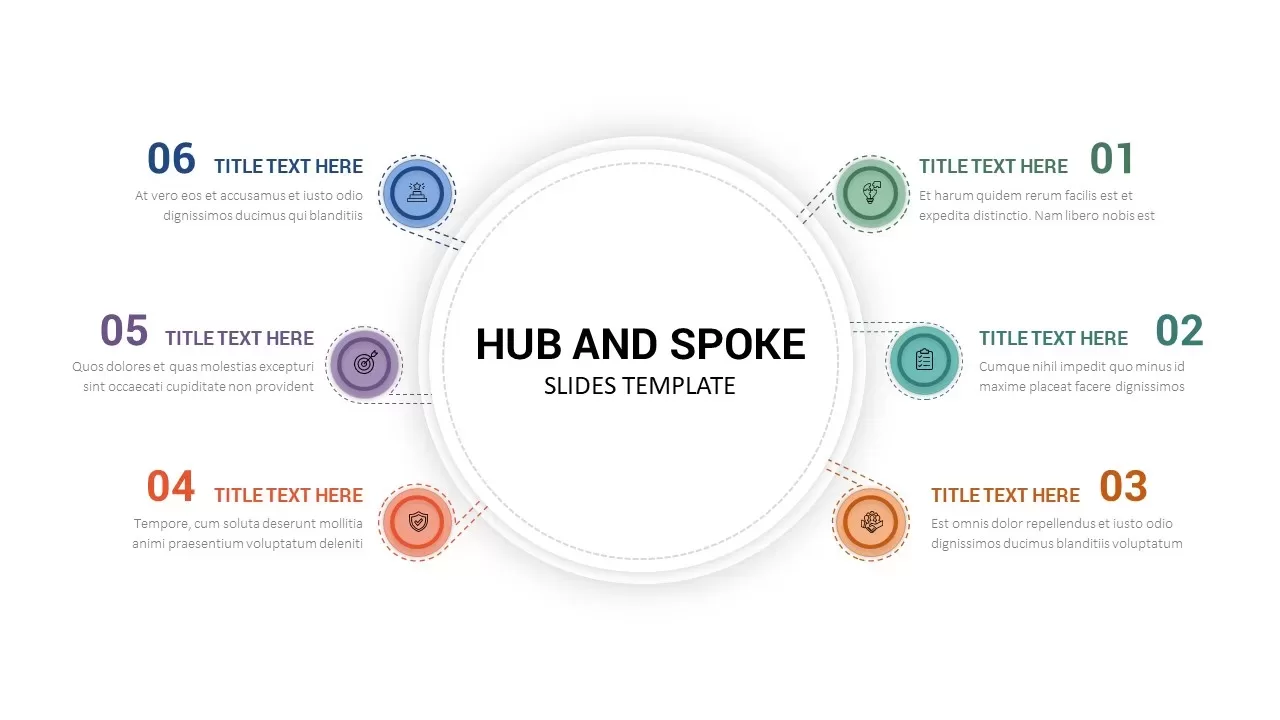
Hub & Spoke Infographic Diagram Template for PowerPoint & Google Slides
Process
Chain Link Process Infographic Diagram Template for PowerPoint & Google Slides
Process
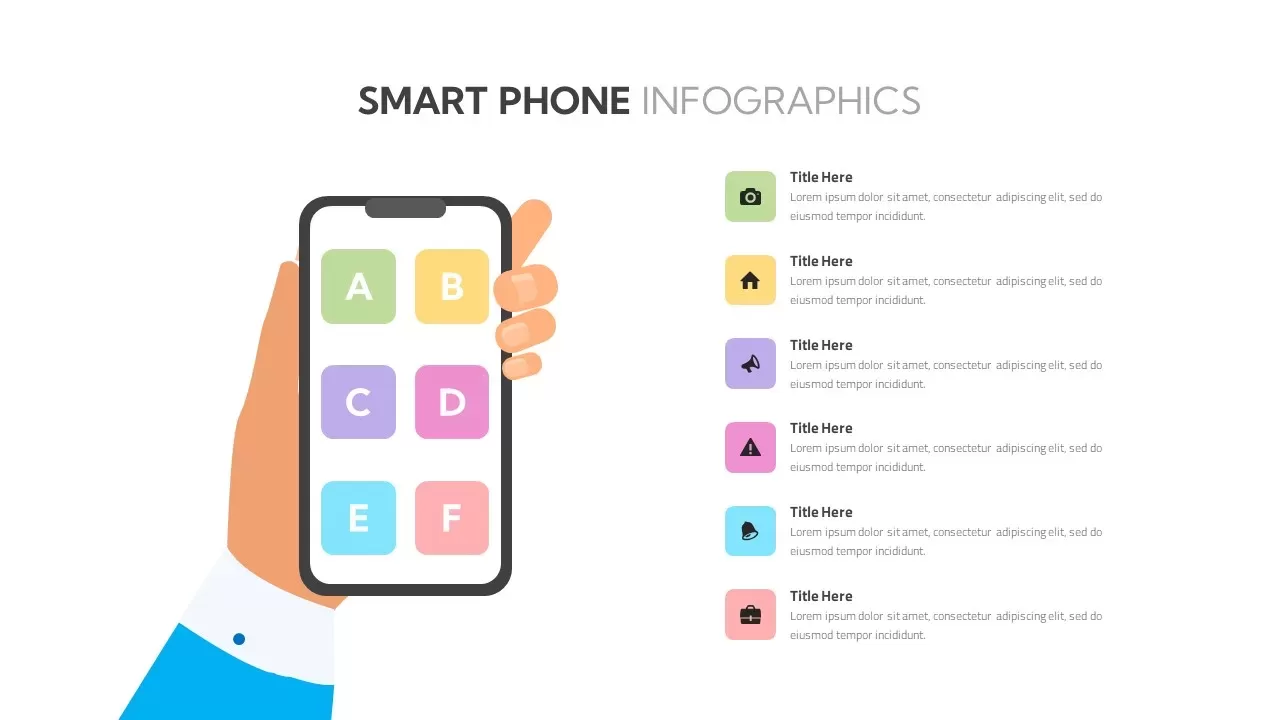
Smartphone Infographic Diagram Template for PowerPoint & Google Slides
Comparison
Chain Link Process Infographic Diagram Template for PowerPoint & Google Slides
Process
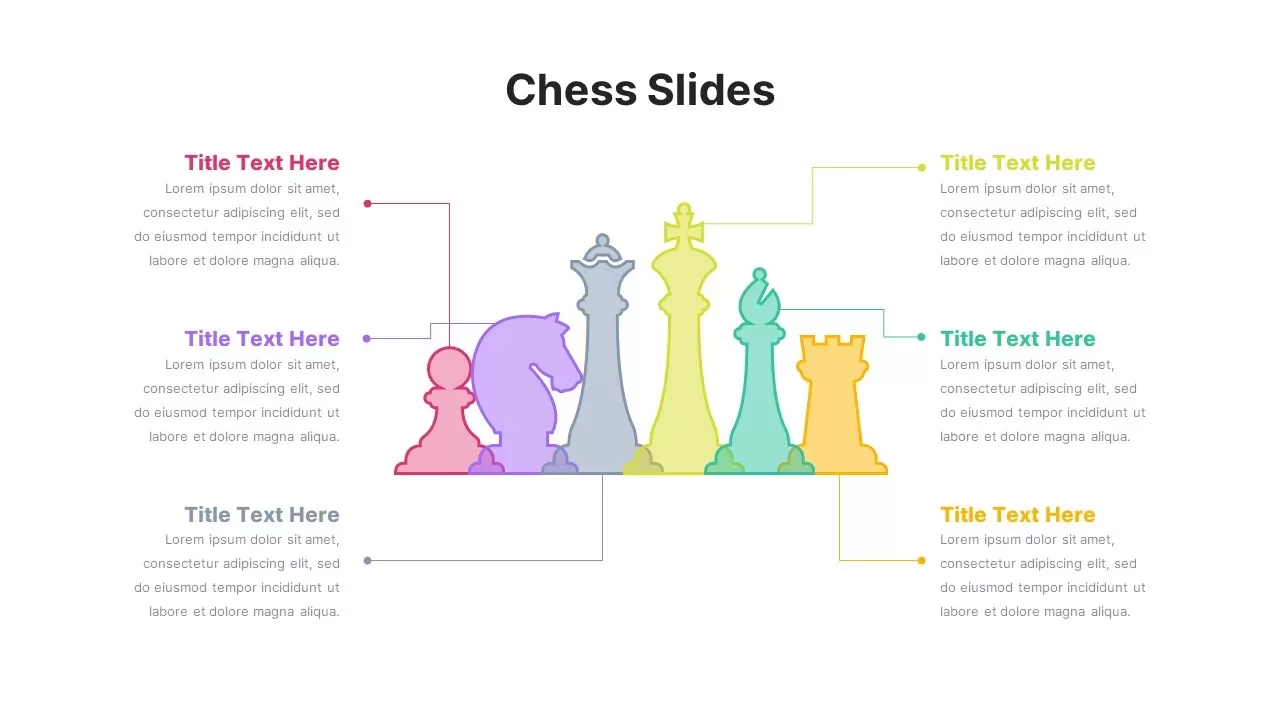
Modern Chess Infographic Diagram Template for PowerPoint & Google Slides
Comparison
Dynamic Hub-and-Spoke Infographic Diagram Template for PowerPoint & Google Slides
Circular
Key Takeaway Infographic Keyhole Diagram Template for PowerPoint & Google Slides
Process
Onion Layer Infographic Diagram Template for PowerPoint & Google Slides
Process
Five-Layer Onion Diagram Infographic Template for PowerPoint & Google Slides
Process
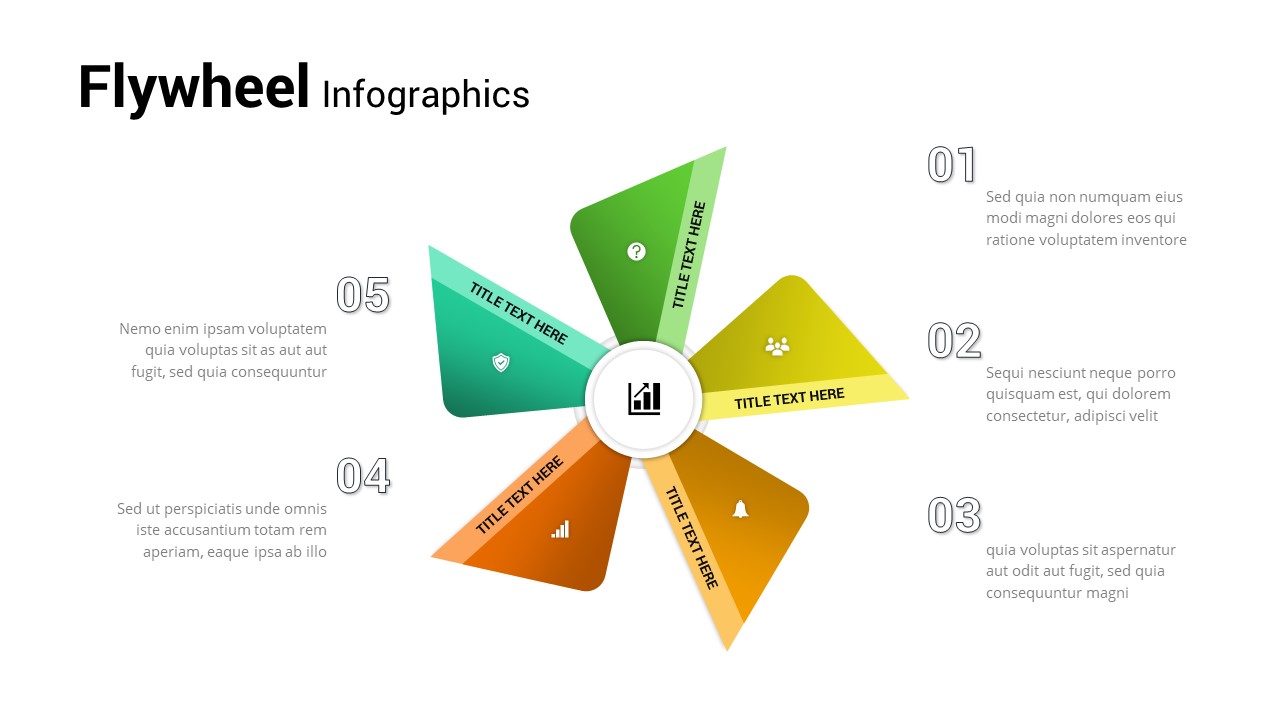
Five-Step Flywheel Infographic Diagram Template for PowerPoint & Google Slides
Process
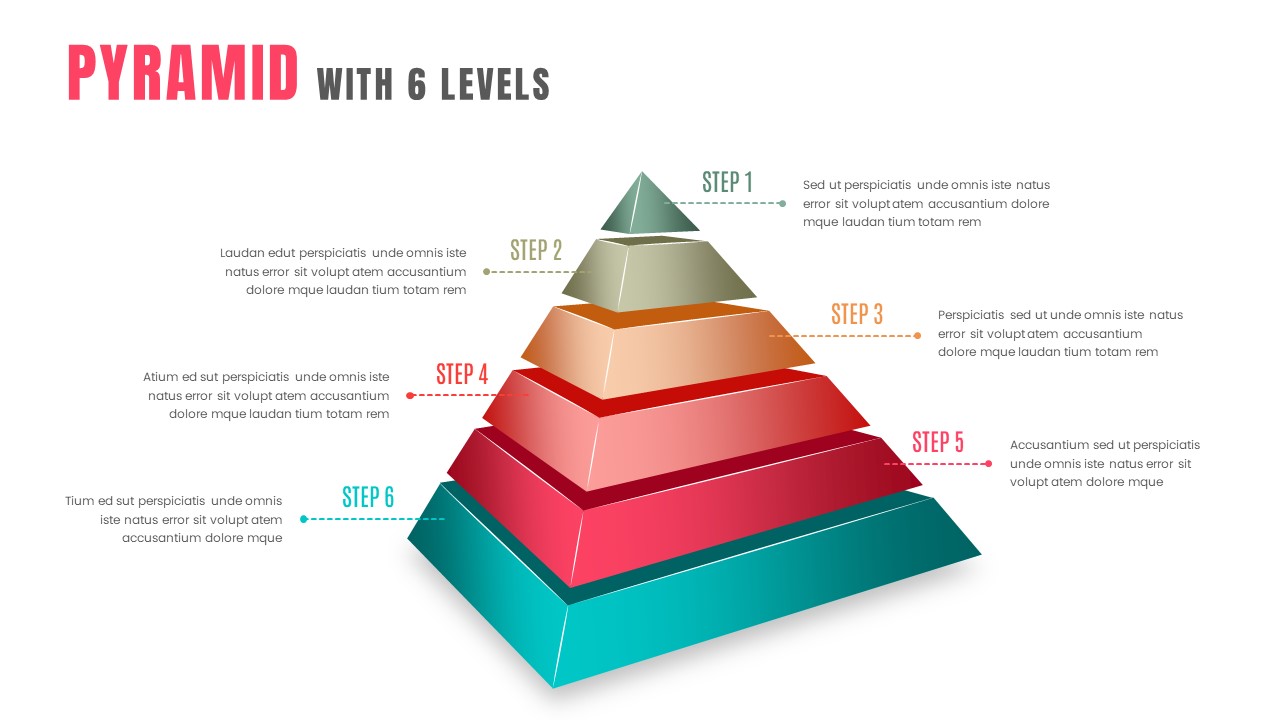
3D Six-Level Pyramid Diagram Infographic Template for PowerPoint & Google Slides
Pyramid
8 Circle Venn Diagram Infographic Design Template for PowerPoint & Google Slides
Circular
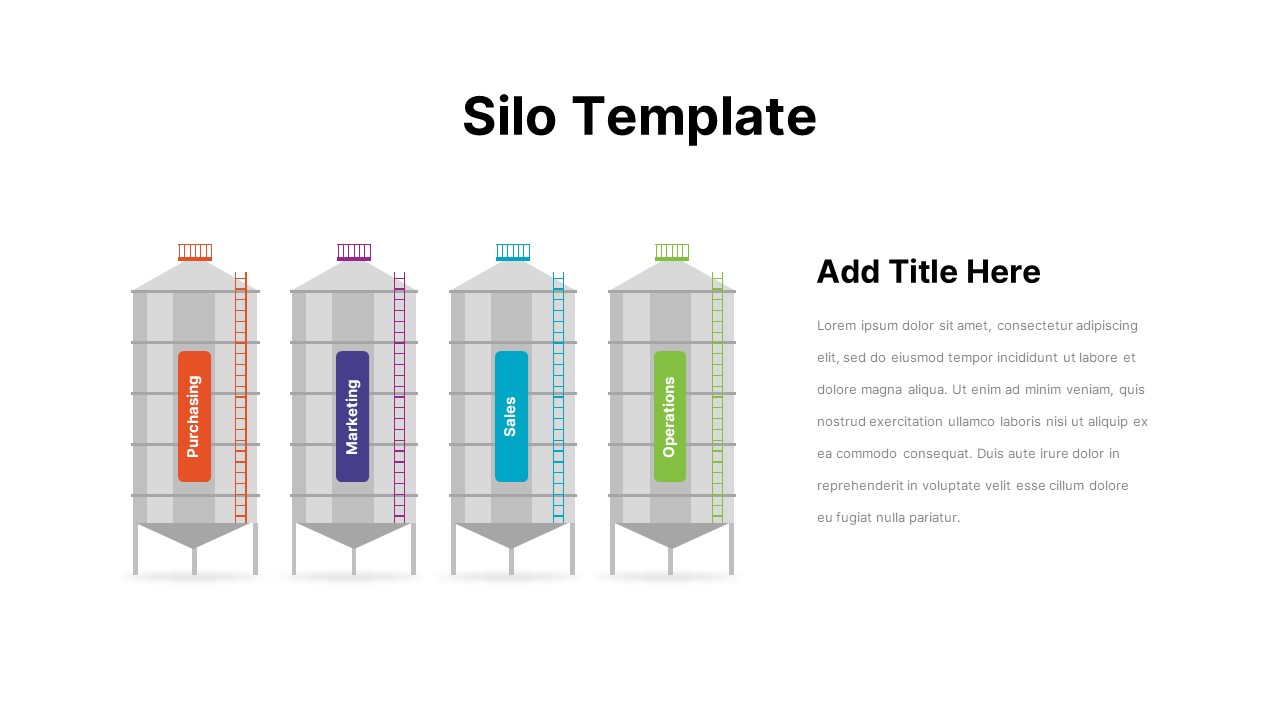
Business Silo Diagram Infographic Design Template for PowerPoint & Google Slides
Business
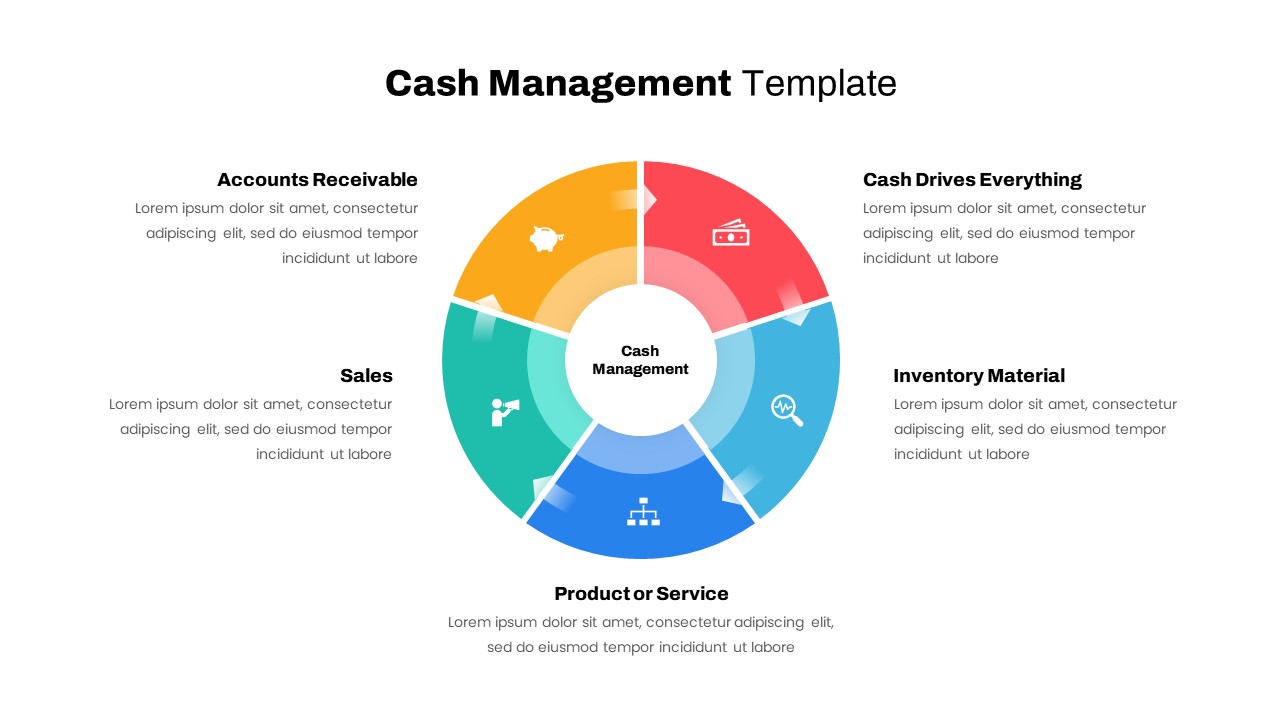
Cash Management Infographic Diagram Template for PowerPoint & Google Slides
Circular
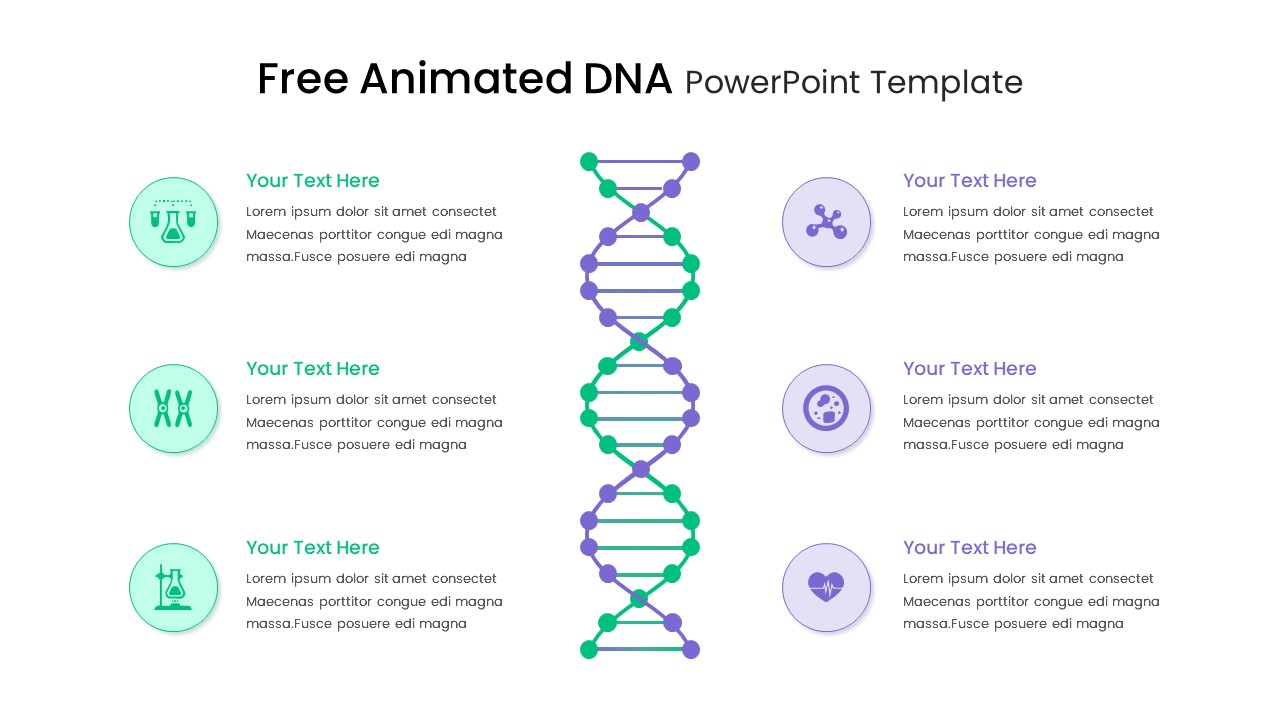
Free Animated DNA Infographic Diagram Template for PowerPoint & Google Slides
Infographics
Free
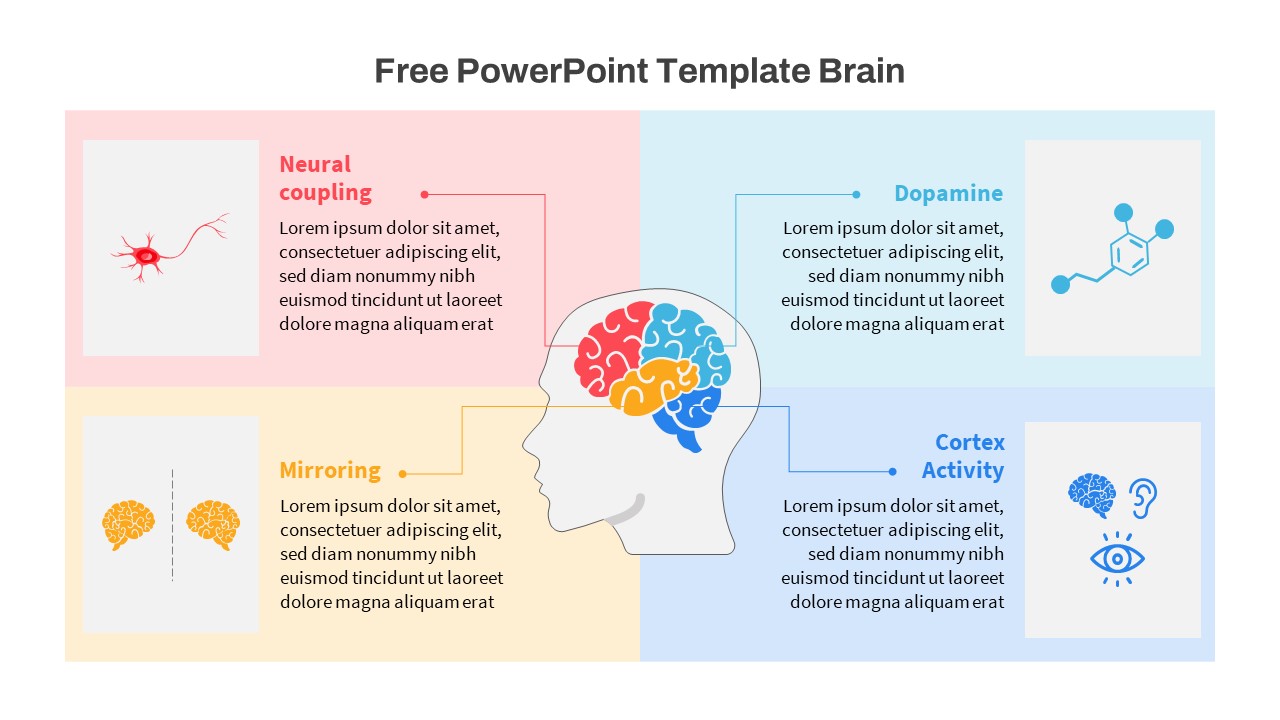
Free Brain Function Diagram Infographic Template for PowerPoint & Google Slides
Process
Free
Salience Model Venn Diagram Infographic Template for PowerPoint & Google Slides
Circular
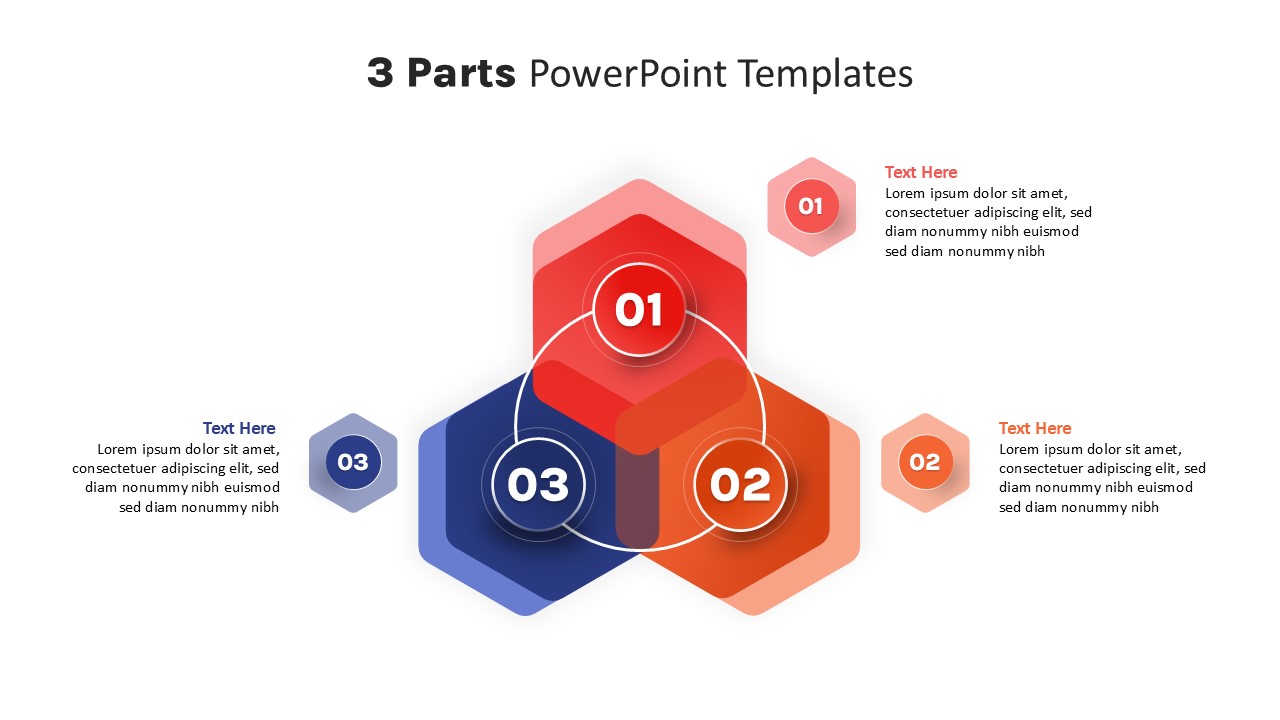
Three-Part Parts Infographic Diagram Template for PowerPoint & Google Slides
Process
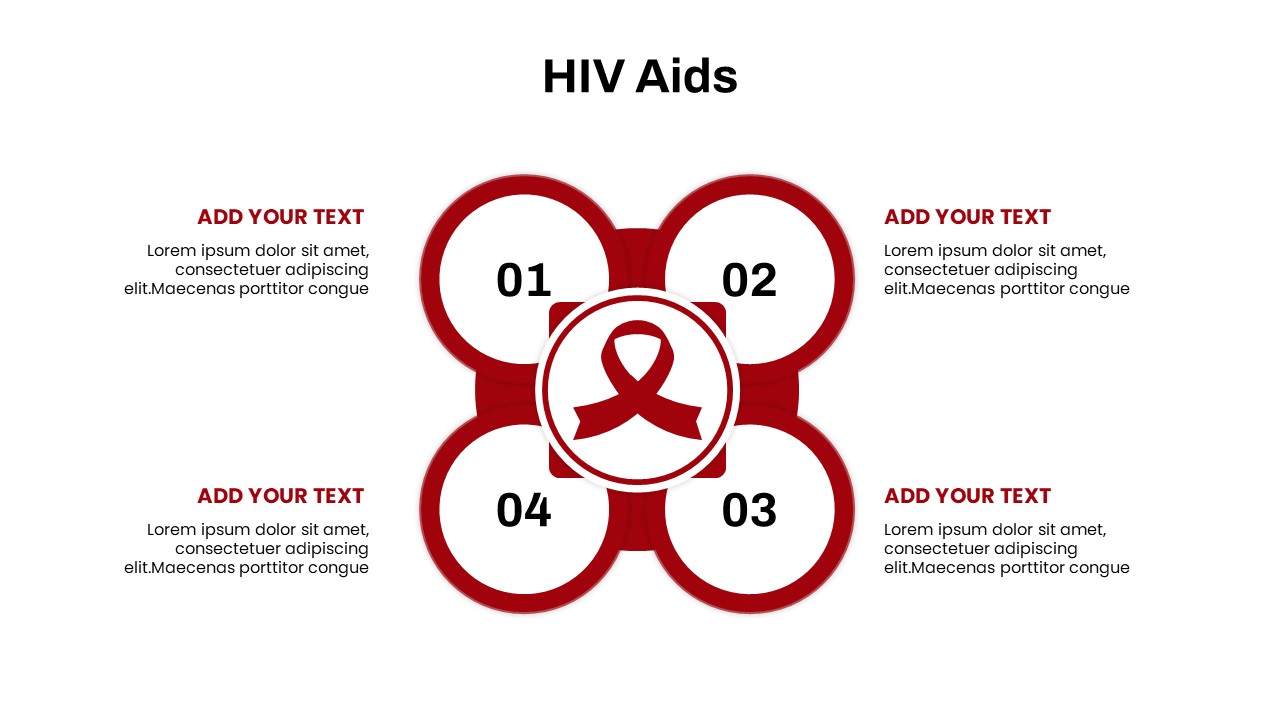
HIV AIDS Infographic Diagram Slide Deck Template for PowerPoint & Google Slides
Graphics
Employer Branding Infographic Diagram Template for PowerPoint & Google Slides
Recruitment
4 Parts Infographic Diagram Template for PowerPoint & Google Slides
Process
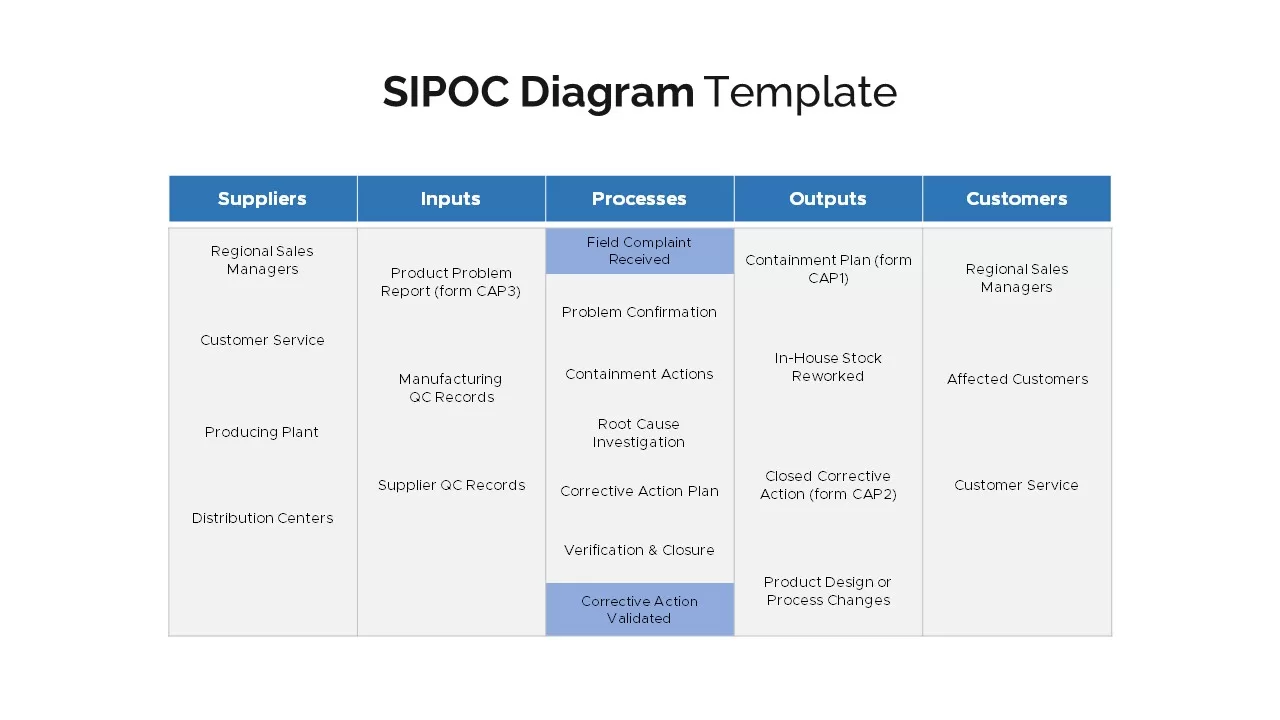
Four SIPOC Diagram Infographic Templates for PowerPoint & Google Slides
Business Plan