Contingency Matrix in Machine Learning template for PowerPoint & Google Slides


Description
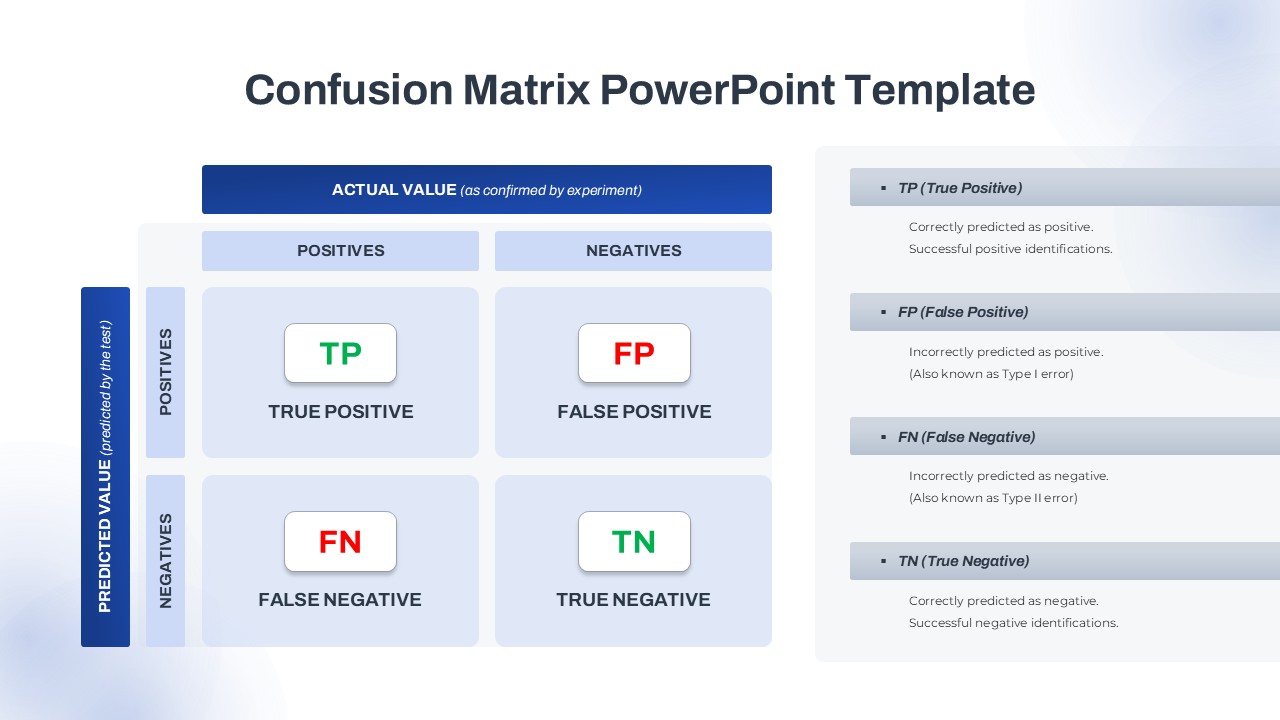
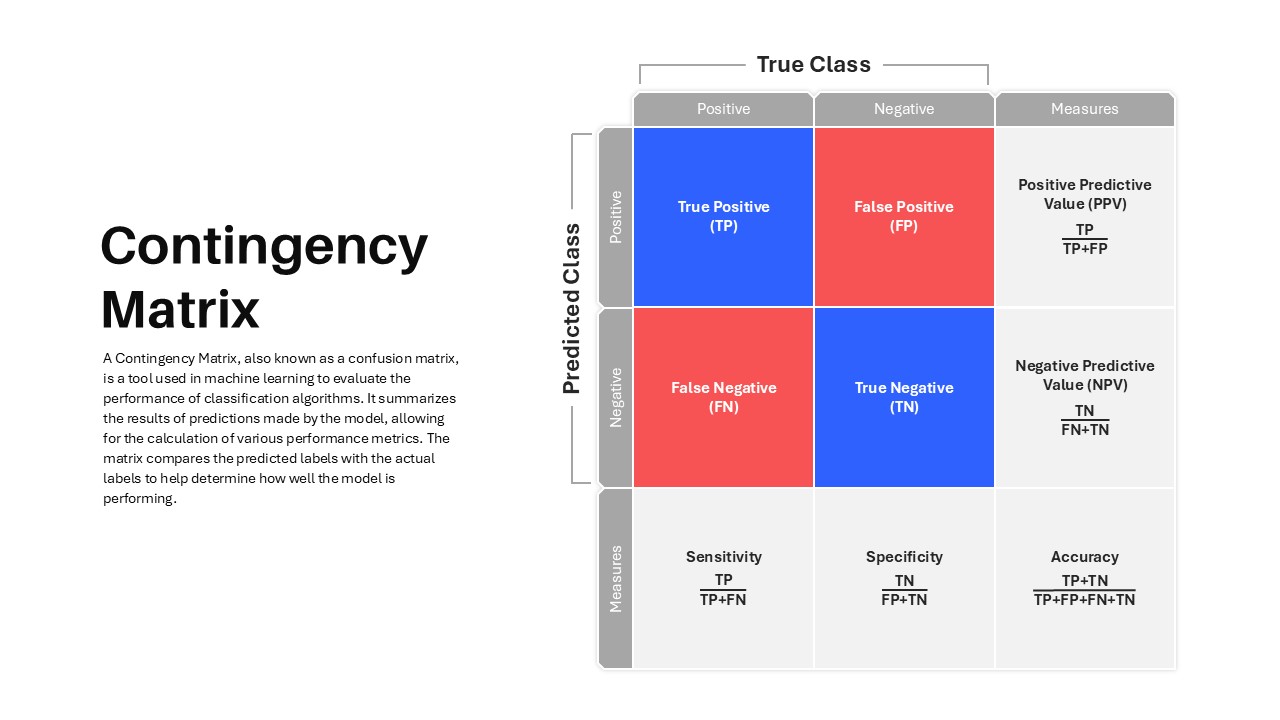
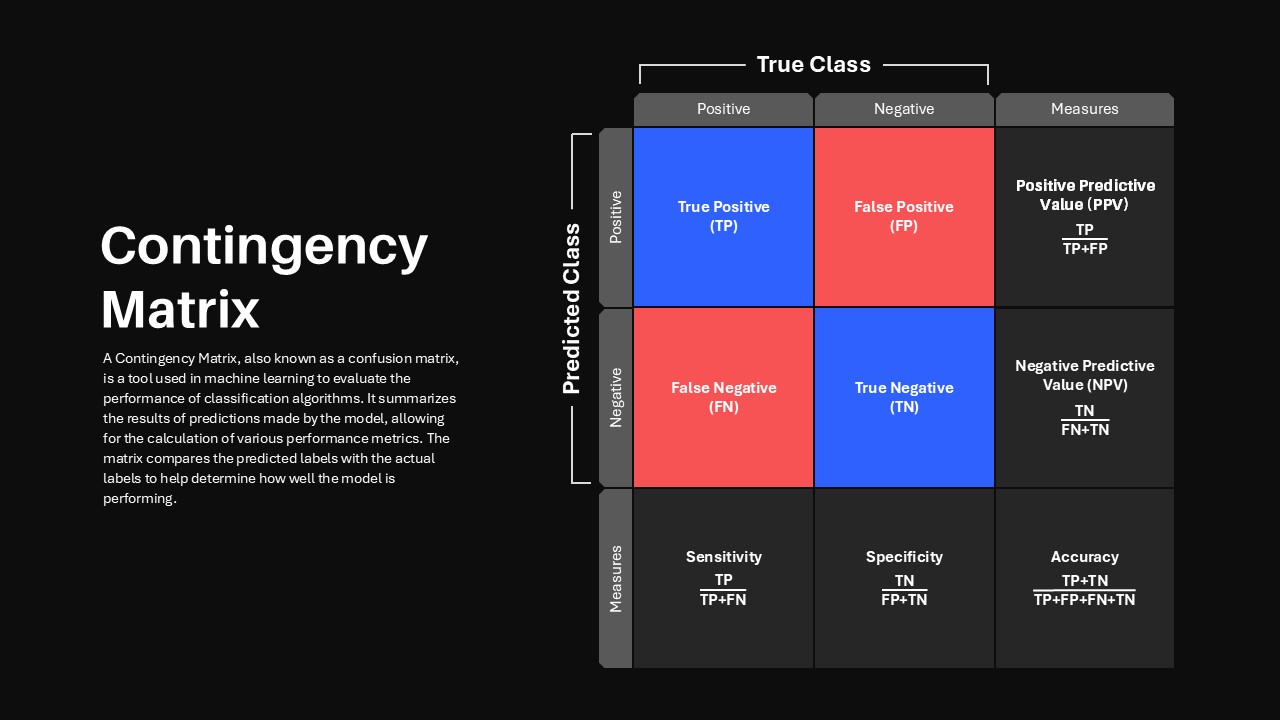
This slide provides a comprehensive overview of the Contingency Matrix, a crucial tool in machine learning used to evaluate classification algorithm performance. The matrix summarizes predicted versus actual outcomes, helping to calculate various performance metrics like Sensitivity, Specificity, Accuracy, and Predictive Values. The slide features a clearly organized grid that highlights the four key outcomes—True Positive (TP), False Positive (FP), False Negative (FN), and True Negative (TN)—and the associated performance measures.
The design uses a combination of contrasting colors—blue for true classifications and red for false classifications—to create a visually clear distinction between outcomes. The matrix is accompanied by concise definitions and mathematical formulas to explain each metric, making it easy to follow even for those new to machine learning concepts.
This slide is perfect for explaining model evaluation to teams, stakeholders, or students in a machine learning or data science setting. The design is clean and professional, allowing for easy customization of text, colors, and data to fit your specific needs. Whether you’re discussing model performance with colleagues or presenting your findings, this matrix will provide a strong visual foundation.
Who is it for
This slide is ideal for data scientists, machine learning engineers, analysts, and educators involved in model evaluation or explaining machine learning concepts. It’s also beneficial for teams and professionals who need to evaluate or explain classification model performance in a clear and concise manner.
Other Uses
Beyond machine learning applications, this template can be adapted for use in any field that requires classification or performance metrics. It can be used in statistical analysis presentations, quality control, or any situation where evaluating binary outcomes is necessary. Additionally, it can be repurposed for educational purposes in courses related to statistics, data science, or predictive analytics.
Login to download this file

Item ID
SB05145
Related Templates

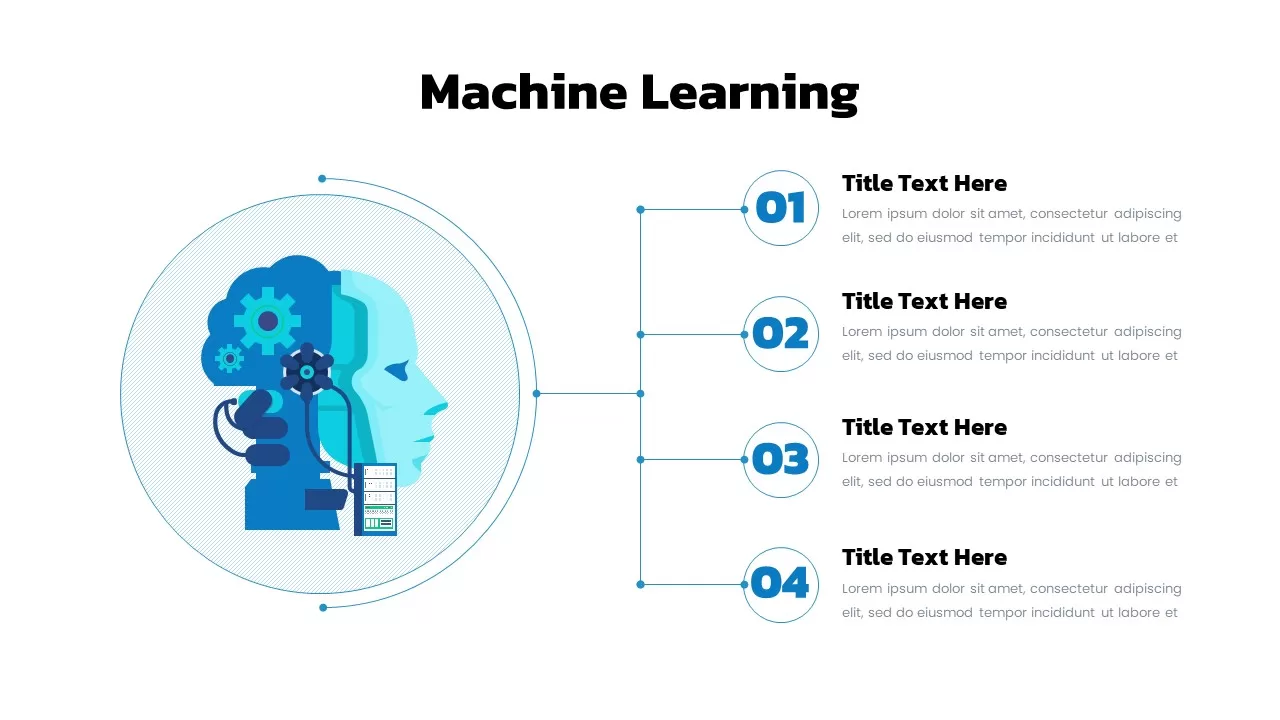
Machine Learning Diagram Template for PowerPoint & Google Slides
Process
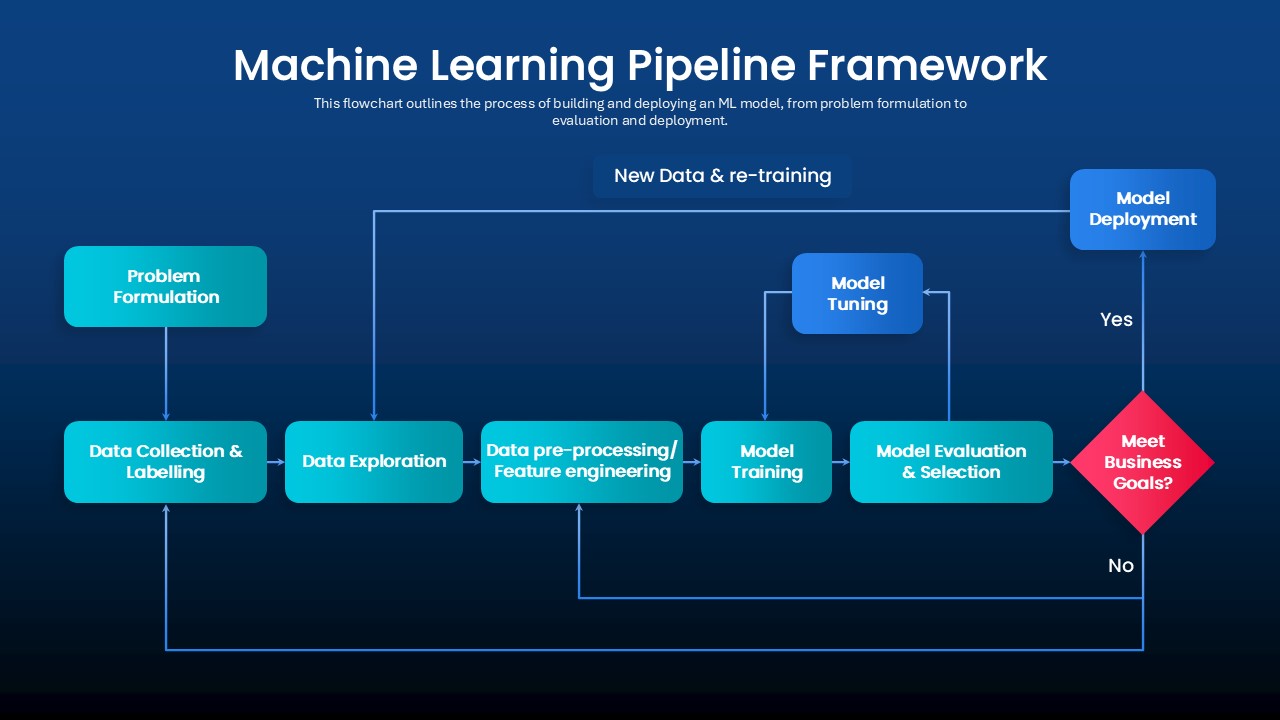
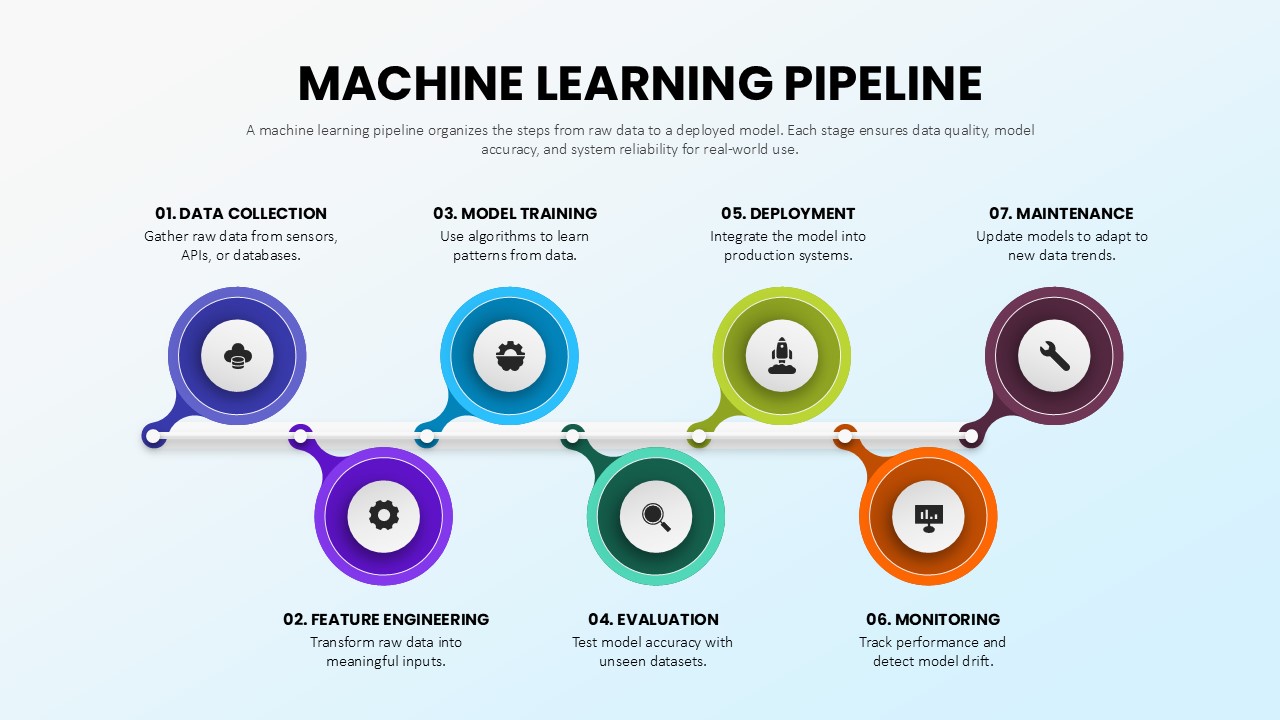
Machine Learning Pipeline Framework Template for PowerPoint & Google Slides
Charts
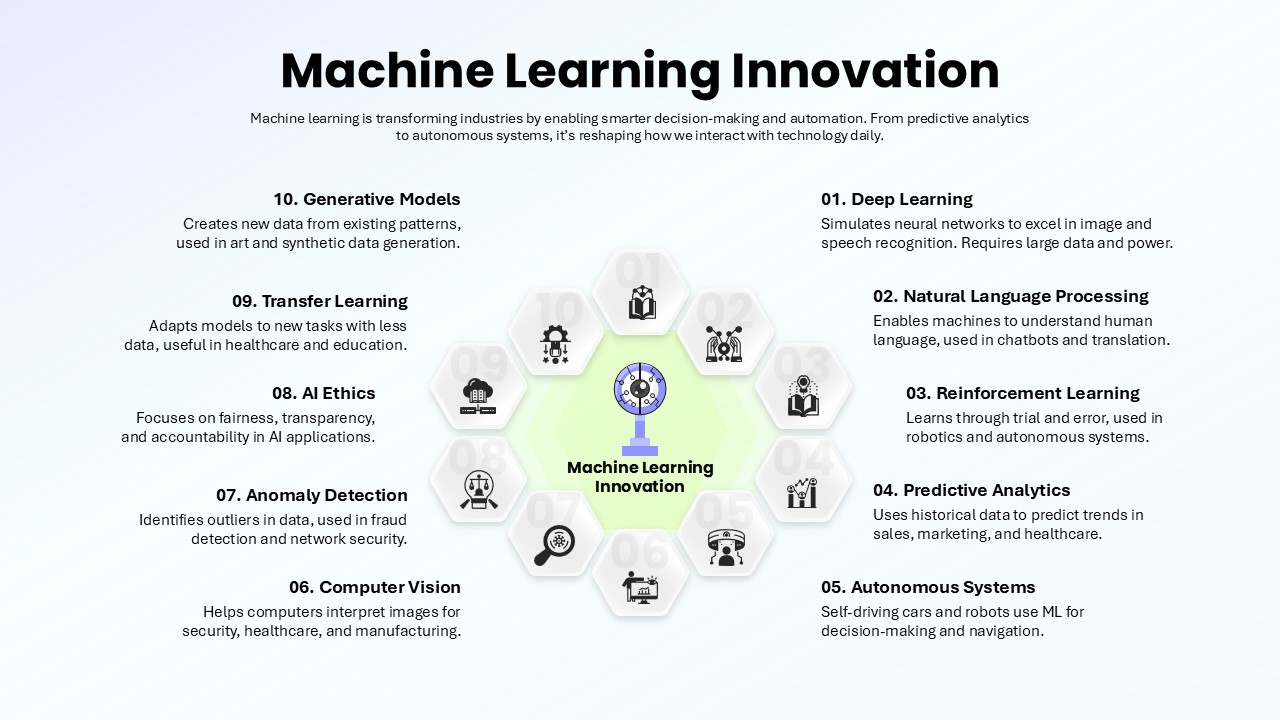
Machine Learning Innovation Overview template for PowerPoint & Google Slides
AI
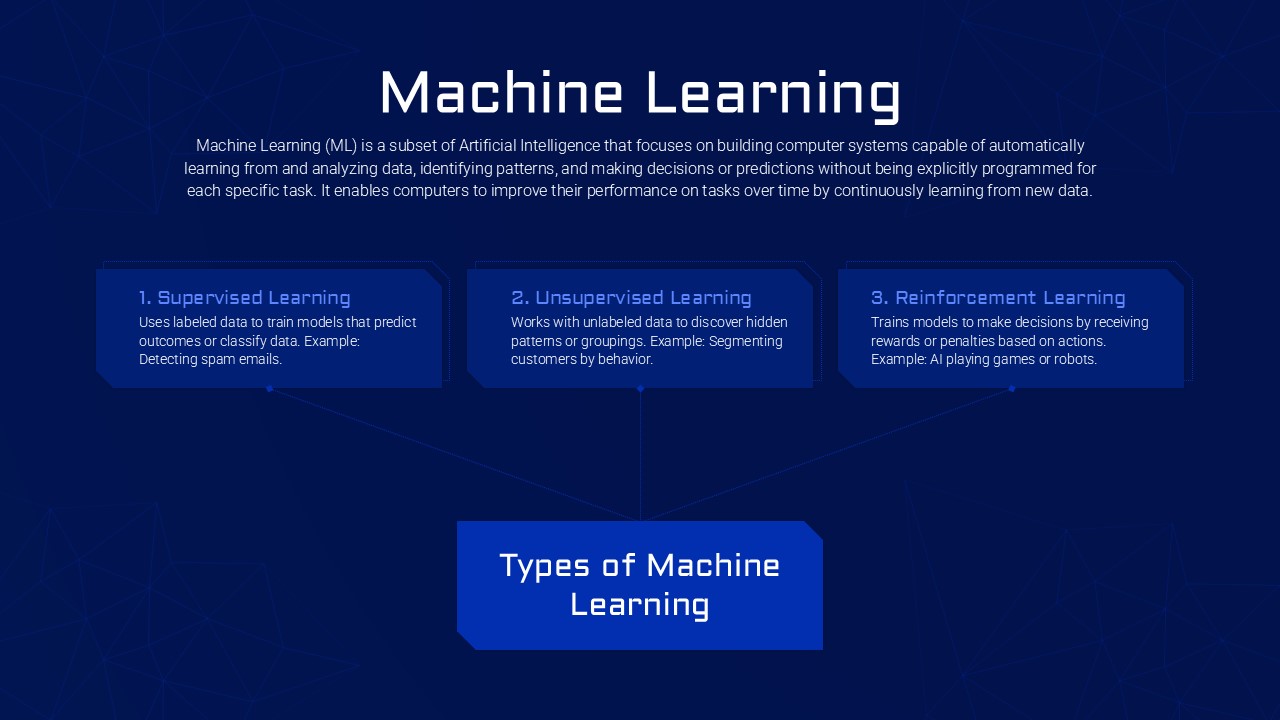
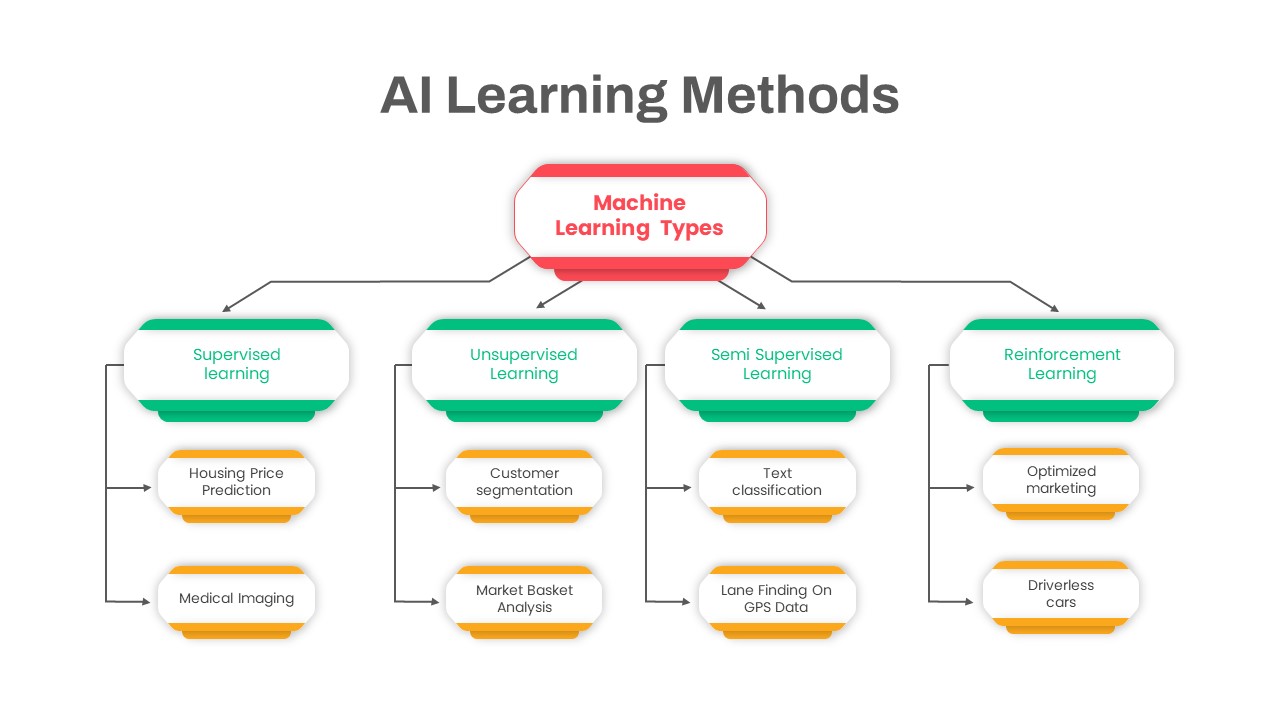
Machine Learning Types template for PowerPoint & Google Slides
Technology
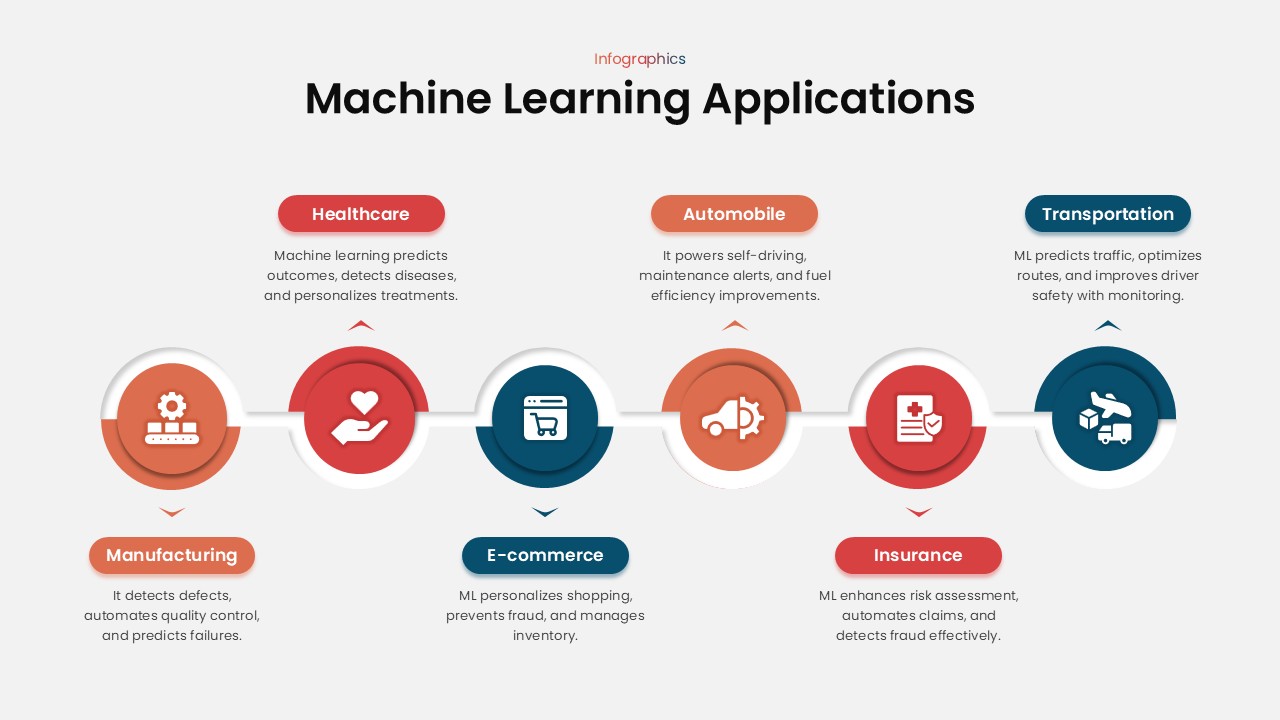
Machine Learning Applications template for PowerPoint & Google Slides
Technology
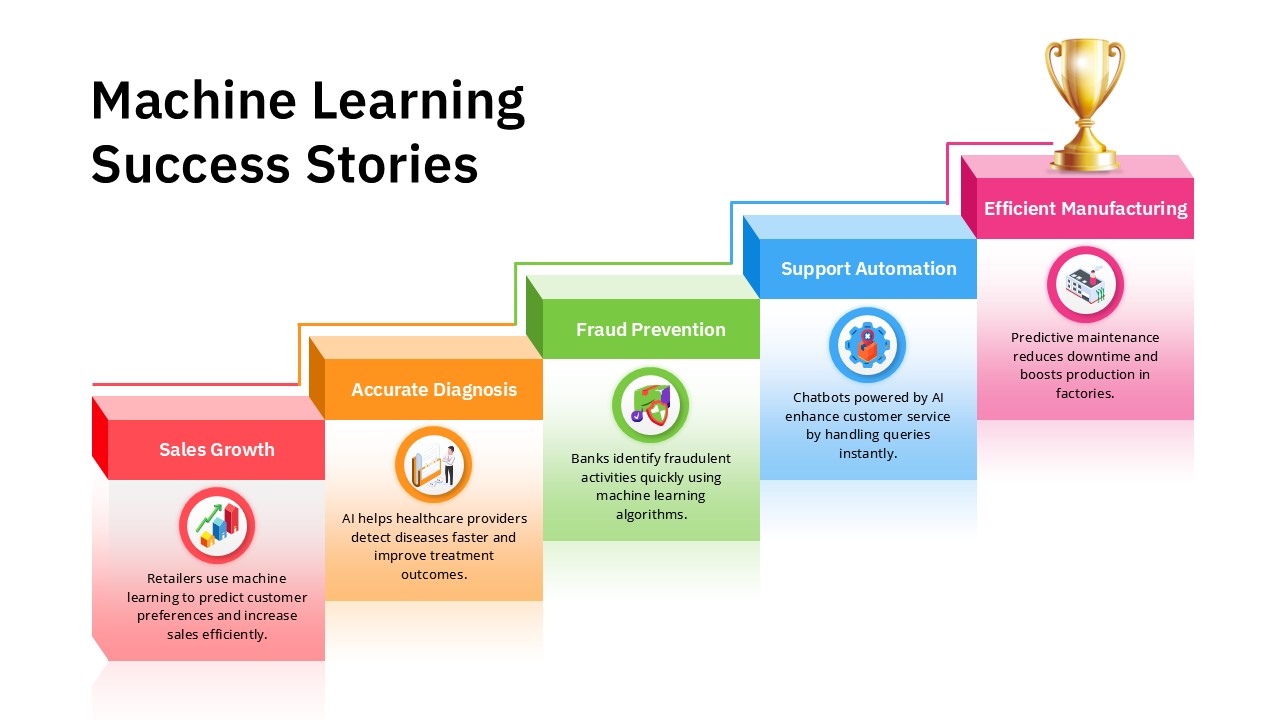
Machine Learning Success Stories Infographic Template for PowerPoint & Google Slides
Process
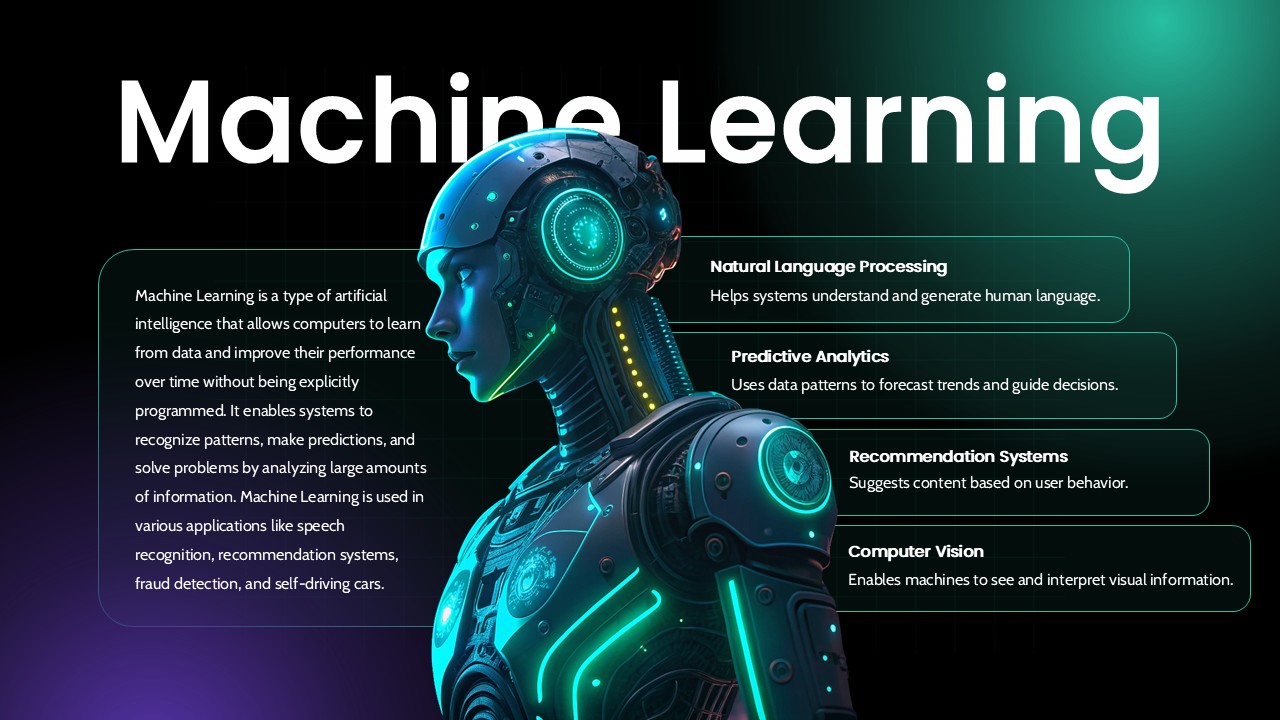
Machine Learning Overview Slide Template for PowerPoint & Google Slides
Machine Learning
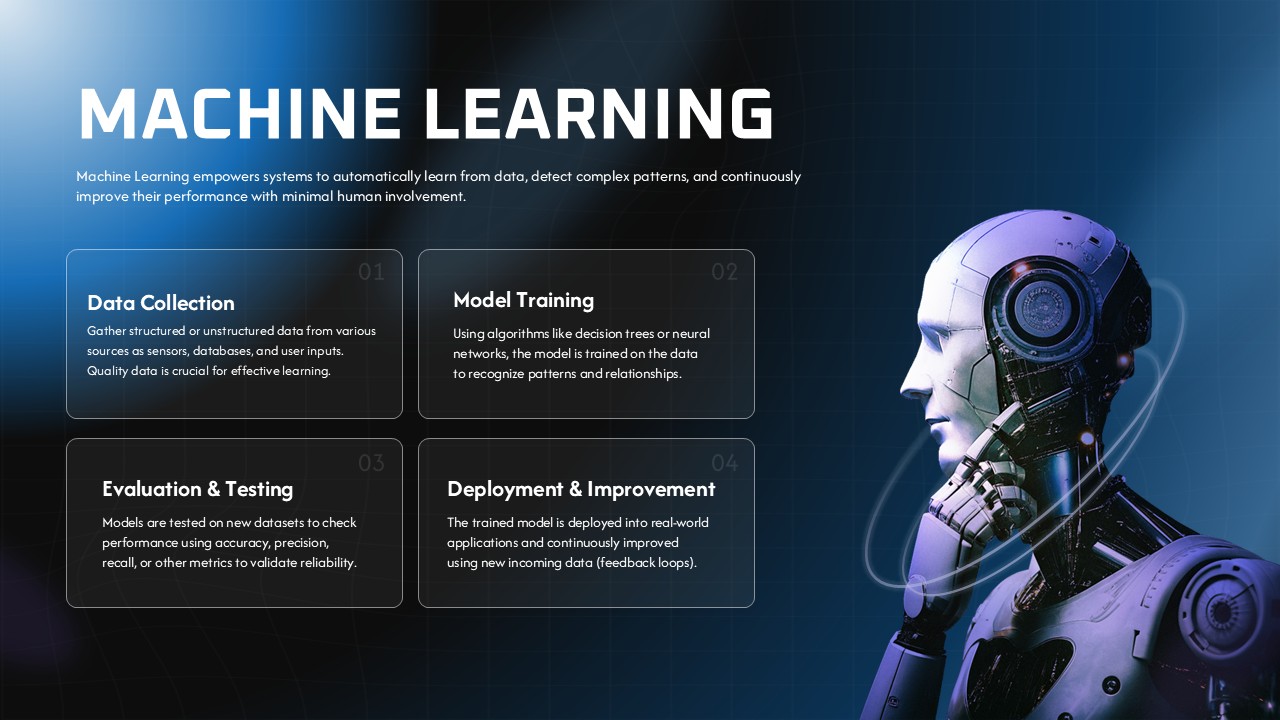
Machine Learning Four-Step Process Template for PowerPoint & Google Slides
Machine Learning
Machine Learning Three-Step Process Template for PowerPoint & Google Slides
Machine Learning
Free Machine Learning Concept Slide Template for PowerPoint & Google Slides
Machine Learning
Free
Futuristic Machine Learning Workflow Template for PowerPoint & Google Slides
Machine Learning
Futuristic Machine Learning Types Overview Template for PowerPoint & Google Slides
AI
Machine Learning Pipeline Overview Template for PowerPoint & Google Slides
Machine Learning
Machine Learning Presentation Use Cases Template for PowerPoint & Google Slides
Machine Learning
Machine Learning 4-Step Workflow Template for PowerPoint & Google Slides
Machine Learning
Machine Learning Model Management Template for PowerPoint & Google Slides
Machine Learning
Machine Learning Pipeline & MLOps Flow Template for PowerPoint & Google Slides
Machine Learning
Machine Learning Process Template for PowerPoint & Google Slides
Machine Learning
Seven Stage Machine Learning Pipeline Template for PowerPoint & Google Slides
Machine Learning
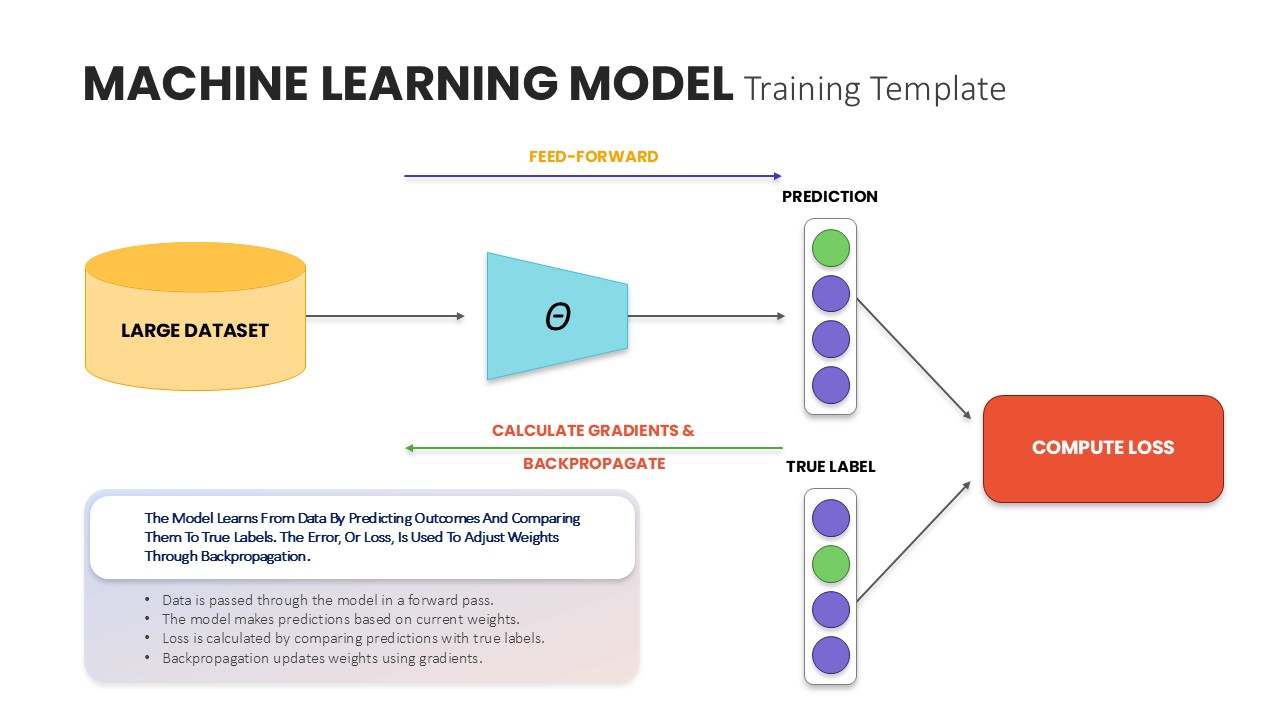
Machine Learning Model Training Template for PowerPoint & Google Slides
Machine Learning
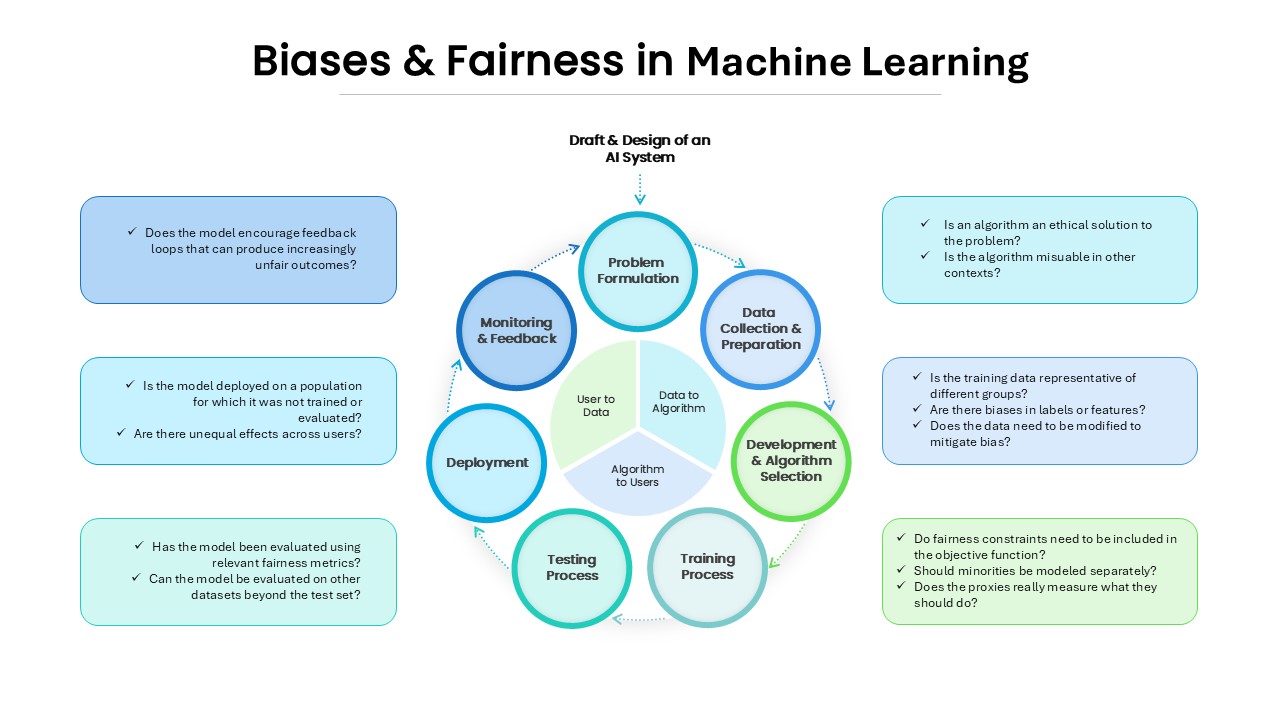
Biases and Fairness in Machine Learning for PowerPoint & Google Slides
Information Technology
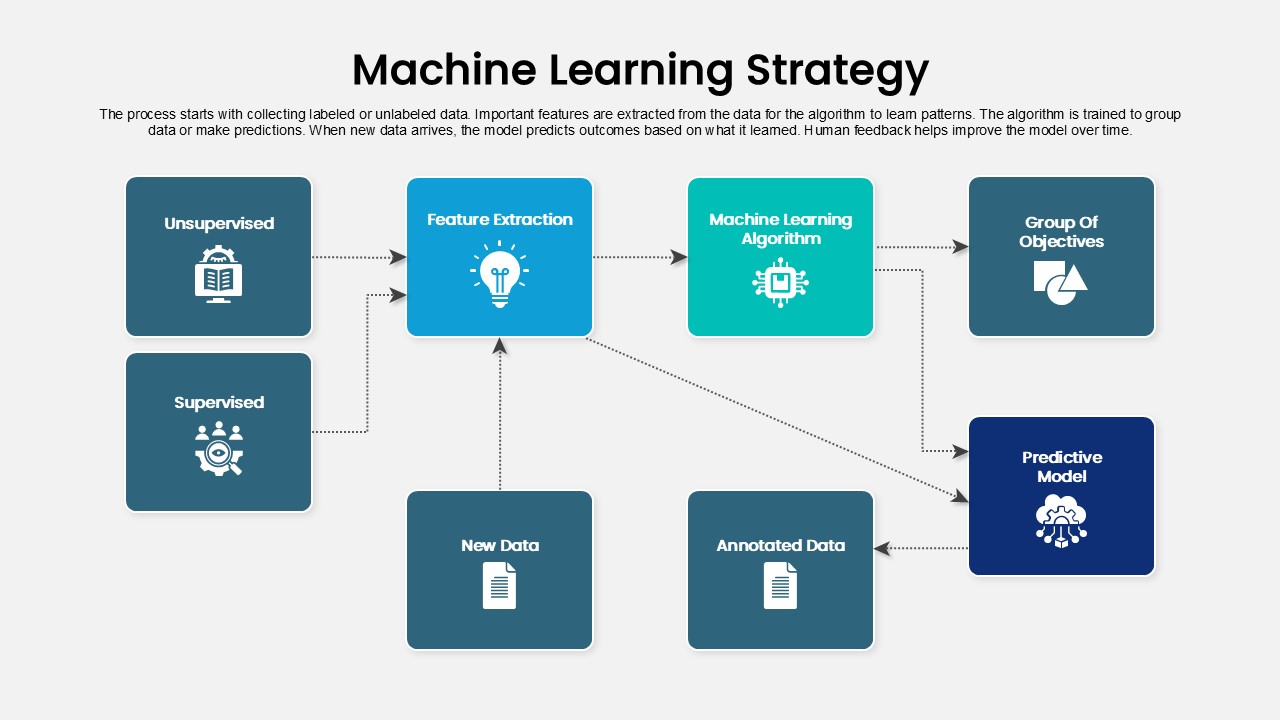
Machine Learning Strategy Flowchart
Machine Learning
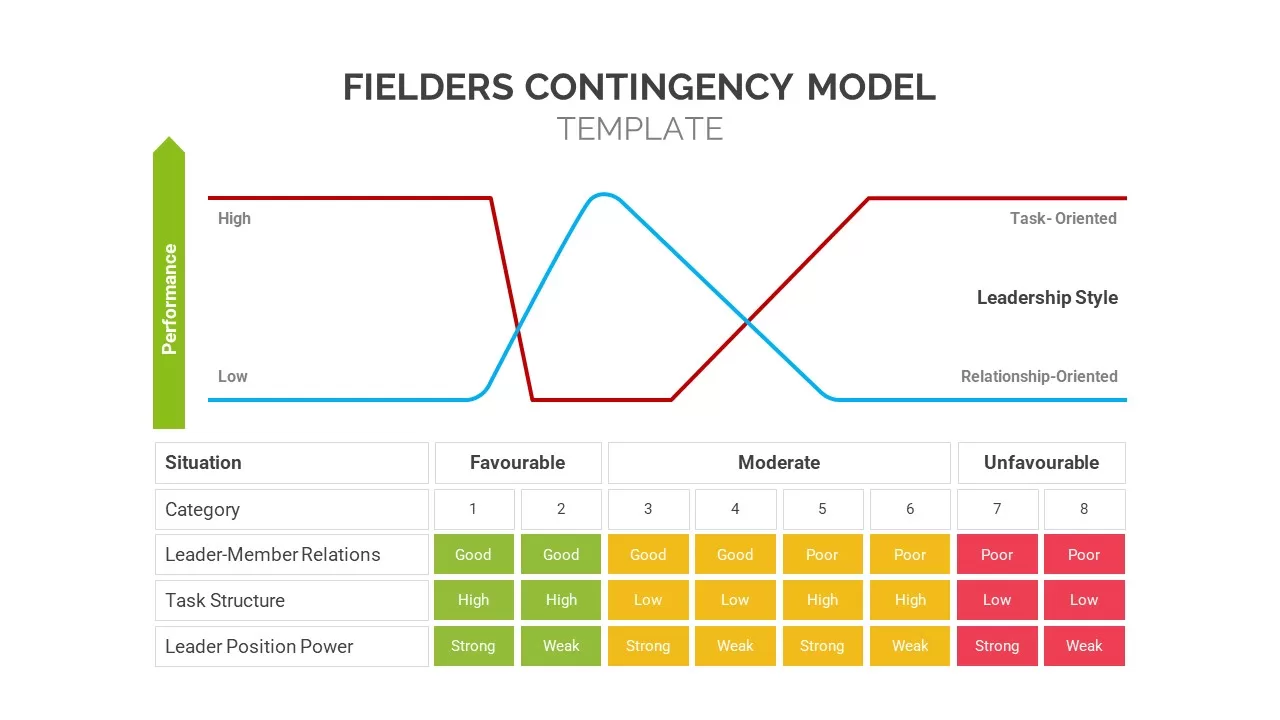
Fiedler’s Contingency Model template for PowerPoint & Google Slides
Business Strategy
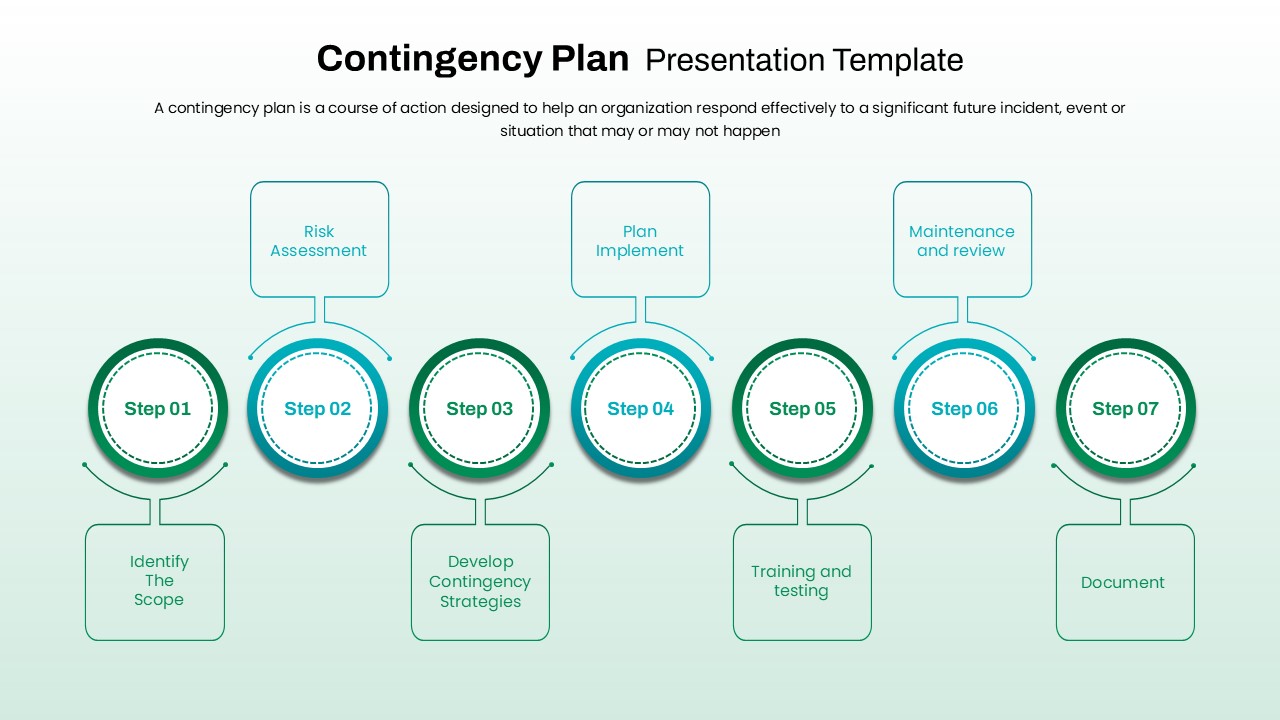
7-Step Contingency Planning Process Template for PowerPoint & Google Slides
Risk Management
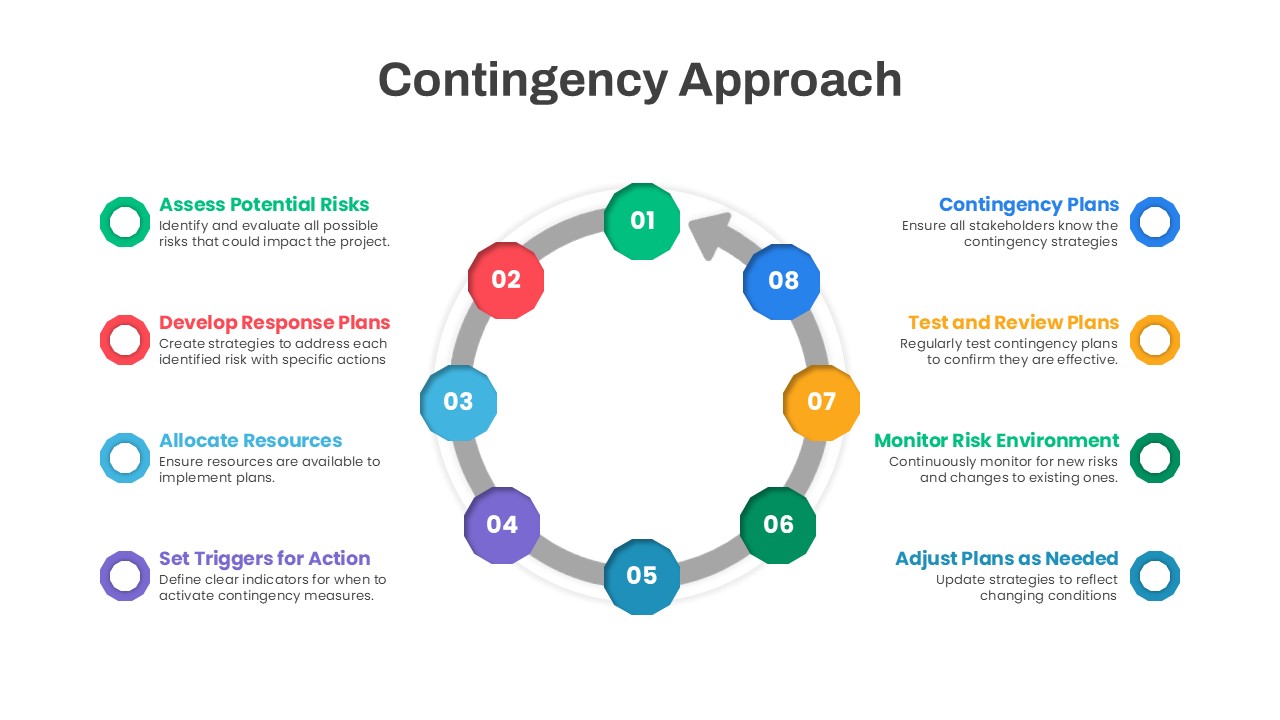
Contingency Approach for PowerPoint & Google Slides
Business
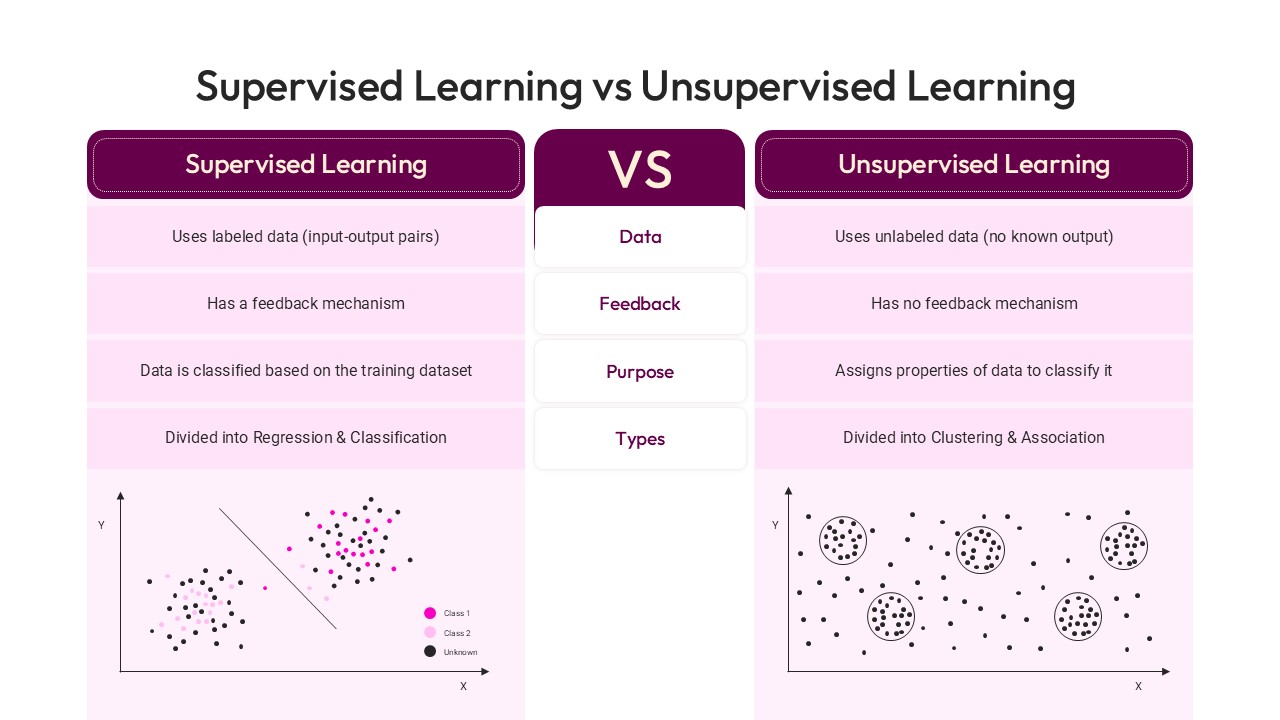
Supervised Learning vs Unsupervised Learning template for PowerPoint & Google Slides
Technology
Online Learning PowerPoint Template for PowerPoint & Google Slides
Customer Journey
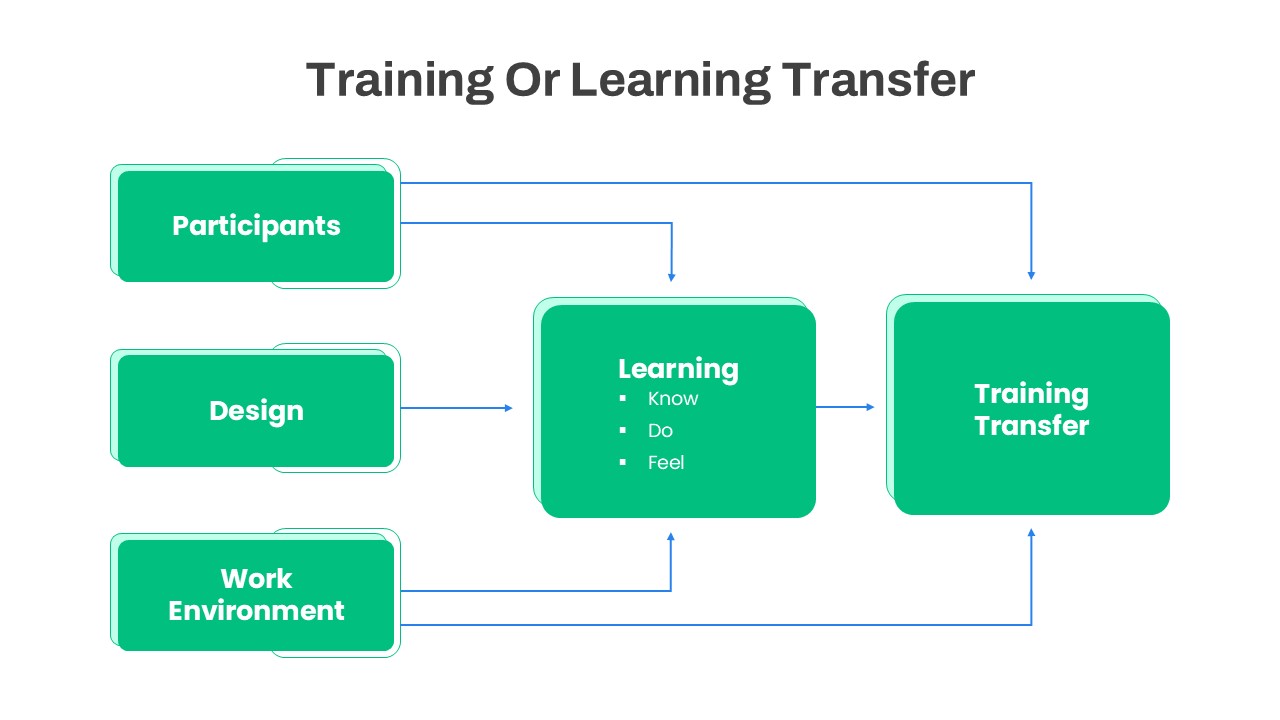
Training or Learning Transfer PowerPoint Template for PowerPoint & Google Slides
Business Proposal
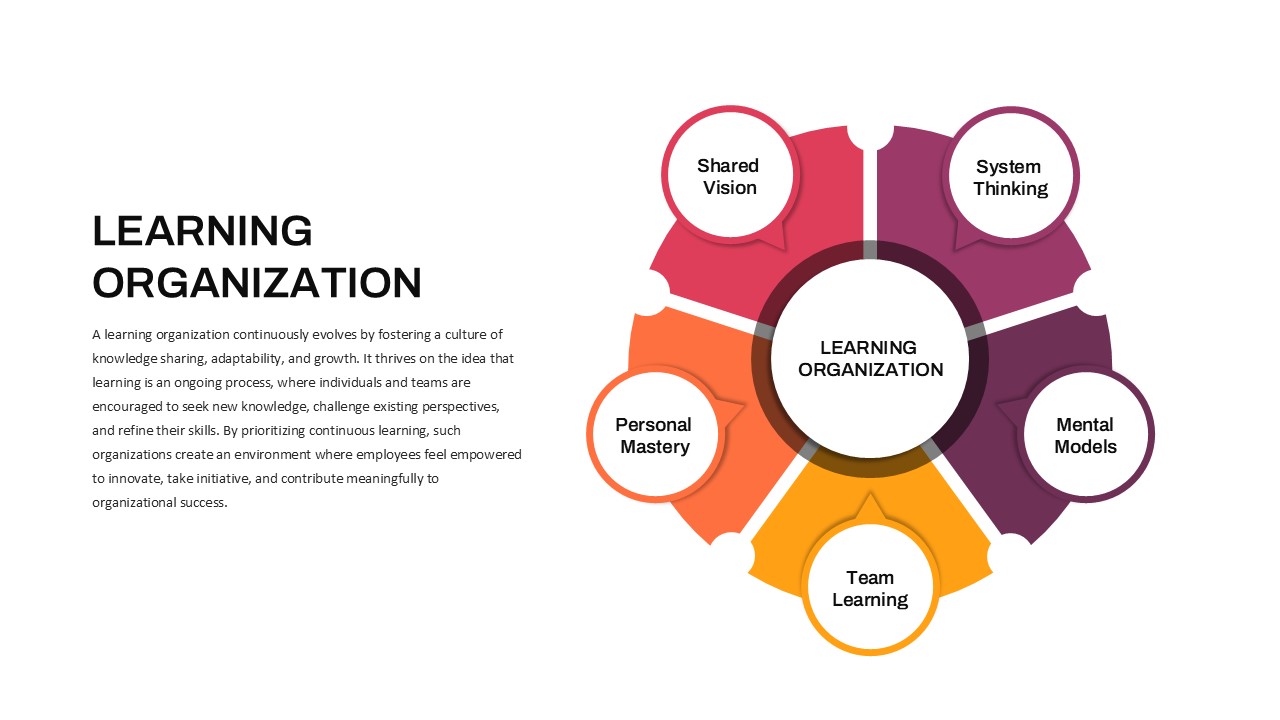
Learning Organization PowerPoint Template for PowerPoint & Google Slides
Business Strategy

Innovation Ambition Matrix & Funnel Strategy Slides for PowerPoint & Google Slides
Process
E-Learning Report Analysis Template for PowerPoint & Google Slides
Infographics
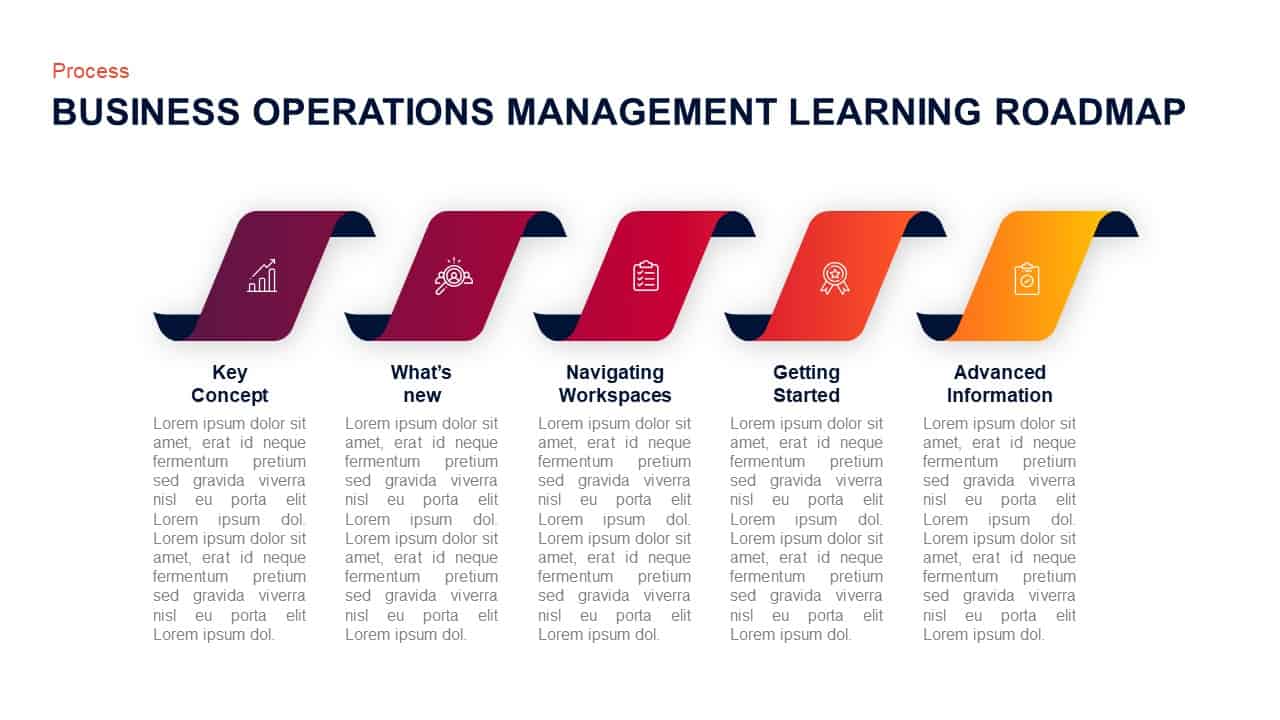
Operations Management Learning Roadmap Template for PowerPoint & Google Slides
Roadmap
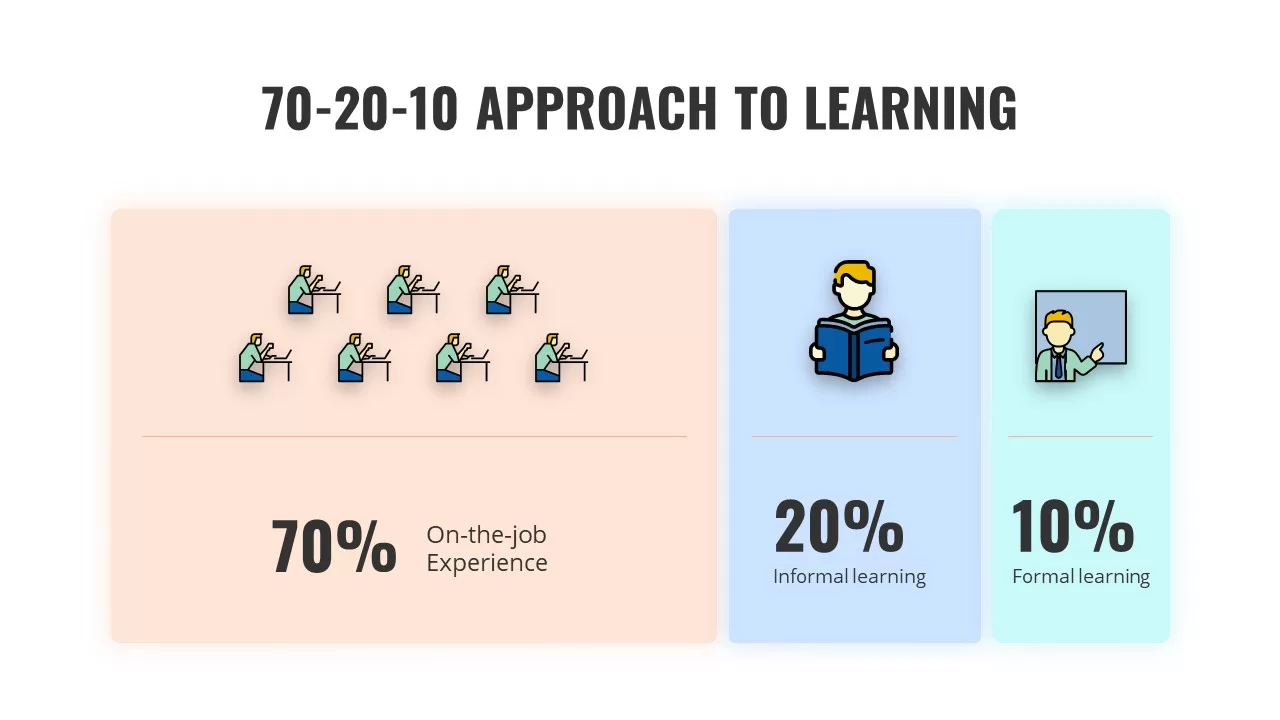
70-20-10 Learning Approach Infographic Template for PowerPoint & Google Slides
Process
4MAT Learning Cycle Circular Diagram Template for PowerPoint & Google Slides
Circular
Free Stylish E-Learning Presentation Template for PowerPoint & Google Slides
Pitch Deck
Free
E-Learning Education Presentation Deck Template for PowerPoint & Google Slides
Decks
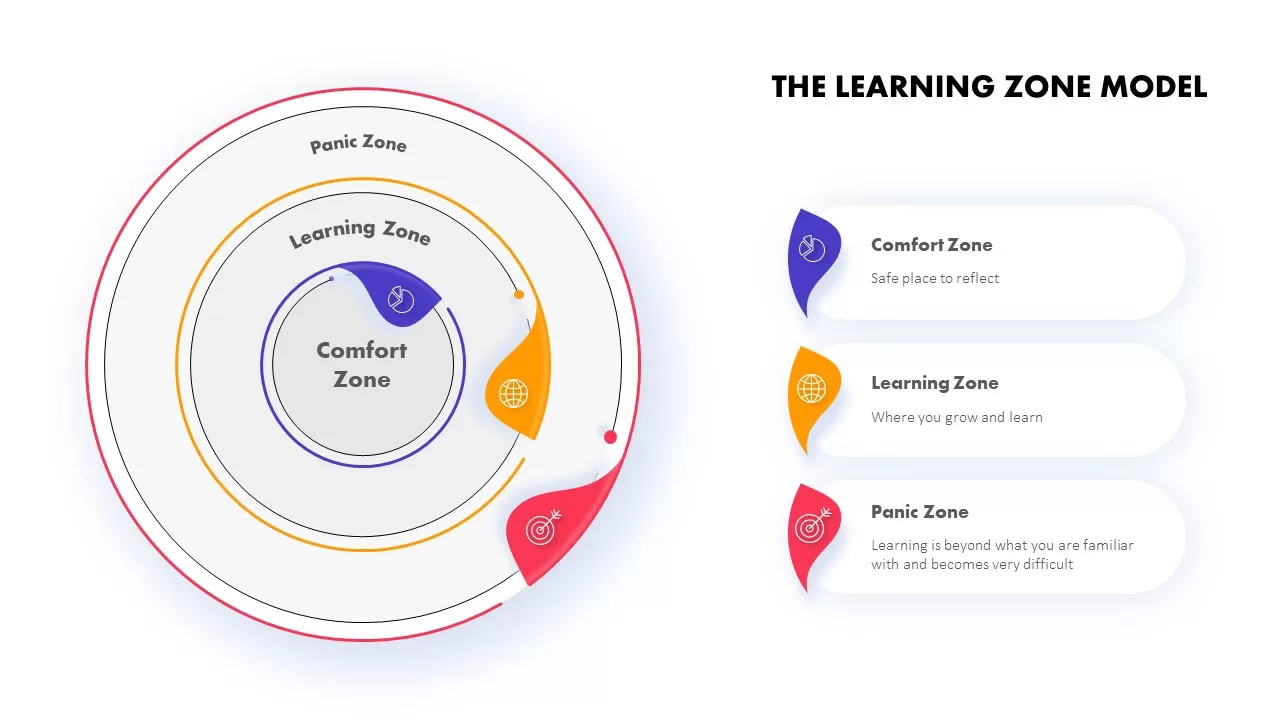
The Learning Zone Model Template for PowerPoint & Google Slides
Process
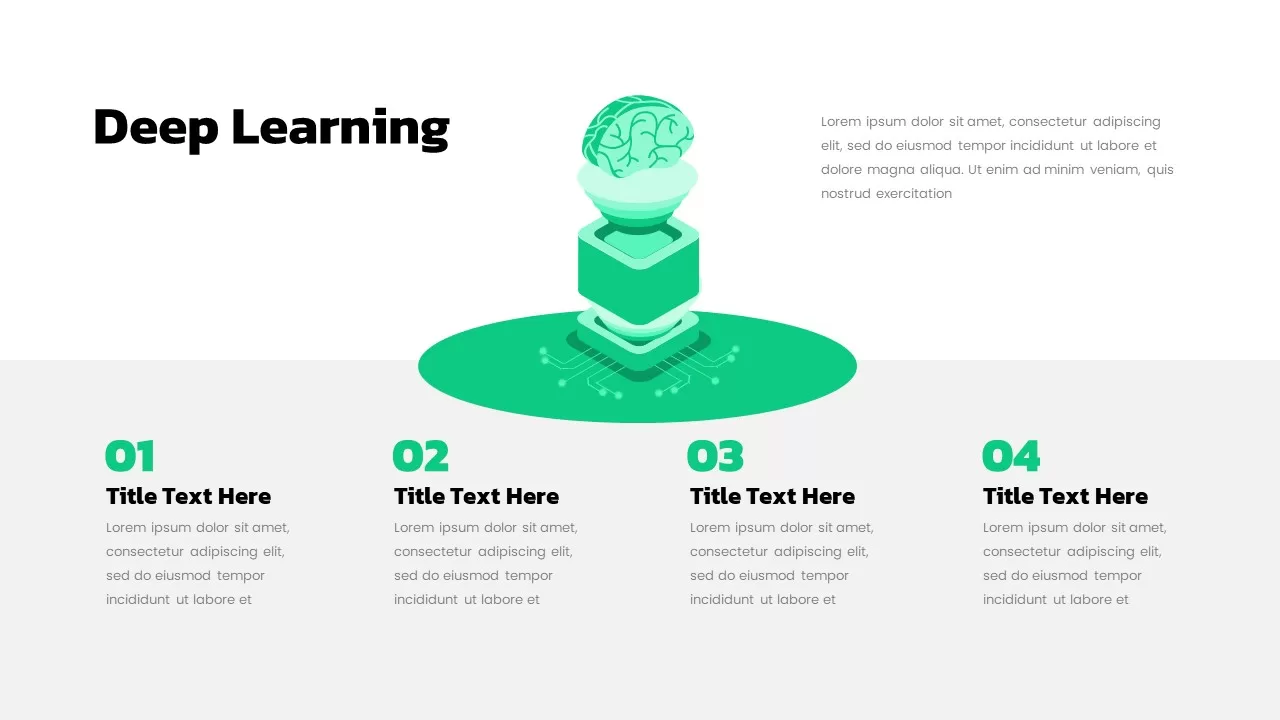
Deep Learning Concept Illustration Template for PowerPoint & Google Slides
Machine Learning
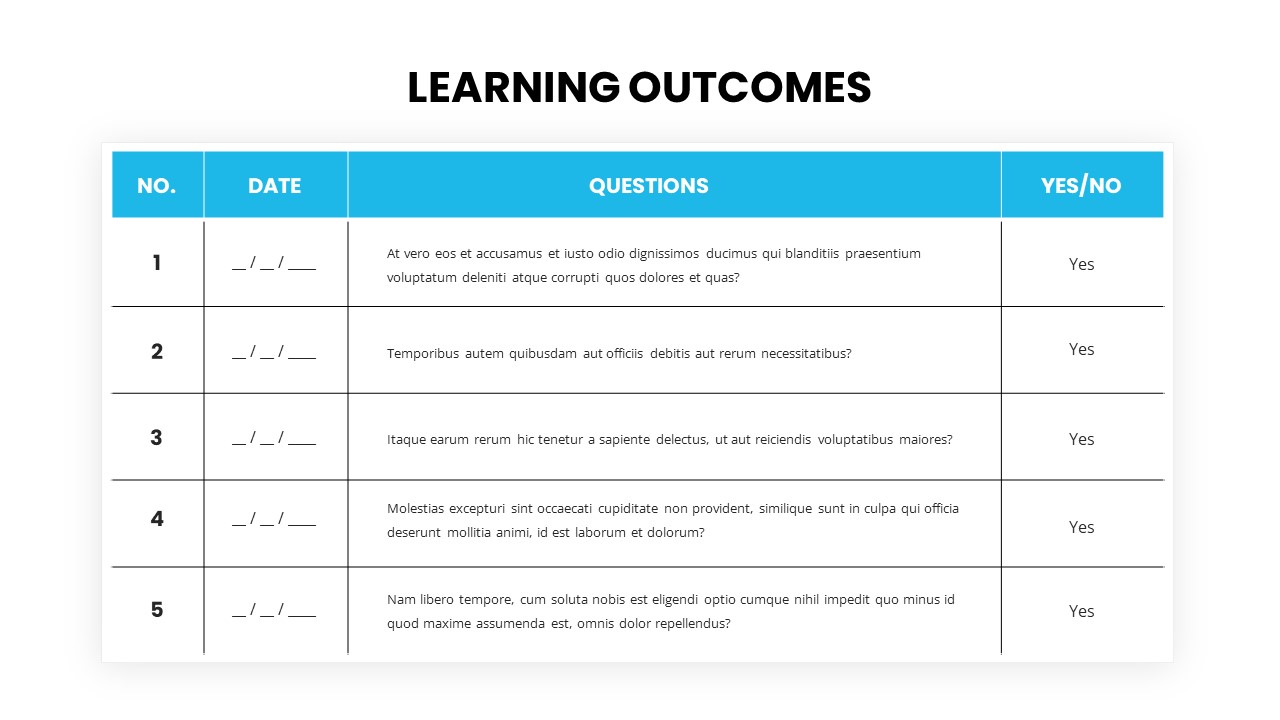
Learning Outcomes table template for PowerPoint & Google Slides
Charts

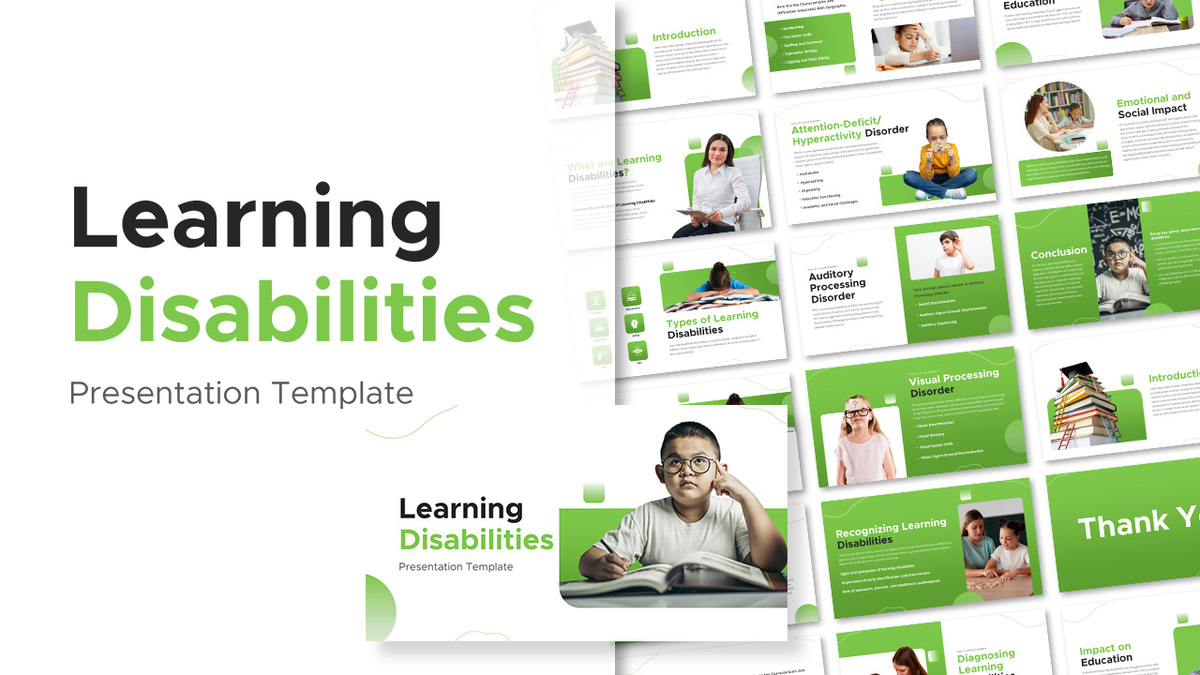
Learning Disabilities Presentation Template for PowerPoint & Google Slides
Company Profile
Free Learning Retention Pyramid Chart Template for PowerPoint & Google Slides
Pyramid
Free
AI Learning Methods Flowchart Diagram Template for PowerPoint & Google Slides
Flow Charts
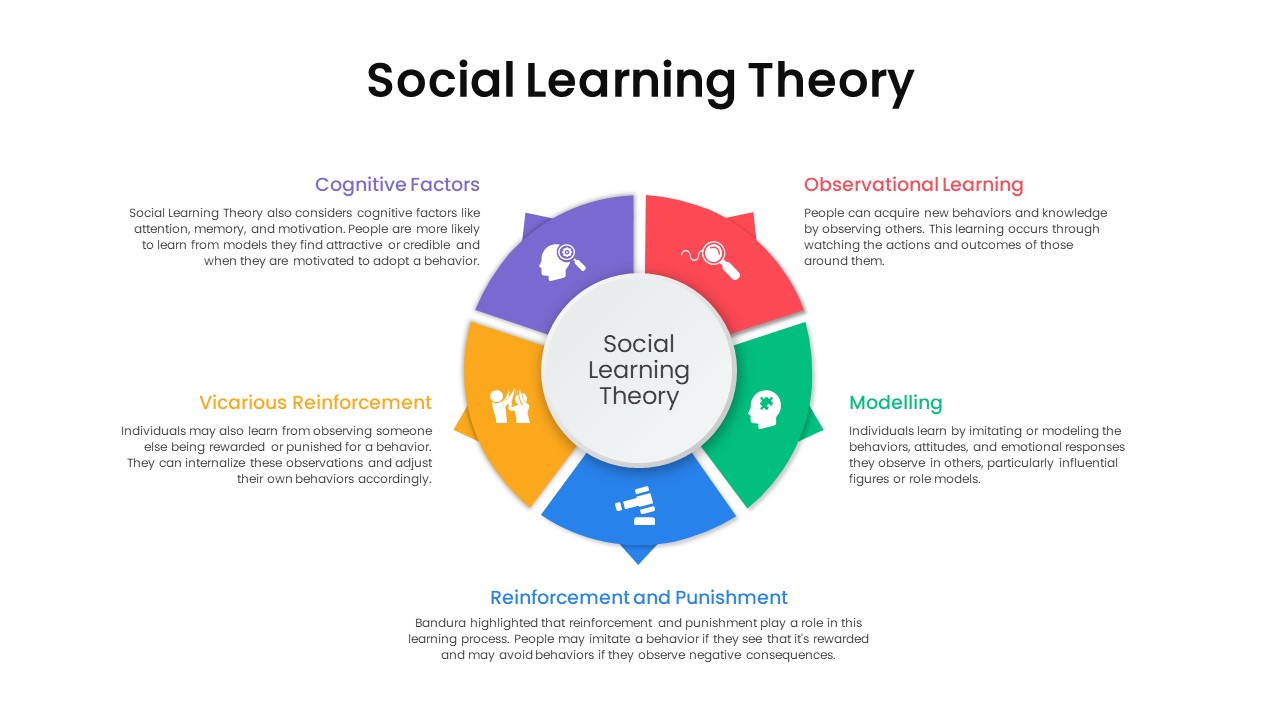
Social Learning Theory Infographic Template for PowerPoint & Google Slides
Circular
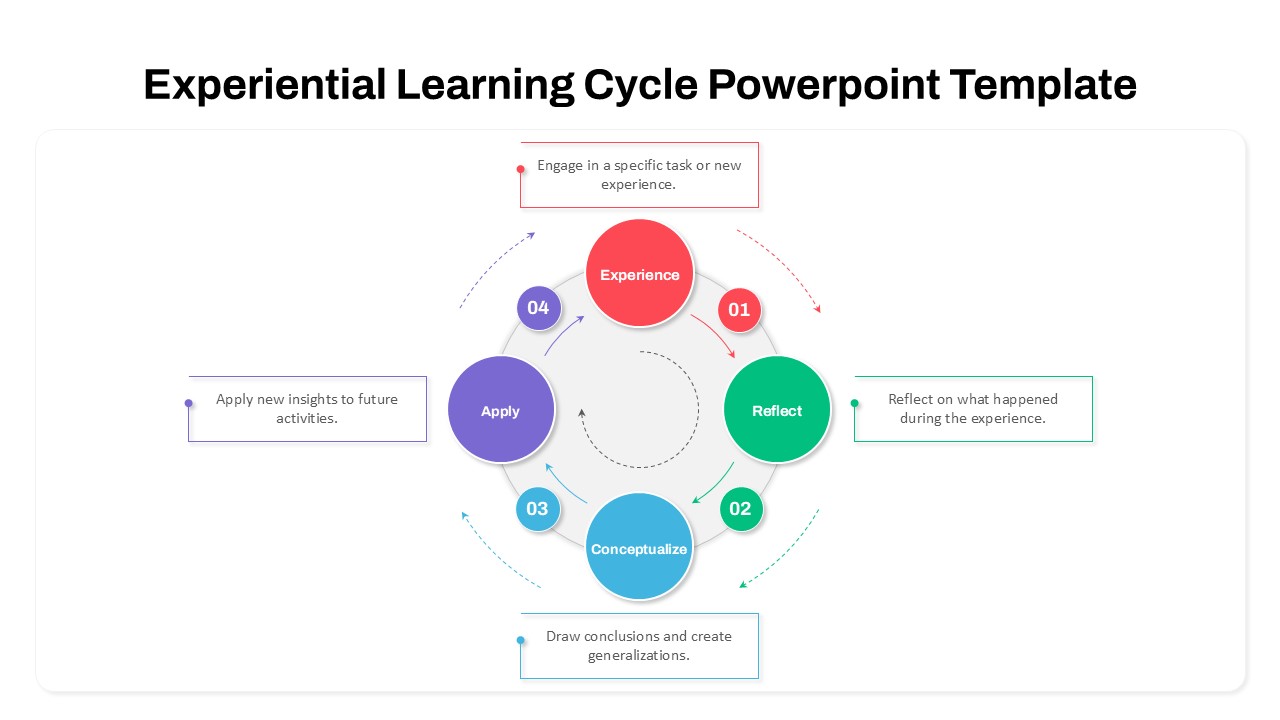
Experiential Learning Cycle Diagram Template for PowerPoint & Google Slides
Circular
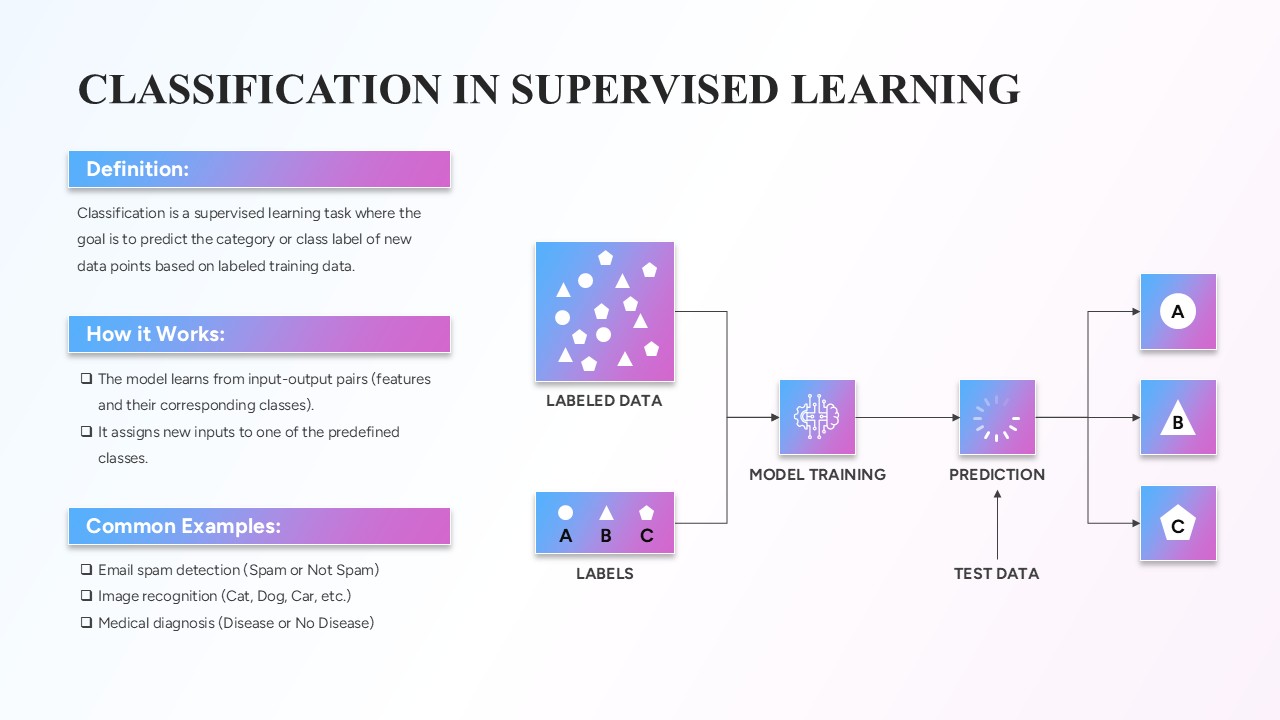
Classification in Supervised Learning template for PowerPoint & Google Slides
Infographics
Supervised Learning Overview template for PowerPoint & Google Slides
Technology
Transfer Learning Process template for PowerPoint & Google Slides
Technology
Self-supervised Learning Process template for PowerPoint & Google Slides
Technology
Reinforcement Learning Diagram Dark Template for PowerPoint & Google Slides
Machine Learning
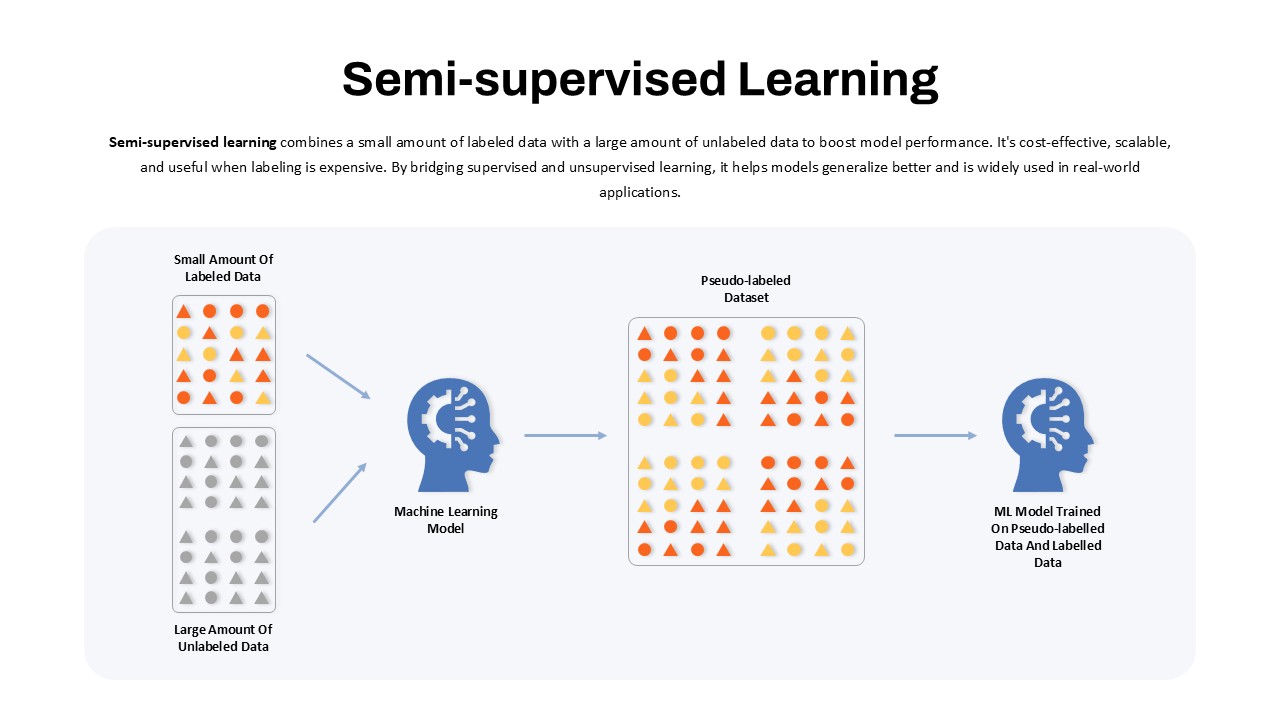
Semi-Supervised Learning Flow Diagram Template for PowerPoint & Google Slides
Machine Learning
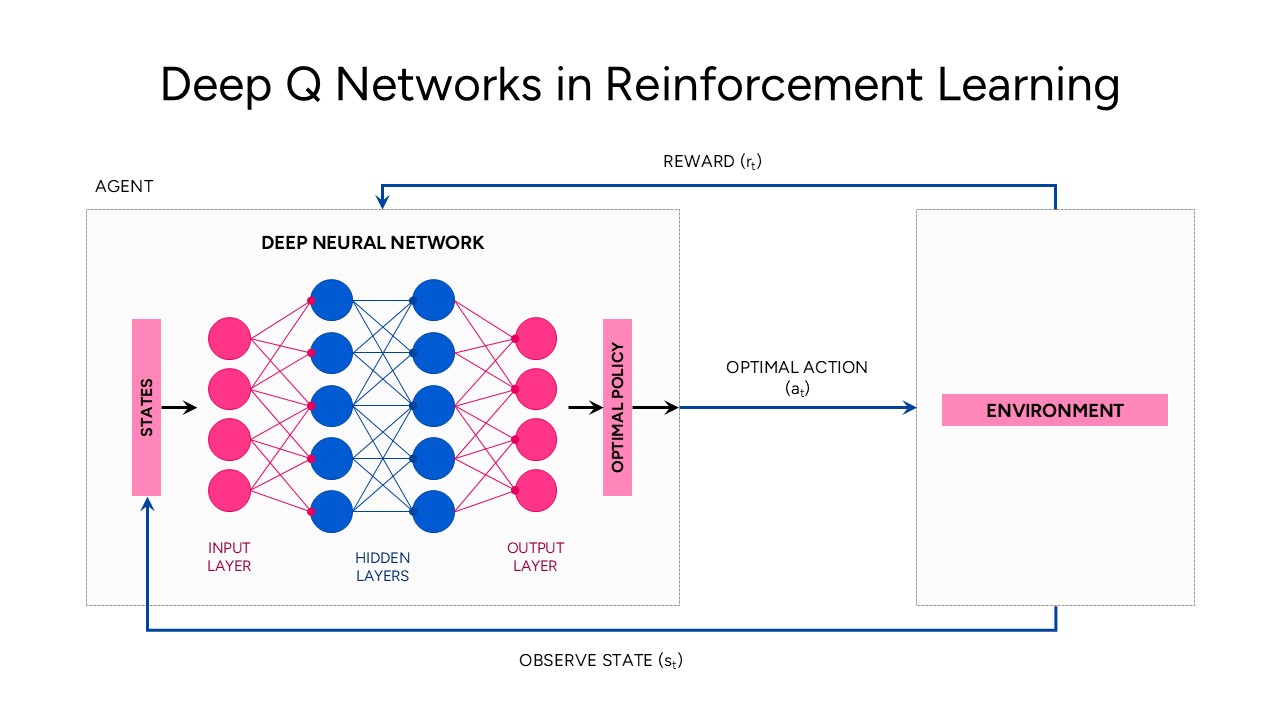
Deep Q Networks in Reinforcement Learning template for PowerPoint & Google Slides
Technology
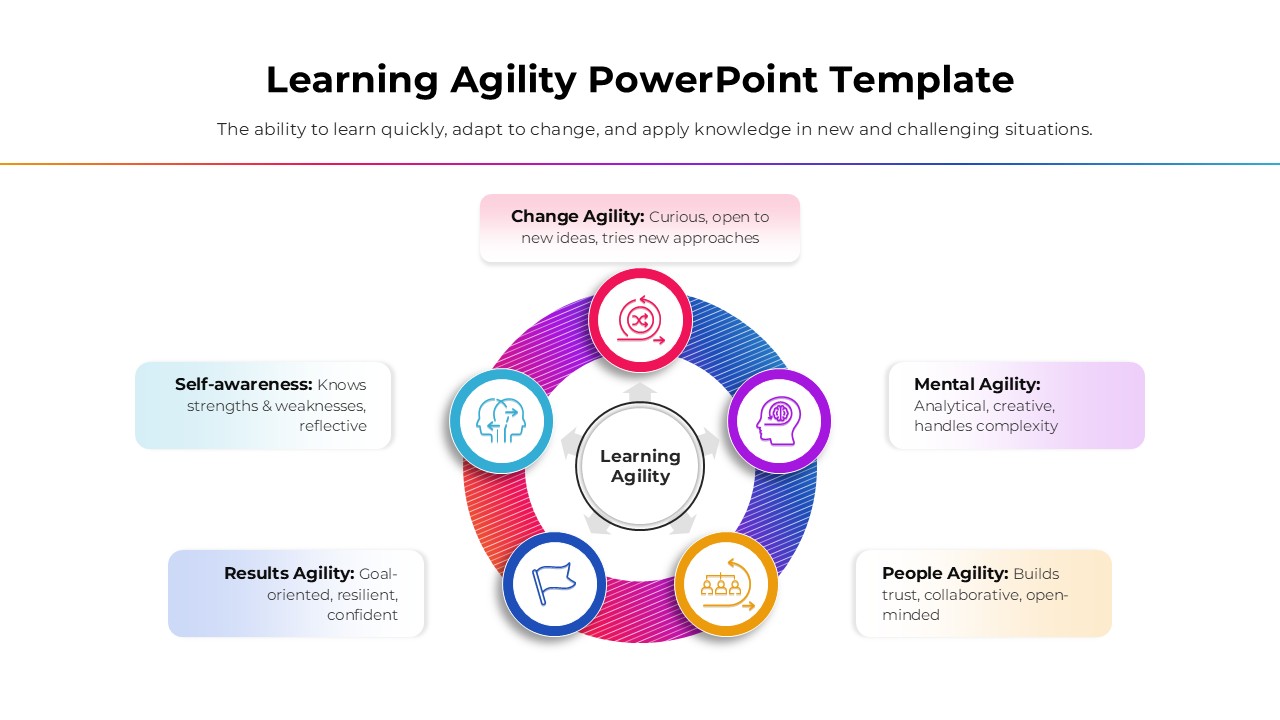
Learning Agility template for PowerPoint & Google Slides
Business
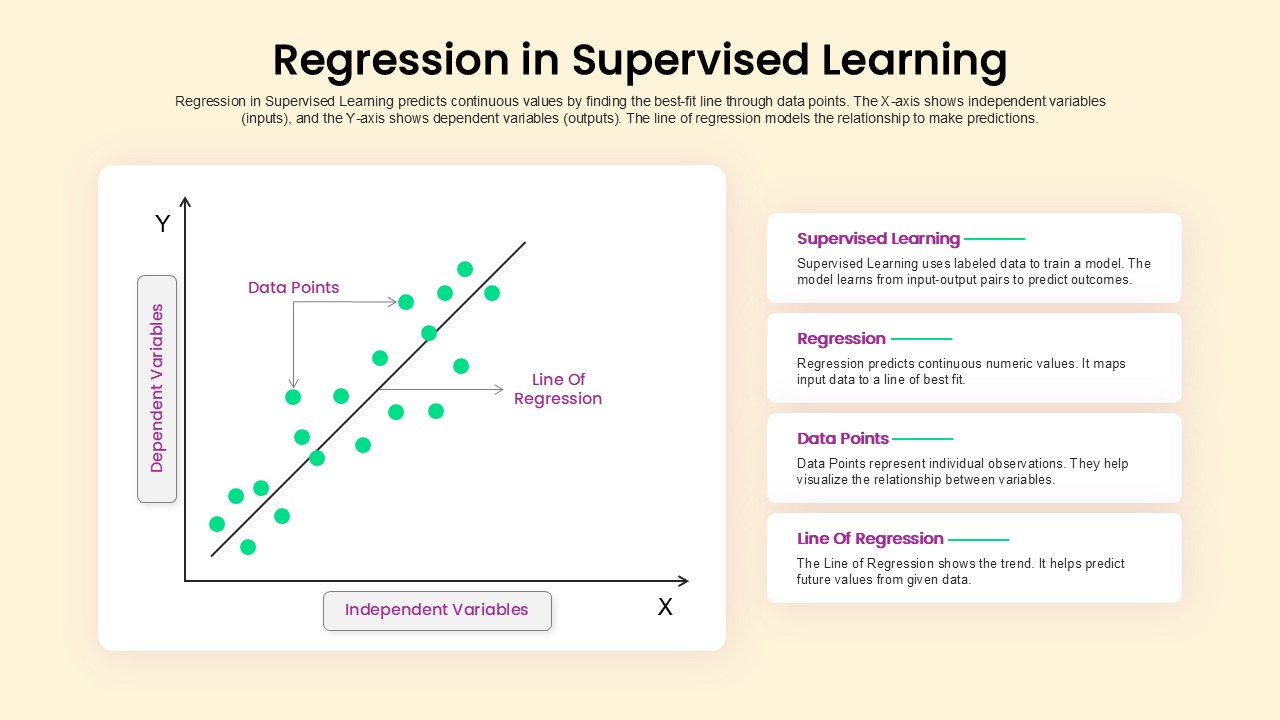
Regression in Supervised Learning Overview template for PowerPoint & Google Slides
Process
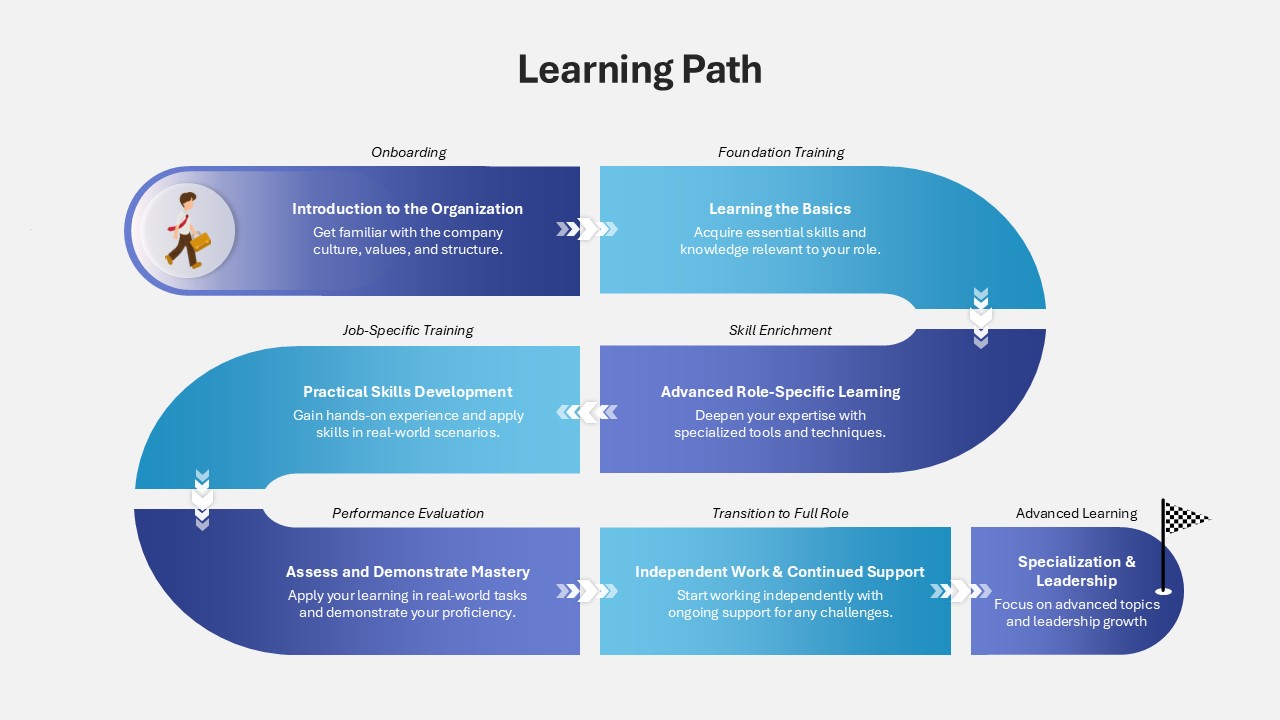
Learning Path Infographic Template for PowerPoint & Google Slides
Process
Q-Learning Process Flow Diagram Template for PowerPoint & Google Slides
Process
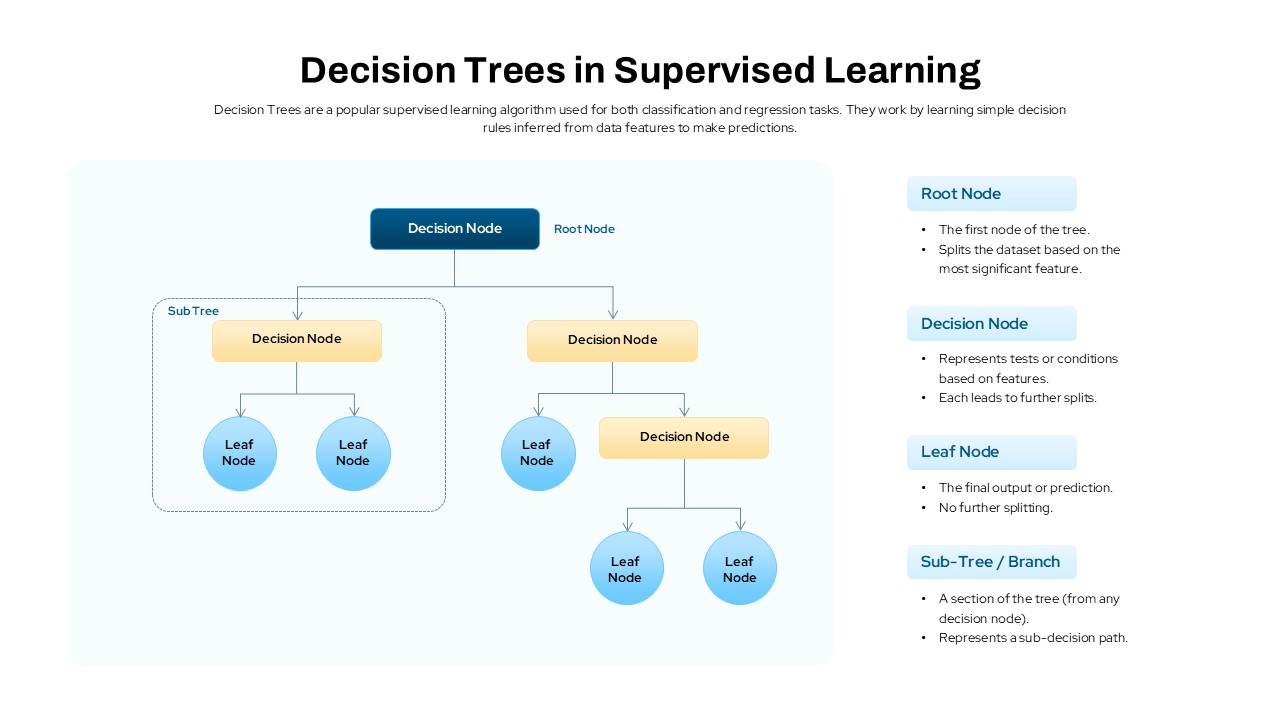
Decision Trees in Supervised Learning Template for PowerPoint & Google Slides
Machine Learning
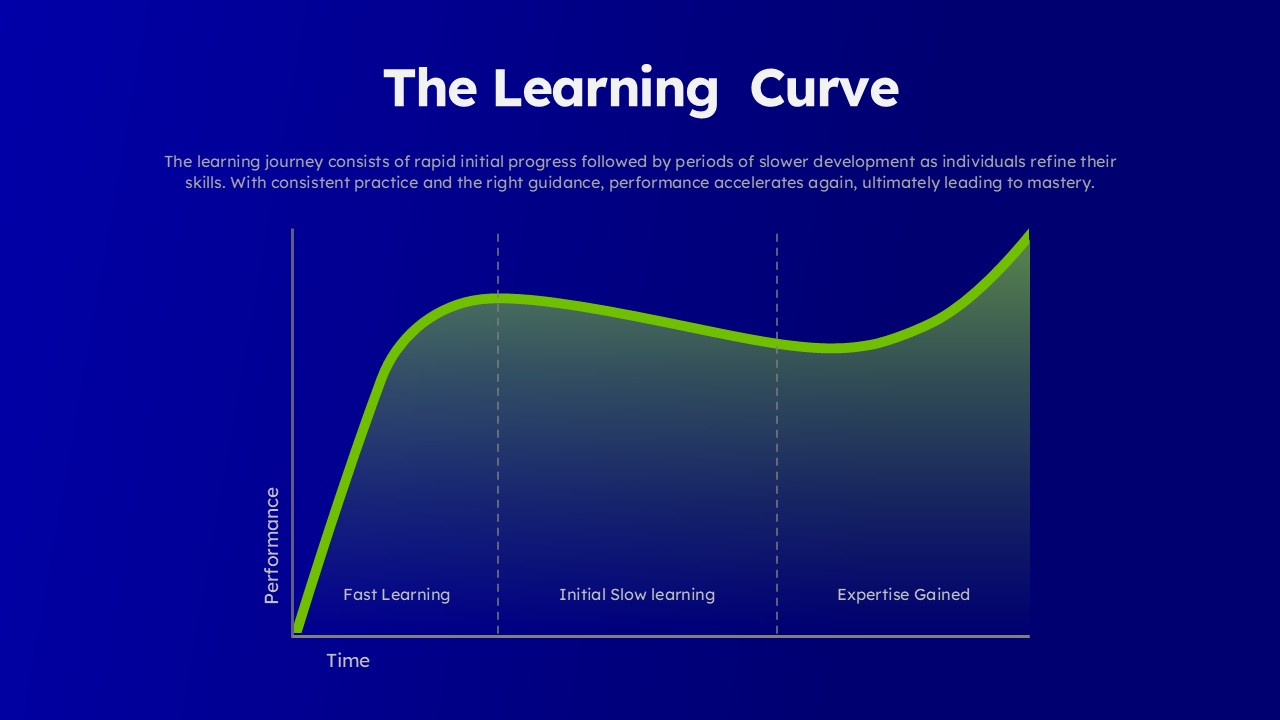
Learning Curve Performance Growth Chart Template for PowerPoint & Google Slides
Employee Performance
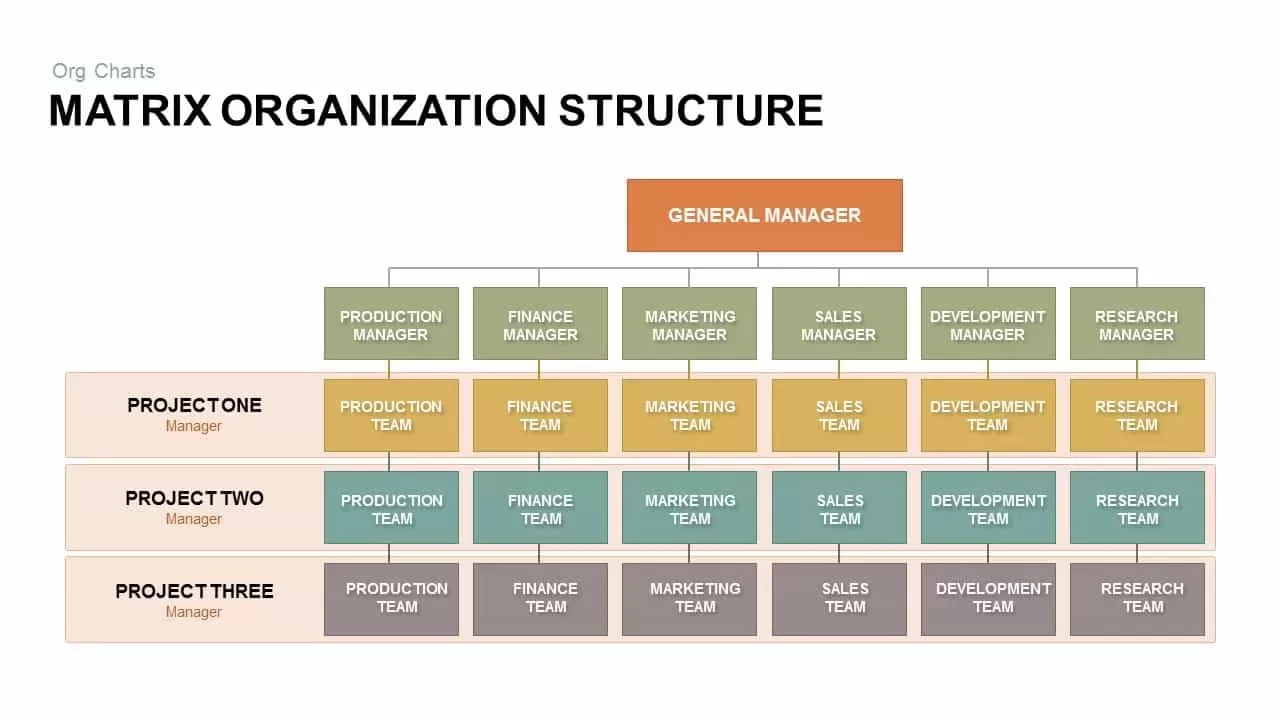
Matrix Organization Structure template for PowerPoint & Google Slides
Org Chart
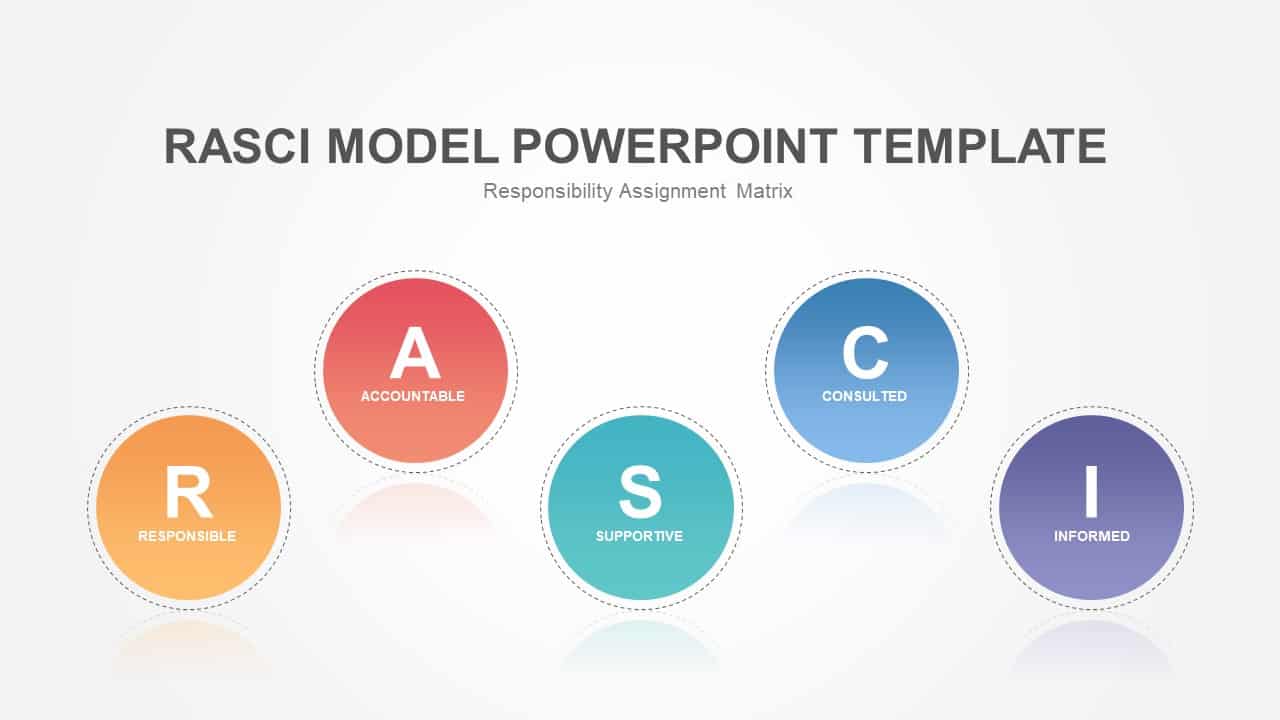
RASCI Responsibility Matrix Chart Template for PowerPoint & Google Slides
Business
Three-Year Strategic Plan Matrix Template for PowerPoint & Google Slides
Timeline
RASCI Responsibility Assignment Matrix Template for PowerPoint & Google Slides
Project
Strategic ADL Matrix by Industry Life Cycle & Position Template for PowerPoint & Google Slides
Business Strategy
Ansoff Growth Matrix Strategy Diagram Template for PowerPoint & Google Slides
Business Strategy
Supply Positioning Model Matrix Template for PowerPoint & Google Slides
Comparison Chart
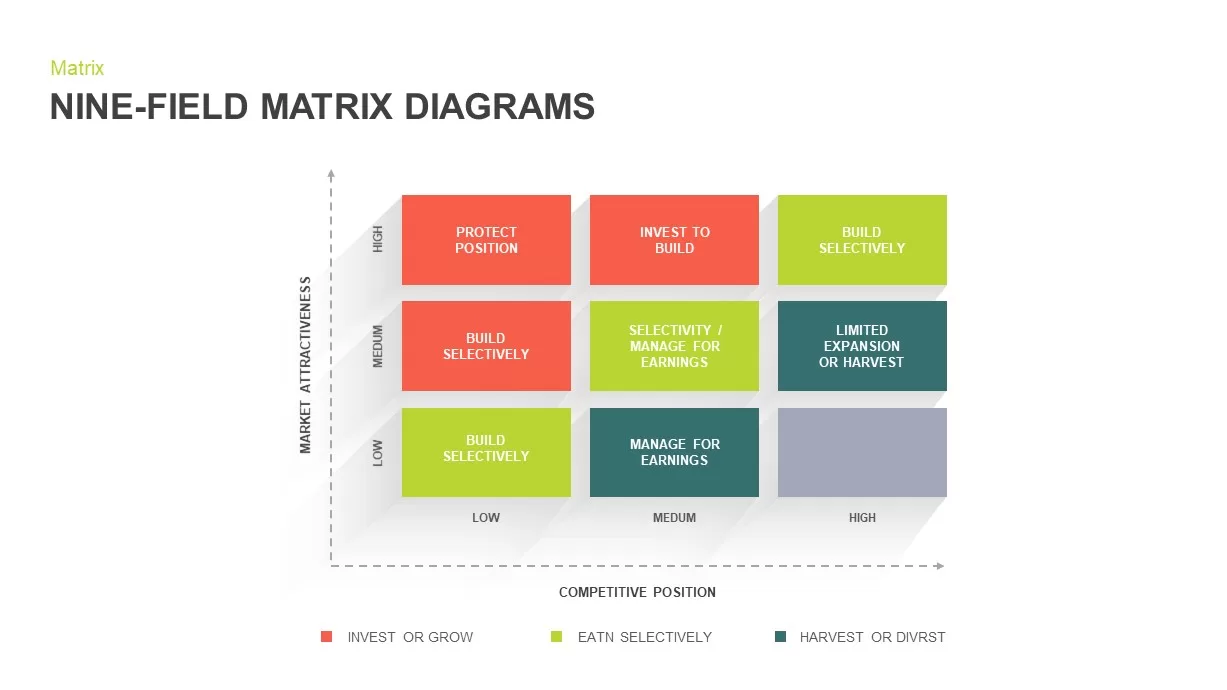
Nine-Field Matrix Diagrams Collection Template for PowerPoint & Google Slides
Comparison Chart
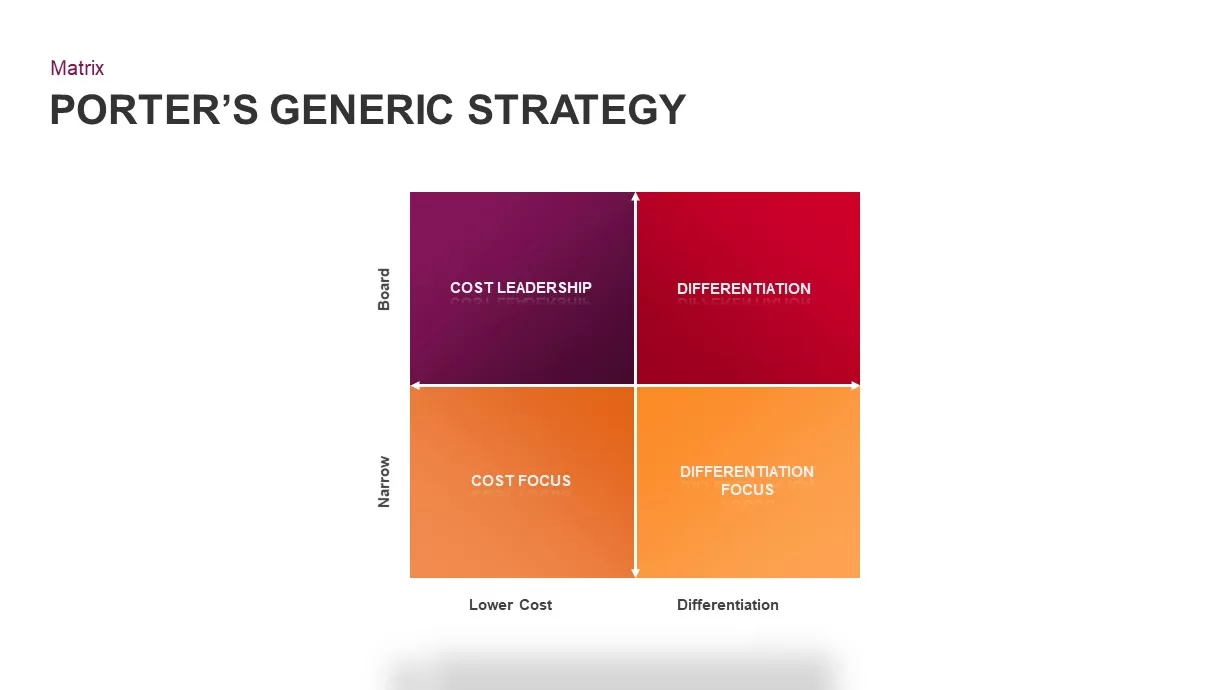
Porter’s Generic Strategy Matrix Diagram Template for PowerPoint & Google Slides
Competitor Analysis
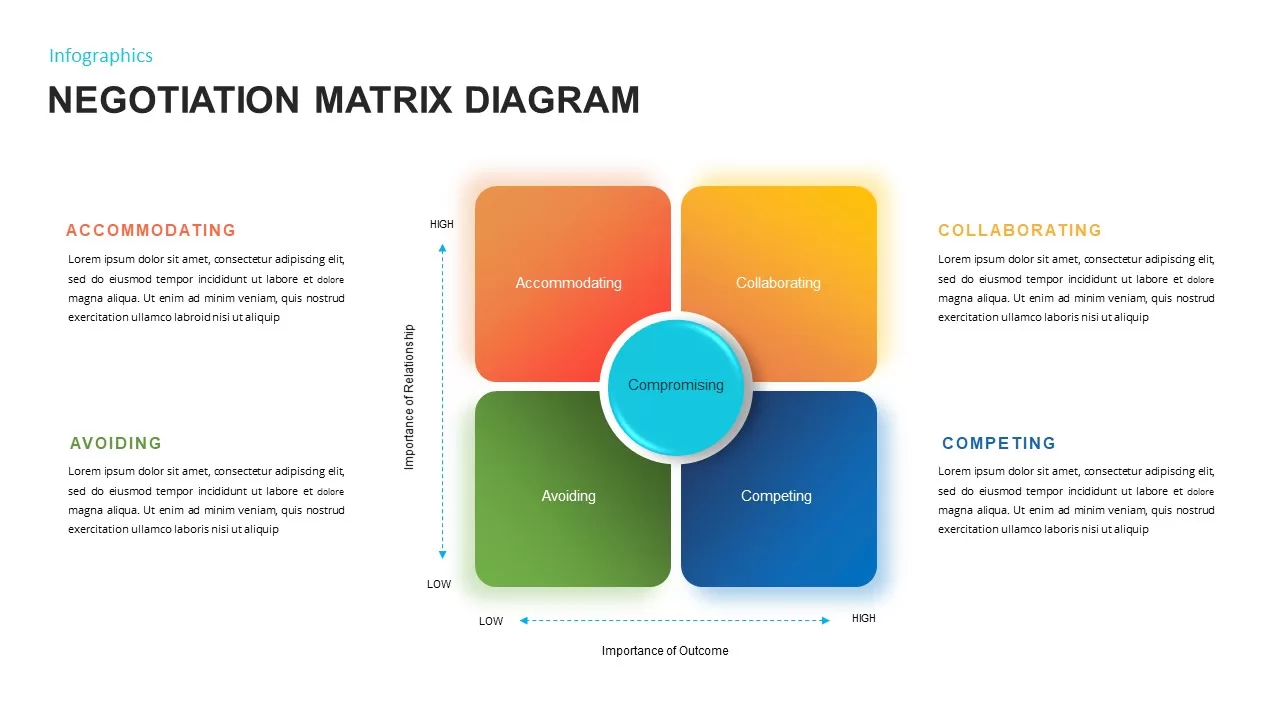
Negotiation Matrix Diagram Template for PowerPoint & Google Slides
Business
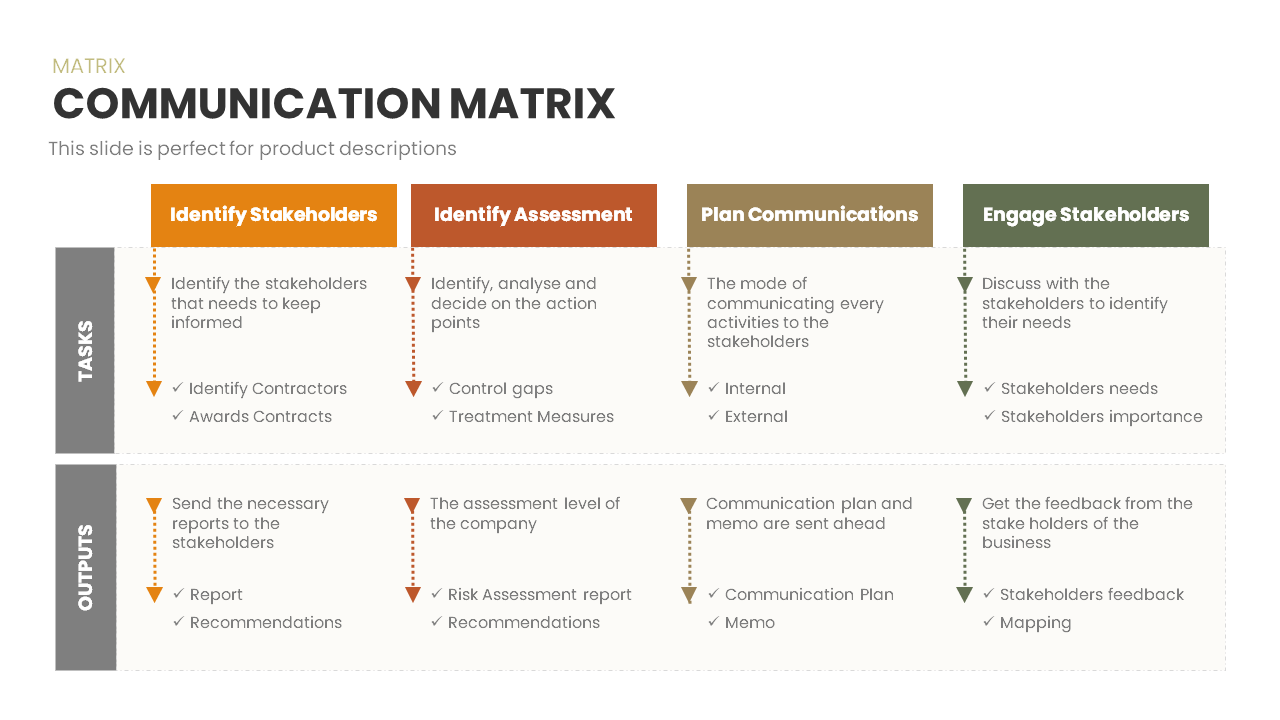
Communication Matrix Overview Template for PowerPoint & Google Slides
Business
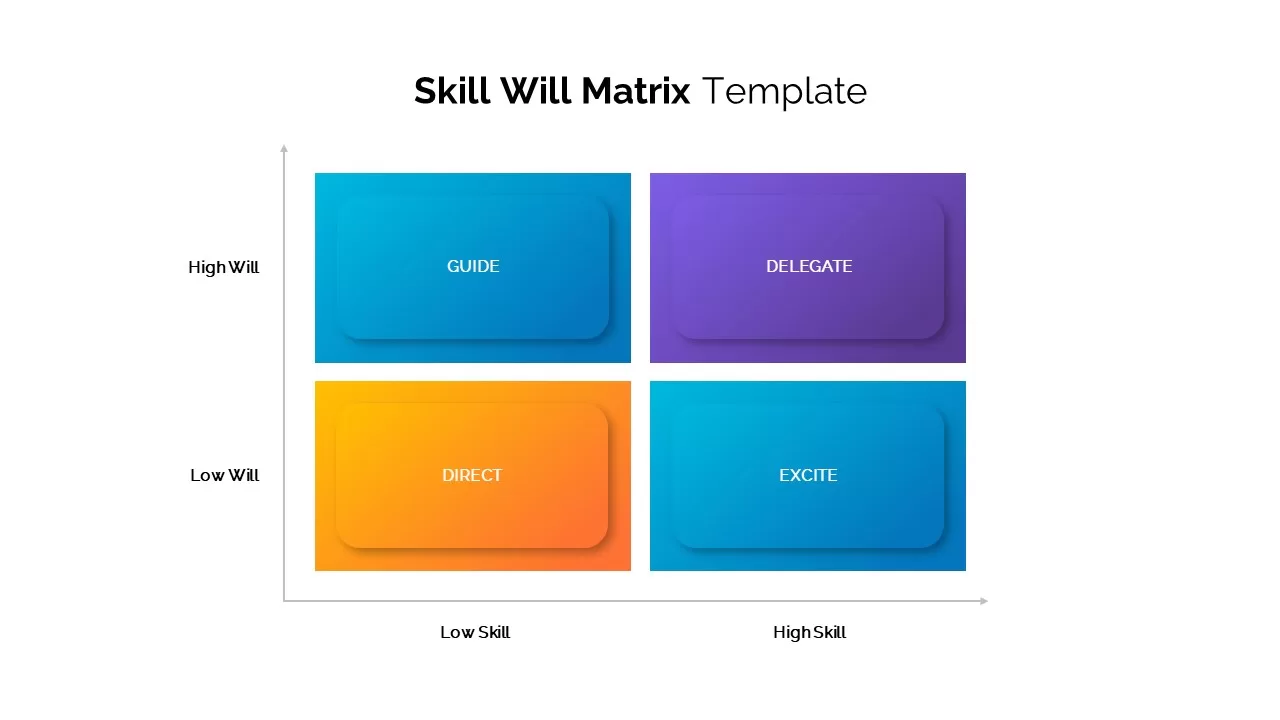
Skill Will Matrix Template for PowerPoint & Google Slides
Infographics
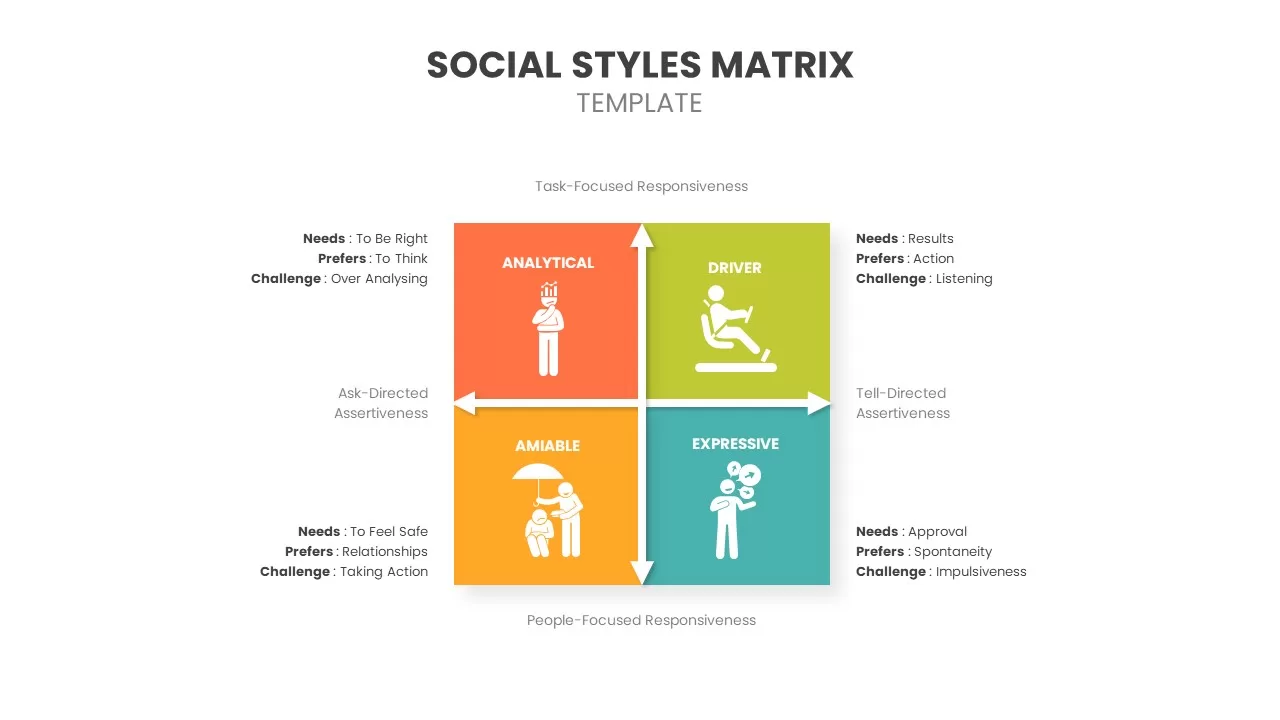
Social Styles Matrix Template for PowerPoint & Google Slides
Business
Pugh Matrix Decision Comparison Chart Template for PowerPoint & Google Slides
Comparison Chart
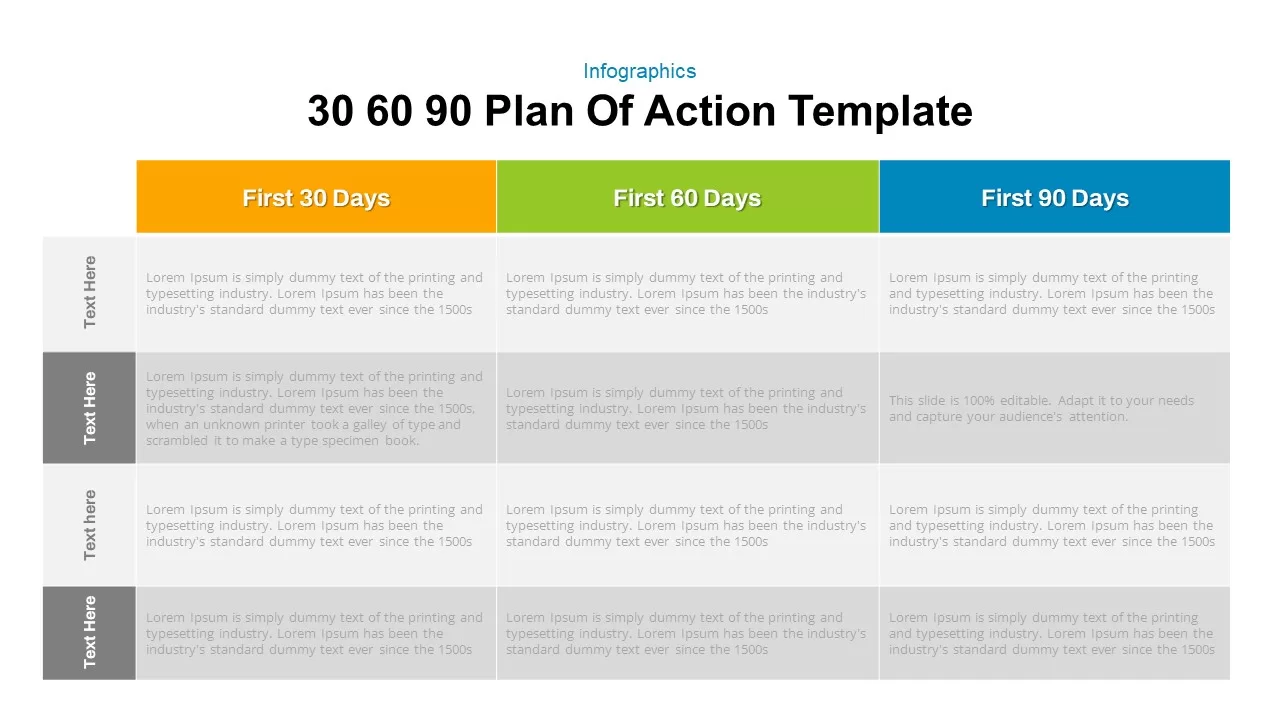
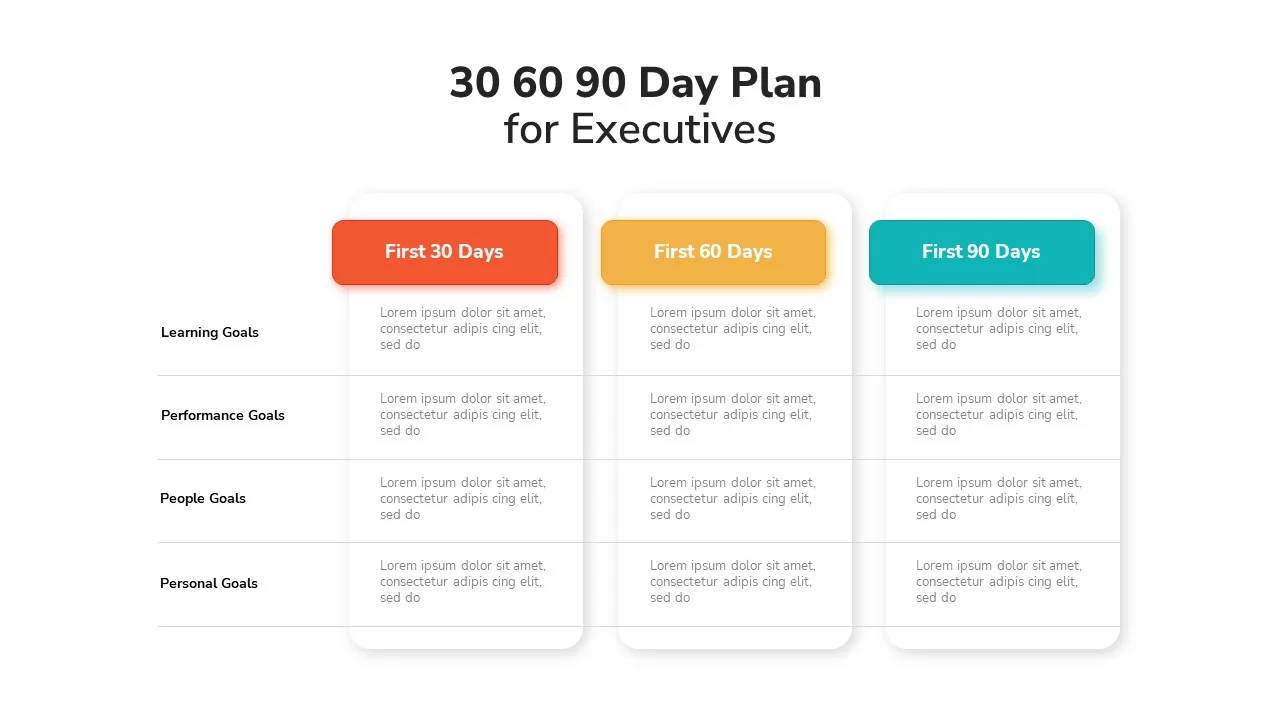
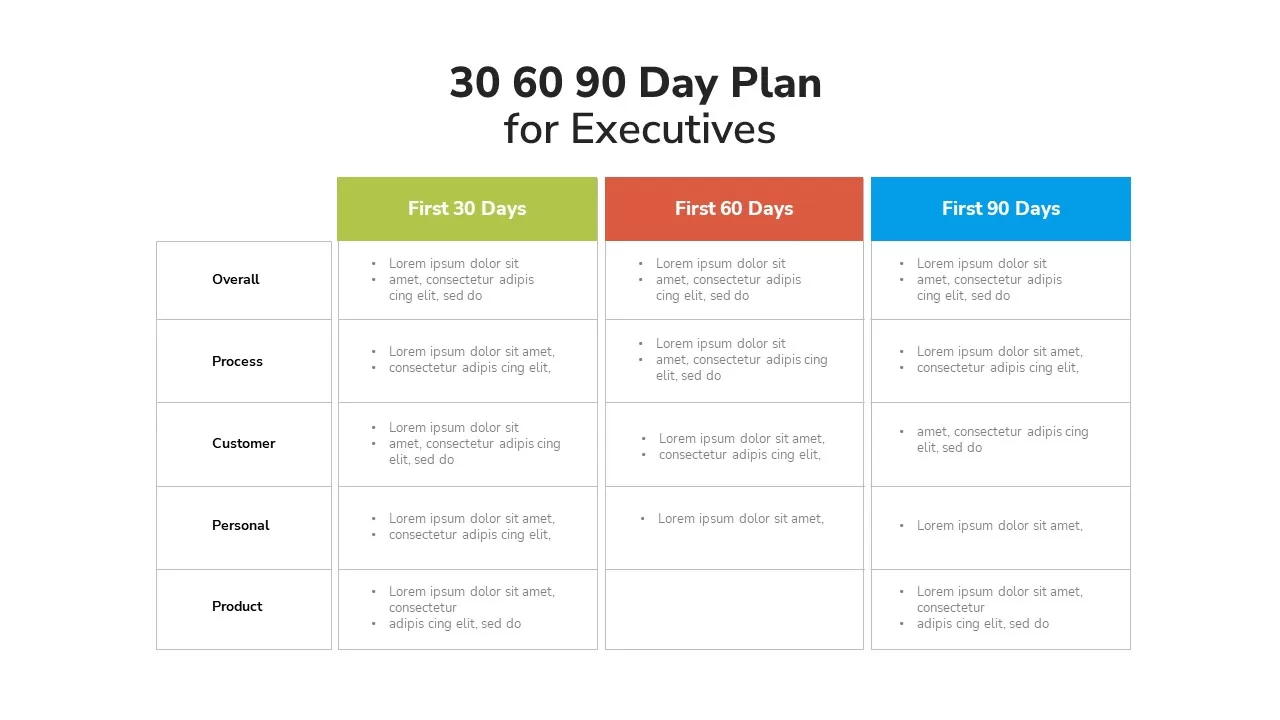
30 60 90 Day Plan Matrix Table Template for PowerPoint & Google Slides
Timeline
Executive 30-60-90 Day Plan Matrix Template for PowerPoint & Google Slides
Timeline
Executive 30-60-90 Day Plan Matrix Template for PowerPoint & Google Slides
Timeline
9-Box Matrix for Performance & Potential Template for PowerPoint & Google Slides
Employee Performance
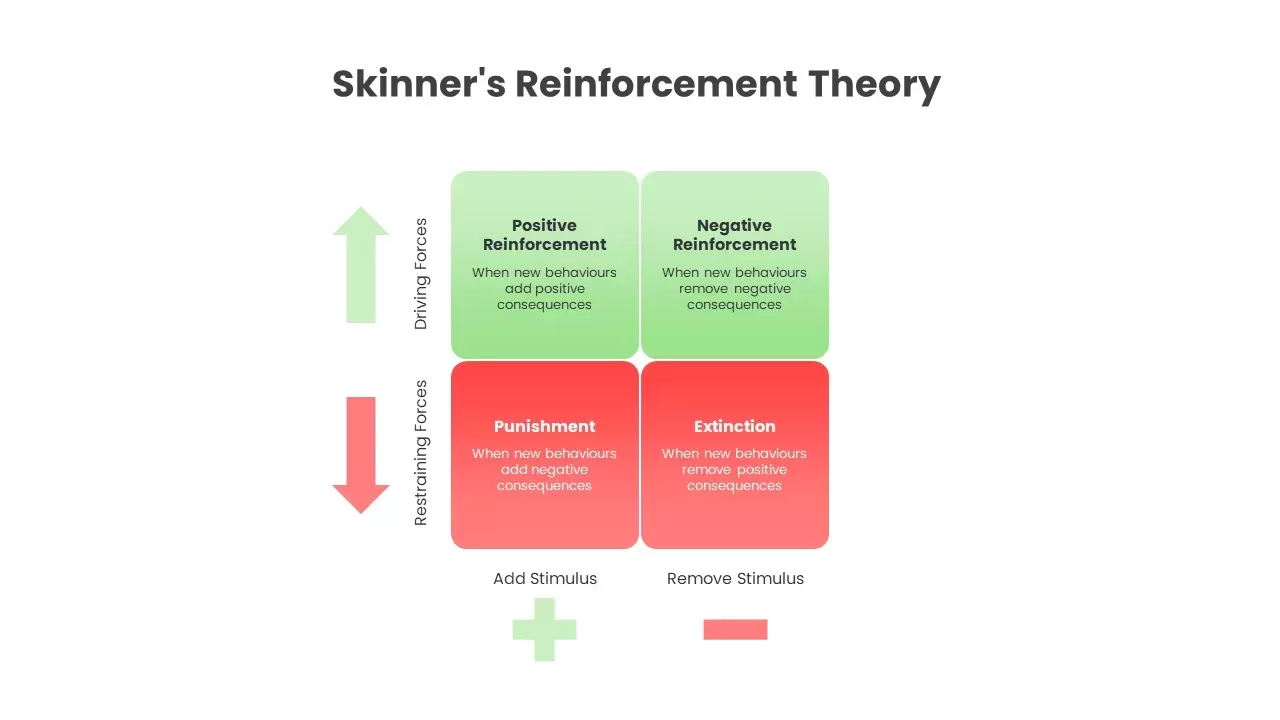
Skinner’s Reinforcement Theory Matrix Template for PowerPoint & Google Slides
Comparison
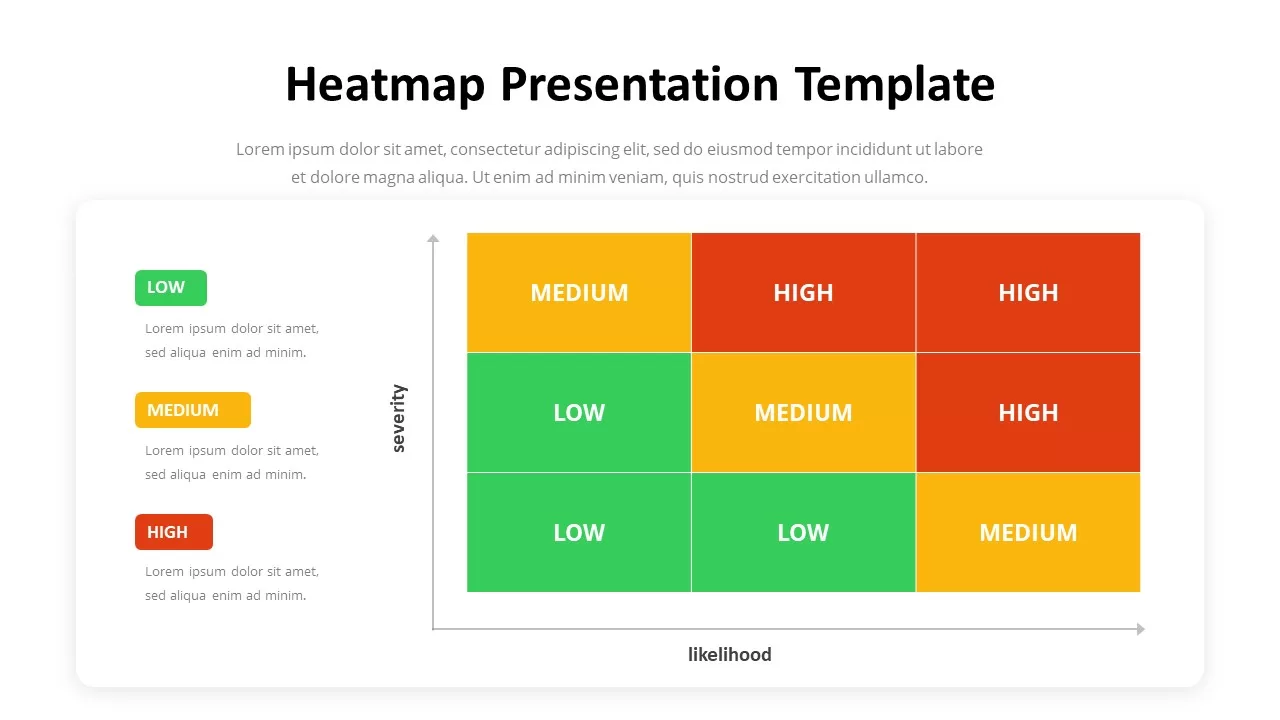
Heatmap Matrix Template for PowerPoint & Google Slides
Maps
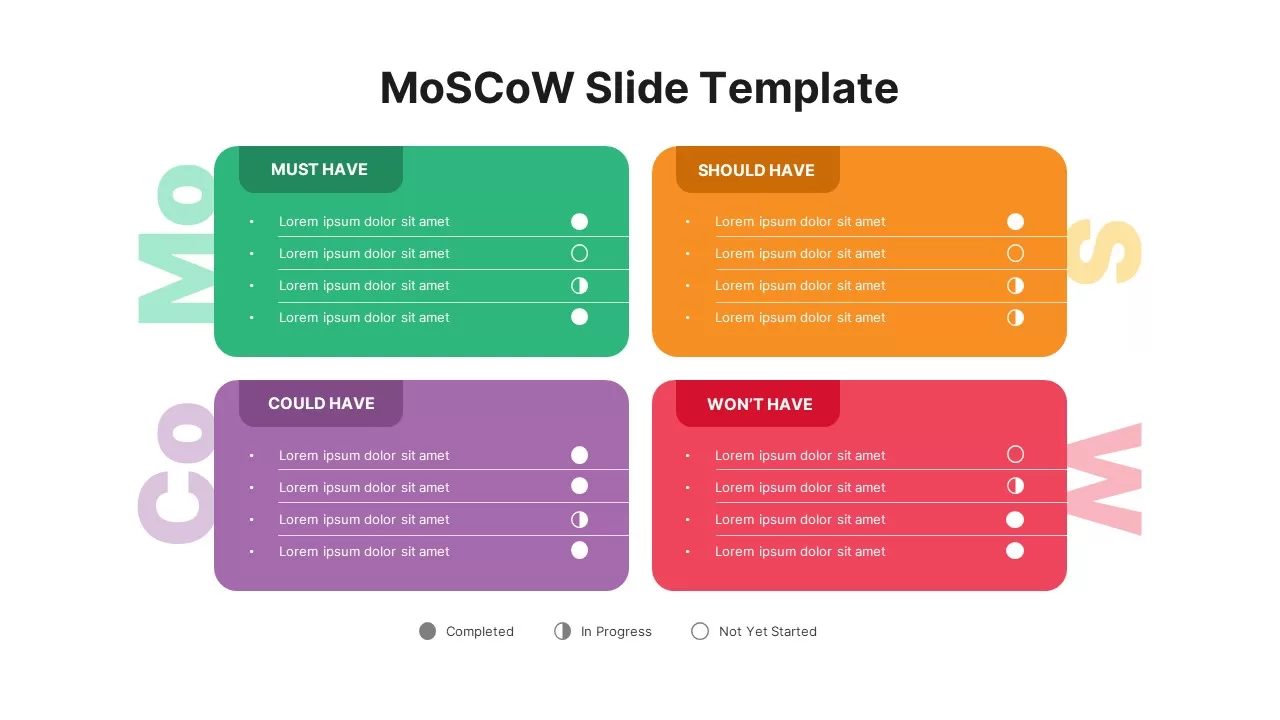
MoSCoW Prioritization Matrix Slide Template for PowerPoint & Google Slides
Business Strategy
MABA Attractiveness Matrix Chart Template for PowerPoint & Google Slides
Comparison Chart
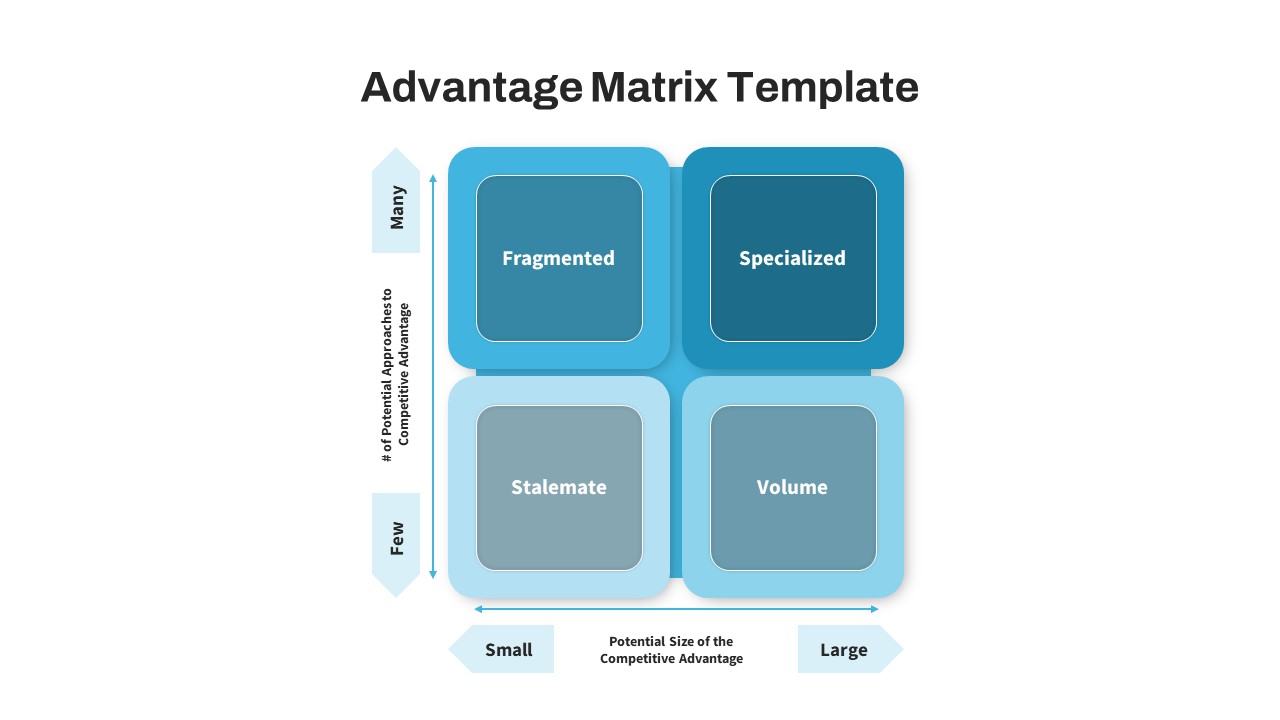
Advantage Matrix 2×2 Framework Template for PowerPoint & Google Slides
Competitor Analysis
Business Growth Strategies Matrix Template for PowerPoint & Google Slides
Comparison
Free Competitor Analysis Matrix Template for PowerPoint & Google Slides
Competitor Analysis
Free
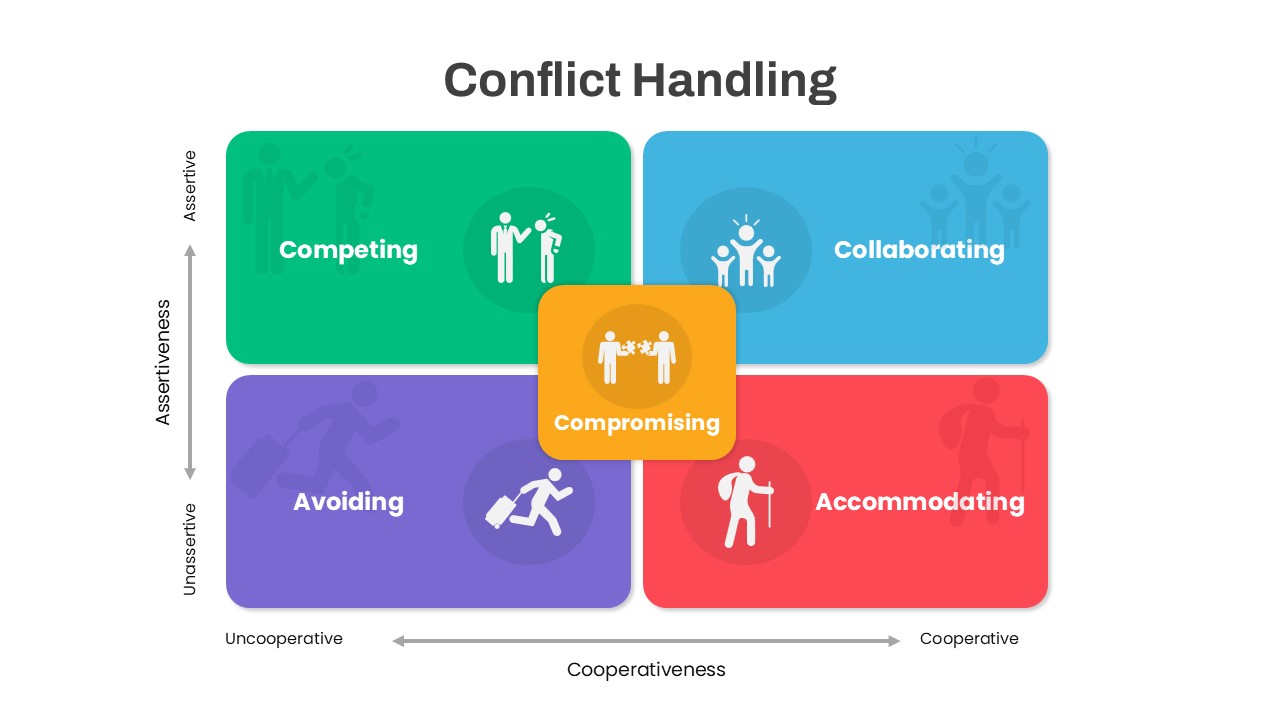
Colorful Conflict Handling Matrix Template for PowerPoint & Google Slides
Comparison
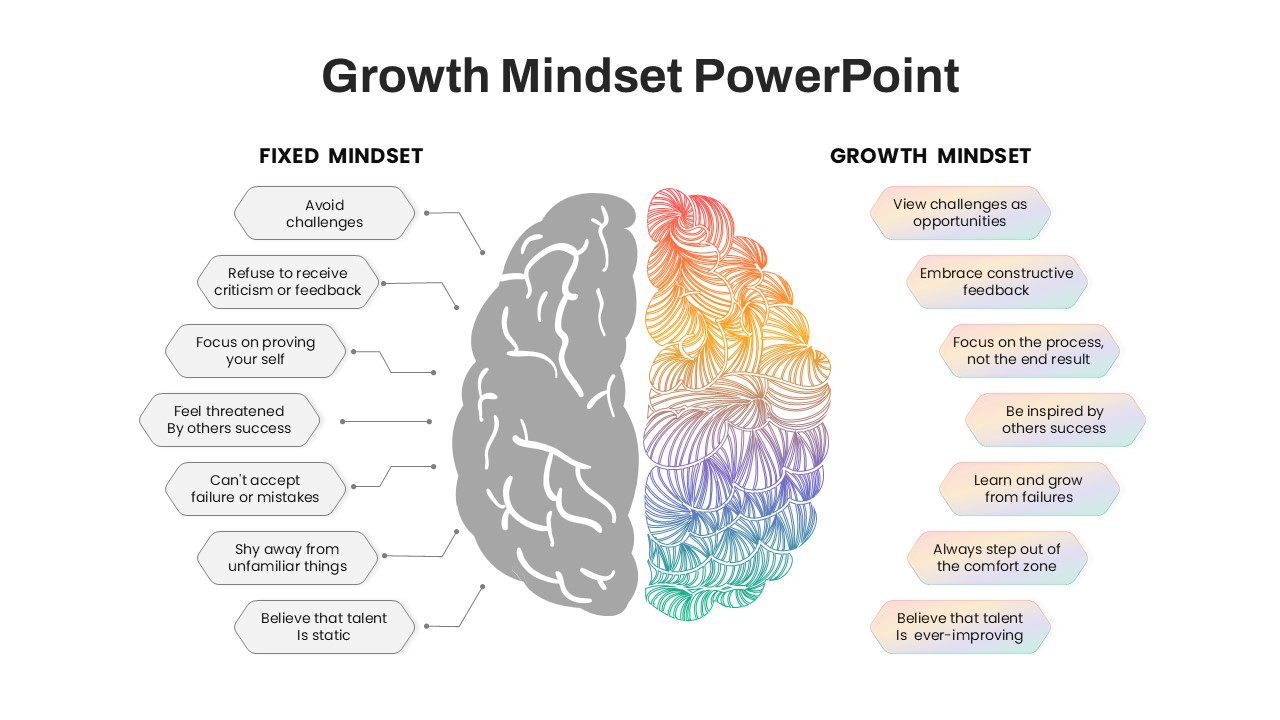
Fixed vs Growth Mindset Matrix Template for PowerPoint & Google Slides
Comparison
Decision Matrix & Prioritization Chart Template for PowerPoint & Google Slides
Comparison Chart
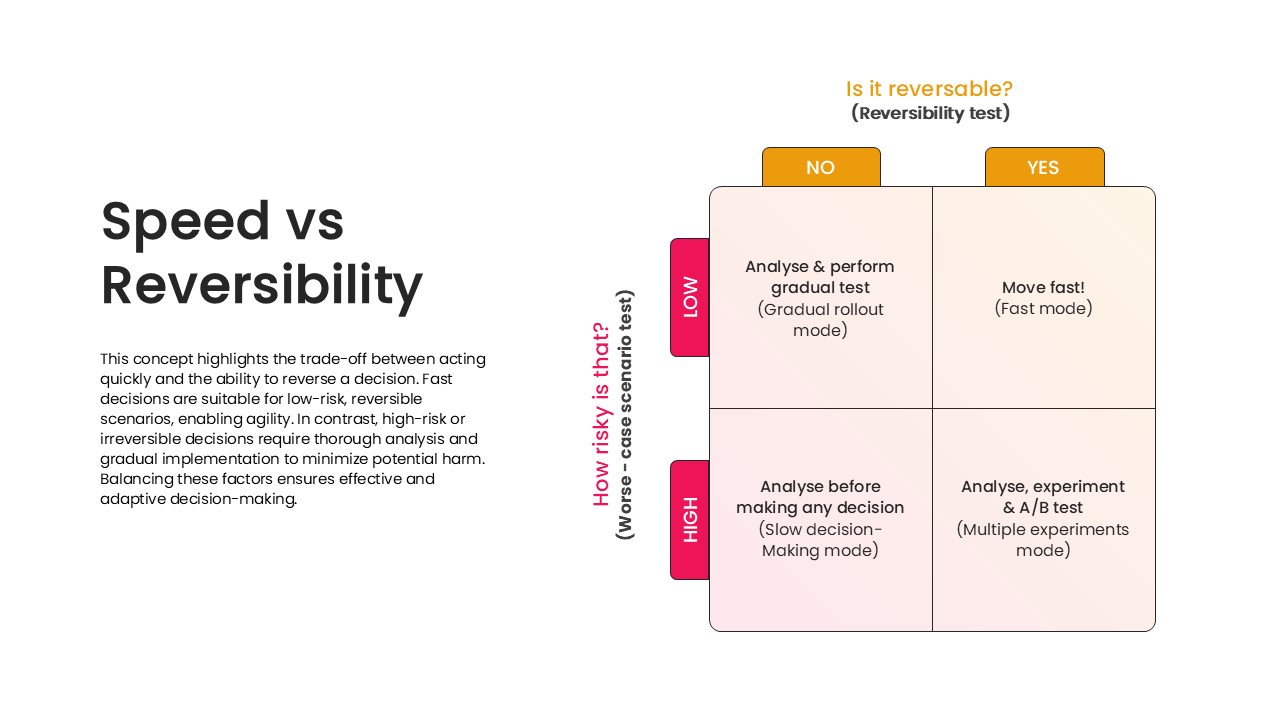
Speed vs Reversibility Decision Matrix Template for PowerPoint & Google Slides
Comparison
Ansoff Growth Matrix Professional Template for PowerPoint & Google Slides
Comparison
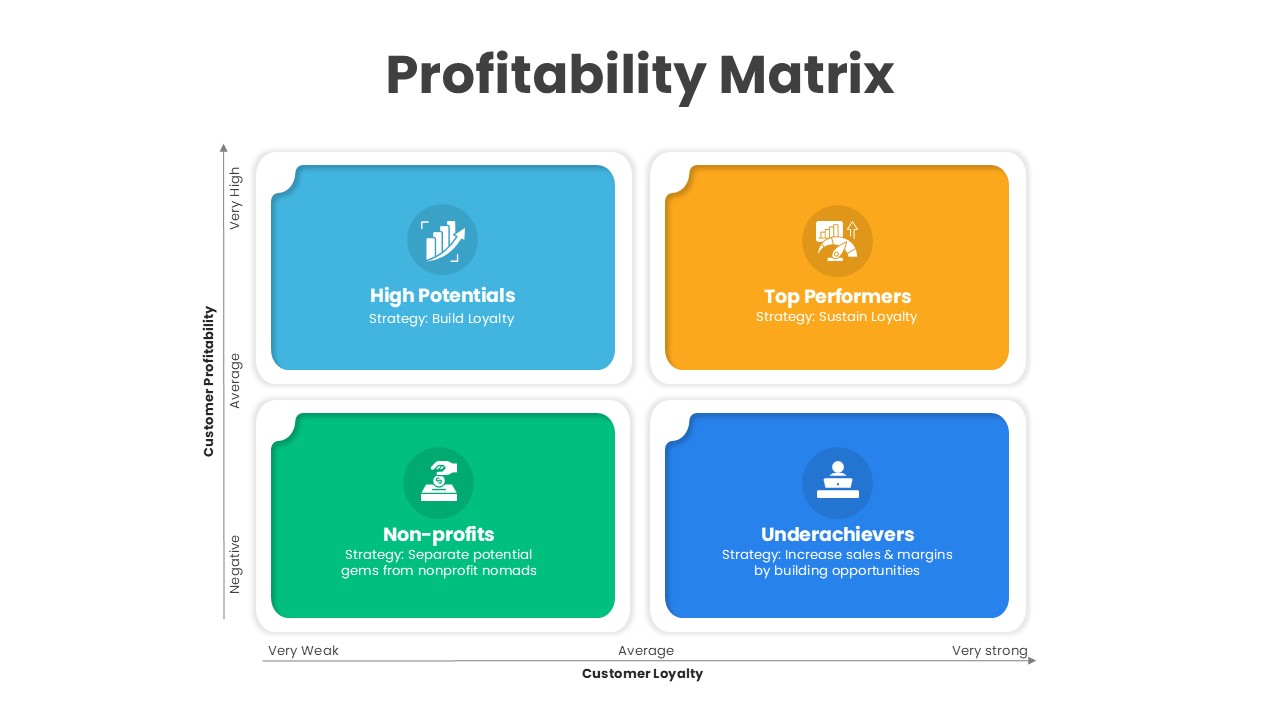
Customer Loyalty & Profitability Matrix Template for PowerPoint & Google Slides
Comparison
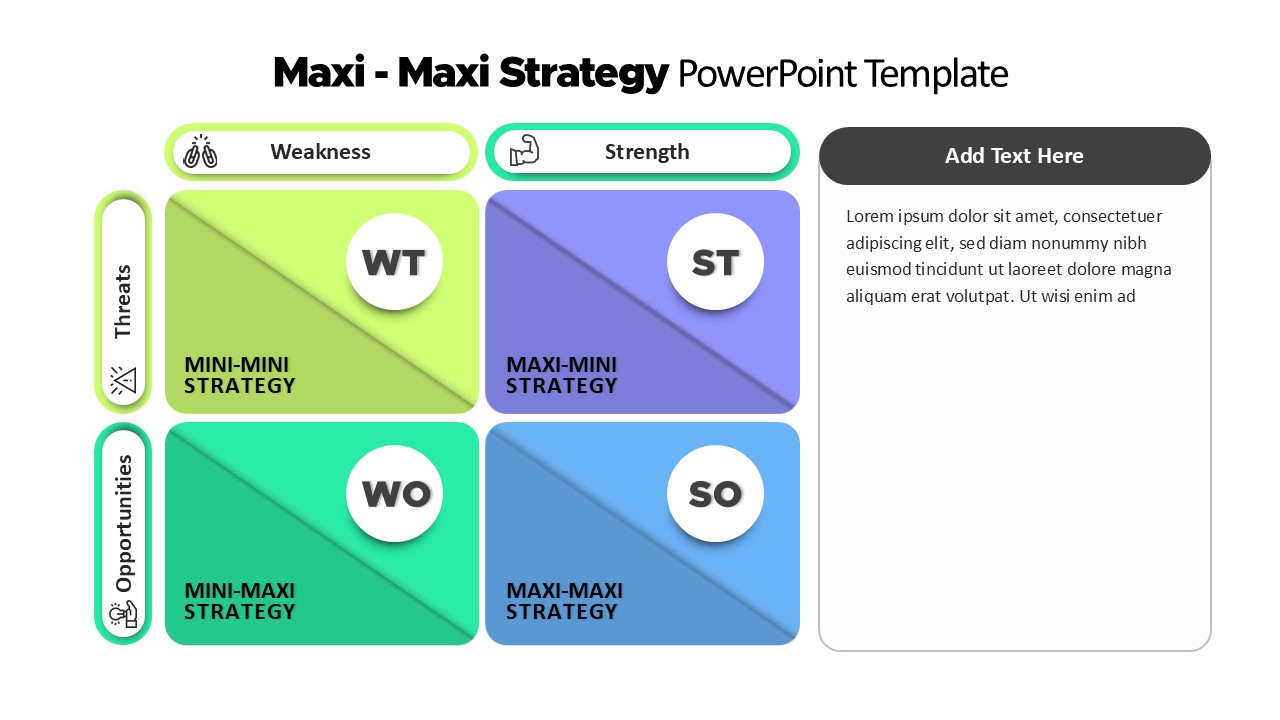
Maxi-Maxi Strategy Matrix SWOT Diagram Template for PowerPoint & Google Slides
SWOT
Confusion Matrix Diagram Overview Template for PowerPoint & Google Slides
Comparison
Risk Scoring & Ranking Heatmap Matrix Template for PowerPoint & Google Slides
Risk Management
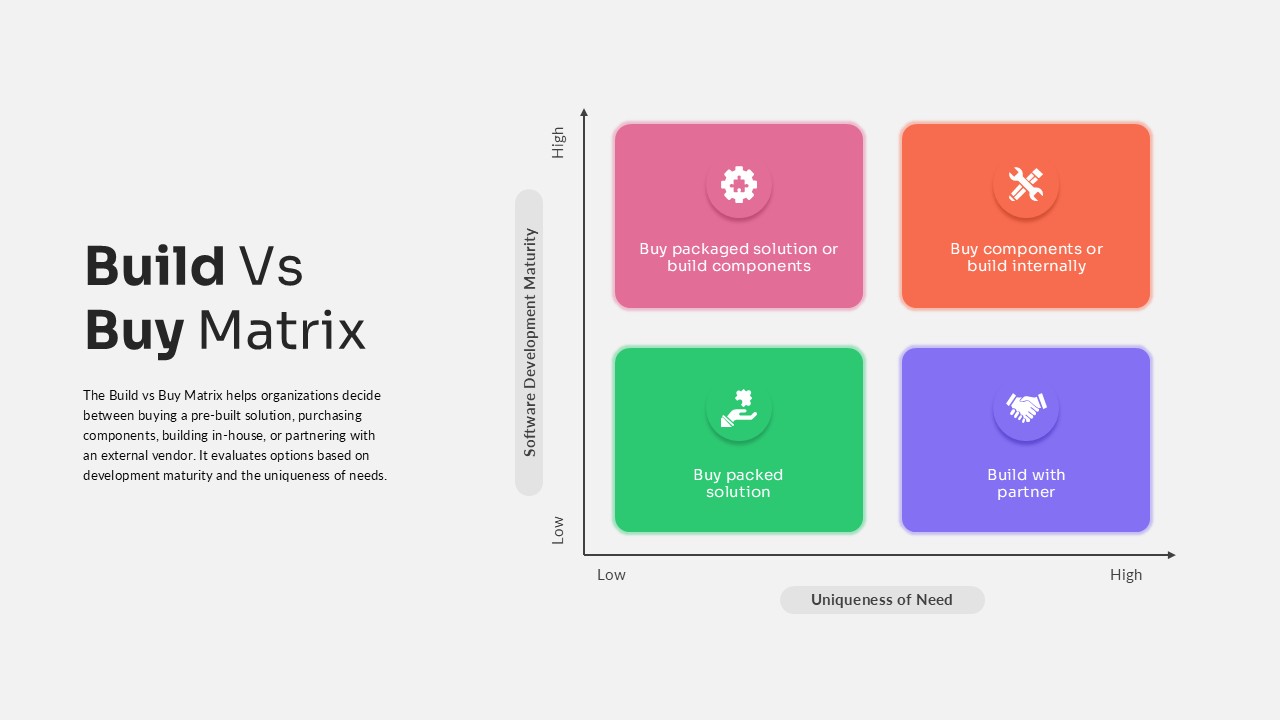
Build vs Buy Matrix Decision Framework template for PowerPoint & Google Slides
Business Strategy
Disaster Response Role Matrix RACI Chart Template for PowerPoint & Google Slides
Project Status
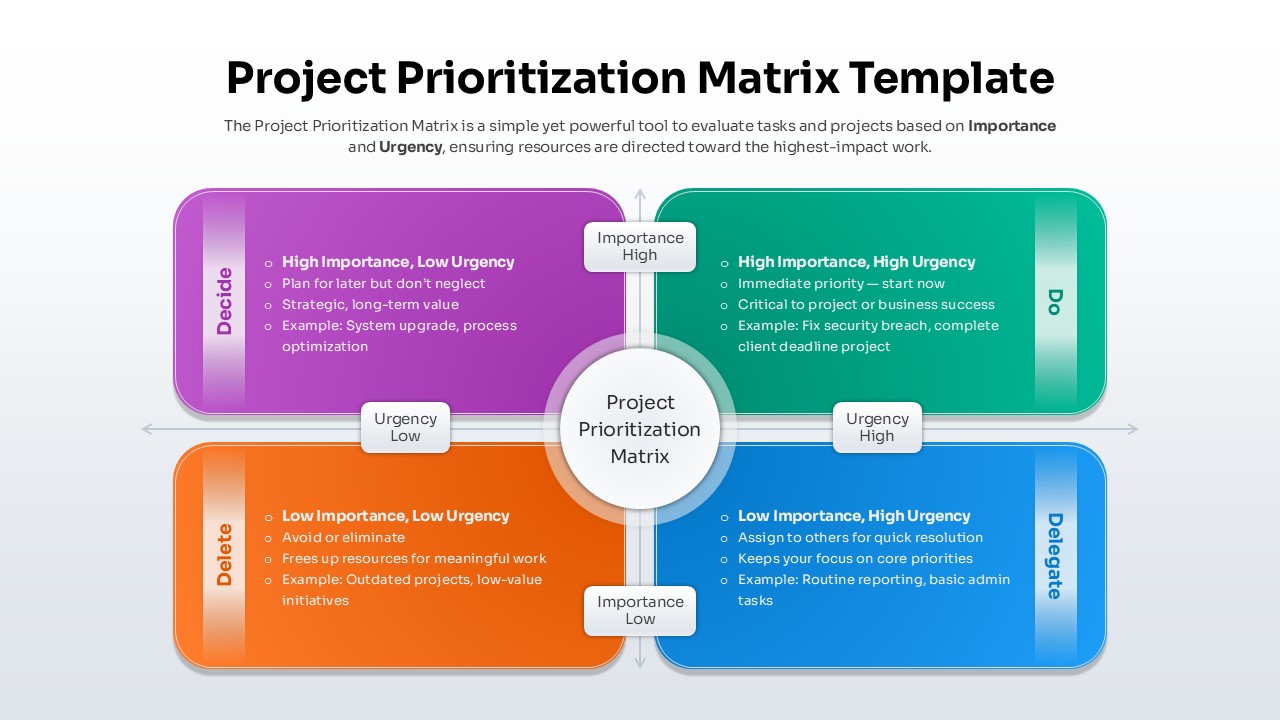
Project Prioritization Matrix Template for PowerPoint & Google Slides
Project
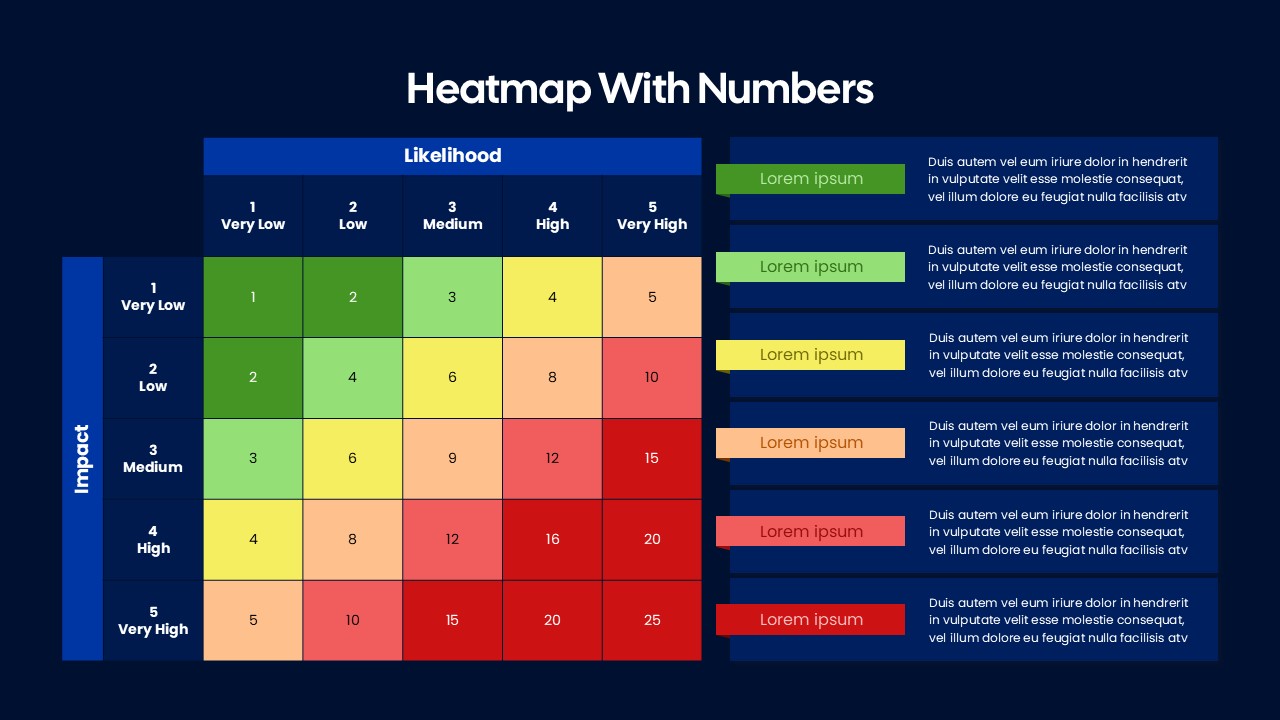
Heatmap Matrix with Numbers Template for PowerPoint & Google Slides
Project
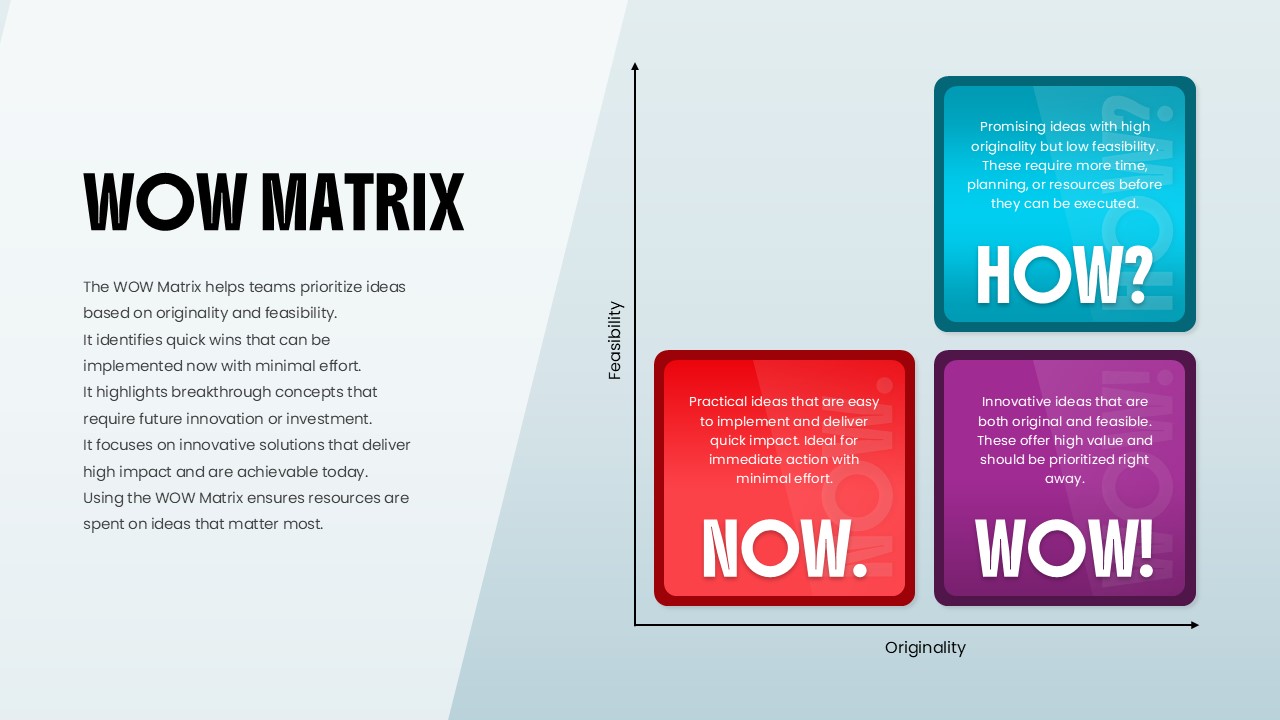
WOW Matrix Template for PowerPoint & Google Slides
Business Strategy

Impact Effort Matrix Template for PowerPoint & Google Slides
Comparison Chart
Ansoff Growth Matrix Template for PowerPoint & Google Slides
Business Strategy
Materiality Assessment Matrix Diagram Template for PowerPoint & Google Slides
Risk Management
IT Gap Analysis Assessment Matrix Template for PowerPoint & Google Slides
Information Technology