Custom Company Features Box Diagram Template for PowerPoint & Google Slides
Description
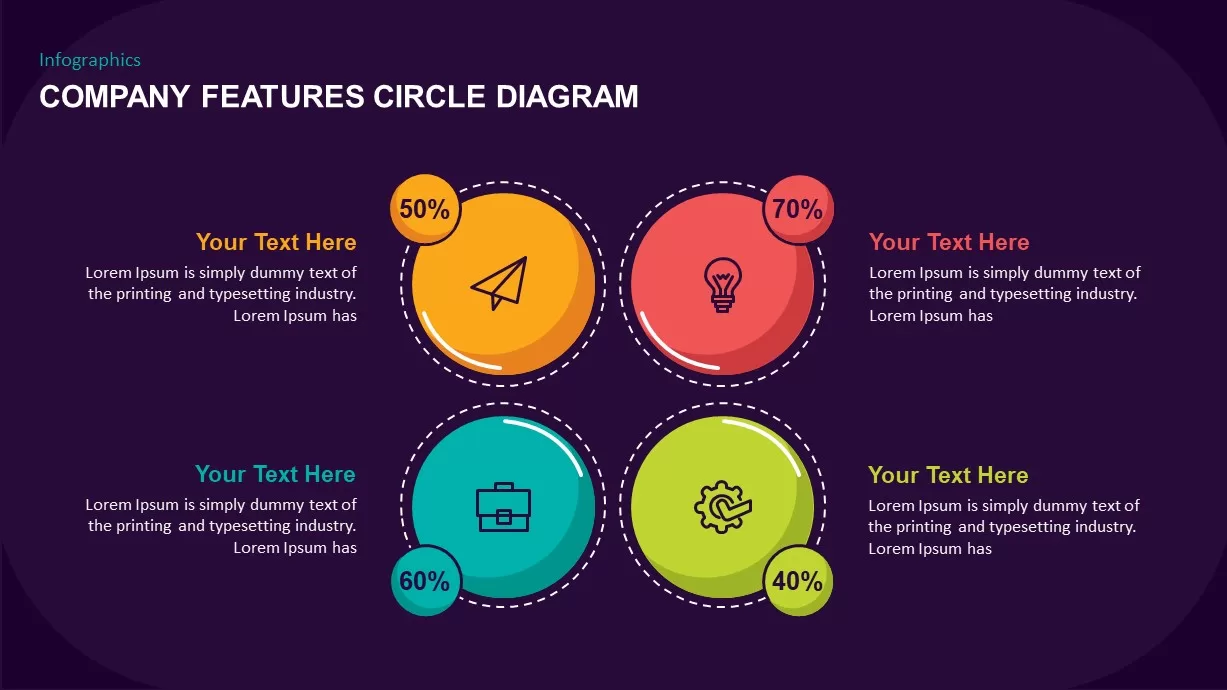
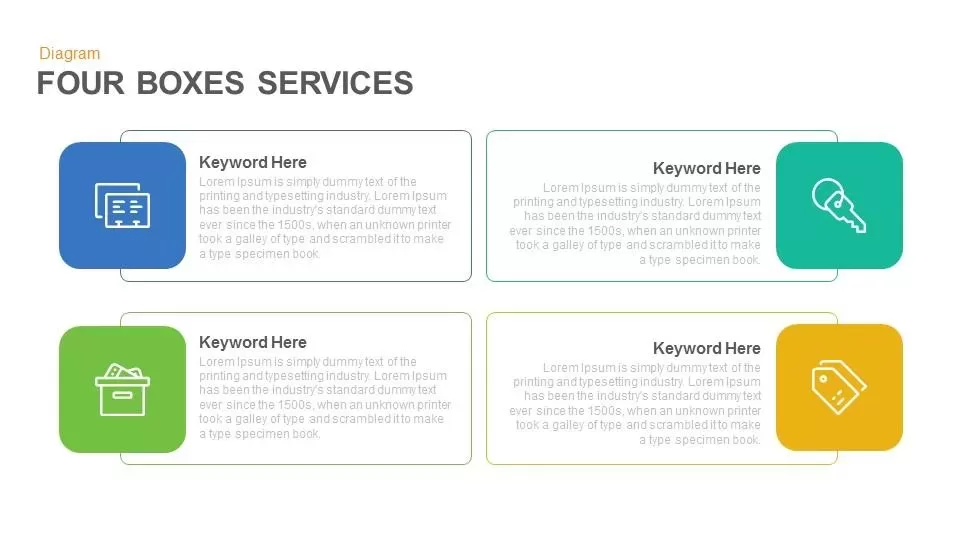
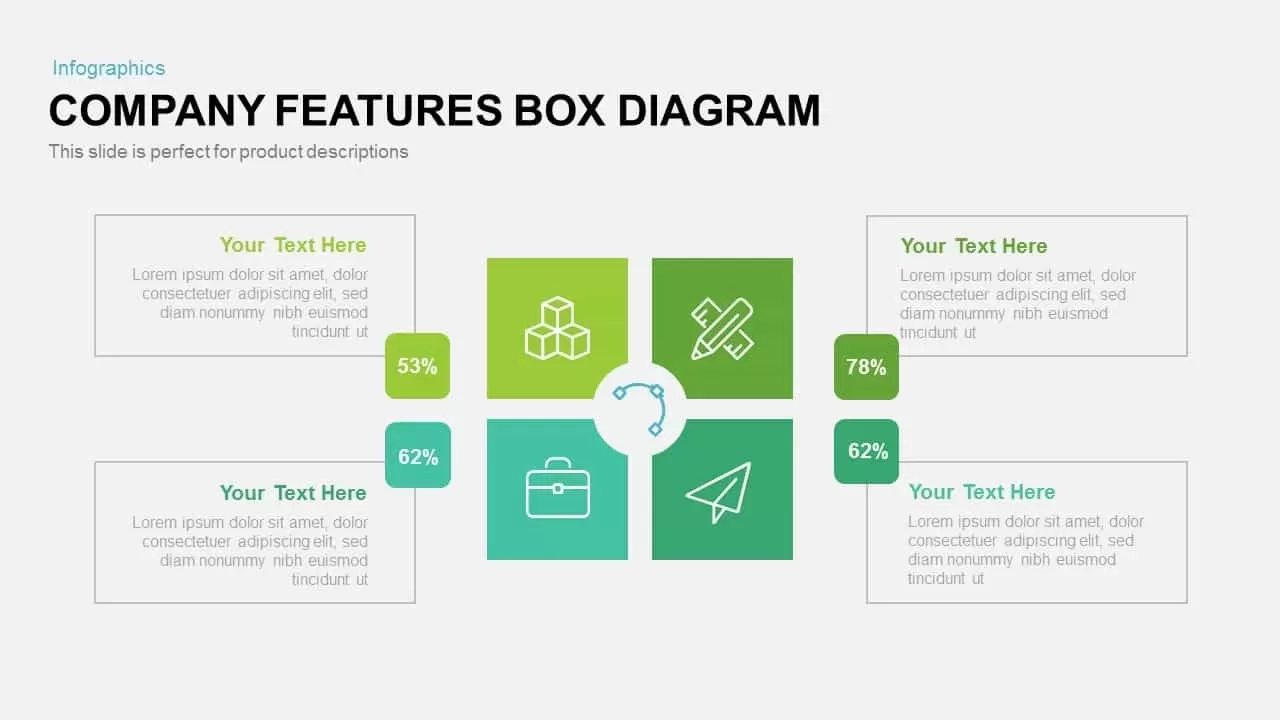
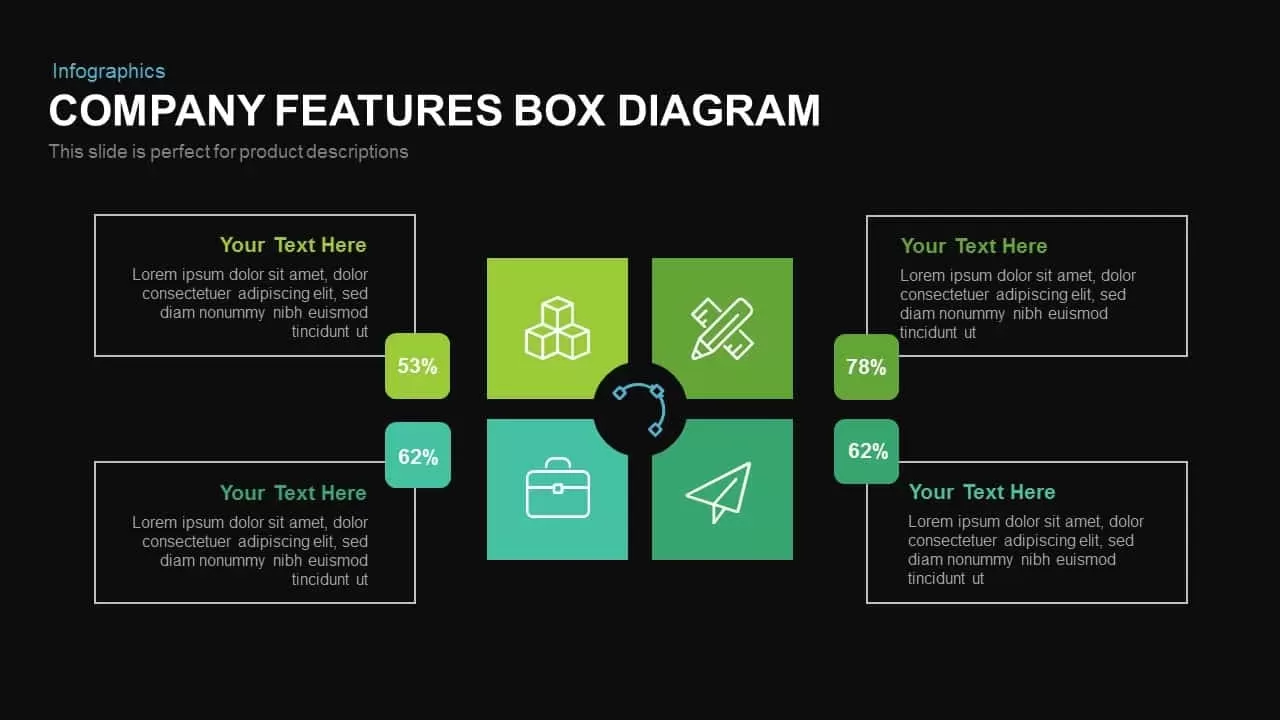
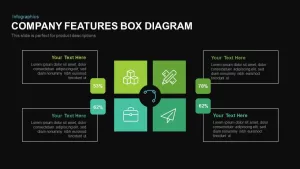
Leverage this dynamic company features box diagram slide to highlight four core attributes, metrics, or product strengths in a cohesive, visually balanced framework. At its center, a crisp circular hub anchors four surrounding feature boxes arranged in a square grid, each containing an editable icon and a percentage callout for instant data emphasis. The adjacent text panels provide bold headline placeholders and concise description blocks, allowing you to communicate benefits, KPI metrics, or unique selling points with clarity.
Crafted entirely with editable vector shapes and master slide layouts, this template delivers complete design freedom: swap icons from the embedded fifty-plus symbol library, adjust percentage values and colors to match corporate brand palettes, or modify typography without loss of resolution. Precision snap-to-grid alignment guides and optional drop shadows maintain perfect symmetry and visual depth, while intuitive placeholders streamline content updates and accelerate deck building. Duplicate or remove feature boxes and data callouts to scale the diagram to your narrative requirements.
Optimized for both PowerPoint and Google Slides, this slide preserves high-definition clarity across devices and screen resolutions, eliminating formatting headaches and ensuring a polished appearance in boardrooms, webinars, or client meetings. The modular structure and locked guides support collaborative cloud editing and real-time adjustments, making it ideal for sales presentations, product roadmaps, or investor pitch decks. With its modern flat design and data-driven focus, this company features box diagram enhances audience engagement, drives strategic conversations, and simplifies complex information into an impactful visual story.
Engineered for versatility, the diagram excels beyond company features—repurpose it to map customer satisfaction metrics, operational KPIs, market segment breakdowns, or competitive analyses. Use the central hub to anchor theme icons or core values, then branch out with feature-specific data callouts to illustrate performance trends or priority areas. Quickly rebrand the slide by swapping color schemes and iconography, ensuring alignment with diverse presentations and consistent messaging across your deck.
Who is it for
Product managers, marketing strategists, business analysts, and sales leaders will leverage this slide to showcase company features, track KPIs, and communicate product benefits in sales decks and stakeholder presentations.
Other Uses
Repurpose this diagram for competitor feature comparisons, customer satisfaction surveys, team performance dashboards, or risk factor highlights. Use the central hub to anchor core values or project milestones, then illustrate supporting metrics with percentage callouts around the layout.
Login to download this file

Item ID
SB00553
Related Templates

Custom Customer Service Infographics Template for PowerPoint & Google Slides
Process

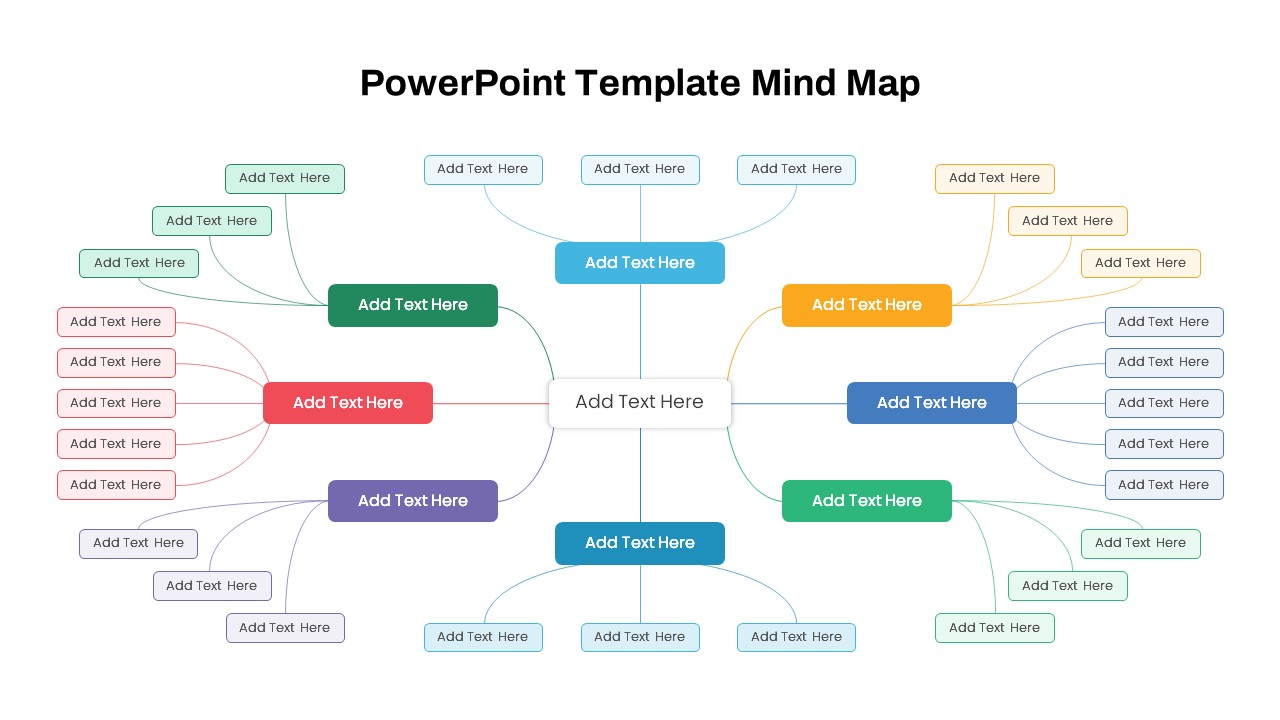
Modern Custom Eight-Branch Mind Map Template for PowerPoint & Google Slides
Mind Maps

Company Features Circle Diagram for PowerPoint & Google Slides
Process
Puzzle DNA Diagram for Product Features Template for PowerPoint & Google Slides
Process
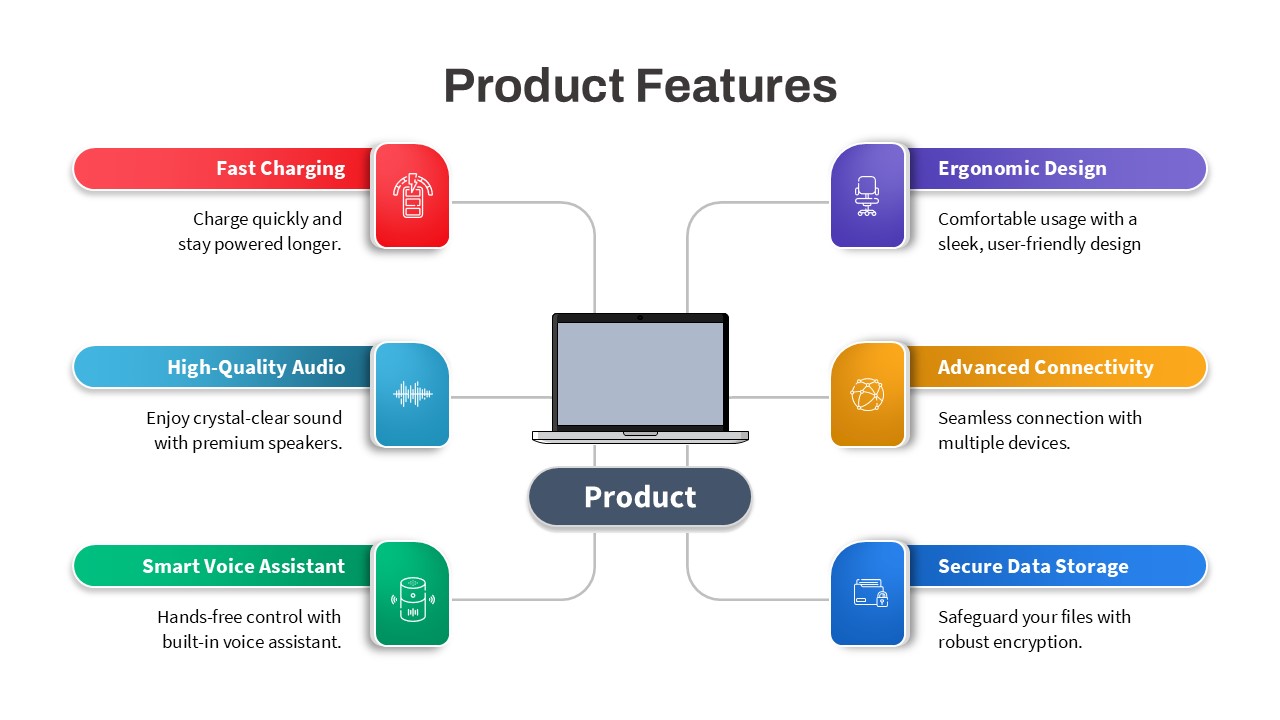
Product Features Diagram Template for PowerPoint & Google Slides
Process
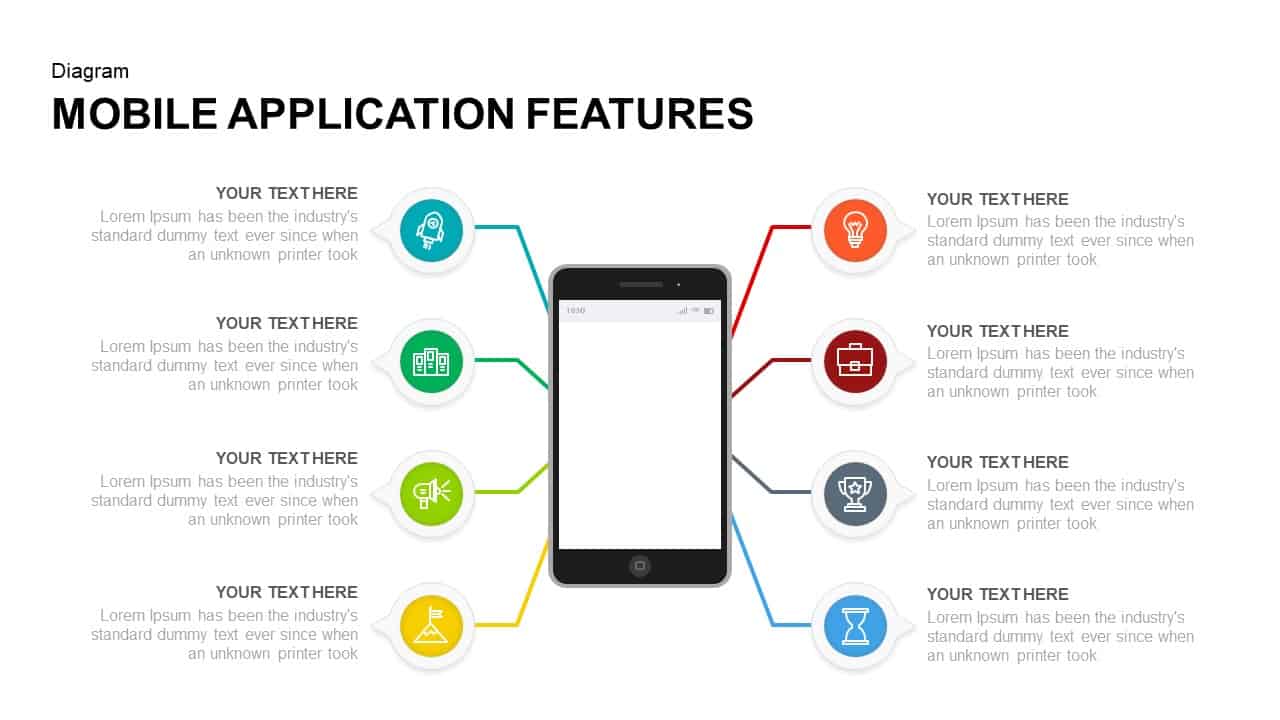
Mobile Application Features Diagram for PowerPoint & Google Slides
Technology
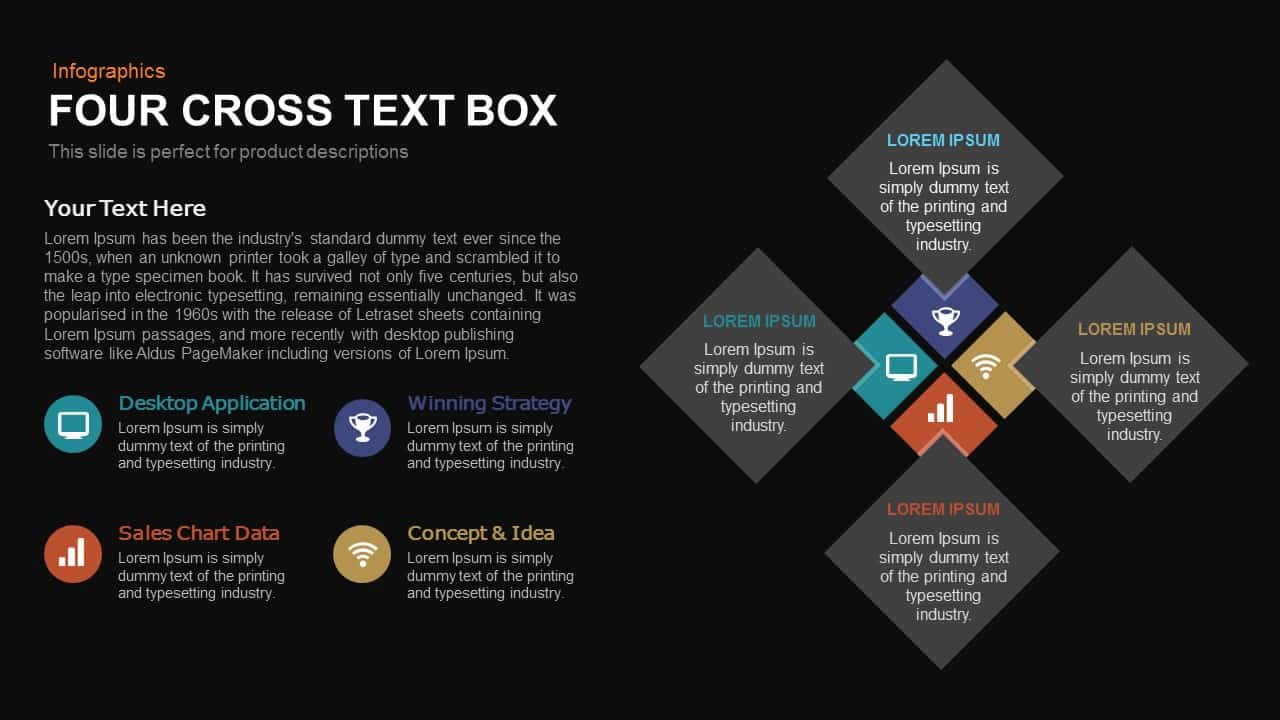
Four-Cross Text Box Diagram Template for PowerPoint & Google Slides
Comparison
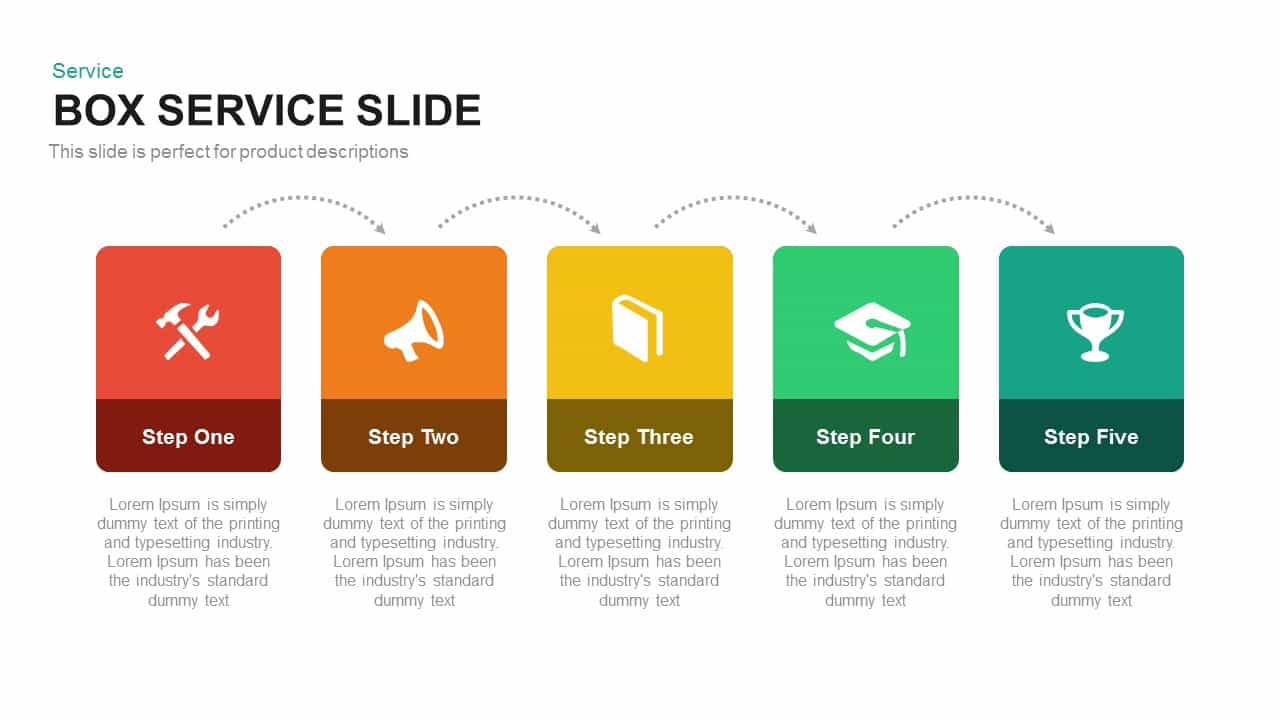
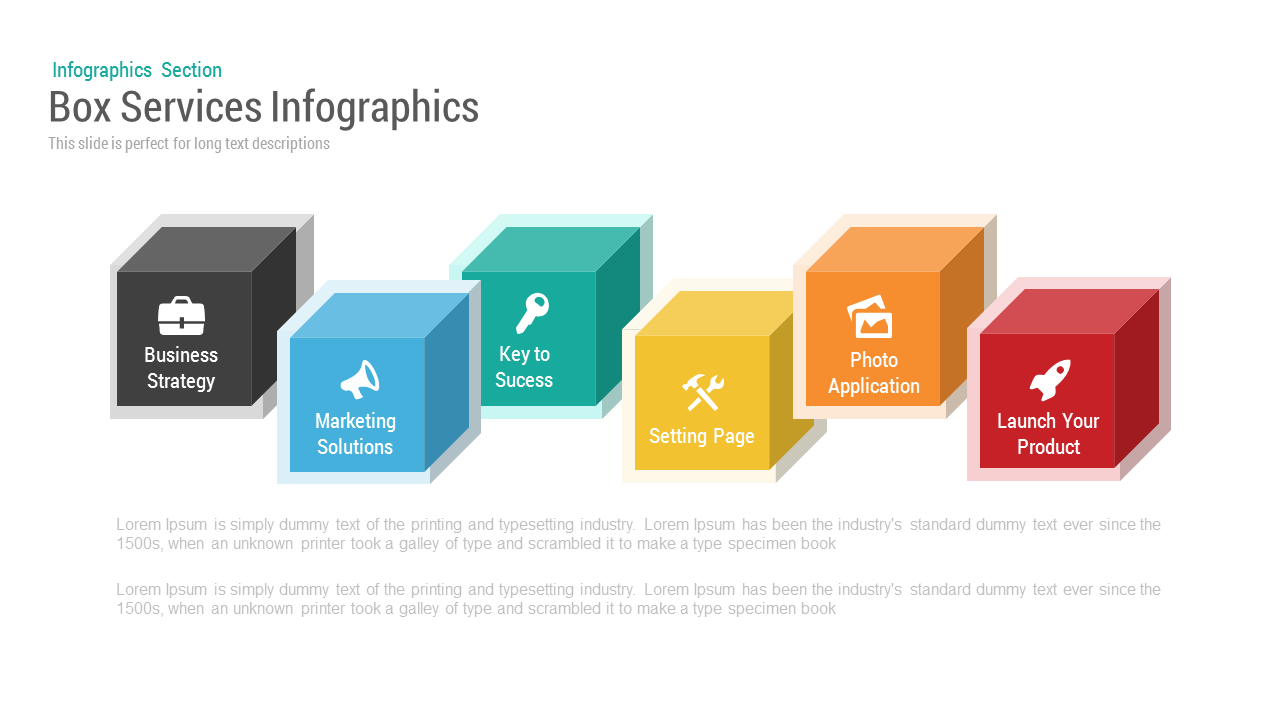
Professional Box Service Diagram Template for PowerPoint & Google Slides
Comparison
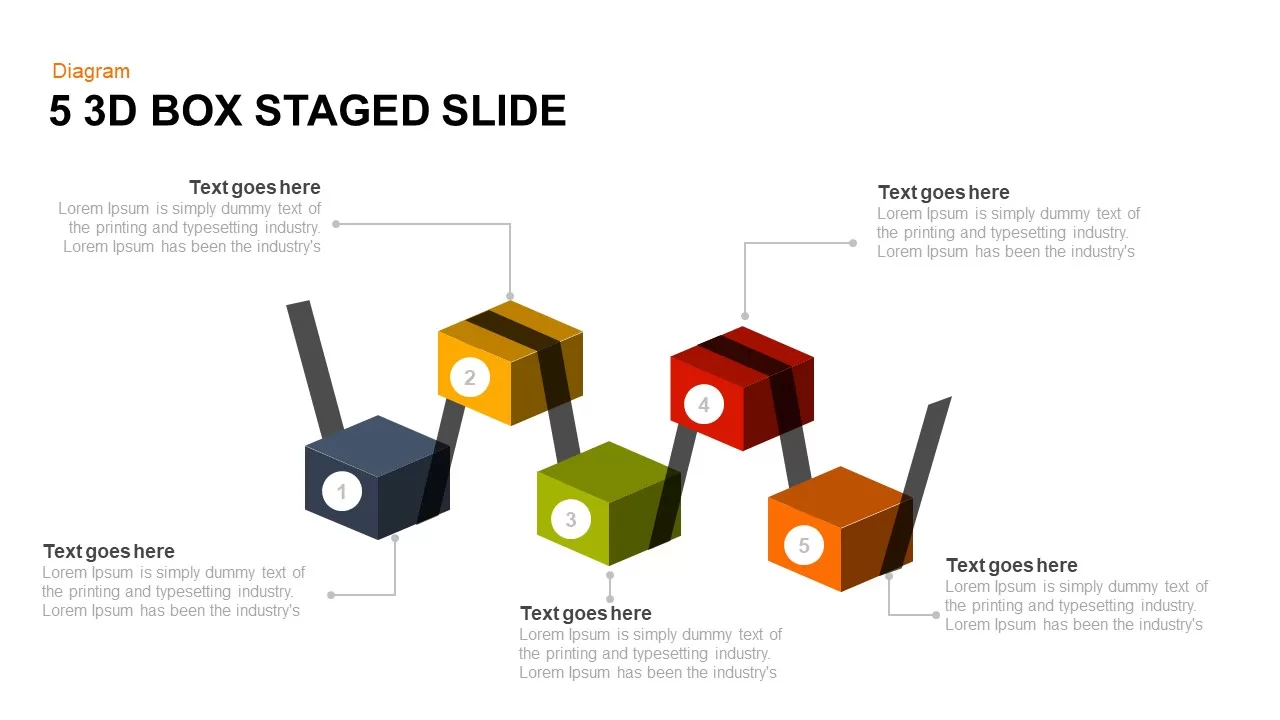
Five-Stage 3D Box Flow Diagram Template for PowerPoint & Google Slides
Process

Flat Four-Box Business Layout Diagram Template for PowerPoint & Google Slides
Process
Box Diagram Infographics template for PowerPoint & Google Slides
Business
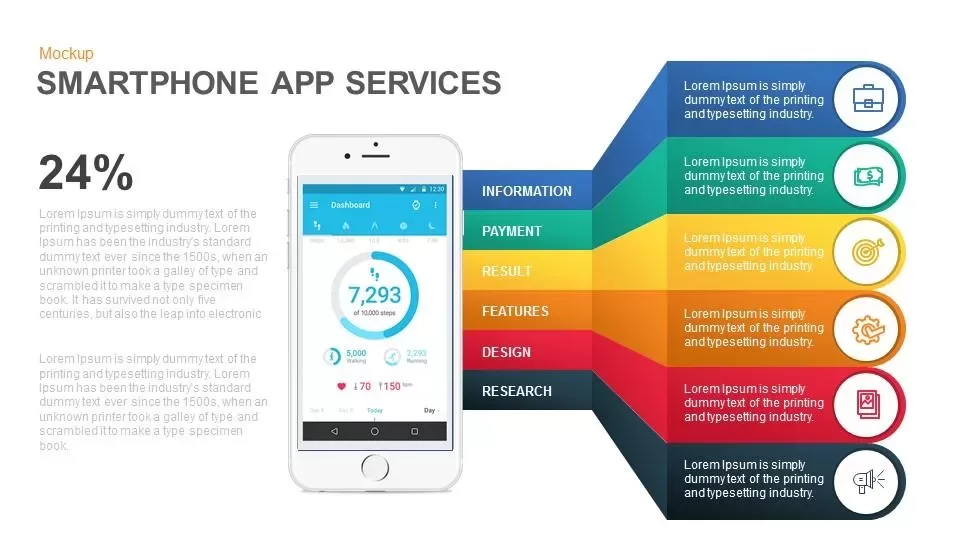
Application Smartphone Features template for PowerPoint & Google Slides
Technology
Mobile App Features template for PowerPoint & Google Slides
Technology
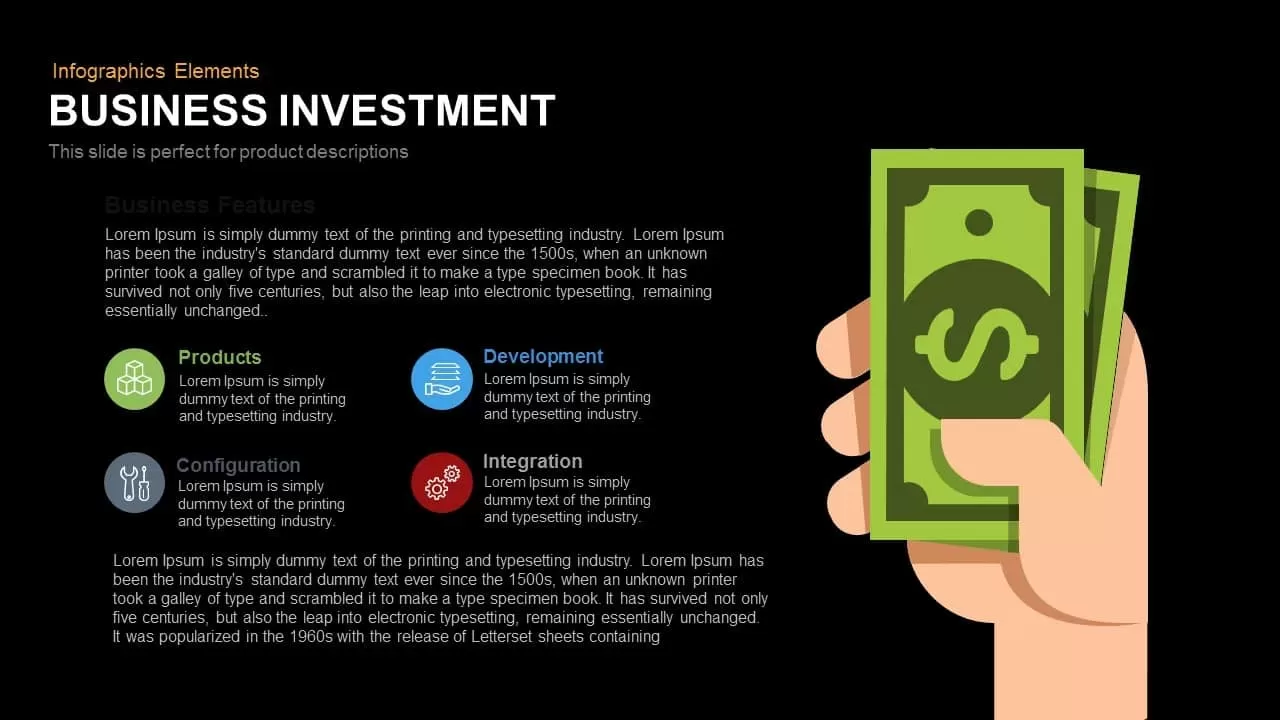
Business Investment Features Infographic Template for PowerPoint & Google Slides
Finance
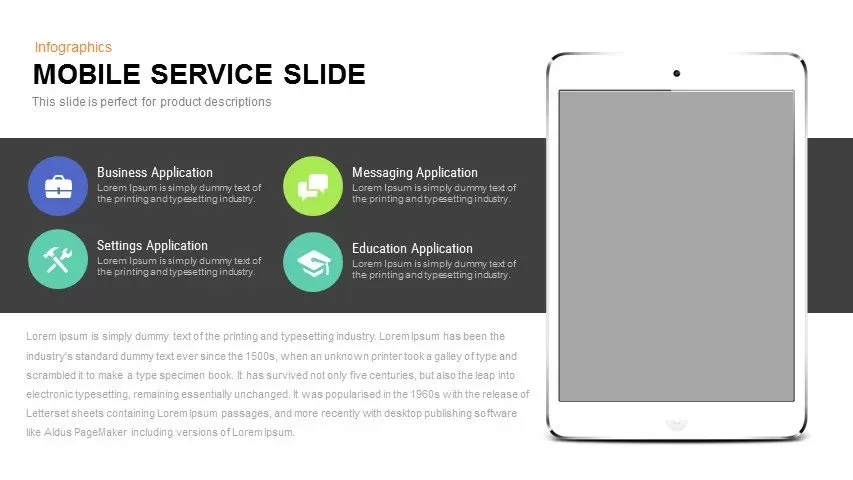
Mobile Service Features Infographic Template for PowerPoint & Google Slides
Process
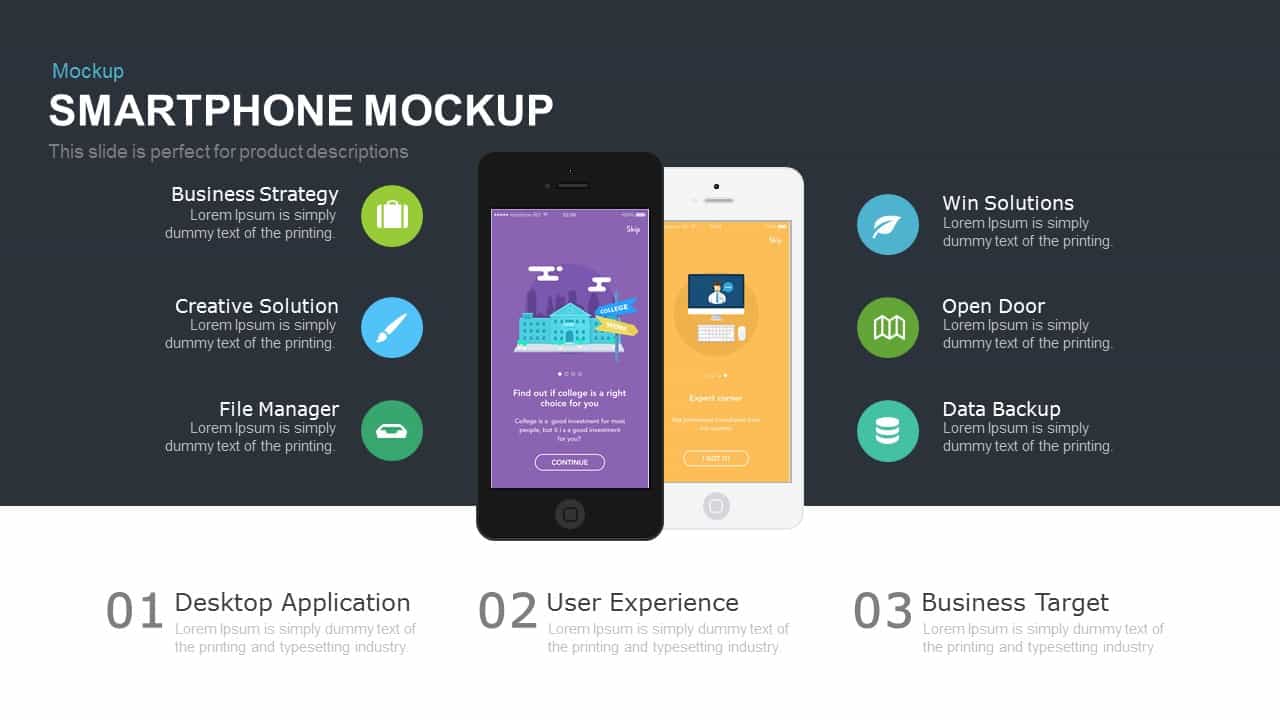
Smartphone App Features Mockup Template for PowerPoint & Google Slides
Software Development

Smartphone & Web Application Features template for PowerPoint & Google Slides
Software Development
Service Features Presentation template for PowerPoint & Google Slides
Business Proposal
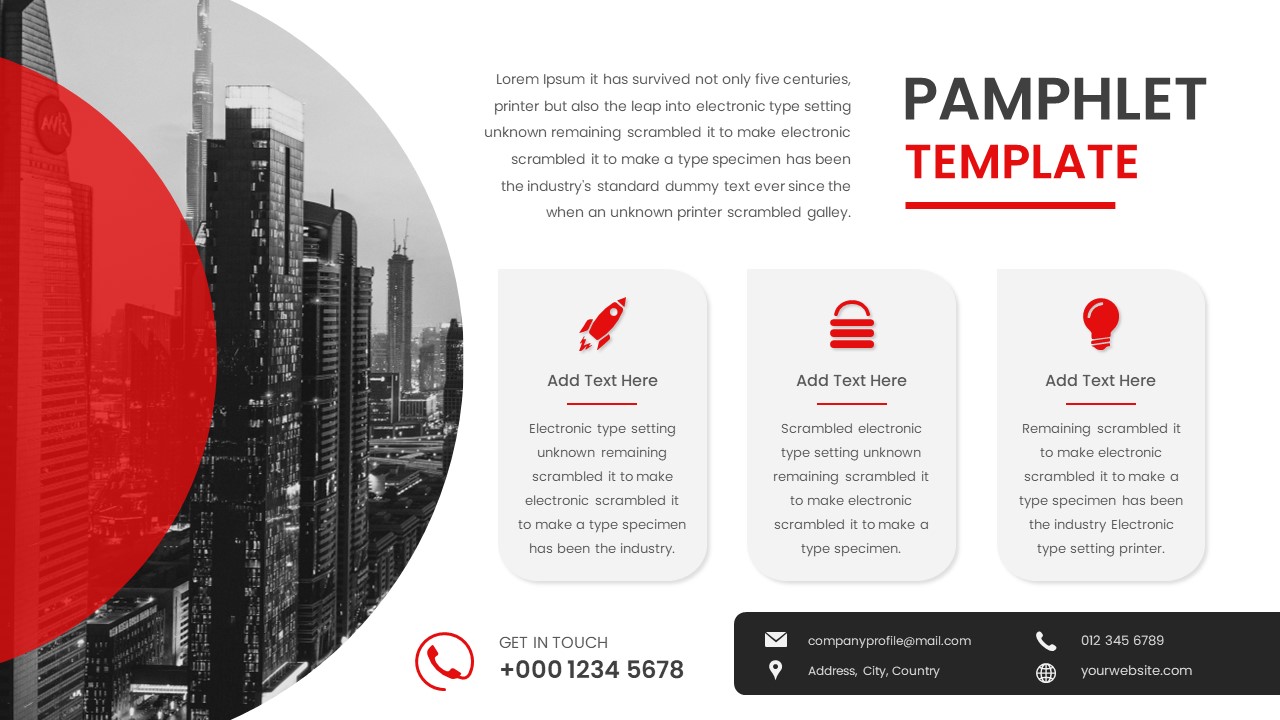
Corporate Pamphlet with Icon Features Template for PowerPoint & Google Slides
Graphics
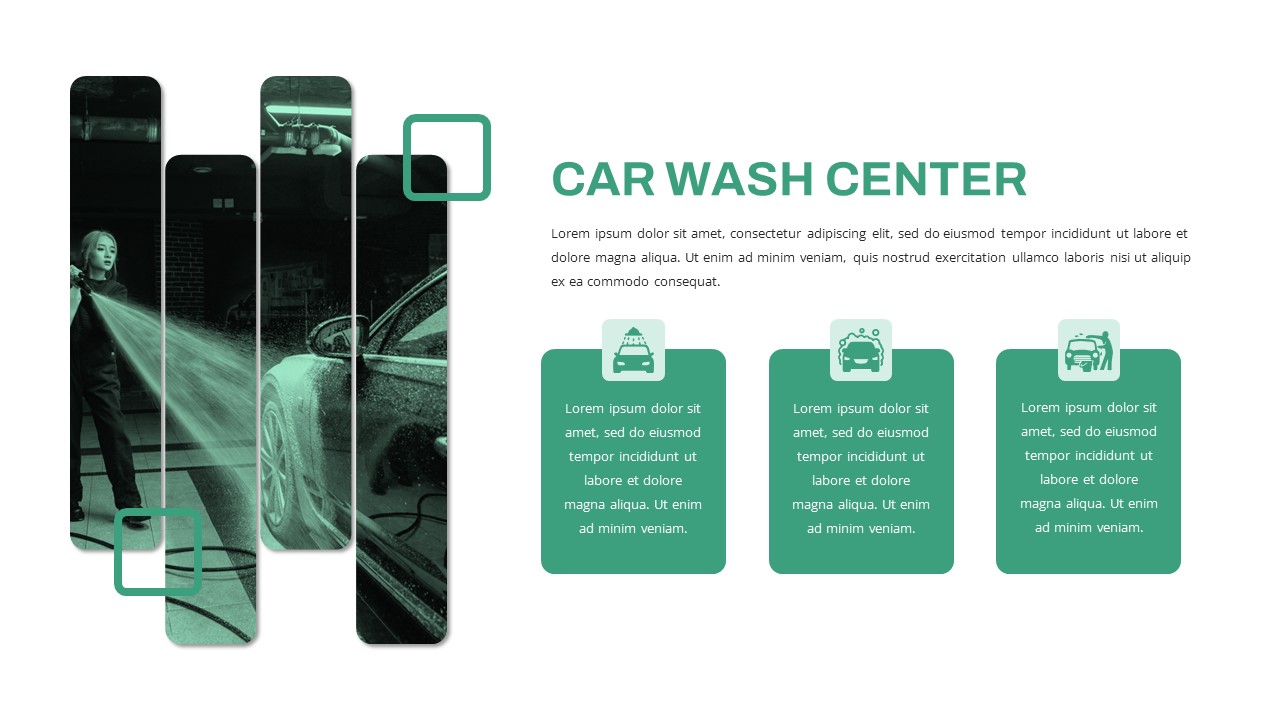
Free Car Wash Center Service Features Slide Template for PowerPoint & Google Slides
Business Proposal
Free
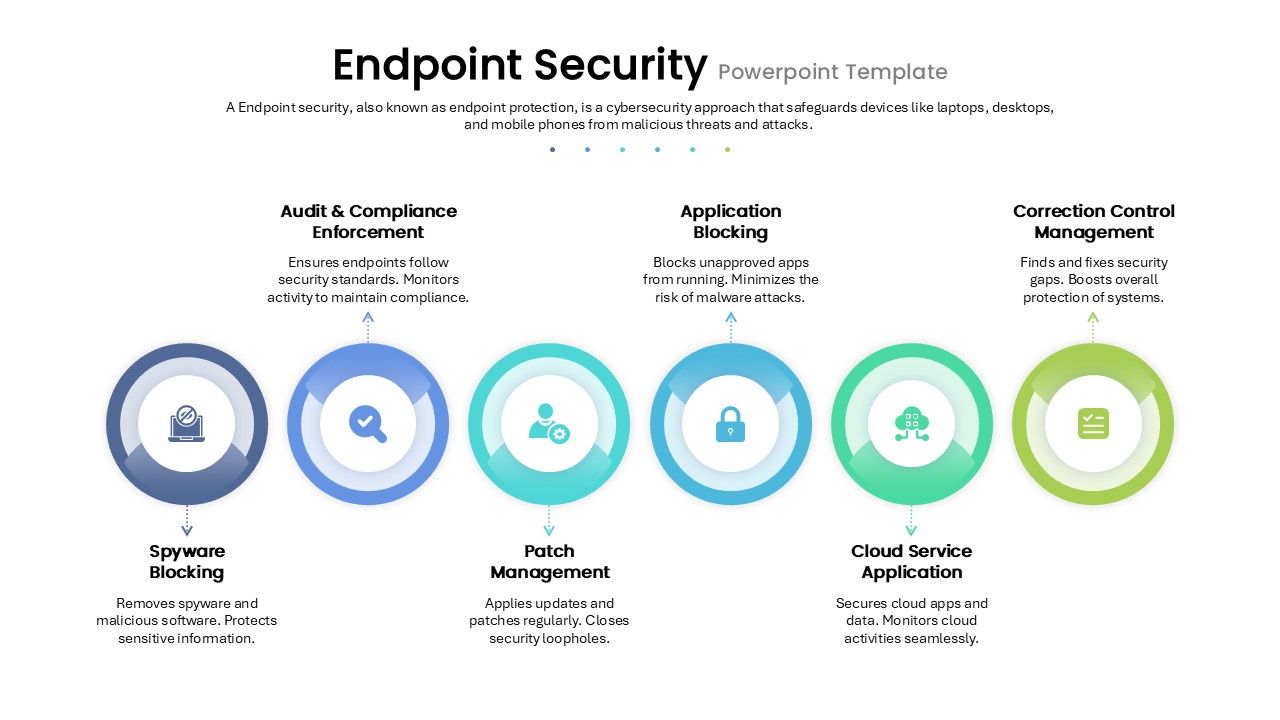
Endpoint Security Protection Features Template for PowerPoint & Google Slides
Information Technology
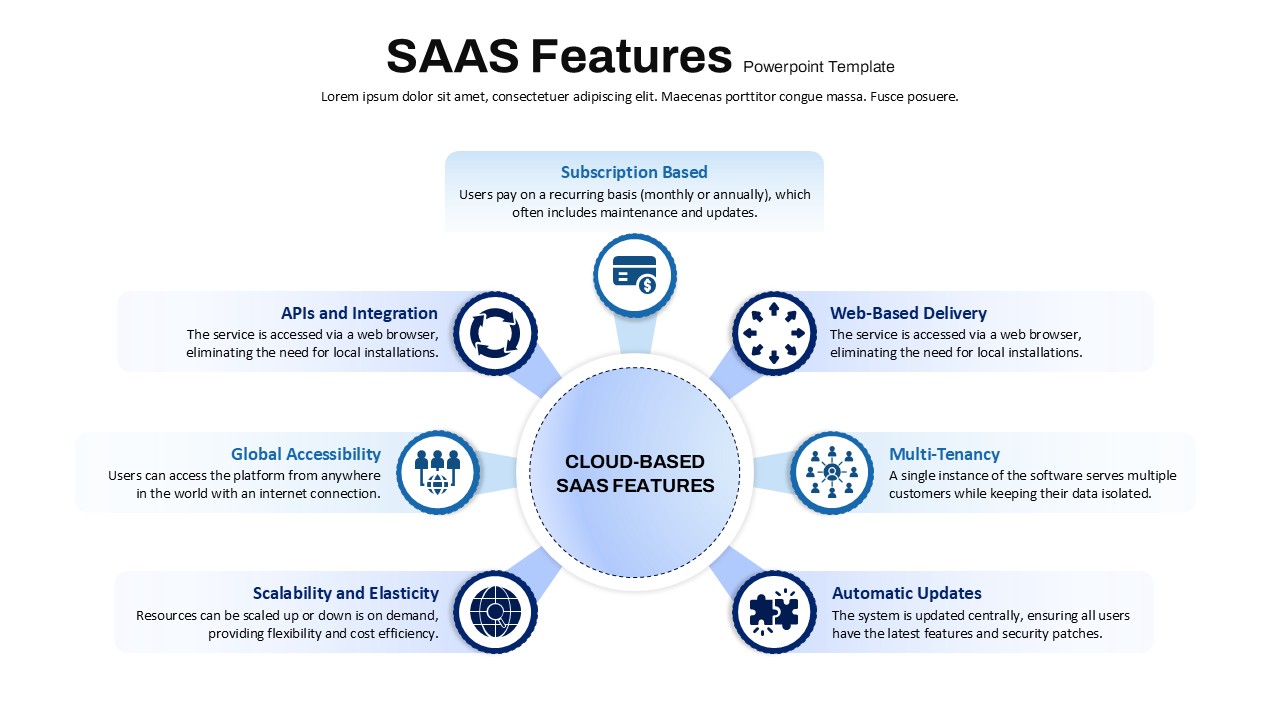
SAAS Features template for PowerPoint & Google Slides
Cloud Computing
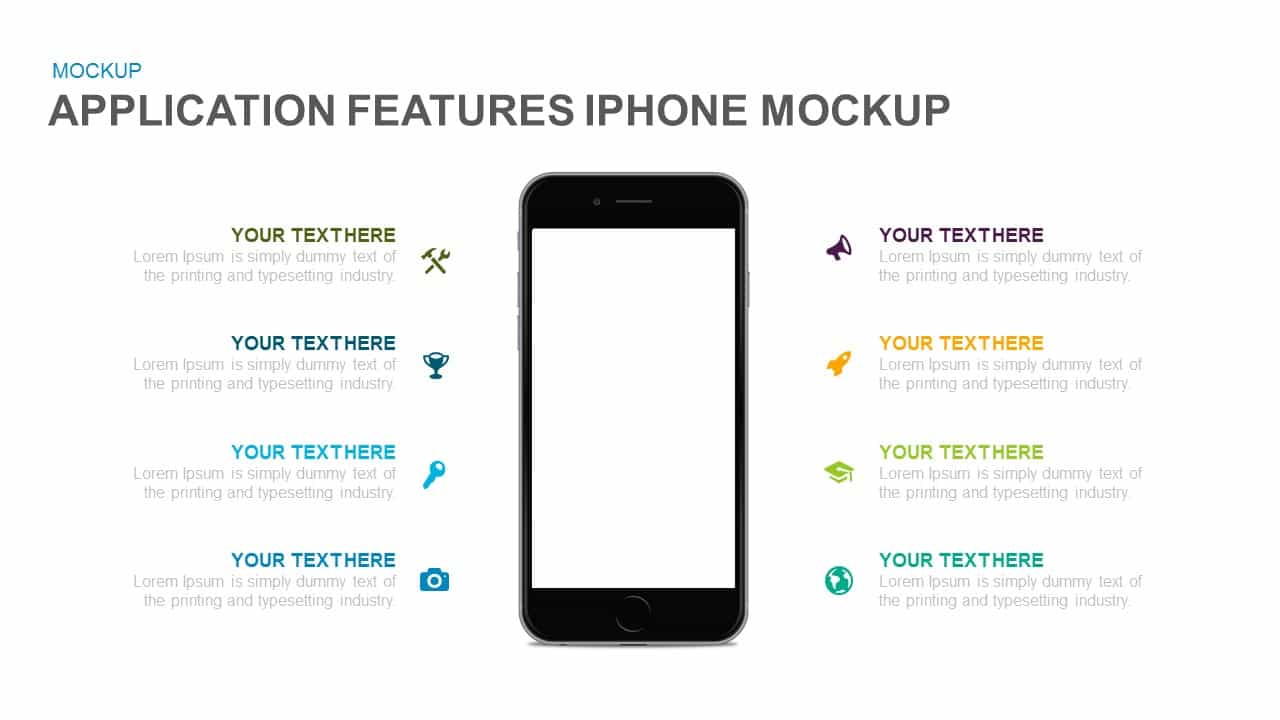
Application Features iPhone Mockup for PowerPoint & Google Slides
Graphics
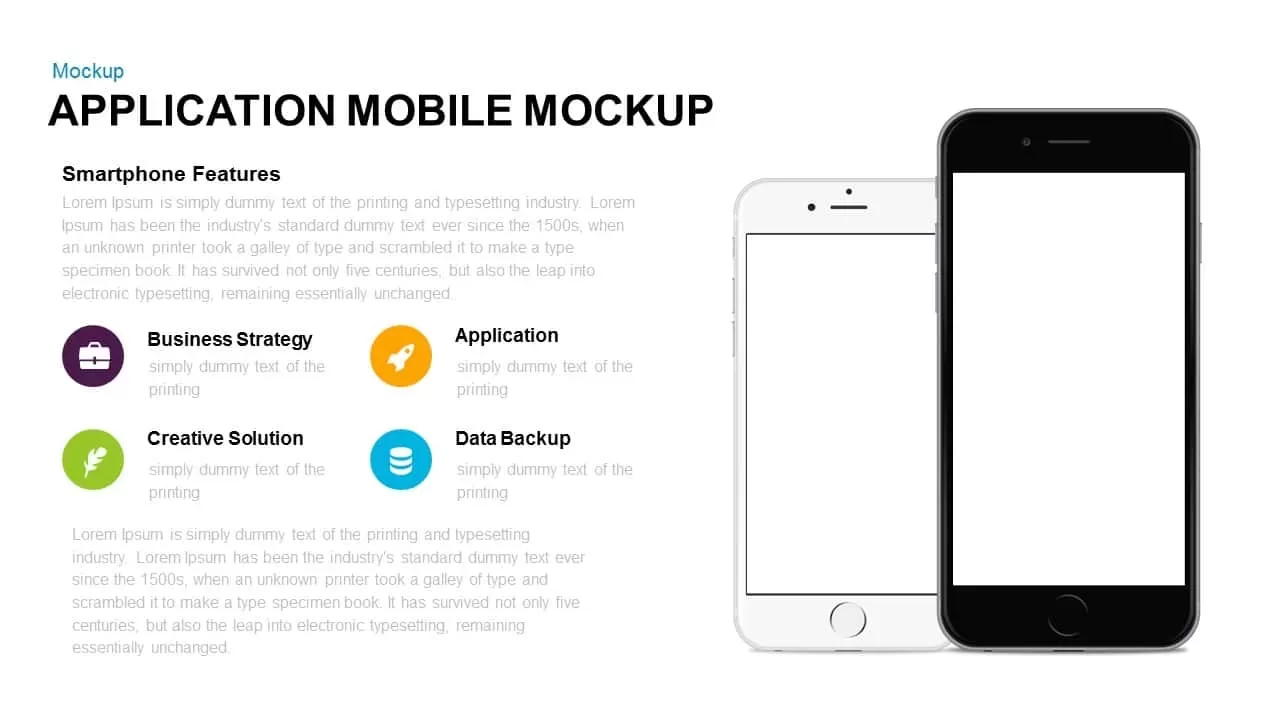
Mobile Application Features Mockup for PowerPoint & Google Slides
Graphics
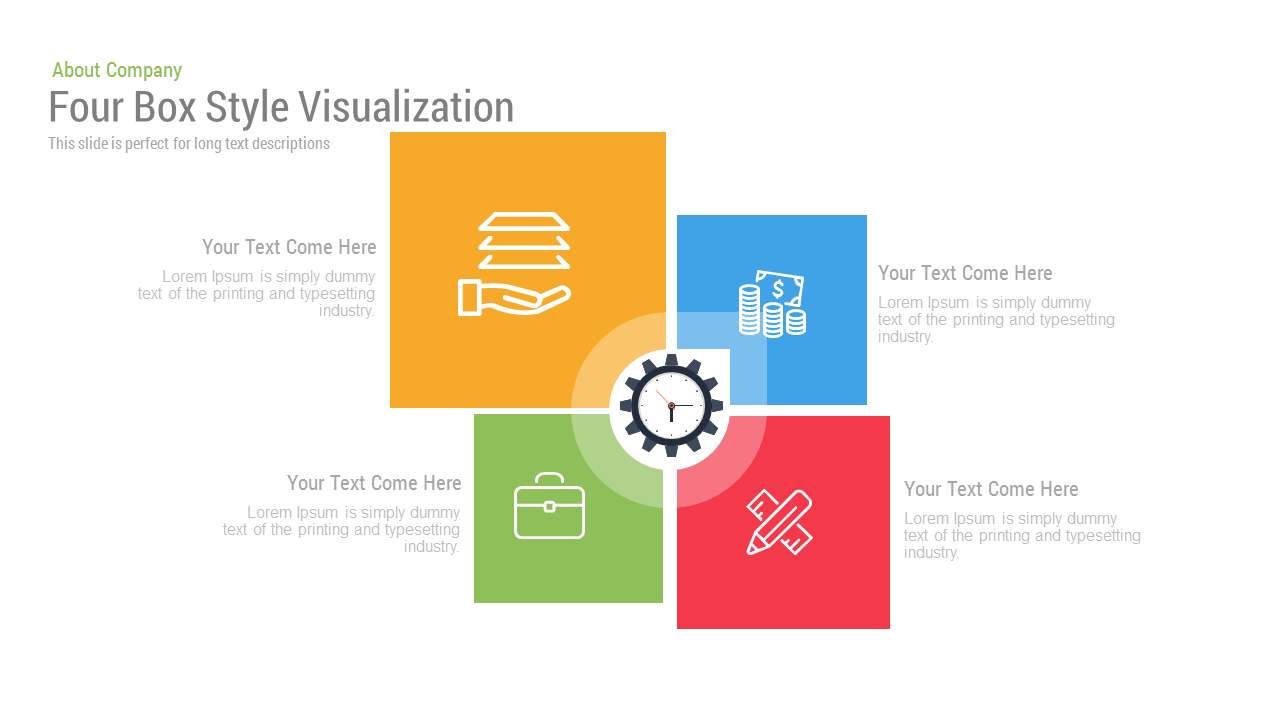
Free Four Box Style Visualization template for PowerPoint & Google Slides
Process
Free
Box Services Infographics template for PowerPoint & Google Slides
Process
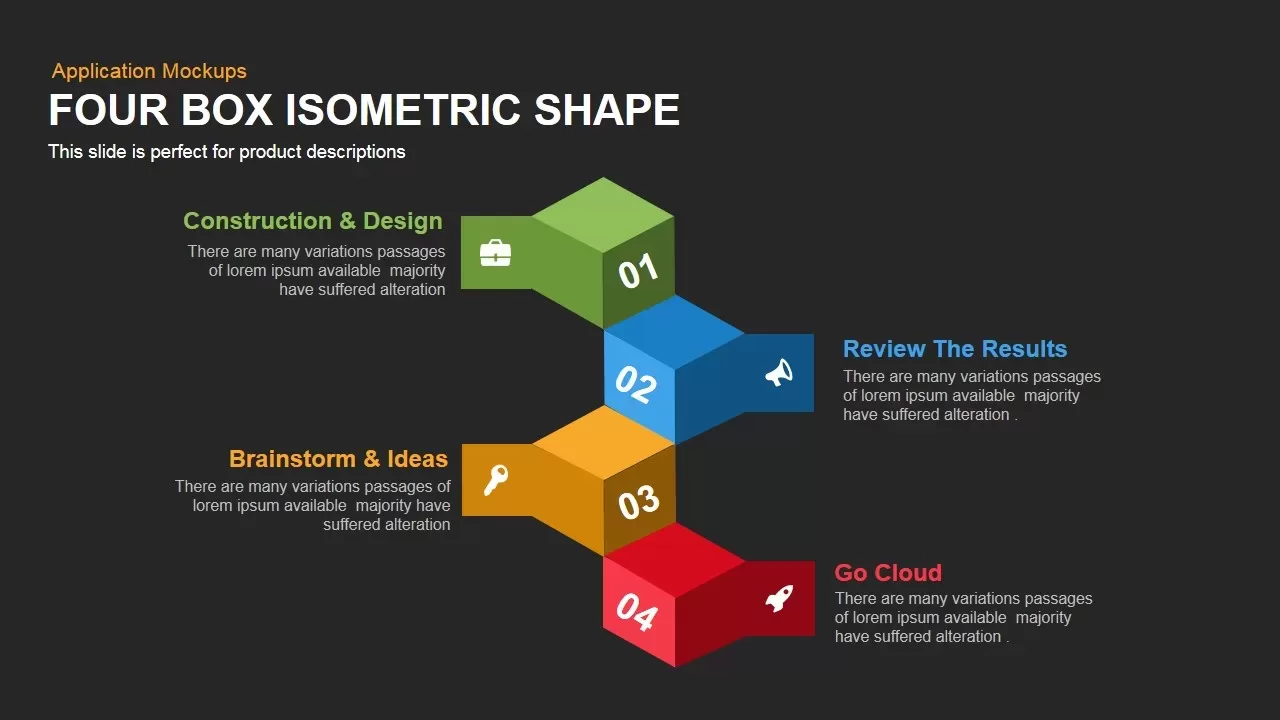
Four Box Isometric template for PowerPoint & Google Slides
Process
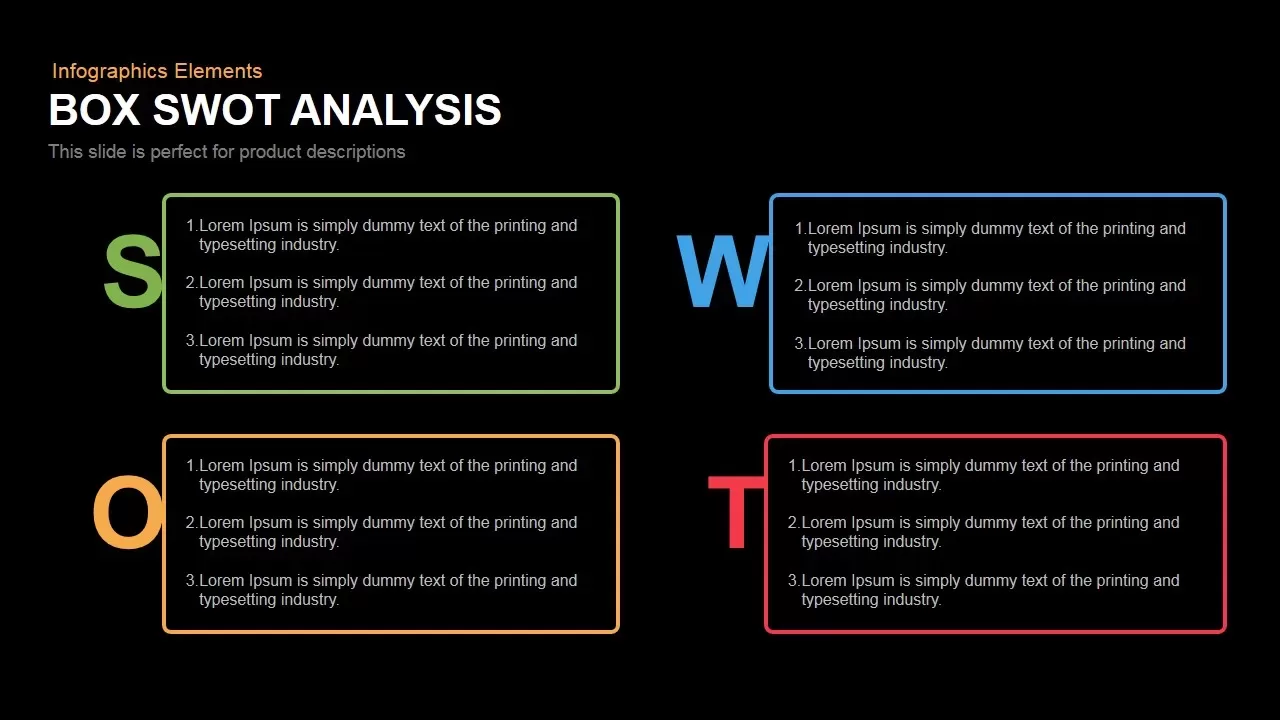
Box SWOT Analysis Infographic Template for PowerPoint & Google Slides
SWOT
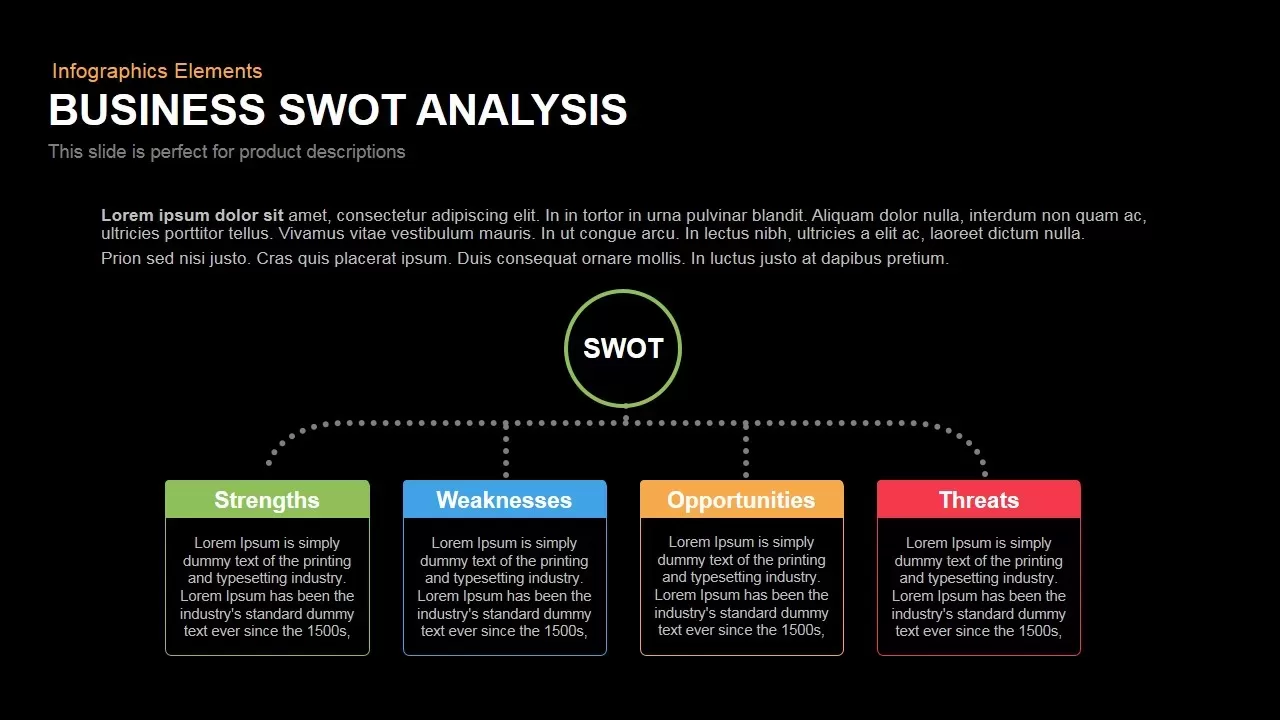
Box Business SWOT Analysis Template for PowerPoint & Google Slides
SWOT
Eight Box Flowchart template for PowerPoint & Google Slides
Flow Charts
Free Editable Check Box Icon Set Presentation Template for PowerPoint & Google Slides
Infographics
Free
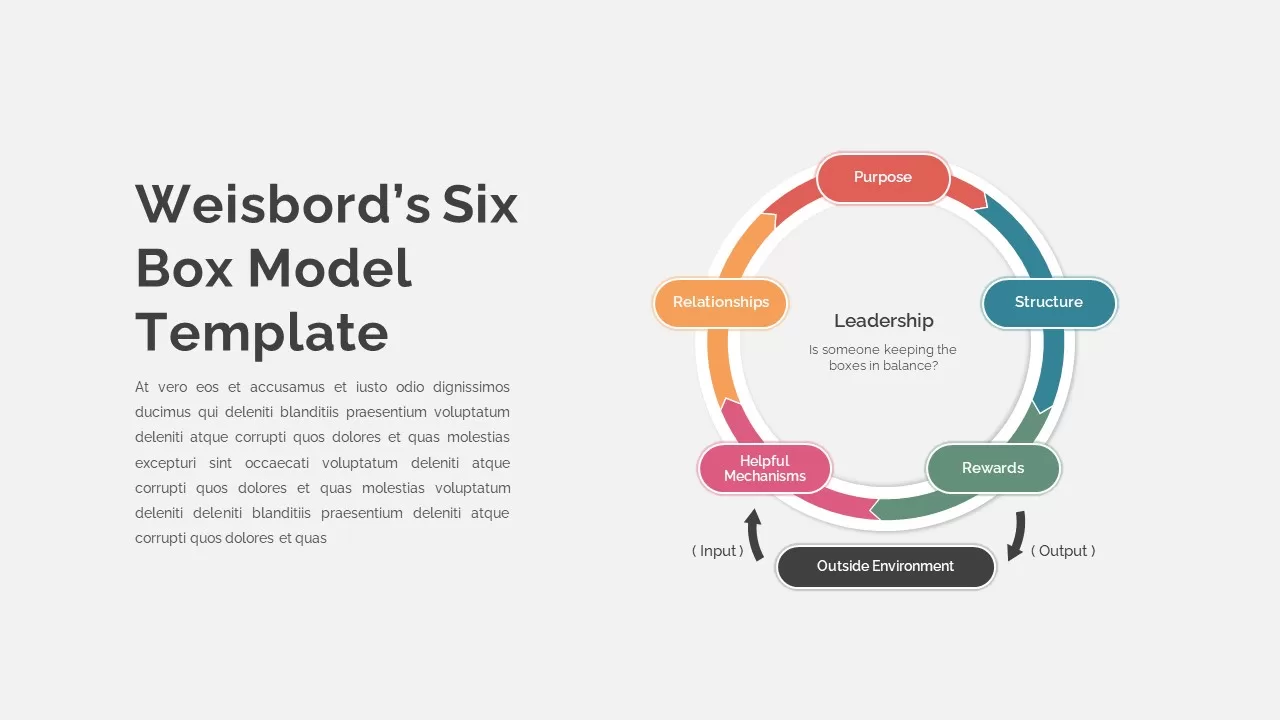
Weisbord’s Six Box Model Infographics Template for PowerPoint & Google Slides
Circular
9-Box Matrix for Performance & Potential Template for PowerPoint & Google Slides
Employee Performance
Out of the Box Thinking template for PowerPoint & Google Slides
Business Strategy
Two-Box Analysis & Target Comparison Template for PowerPoint & Google Slides
Comparison
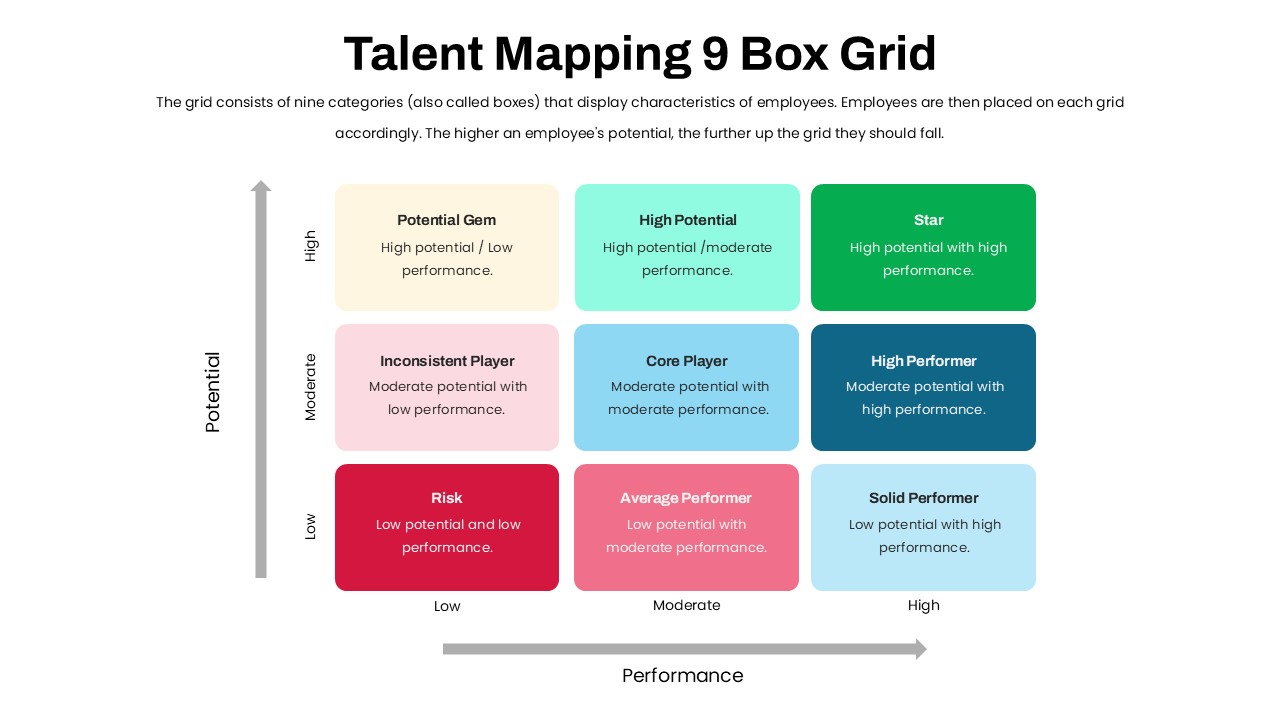
Talent Mapping 9-Box Grid Template for PowerPoint & Google Slides
Employee Performance
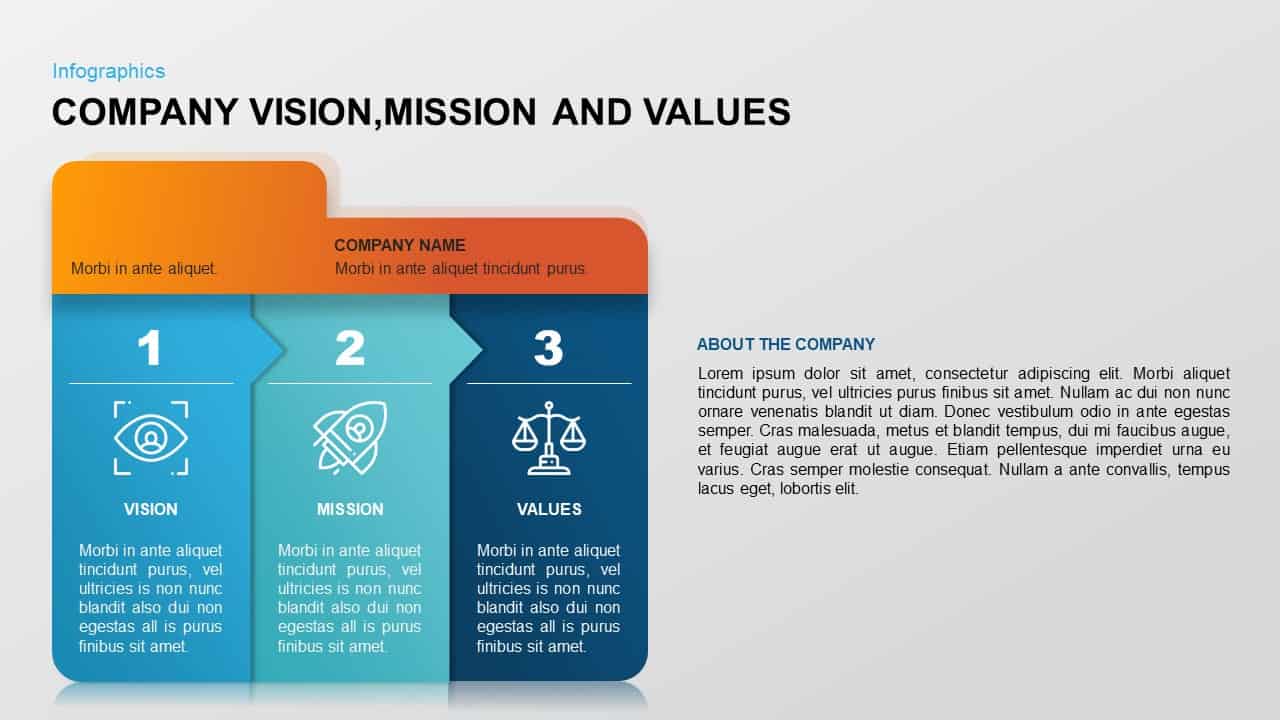
Company Vision, Mission & Values Diagram Template for PowerPoint & Google Slides
Vision and Mission
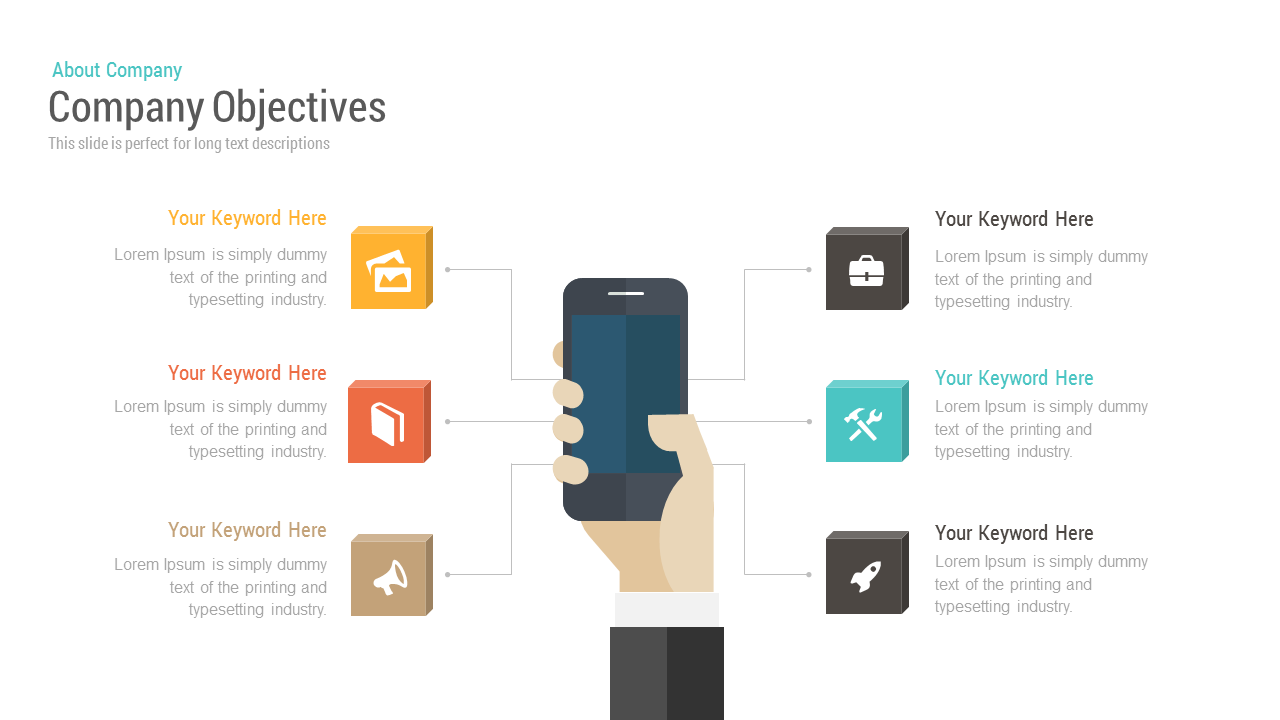
Free Company Objectives template for PowerPoint & Google Slides
Business Strategy
Free

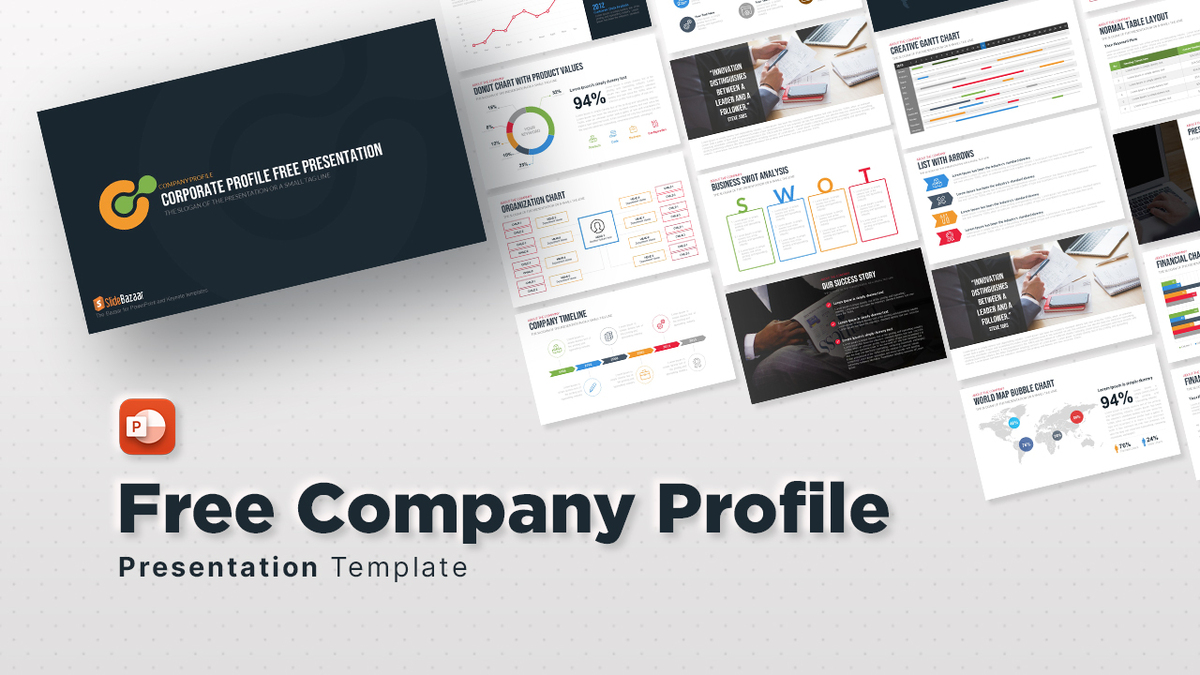
Free Company Profile template for PowerPoint & Google Slides
Company Profile
Free
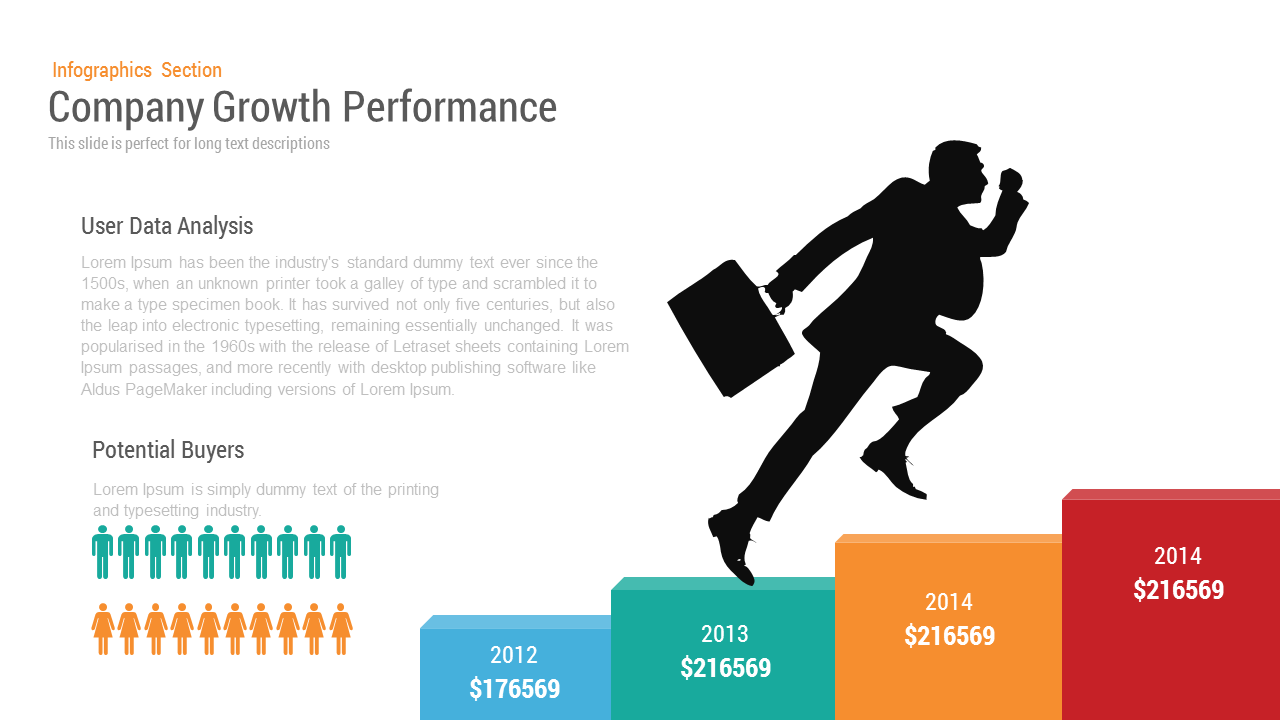
Company Growth template for PowerPoint & Google Slides
Charts
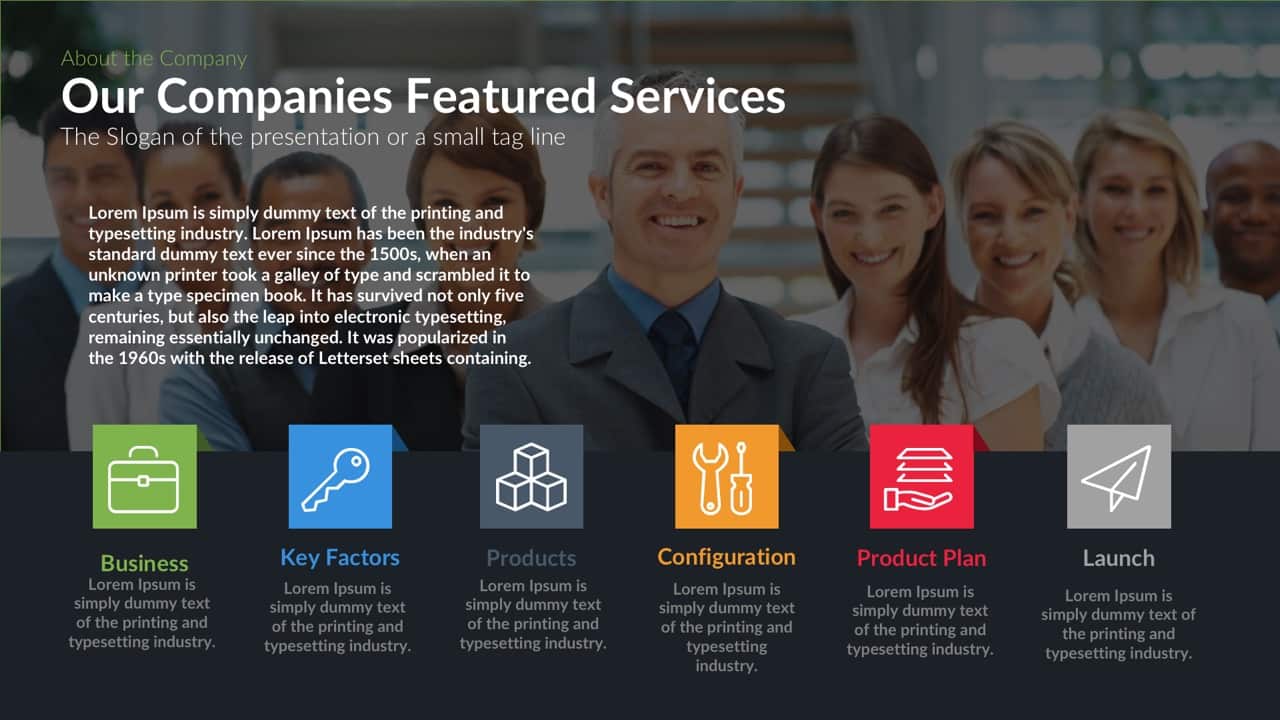
Company’s Featured Services Template for PowerPoint & Google Slides
Company Profile
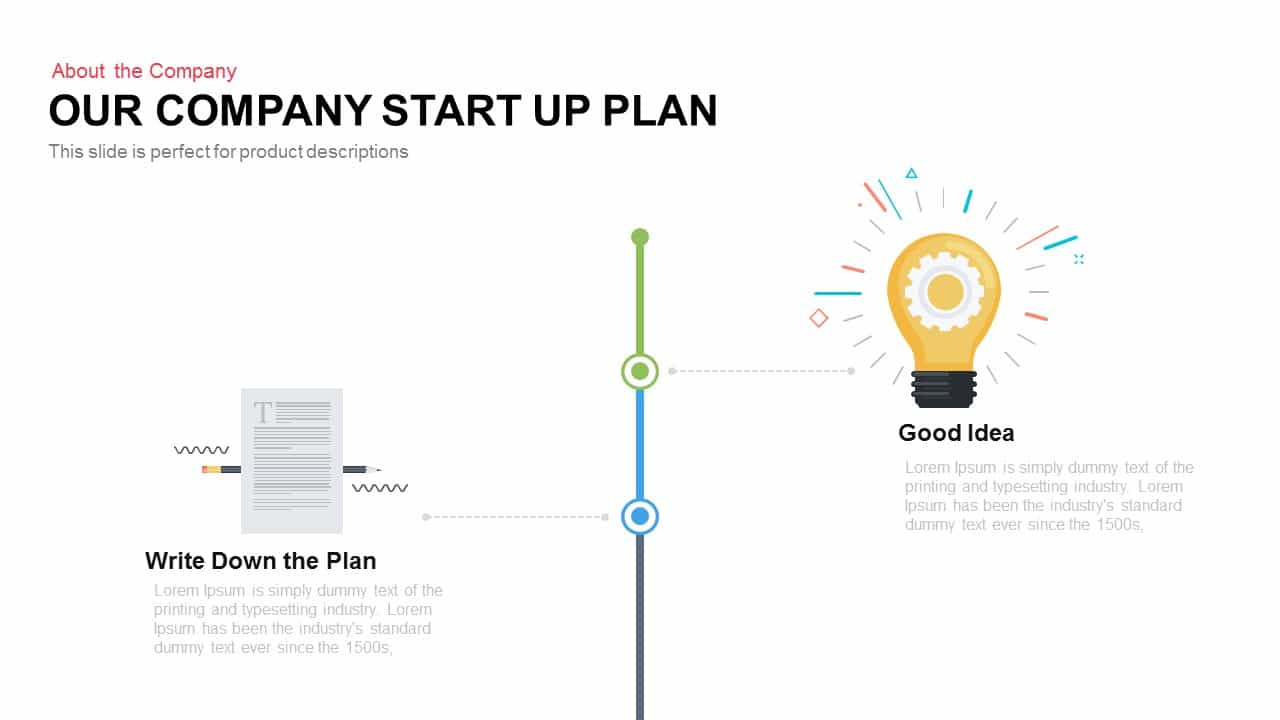
Company Startup Plan Timeline Slide Template for PowerPoint & Google Slides
Timeline
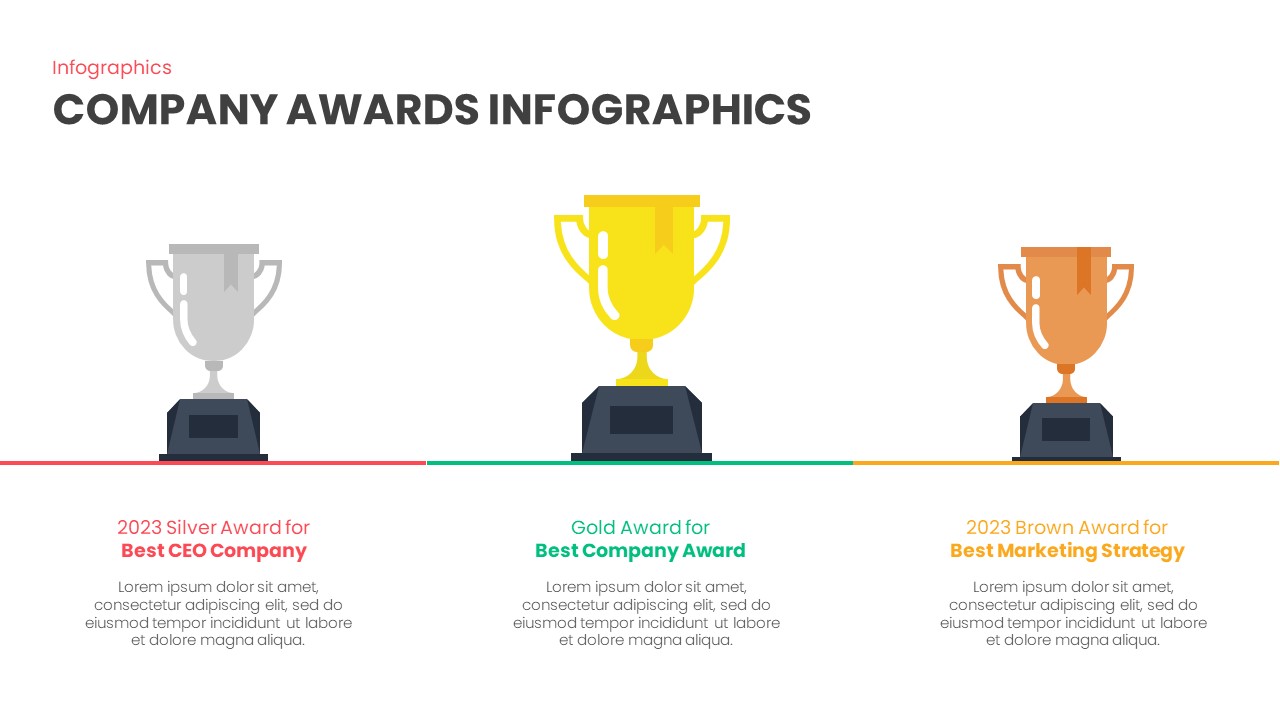
Company Awards Slide template for PowerPoint & Google Slides
Infographics
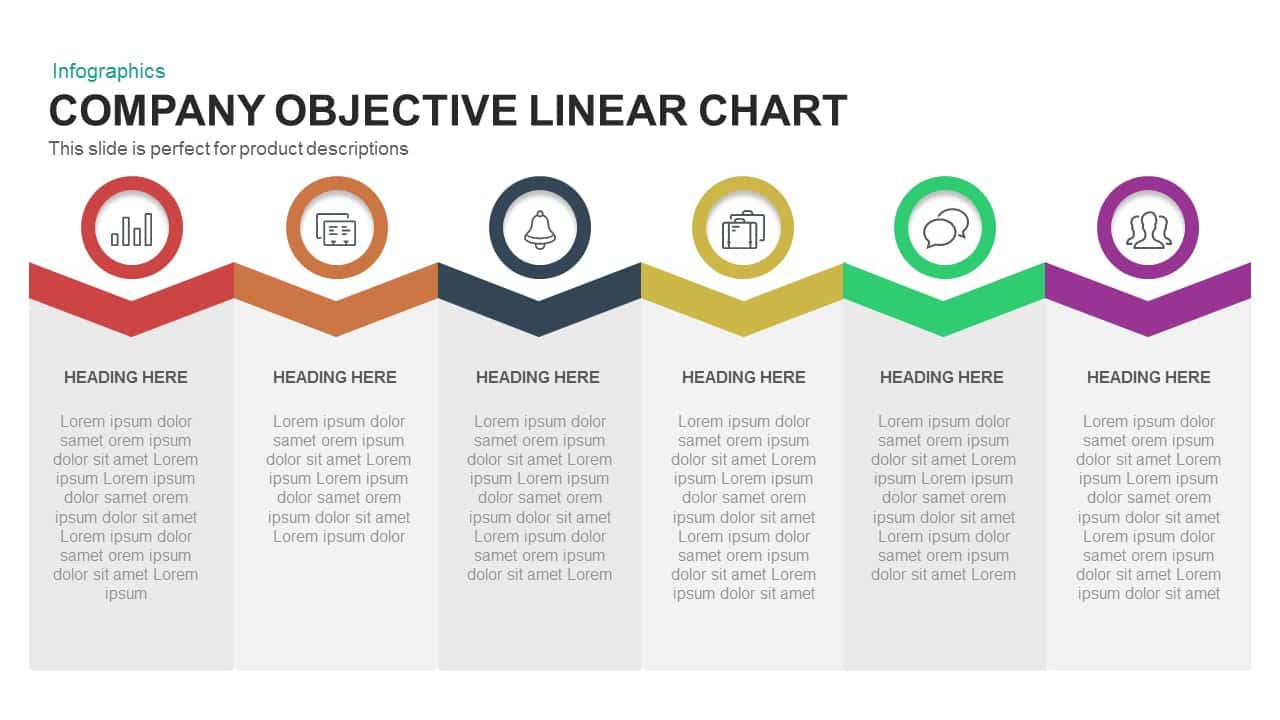
Company Objective Linear Chart Template for PowerPoint & Google Slides
Flow Charts
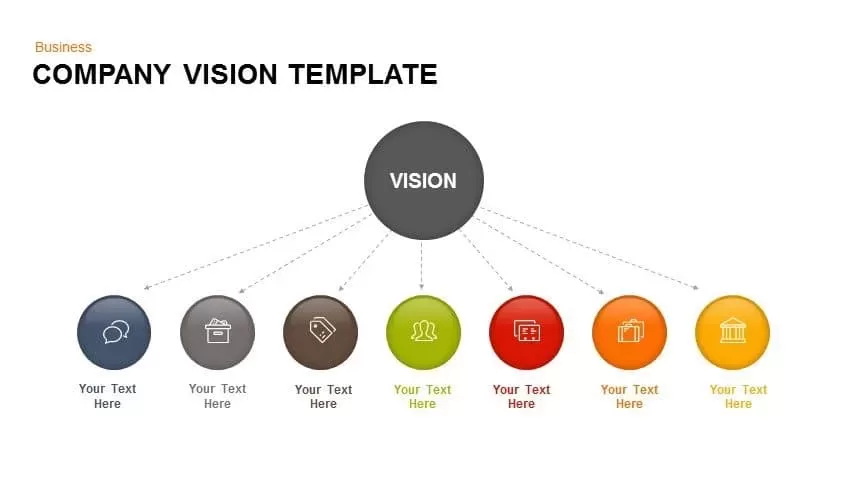
Company Vision Hub and Spoke Infographic Template for PowerPoint & Google Slides
Vision and Mission

Ultimate Free Company Profile Pitch Deck Template for PowerPoint & Google Slides
Company Profile
Free
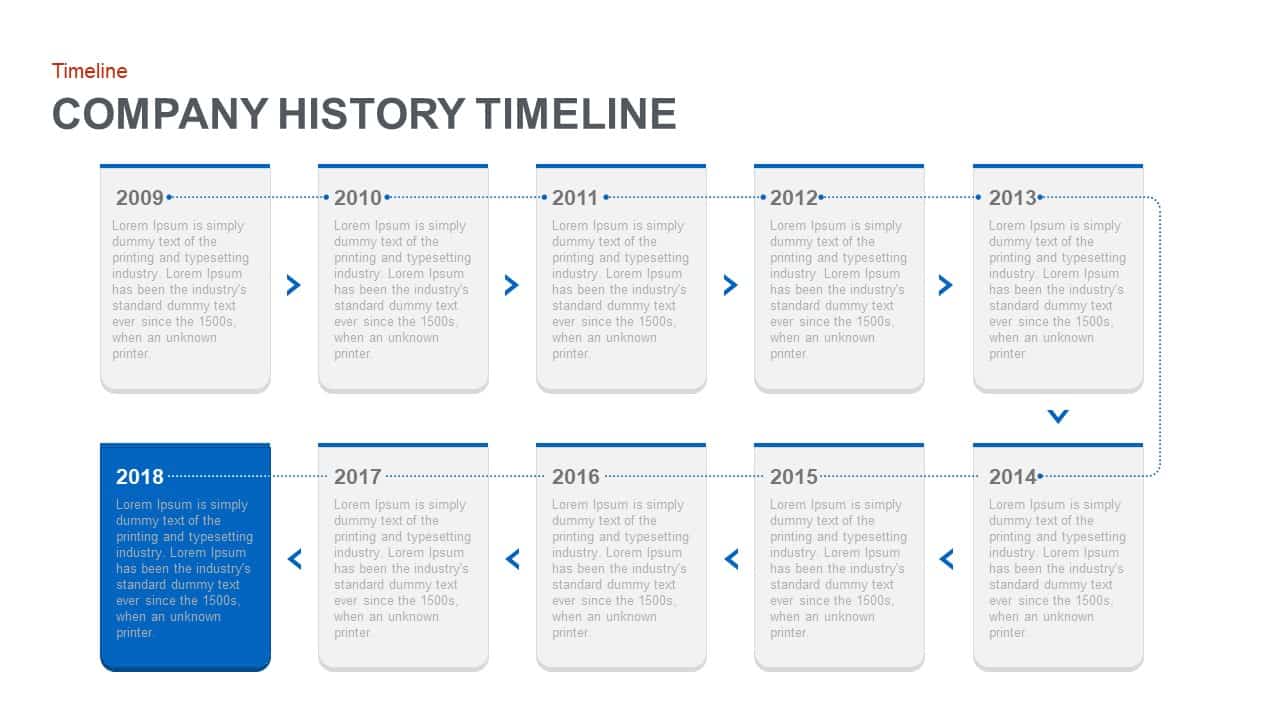
Company History Timeline Roadmap Template for PowerPoint & Google Slides
Timeline
Simple Business Company Profile Deck Template for PowerPoint & Google Slides
Company Profile
Gradient Business Company Profile Template for PowerPoint & Google Slides
Company Profile
Corporate Solutions & Company Profile Template for PowerPoint & Google Slides
Company Profile
Purple Gradient Company Profile Deck Template for PowerPoint & Google Slides
Company Profile
Company Profile Overview template for PowerPoint & Google Slides
Company Profile
Medical Company Profile Slide Deck Template for PowerPoint & Google Slides
Company Profile
Free Helooo Creative Company Profile Template for PowerPoint & Google Slides
Company Profile
Free
Swipewire Company Portfolio Template for PowerPoint & Google Slides
Pitch Deck
Business Company Profile Template for PowerPoint & Google Slides
Company Profile
Redbox Company Profile Template for PowerPoint & Google Slides
Company Profile
Free App Development Company Profile template for PowerPoint & Google Slides
Company Profile
Free
Free Real Estate Company Profile Template for PowerPoint & Google Slides
Company Profile
Free
Modern Blue Yellow Company Profile Template for PowerPoint & Google Slides
Company Profile
Technology Company Profile Deck Template for PowerPoint & Google Slides
Information Technology
E-commerce Company Profile Presentation Template for PowerPoint & Google Slides
Company Profile
Pink White Theme Company Profile template for PowerPoint & Google Slides
Company Profile

Knowza Company Brochure Template for PowerPoint & Google Slides
Company Profile
Professional Company About Us Slide Template for PowerPoint & Google Slides
Company Profile
Modern Company Profile About Us Slide Template for PowerPoint & Google Slides
Company Profile
About Us Company Profile Template for PowerPoint & Google Slides
Marketing
Red Company Profile Presentation Template for PowerPoint & Google Slides
Company Profile
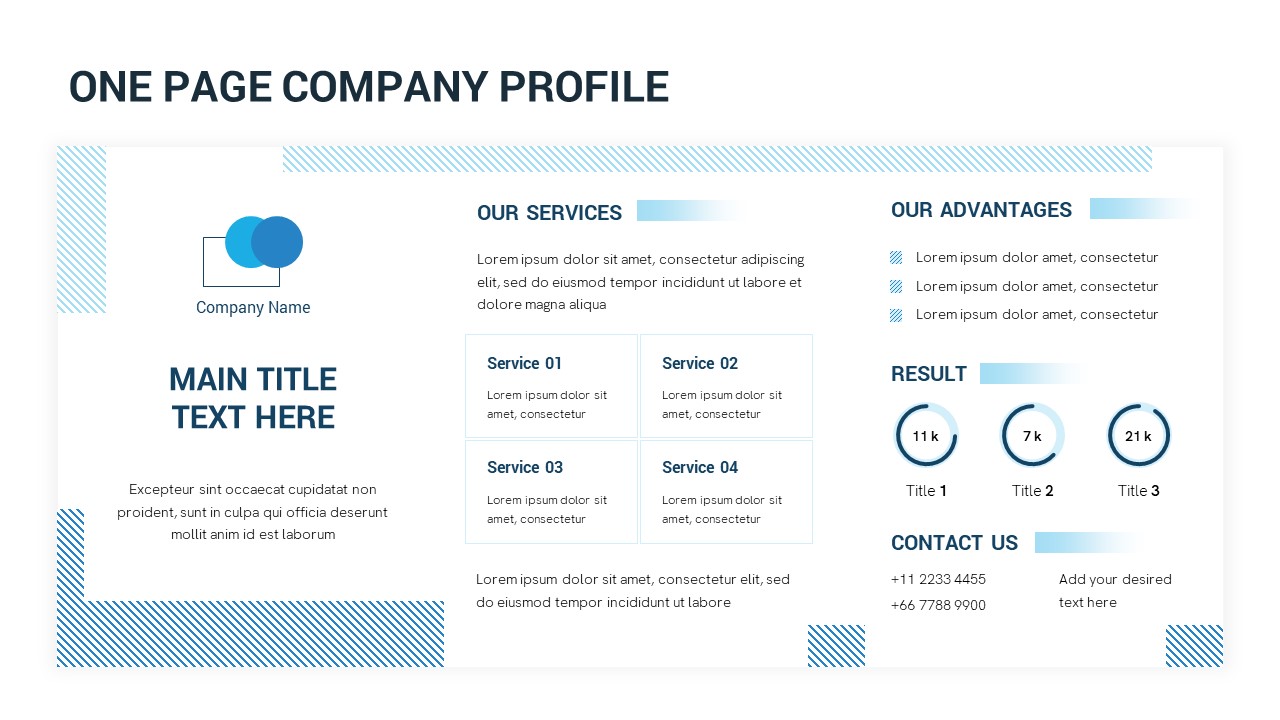
One-Page Company Profile Overview Template for PowerPoint & Google Slides
Company Profile
Green Company Profile Introduction Template for PowerPoint & Google Slides
Company Profile
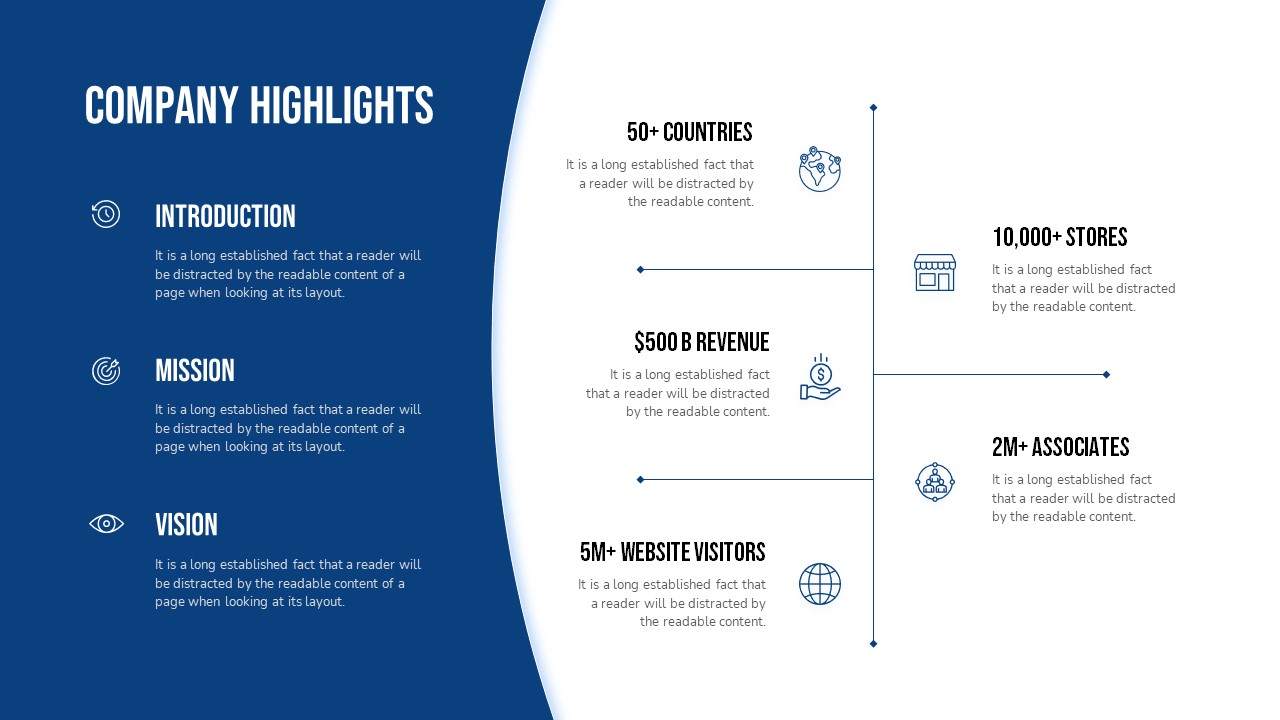
Company Highlights Profile Presentation Template for PowerPoint & Google Slides
Business
Free Chocolate Company Profile Slide Template for PowerPoint & Google Slides
Company Profile
Free
Financial Consulting Company Profile Template for PowerPoint & Google Slides
Finance
Aviation Industry Company Profile Deck Template for PowerPoint & Google Slides
Company Profile
Pharmaceutical Company Profile Deck Template for PowerPoint & Google Slides
Company Profile
Free Coffee Company Profile Presentation Template for PowerPoint & Google Slides
Company Profile
Free
Free Simple Green Plant Company Profile Deck Template for PowerPoint & Google Slides
Company Profile
Free
Free Clean Company Profile Presentation Template for PowerPoint & Google Slides
Company Profile
Free
Free Modern Blue Company Profile Deck Template for PowerPoint & Google Slides
Company Profile
Free
Free Dark Coffee Shop Company Profile Template for PowerPoint & Google Slides
Company Profile
Free
Minimal Construction Company Profile Template for PowerPoint & Google Slides
Company Profile
Presentation Magazine Company Overview Template for PowerPoint & Google Slides
Company Profile
AI Tech Agency Company Profile Deck Template for PowerPoint & Google Slides
Company Profile
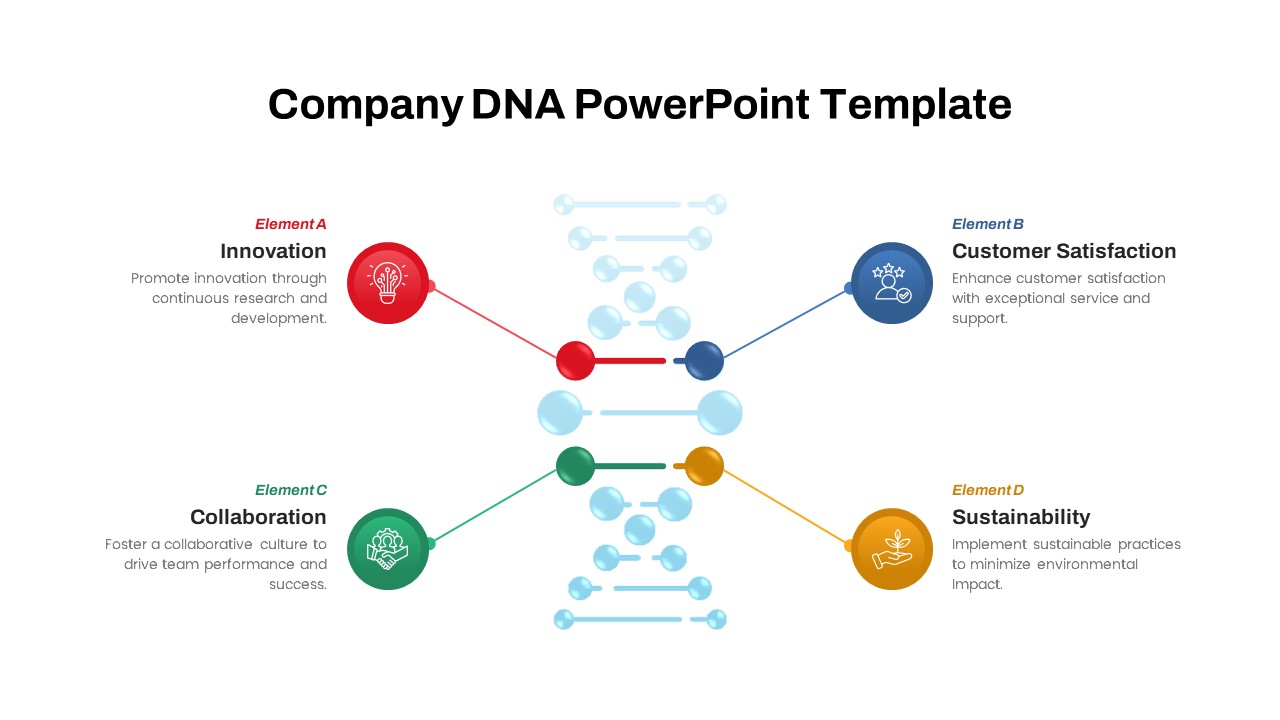
Company DNA Framework Slide Deck Template for PowerPoint & Google Slides
Circular
Company Anniversary Celebration Deck Template for PowerPoint & Google Slides
Company Profile
Air Force Company Profile Presentation Template for PowerPoint & Google Slides
Company Profile
Rustic Company Profile Presentation Template for PowerPoint & Google Slides
Decks
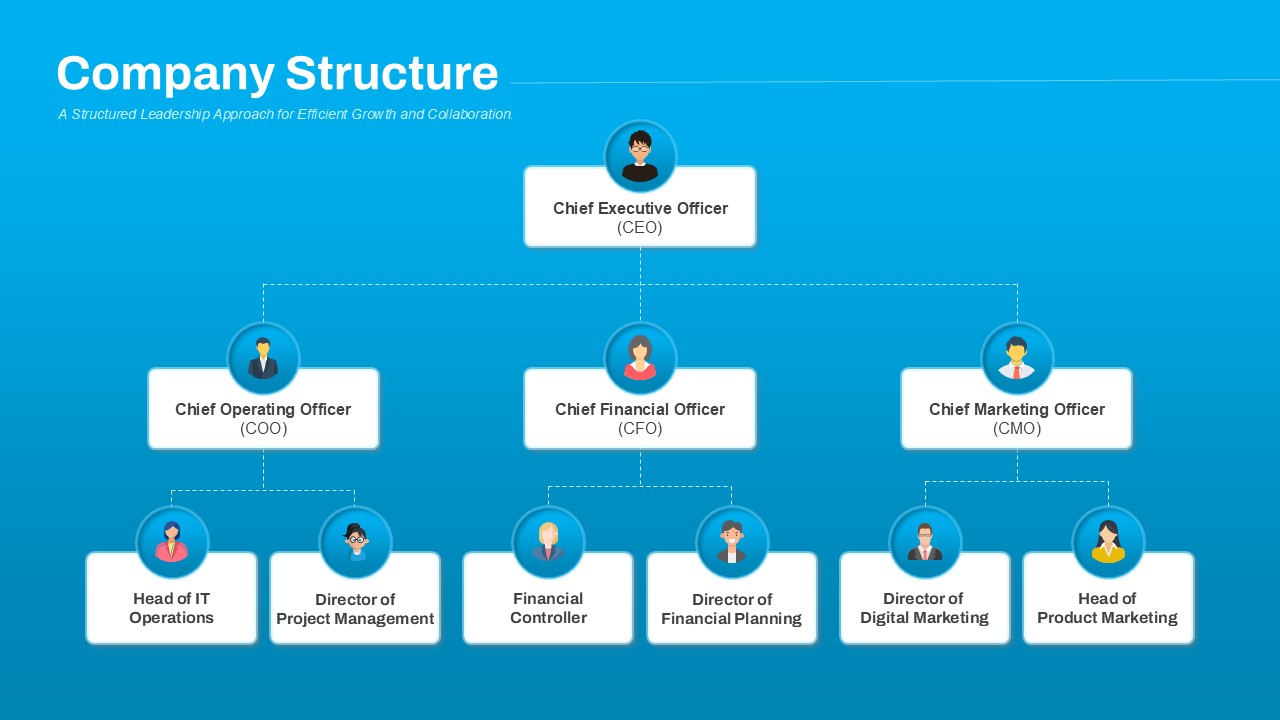
Company Structure Hierarchical Org Chart Template for PowerPoint & Google Slides
Org Chart
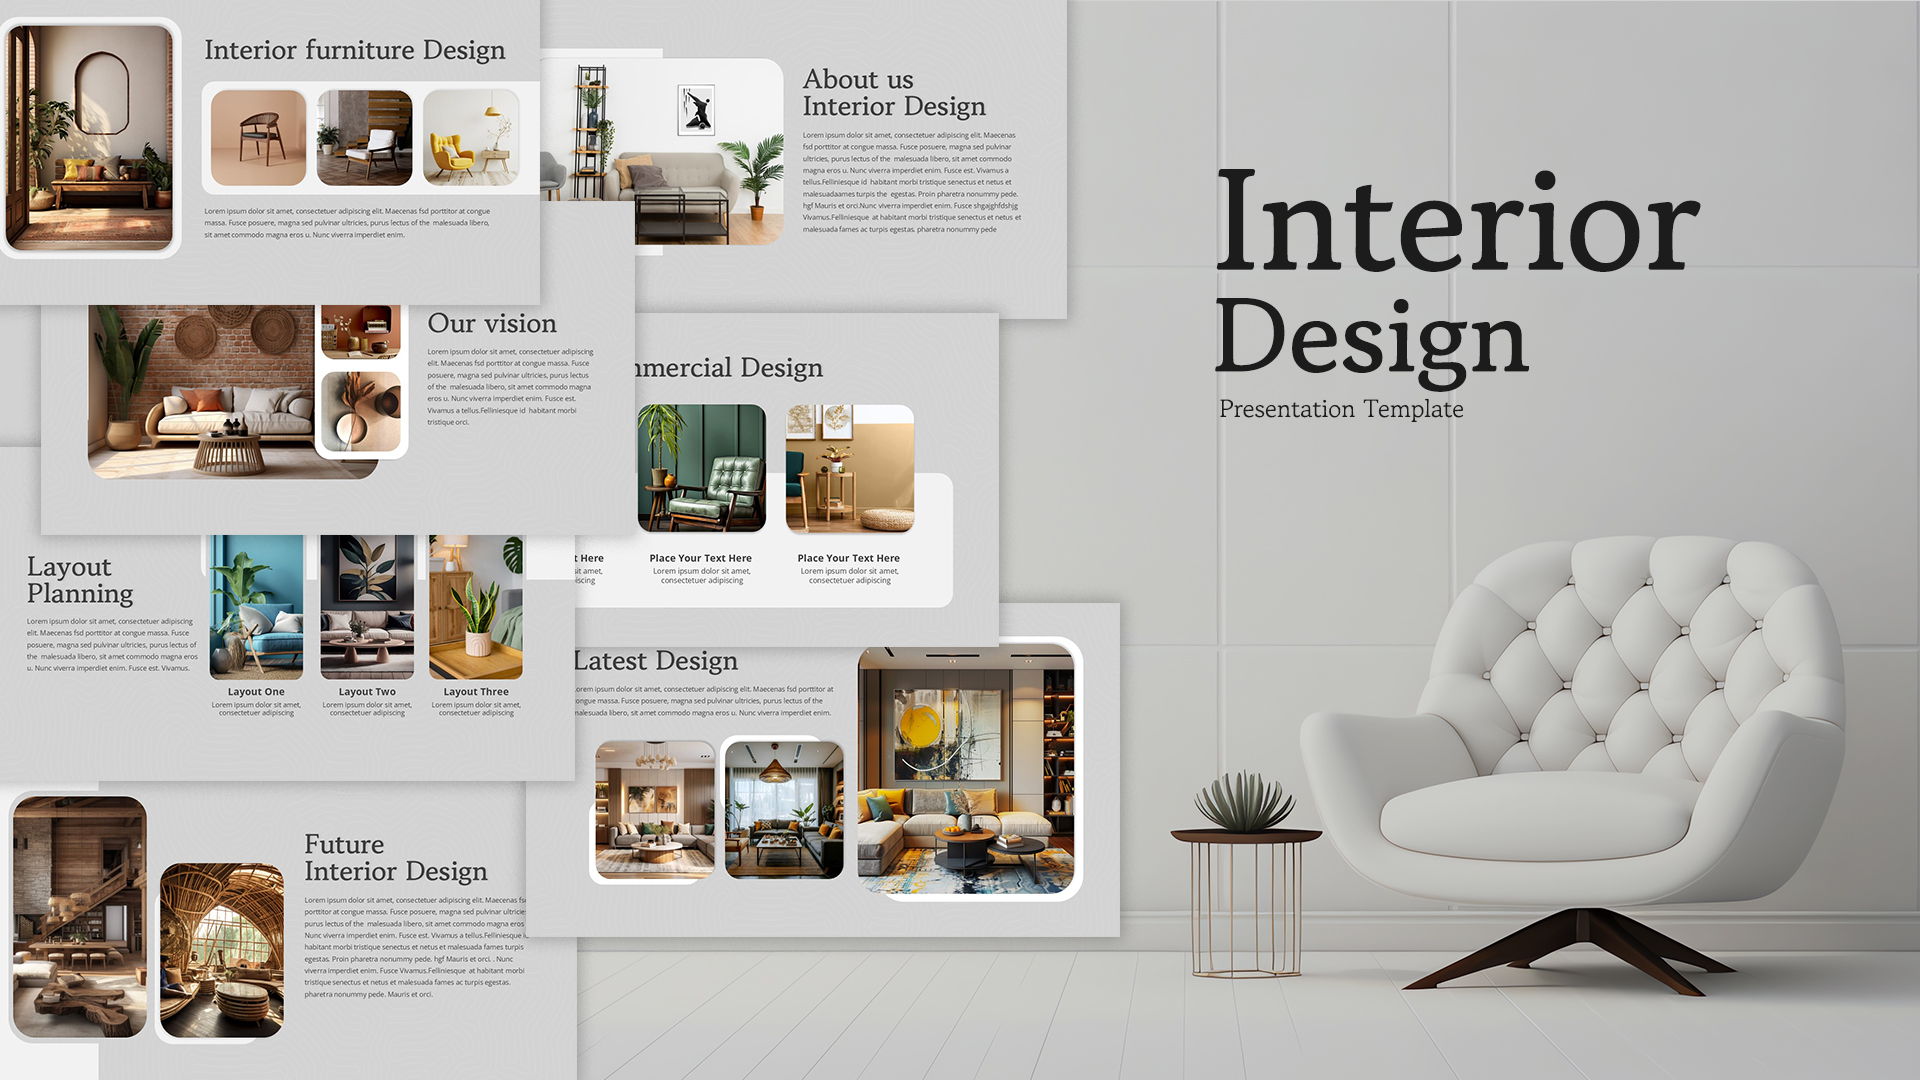
Interior Design Company Profile Deck Template for PowerPoint & Google Slides
Company Profile
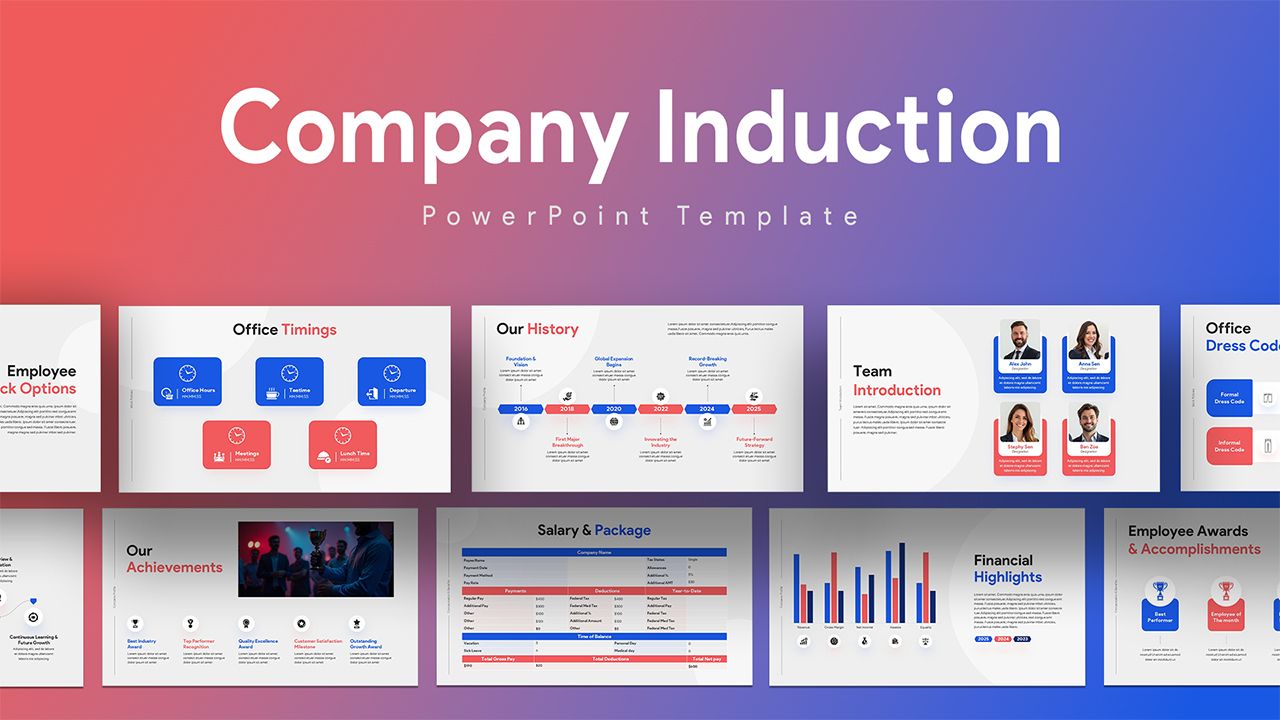
Company Induction Template for PowerPoint & Google Slides
Company Profile
Hospital Company Profile Presentation Template for PowerPoint & Google Slides
Decks
Company Snapshot template for PowerPoint & Google Slides
Company Profile
Animated Corporate Company Profile Deck Template for PowerPoint & Google Slides
Company Profile
ICT Company Profile Deck Template for PowerPoint & Google Slides
Company Profile
Animated Corporate Company Profile Template for PowerPoint & Google Slides
Company Profile
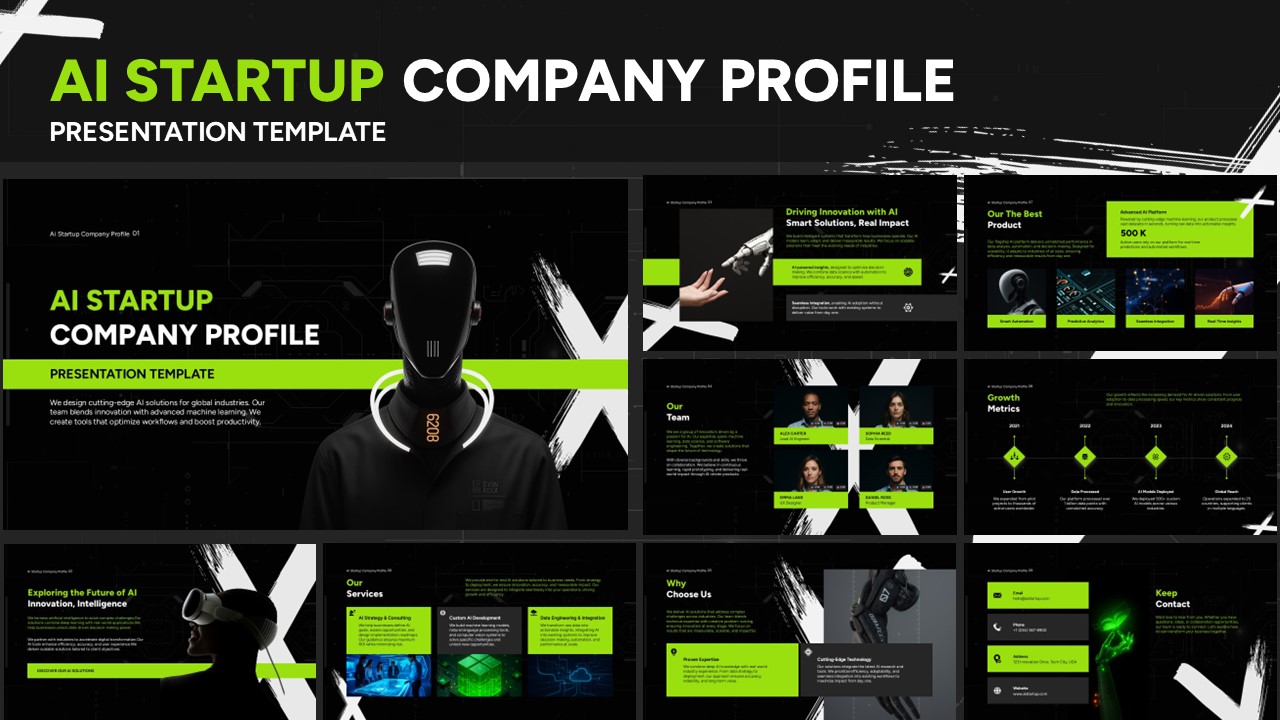
AI Startup Company Profile Template for PowerPoint & Google Slides
Company Profile
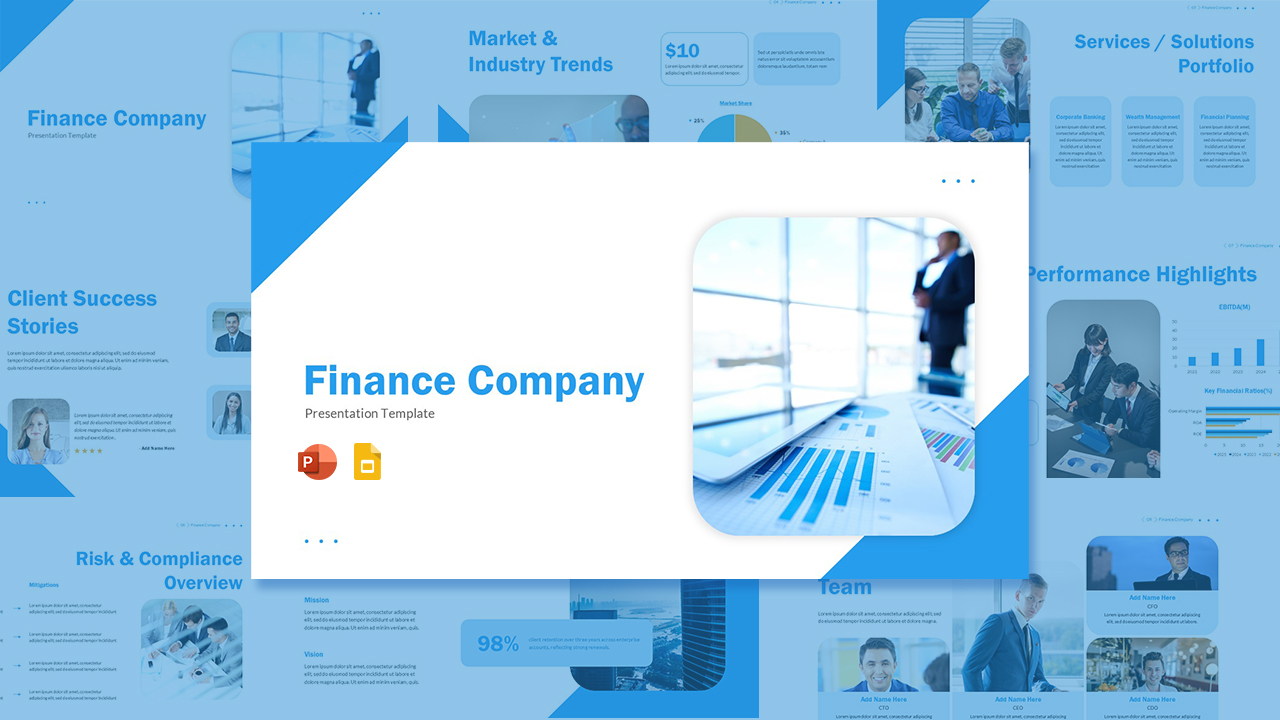
Finance Company Template for PowerPoint & Google Slides
Finance
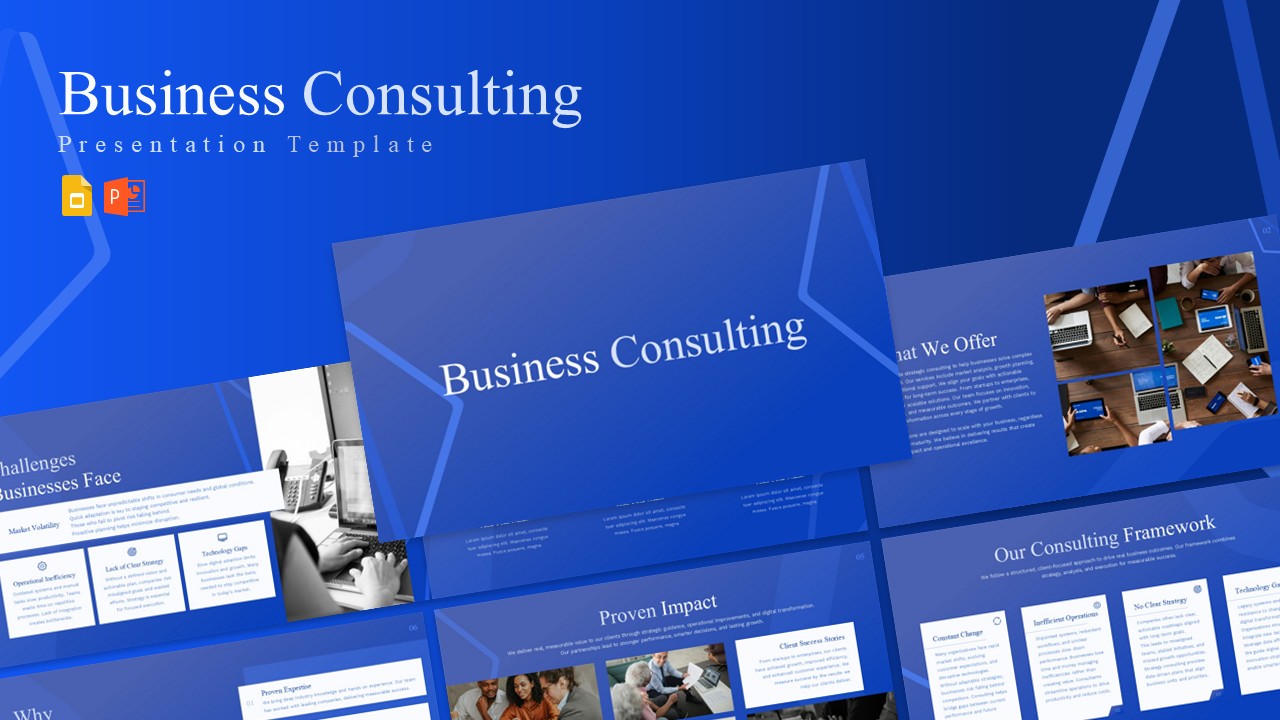
Business Consulting Company Profile Template for PowerPoint & Google Slides
Consulting
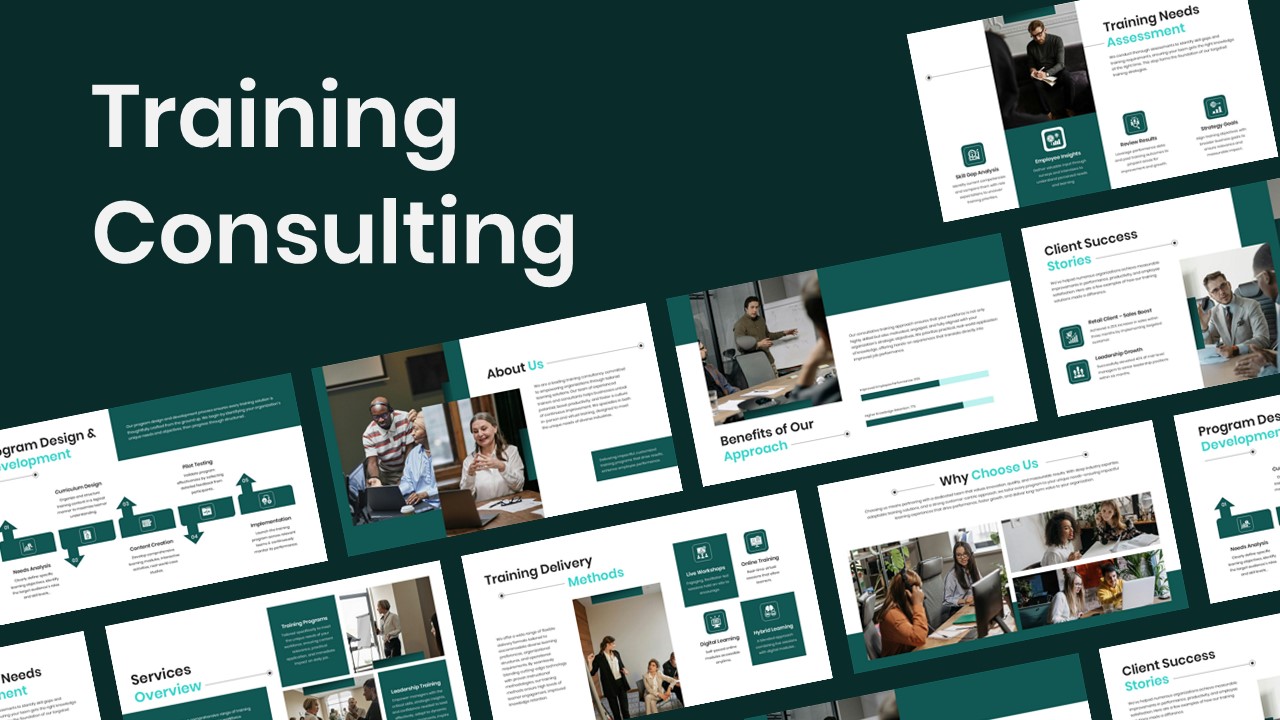
Training Consulting Company Profile Template for PowerPoint & Google Slides
Company Profile
Digital Marketing Company Profile Template for PowerPoint & Google Slides
Digital Marketing