Colorful Functional Organization Chart Template for PowerPoint & Google Slides

Description
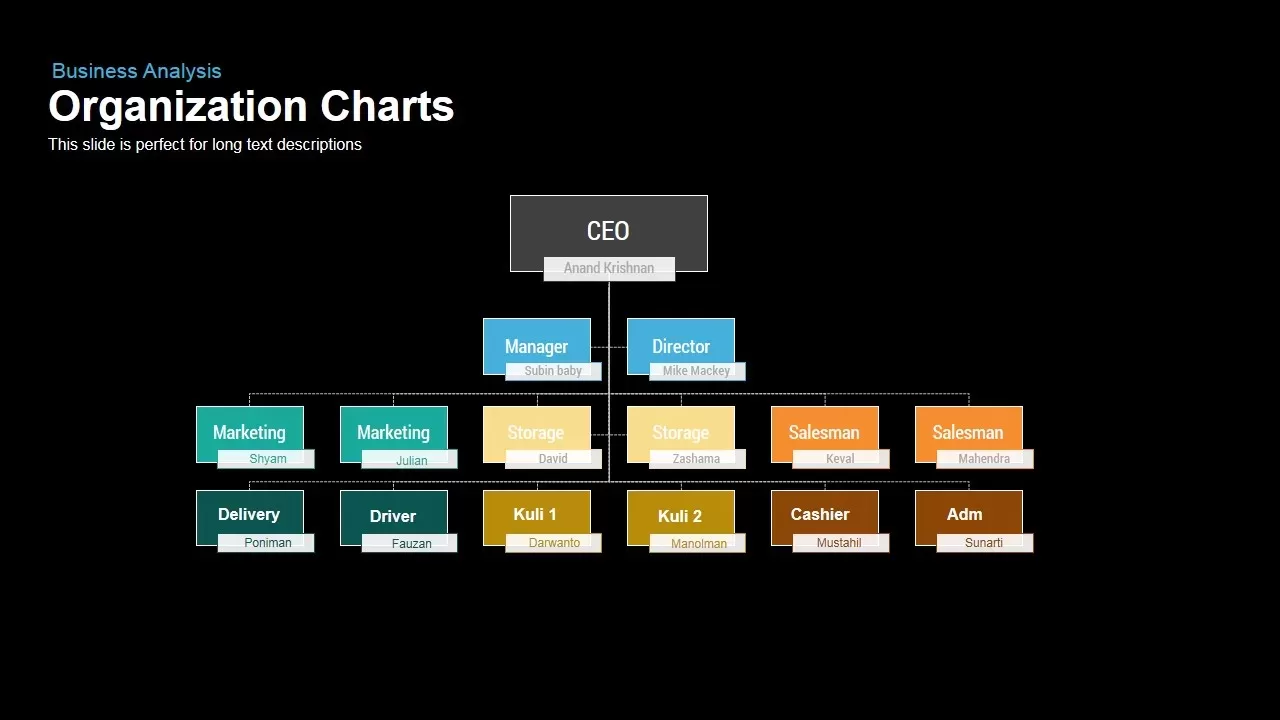
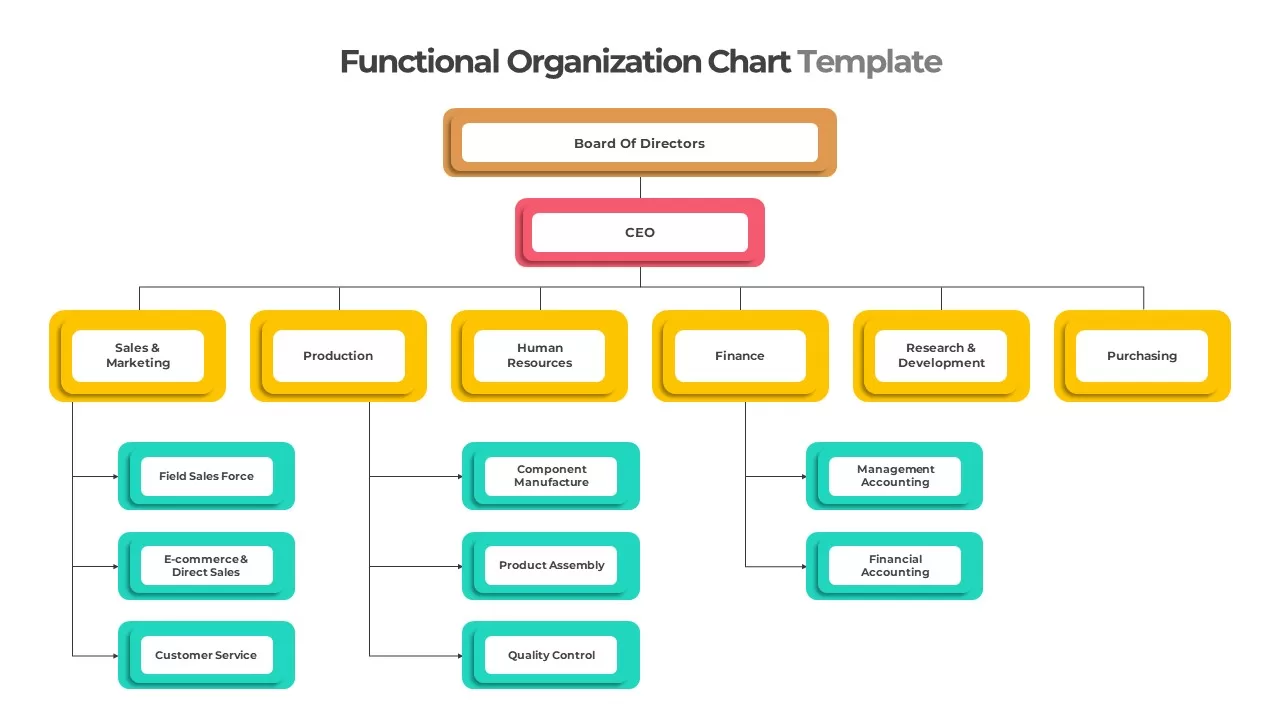
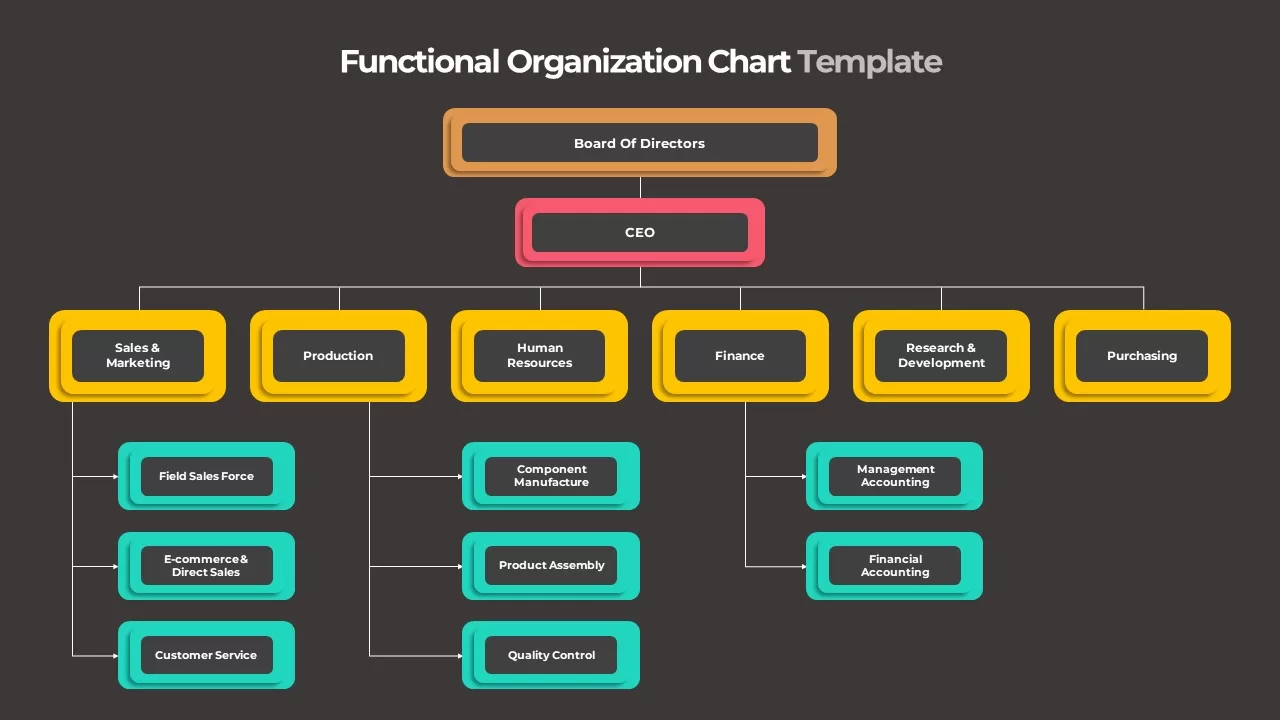
Map your company’s reporting structure with this vibrant functional organization chart slide. At the top, a bold orange-to-gold gradient “Board of Directors” box anchors the hierarchy, leading down via a clean connector line to a pink “CEO” node. Four yellow-gradient manager boxes (“Sales & Marketing,” “Production,” “Human Resources,” “Finance,” “Research & Development,” and “Purchasing”) branch below the CEO, each linked to three teal function nodes—such as “Field Sales Force,” “Component Manufacture,” and “Management Accounting”—that clearly delineate team responsibilities. Rounded corners, subtle drop shadows, and consistent spacing lend a polished, professional feel, while contrasting gradient fills make each level instantly distinguishable.
Built on fully editable master slides, this template lets you rename positions, add or remove branches, swap gradient colors for brand consistency, and resize boxes to accommodate longer titles. Use connector animations to reveal each branch sequentially during live presentations, or duplicate the layout to compare organizational structures across multiple business units. Whether you’re presenting a board-level governance overview, rolling out a new departmental restructure, or documenting project-team assignments, this slide streamlines the process—no manual alignment or complex graphics editing required.
Who is it for
HR leaders, executives, consultants, project managers, and team leads who need a clear, engaging way to communicate organizational hierarchies, departmental responsibilities, or reporting relationships.
Other Uses
Repurpose this layout as a RACI chart, service-line responsibility map, project-team breakdown structure, or cross-functional workflow diagram by relabeling nodes and adjusting branch counts to fit any functional mapping scenario.
Login to download this file

Item ID
SB03067
Related Templates

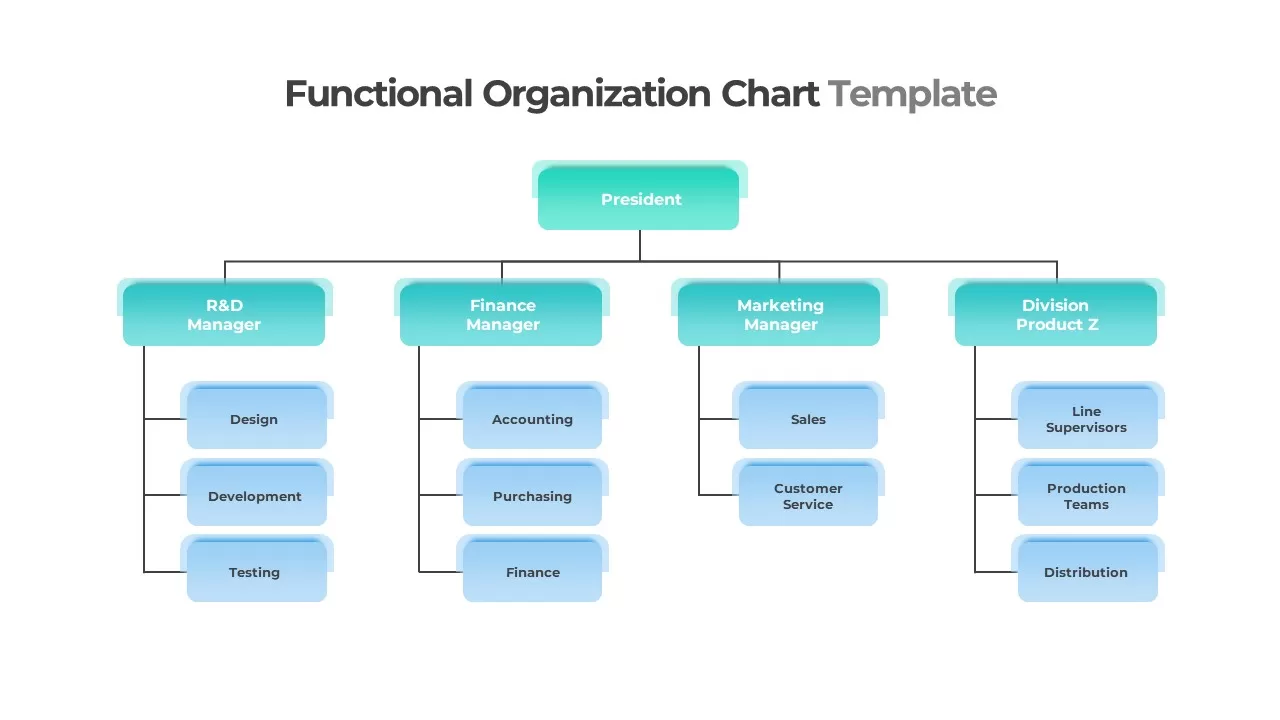
Functional Organization Chart Structure Template for PowerPoint & Google Slides
Org Chart
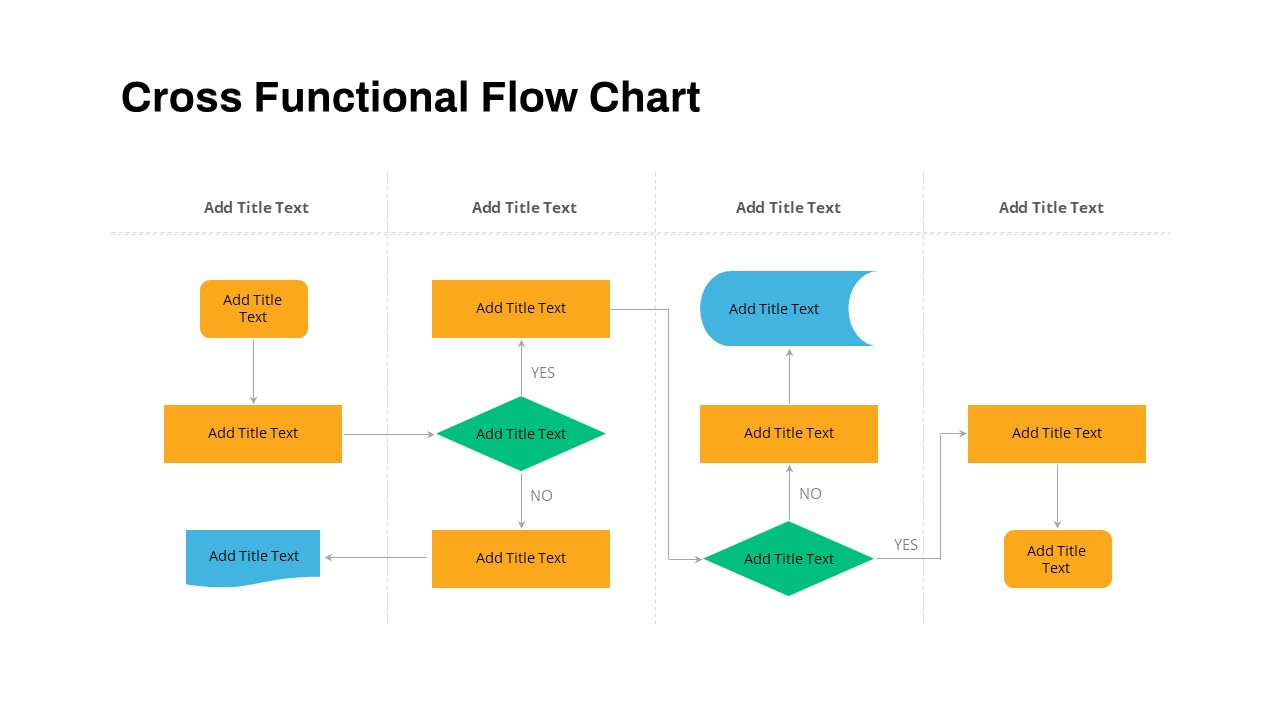
Cross Functional Swimlane Flow Chart Template for PowerPoint & Google Slides
Flow Charts
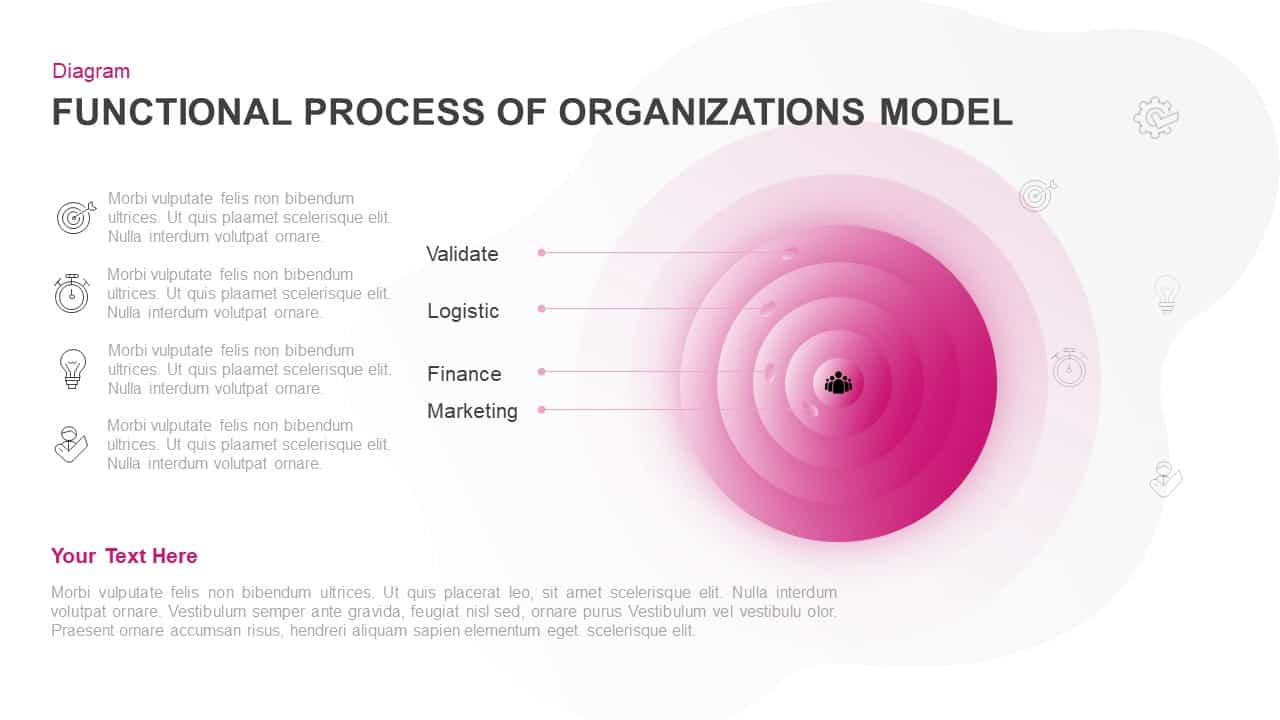
Concentric Functional Process Model Template for PowerPoint & Google Slides
Circular
Multi-Functional Presentation Template for PowerPoint & Google Slides
Pitch Deck

Corporate Organization Chart template for PowerPoint & Google Slides
Org Chart
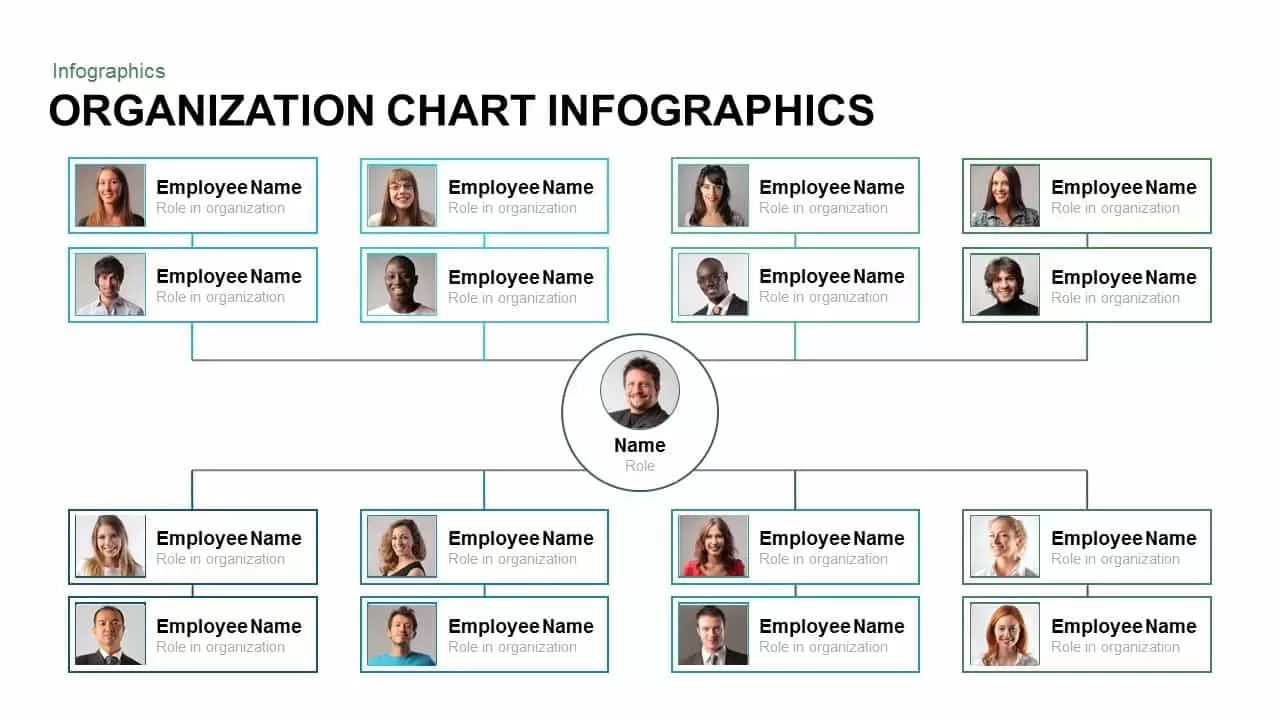
Organization Chart template for PowerPoint & Google Slides
Org Chart
Business Organization Chart Hierarchy Template for PowerPoint & Google Slides
Org Chart
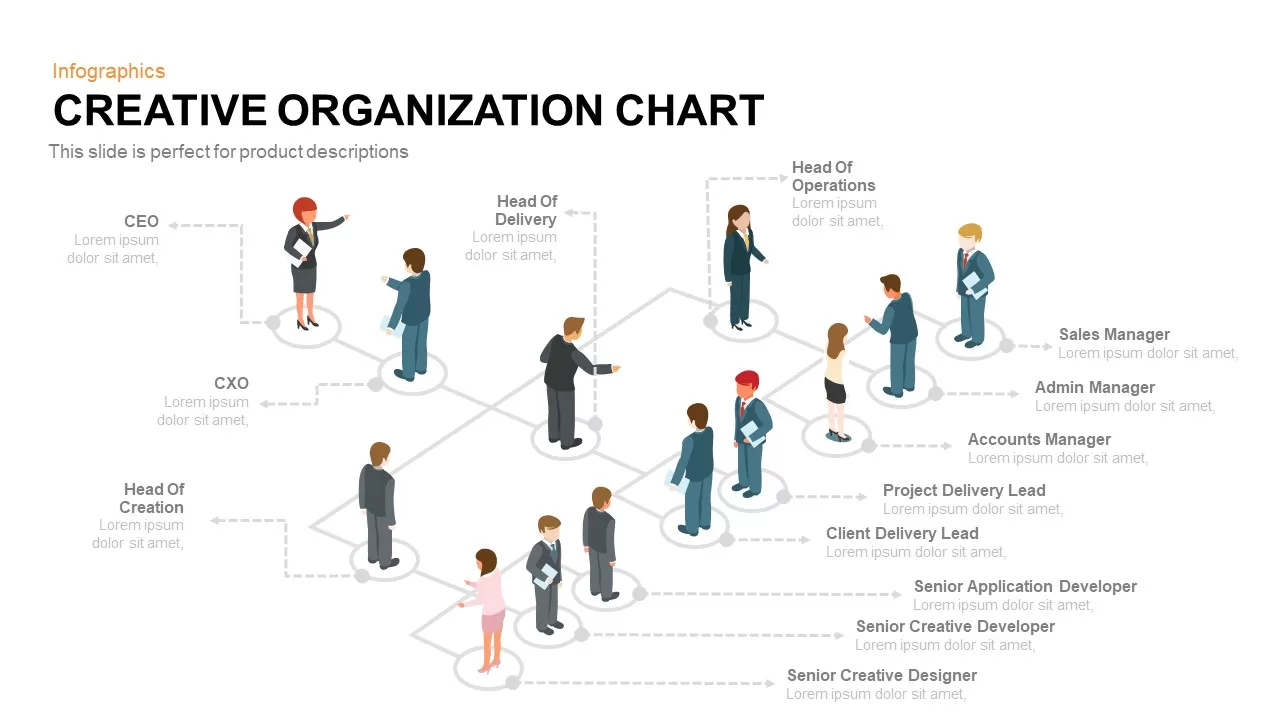
Isometric Organization Chart Diagram Template for PowerPoint & Google Slides
Org Chart
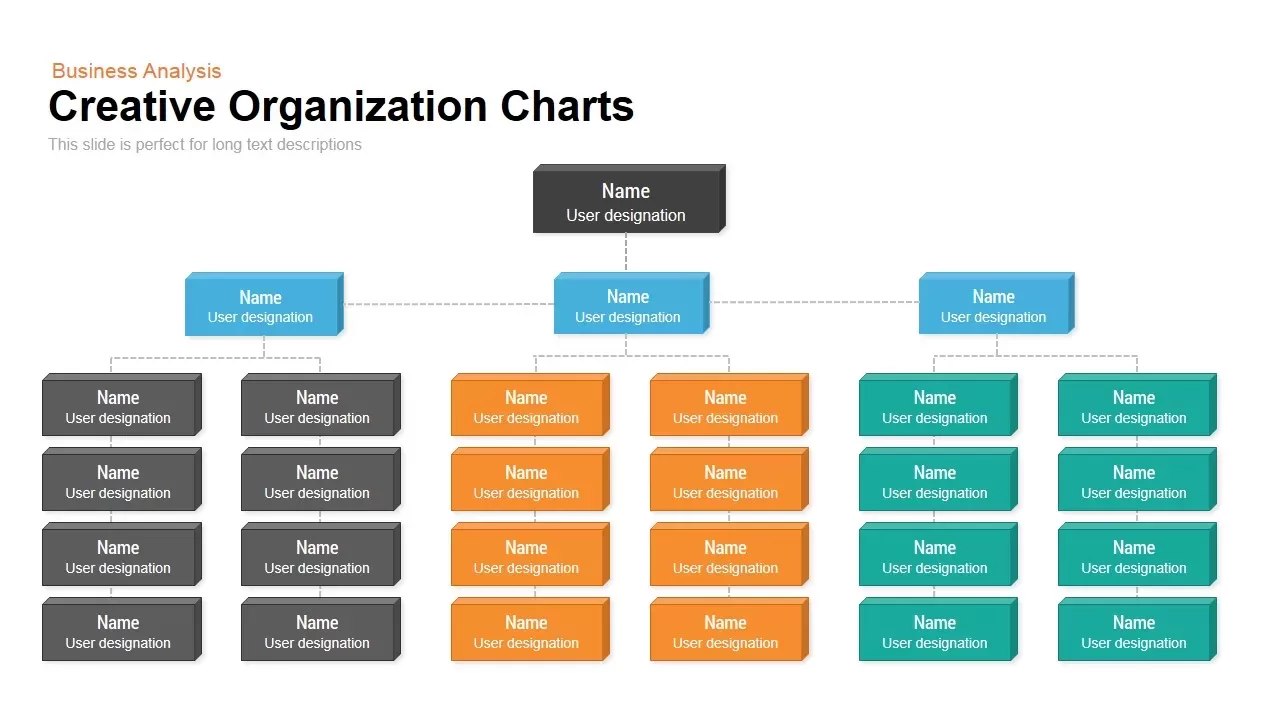
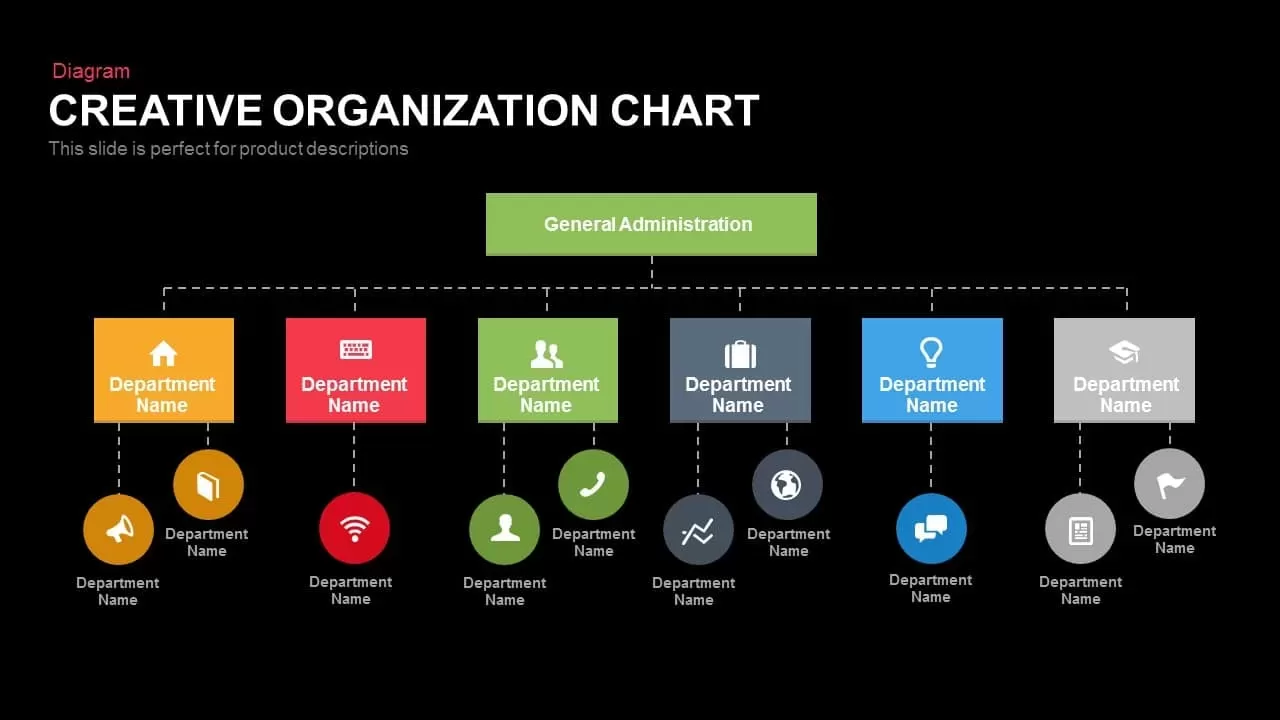
Creative Organization Chart Diagram Template for PowerPoint & Google Slides
Org Chart

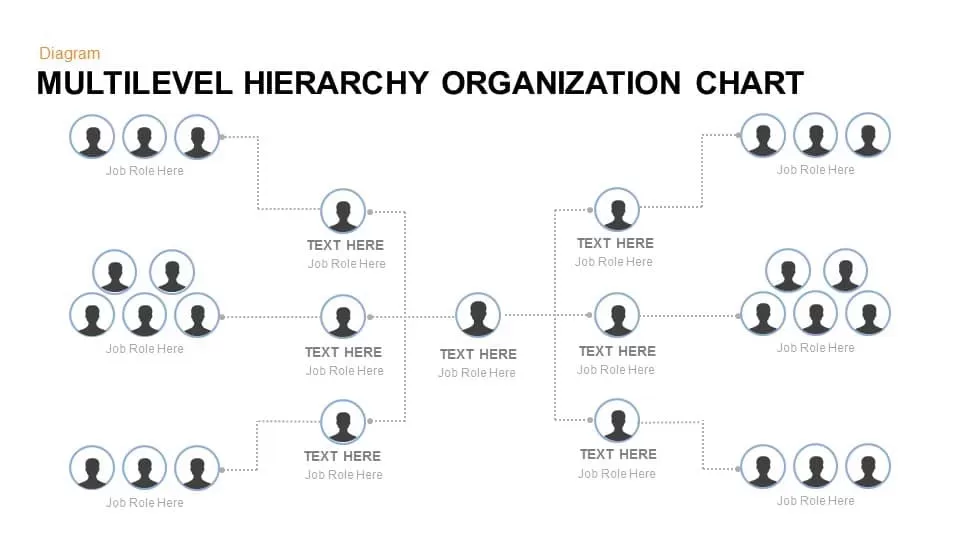
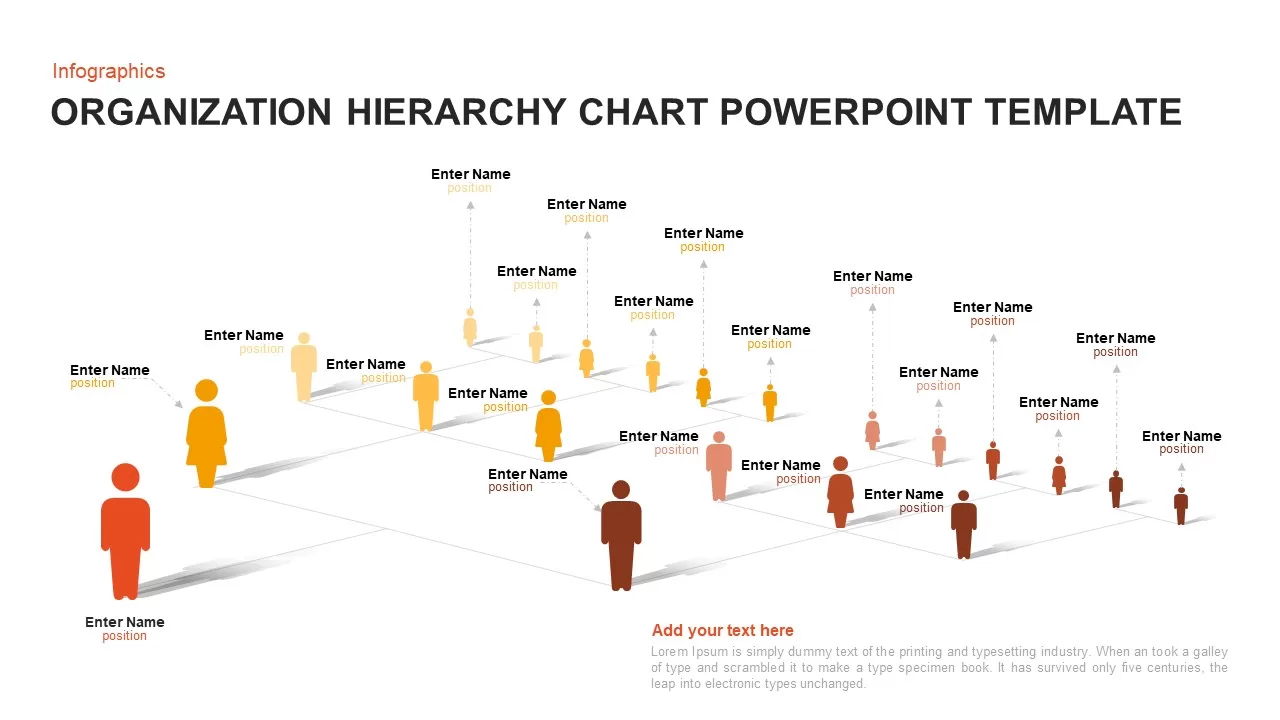
Multilevel Hierarchy Organization Chart template for PowerPoint & Google Slides
Org Chart
Organization Chart Overview template for PowerPoint & Google Slides
Org Chart
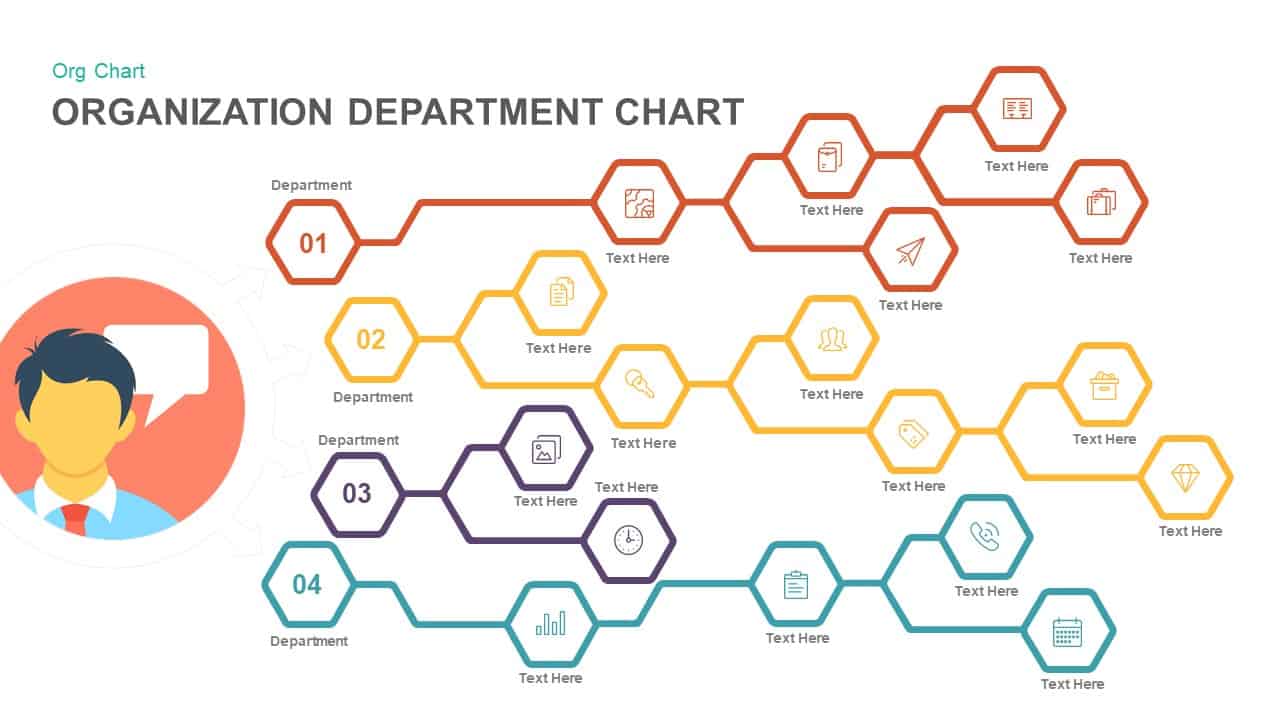
Organization Department Hexagon Chart Template for PowerPoint & Google Slides
Org Chart
3D Organization Hierarchy Chart Template for PowerPoint & Google Slides
Org Chart
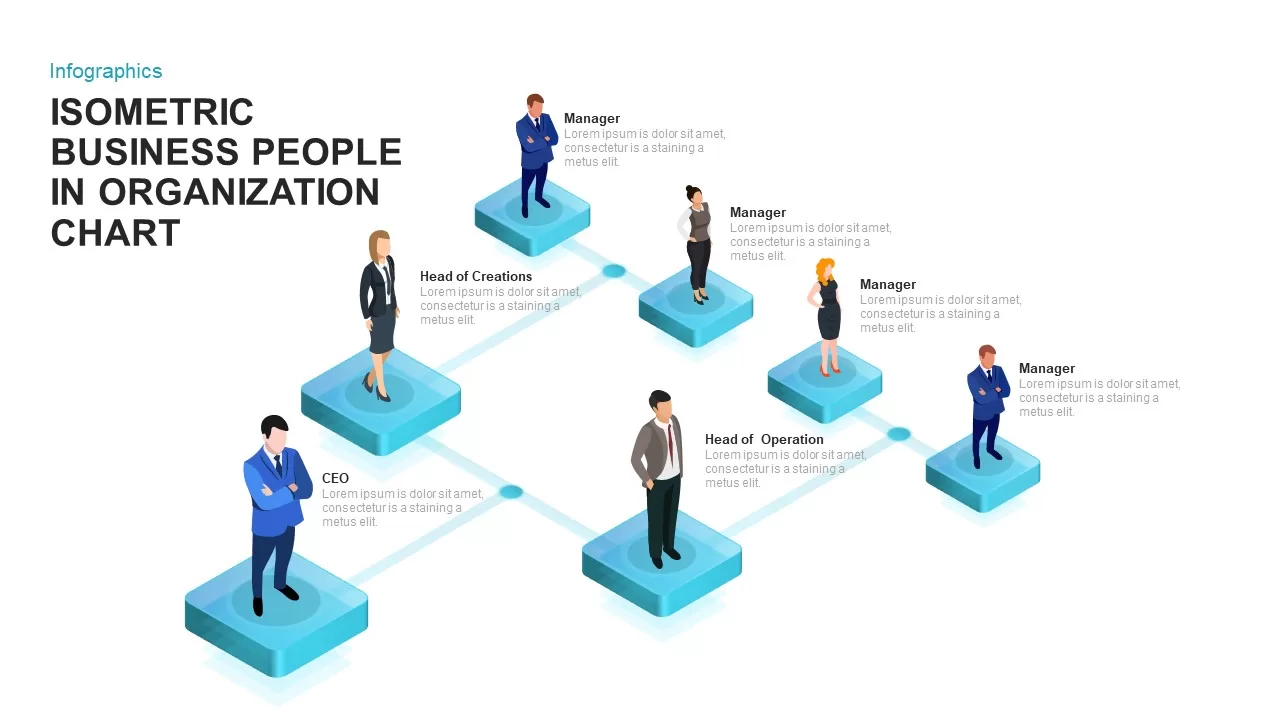
Isometric Business Organization Chart Template for PowerPoint & Google Slides
Org Chart
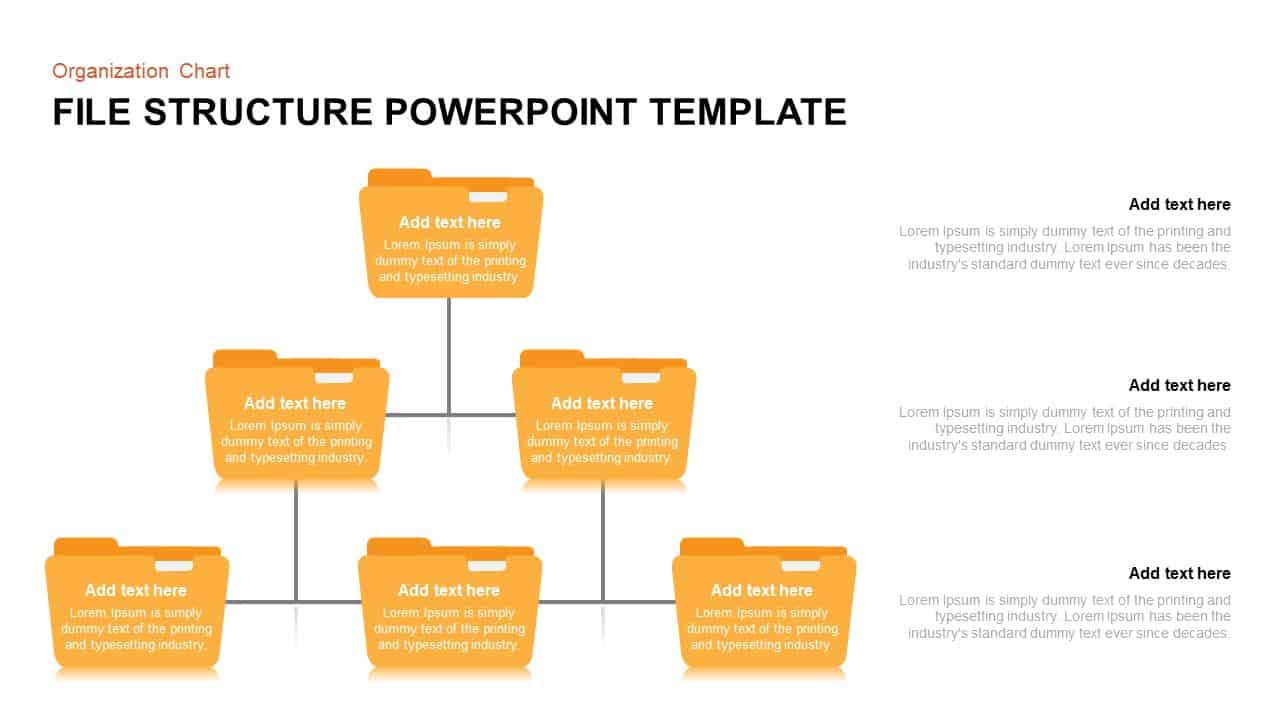
File Structure Organization Chart Template for PowerPoint & Google Slides
Org Chart
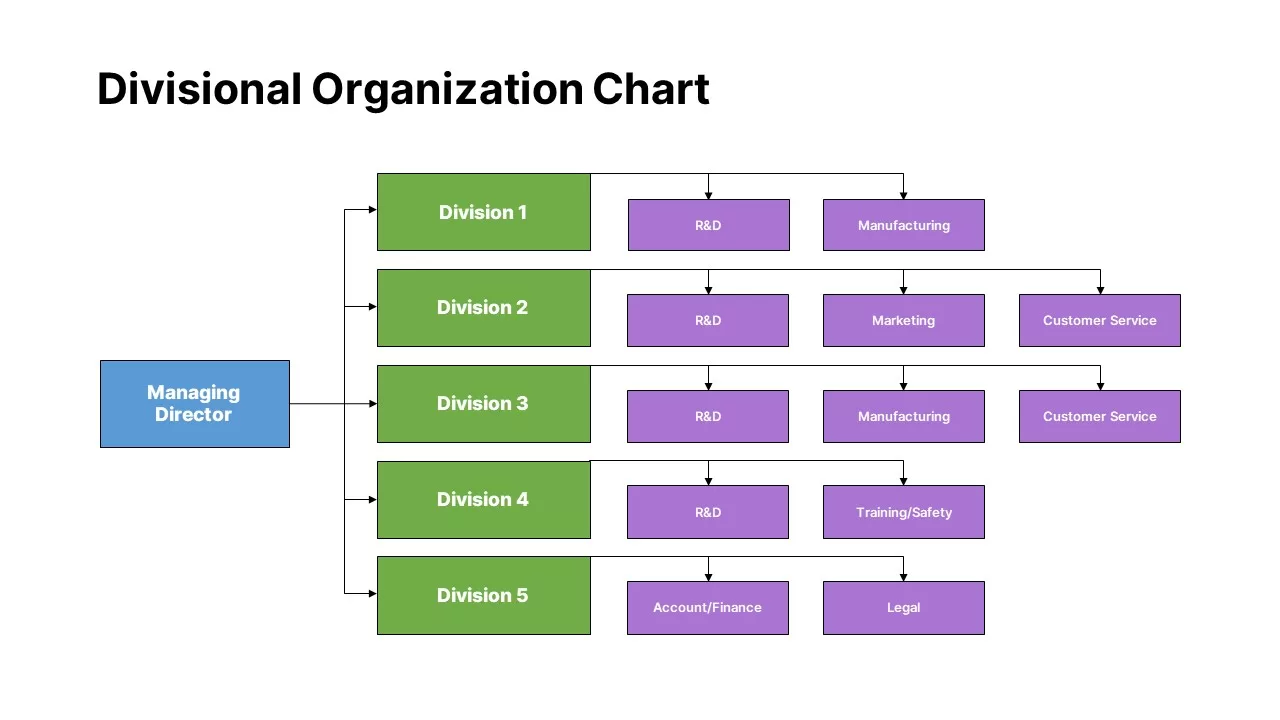
Modern Divisional Organization Chart Template for PowerPoint & Google Slides
Org Chart
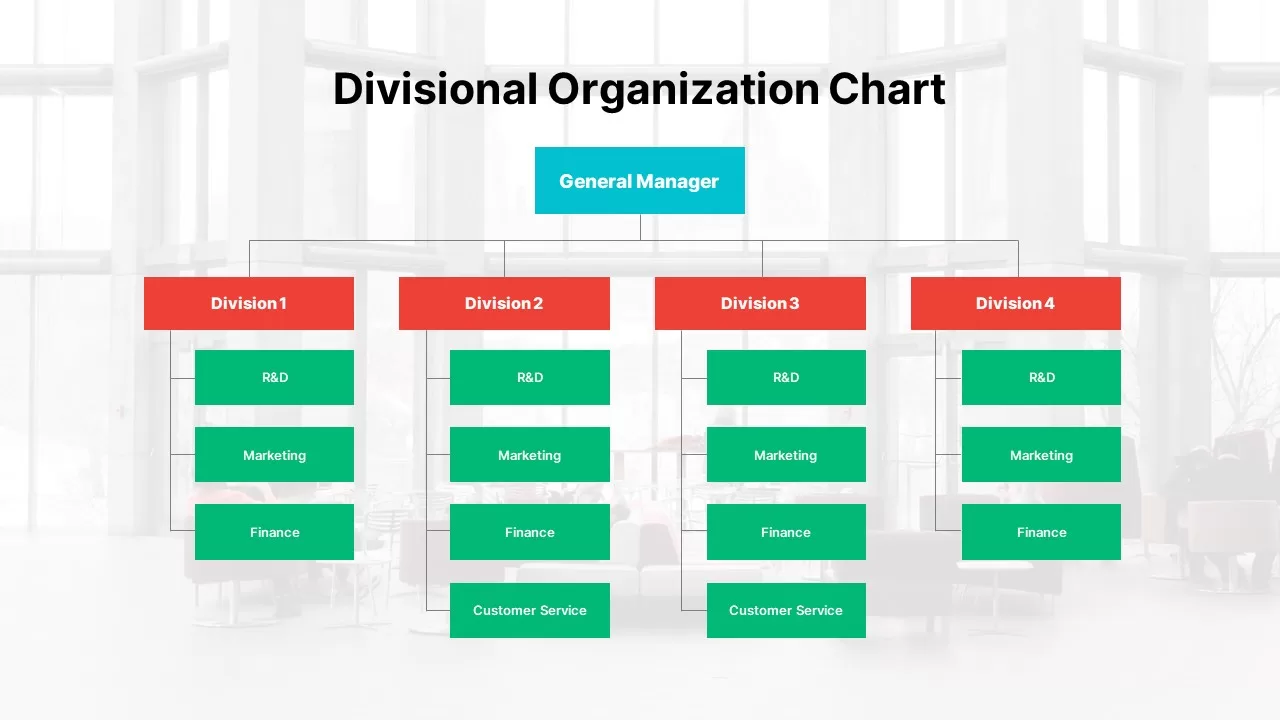
Divisional Organization Chart Template for PowerPoint & Google Slides
Org Chart
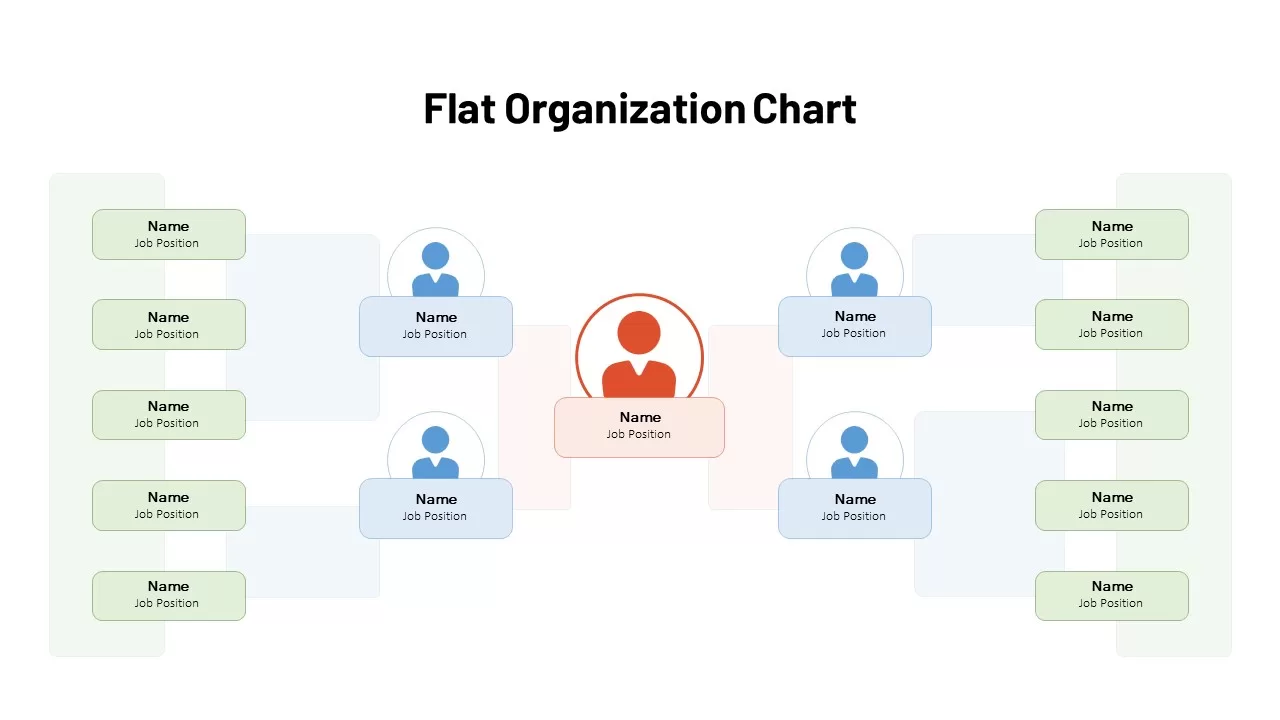
Flat Organization Chart Diagram Template for PowerPoint & Google Slides
Org Chart
Flat Organization Chart Diagram Template for PowerPoint & Google Slides
Org Chart
Professional HR Organization Chart Template for PowerPoint & Google Slides
Org Chart
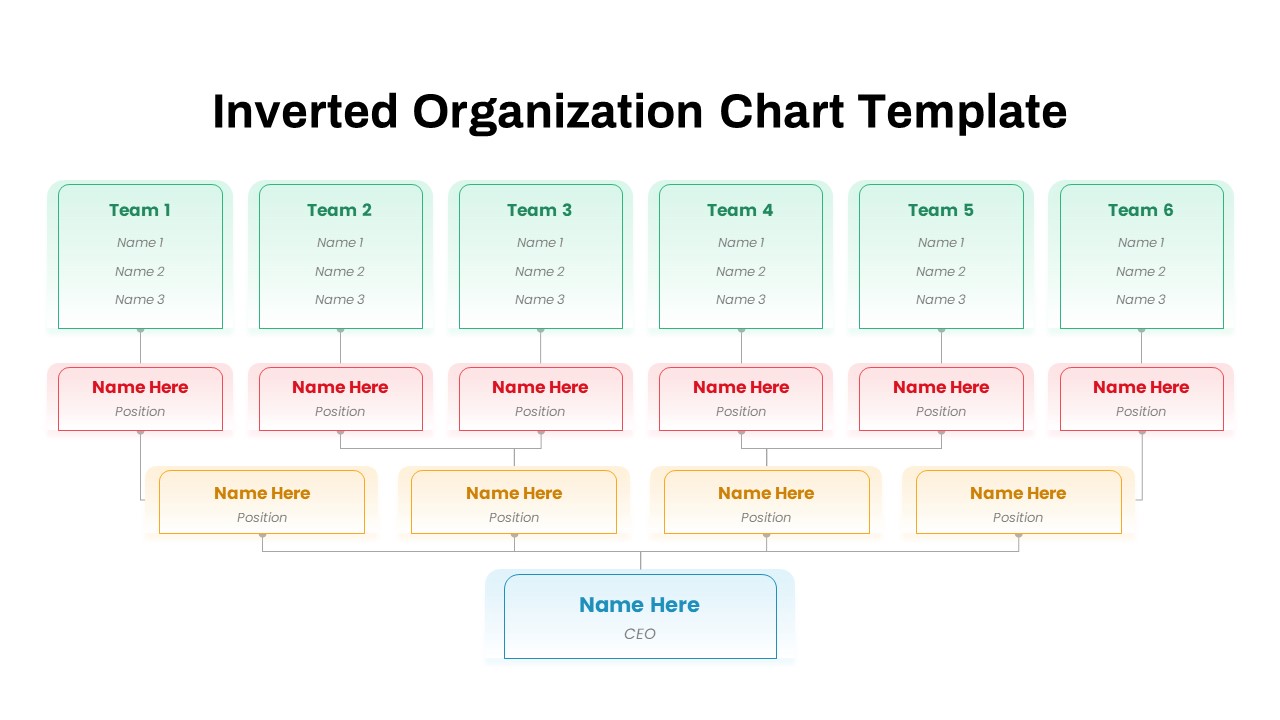
Inverted Organization Chart Diagram Template for PowerPoint & Google Slides
Org Chart
Professional Table of Organization Chart Template for PowerPoint & Google Slides
Org Chart

Colorful Radial Bar Chart Template for PowerPoint & Google Slides
Bar/Column
Modern Colorful Circular Org Chart Template for PowerPoint & Google Slides
Org Chart
Colorful Four-Segment Wheel Chart Template for PowerPoint & Google Slides
Circular
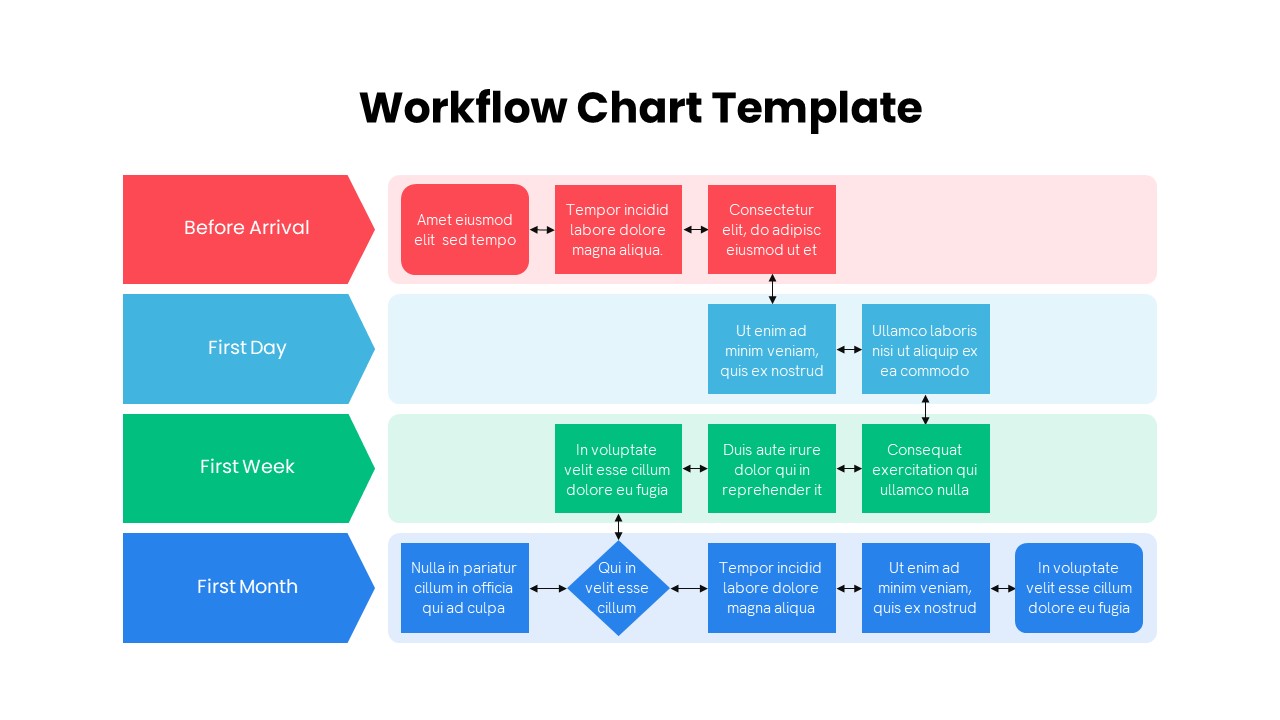
Colorful Multistage Workflow Chart Template for PowerPoint & Google Slides
Flow Charts
Multi-Level Colorful Pyramid Chart Template for PowerPoint & Google Slides
Pyramid
Colorful Annual Gantt Chart Project Planner Template for PowerPoint & Google Slides
Gantt Chart
Colorful Annual Gantt Chart Timeline Template for PowerPoint & Google Slides
Gantt Chart
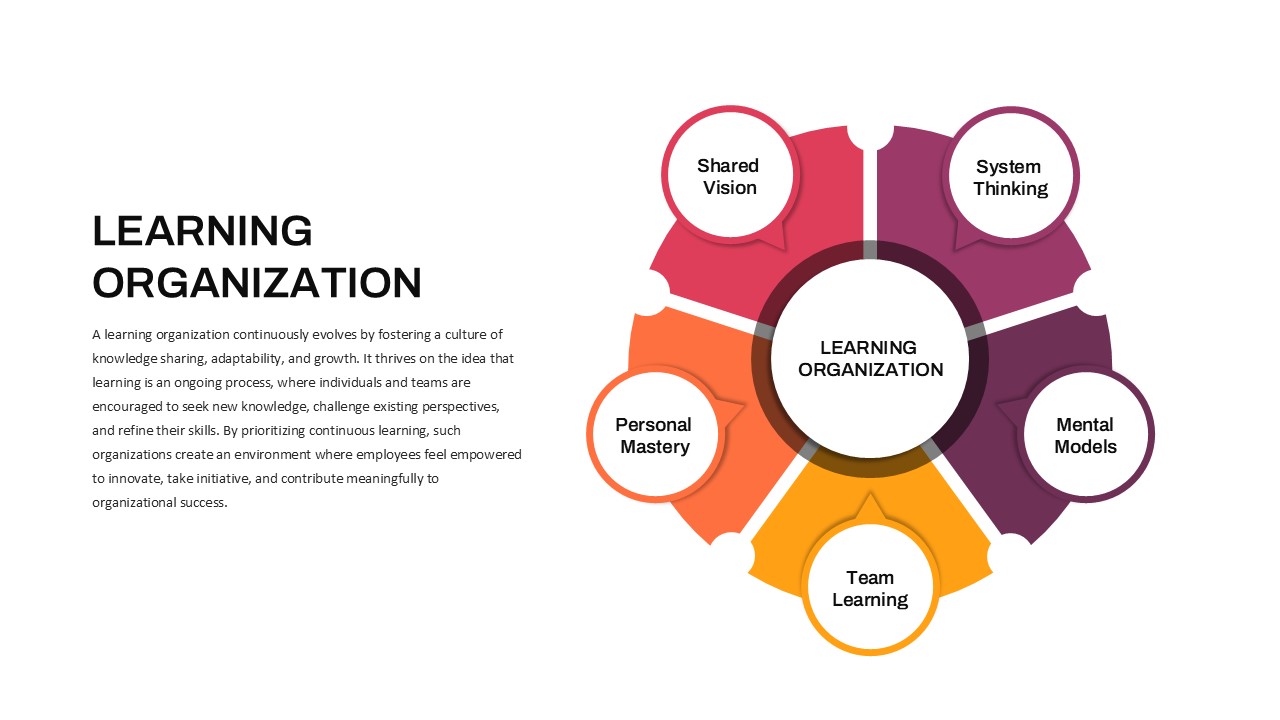
Learning Organization PowerPoint Template for PowerPoint & Google Slides
Business Strategy
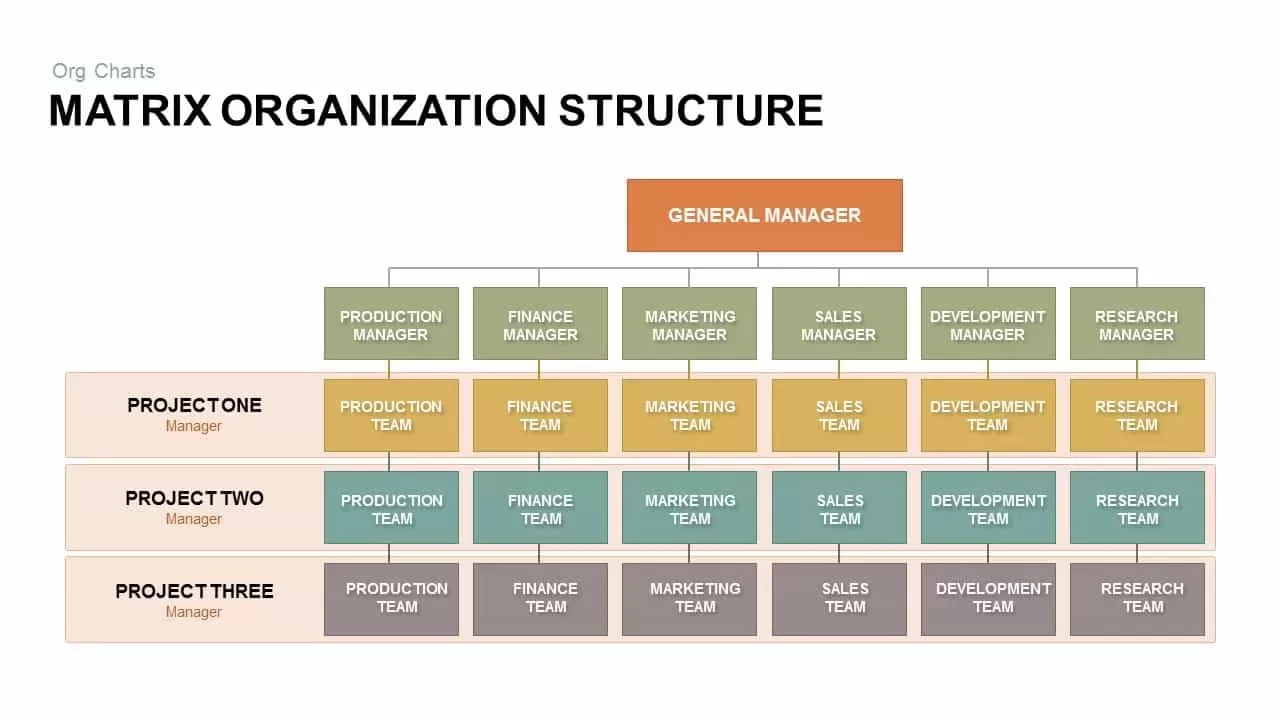
Matrix Organization Structure template for PowerPoint & Google Slides
Org Chart

Non-Profit Organization Profile Deck Template for PowerPoint & Google Slides
Pitch Deck
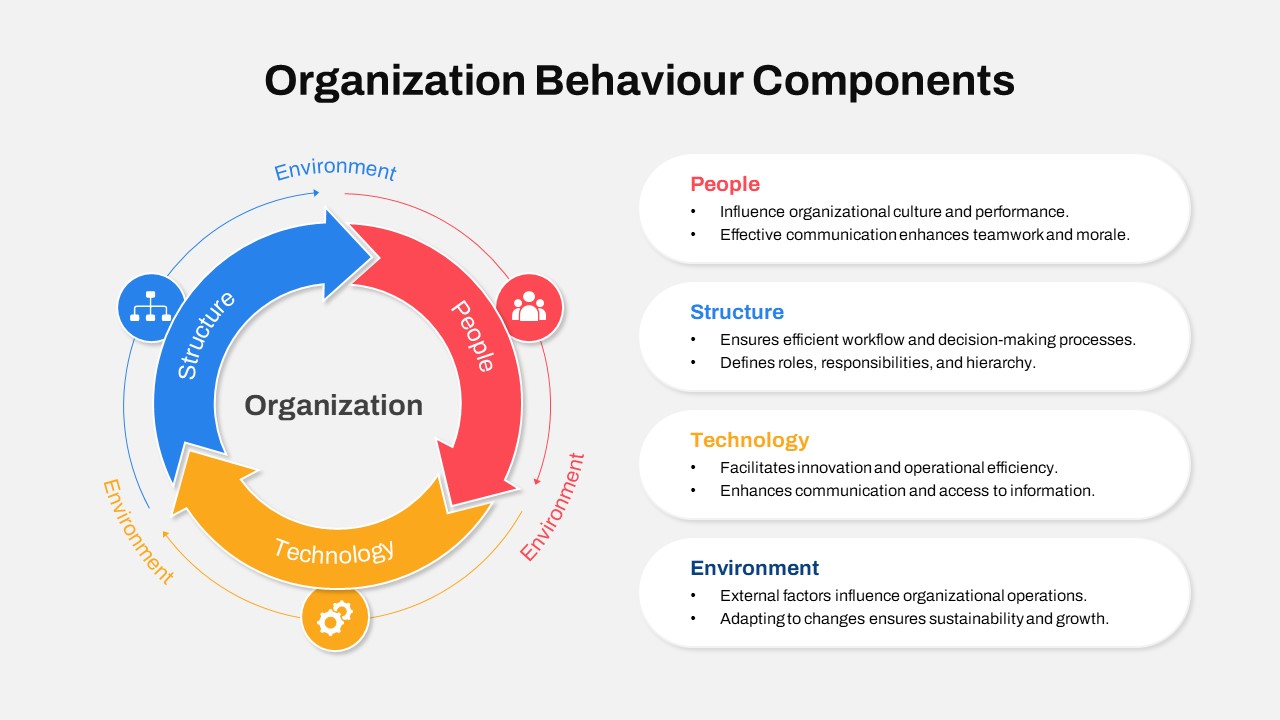
Organization Behaviour Circular Template for PowerPoint & Google Slides
Circular
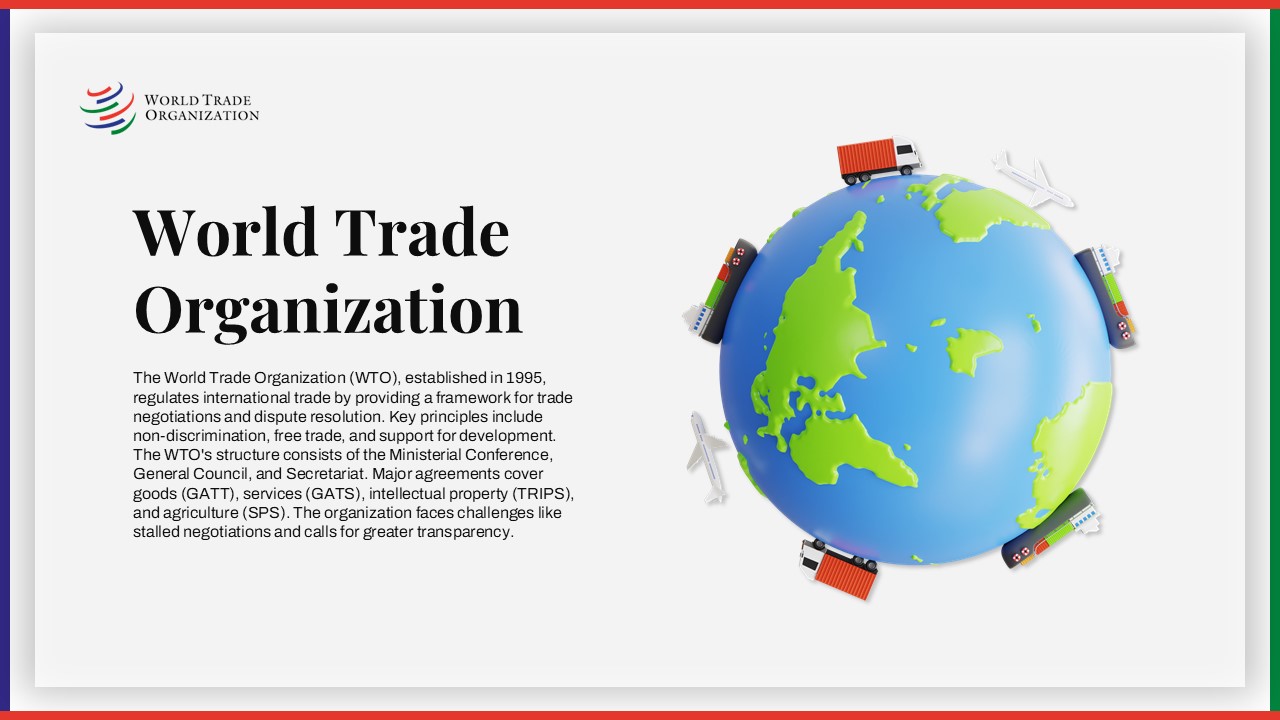
World Trade Organization Profile Template for PowerPoint & Google Slides
Business
Free World Health Organization Presentation Deck for PowerPoint & Google Slides
Decks
Free
Colorful Rainbow Slides Template for PowerPoint & Google Slides
Graphics
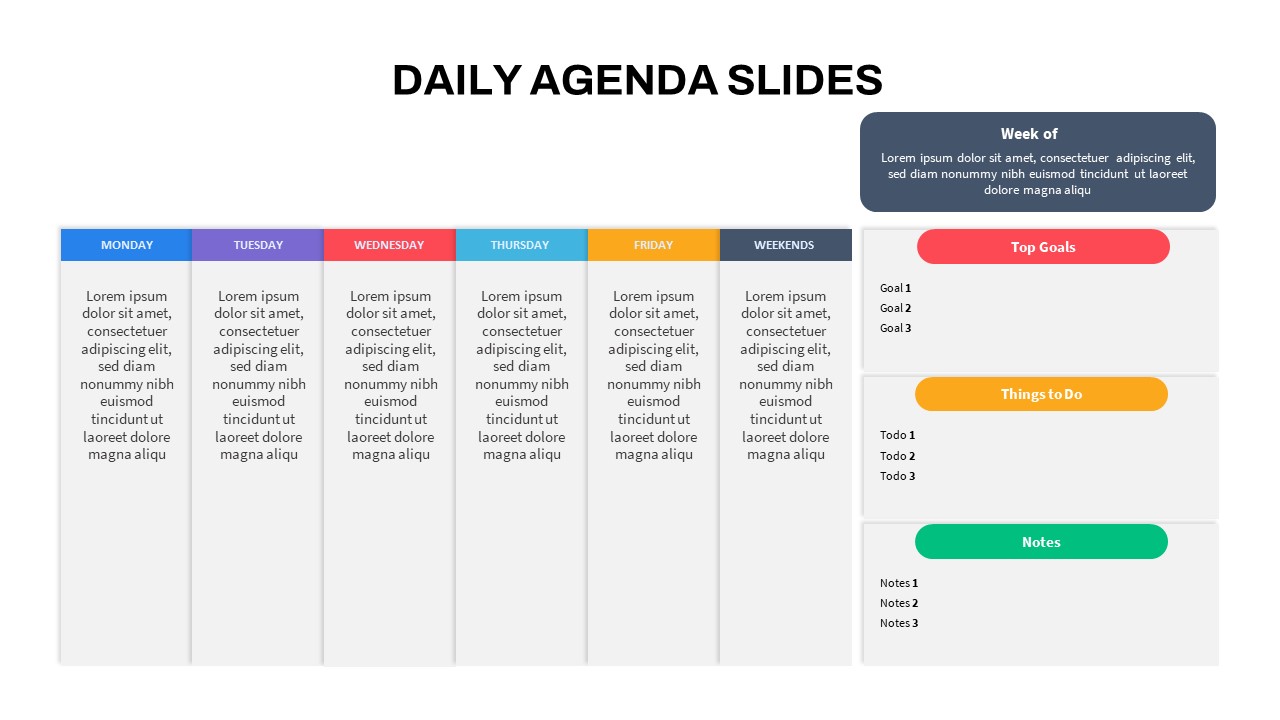
Editable Colorful Daily Agenda Slides Template for PowerPoint & Google Slides
Agenda
Free Colorful Morning Meeting Agenda Slides Template for PowerPoint & Google Slides
Agenda
Free
Colorful Birthday Celebration Slides for PowerPoint & Google Slides
Graphics
7-Stage Colorful Timeline Infographic Template for PowerPoint & Google Slides
Timeline
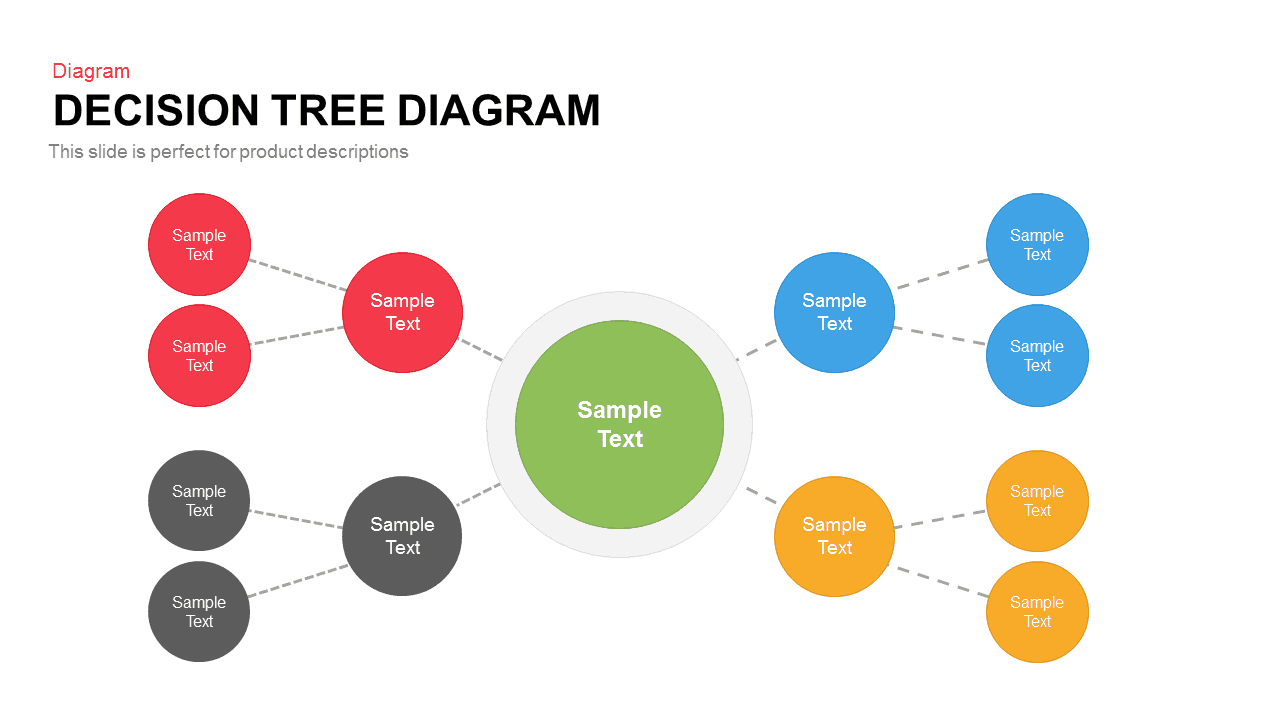
Colorful Decision Tree Diagram template for PowerPoint & Google Slides
Decision Tree
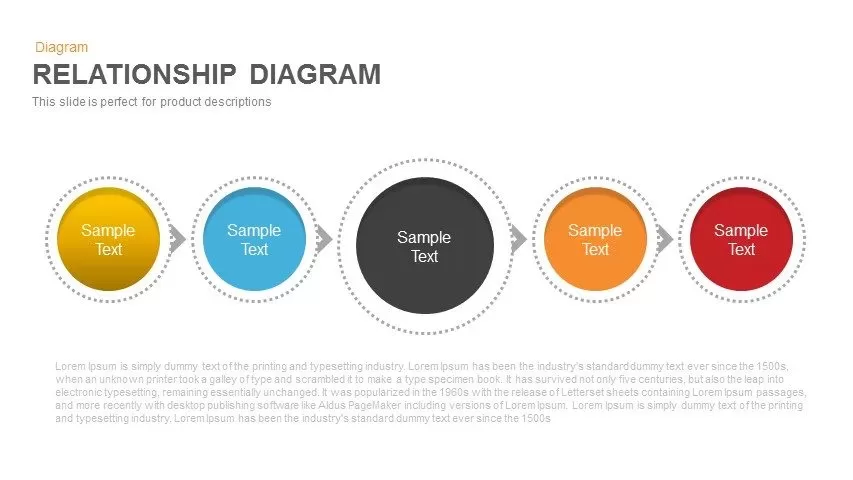
Colorful Five-Stage Relationship Diagram Template for PowerPoint & Google Slides
Process
Colorful Photo Capture Infographic Template for PowerPoint & Google Slides
Advertising
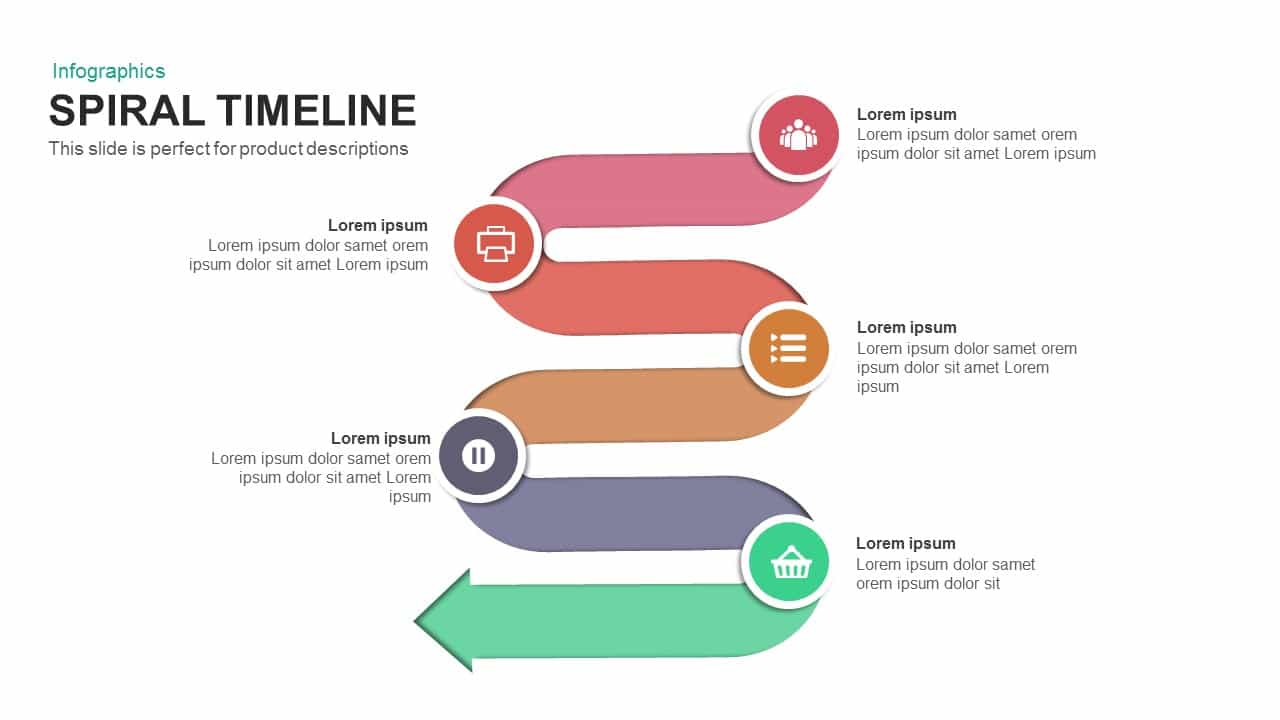
Six-Stage Colorful Spiral Timeline Template for PowerPoint & Google Slides
Timeline
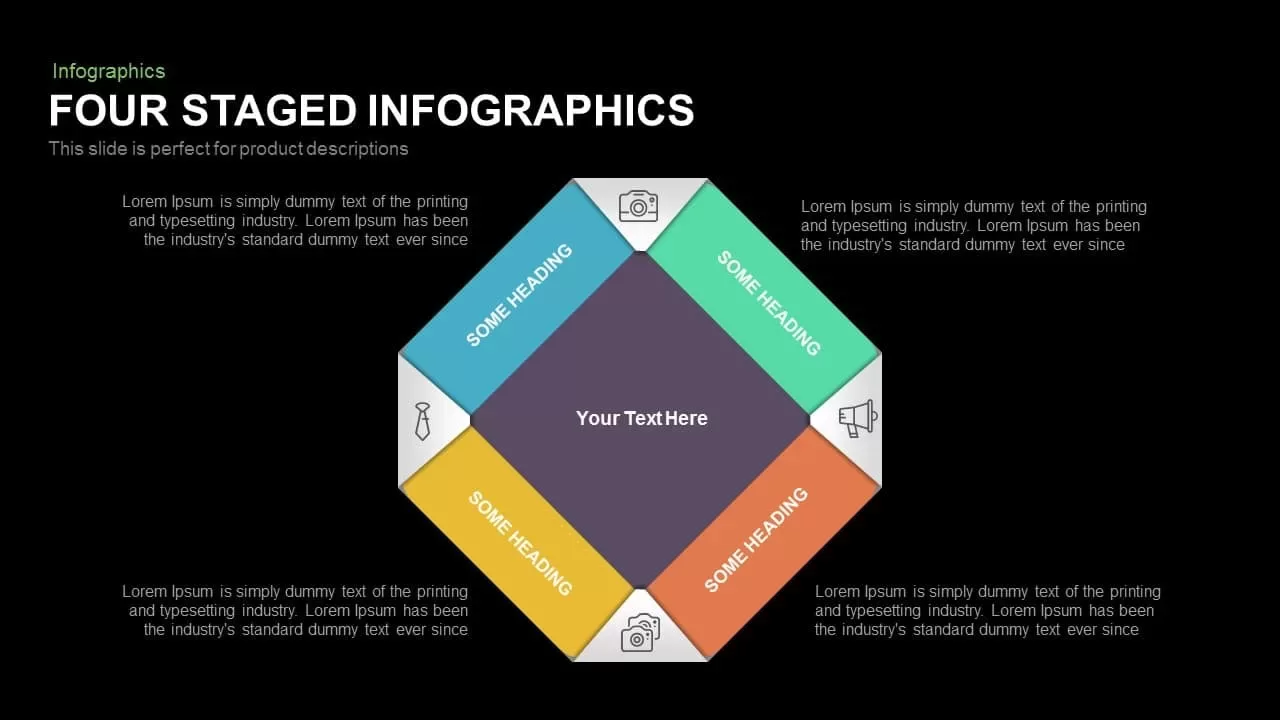
Colorful Four-Stage Infographic Process Template for PowerPoint & Google Slides
Process
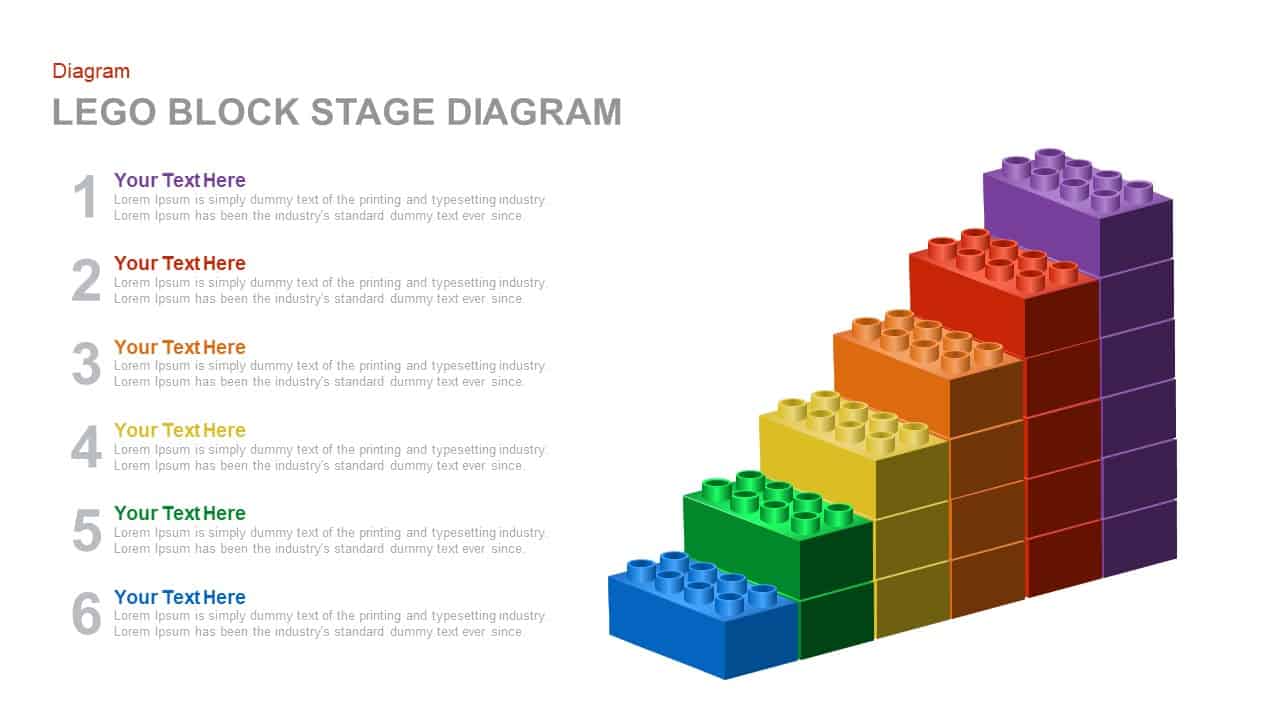
Colorful LEGO Block Stage Diagram Template for PowerPoint & Google Slides
Process
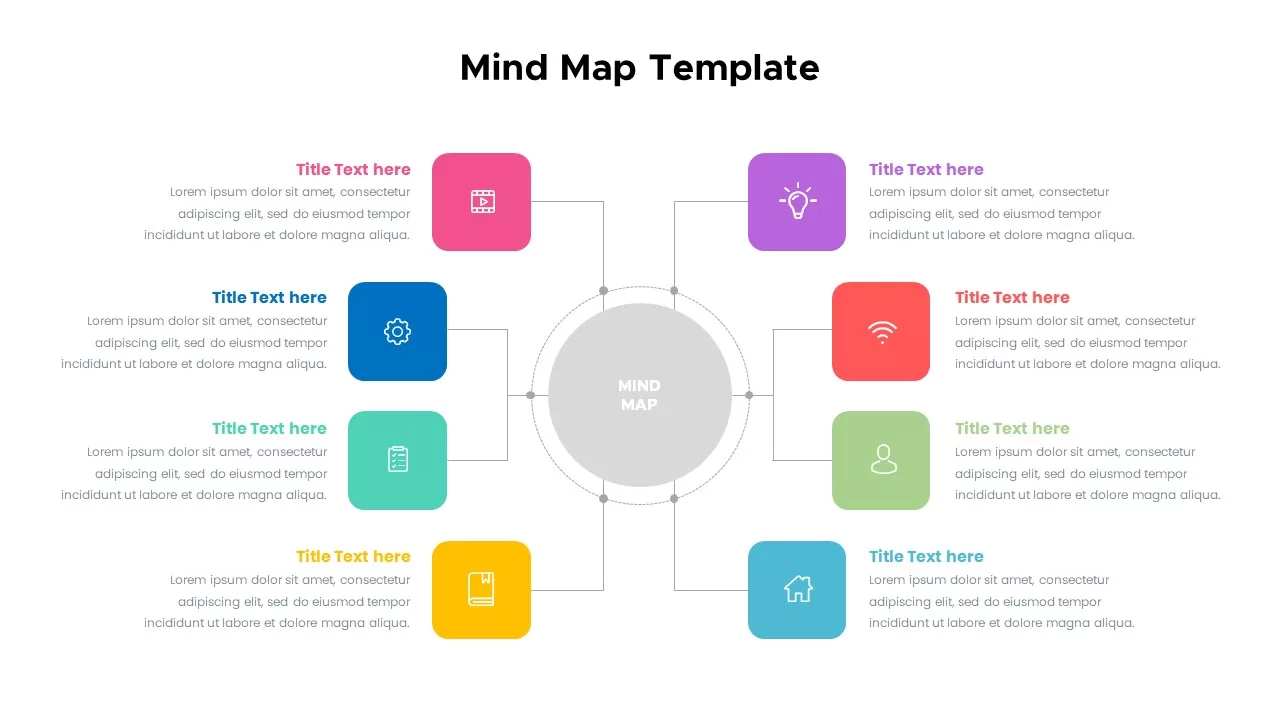
Colorful Mind Map Infographic Template with Icons for PowerPoint & Google Slides
Mind Maps
Colorful Venn Diagram Infographics Template for PowerPoint & Google Slides
Circular
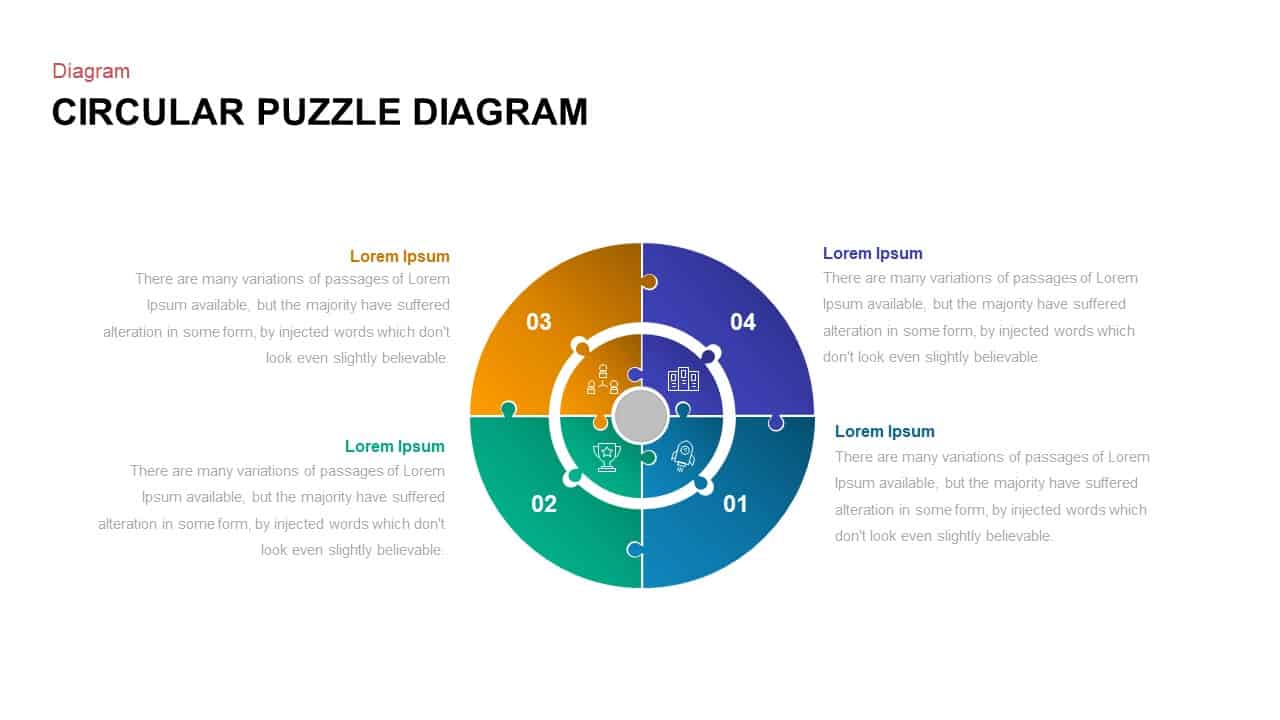
Colorful Circular Puzzle Diagram Template for PowerPoint & Google Slides
Circular
Colorful 5-Step Circular Process Template for PowerPoint & Google Slides
Process
Colorful Curved Roadmap Phases Template for PowerPoint & Google Slides
Roadmap
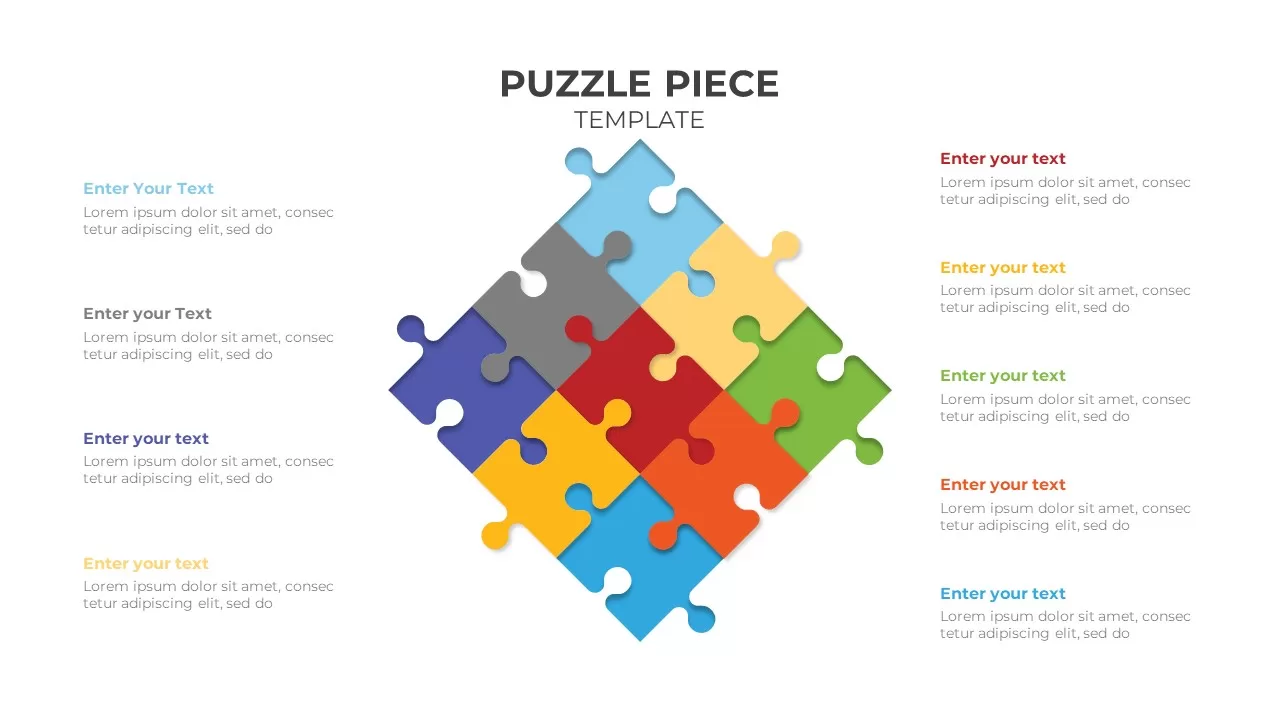
Colorful Eight-Piece Puzzle Diagram Template for PowerPoint & Google Slides
Process
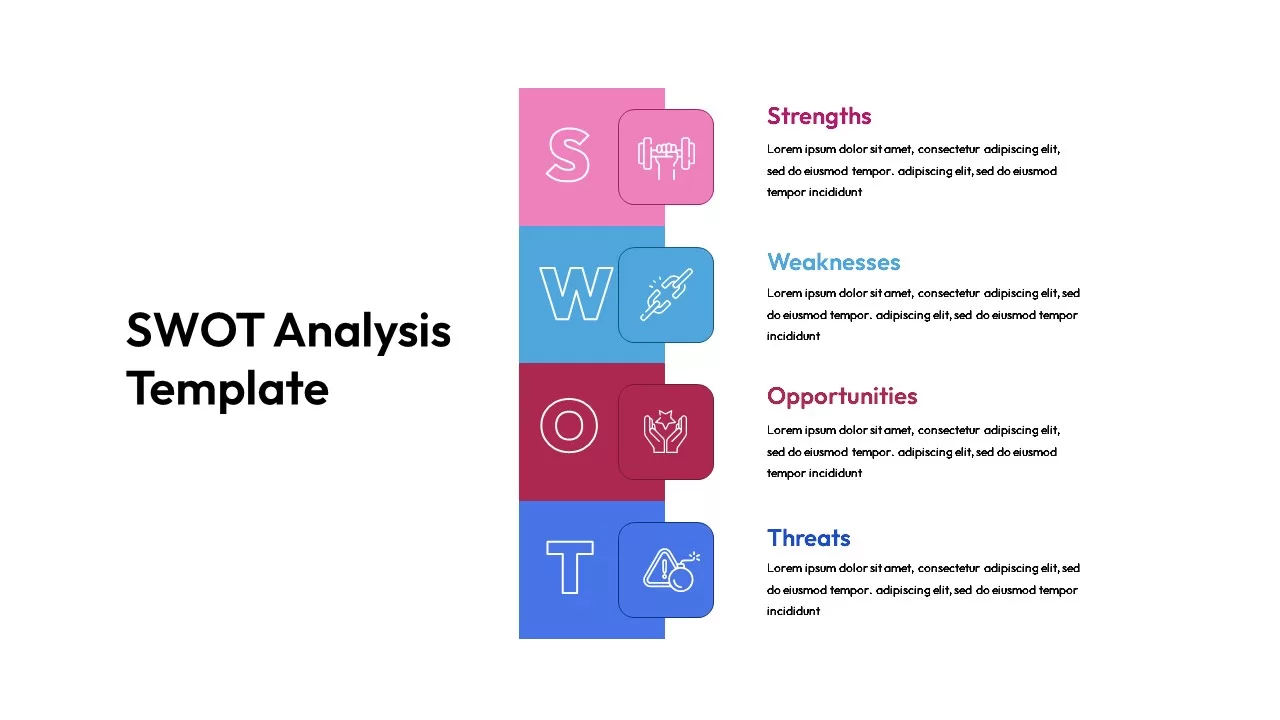
Modern Colorful SWOT Quadrant Analysis Template for PowerPoint & Google Slides
SWOT
Colorful Five-Step Roadmap Diagram Template for PowerPoint & Google Slides
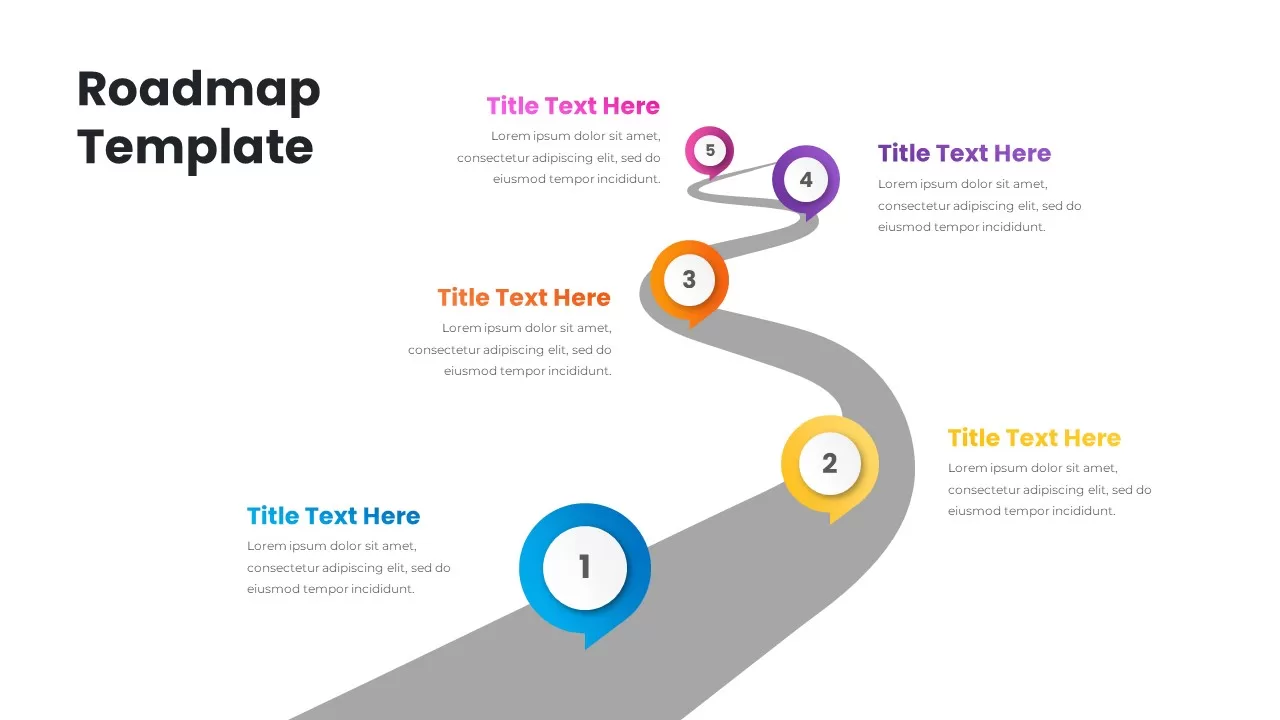
Roadmap
Colorful Nine-Piece Puzzle Diagram Template for PowerPoint & Google Slides
Process
Colorful SWOT Analysis Quadrant Template for PowerPoint & Google Slides
SWOT
Colorful Vertical SWOT Analysis Layout Template for PowerPoint & Google Slides
SWOT
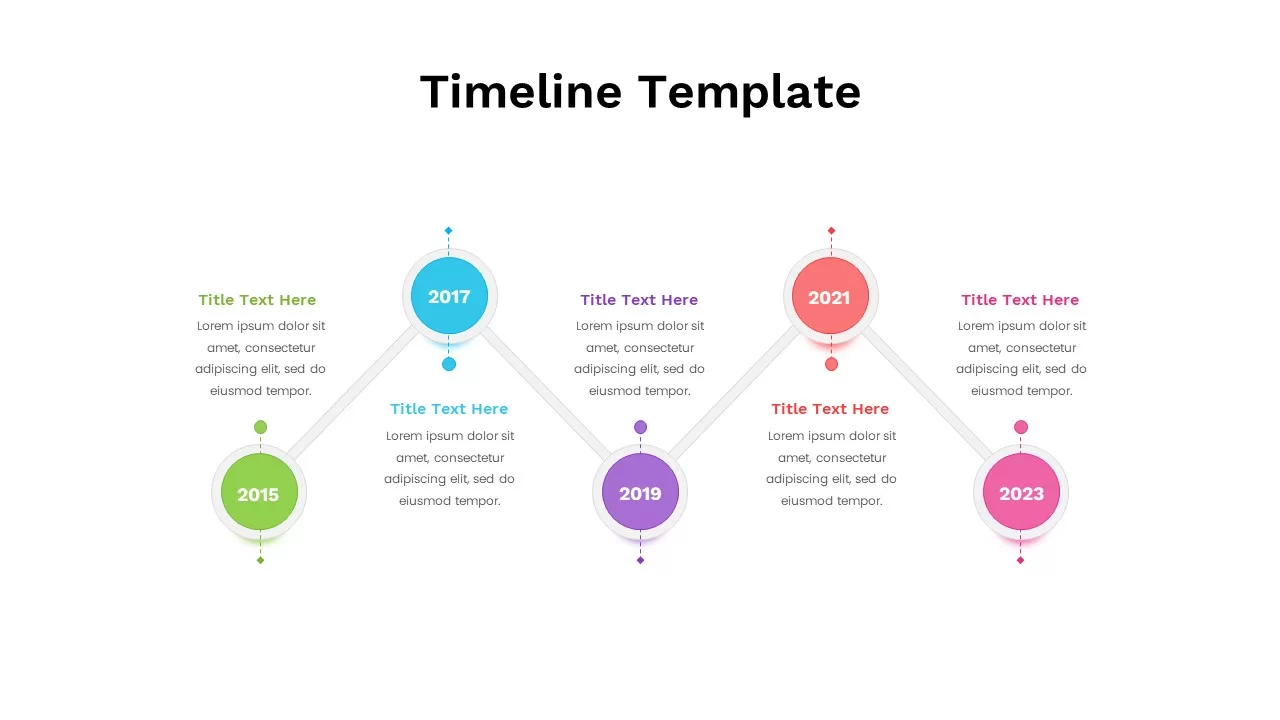
Colorful Five-Year Timeline Layout Template for PowerPoint & Google Slides
Timeline
Free Colorful Process Flow Infographics Template for PowerPoint & Google Slides
Process
Free
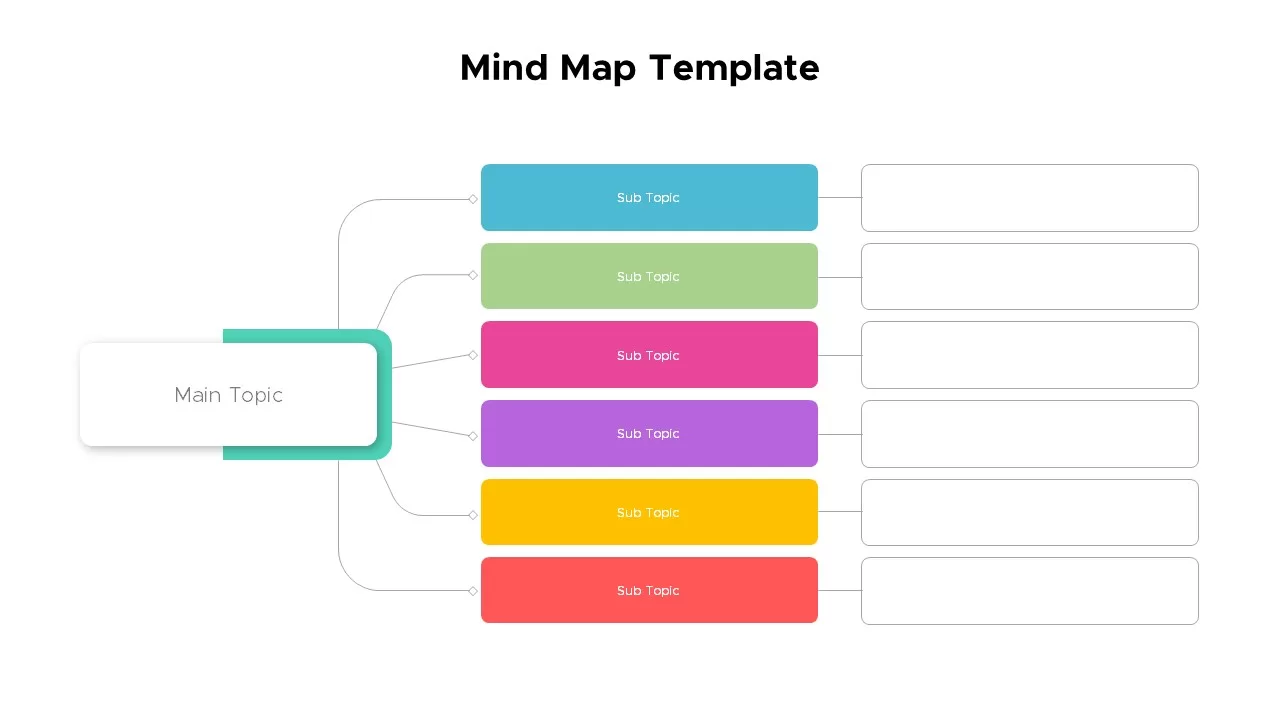
Colorful Mind Map Template for PowerPoint & Google Slides
Mind Maps
Colorful Mind Map with Icons Template for PowerPoint & Google Slides
Mind Maps
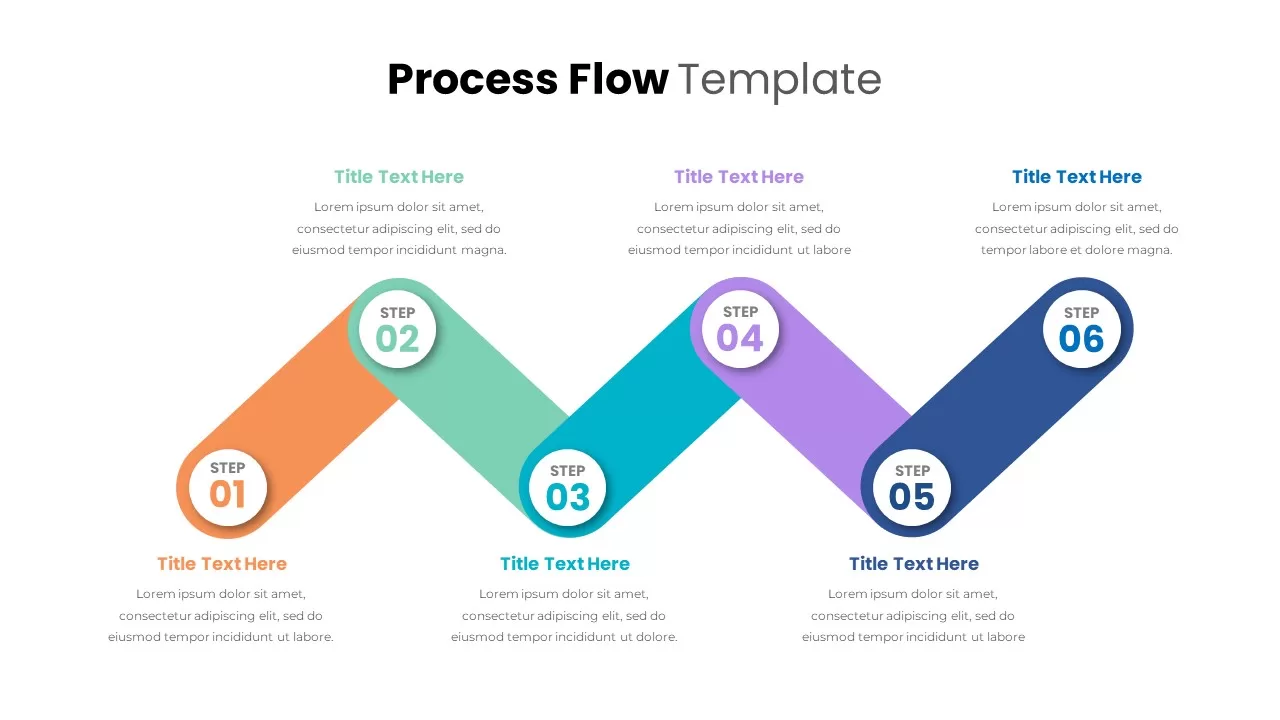
Colorful Process Flow Template for PowerPoint & Google Slides
Process
Colorful Mind Map Template for PowerPoint & Google Slides
Mind Maps
Colorful Process Flow Infographics Template for PowerPoint & Google Slides
Process
Colorful Block Infographic Metrics Slide Template for PowerPoint & Google Slides
Infographics
Colorful Nursing Presentation Deck Template for PowerPoint & Google Slides
Nursing
Colorful Project Status Dashboard Template for PowerPoint & Google Slides
Project Status
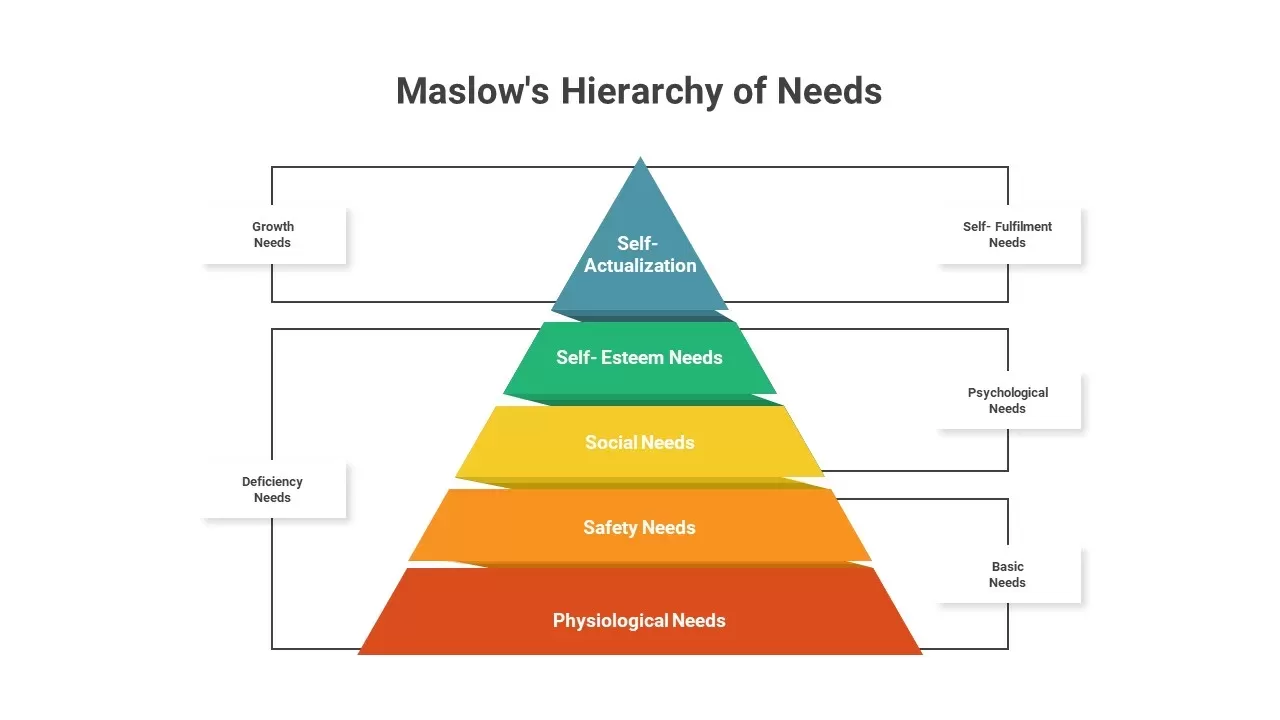
Maslow’s Colorful Pyramid of Needs Template for PowerPoint & Google Slides
Pyramid
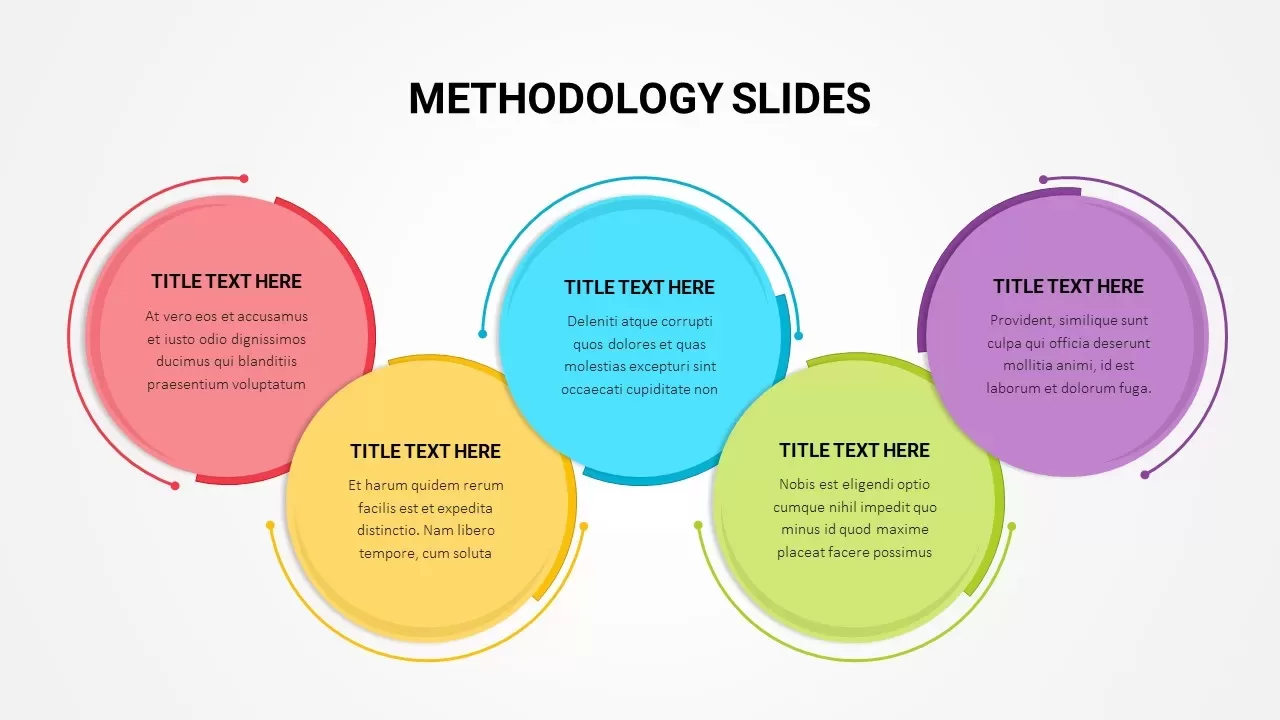
Colorful Five-Stage Methodology Diagram Template for PowerPoint & Google Slides
Process
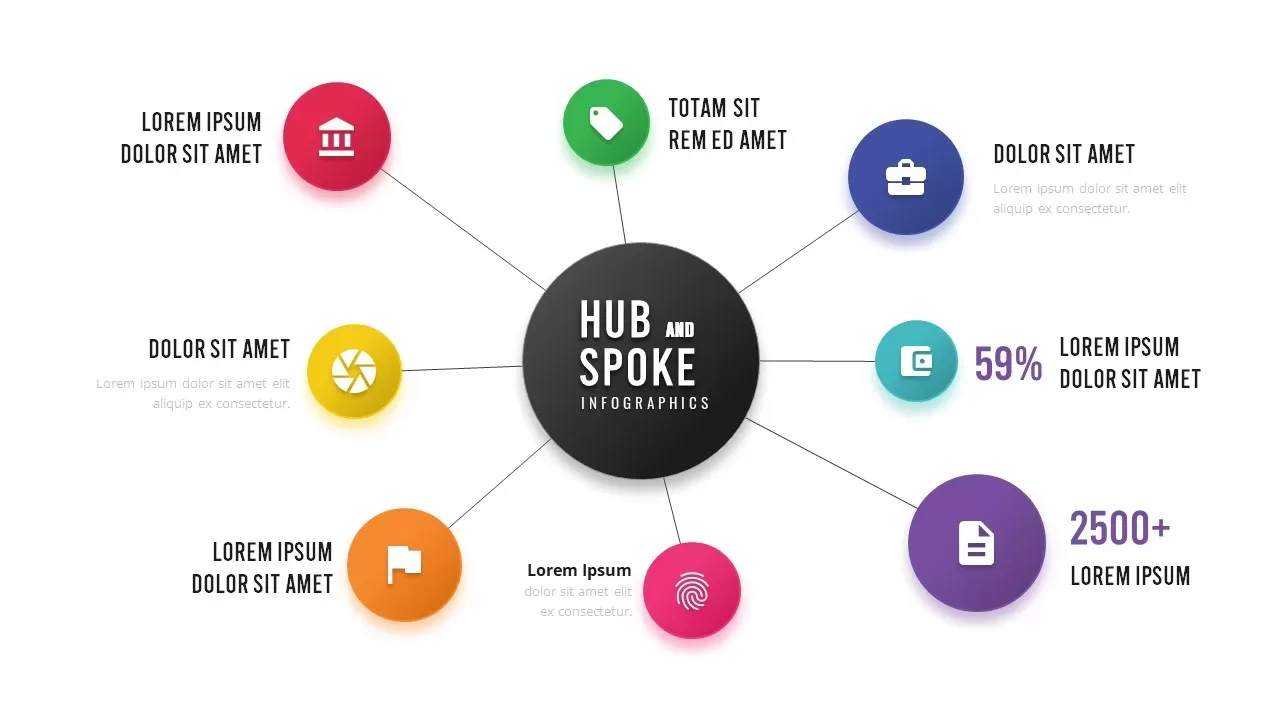
Colorful Hub-and-Spoke Infographic Template for PowerPoint & Google Slides
Circular
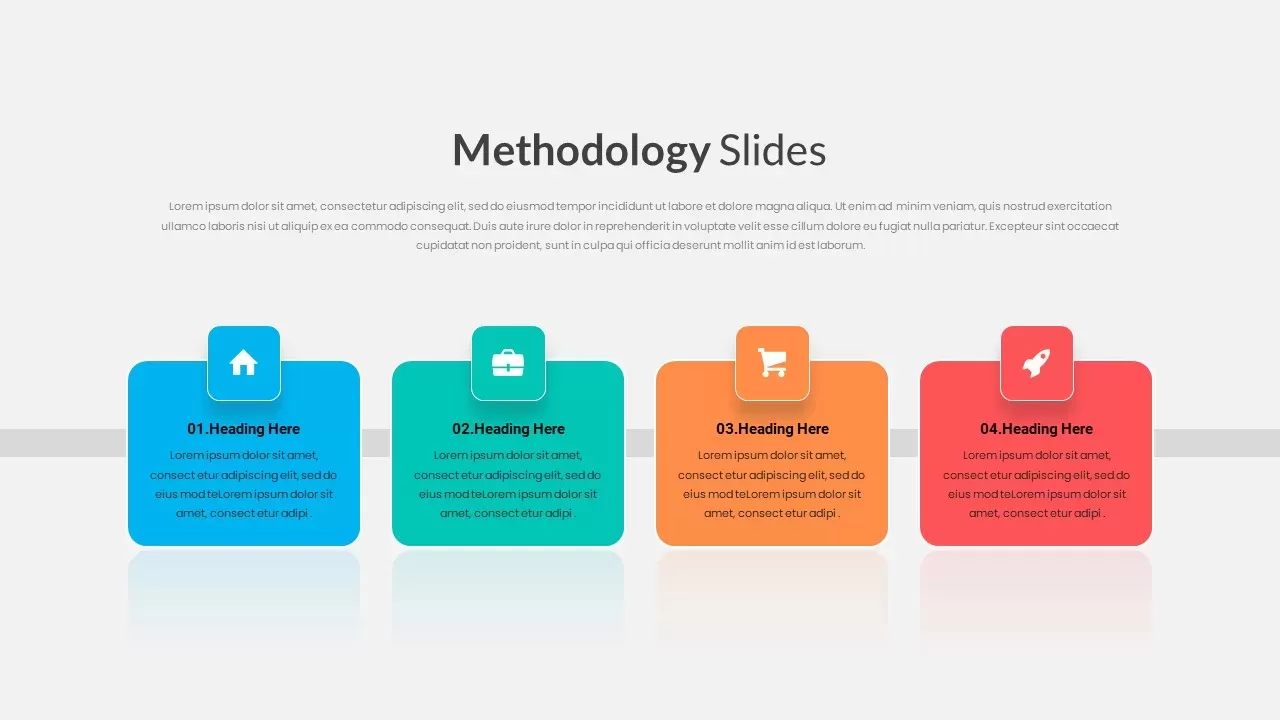
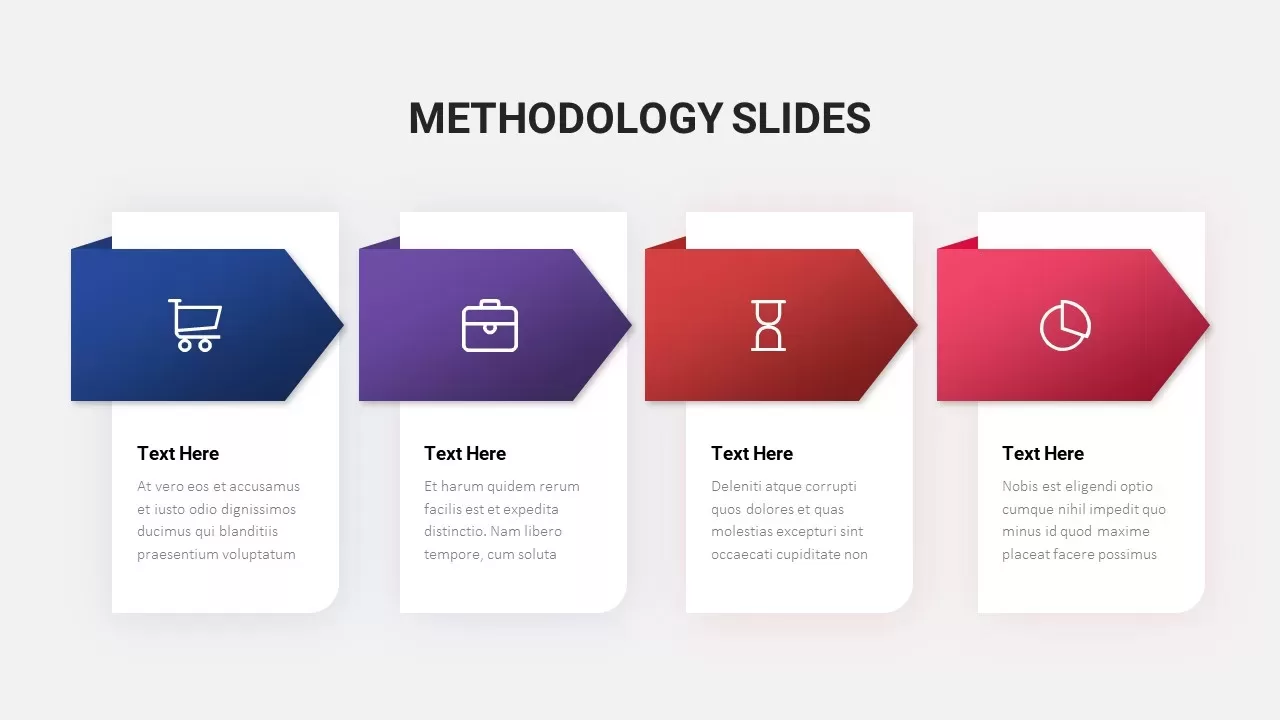
4 Step Vibrant Colorful Methodology Template for PowerPoint & Google Slides
Process
Colorful Arrow Methodology Steps Template for PowerPoint & Google Slides
Process
Six-Step Colorful Flywheel Diagram Template for PowerPoint & Google Slides
Circular
Four-Level Colorful Pyramid Diagram Template for PowerPoint & Google Slides
Pyramid
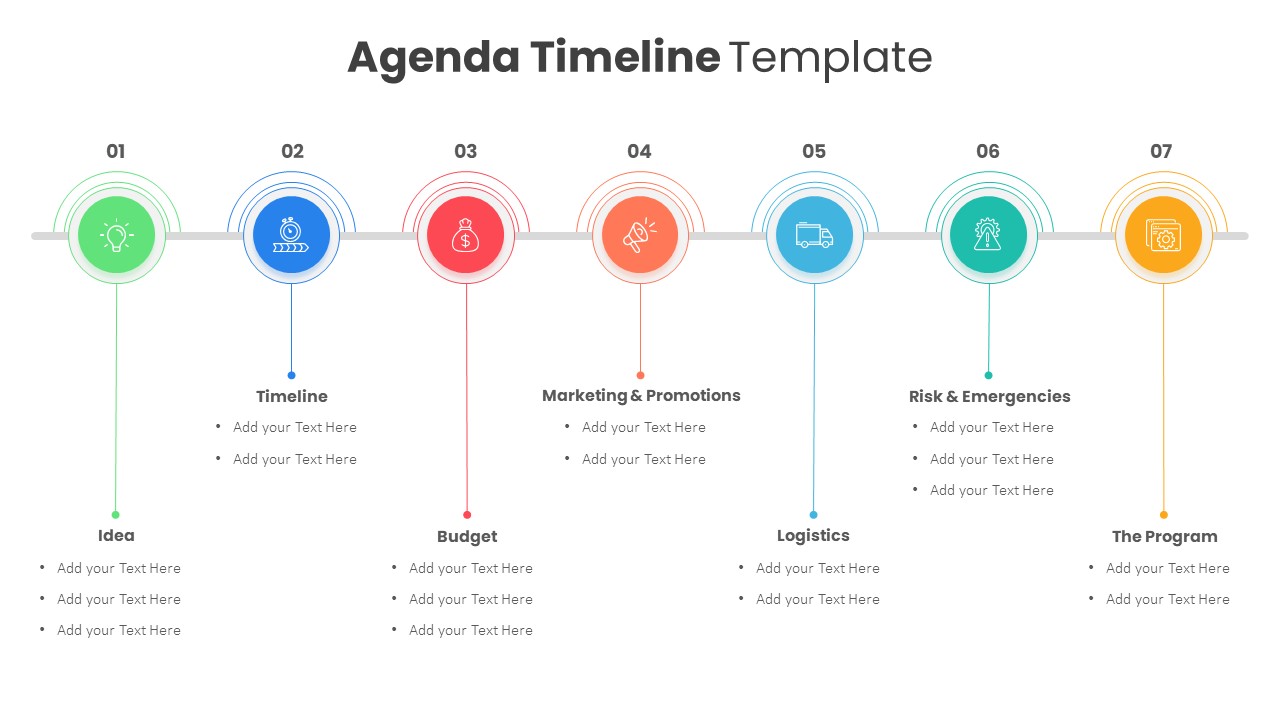
Colorful Agenda Timeline Infographic Template for PowerPoint & Google Slides
Agenda
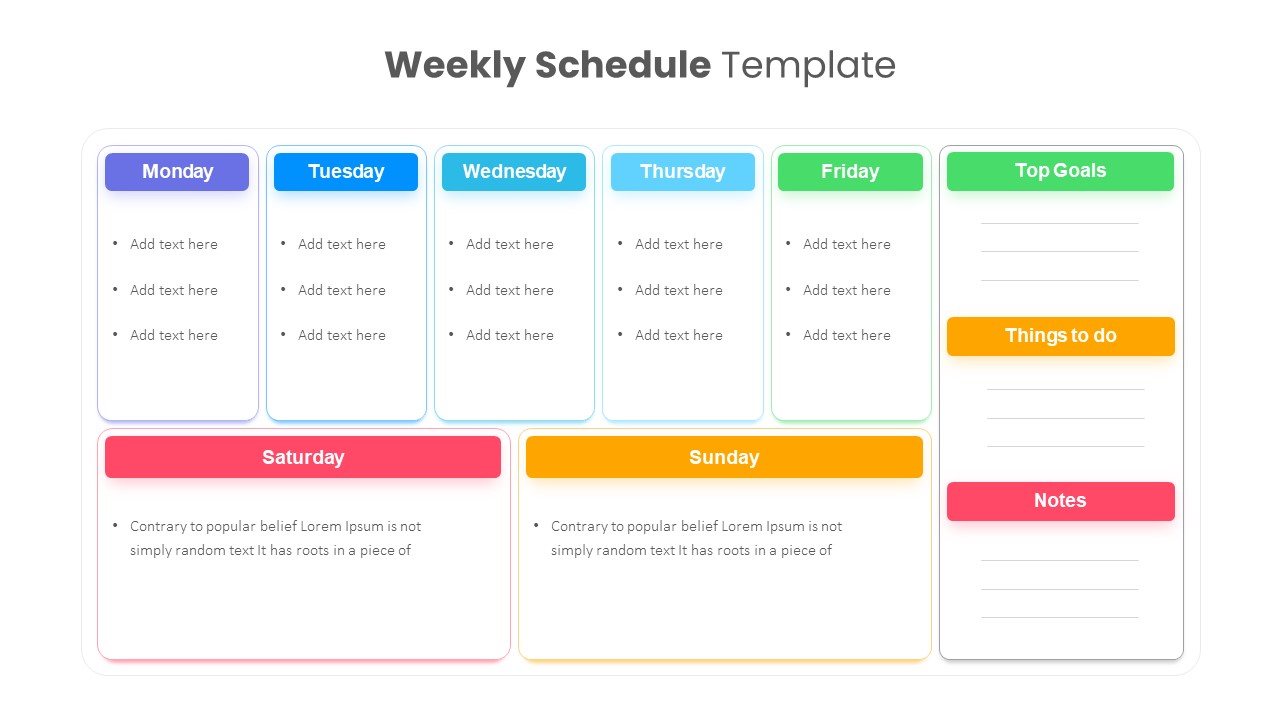
Colorful Weekly Schedule Slide Deck Template for PowerPoint & Google Slides
Agenda
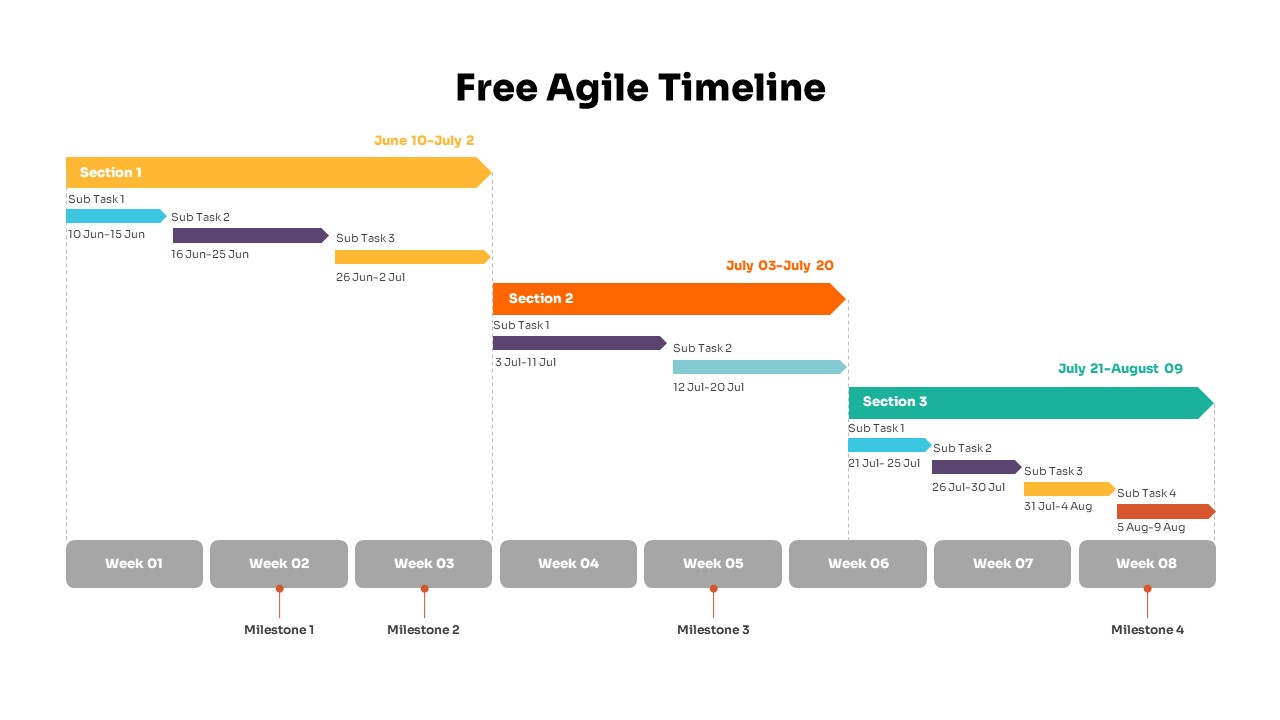
Colorful Agile Timeline Infographic Template for PowerPoint & Google Slides
Timeline
Free
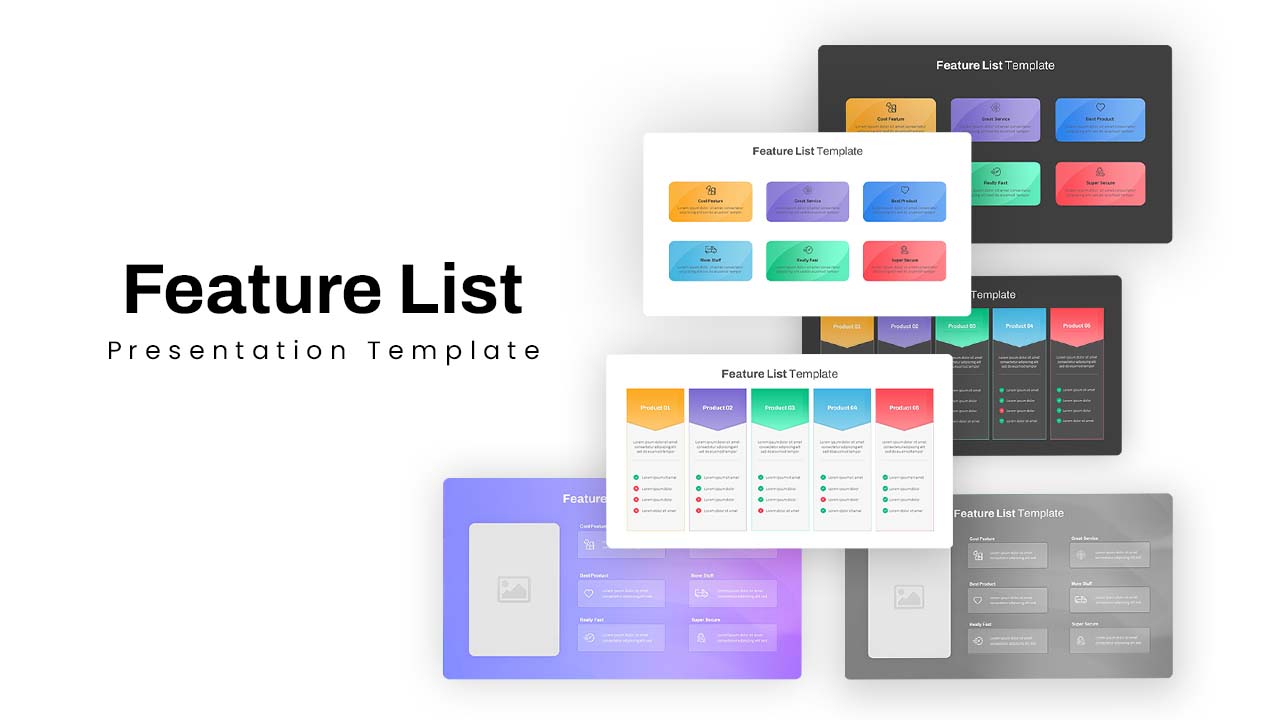
Colorful Feature List Presentation Template for PowerPoint & Google Slides
Decks
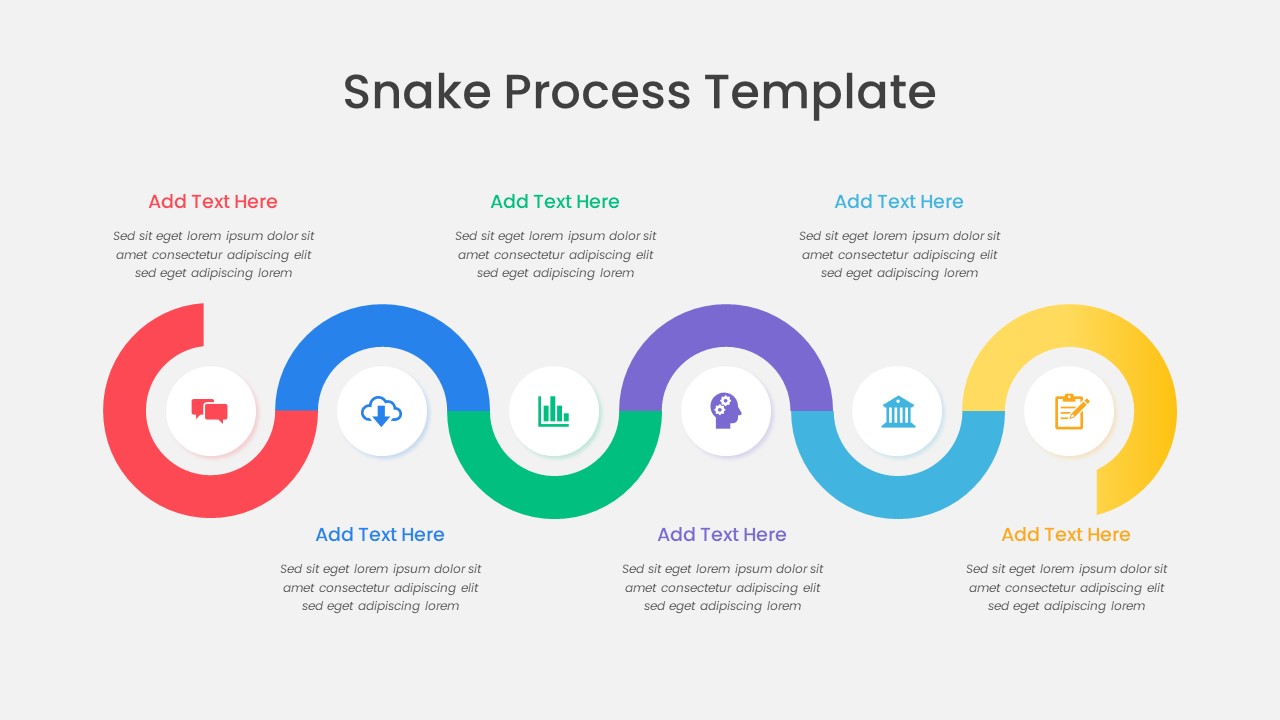
Colorful Snake Process Diagram Template for PowerPoint & Google Slides
Process
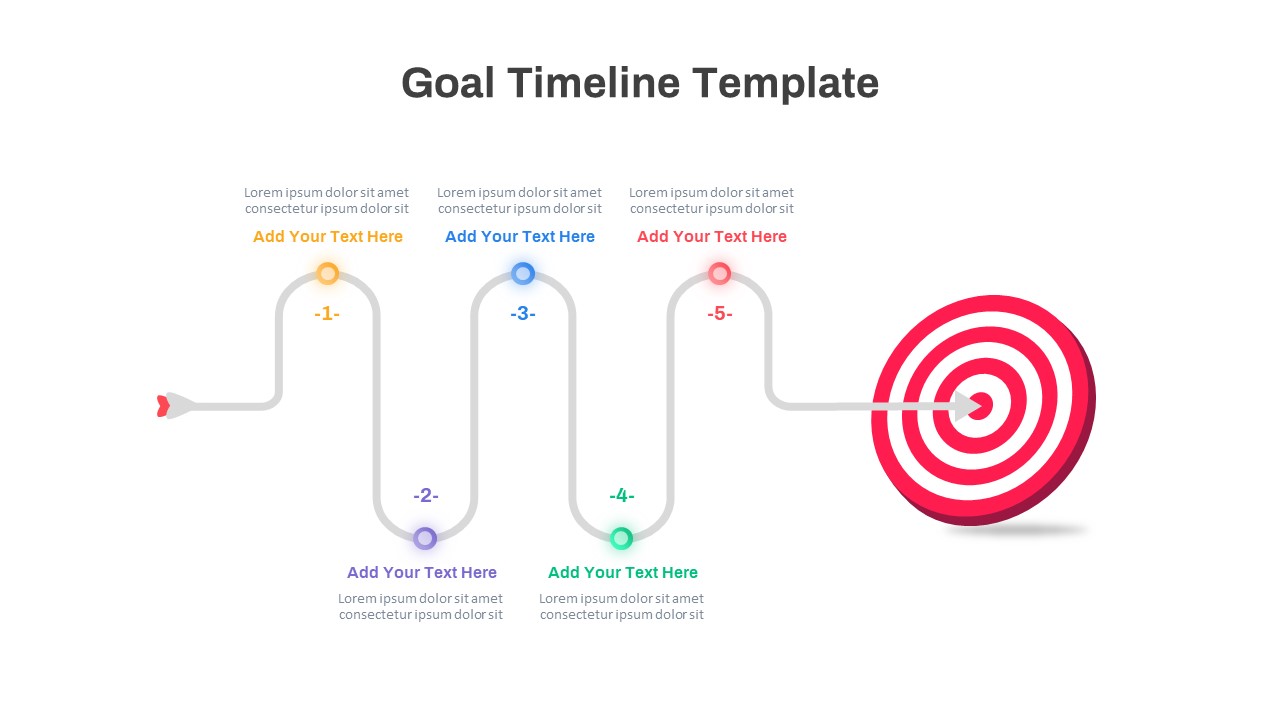
Colorful Five-Step Goal Timeline Template for PowerPoint & Google Slides
Timeline
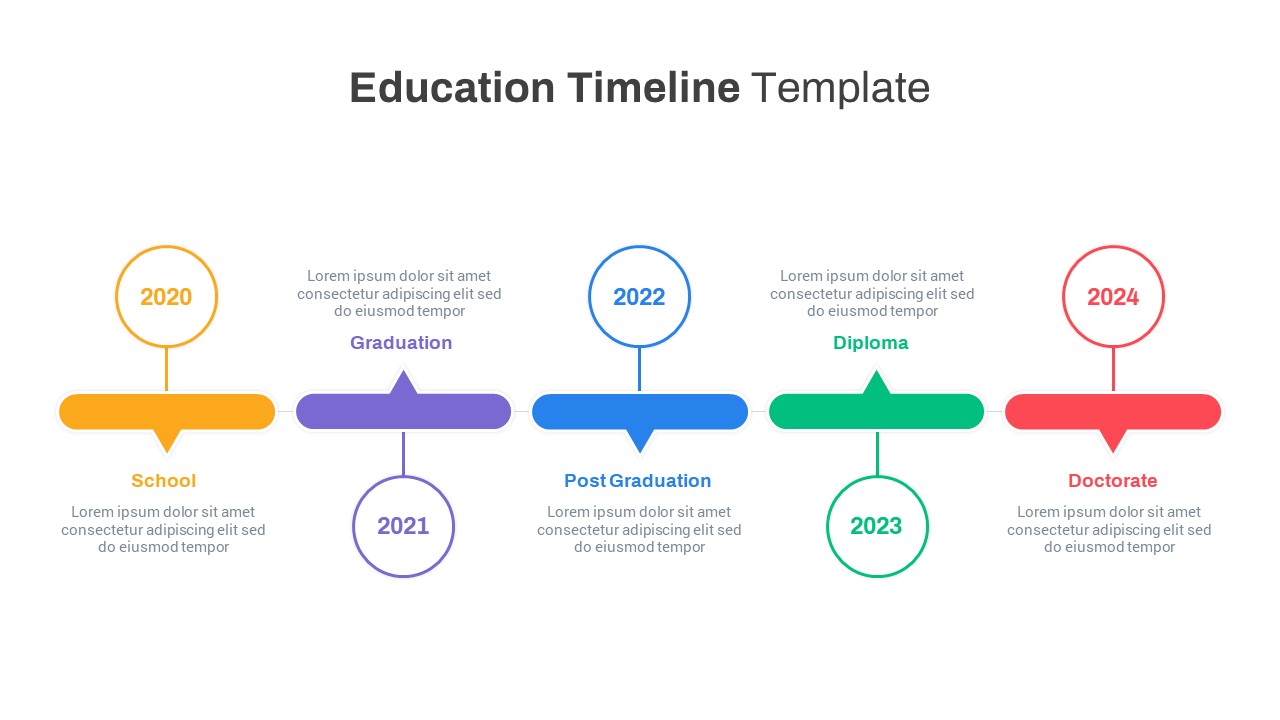
Colorful Five-Stage Education Timeline Template for PowerPoint & Google Slides
Timeline
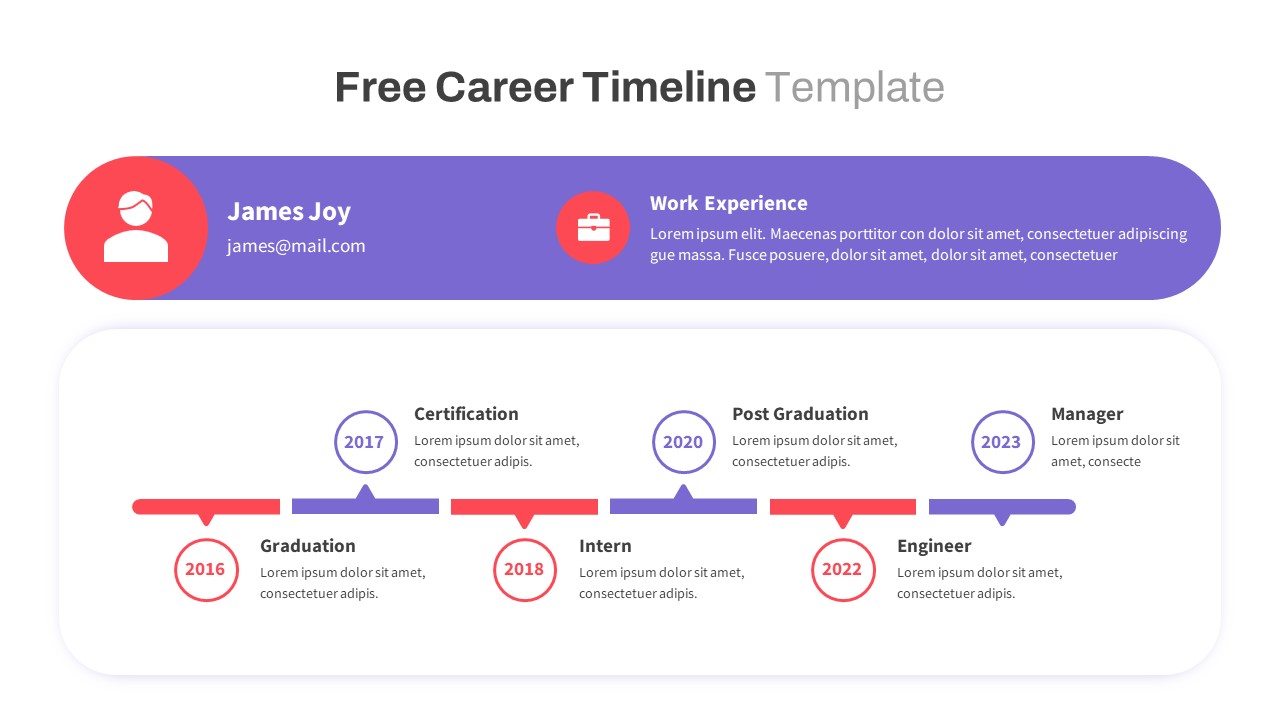
Free Colorful Career Timeline Resume Slide Template for PowerPoint & Google Slides
Timeline
Free
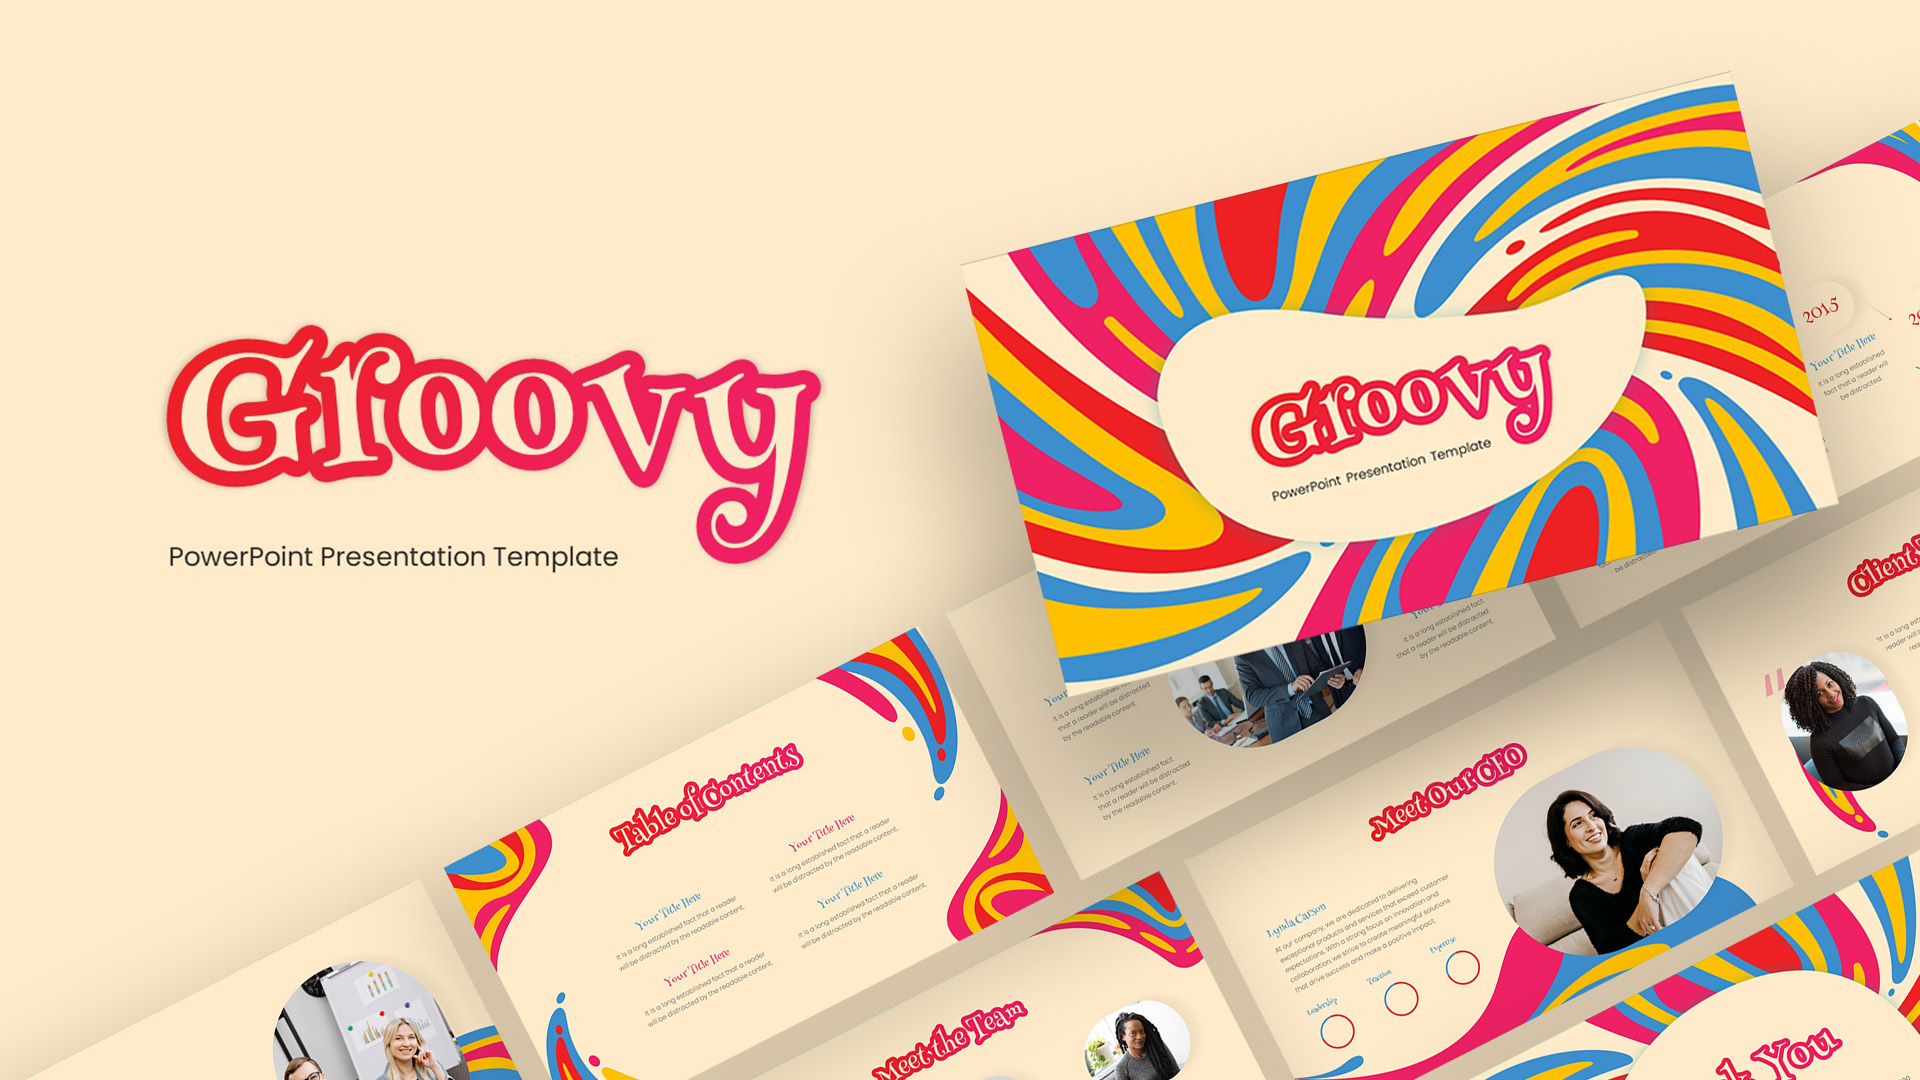
Groovy Retro Colorful Presentation Template for PowerPoint & Google Slides
Company Profile
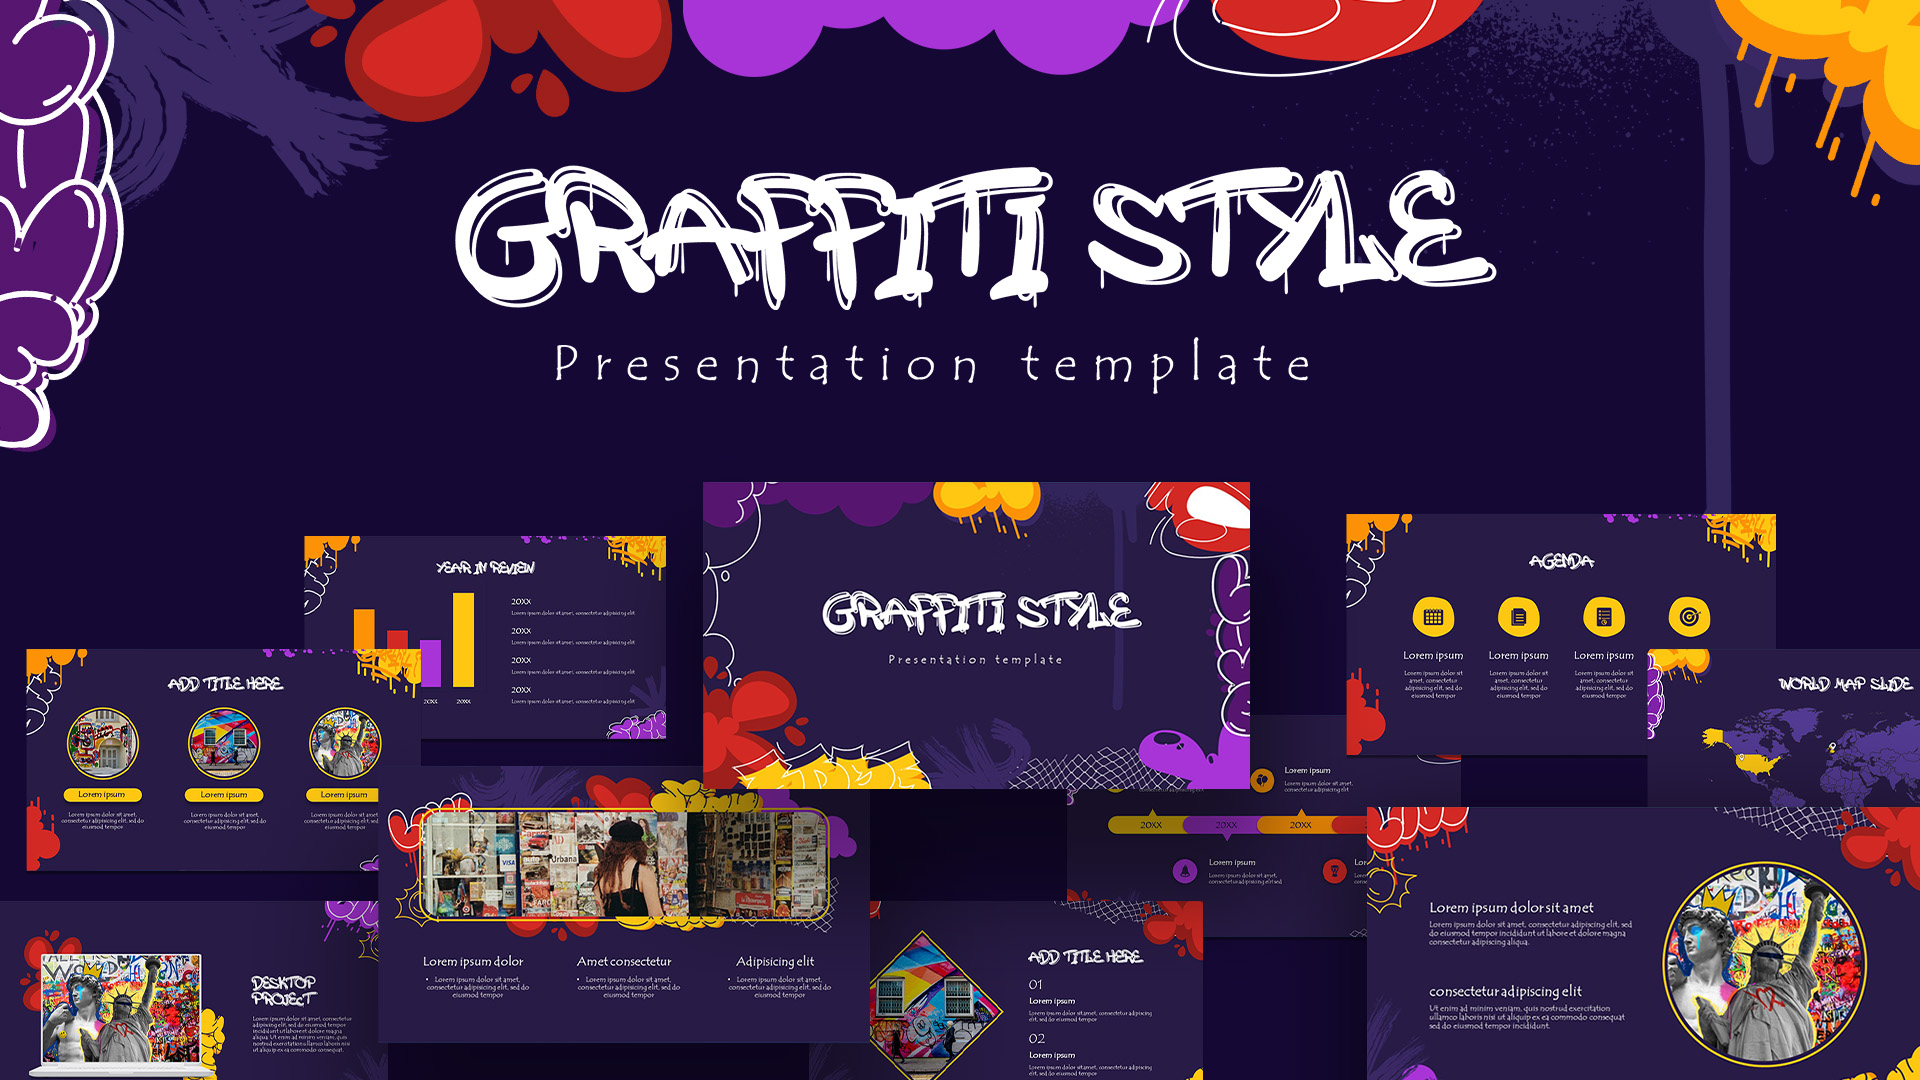
Free Graffiti Style Colorful Presentation Template for PowerPoint & Google Slides
Pitch Deck
Free
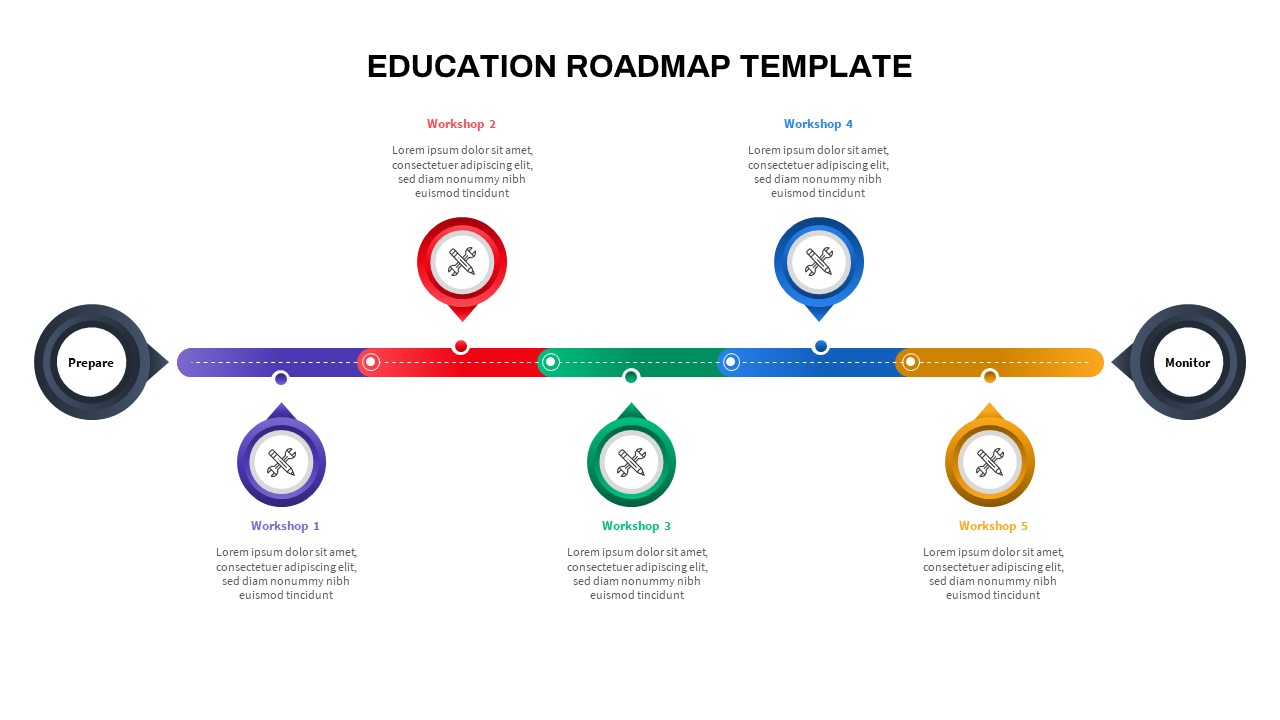
Colorful Education Roadmap Workshop Timeline Template for PowerPoint & Google Slides
Roadmap
Free Modern Colorful Business Plan Deck Template for PowerPoint & Google Slides
Business Plan
Free
Free Colorful Animal 2024 Calendar Slide Pack Template for PowerPoint & Google Slides
Infographics
Free

Free Colorful Infographic Slide Pack Template for PowerPoint & Google Slides
Roadmap
Free
Six Colorful Gear Shapes Infographic Template for PowerPoint & Google Slides
Process
Free
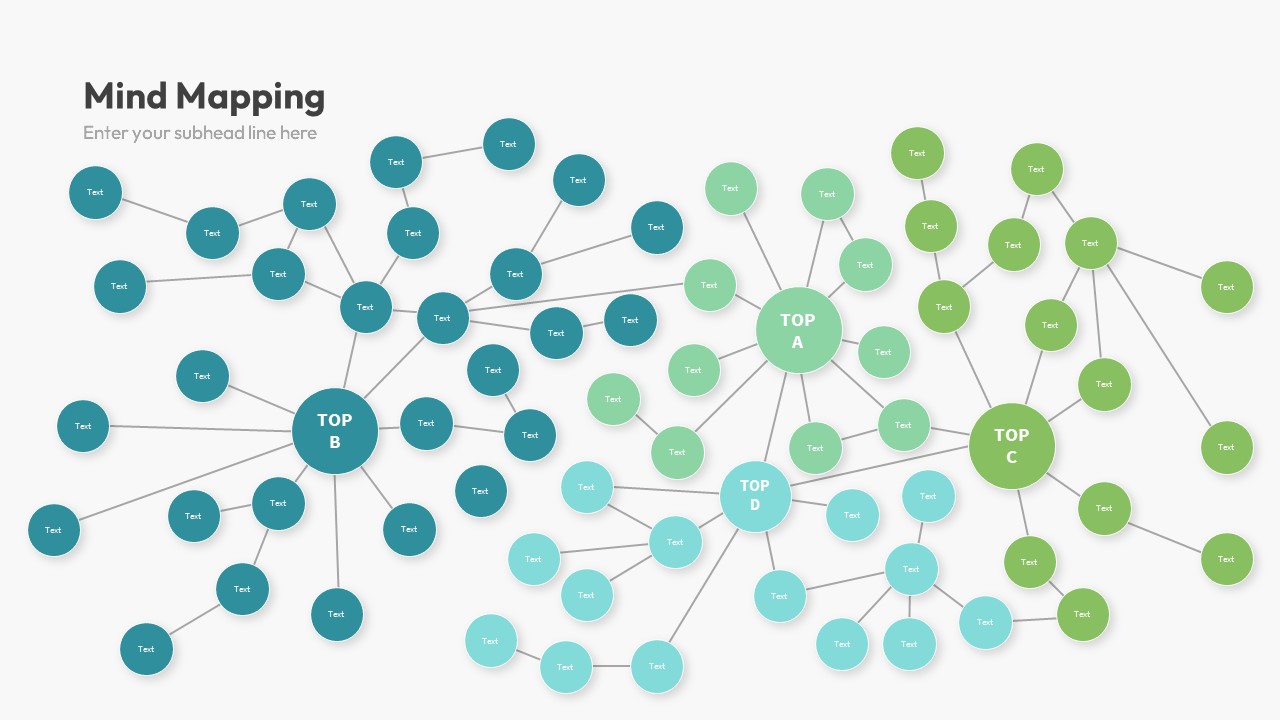
Colorful Multi-Branch Mind Map Slide Template for PowerPoint & Google Slides
Mind Maps
Colorful Creative Presentation Deck Template for PowerPoint & Google Slides
Company Profile
Colorful SWOT Analysis Diagram Template for PowerPoint & Google Slides
SWOT
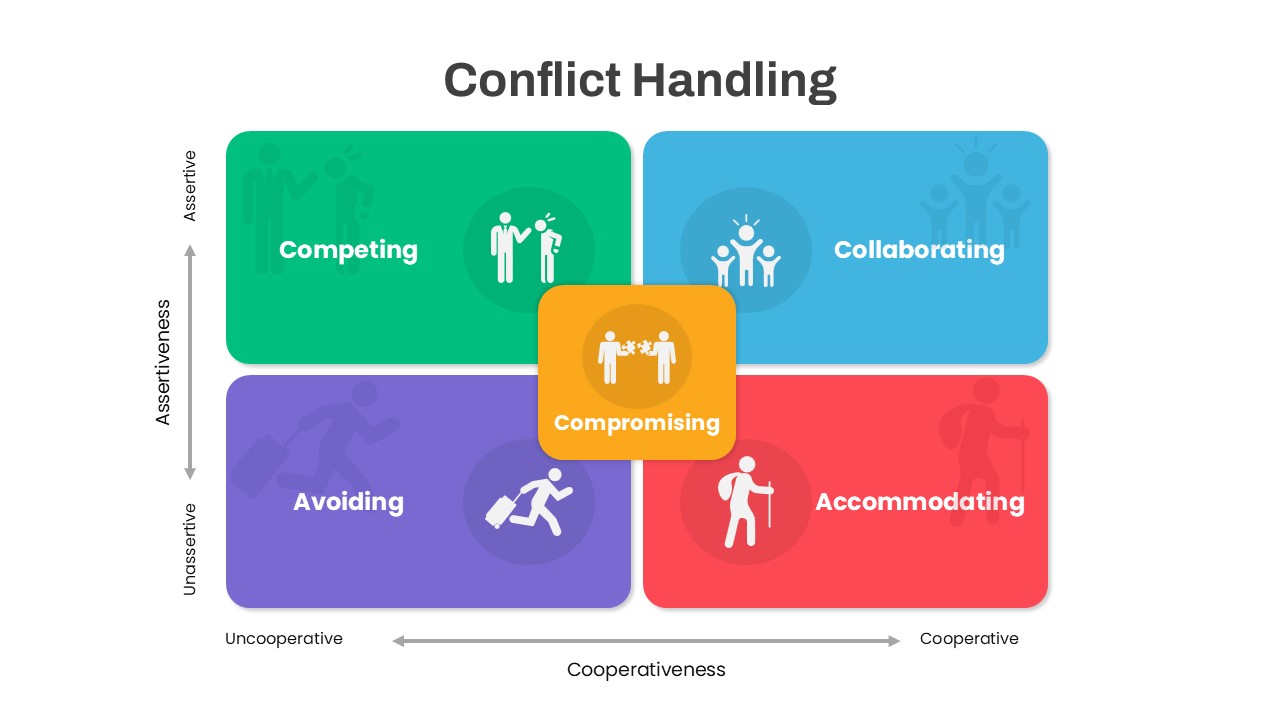
Colorful Conflict Handling Matrix Template for PowerPoint & Google Slides
Comparison
Colorful Startup Financing Cycle Diagram Template for PowerPoint & Google Slides
Finance
Colorful Five-Option Ribbon Infographic Template for PowerPoint & Google Slides
Process
Colorful SWOT Analysis Quadrant Template for PowerPoint & Google Slides
SWOT
Colorful Four-Column Table Layout Template for PowerPoint & Google Slides
Table
Colorful Business Data Comparison Table Template for PowerPoint & Google Slides
Table
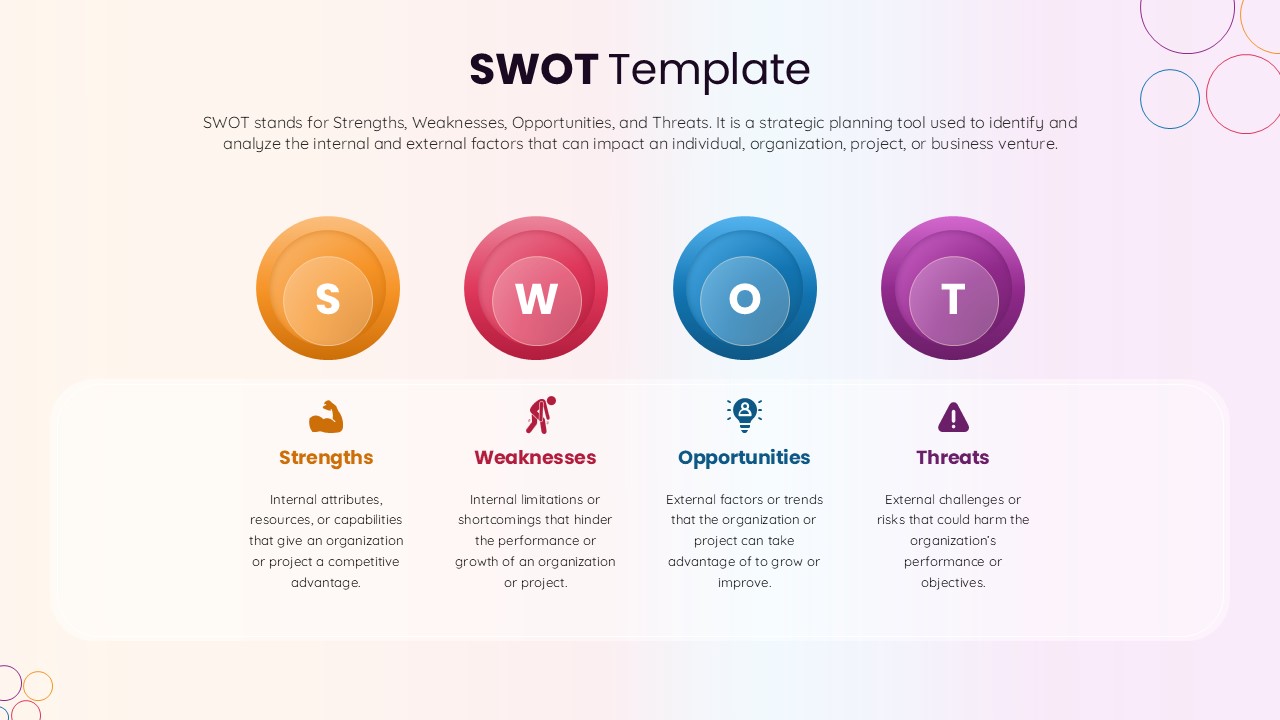
SWOT Template with Colorful Circles for PowerPoint & Google Slides
SWOT
Four-Level Colorful Pyramid Diagram Template for PowerPoint & Google Slides
Pyramid