Colorful Concentric Circles Infographic Slide for PowerPoint & Google Slides

Description
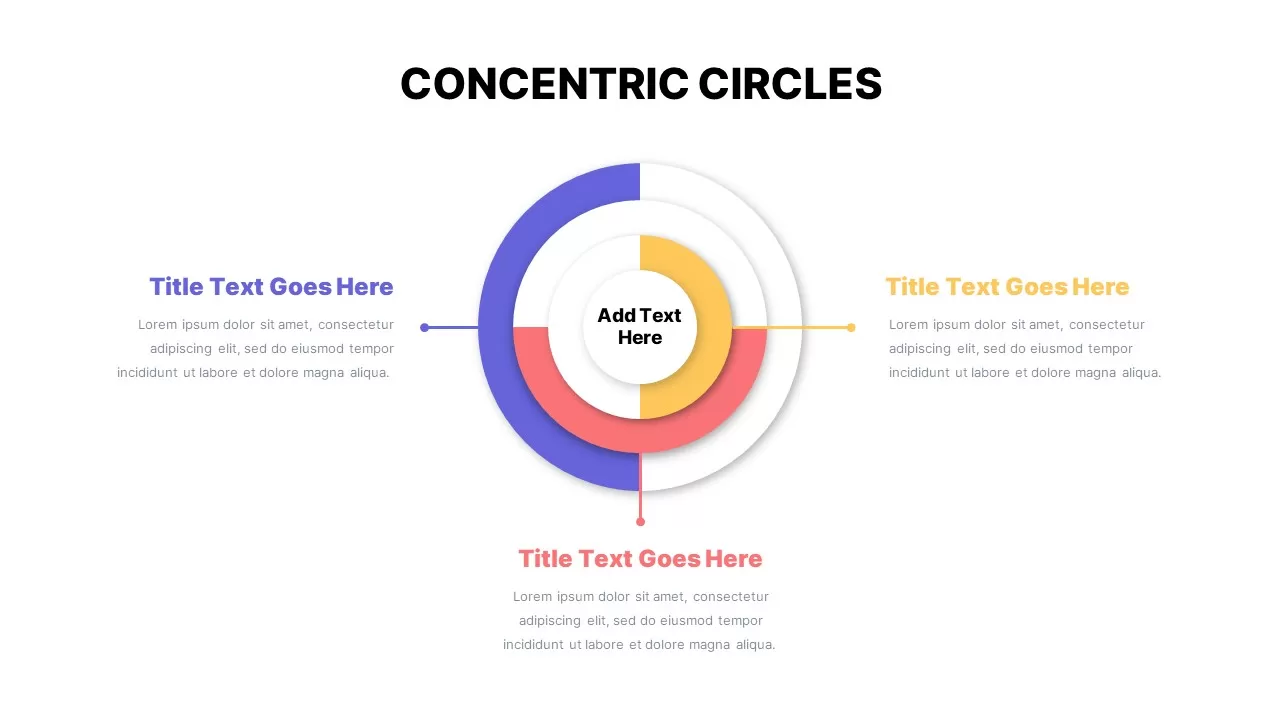
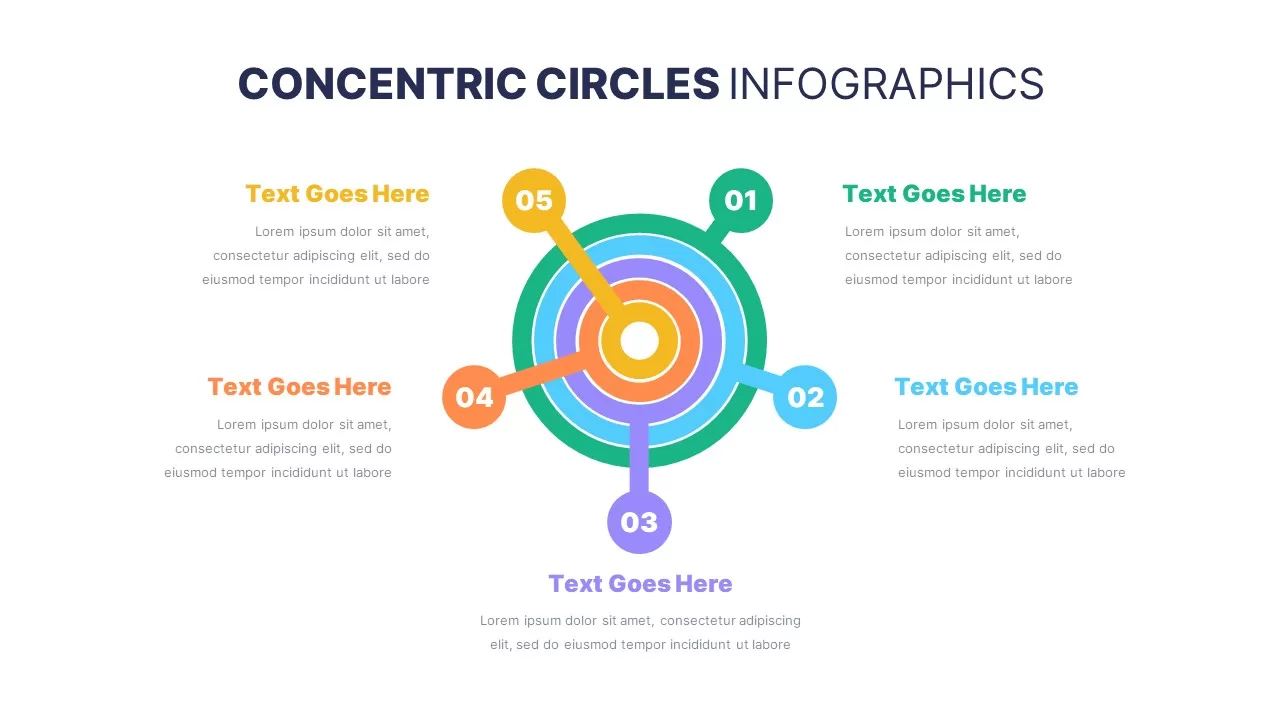
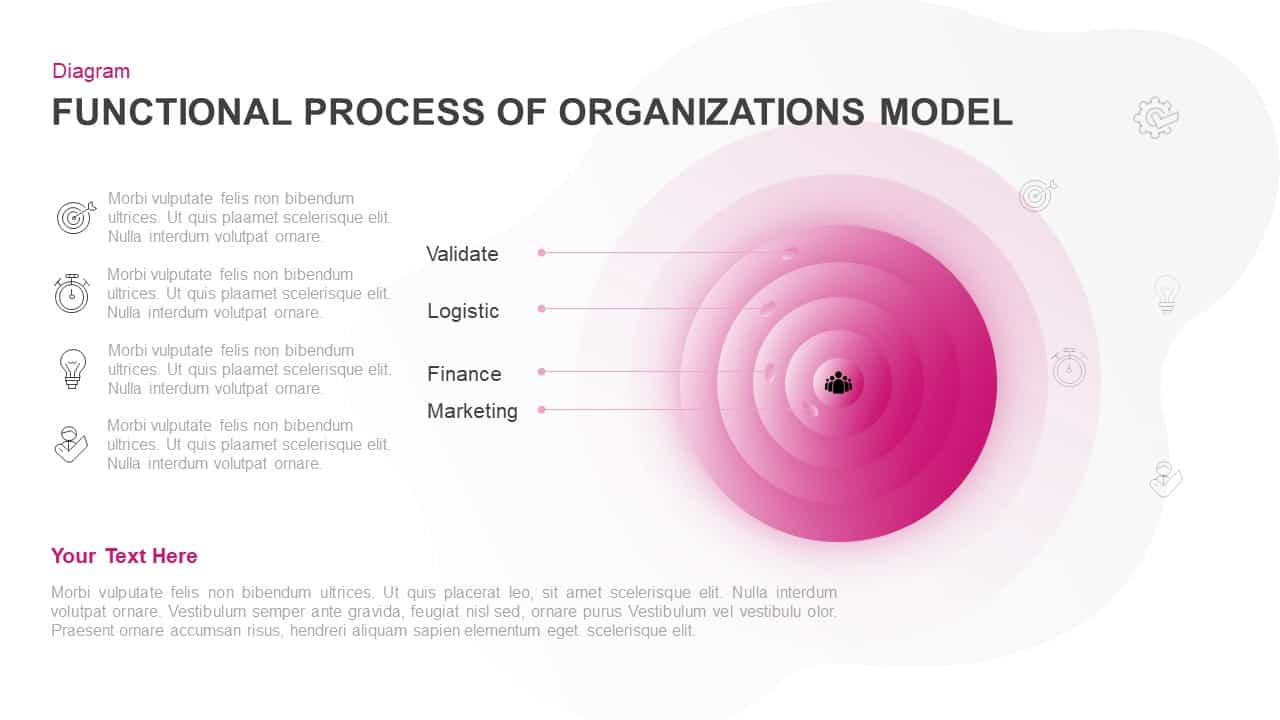
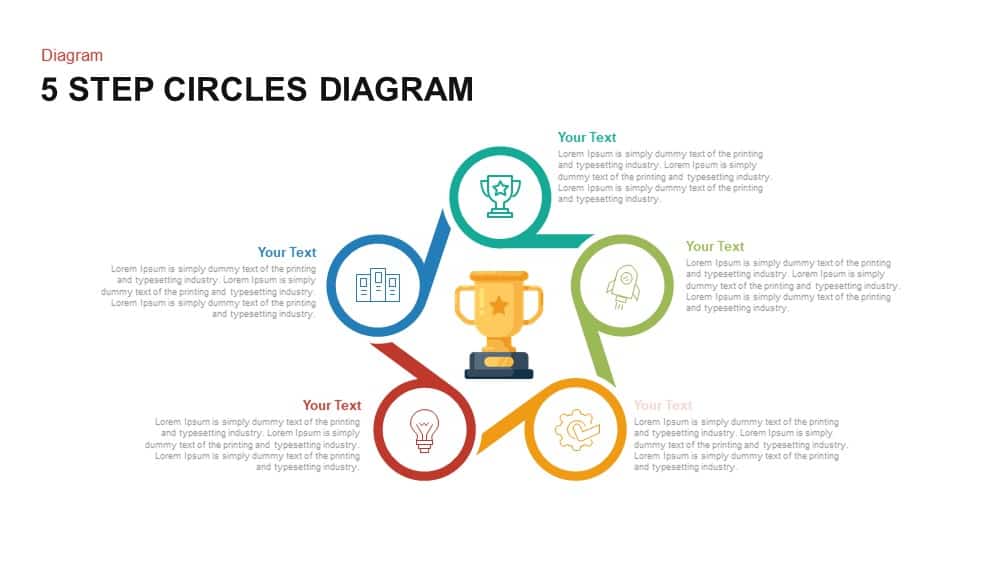
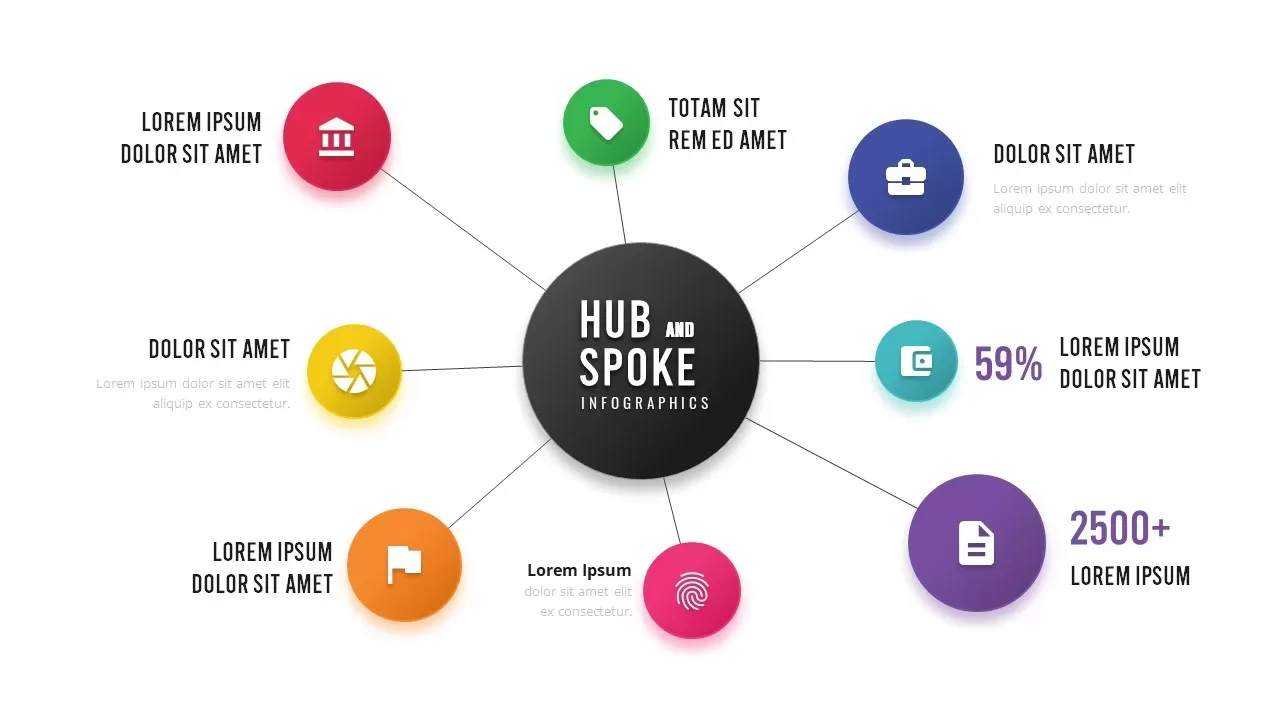
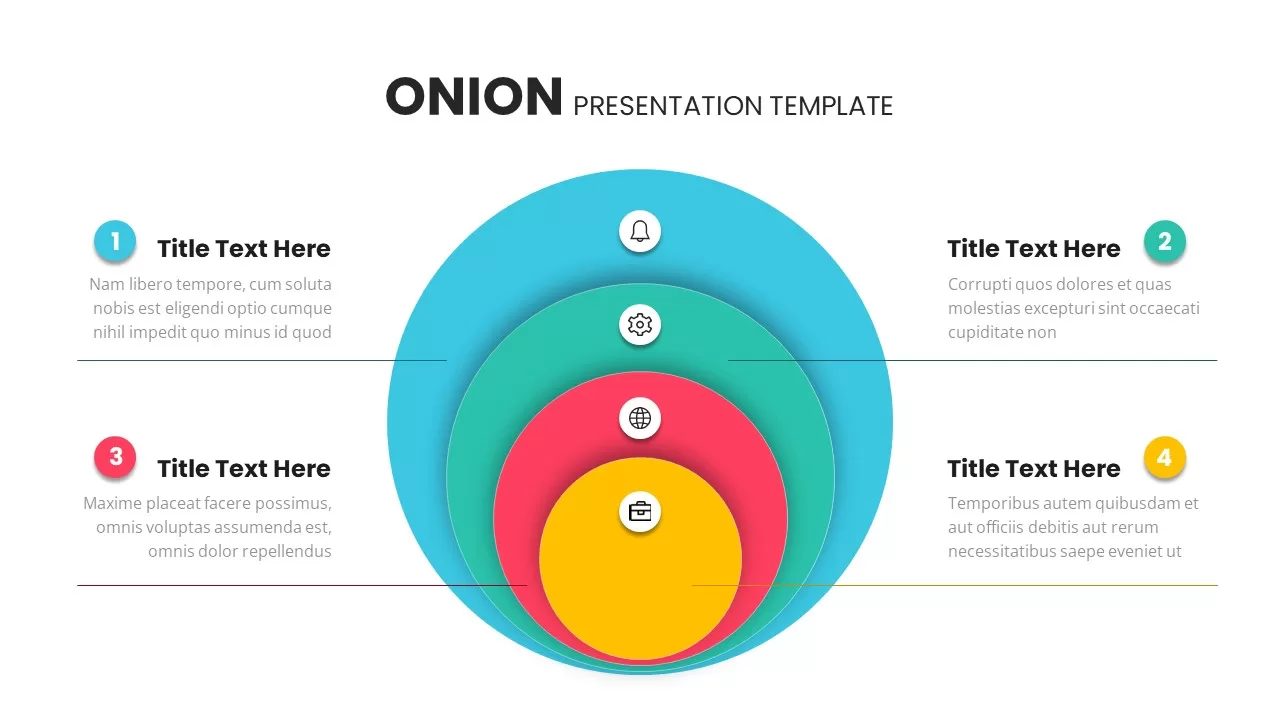
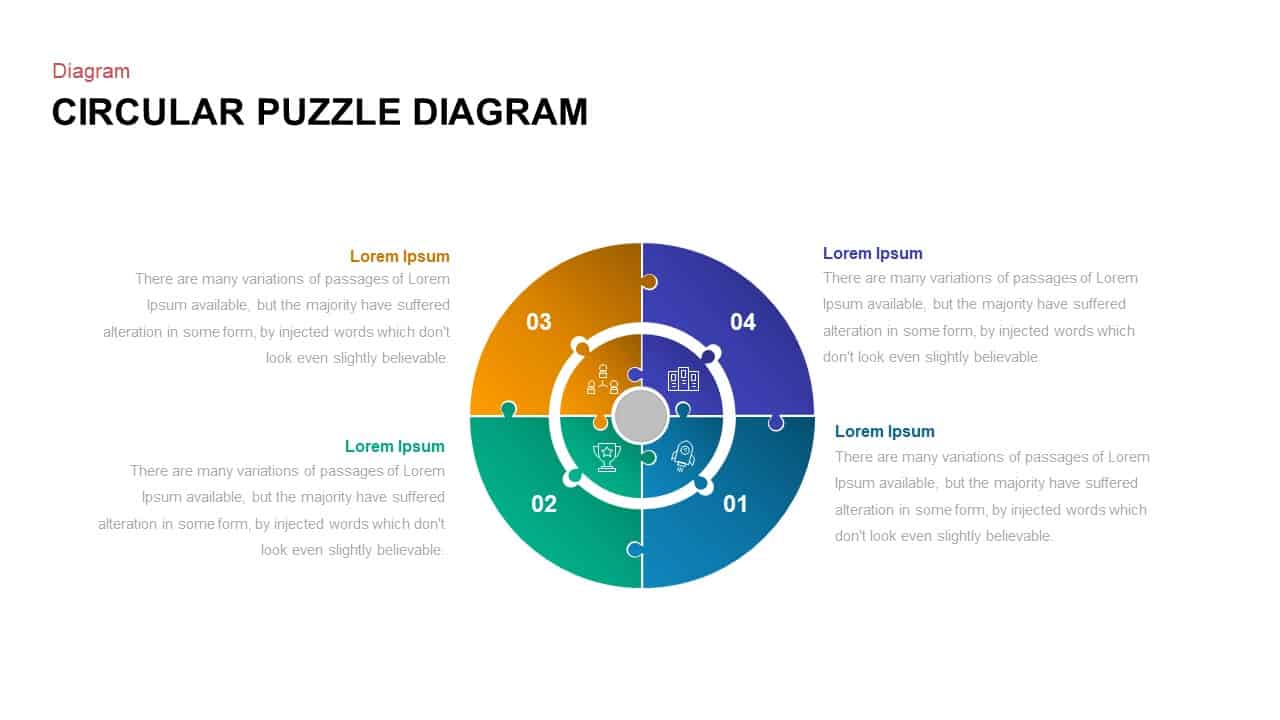
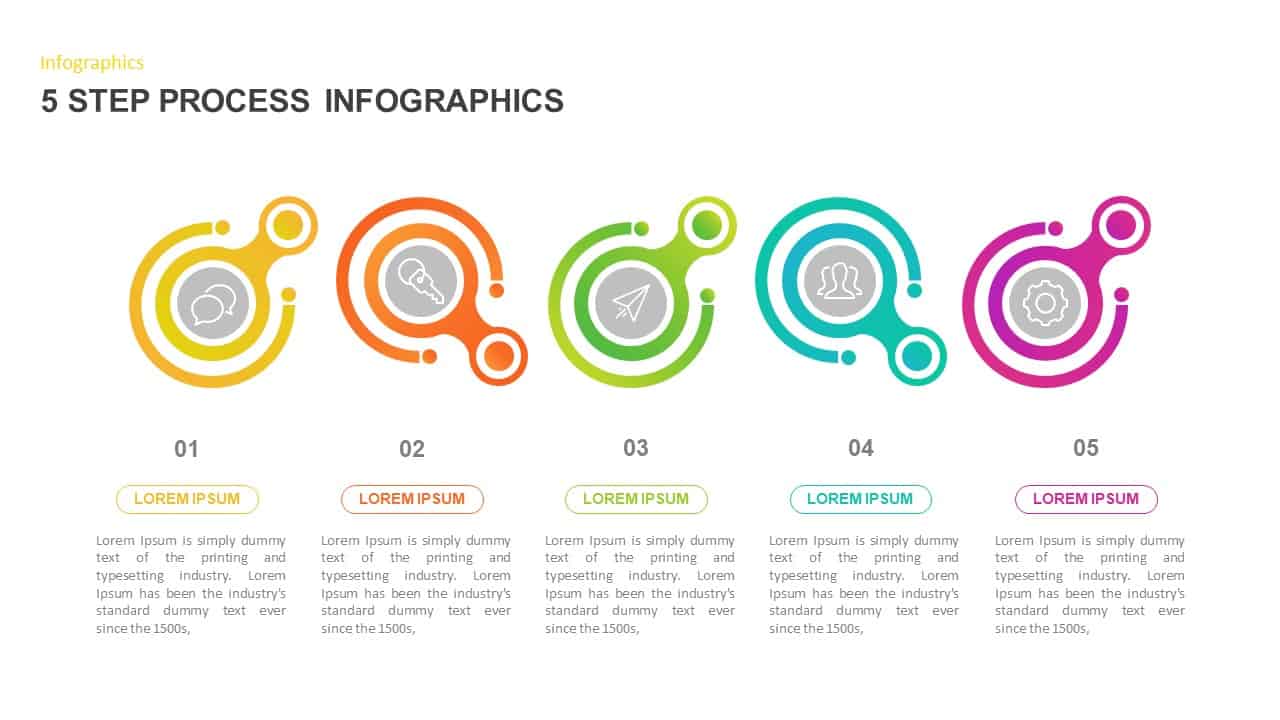
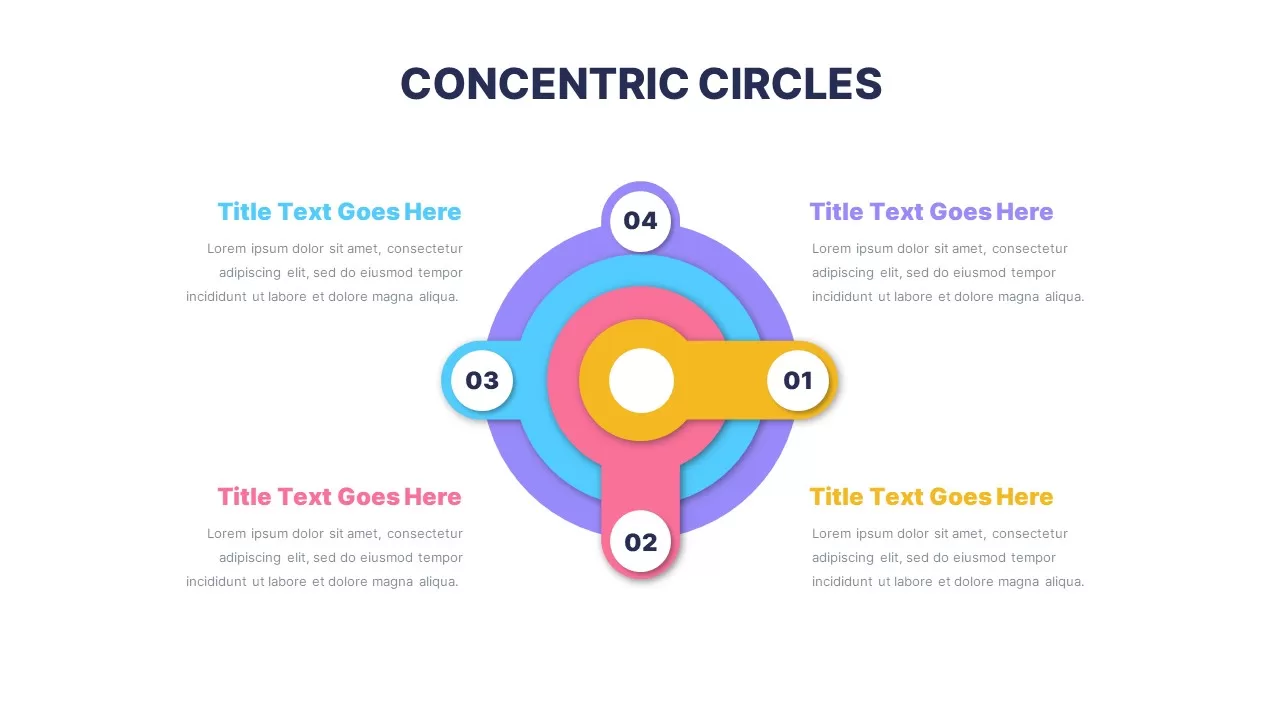
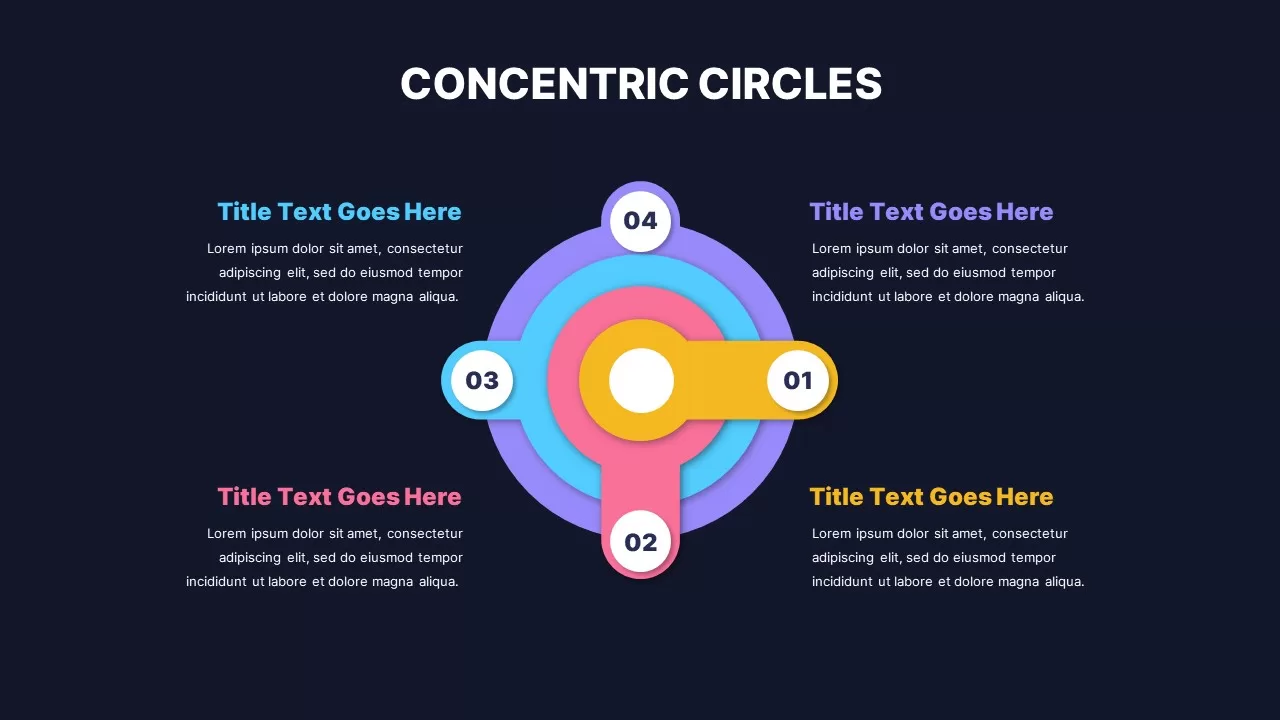
Visualize layered relationships, processes, or core frameworks using this vibrant concentric circles infographic slide. At the center lies a series of four color-coded circular bands, each connected to a numbered segment branching outward in a cross-like structure. Each number corresponds to a surrounding text block, enabling a clear narrative from the core outward or vice versa.
The colors—yellow, pink, cyan, and purple—clearly separate each tier, helping your audience easily interpret progressive or hierarchical information. This format is ideal for illustrating stages of growth, influence zones, centrality in systems, or strategic priorities. The smooth shadows, bold fonts, and geometric alignment give the slide a playful yet structured aesthetic that stands out in any deck.
Fully editable in PowerPoint and Google Slides, the template allows quick customization of colors, icons, numbers, and descriptions. Whether you’re mapping out product features, core competencies, or process flows, this infographic offers clarity through circular structure and symmetry.
Who is it for
Great for educators, business strategists, marketing professionals, and product managers who want to highlight central themes, processes, or layered priorities in a colorful, engaging way.
Other Uses
Also ideal for illustrating customer journey stages, team roles, value models, or circular data flows. Can be adapted for workshop summaries, training visuals, or content marketing frameworks.
Login to download this file

Item ID
SB03150
Related Templates

3-Tier Concentric Circles Infographic Template for PowerPoint & Google Slides
Circular
5 Layer Concentric Circles Infographics Template for PowerPoint & Google Slides
Circular
SWOT Template with Colorful Circles for PowerPoint & Google Slides
SWOT
Concentric Marketing Matrix Slide Template for PowerPoint & Google Slides
Circular
Concentric Four-Layer Core Diagram Template for PowerPoint & Google Slides
Circular
Concentric Functional Process Model Template for PowerPoint & Google Slides
Circular
Concentric Circular Arrow Cycle Diagram Template for PowerPoint & Google Slides
Process
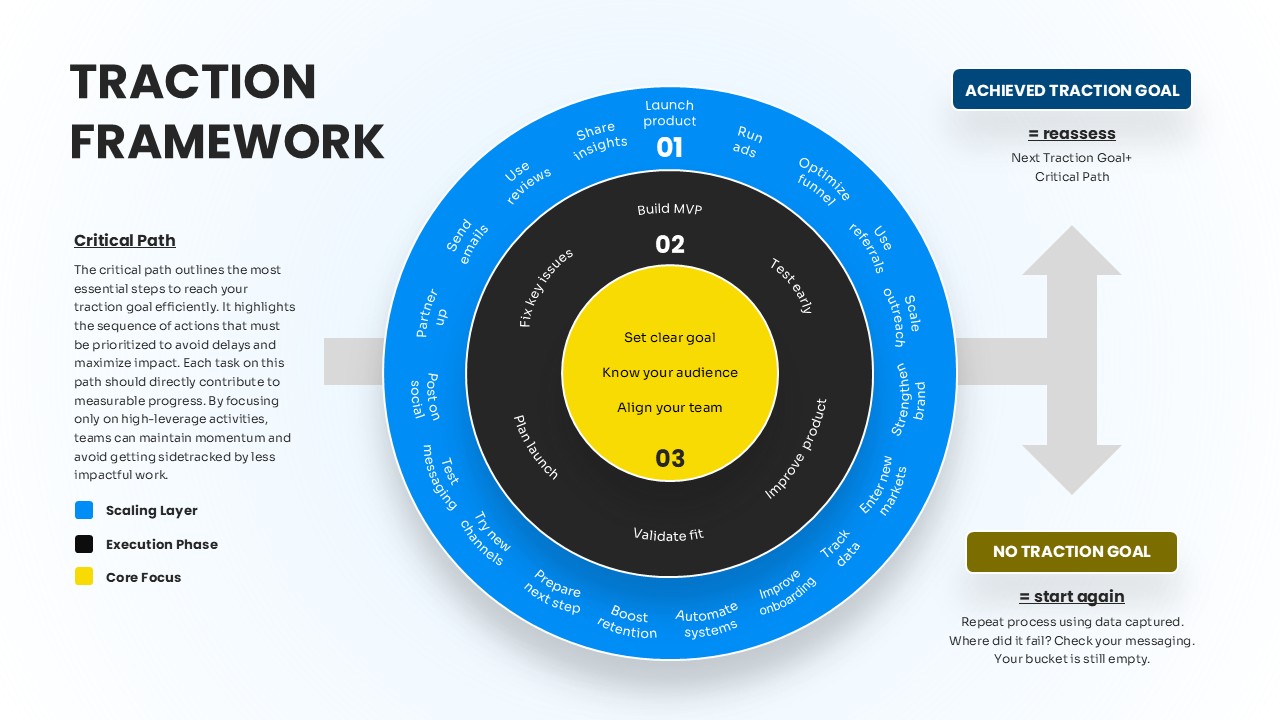
Concentric Traction Framework Diagram Template for PowerPoint & Google Slides
Process

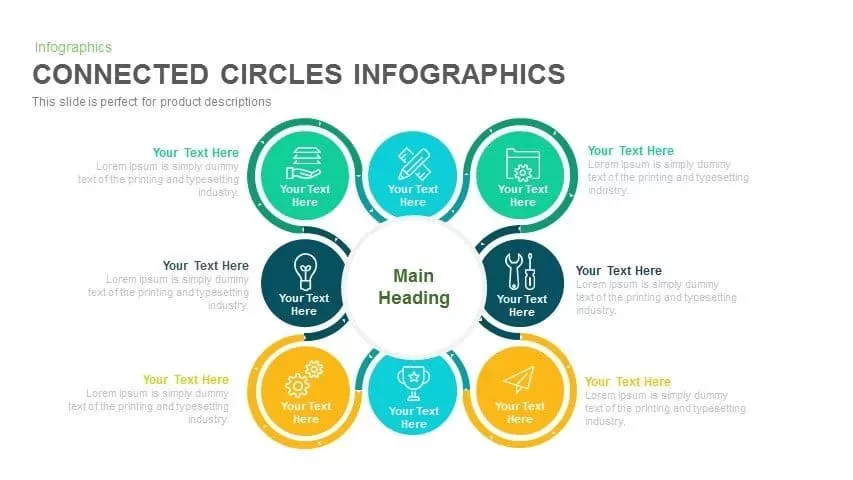
Radial Connected Circles Infographic Template for PowerPoint & Google Slides
Circular
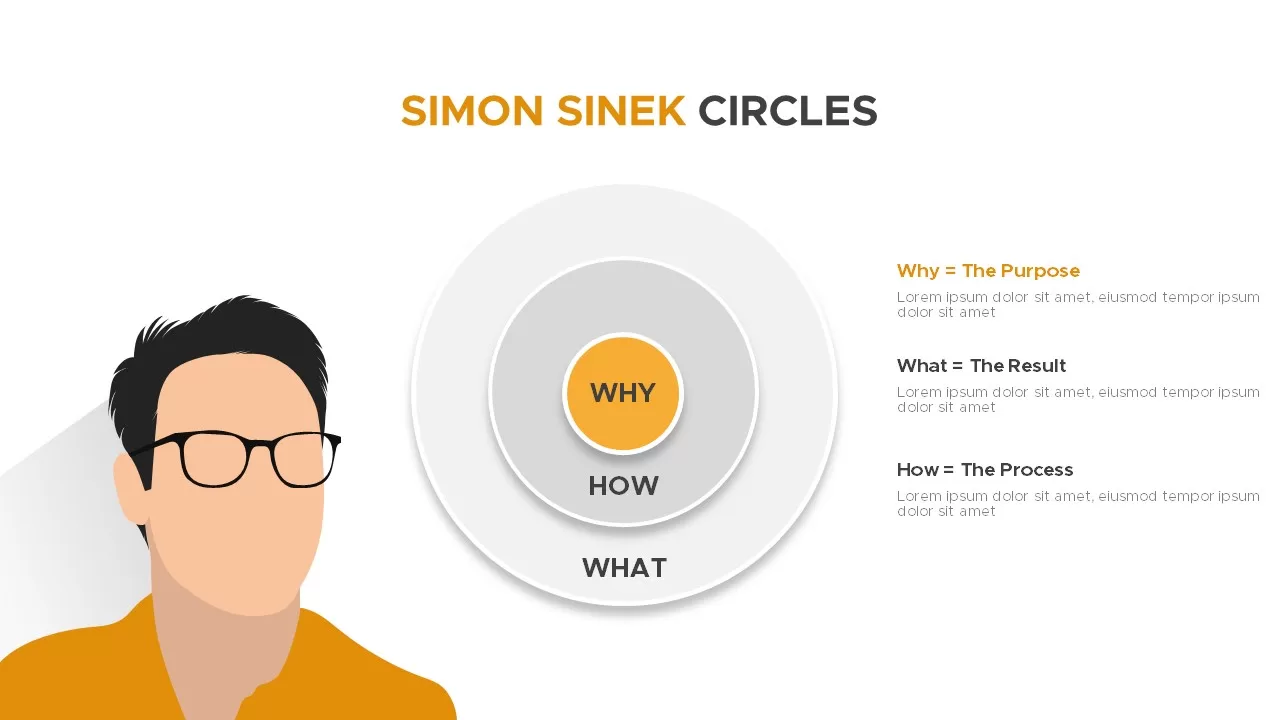
Simon Sinek Circles Model Infographic template for PowerPoint & Google Slides
Business Strategy
Linear Process Flow Circles Diagram Template for PowerPoint & Google Slides
Process

Modern Five-Step Circles Process Diagram Template for PowerPoint & Google Slides
Circular
Colorful Block Infographic Metrics Slide Template for PowerPoint & Google Slides
Infographics

Free Colorful Infographic Slide Pack Template for PowerPoint & Google Slides
Roadmap
Free
7-Stage Colorful Timeline Infographic Template for PowerPoint & Google Slides
Timeline

Colorful Photo Capture Infographic Template for PowerPoint & Google Slides
Advertising
Colorful Four-Stage Infographic Process Template for PowerPoint & Google Slides
Process
Colorful Mind Map Infographic Template with Icons for PowerPoint & Google Slides
Mind Maps
Colorful Mind Map Infographic Template for PowerPoint & Google Slides
Mind Maps
Colorful Callout Calendar Infographic Template for PowerPoint & Google Slides
Infographics
Free Colorful Roadmap Timeline Infographic Template for PowerPoint & Google Slides
Roadmap
Free
Colorful Hub-and-Spoke Infographic Template for PowerPoint & Google Slides
Circular
Colorful Hub-and-Spoke Infographic Template for PowerPoint & Google Slides
Circular
Colorful Agenda Timeline Infographic Template for PowerPoint & Google Slides
Agenda
Colorful Agile Timeline Infographic Template for PowerPoint & Google Slides
Timeline
Free
Six Colorful Gear Shapes Infographic Template for PowerPoint & Google Slides
Process
Free
Colorful Five-Option Ribbon Infographic Template for PowerPoint & Google Slides
Process
Colorful Nine-Stage Agenda Slide Template for PowerPoint & Google Slides
Agenda
Colorful Layered Onion Diagram Slide for PowerPoint & Google Slides
Process
Colorful Weekly Schedule Slide Deck Template for PowerPoint & Google Slides
Agenda
Free Colorful Career Timeline Resume Slide Template for PowerPoint & Google Slides
Timeline
Free
Free Colorful Animal 2024 Calendar Slide Pack Template for PowerPoint & Google Slides
Infographics
Free
Colorful Multi-Branch Mind Map Slide Template for PowerPoint & Google Slides
Mind Maps
Colorful Seven-Item Agenda Slide Template for PowerPoint & Google Slides
Agenda
Colorful Birthday Celebration Slides for PowerPoint & Google Slides
Graphics
Colorful Rainbow Slides Template for PowerPoint & Google Slides
Graphics
Editable Colorful Daily Agenda Slides Template for PowerPoint & Google Slides
Agenda
Free Colorful Morning Meeting Agenda Slides Template for PowerPoint & Google Slides
Agenda
Free
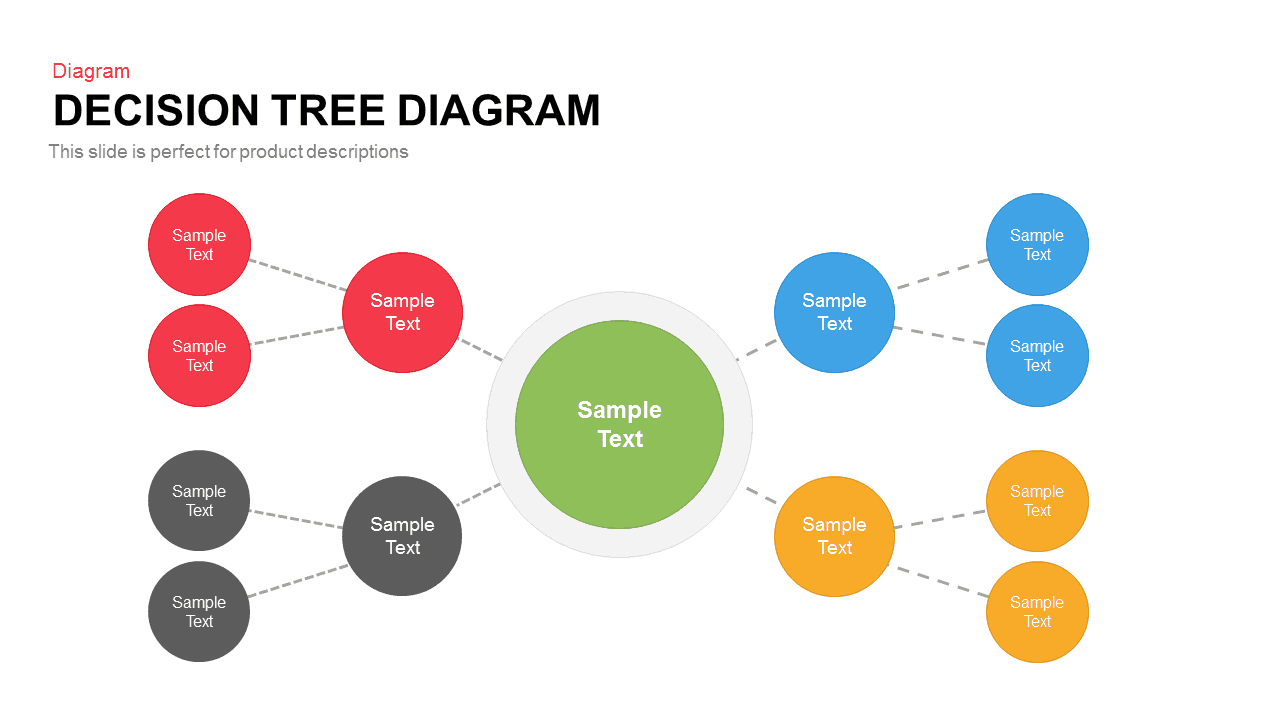
Colorful Decision Tree Diagram template for PowerPoint & Google Slides
Decision Tree
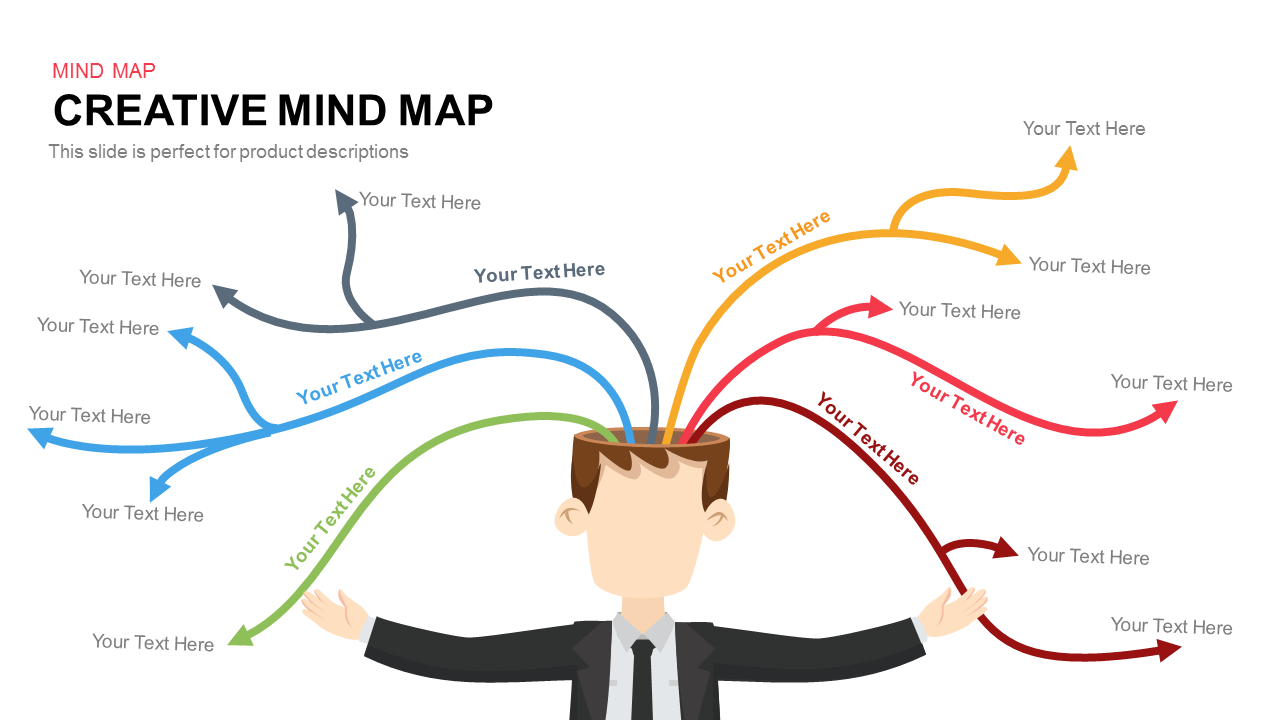
Colorful Creative Mind Map Diagram template for PowerPoint & Google Slides
Mind Maps
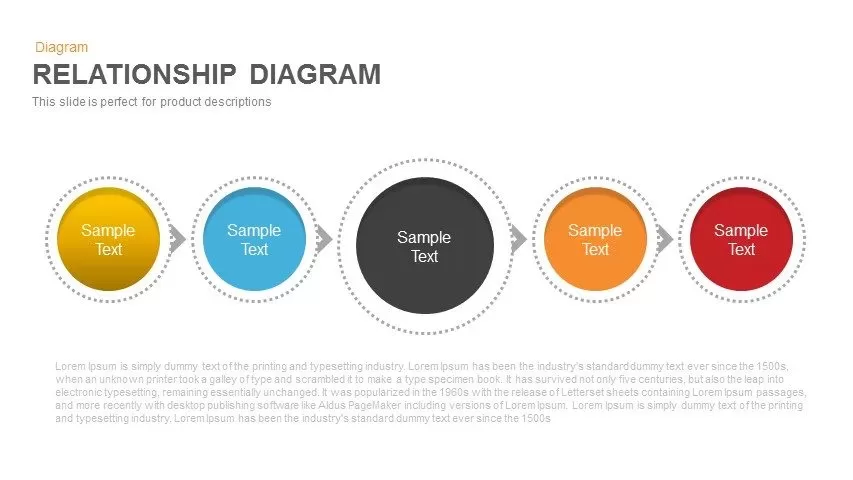
Colorful Five-Stage Relationship Diagram Template for PowerPoint & Google Slides
Process
Colorful Radial Bar Chart Template for PowerPoint & Google Slides
Bar/Column
Six-Stage Colorful Spiral Timeline Template for PowerPoint & Google Slides
Timeline
Modern Colorful Circular Org Chart Template for PowerPoint & Google Slides
Org Chart
Colorful Content Marketing Matrix Template for PowerPoint & Google Slides
Comparison
Colorful Venn Diagram Infographics Template for PowerPoint & Google Slides
Circular
Colorful Circular Puzzle Diagram Template for PowerPoint & Google Slides
Circular
5-Step Colorful Funnel Diagram Template for PowerPoint & Google Slides
Funnel
Colorful 5-Step Circular Process Template for PowerPoint & Google Slides
Process
Colorful Curved Roadmap Phases Template for PowerPoint & Google Slides
Roadmap
Colorful Six-Piece Puzzle Diagram Template for PowerPoint & Google Slides
Infographics
Colorful Eight-Piece Puzzle Diagram Template for PowerPoint & Google Slides
Process
Modern Colorful SWOT Quadrant Analysis Template for PowerPoint & Google Slides
SWOT
Colorful Five-Step Roadmap Diagram Template for PowerPoint & Google Slides
Roadmap
Colorful Nine-Piece Puzzle Diagram Template for PowerPoint & Google Slides
Process
Colorful SWOT Analysis Quadrant Template for PowerPoint & Google Slides
SWOT
Colorful Vertical SWOT Analysis Layout Template for PowerPoint & Google Slides
SWOT
Colorful Four-Year Timeline Layout Template for PowerPoint & Google Slides
Timeline
Colorful Five-Year Timeline Layout Template for PowerPoint & Google Slides
Timeline
Free Colorful Process Flow Infographics Template for PowerPoint & Google Slides
Process
Free
Colorful Mind Map Template for PowerPoint & Google Slides
Mind Maps
Colorful Mind Map Template for PowerPoint & Google Slides
Mind Maps
Colorful Mind Map with Icons Template for PowerPoint & Google Slides
Mind Maps
Colorful Process Flow Template for PowerPoint & Google Slides
Process
Colorful Mind Map Template for PowerPoint & Google Slides
Mind Maps
Colorful Process Flow Infographics Template for PowerPoint & Google Slides
Process

Colorful Nursing Presentation Deck Template for PowerPoint & Google Slides
Nursing
Colorful Project Status Dashboard Template for PowerPoint & Google Slides
Project Status
Maslow’s Colorful Pyramid of Needs Template for PowerPoint & Google Slides
Pyramid
Colorful Five-Stage Methodology Diagram Template for PowerPoint & Google Slides
Process
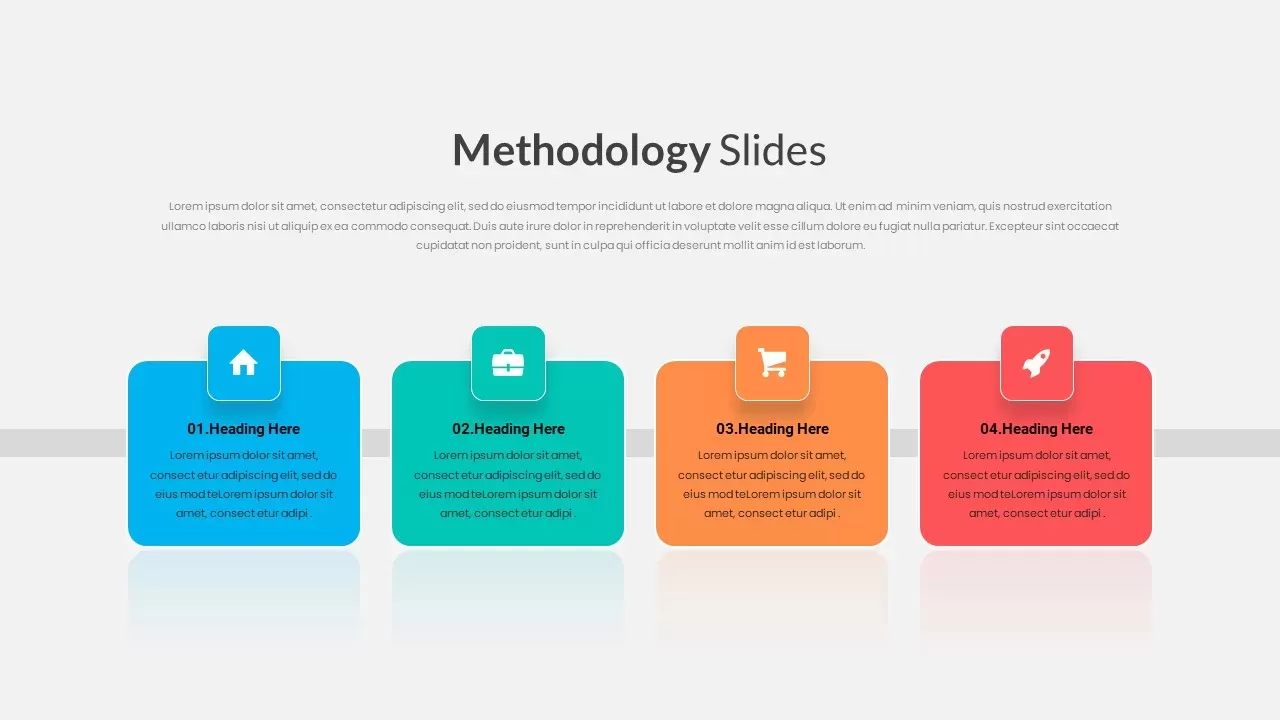
4 Step Vibrant Colorful Methodology Template for PowerPoint & Google Slides
Process
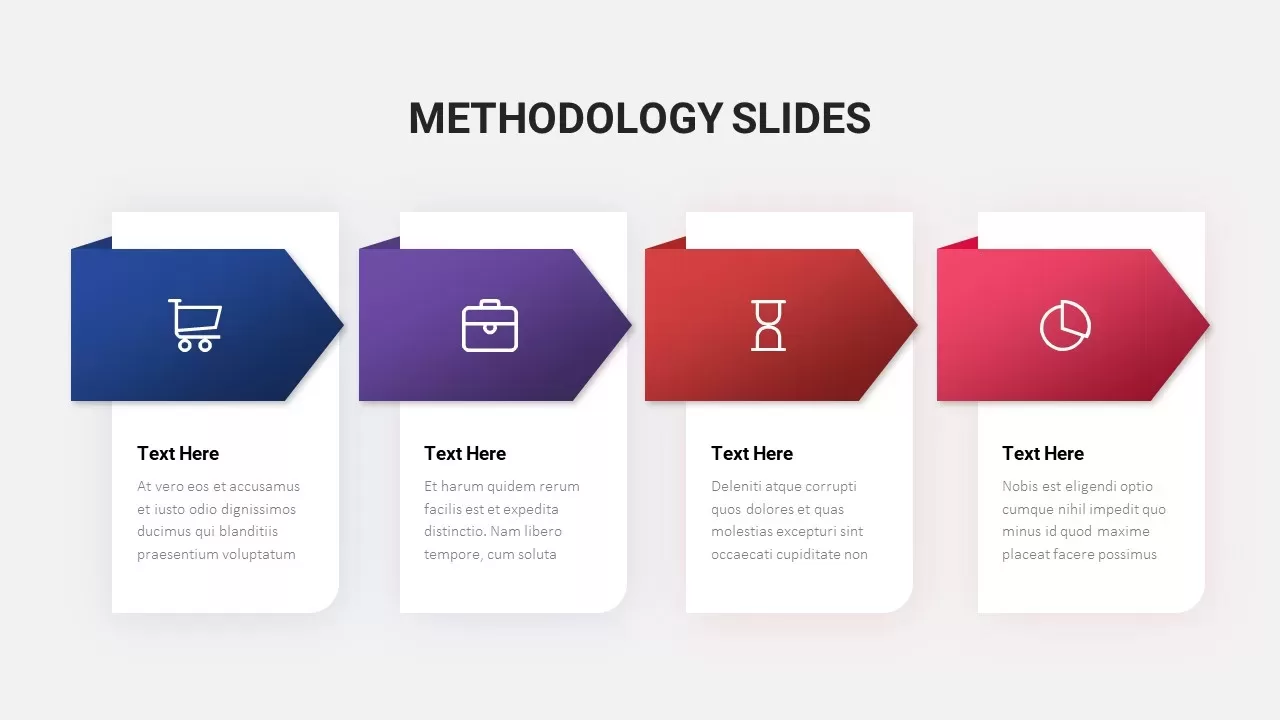
Colorful Arrow Methodology Steps Template for PowerPoint & Google Slides
Process
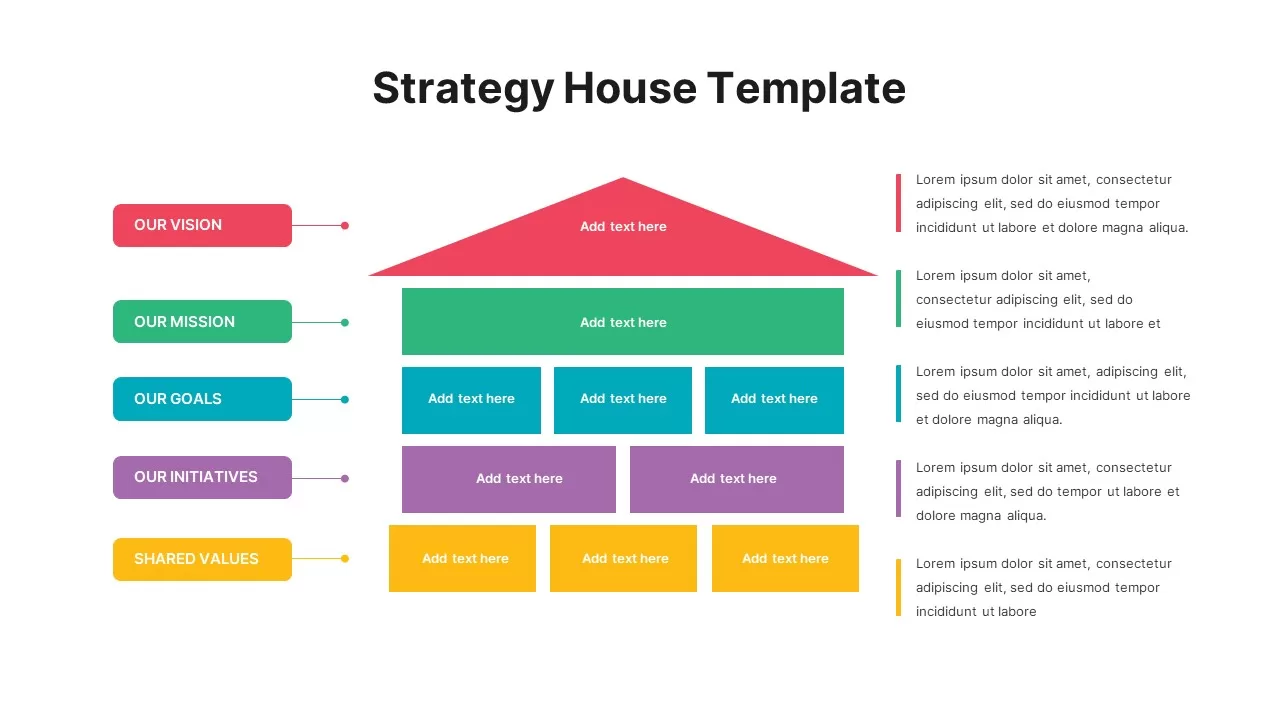
Colorful Strategy House Template for PowerPoint & Google Slides
Business Strategy
Six-Step Colorful Flywheel Diagram Template for PowerPoint & Google Slides
Circular
Four-Level Colorful Pyramid Diagram Template for PowerPoint & Google Slides
Pyramid
Colorful Polka Dot Background Theme Template for PowerPoint & Google Slides
Decks
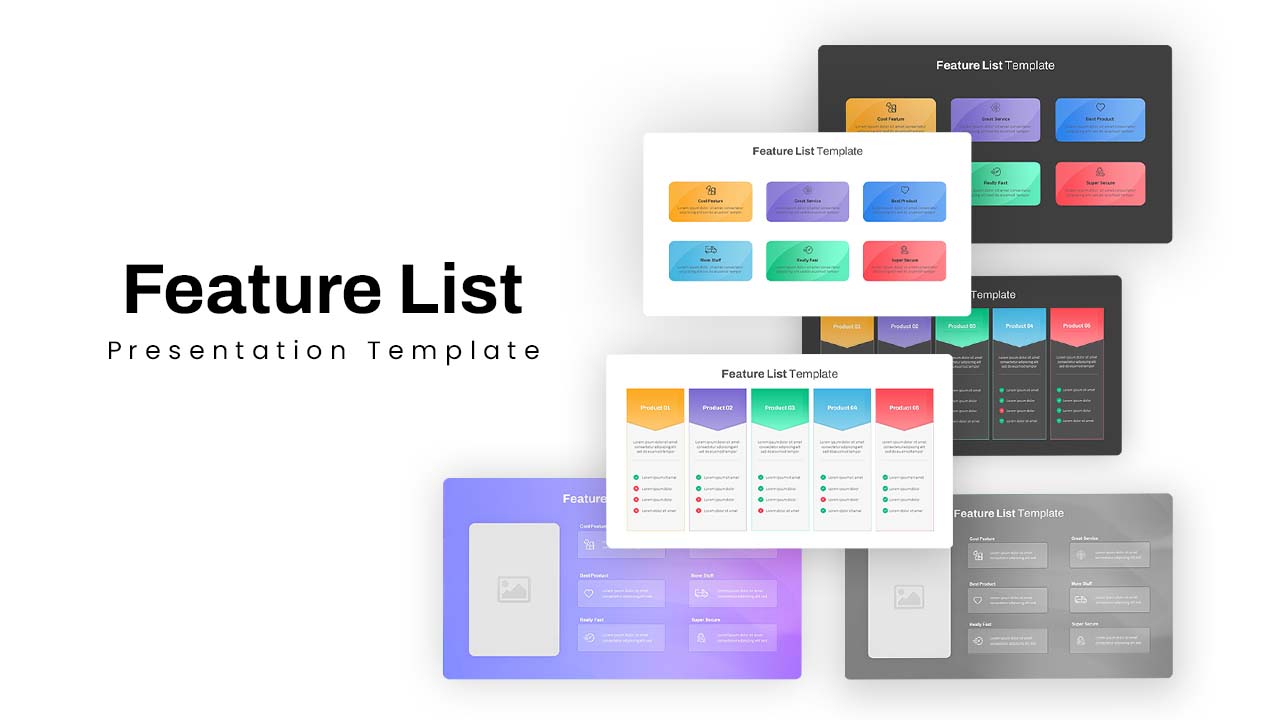
Colorful Feature List Presentation Template for PowerPoint & Google Slides
Decks
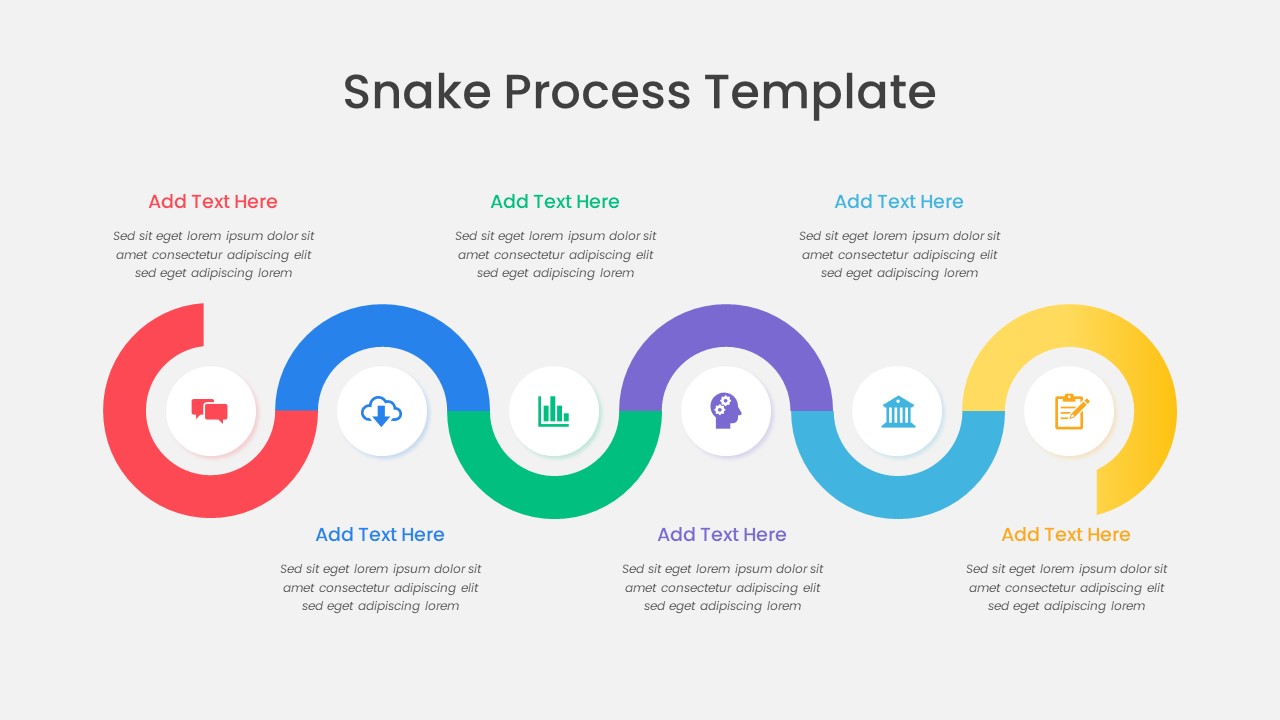
Colorful Snake Process Diagram Template for PowerPoint & Google Slides
Process
Colorful Four-Segment Wheel Chart Template for PowerPoint & Google Slides
Circular
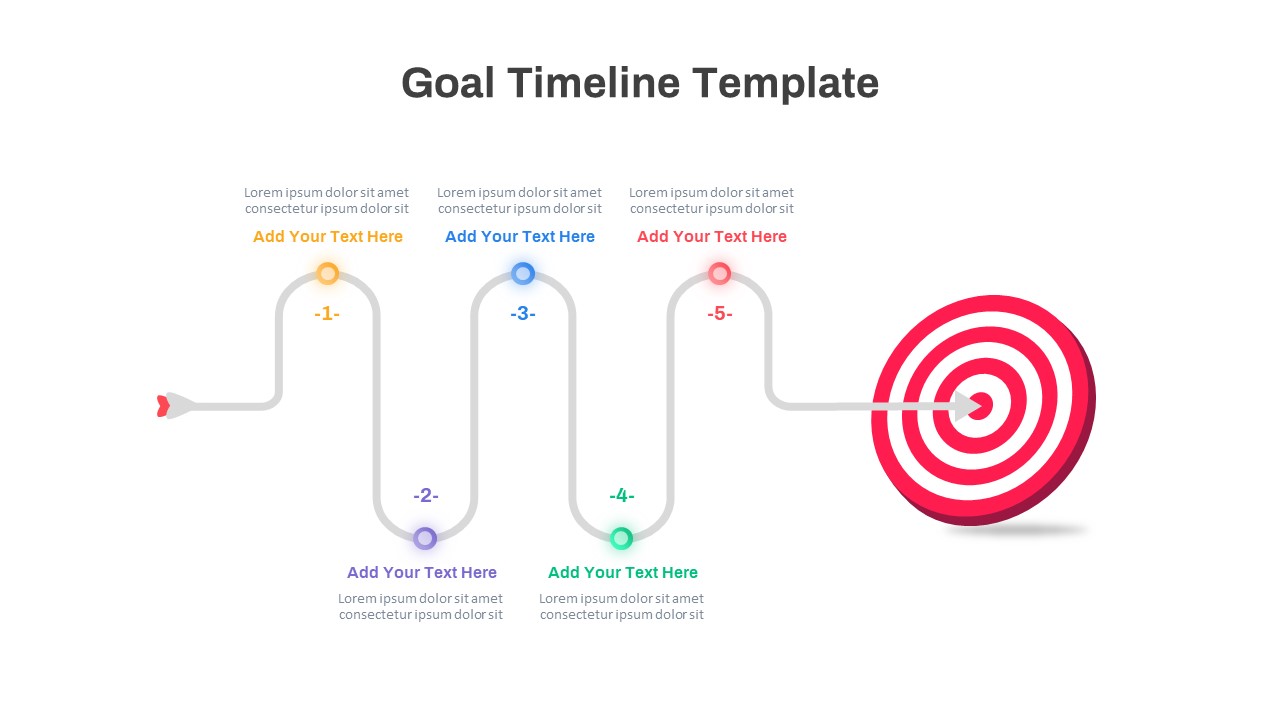
Colorful Five-Step Goal Timeline Template for PowerPoint & Google Slides
Timeline
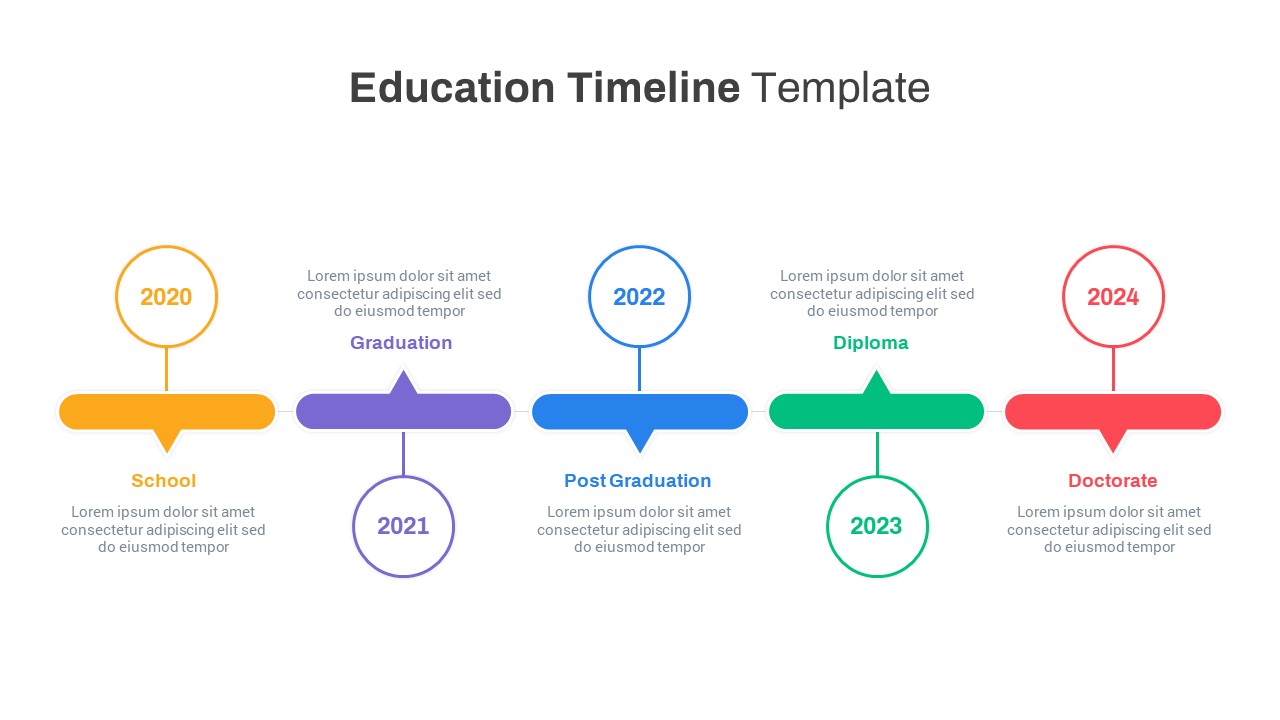
Colorful Five-Stage Education Timeline Template for PowerPoint & Google Slides
Timeline
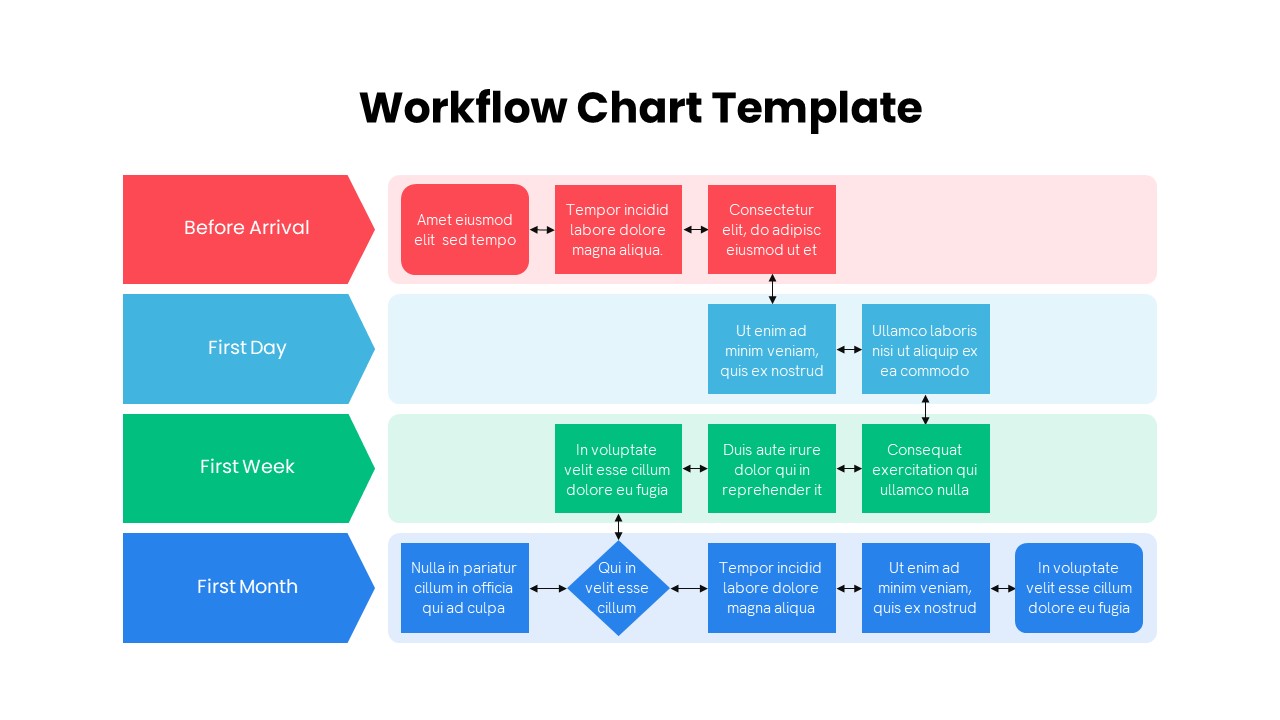
Colorful Multistage Workflow Chart Template for PowerPoint & Google Slides
Flow Charts
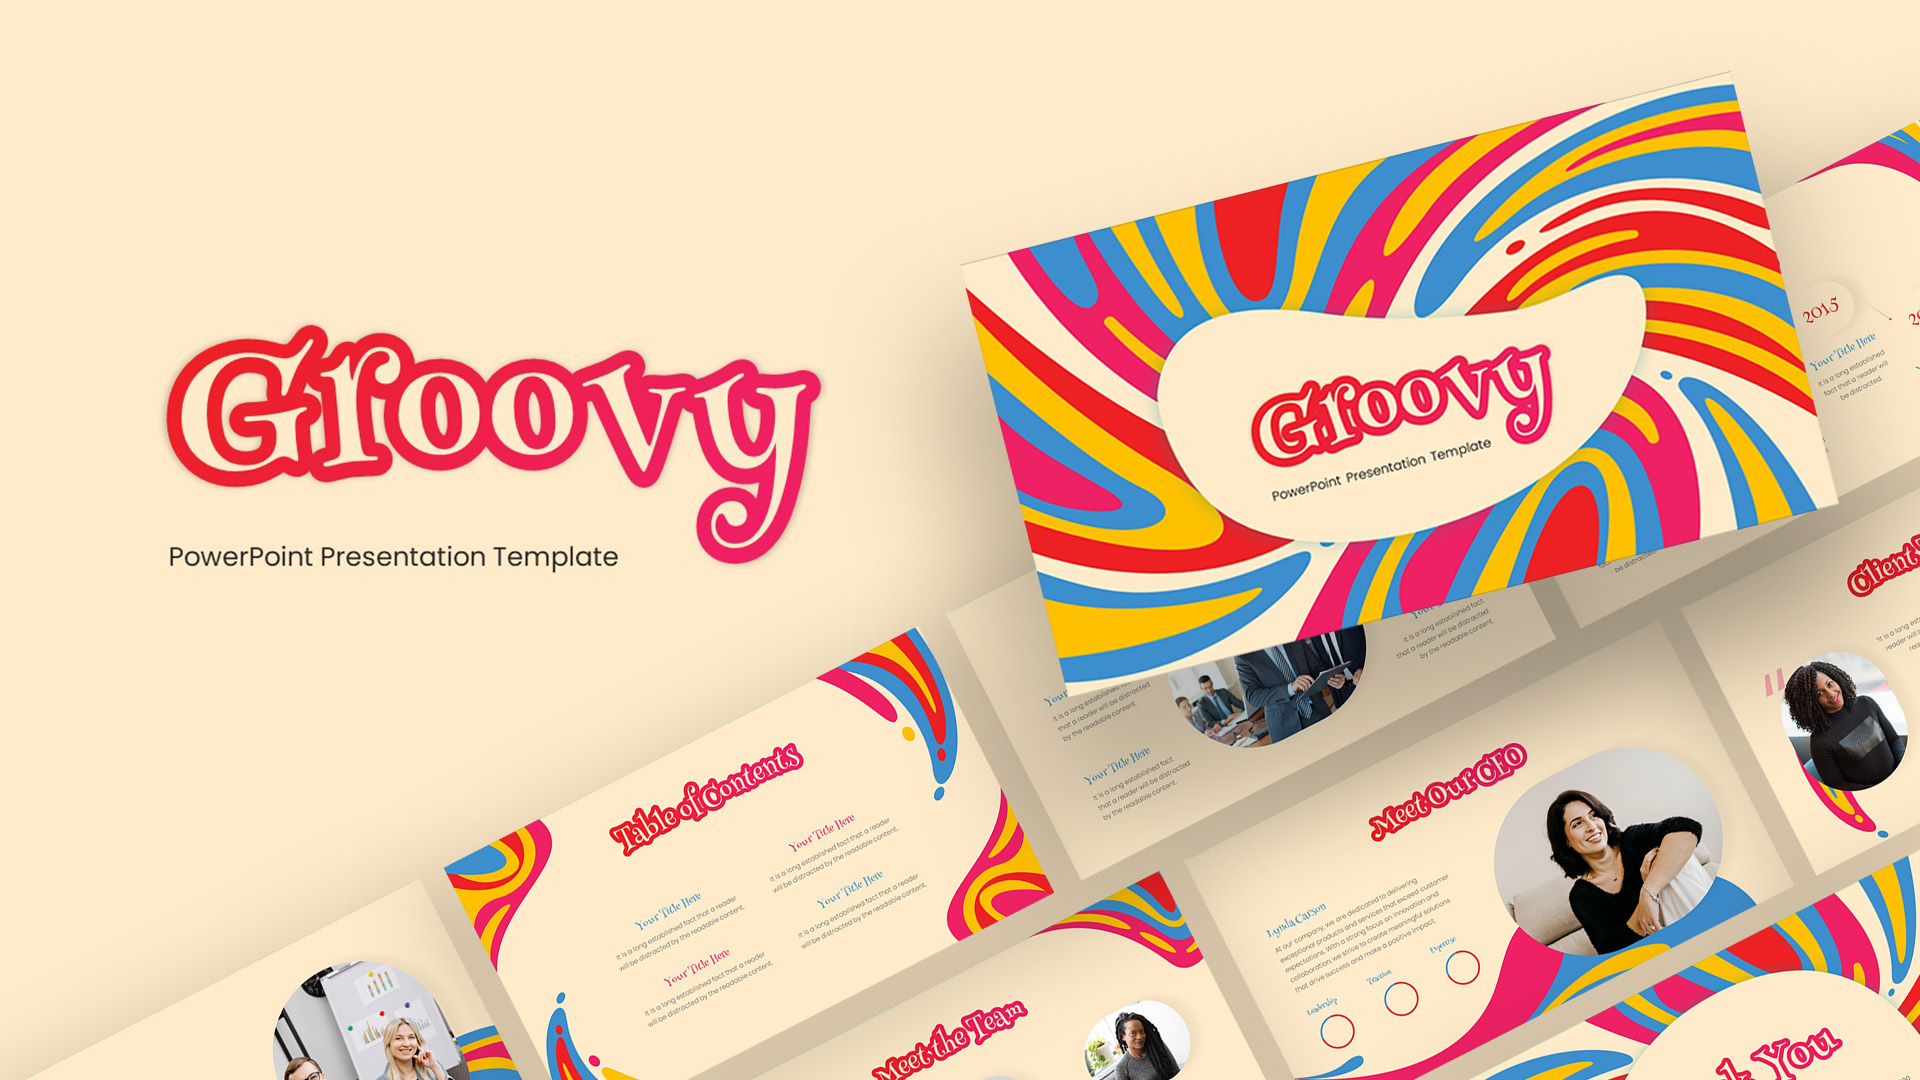
Groovy Retro Colorful Presentation Template for PowerPoint & Google Slides
Company Profile
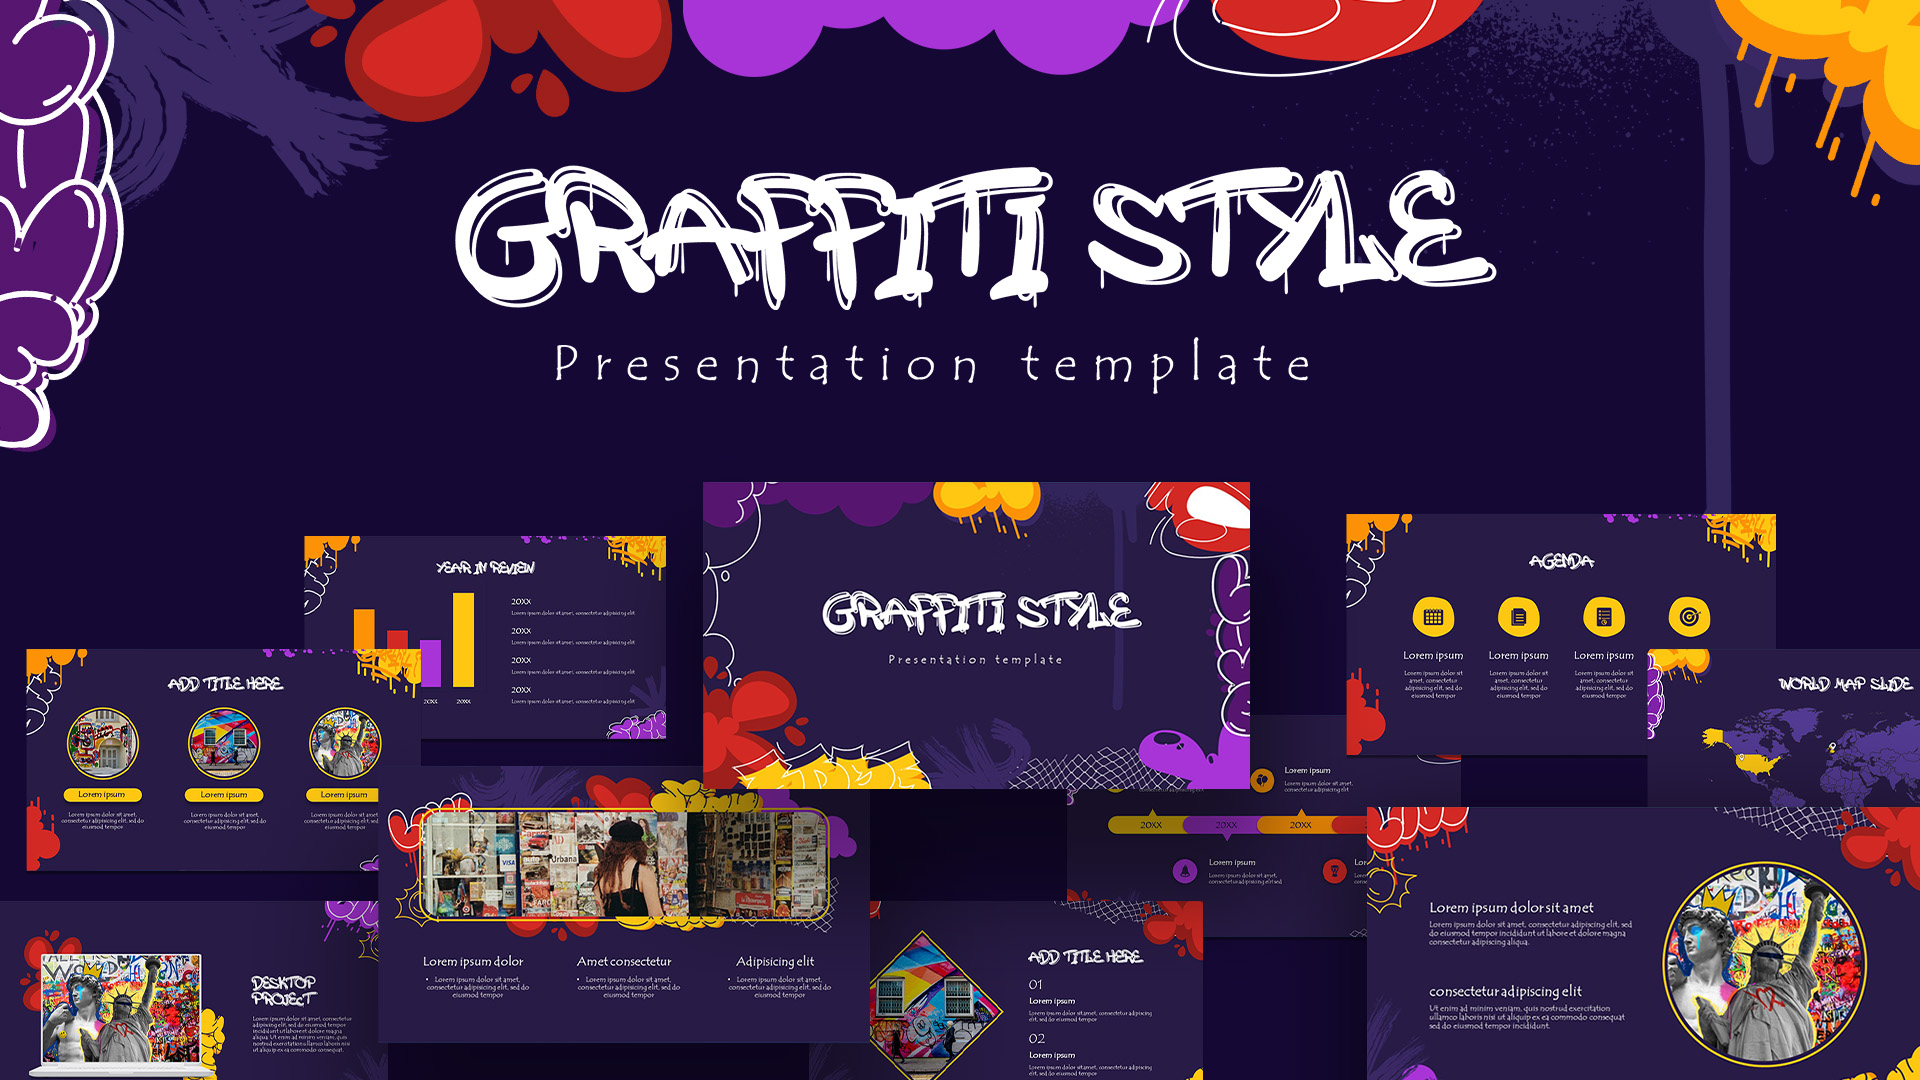
Free Graffiti Style Colorful Presentation Template for PowerPoint & Google Slides
Pitch Deck
Free
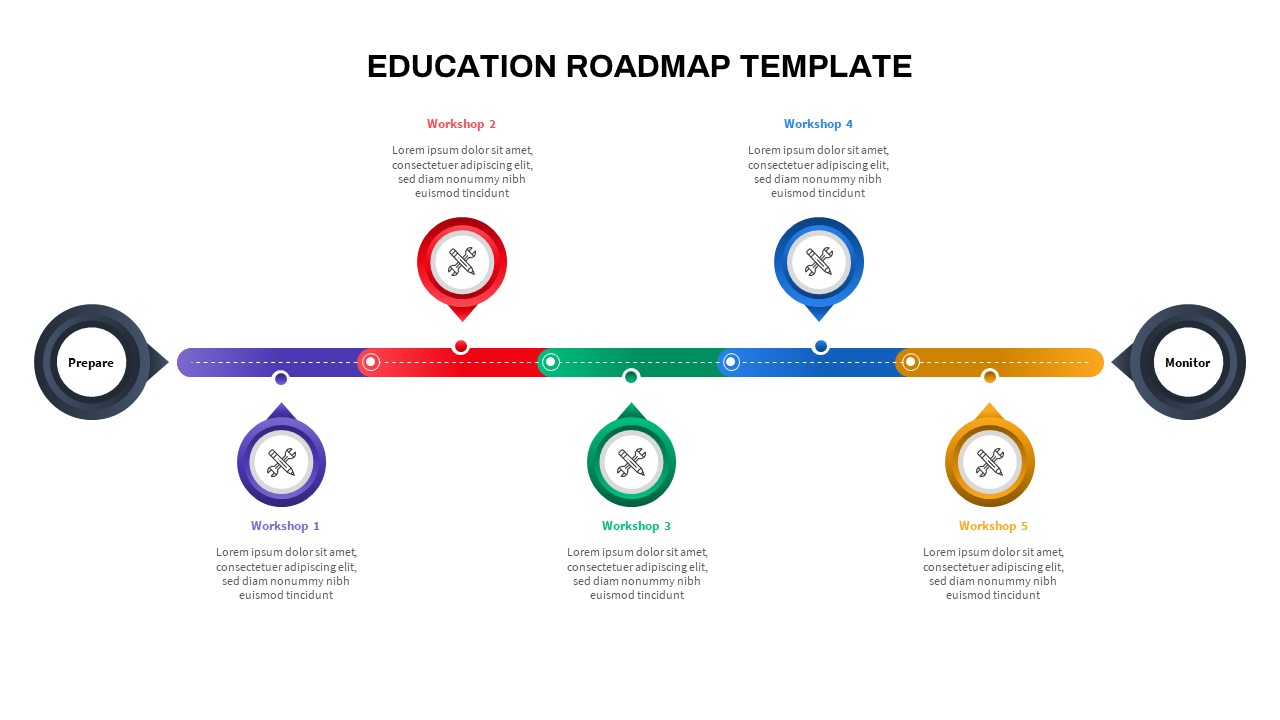
Colorful Education Roadmap Workshop Timeline Template for PowerPoint & Google Slides
Roadmap
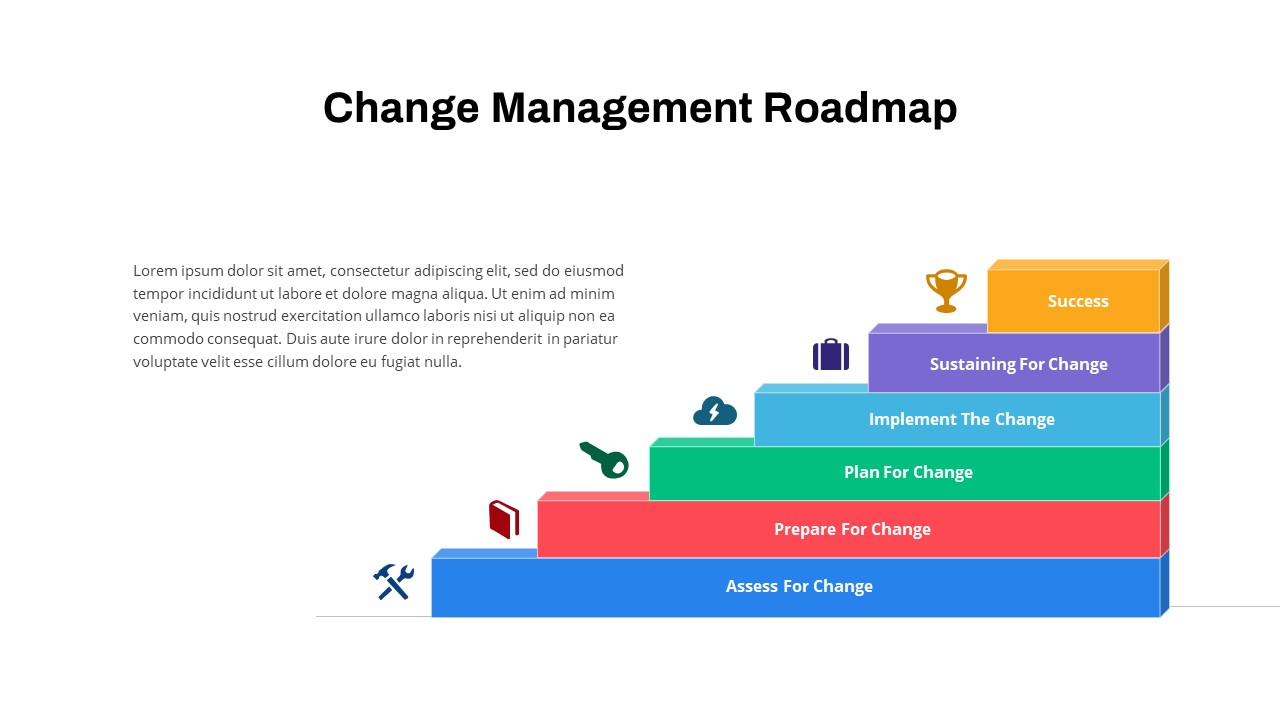
Colorful Change Management Roadmap Template for PowerPoint & Google Slides
Roadmap
Free Colorful Timeline Infographics Template for PowerPoint & Google Slides
Timeline
Free
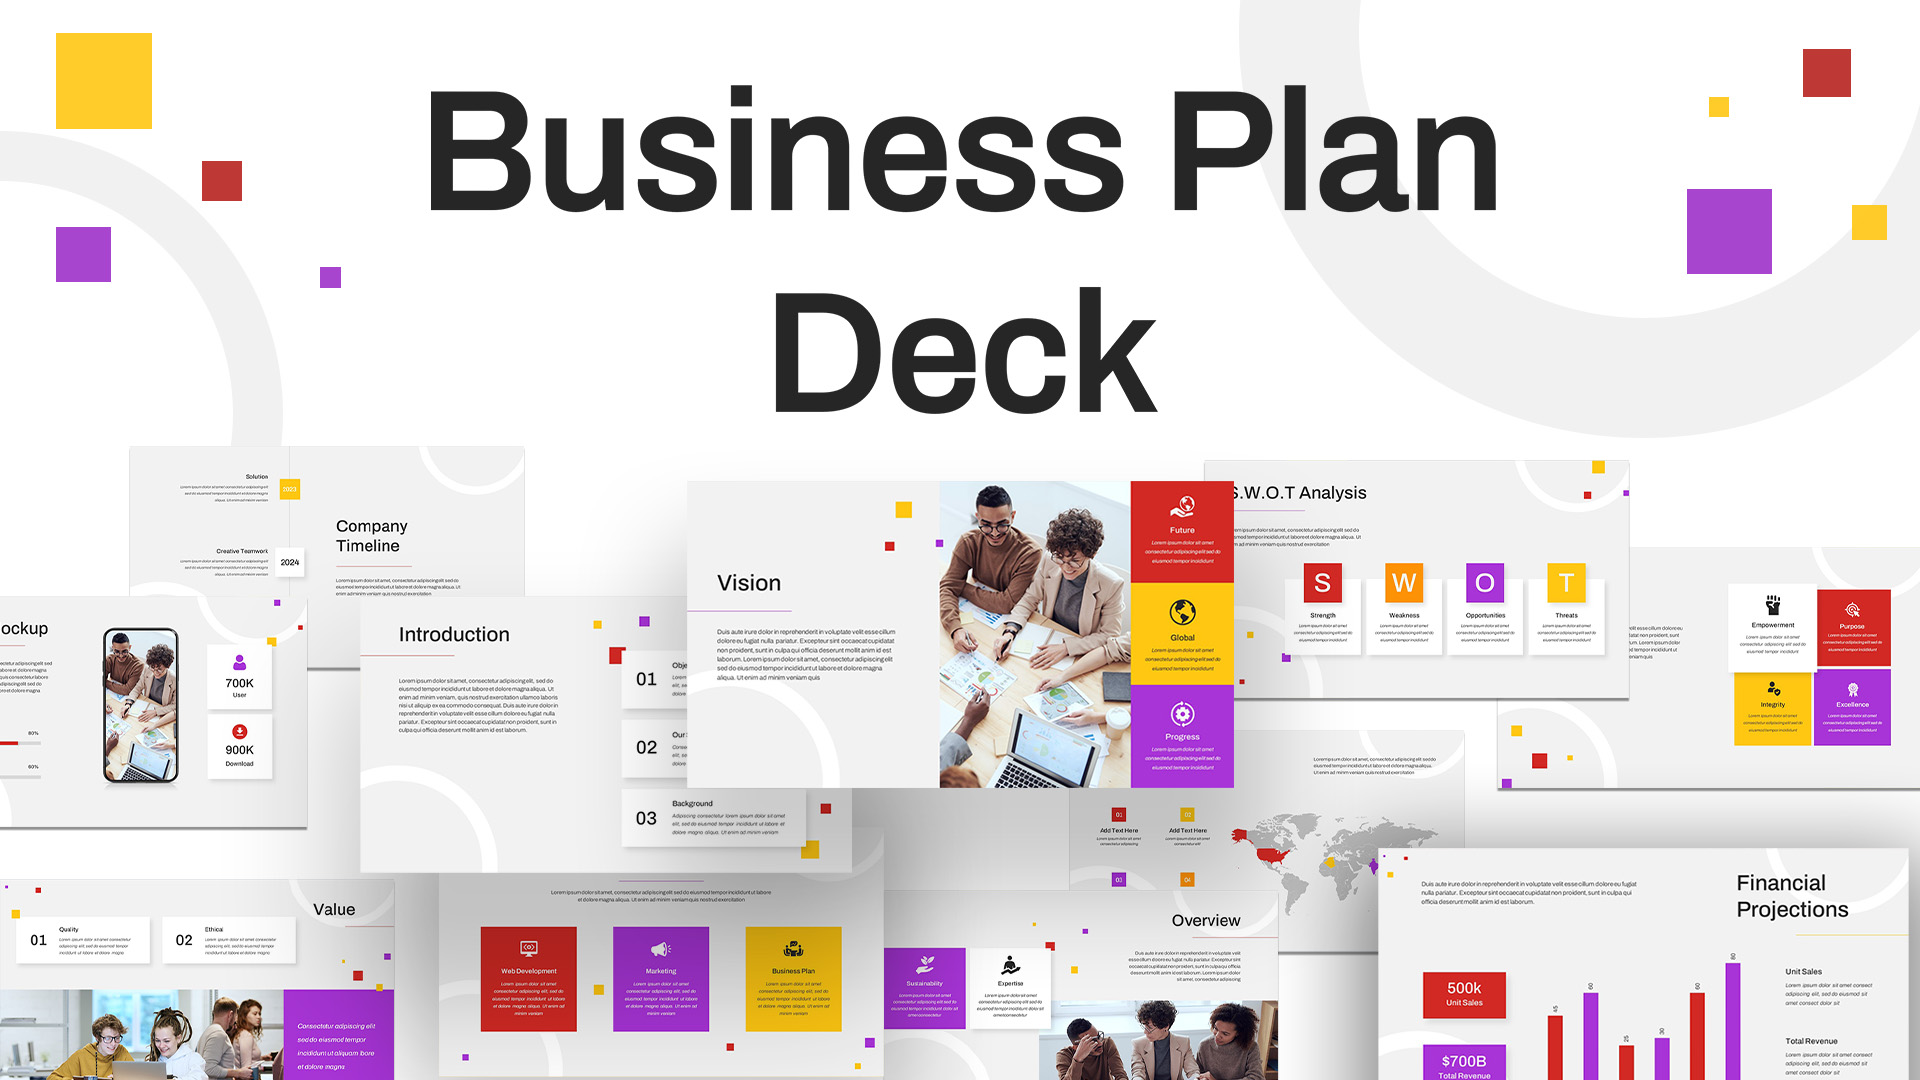
Free Modern Colorful Business Plan Deck Template for PowerPoint & Google Slides
Business Plan
Free
Multi-Level Colorful Pyramid Chart Template for PowerPoint & Google Slides
Pyramid
Colorful Creative Presentation Deck Template for PowerPoint & Google Slides
Company Profile
Colorful SWOT Analysis Diagram Template for PowerPoint & Google Slides
SWOT
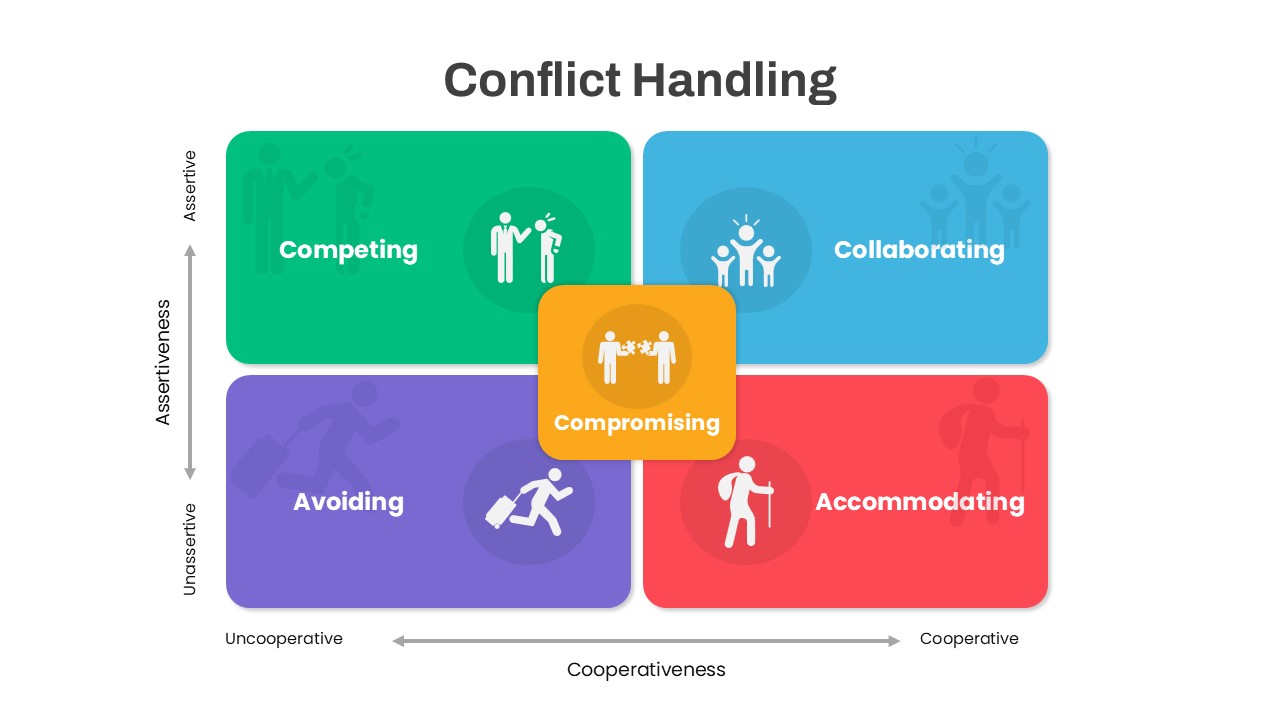
Colorful Conflict Handling Matrix Template for PowerPoint & Google Slides
Comparison
Colorful Startup Financing Cycle Diagram Template for PowerPoint & Google Slides
Finance
Colorful SWOT Analysis Quadrant Template for PowerPoint & Google Slides
SWOT
Colorful Comparison Table Presentation Template for PowerPoint & Google Slides
Table
Colorful Four-Column Table Layout Template for PowerPoint & Google Slides
Table
Colorful Annual Gantt Chart Project Planner Template for PowerPoint & Google Slides
Gantt Chart
Colorful Business Data Comparison Table Template for PowerPoint & Google Slides
Table
Colorful Venn Diagram with 4 Circle for PowerPoint & Google Slides
Circular
Four-Level Colorful Pyramid Diagram Template for PowerPoint & Google Slides
Pyramid