Business Process Reengineering Diagram Template for PowerPoint & Google Slides

Description
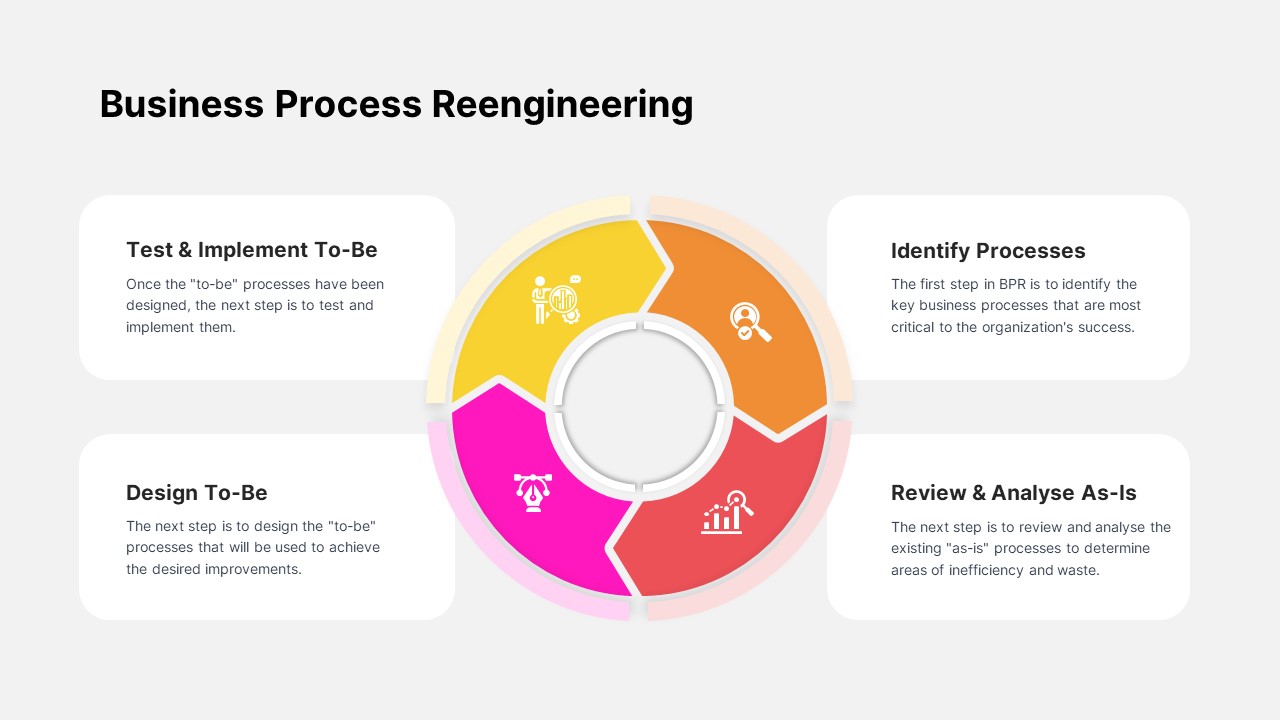
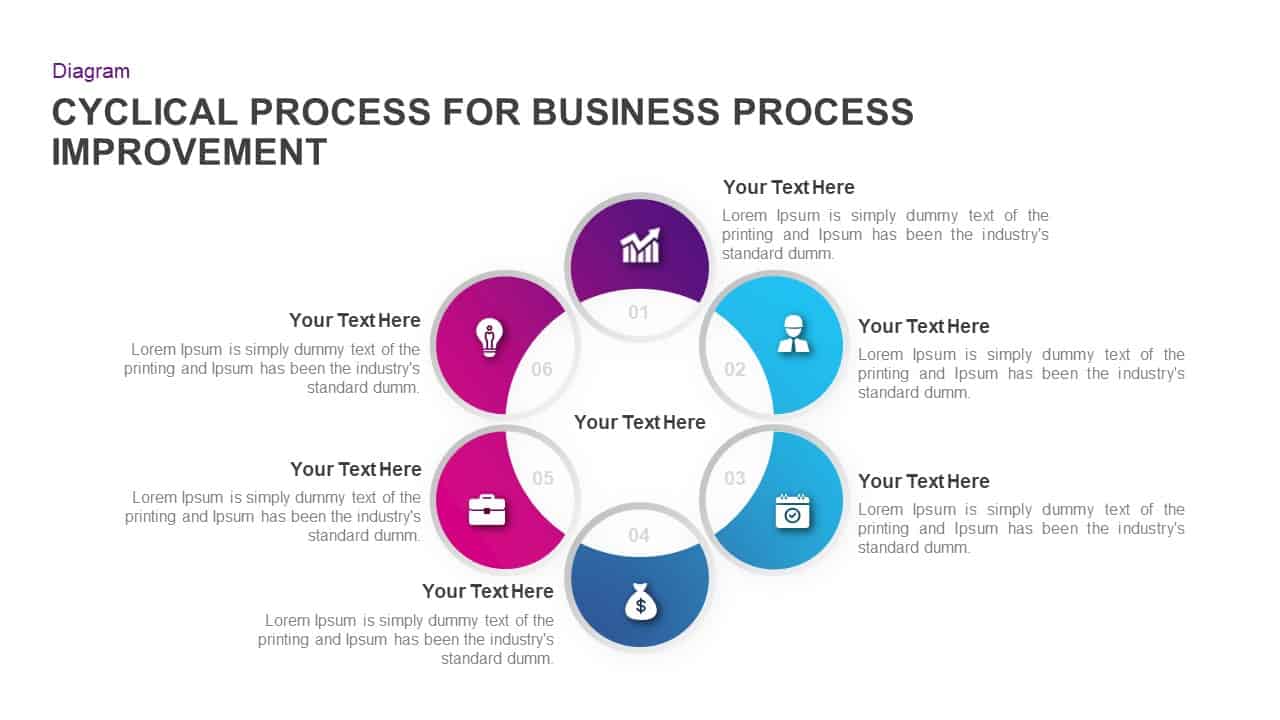
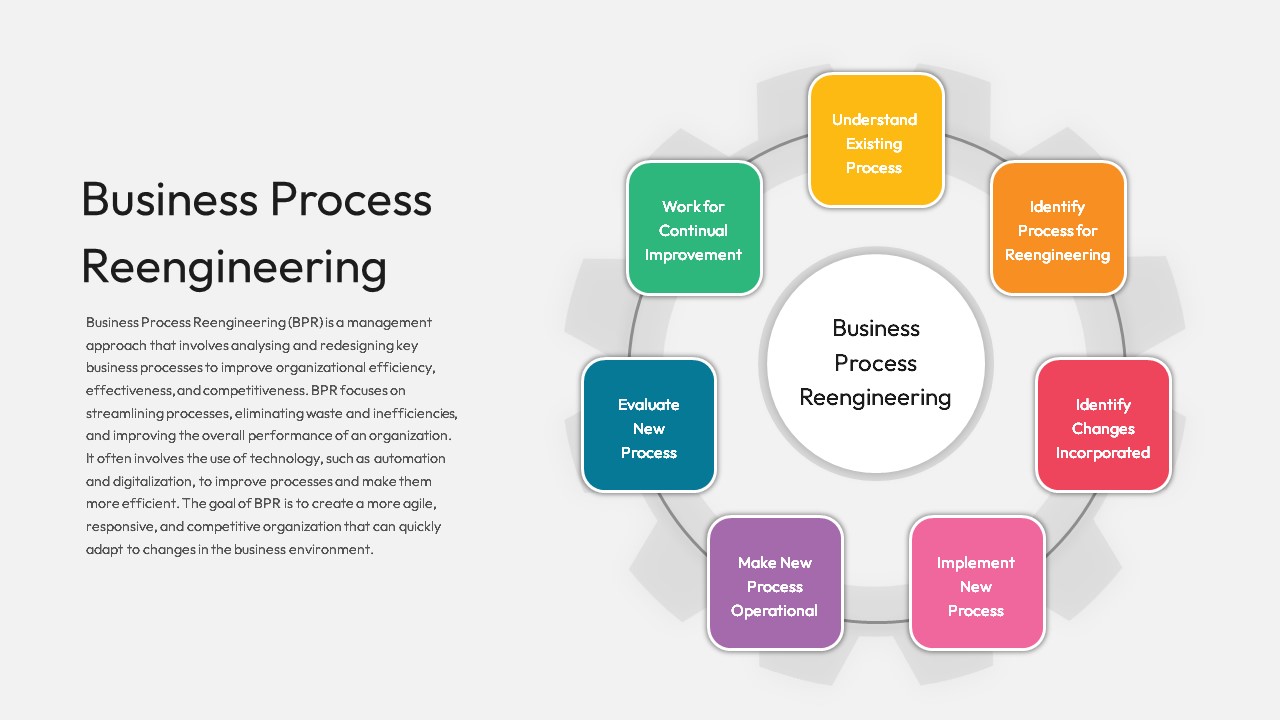
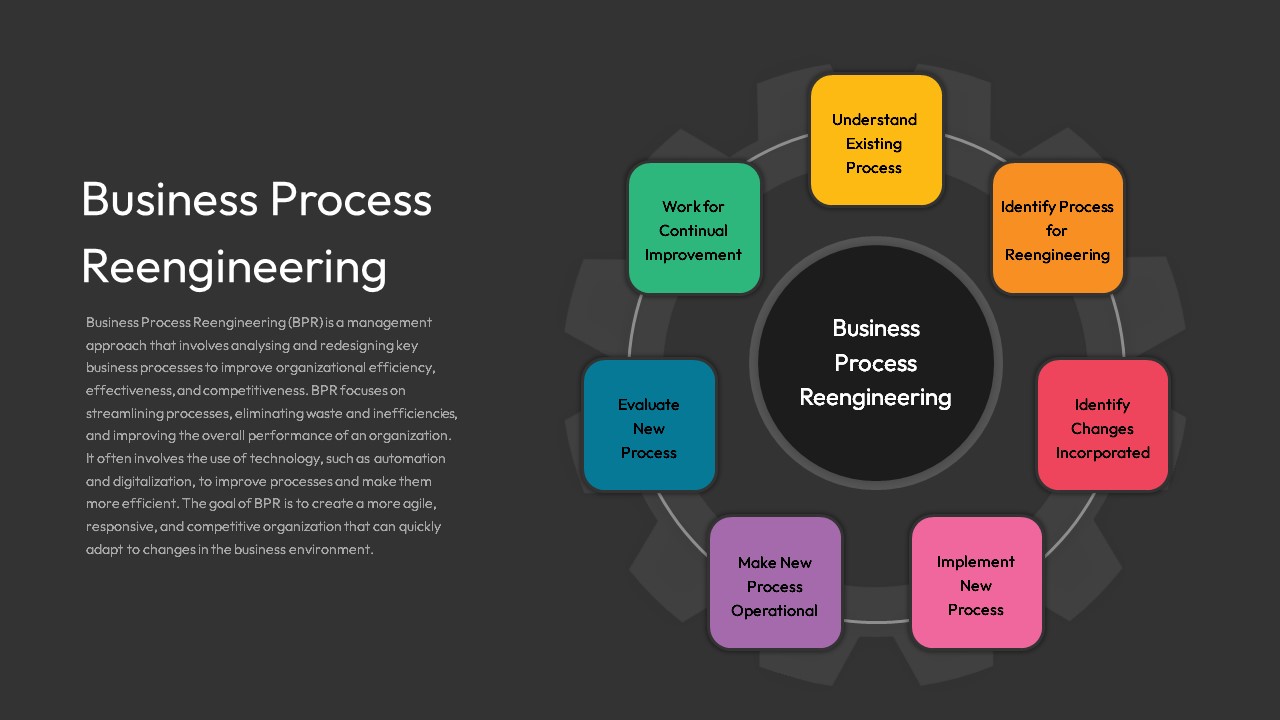
Streamline your analysis of process optimization with this Business Process Reengineering cyclical diagram, designed to visualize the seven critical steps: Understand Existing Process, Identify Process for Reengineering, Identify Changes Incorporated, Implement New Process, Make New Process Operational, Evaluate New Process, and Work for Continual Improvement. Each step is represented by a distinct colored square, arranged around a central circle labeled “Business Process Reengineering,” creating a gear-like circular layout that underscores the iterative nature of continuous improvement. The subtle shadow behind each shape and the clean white background ensure the slide remains professional and easy to read.
Built on editable master slides in PowerPoint and Google Slides, this template features scalable vector shapes, organized layers, and intuitive placeholders. Customize text, icons, and colors to match your corporate branding or project requirements. Adjust the sequence or emphasis of each segment to reflect workflow priorities, resource allocation, or performance metrics without disrupting the overall design integrity.
Leverage this diagram to communicate process analysis, waste reduction initiatives, and technology-driven automation strategies. Highlight key performance indicators at each stage by integrating data charts or icons directly into the shapes. The balanced layout supports storytelling, allowing you to demonstrate before-and-after comparisons, showcase efficiency gains, and outline steps for cross-functional team alignment.
Optimized for high-resolution displays and remote collaboration, this asset simplifies version control and accelerates slide production. Whether you’re presenting to executives, training staff on new protocols, or briefing stakeholders on change management plans, this diagram facilitates clear, data-driven discussions. The versatile framework can also be repurposed for risk management processes, quality improvement cycles, or agile project workflows.
Who is it for
Operations managers, process improvement teams, business analysts, and quality consultants will find this slide invaluable for mapping reengineering initiatives, presenting to stakeholders, or training teams on efficiency-driven transformations.
Other Uses
Use the cyclic layout to illustrate quality improvement cycles, risk management processes, agile retrospectives, or product lifecycle stages. Adapt the segments to showcase onboarding workflows, compliance audits, or continuous improvement initiatives.
Login to download this file

Item ID
SB03373
Related Templates

Business Process Reengineering Cycle Template for PowerPoint & Google Slides
Circular
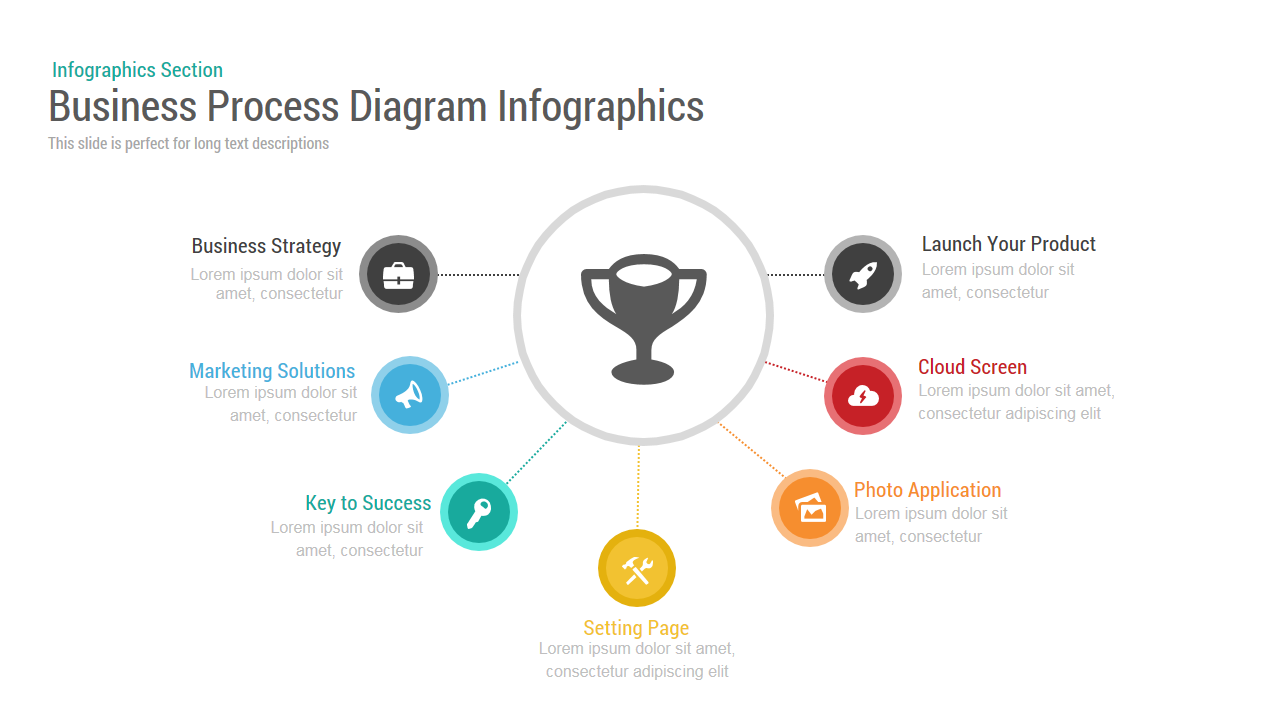
Business Process Diagram template for PowerPoint & Google Slides
Process
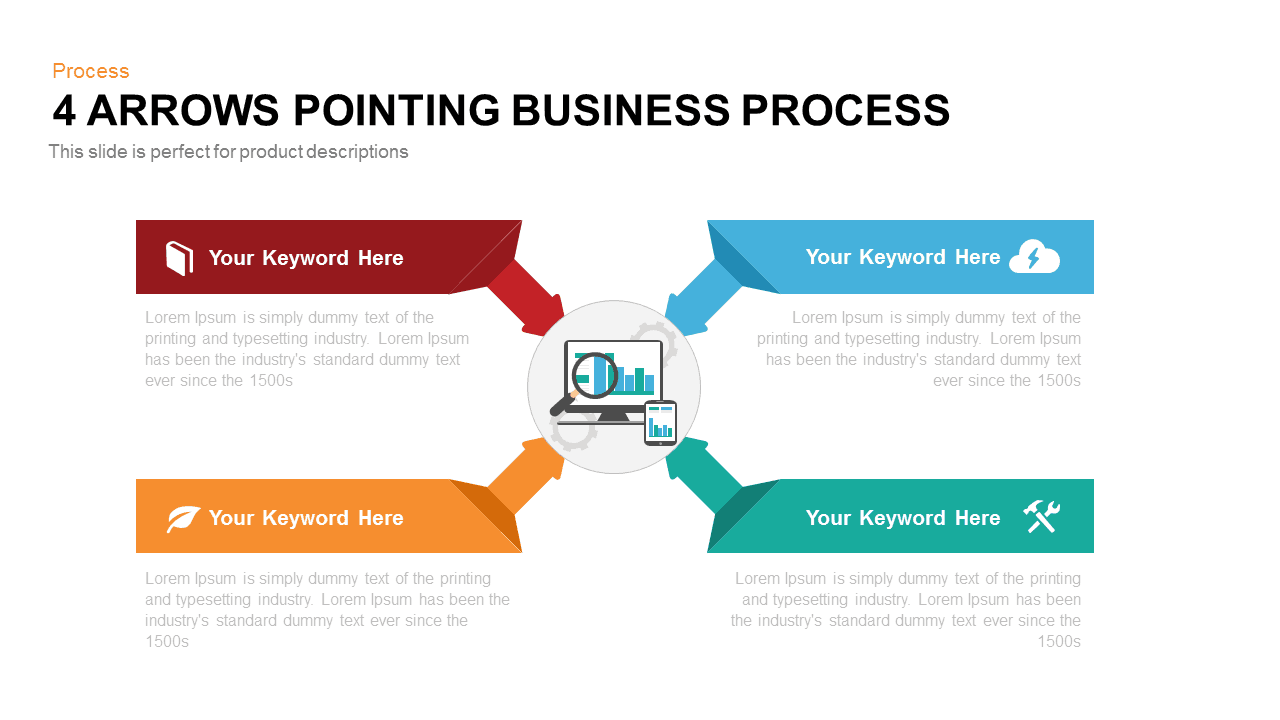
Four Arrows Business Process Diagram template for PowerPoint & Google Slides
Process
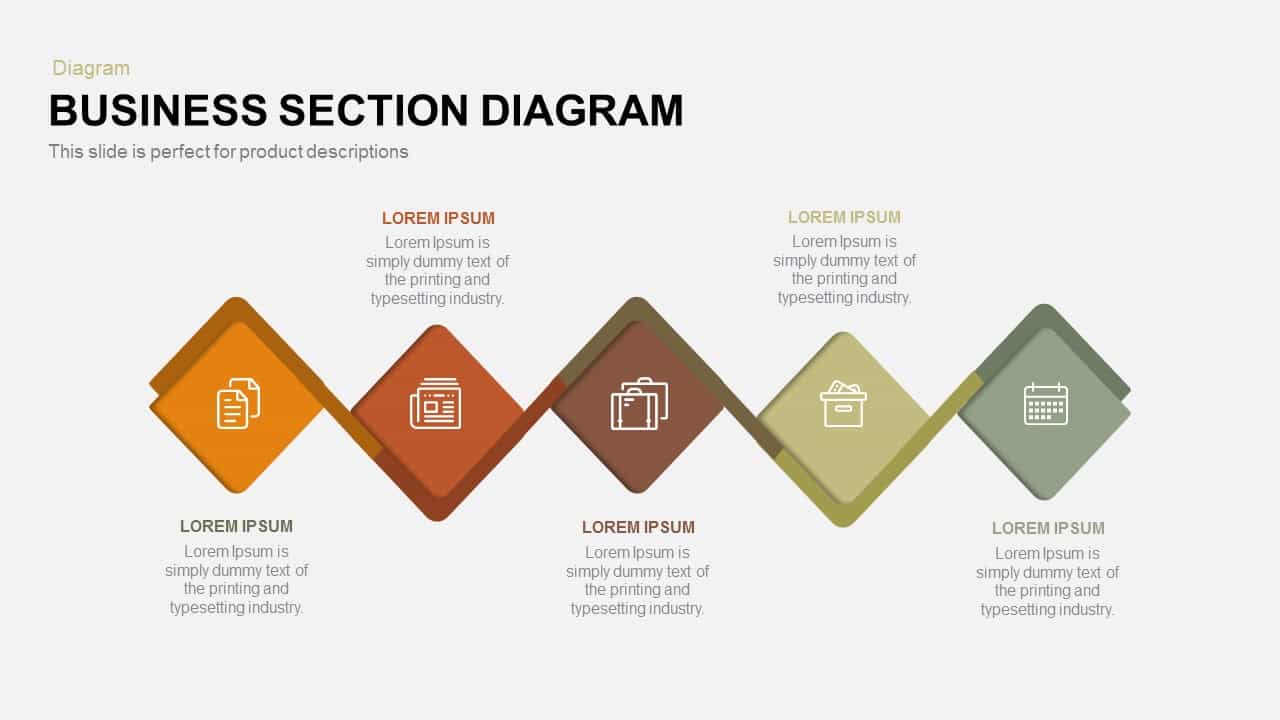
Business Section Diamond Process Diagram Template for PowerPoint & Google Slides
Process
Vertical Business Process Flow Diagram Template for PowerPoint & Google Slides
Process

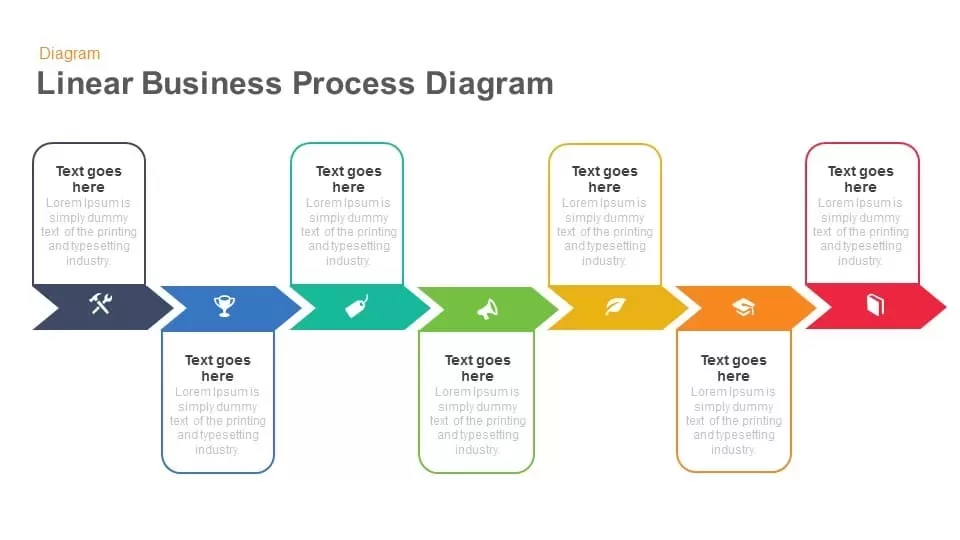
Linear Business Process Diagram template for PowerPoint & Google Slides
Process
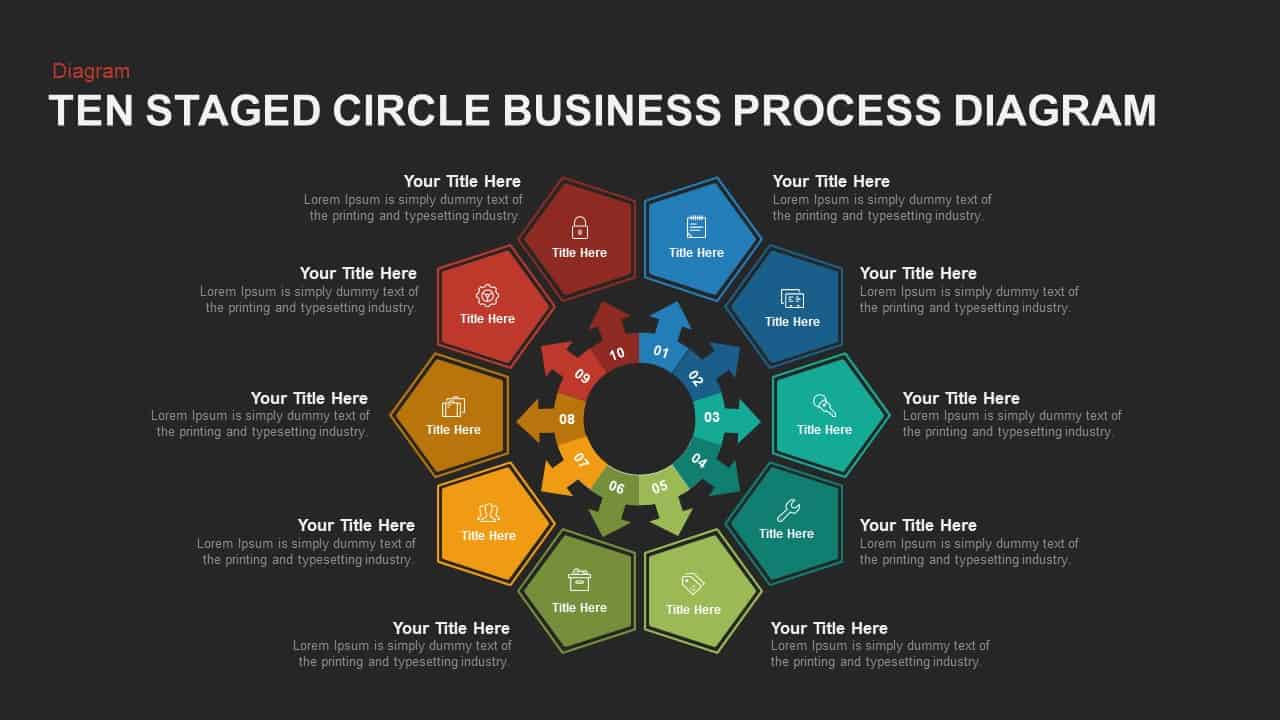
10 Stages Business Flow Process Diagram template for PowerPoint & Google Slides
Business
Ten-Stage Business Process Diagram Template for PowerPoint & Google Slides
Process
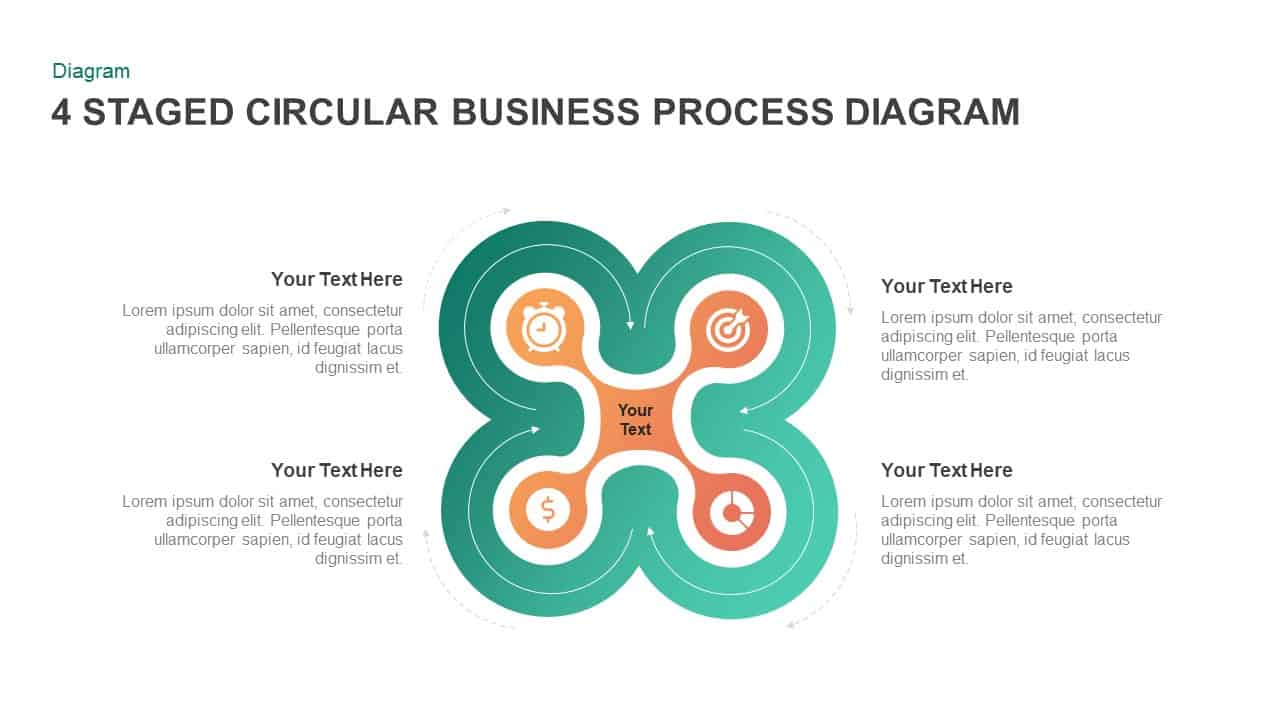
4 Staged Circular Business Process Diagram template for PowerPoint & Google Slides
Process

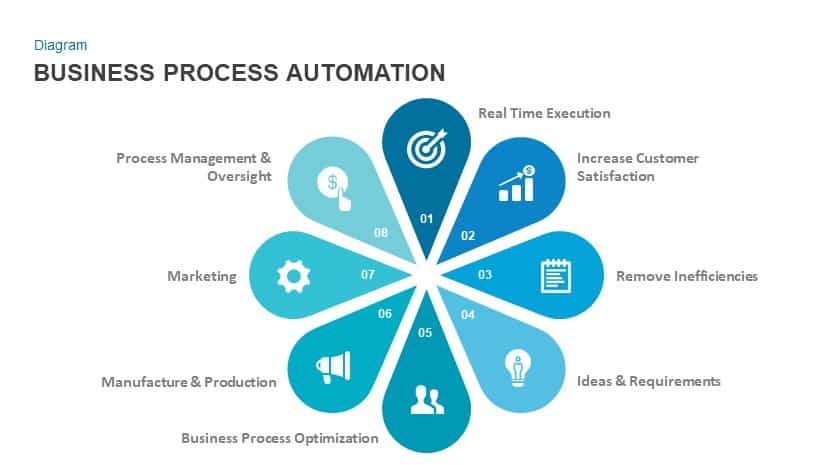
Business Process Automation Diagram Template for PowerPoint & Google Slides
Process
6-Step Business Process Flow Diagram Template for PowerPoint & Google Slides
Process
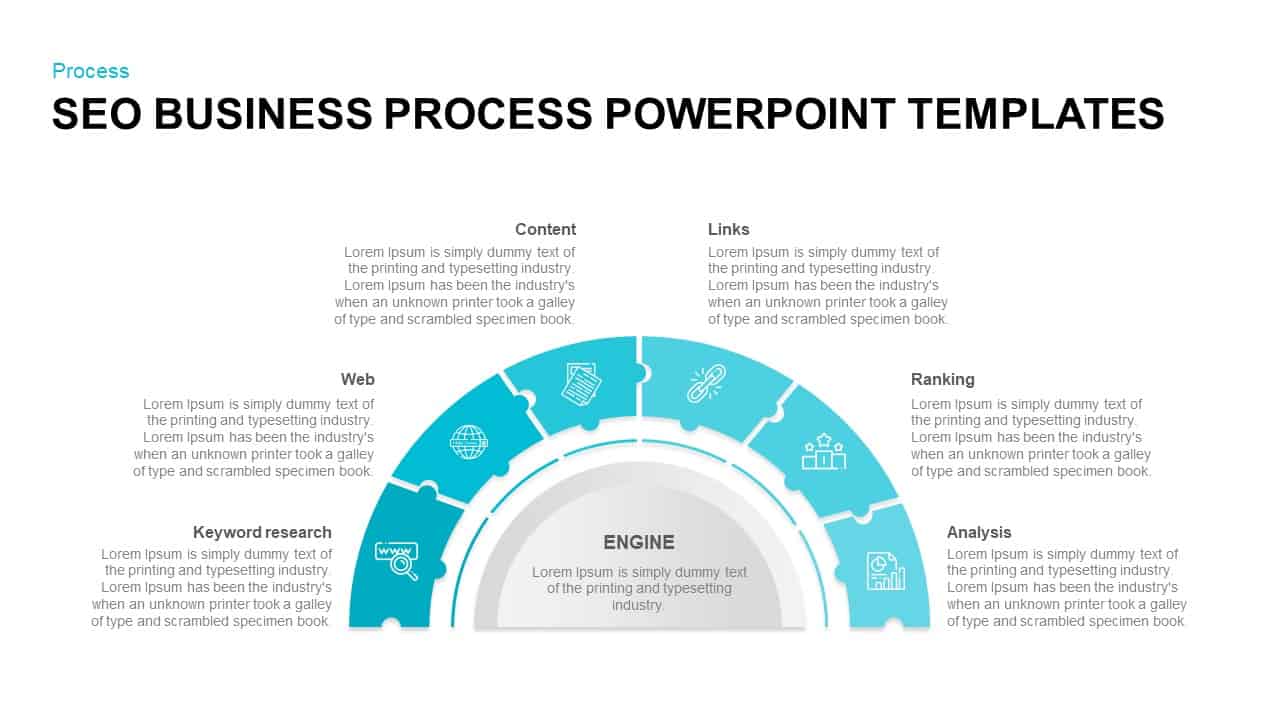
SEO Business Process Puzzle Diagram Template for PowerPoint & Google Slides
Process
Business Process Management Flow Diagram Template for PowerPoint & Google Slides
Process
Cloud Kitchen Business Process Diagram Template for PowerPoint & Google Slides
Process
Business Process Analysis Cycle Diagram Template for PowerPoint & Google Slides
Business Strategy
4 Staged Circular Business Process Diagram for PowerPoint & Google Slides
Process
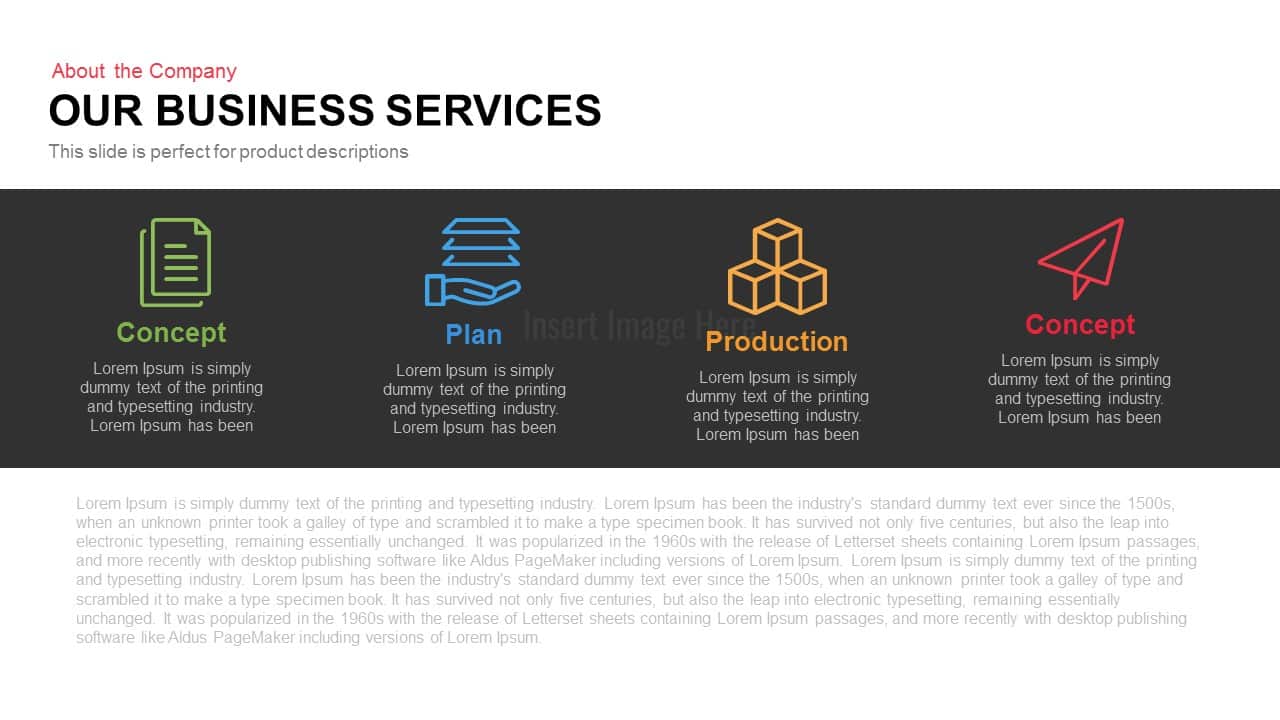
Business Services 4-Step Process Template for PowerPoint & Google Slides
Process
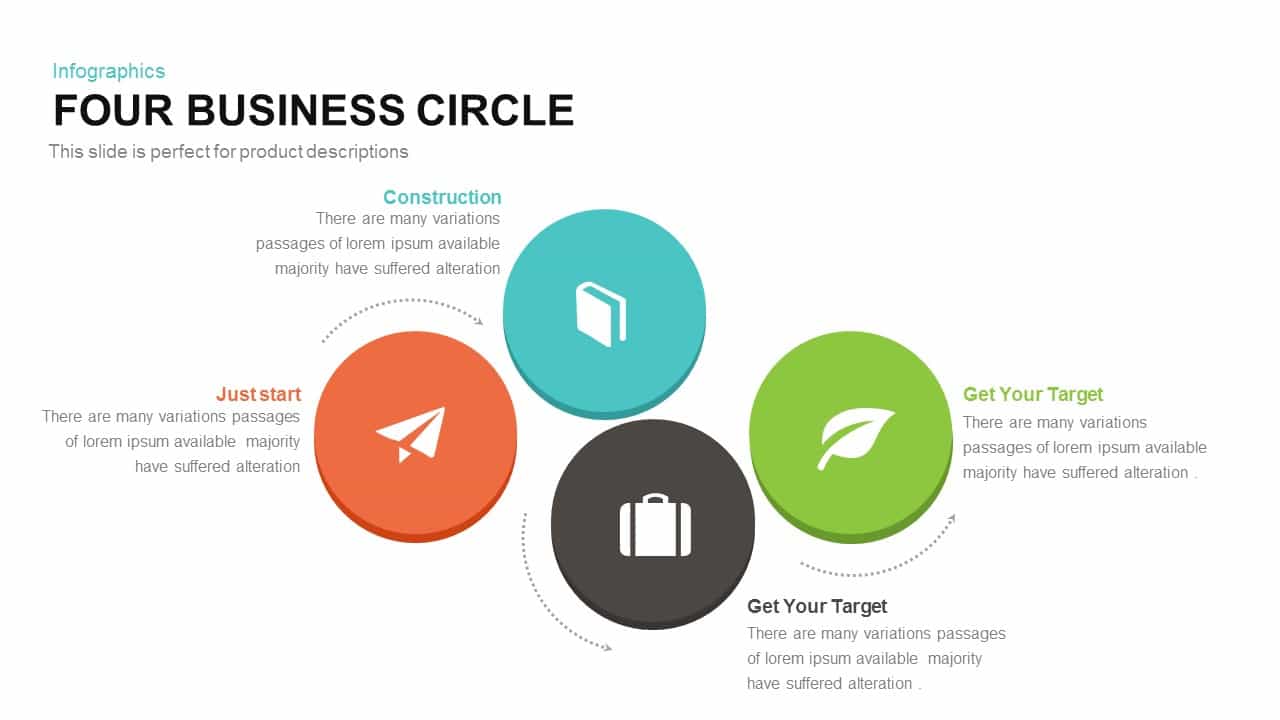
Four-Circle Business Process Infographic Template for PowerPoint & Google Slides
Circular
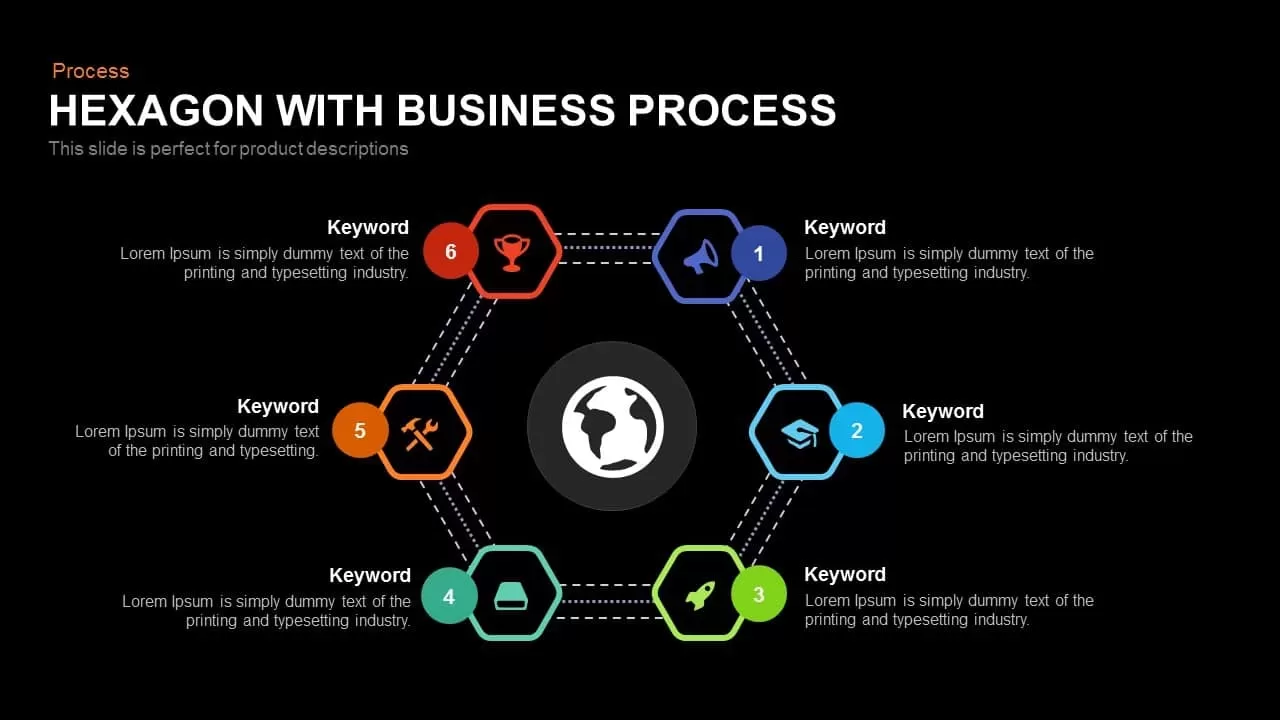
Global Hexagon Six-Step Business Process Template for PowerPoint & Google Slides
Process
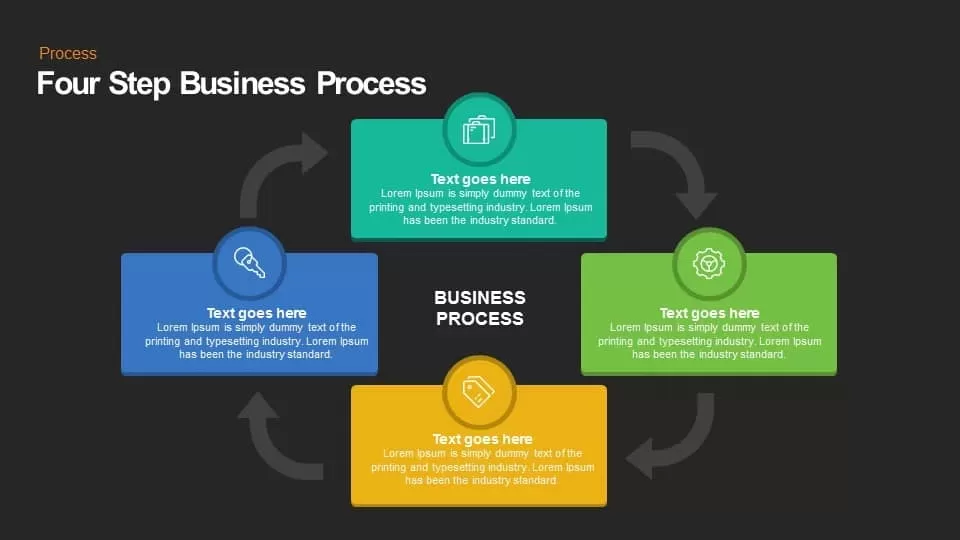
Four Step Business Process template for PowerPoint & Google Slides
Process
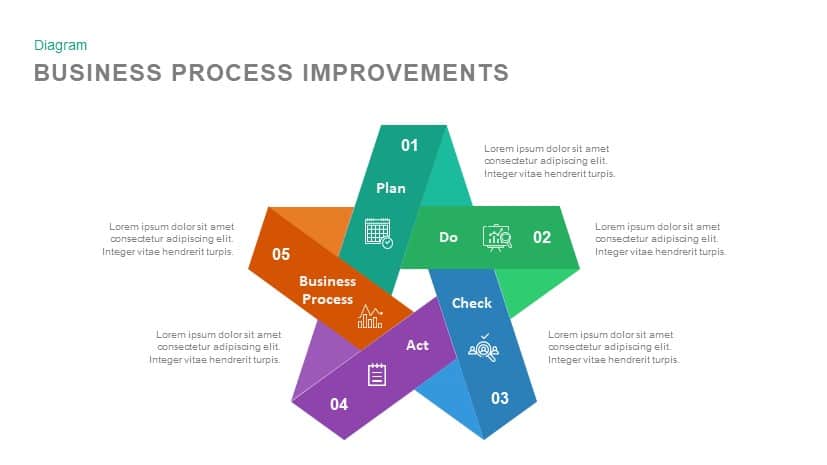
Business Process Improvements template for PowerPoint & Google Slides
Process
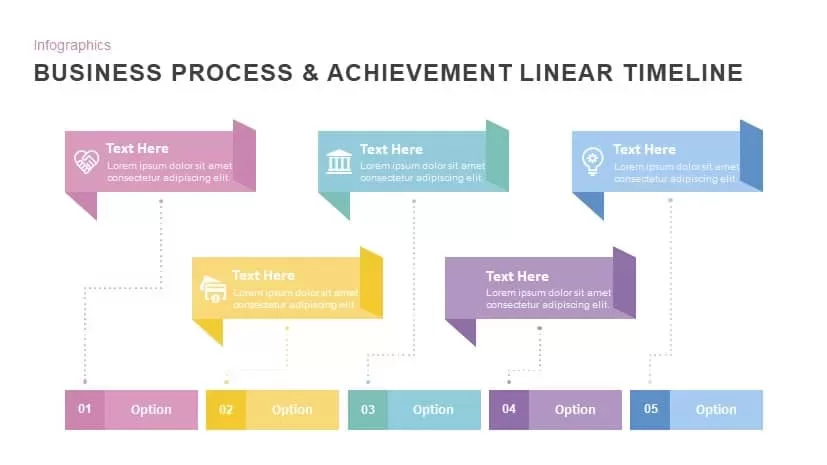
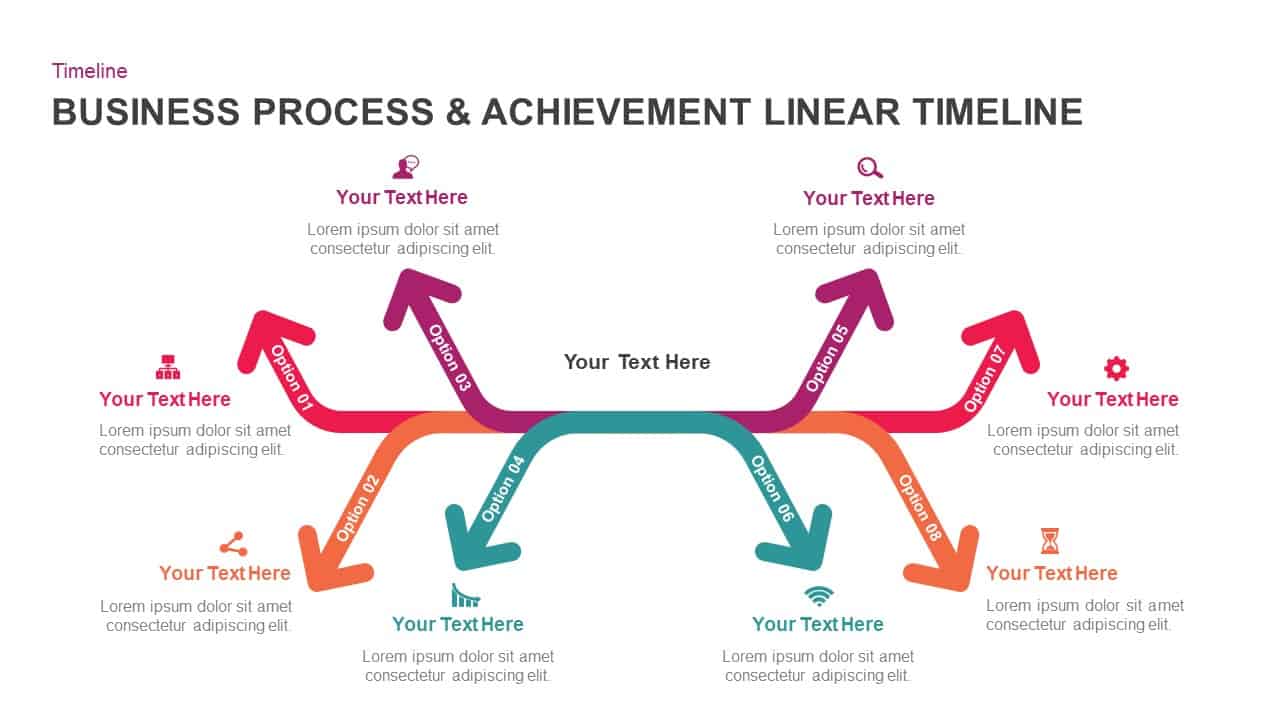
Business Process & Achievement Linear Timeline template for PowerPoint & Google Slides
Timeline
Business Process Improvement Cycle Template for PowerPoint & Google Slides
Process
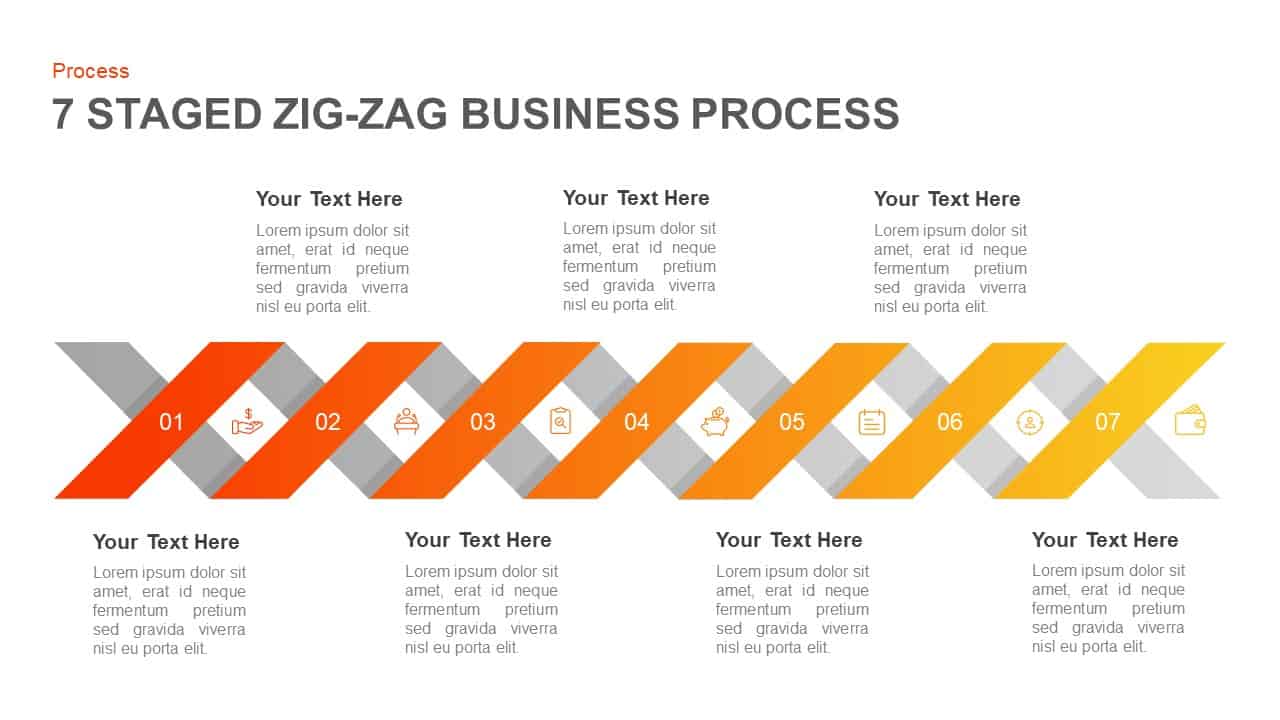
7-Stage Zig-Zag Business Process Template for PowerPoint & Google Slides
Process
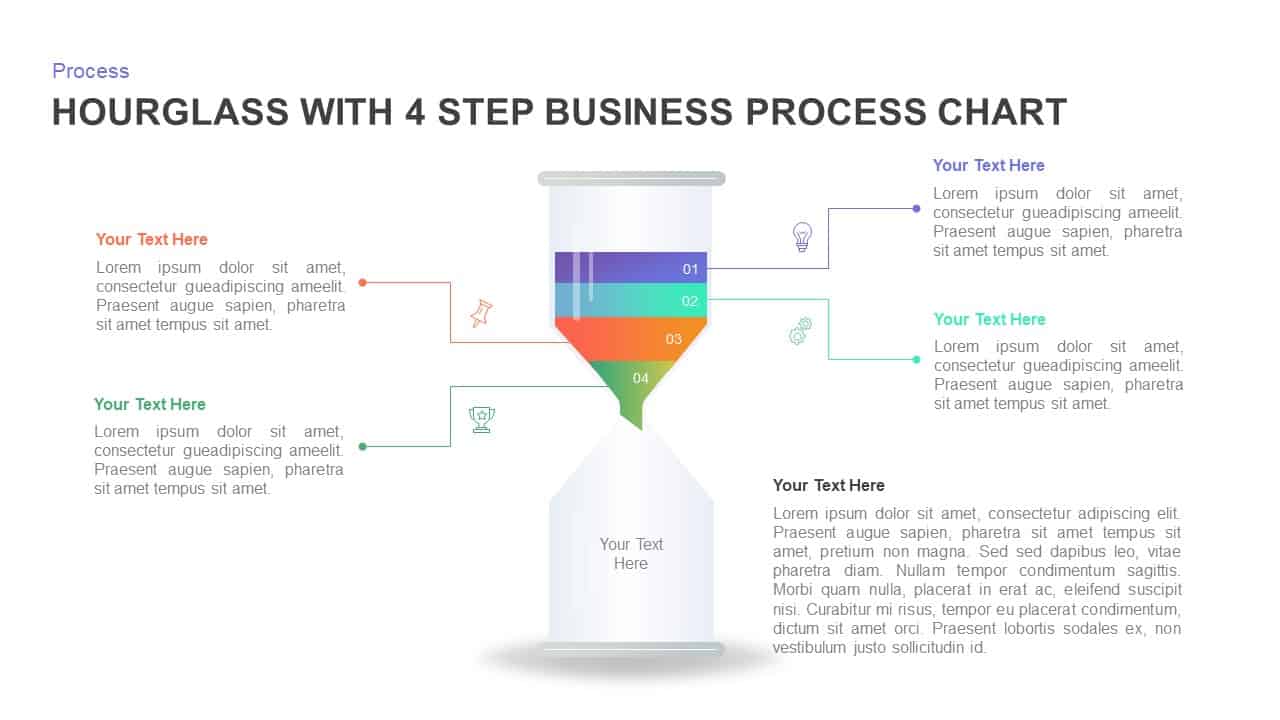
Four-Step Hourglass Business Process Template for PowerPoint & Google Slides
Process
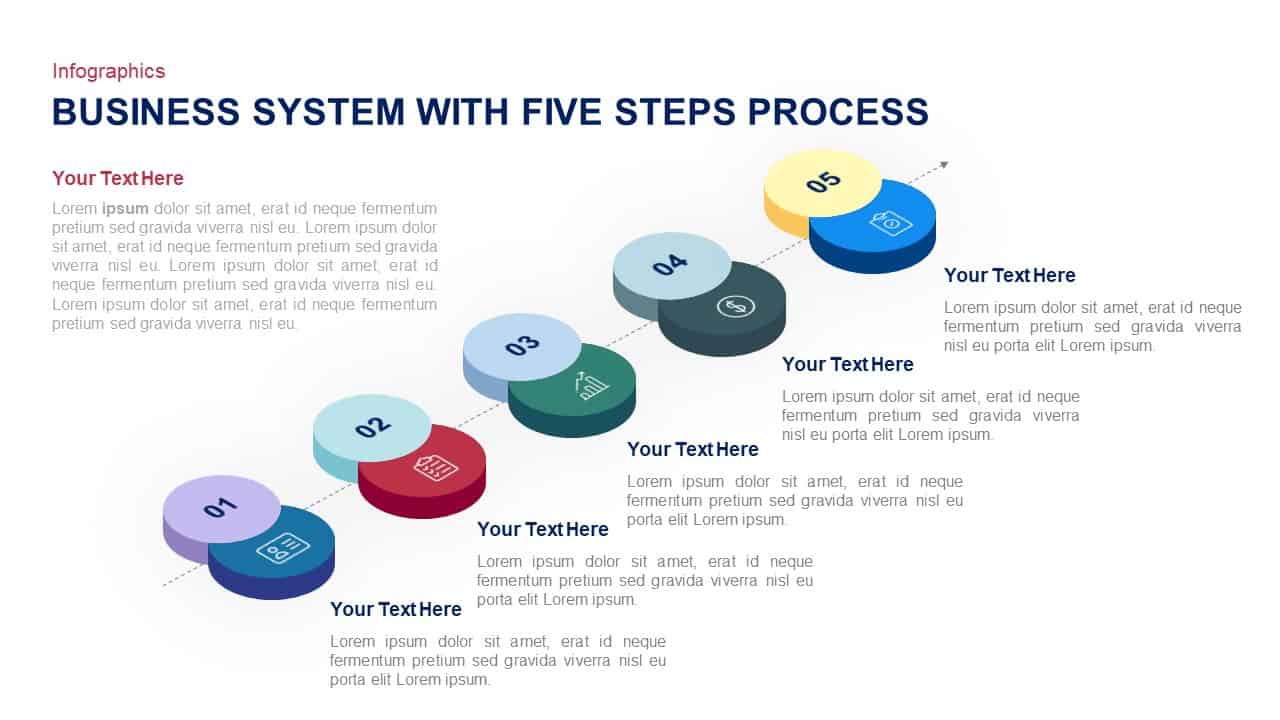
Business System Five-Step Process Template for PowerPoint & Google Slides
Process
Business Process Improvement Cycle Template for PowerPoint & Google Slides
Circular
Business Process Achievement Timeline Template for PowerPoint & Google Slides
Timeline
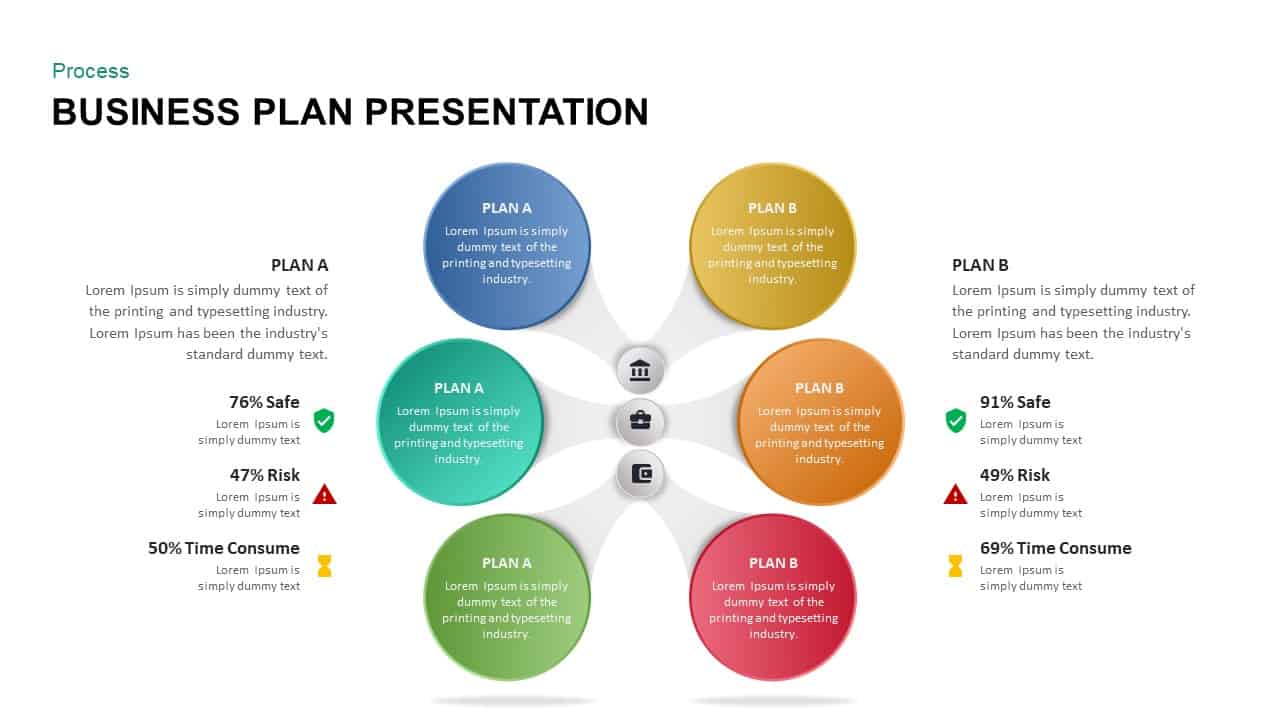
Business Plan Presentation Process template for PowerPoint & Google Slides
Business Plan
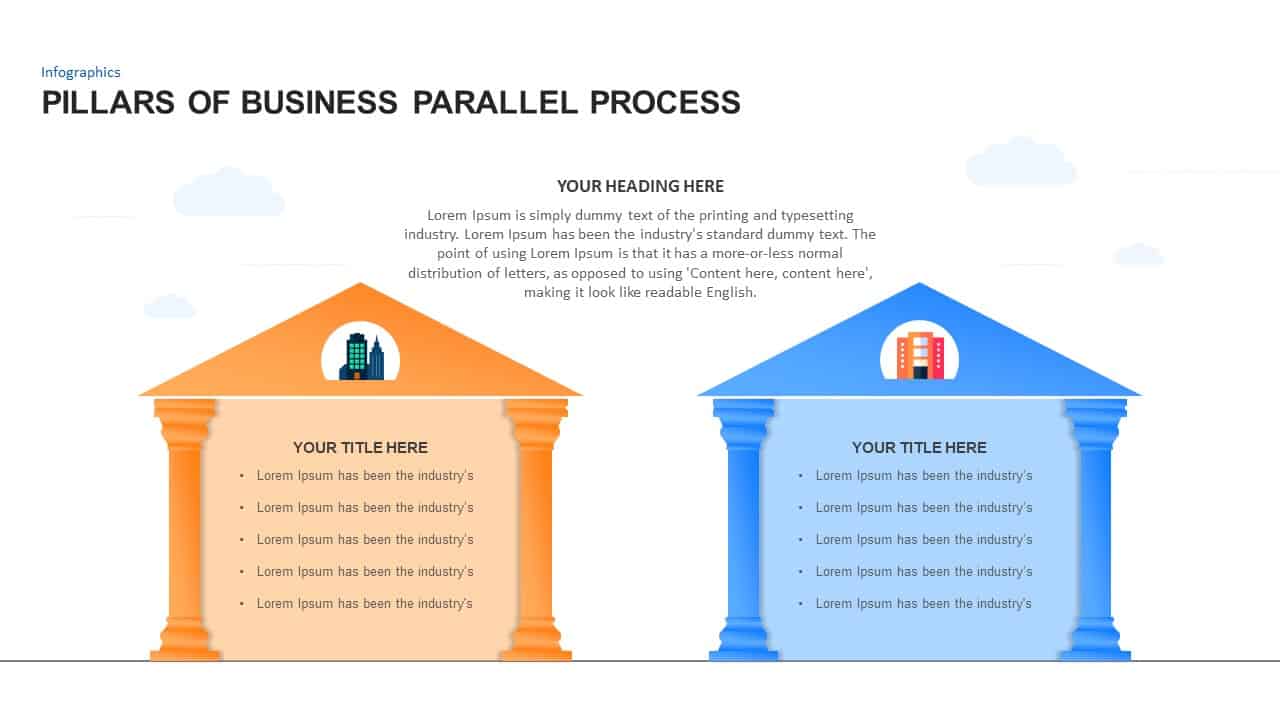
Pillars of Business Parallel Process template for PowerPoint & Google Slides
Process
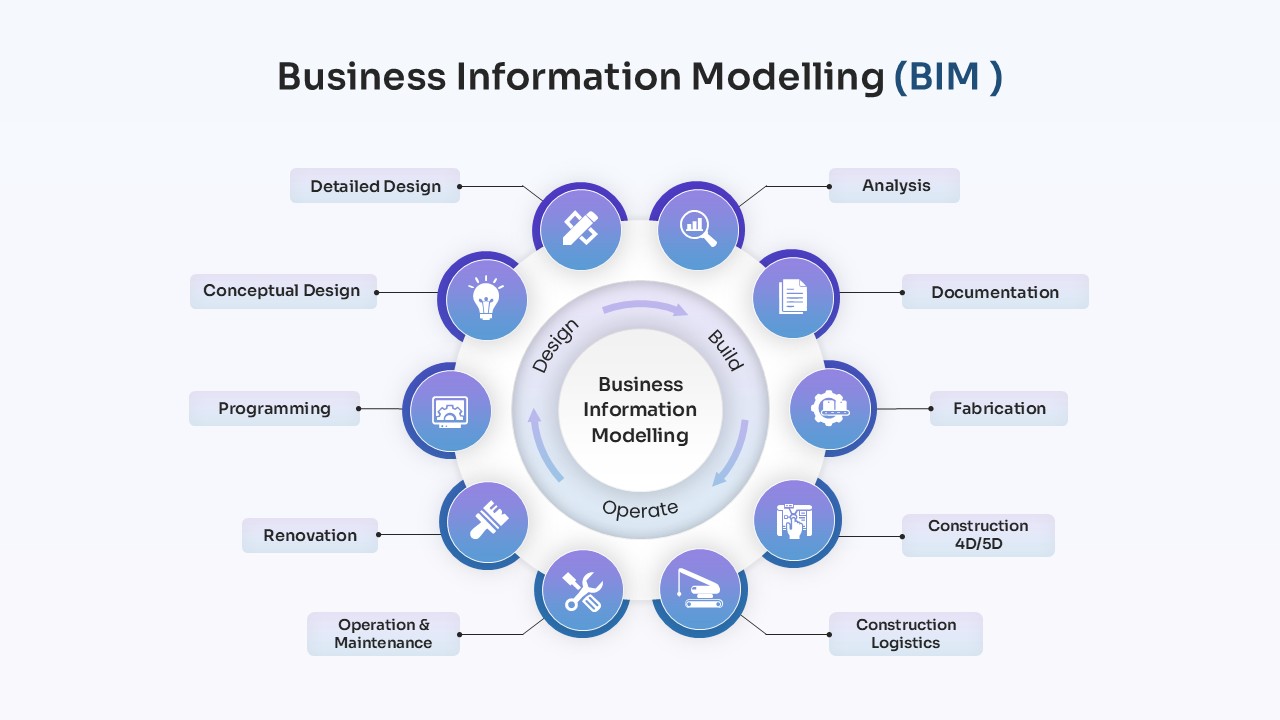
Business Information Modelling Process Template for PowerPoint & Google Slides
Process
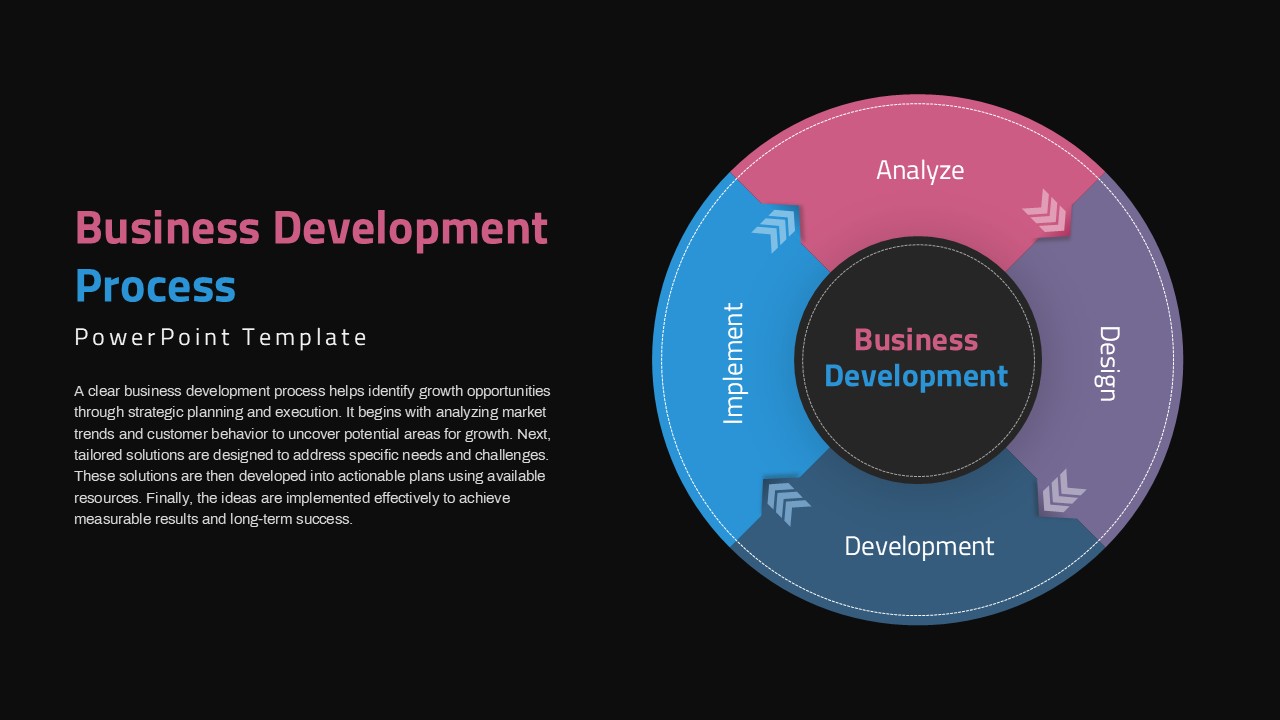
Circular Business Development Process Template for PowerPoint & Google Slides
Process
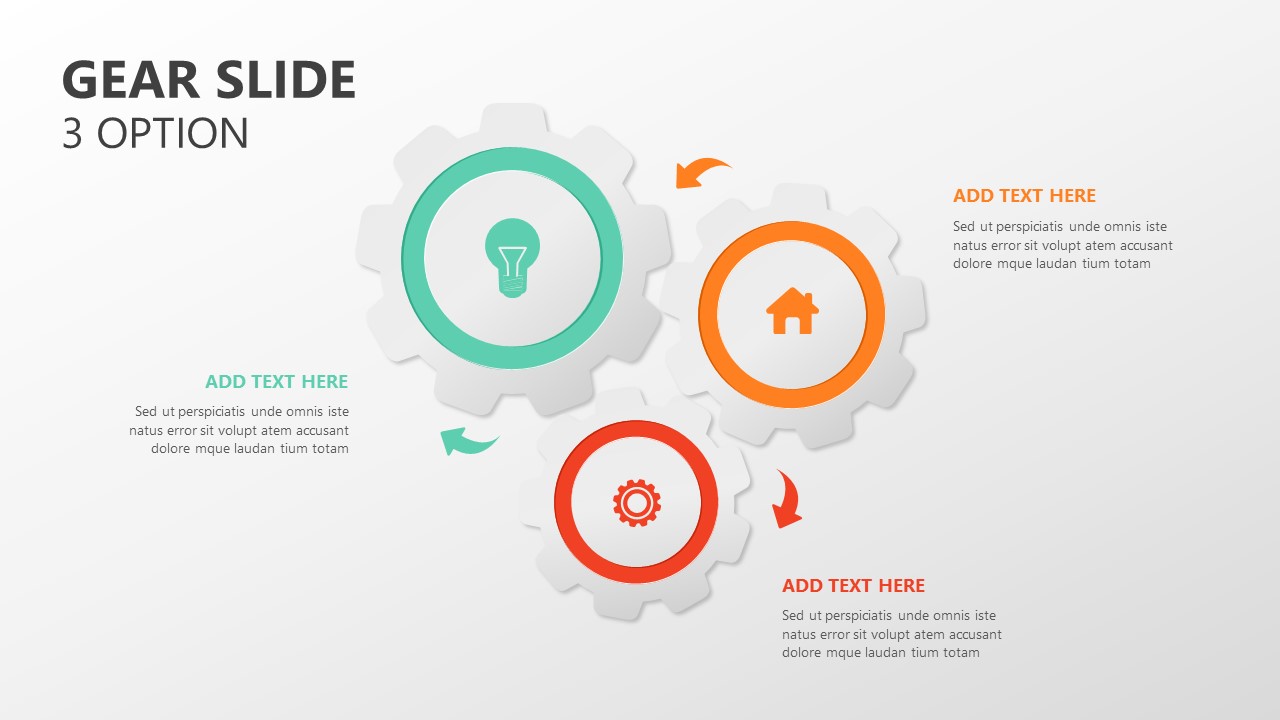
Gear Process Diagram PowerPoint Template for PowerPoint & Google Slides
Process
Sales Process Workflow Funnel Diagram PowerPoint Template for PowerPoint & Google Slides
Funnel
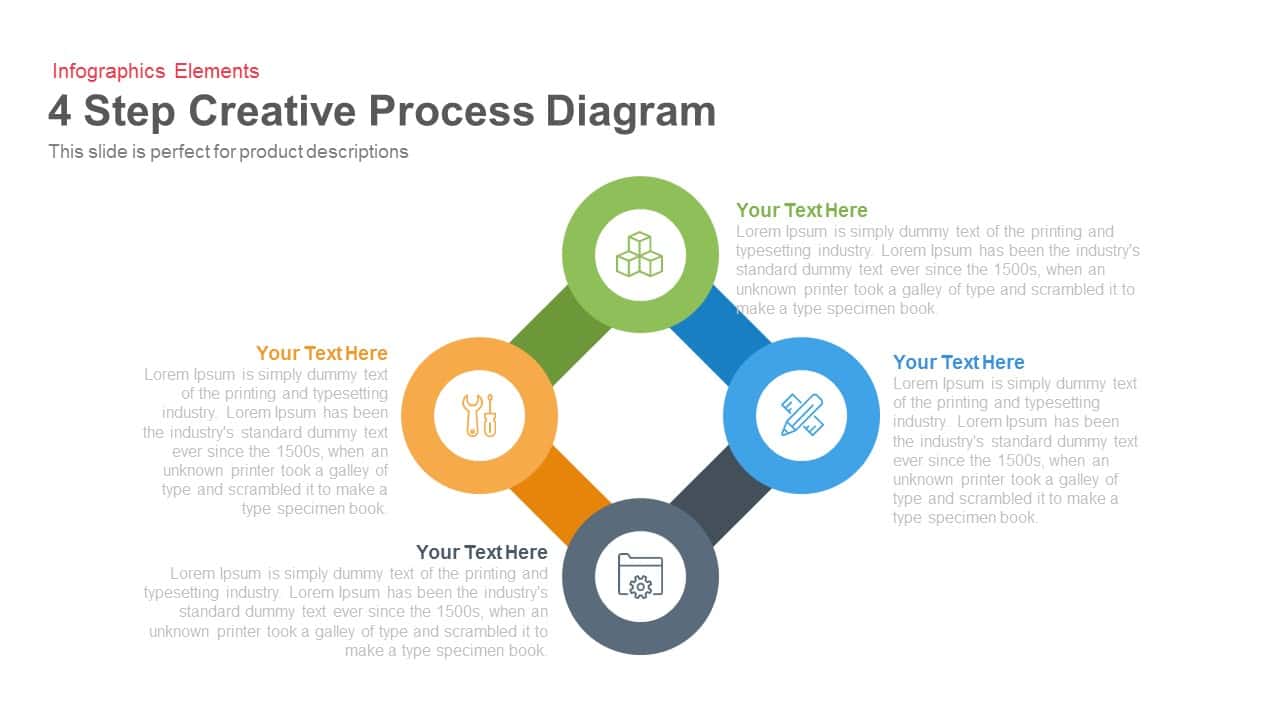
4 Step Creative Process Diagram Template for PowerPoint & Google Slides
Infographics
4 Section Pipe Diagram Process Flow Template for PowerPoint & Google Slides
Process
Dynamic Shield Process Flow Diagram template for PowerPoint & Google Slides
Process
Six Arrow Radial Process Diagram template for PowerPoint & Google Slides
Infographics
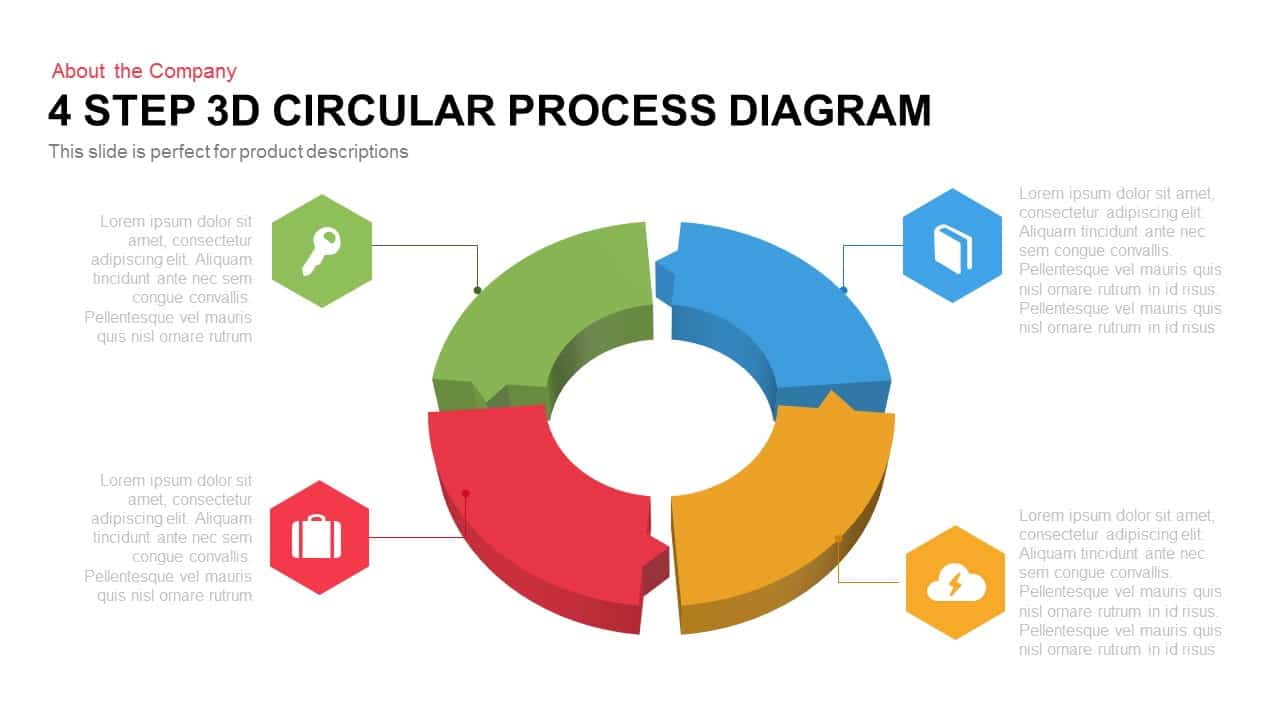
4 Step 3D Circular Process Diagram template for PowerPoint & Google Slides
Process
Three-Section Fishbone Process Diagram template for PowerPoint & Google Slides
Process
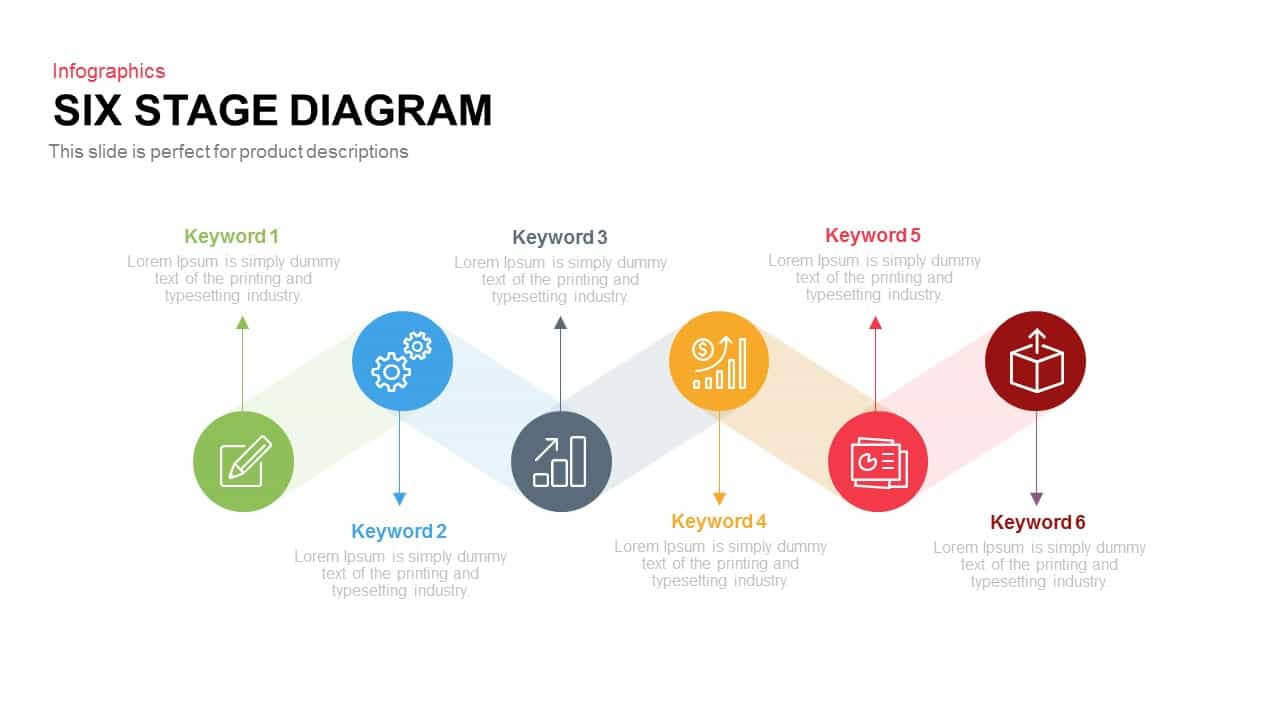
Six Stage Zigzag Process Diagram Template for PowerPoint & Google Slides
Process

15-Step Process Flow Diagram Template for PowerPoint & Google Slides
Process
Roadmap Six-Step Process Diagram Template for PowerPoint & Google Slides
Roadmap
3 Stage Section Process Diagram Template for PowerPoint & Google Slides
Process
Four-Circle Venn Process Diagram template for PowerPoint & Google Slides
Process
5 Stage Process Diagram Slide Overview Template for PowerPoint & Google Slides
Process
SIPOC Diagram with Process Breakdown Template for PowerPoint & Google Slides
Process
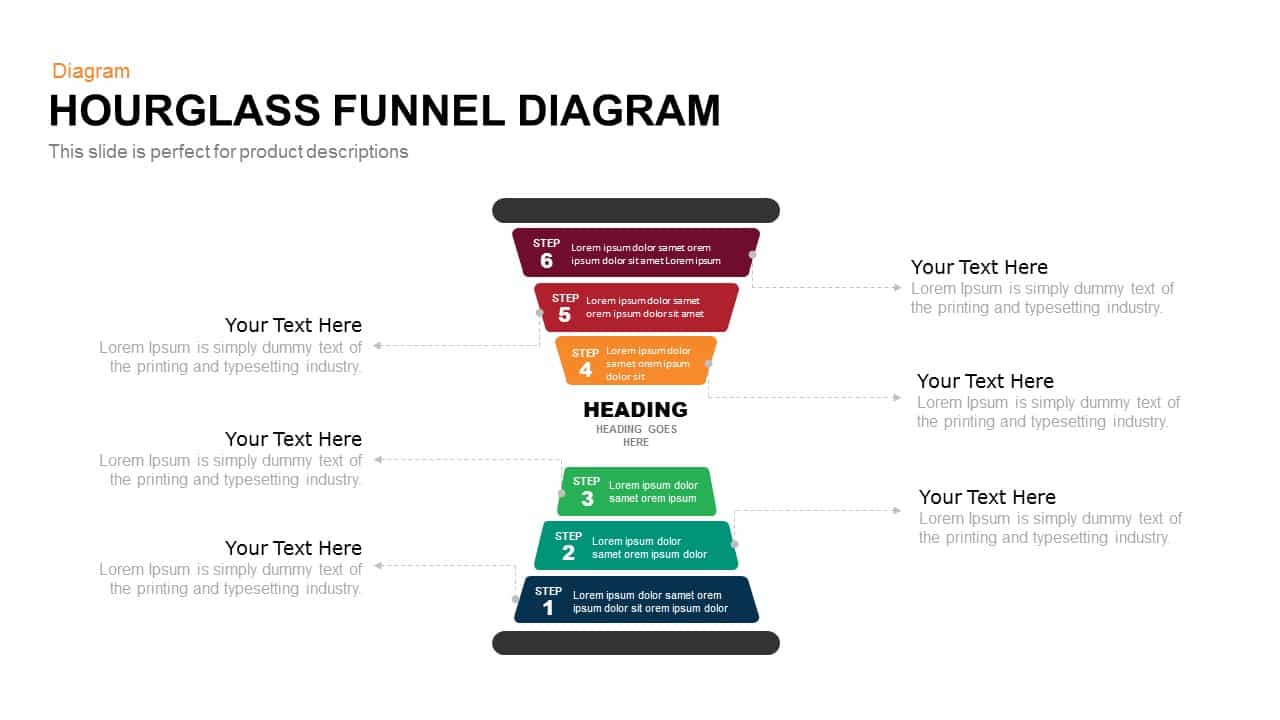
Hourglass Funnel Diagram Process Template for PowerPoint & Google Slides
Funnel
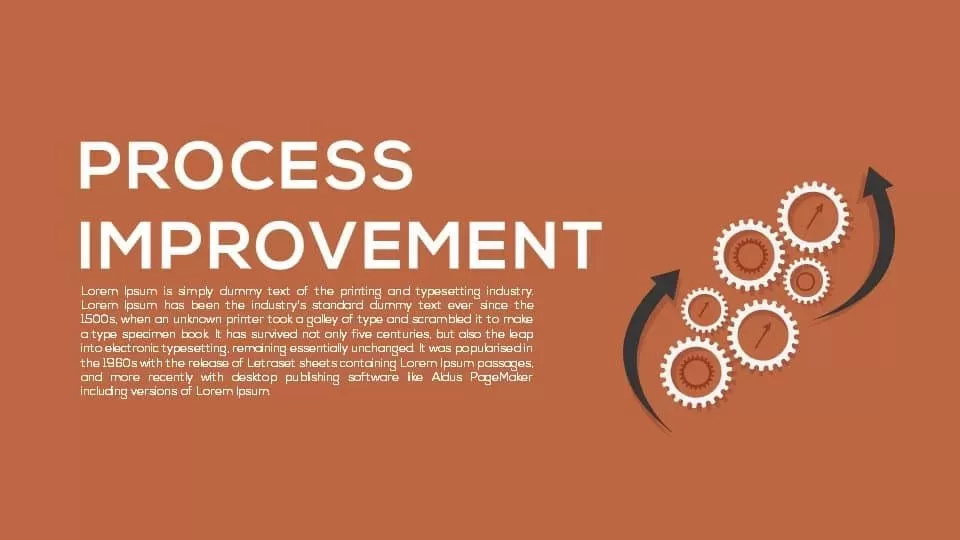
Process Improvement Metaphor Diagram Template for PowerPoint & Google Slides
Process
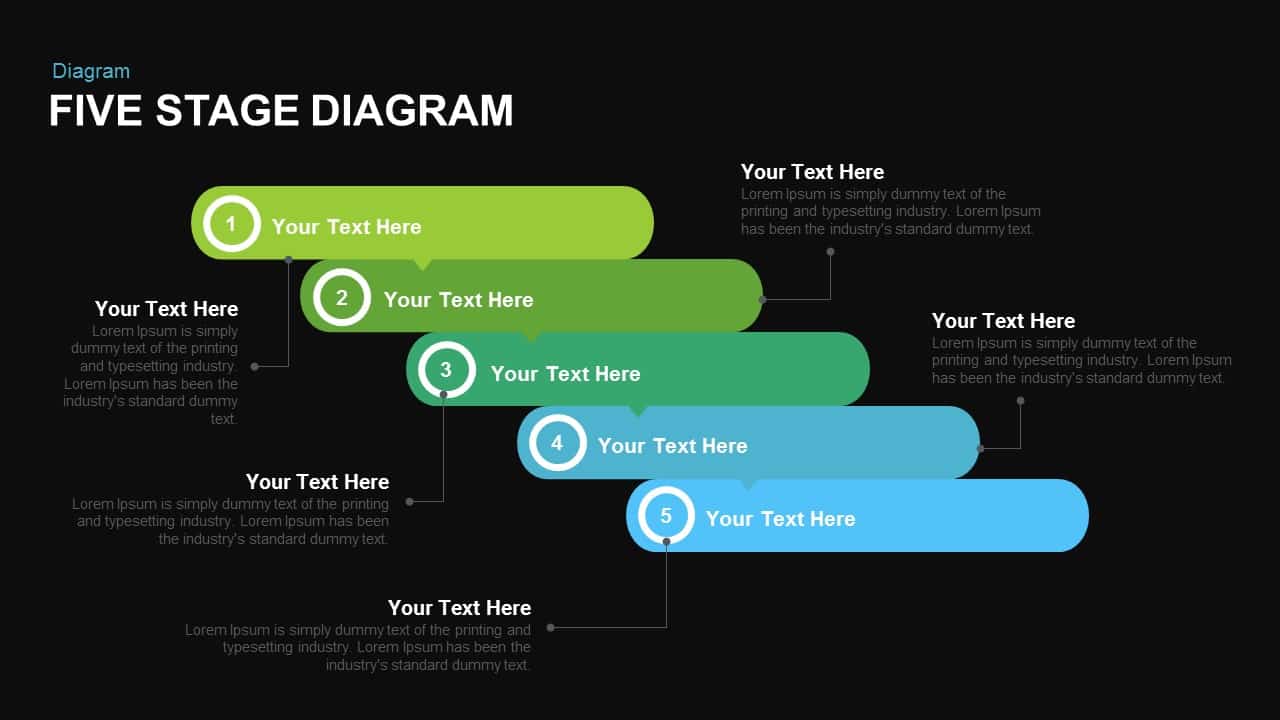
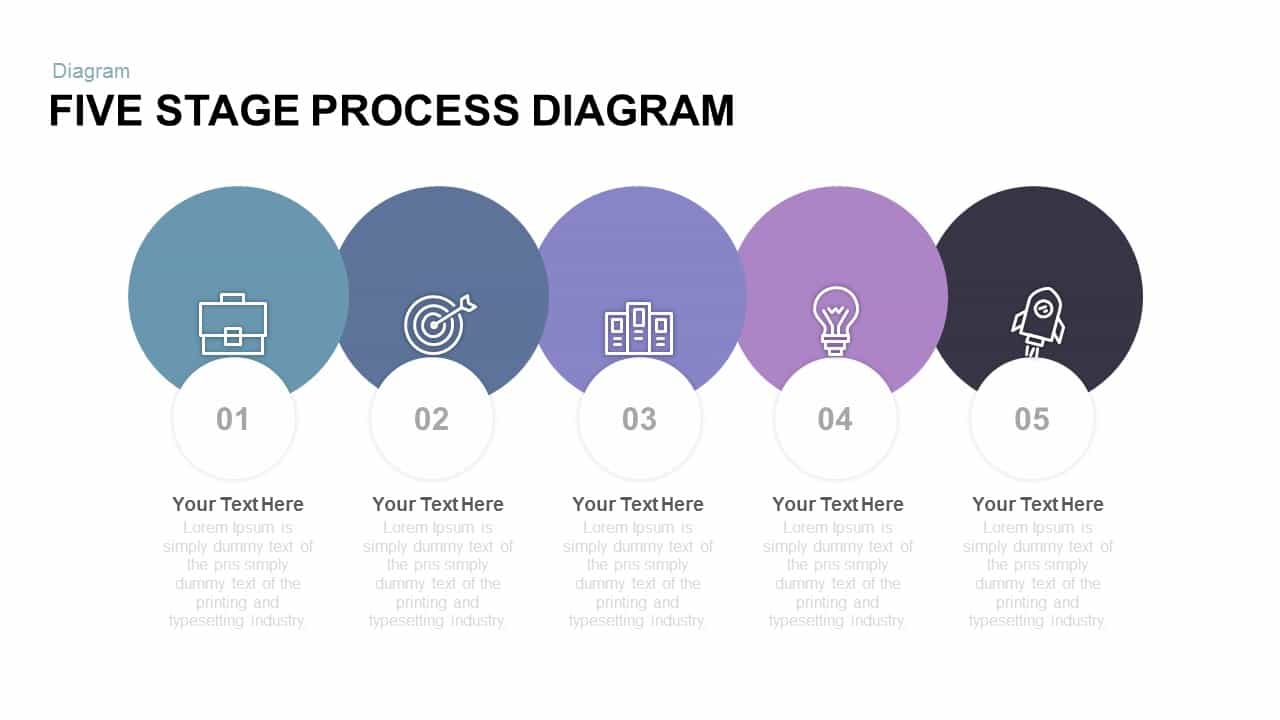
Engaging Five-Stage Process Diagram Template for PowerPoint & Google Slides
Process
8 Steps Arrow Process Diagram template for PowerPoint & Google Slides
Process
Five Stage Process Diagram template for PowerPoint & Google Slides
Process
Free

Five-Stage Cyclic Process Arrow Diagram Template for PowerPoint & Google Slides
Process
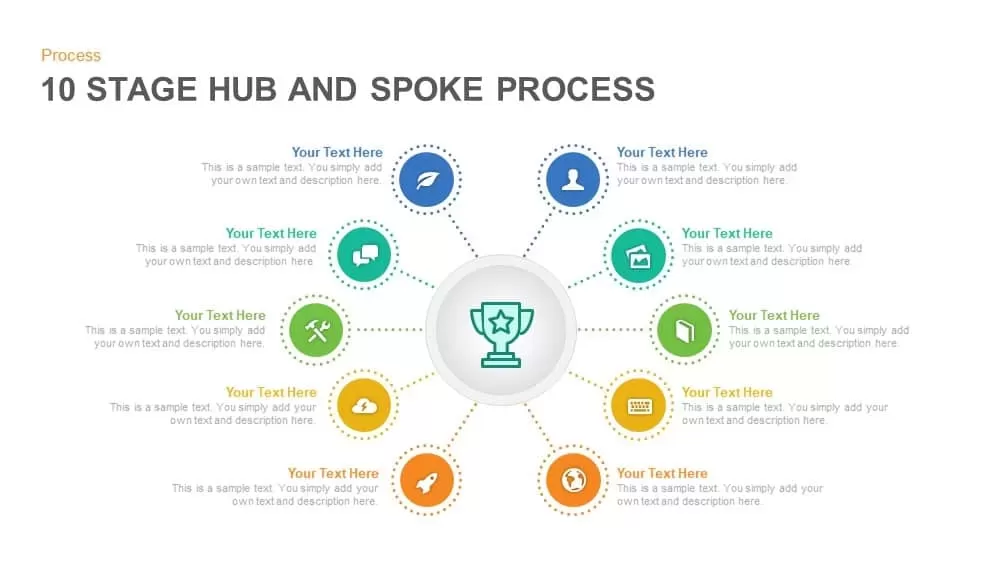
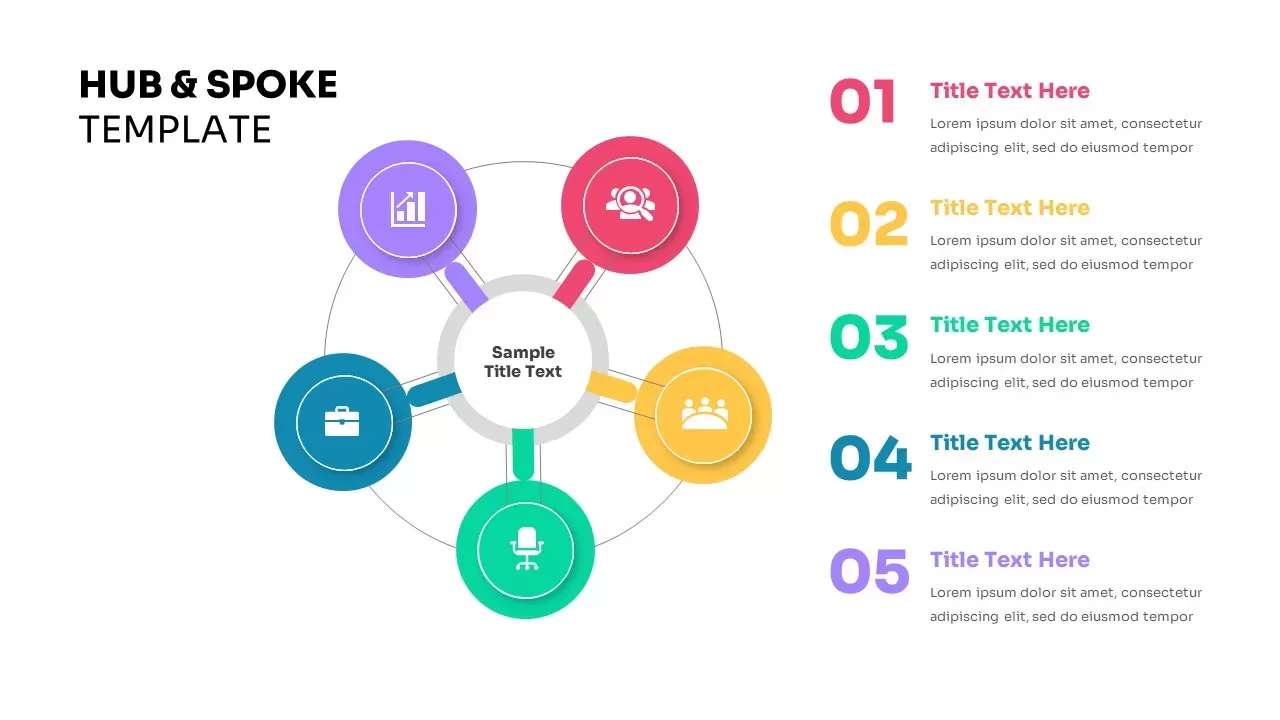
Ten-Stage Hub and Spoke Process Diagram Template for PowerPoint & Google Slides
Process
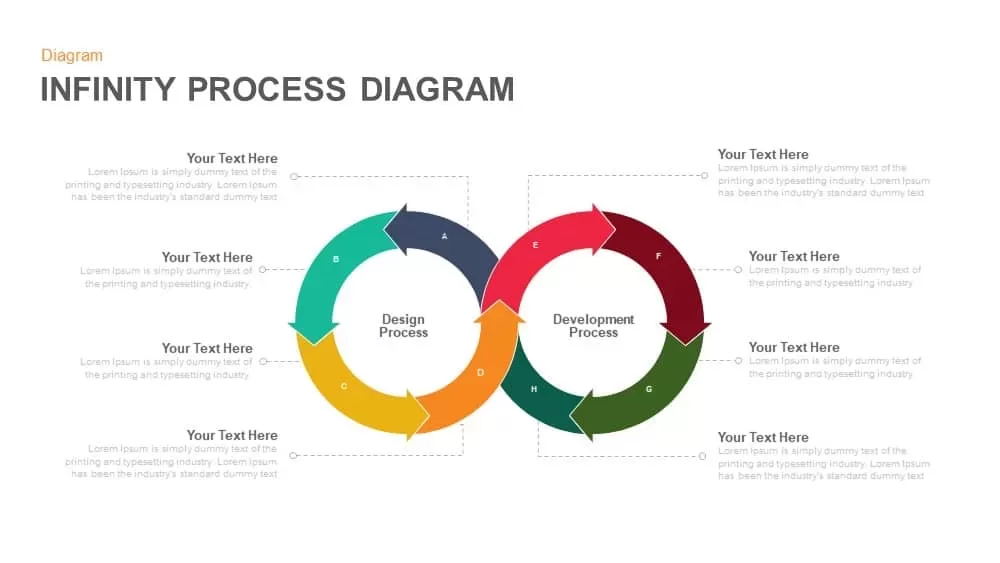
Infinity Process Diagram Template for PowerPoint & Google Slides
Process
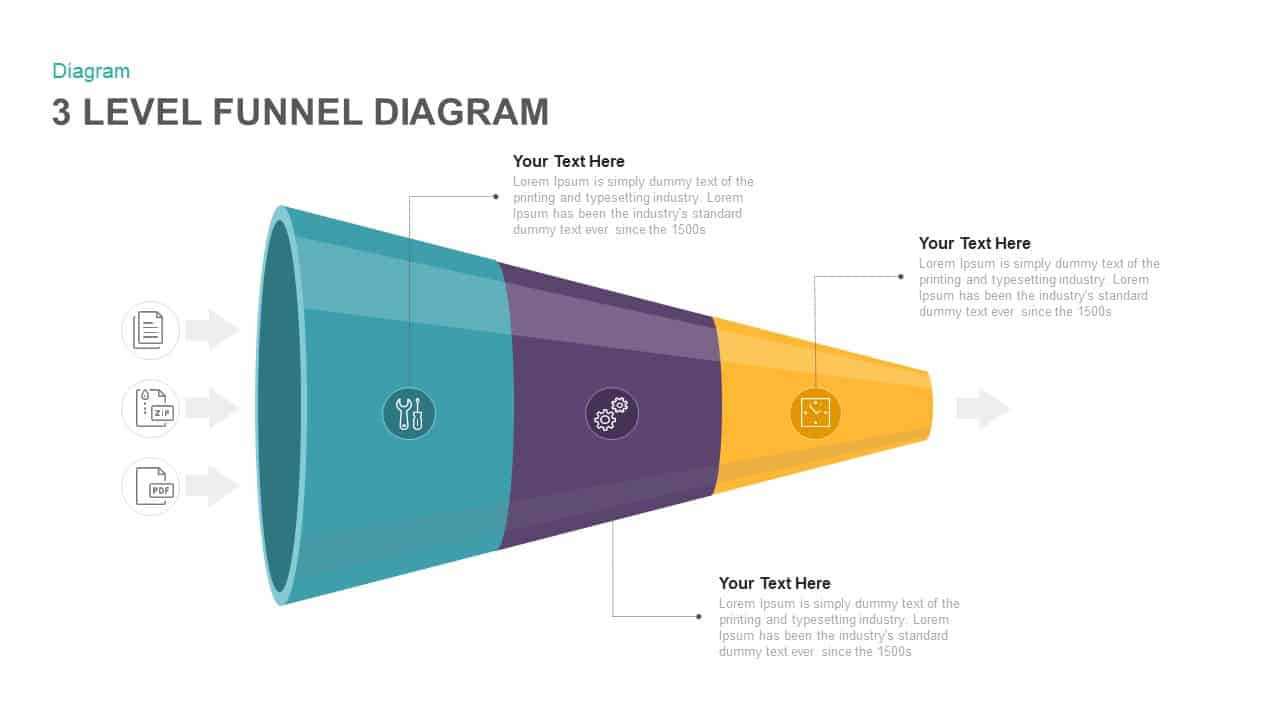
Three Level Funnel Process Diagram Template for PowerPoint & Google Slides
Funnel
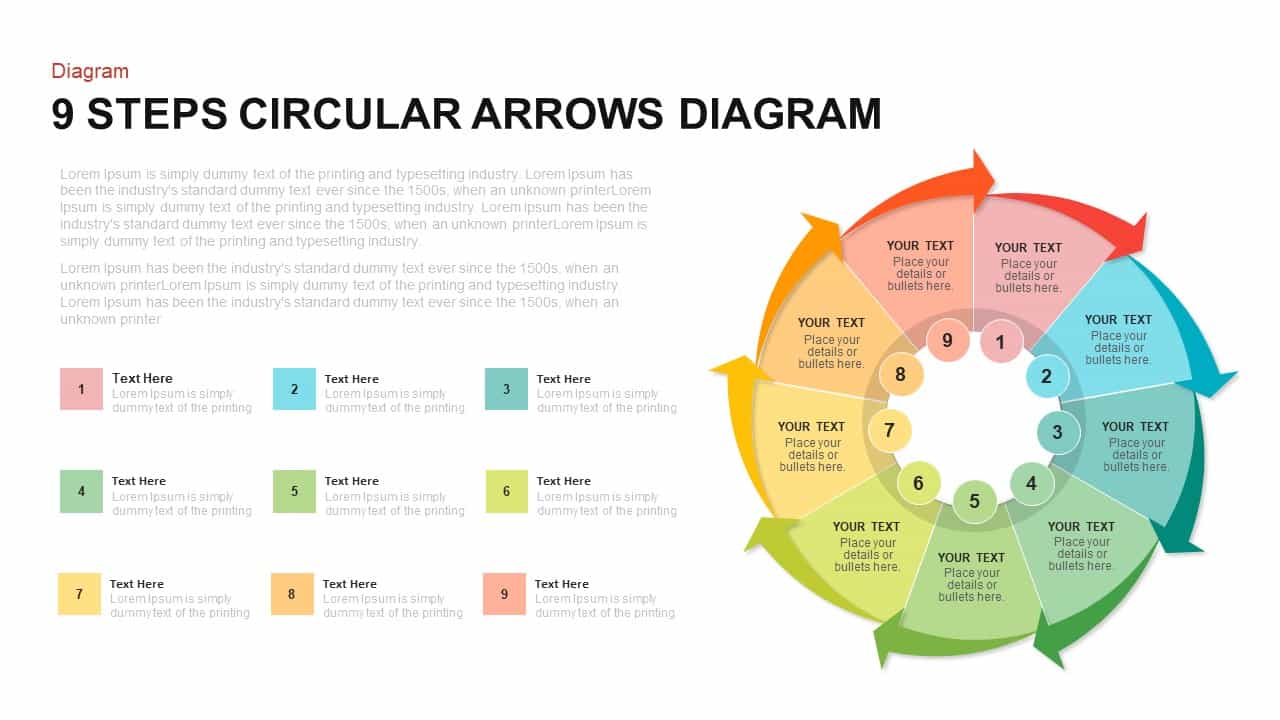
9-Step Circular Arrows Process Diagram Template for PowerPoint & Google Slides
Process
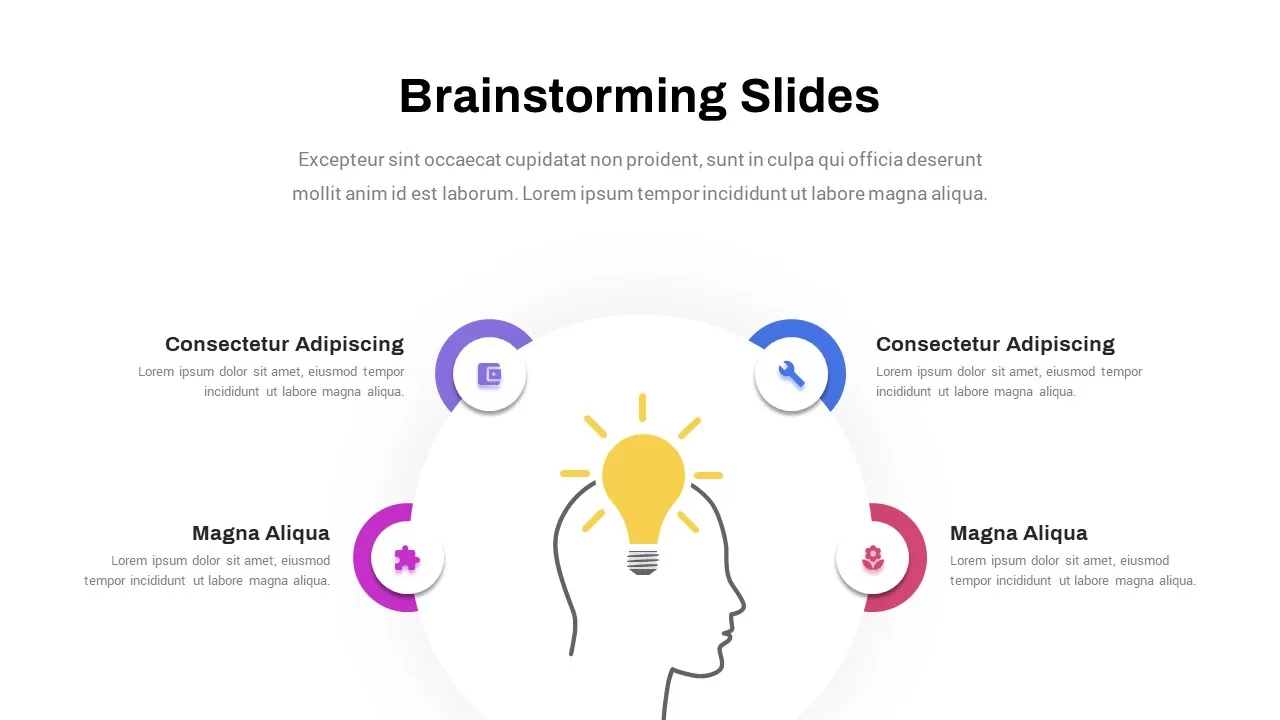
Eight-Step Brainstorming Process Diagram Template for PowerPoint & Google Slides
Process
Five Stage Linear Process Flow Diagram Template for PowerPoint & Google Slides
Process
Five-Stage Circular Process Diagram Template for PowerPoint & Google Slides
Circular
Four-Stage Gear Process Diagram Template for PowerPoint & Google Slides
Process
Six Stage Hexagon Process Diagram Template for PowerPoint & Google Slides
Process
Six-Stage Infinity Loop Process Diagram Template for PowerPoint & Google Slides
Process
5-Stage Gear Process Flow Diagram Template for PowerPoint & Google Slides
Process
Four-Stage Linear Process Flow Diagram Template for PowerPoint & Google Slides
Process
5-Stage Linear Process Flow Diagram Template for PowerPoint & Google Slides
Process
Five-Stage Process Flow Diagram Template for PowerPoint & Google Slides
Process
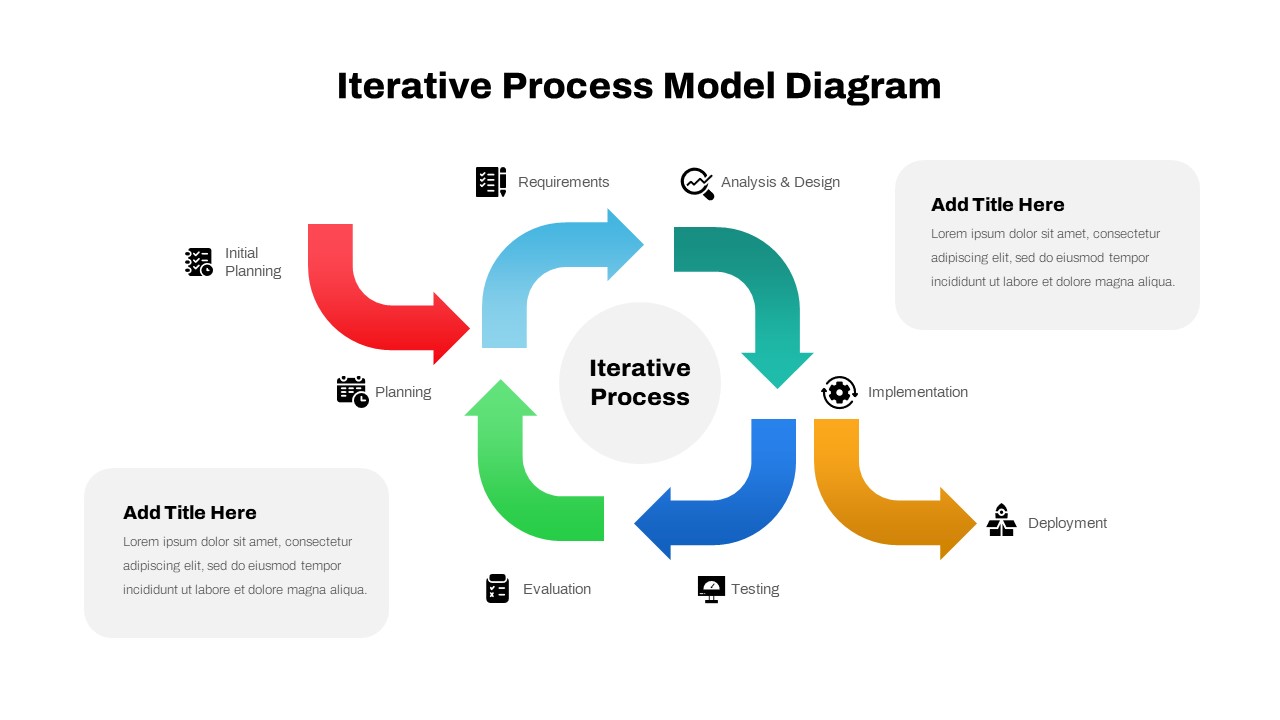
Iterative Process Model Diagram Template for PowerPoint & Google Slides
Process
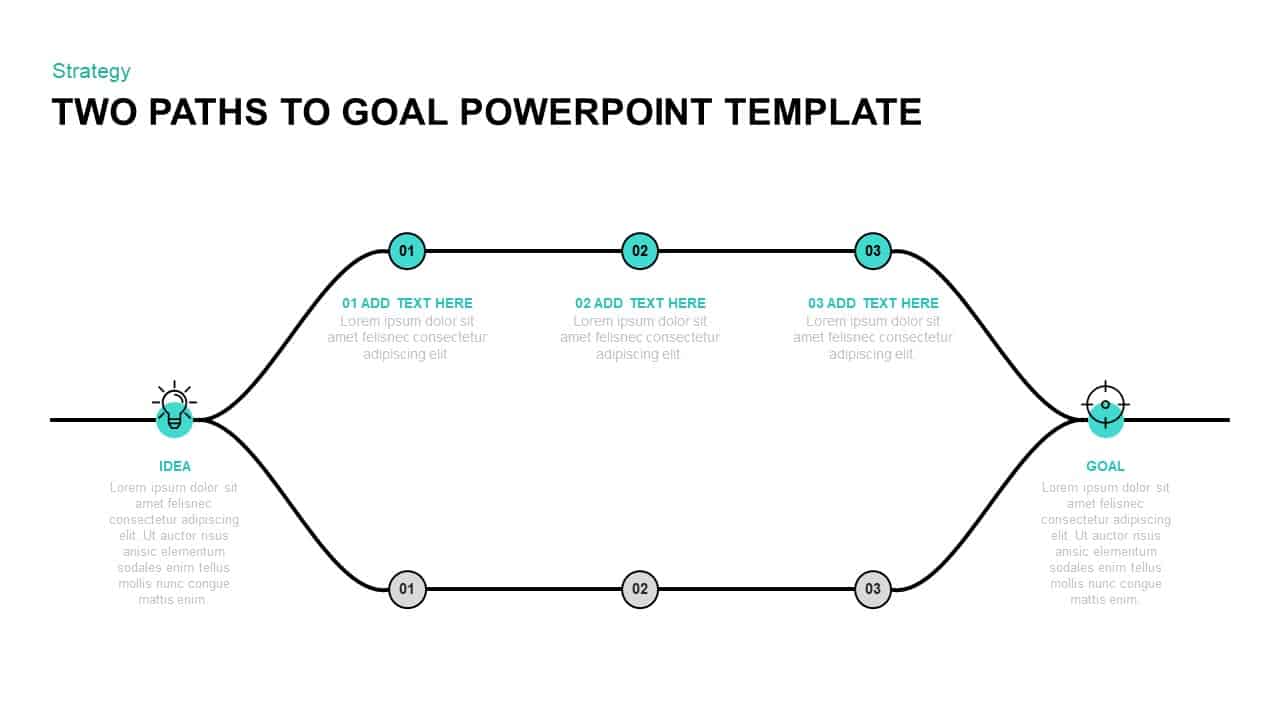
Two-Path Idea-to-Goal Process Diagram Template for PowerPoint & Google Slides
Infographics
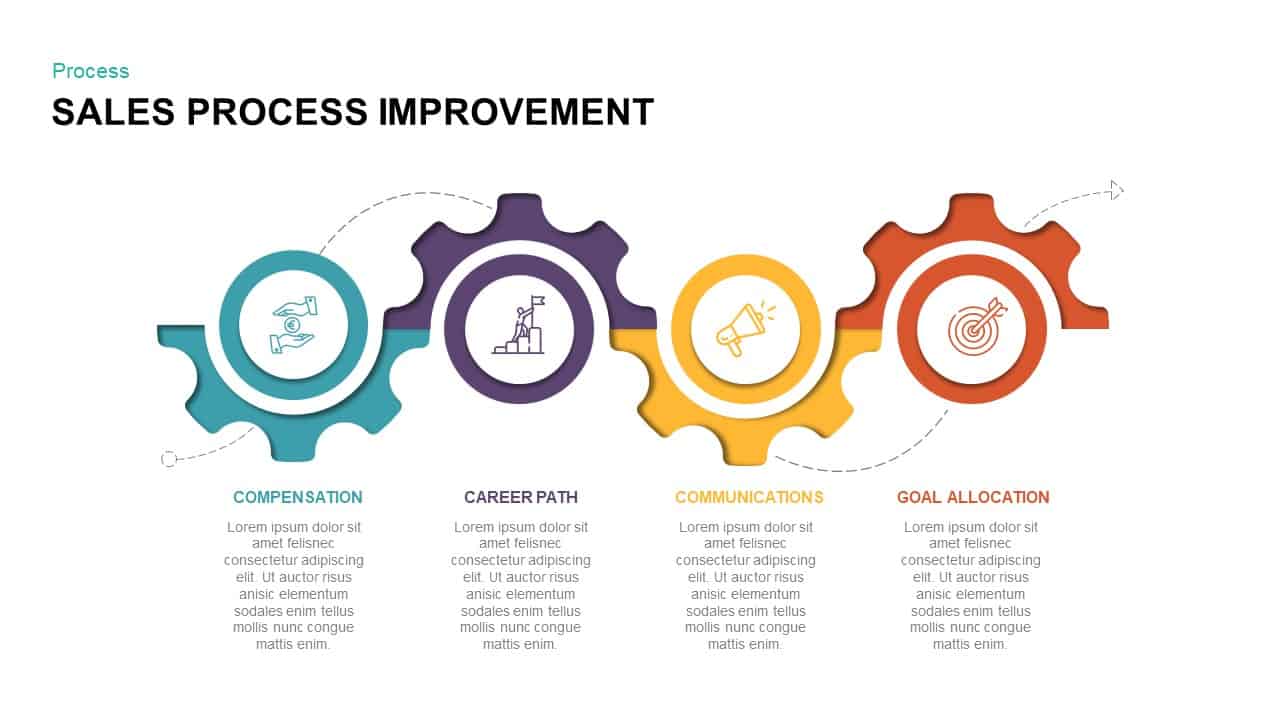
Sales Process Improvement Gear Diagram Template for PowerPoint & Google Slides
Process
Colorful 8-Stage Droplet Process Flow Diagram Template for PowerPoint & Google Slides
Process

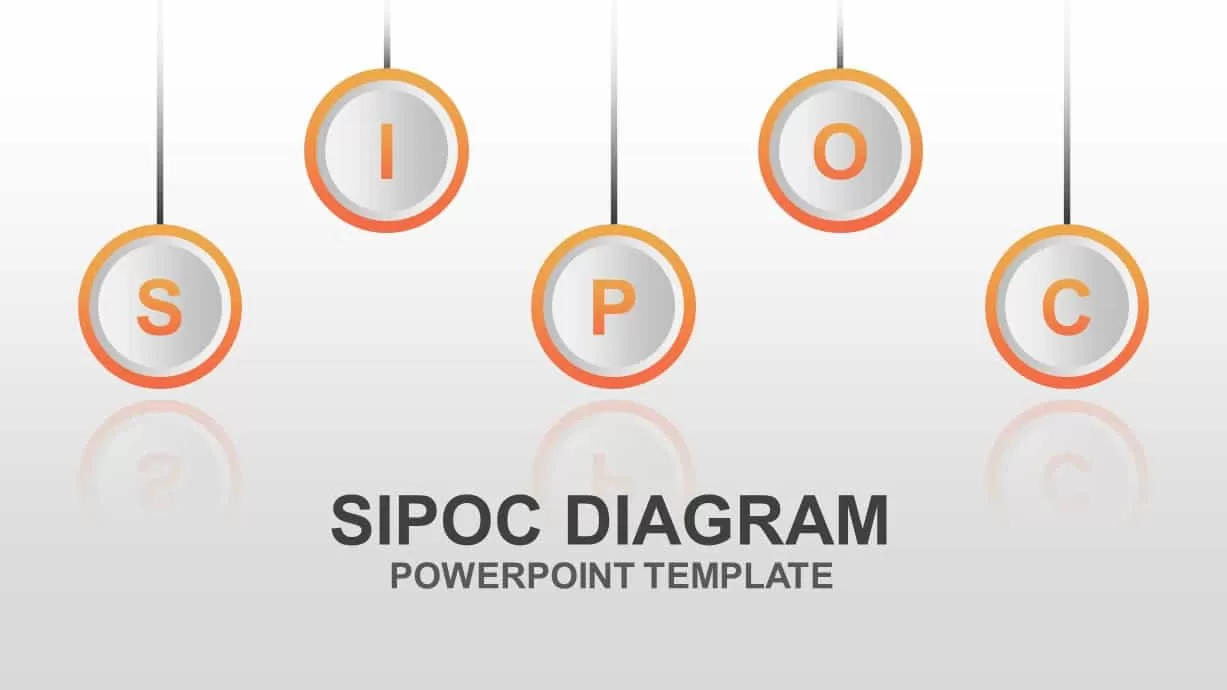
Editable SIPOC Process Diagram Deck Template for PowerPoint & Google Slides
Pitch Deck
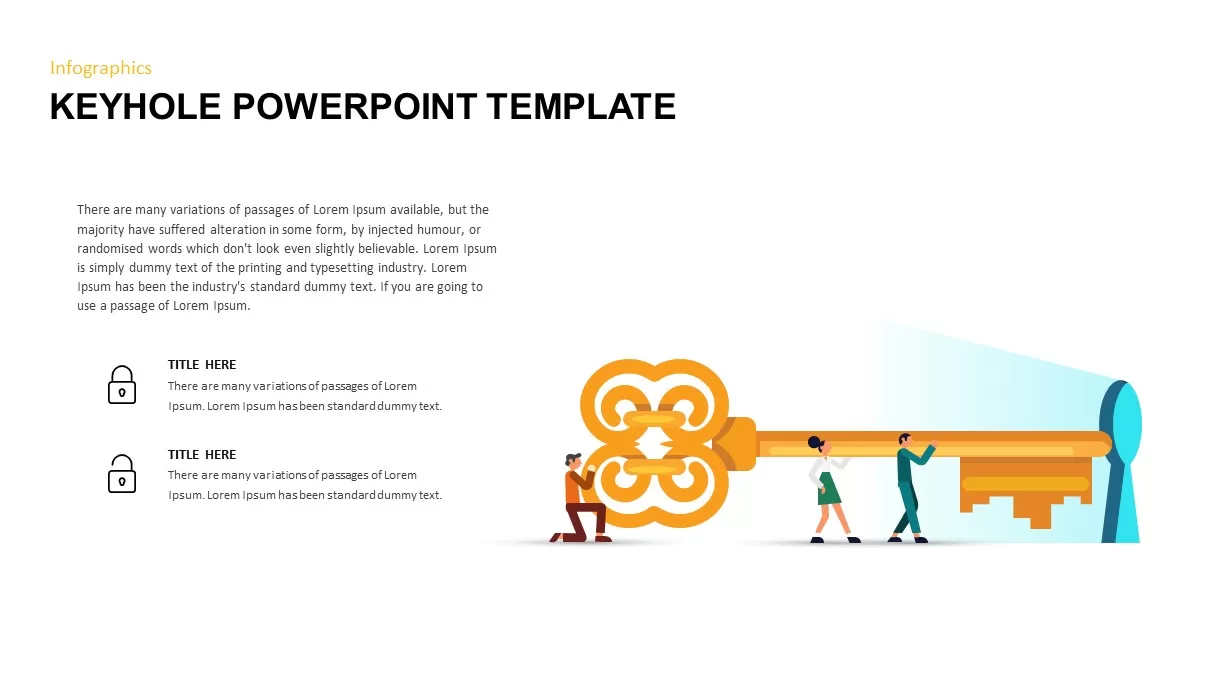
Keyhole Infographic Process Diagram Template for PowerPoint & Google Slides
Process
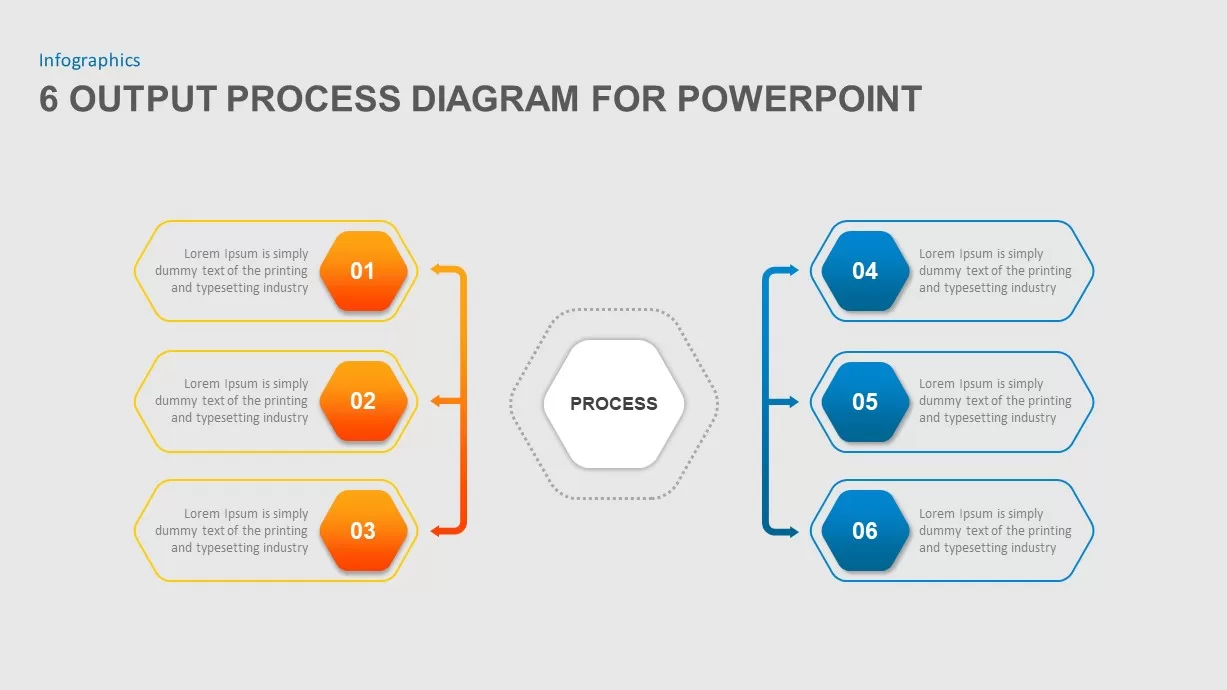
Six-Step Output Process Diagram Template for PowerPoint & Google Slides
Process
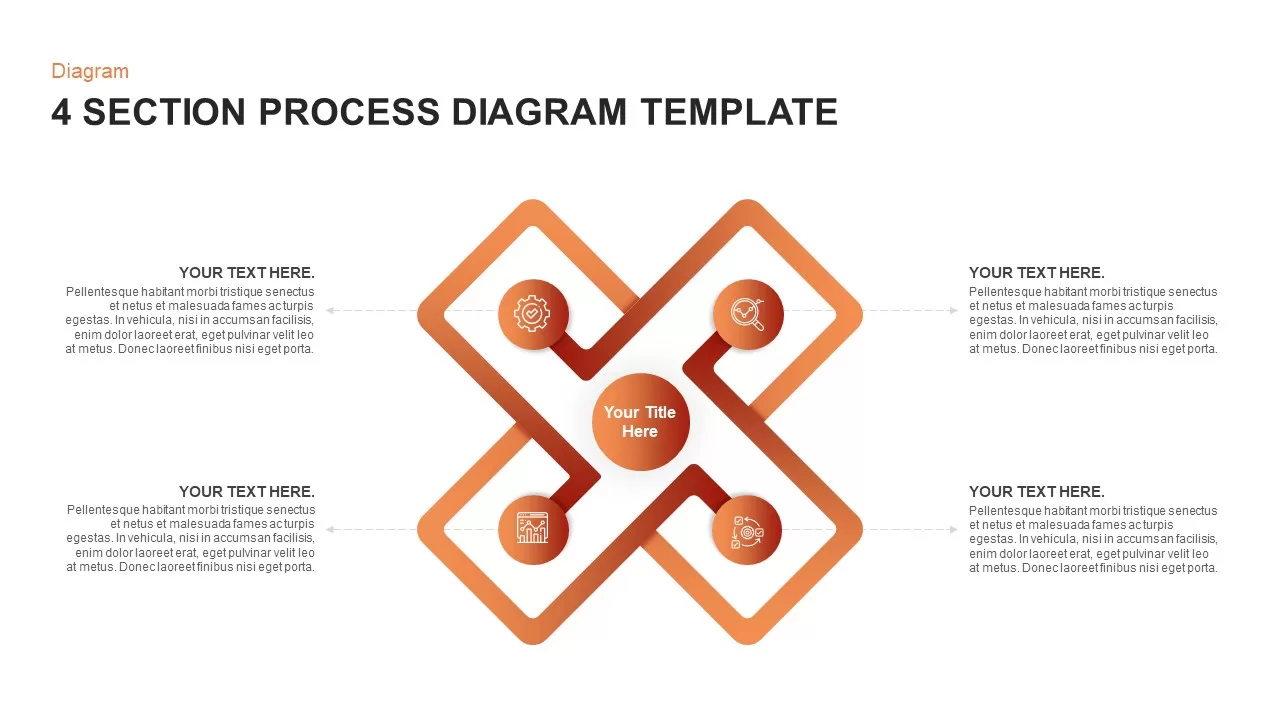
Modern 4 Section Process Diagram Template for PowerPoint & Google Slides
Process
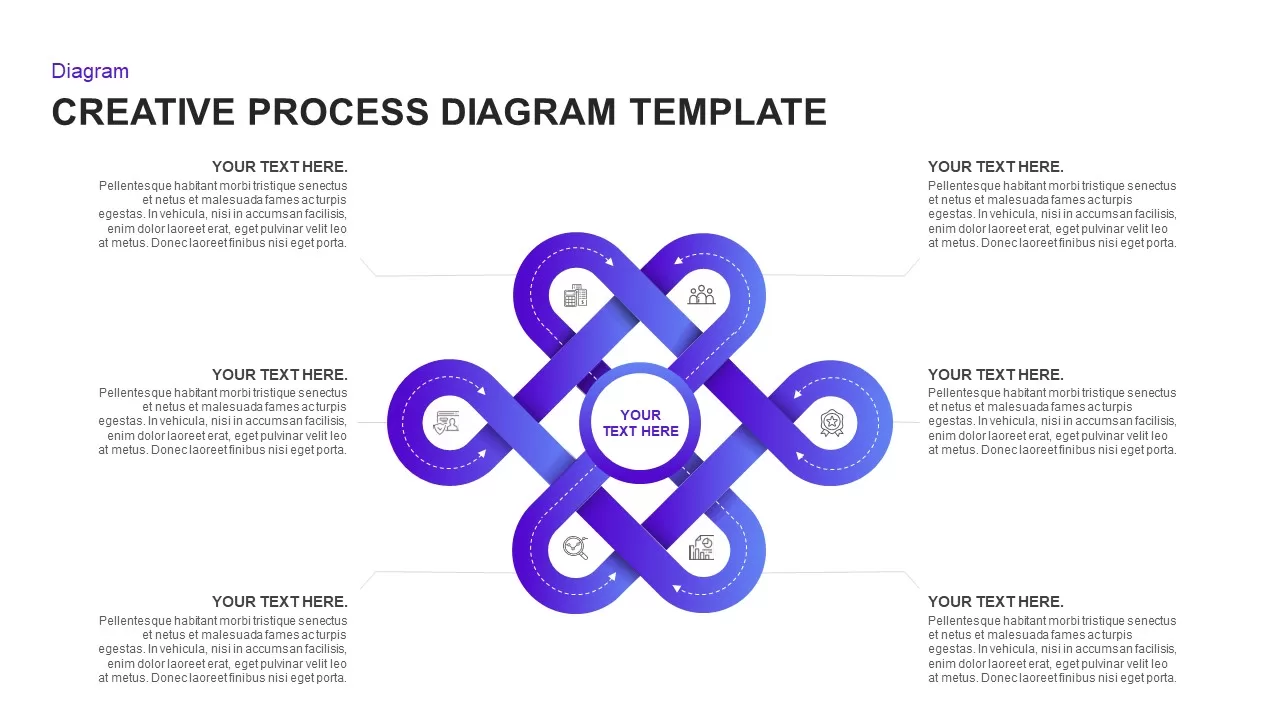
Creative Infinity Loop Process Diagram Template for PowerPoint & Google Slides
Process
Snowball Effect Process Diagram Template for PowerPoint & Google Slides
Process
Three-Step Curved Arrow Process Diagram Template for PowerPoint & Google Slides
Arrow
Five-Node Hub & Spoke Diagram Process Template for PowerPoint & Google Slides
Business Models
10 Step Circular Process Diagram Template for PowerPoint & Google Slides
Circular
3D Conveyor Belt Process Flow Diagram Template for PowerPoint & Google Slides
Process
Creative Brainstorming Process Diagram Template for PowerPoint & Google Slides
Process
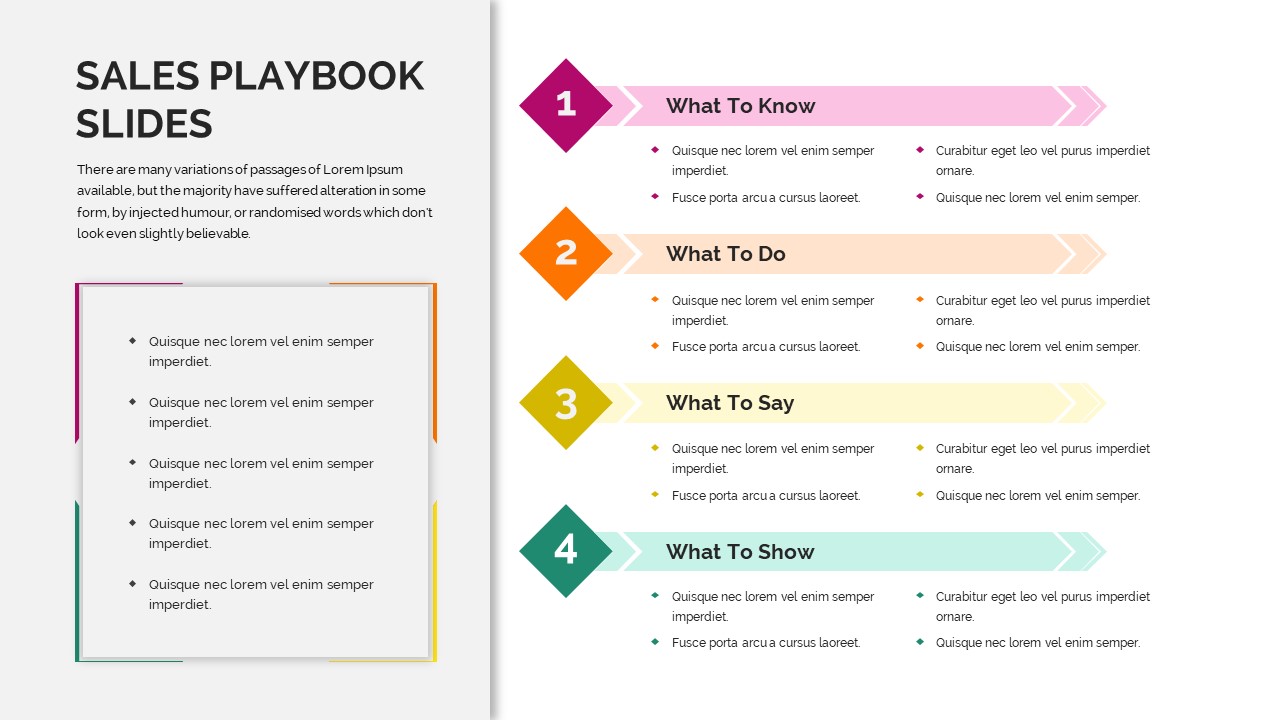
Sales Playbook Process Steps Diagram Template for PowerPoint & Google Slides
Marketing
Gear Process Diagram Template for PowerPoint & Google Slides
Process
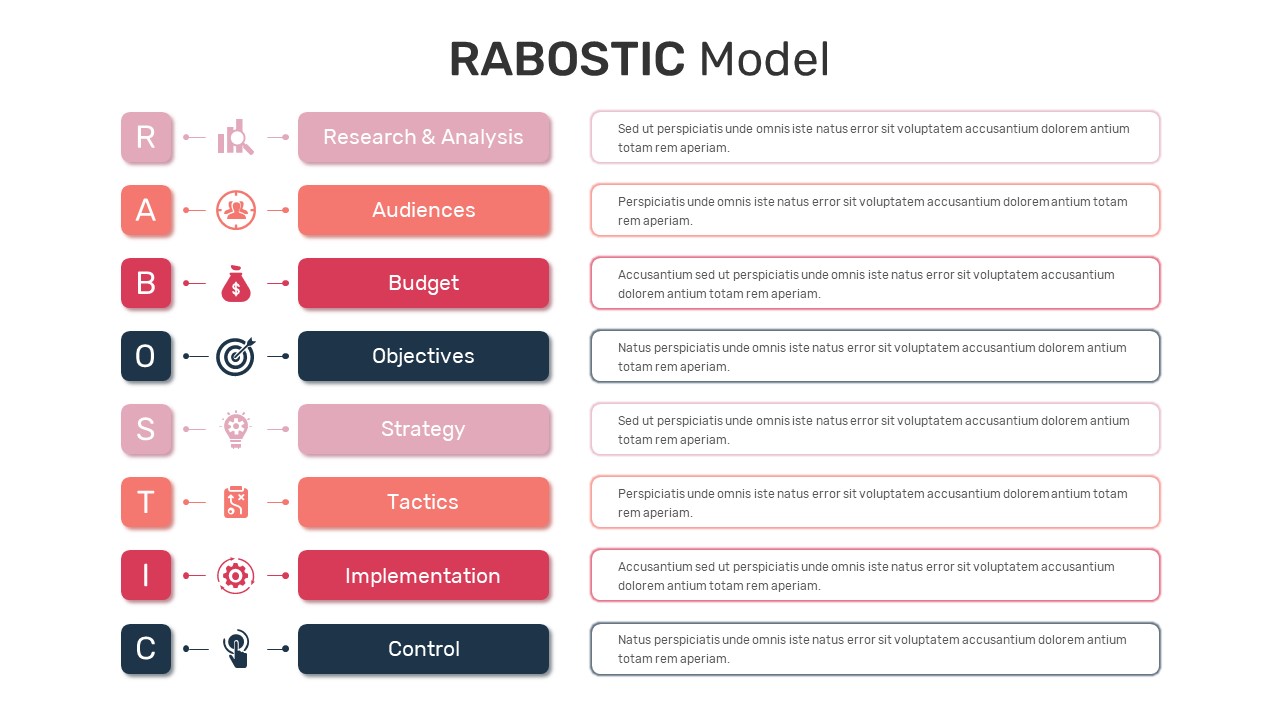
RABOSTIC Marketing Model Process Diagram Template for PowerPoint & Google Slides
Process
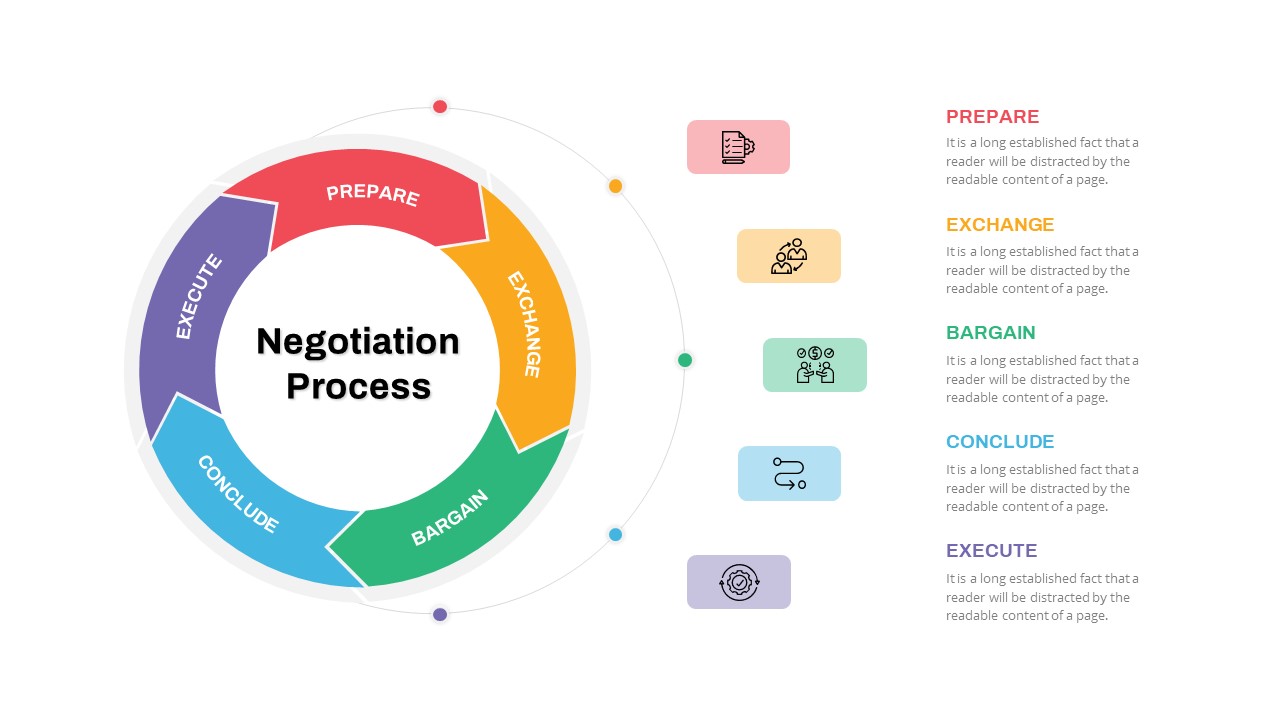
Negotiation Process Circular Diagram Template for PowerPoint & Google Slides
Circular
Comprehensive Process Flow Diagram Template for PowerPoint & Google Slides
Process
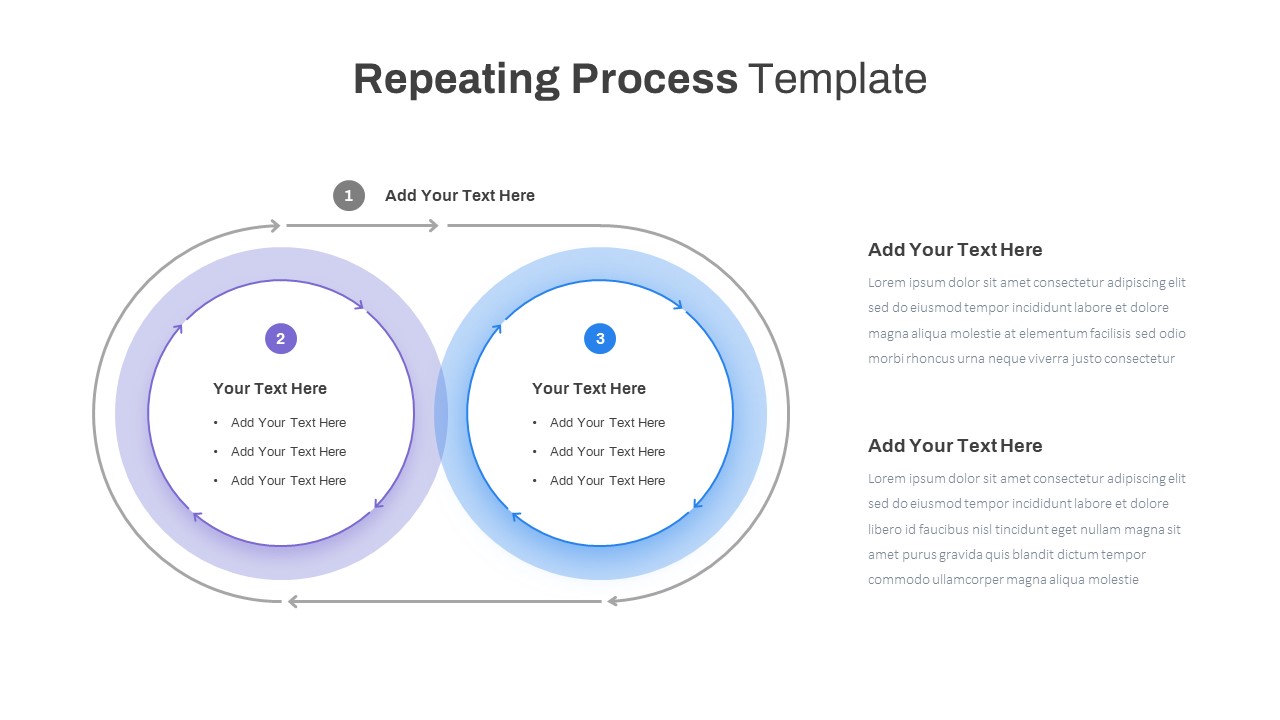
Repeating Overlapping Process Diagram Template for PowerPoint & Google Slides
Process
Animated Gears Process Flow Diagram Template for PowerPoint & Google Slides
Process
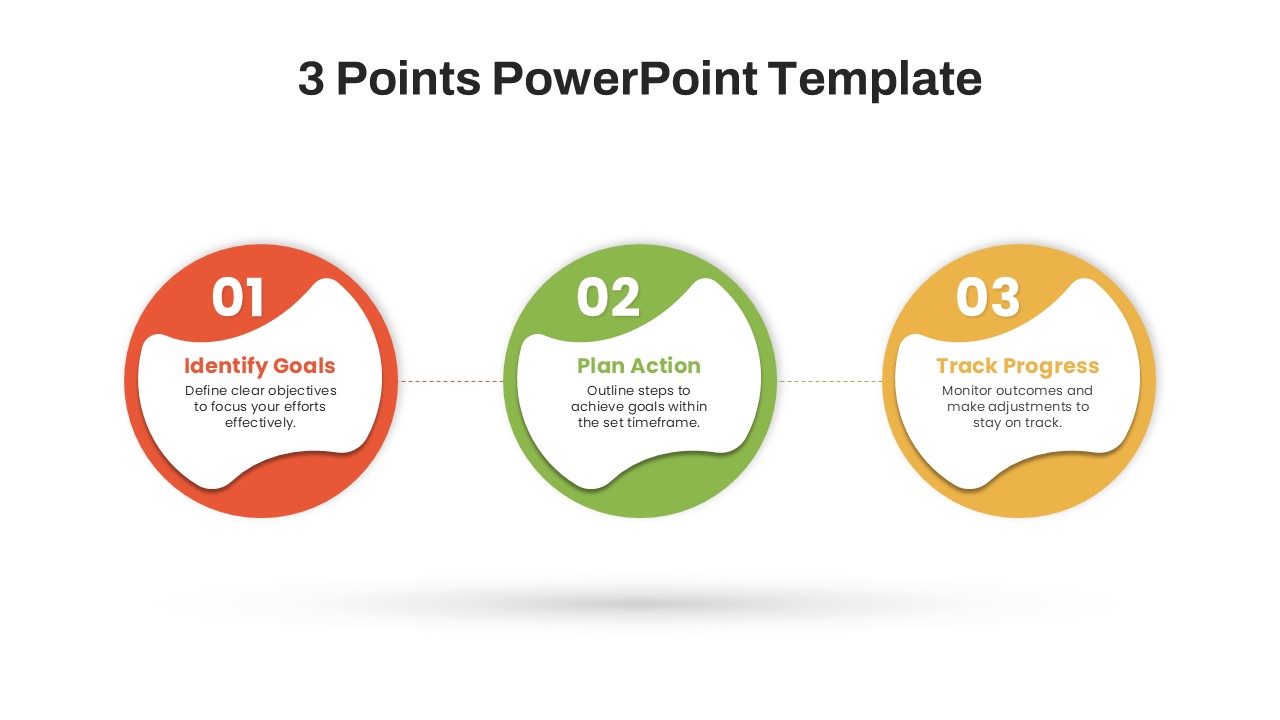
Modern Three-Point Process Diagram Template for PowerPoint & Google Slides
Process
Horizontal Funnel Diagram Process Template for PowerPoint & Google Slides
Funnel
Pharmacovigilance Process Diagram Template for PowerPoint & Google Slides
Process
14 Steps Circular Process Diagram Template for PowerPoint & Google Slides
Circular
Empirical Process Control Theory Diagram Template for PowerPoint & Google Slides
Circular
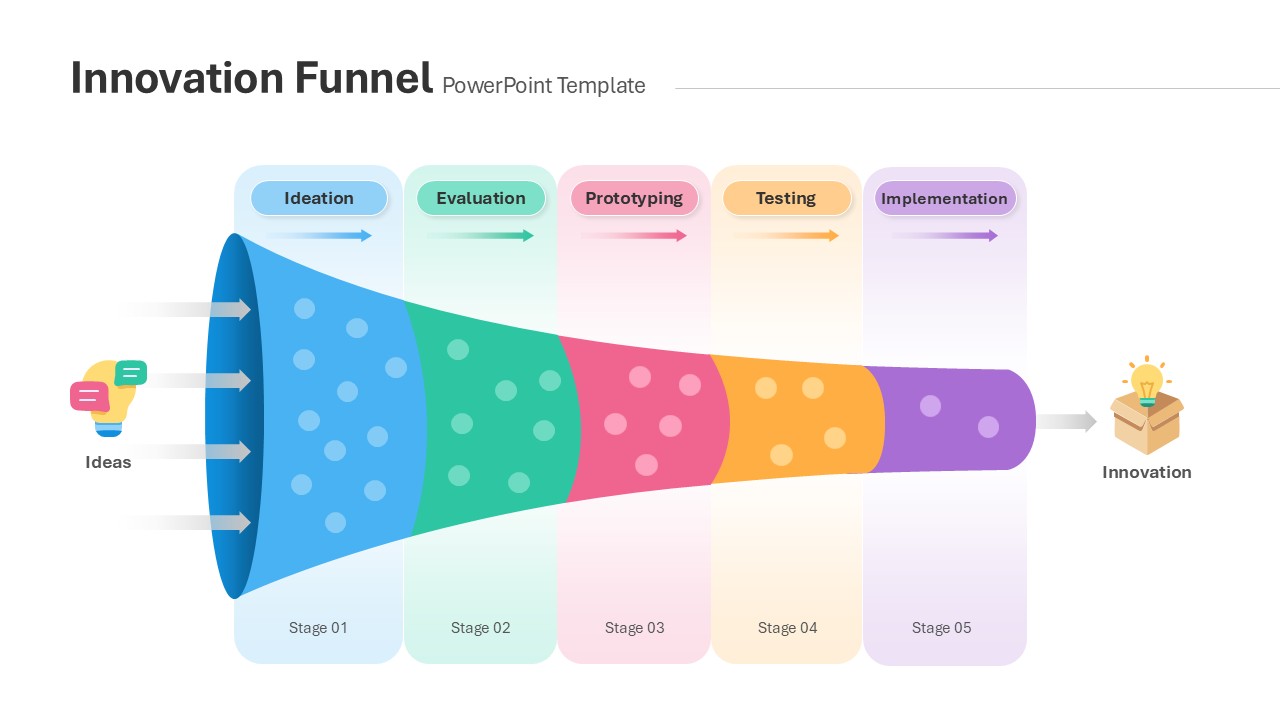
Innovation Funnel Process Diagram Template for PowerPoint & Google Slides
Funnel
Resume Screening Process Flow Diagram Template for PowerPoint & Google Slides
Process
Q-Learning Process Flow Diagram Template for PowerPoint & Google Slides
Process
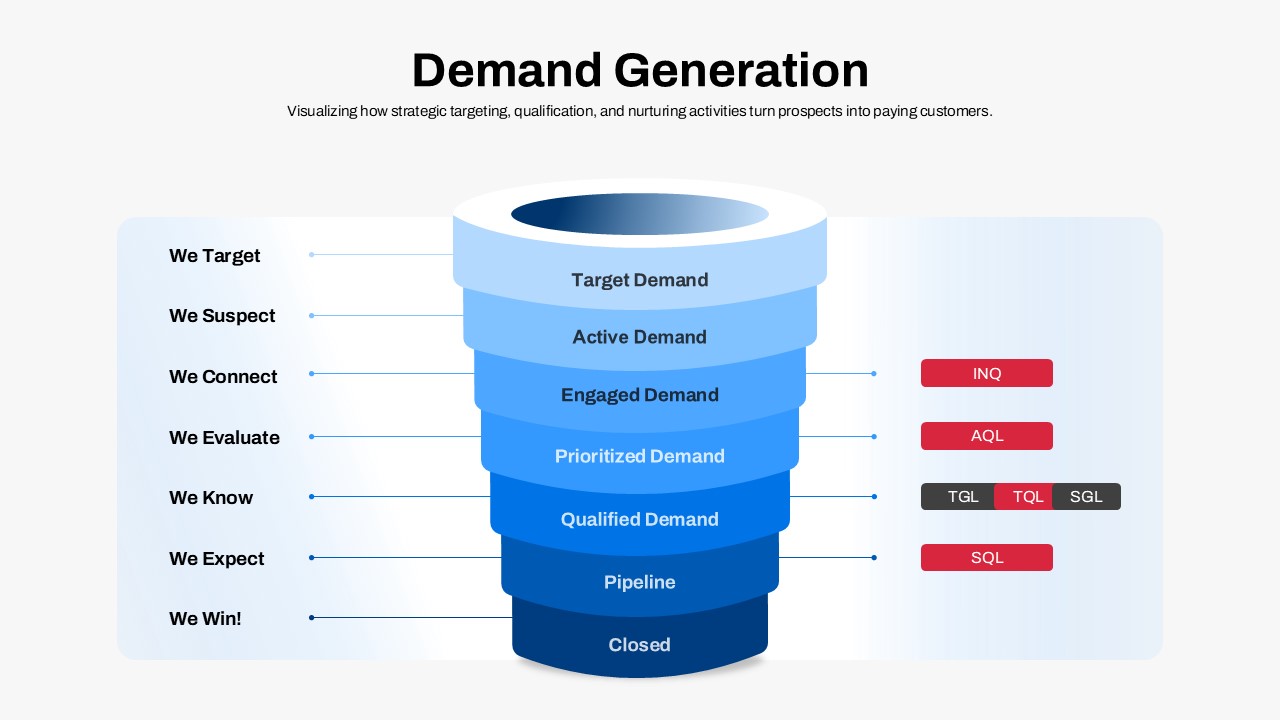
Demand Generation Funnel Process Diagram Template for PowerPoint & Google Slides
Funnel
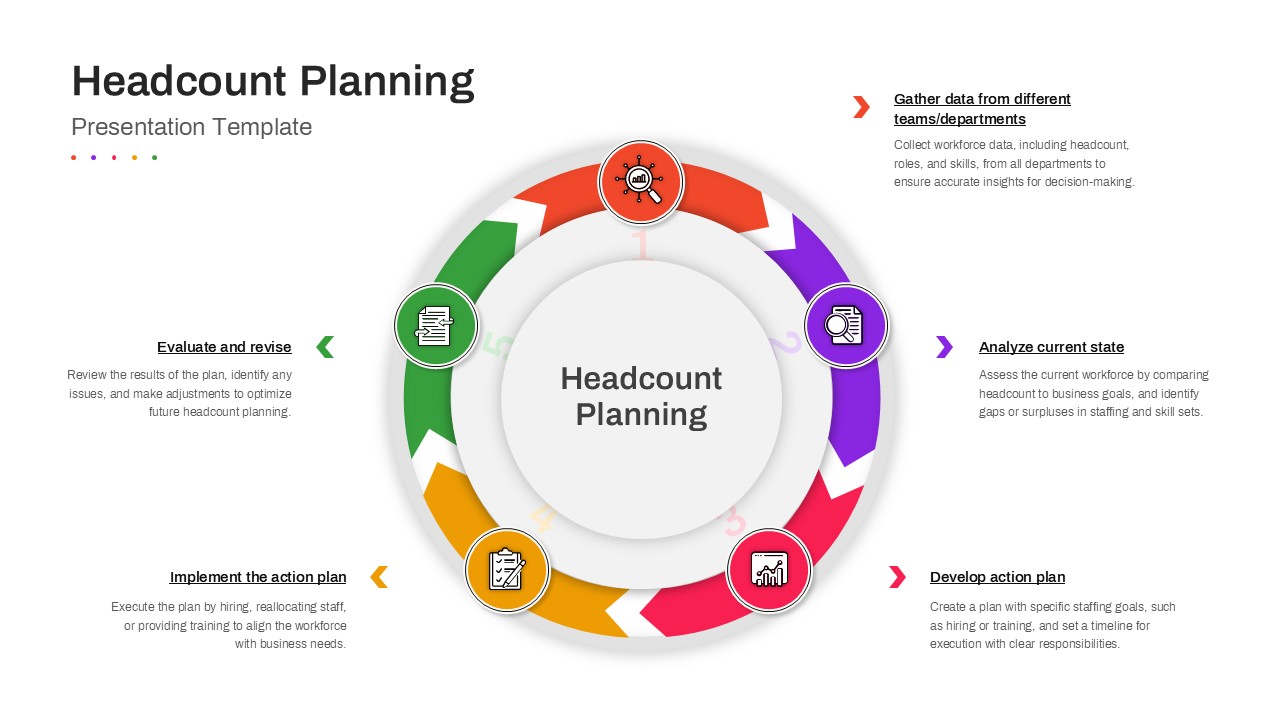
Headcount Planning Circular Process Diagram Template for PowerPoint & Google Slides
HR
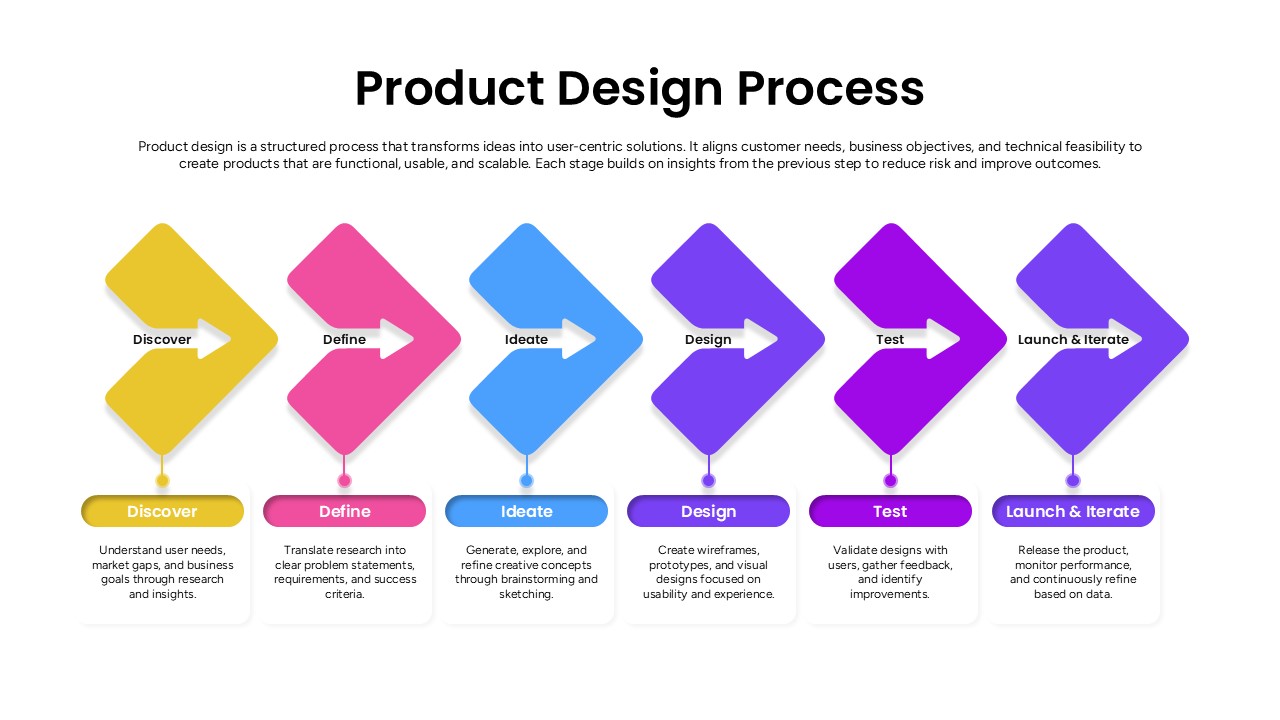
Product Design Process Flow Diagram Template for PowerPoint & Google Slides
Process