Circular Balanced Scorecard Infographic Template for PowerPoint & Google Slides
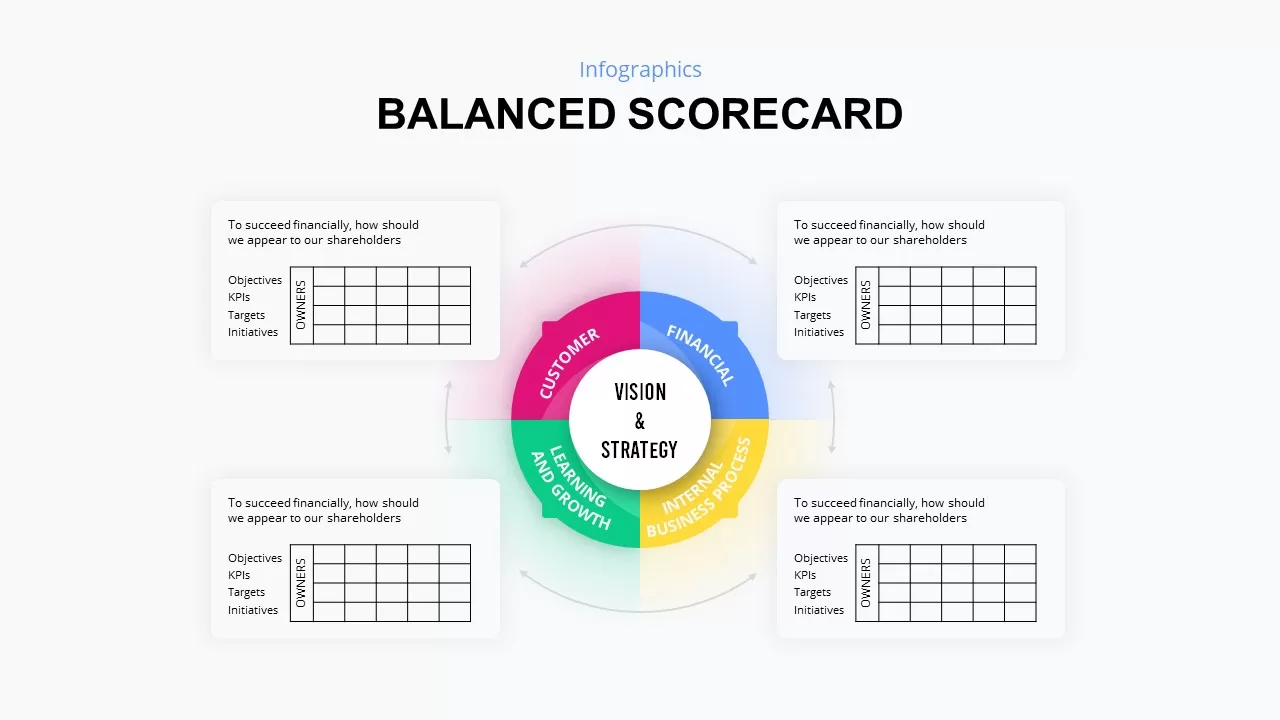
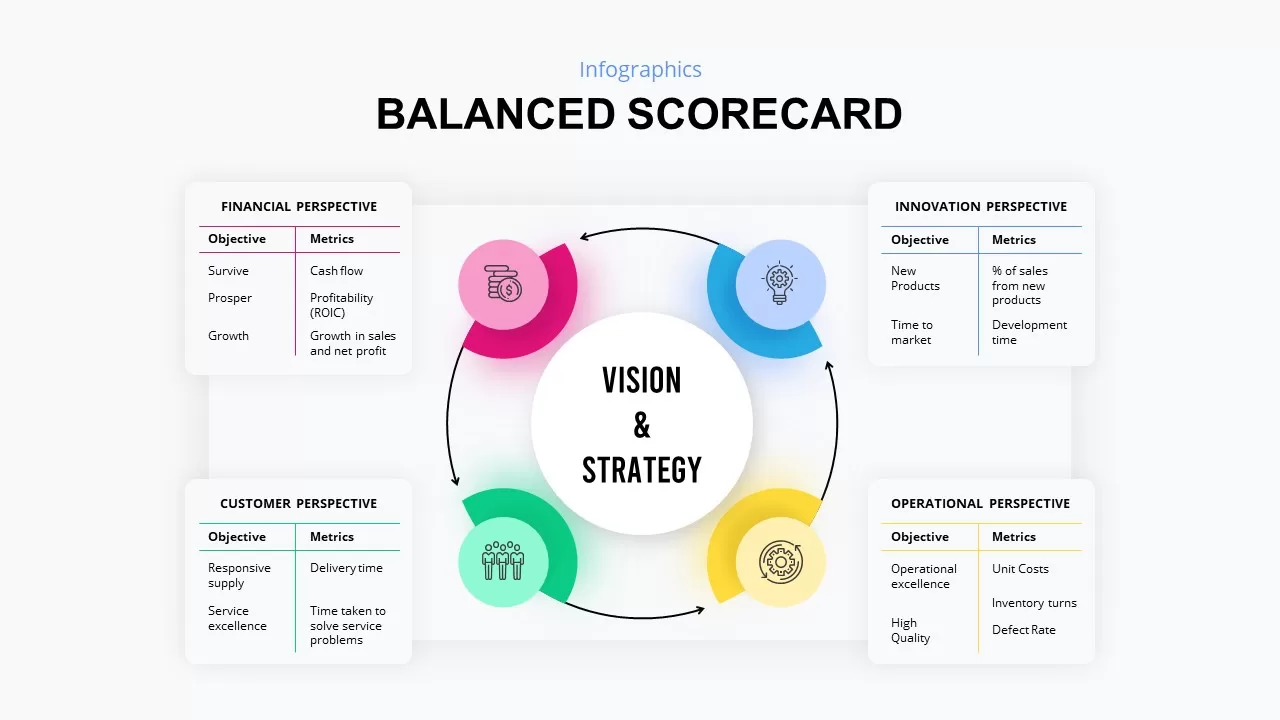
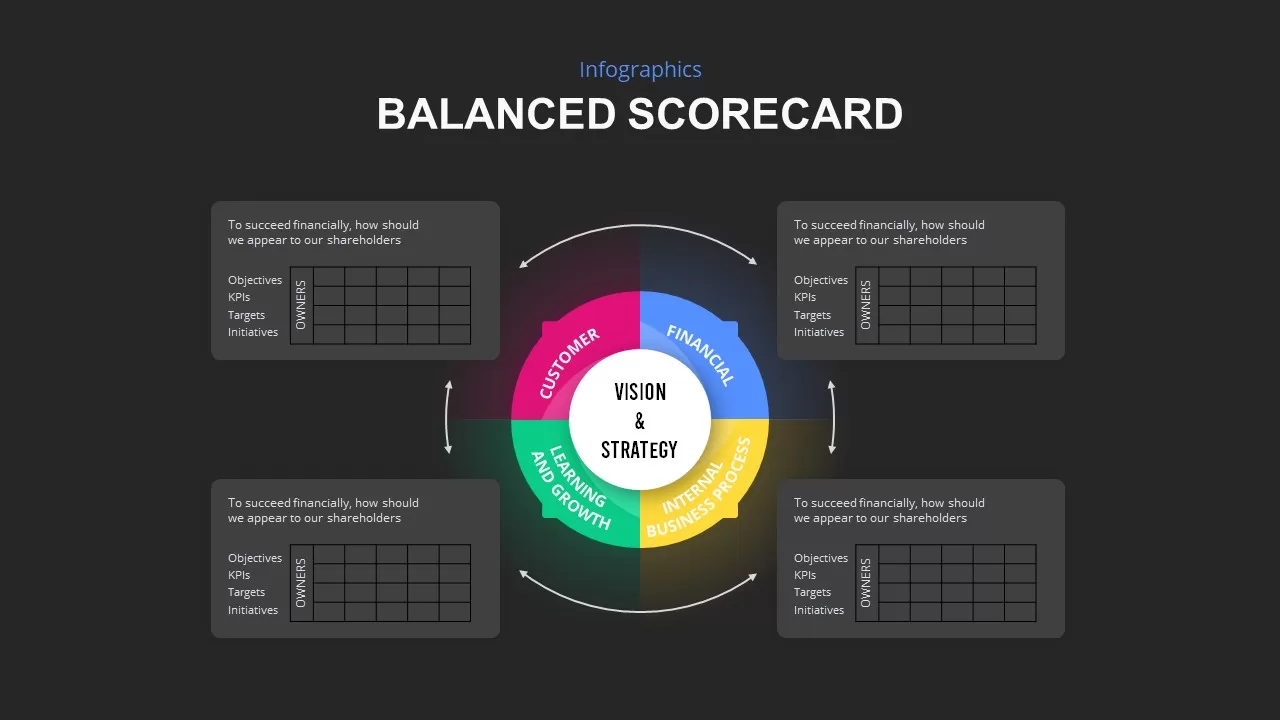
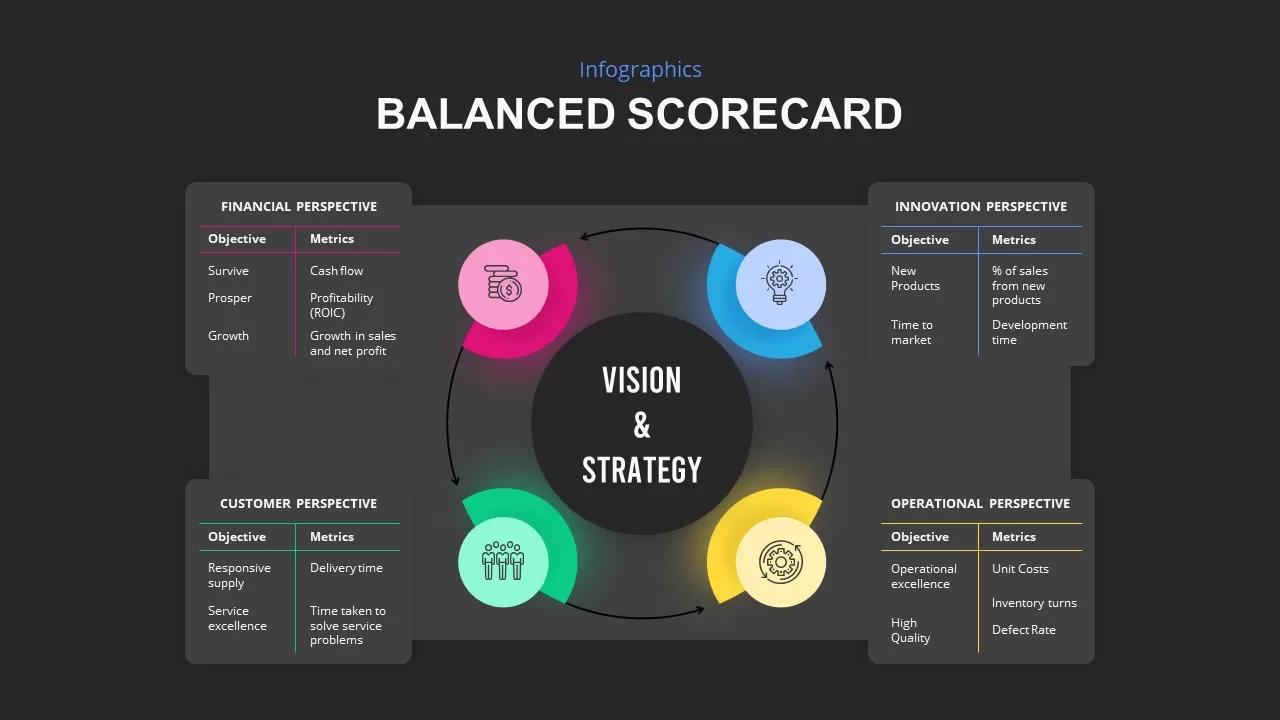
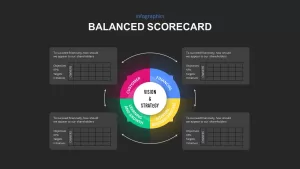

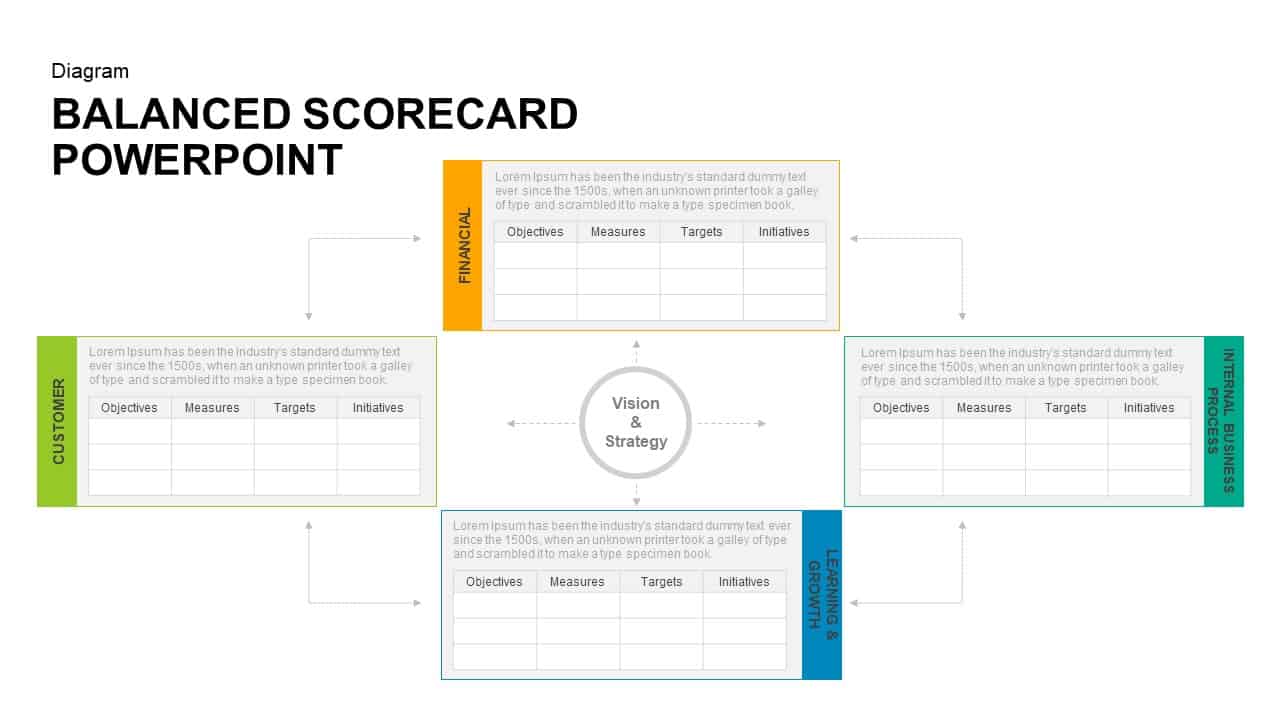
This infographic slide presents a circular balanced scorecard divided into four color-coded quadrants—Financial, Customer, Internal Business Process, and Learning & Growth—surrounding a central “Vision & Strategy” hub. Each segment features an icon placeholder and connects to a corresponding text table for Objectives and Metrics, with subtle arrow indicators guiding the strategic flow. The clean white background and soft drop shadows ensure clarity, while the pastel pink, blue, yellow, and green hues draw attention to each perspective without clutter.
Built for full customization, this slide includes editable vector graphics, drag-and-drop icon placeholders, and data-linked chart tables that adapt to your key performance indicators. Master slide layouts and alignment guides make it effortless to swap colors, update fonts, or reposition elements to match your brand standards. Whether you’re mapping financial goals, customer targets, process optimizations, or learning initiatives, this template streamlines data entry and maintains consistent styling across your deck.
Use this balanced scorecard infographic to present strategic objectives, performance reviews, quarterly dashboards, or executive summaries. The intuitive layout supports dynamic storytelling, helping stakeholders see how each perspective interrelates and drives organizational vision.
Who is it for
Strategy consultants, finance leaders, operations managers, and executive teams will benefit from this slide when communicating balanced scorecard frameworks, KPI reviews, or strategic roadmaps. It’s ideal for C-suite presentations, board meetings, and performance review workshops.
Other Uses
Repurpose this circular layout for project status dashboards, department scorecards, risk-management overviews, and quarterly business reviews. Swap the quadrant titles and tables to illustrate SWOT categories, growth metrics, or customer journey stages with the same clear, infographic style.
Login to download this file

Item ID
SB01997
Related Templates

Free Balanced Scorecard Quadrant KPI Layout Template for PowerPoint & Google Slides
Employee Performance
Free
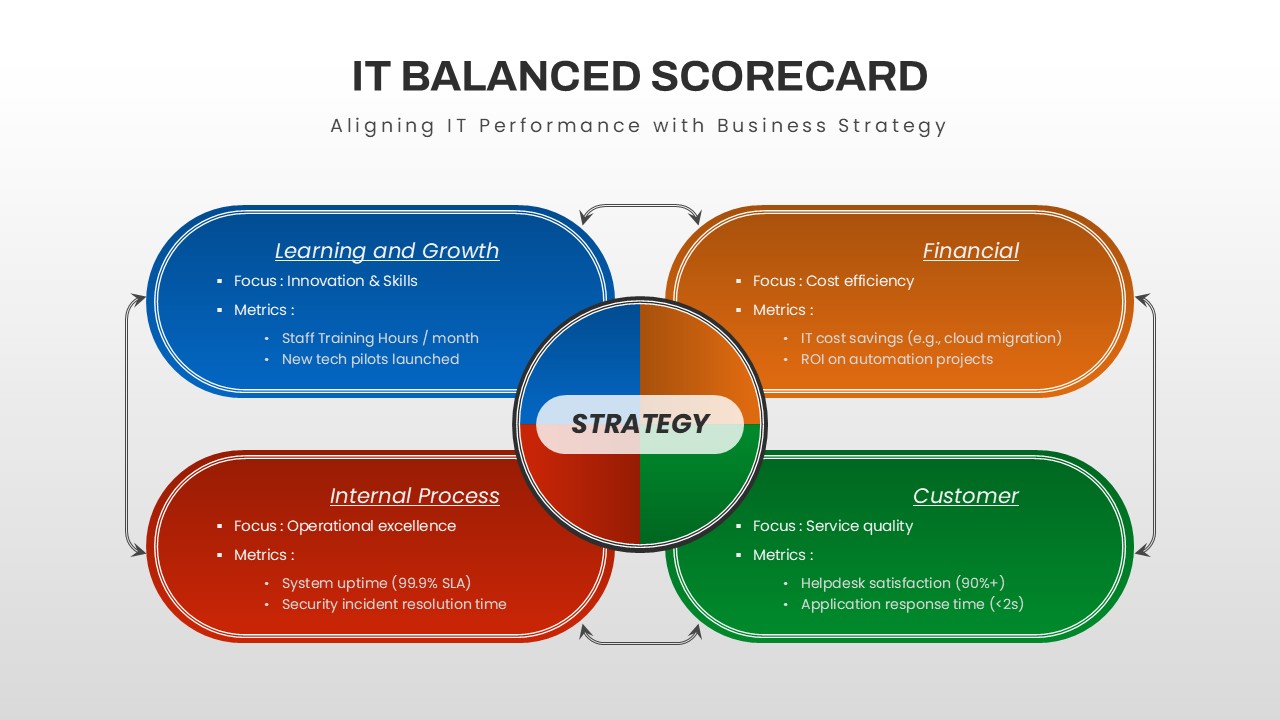
IT Balanced Scorecard Strategy Framework Template for PowerPoint & Google Slides
Business Strategy
Balanced Scorecard Diagram for PowerPoint & Google Slides
Goals
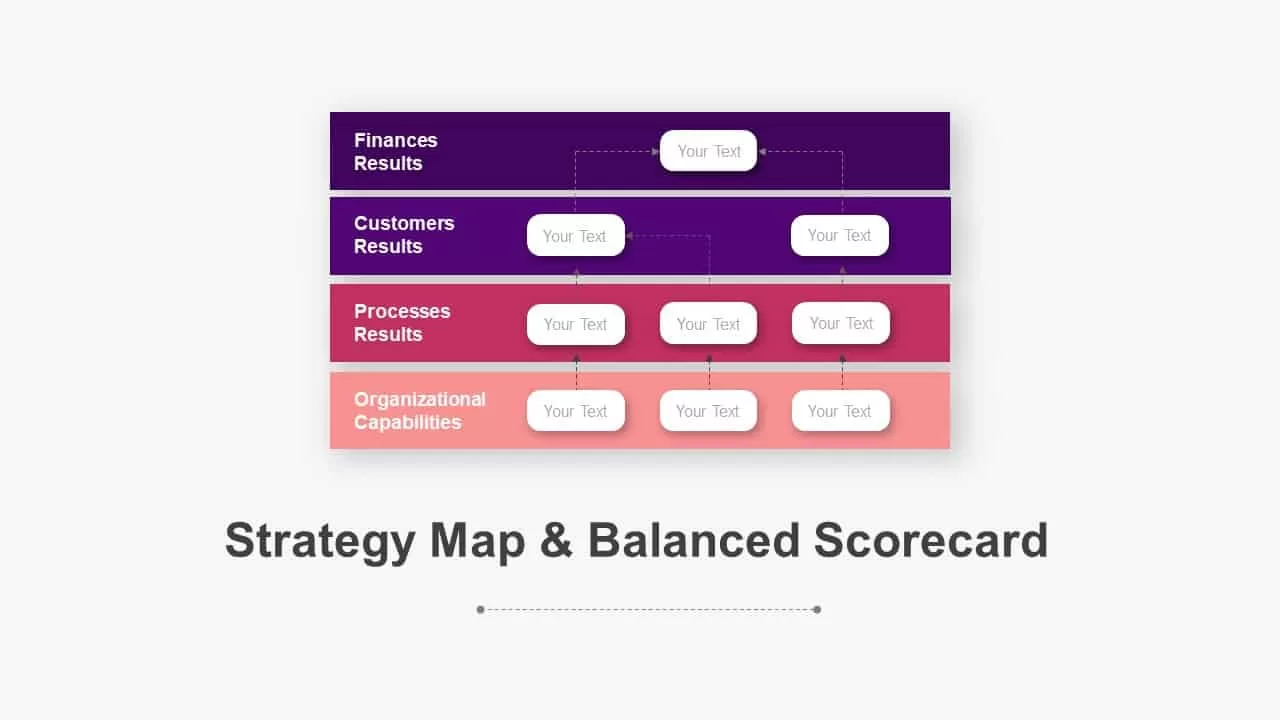
Balanced Scorecard Strategy Map Diagram Pack for PowerPoint & Google Slides
Business Strategy
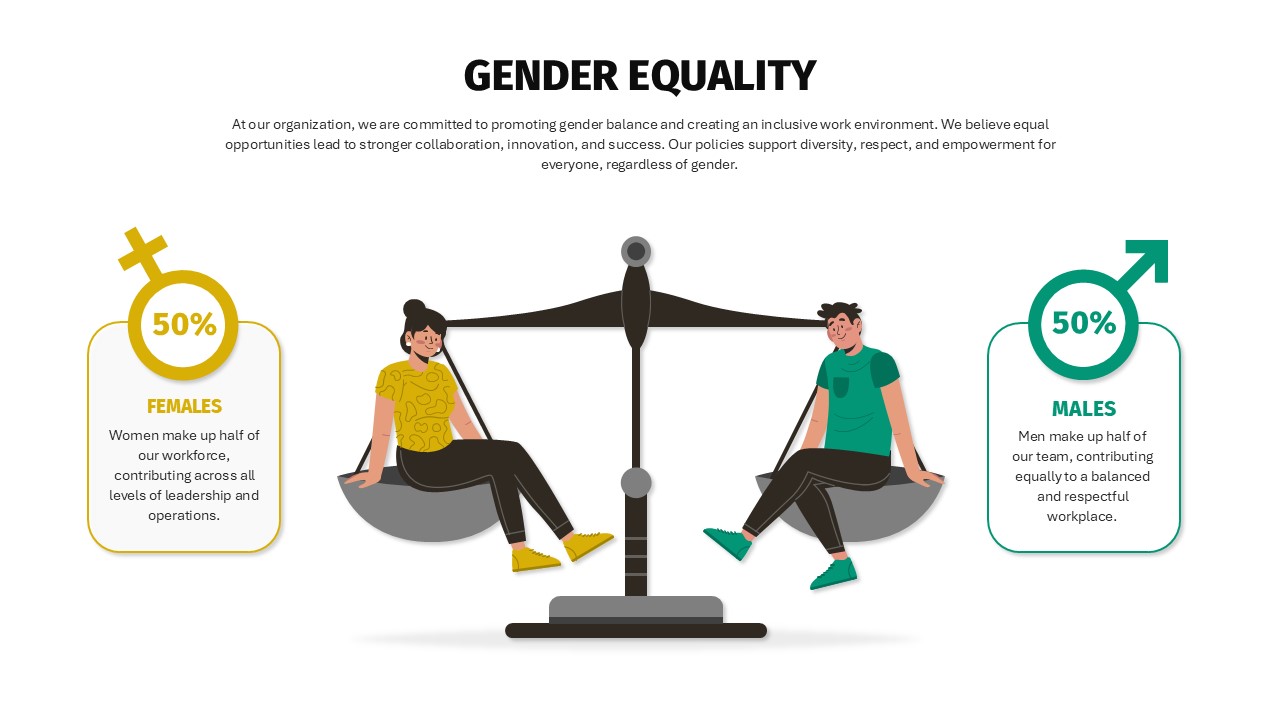
Balanced Gender Equality Scale Infographic Template for PowerPoint & Google Slides
Comparison
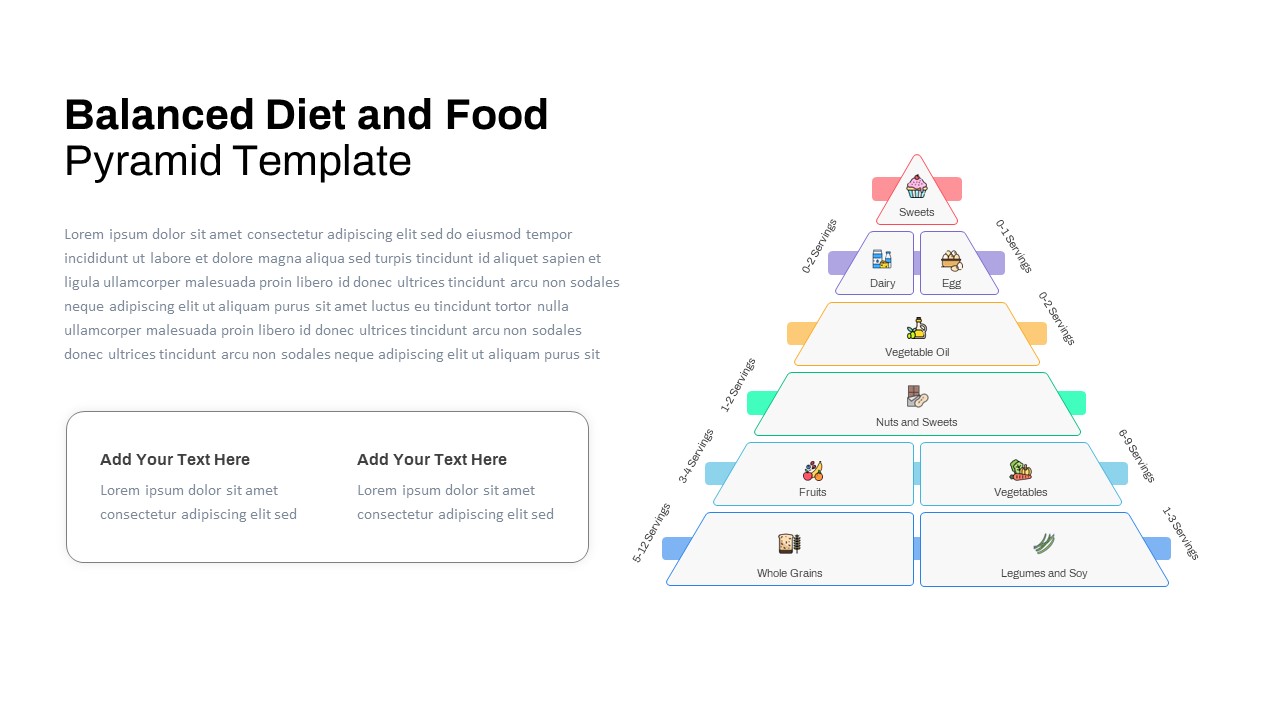
Free Balanced Diet and Food Pyramid Template for PowerPoint & Google Slides
Pyramid
Free
Six Section Circular Infographic Diagram Template for PowerPoint & Google Slides
Circular
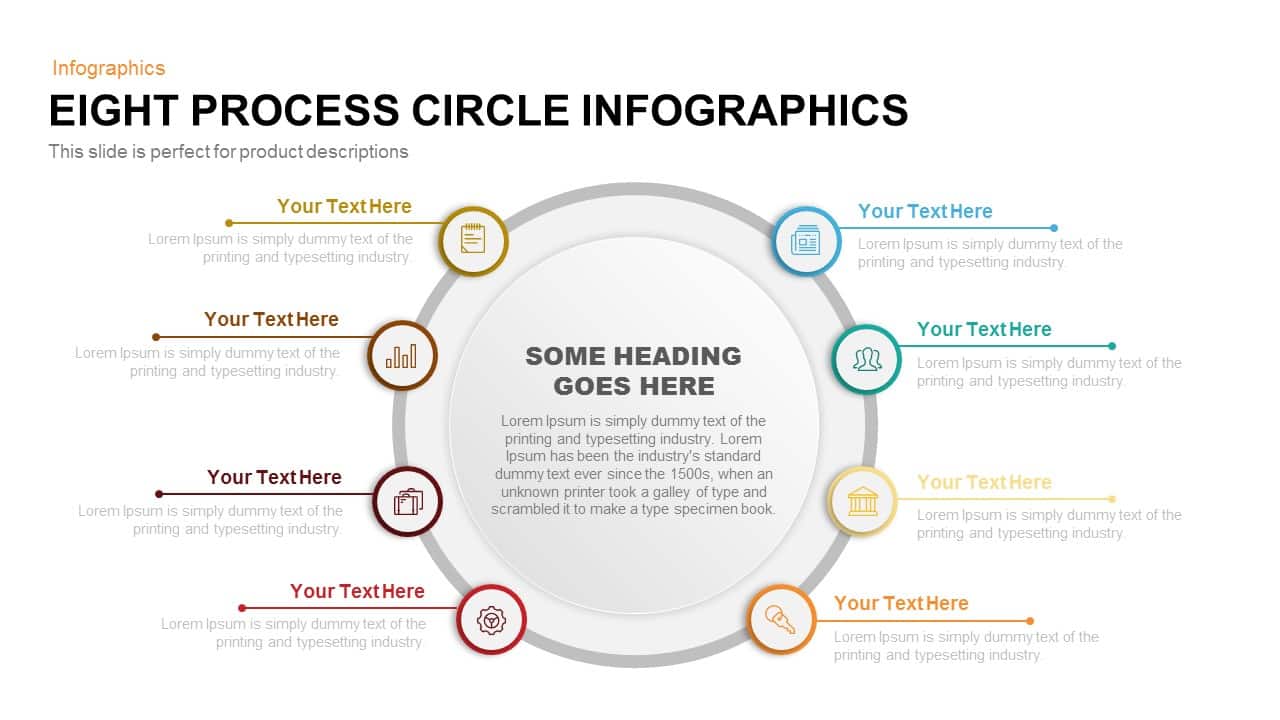
Eight-Stage Circular Process Infographic Template for PowerPoint & Google Slides
Circular
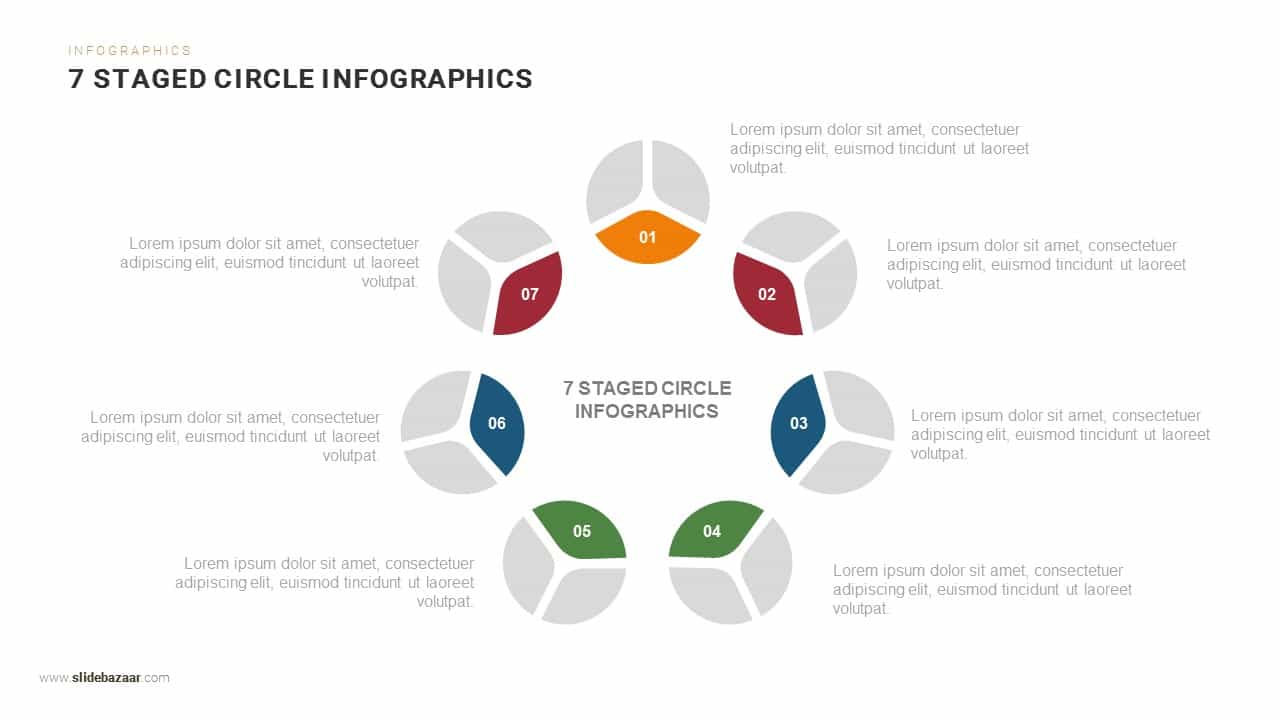
Seven-Stage Circular Infographic Template for PowerPoint & Google Slides
Circular
Six-Segment Circular Hub Infographic Template for PowerPoint & Google Slides
Circular
Eight-Step Circular Diagram Infographic Template for PowerPoint & Google Slides
Circular
Five-Stage Circular Infographic Diagram Template for PowerPoint & Google Slides
Process
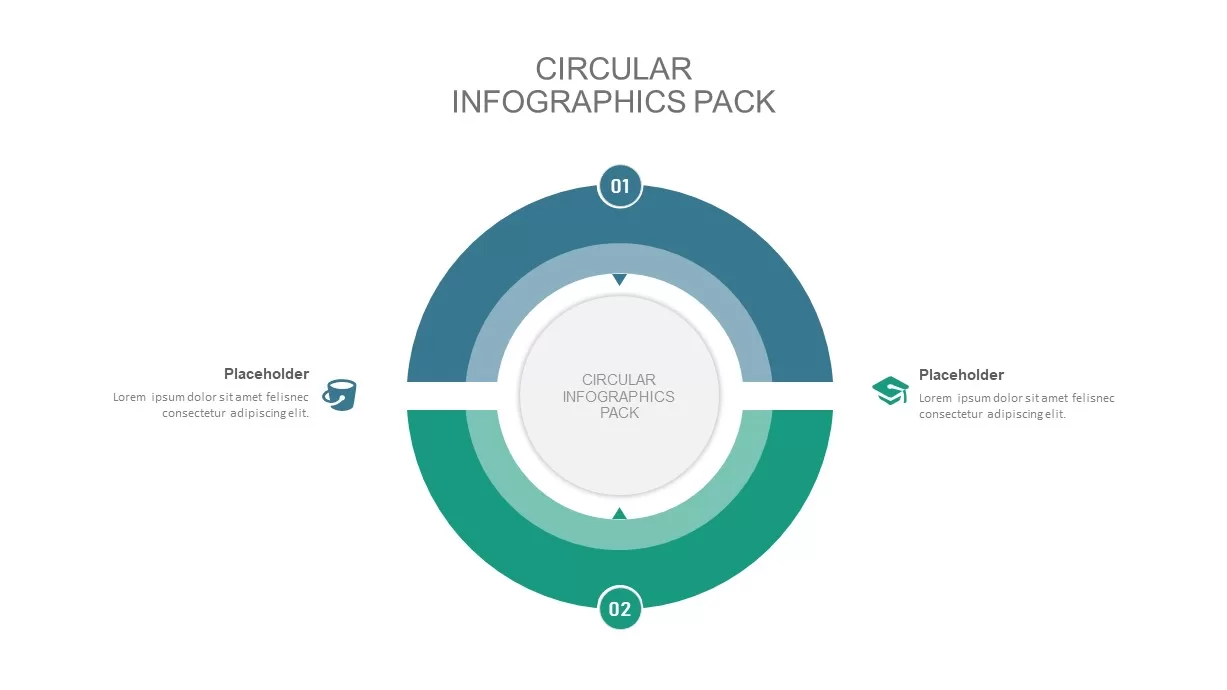
Four-Stage Circular Diagram Infographic Template for PowerPoint & Google Slides
Circular
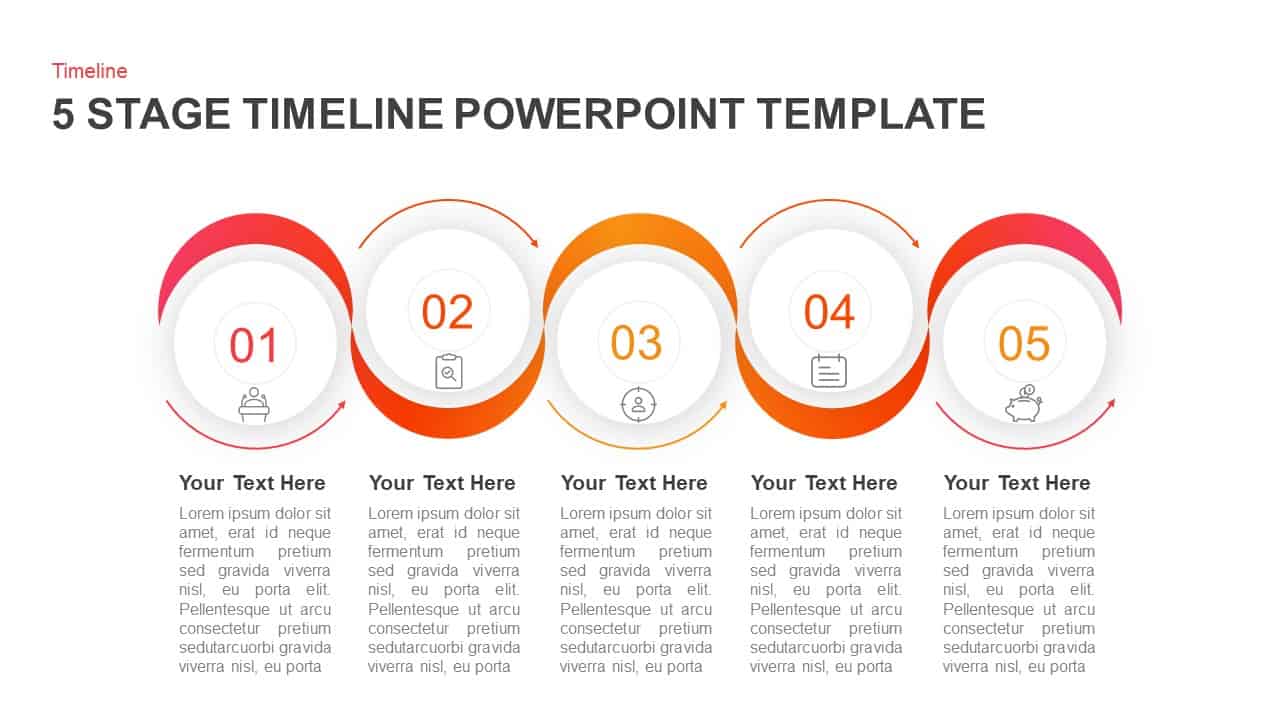
5 Stage Circular Timeline Infographic Template for PowerPoint & Google Slides
Timeline
4 Factors Circular Diagram Infographic Template for PowerPoint & Google Slides
Circular
Circular CRM Process Diagram Infographic Template for PowerPoint & Google Slides
Circular
Circular Three-Step Infographic Diagram Template for PowerPoint & Google Slides
Circular
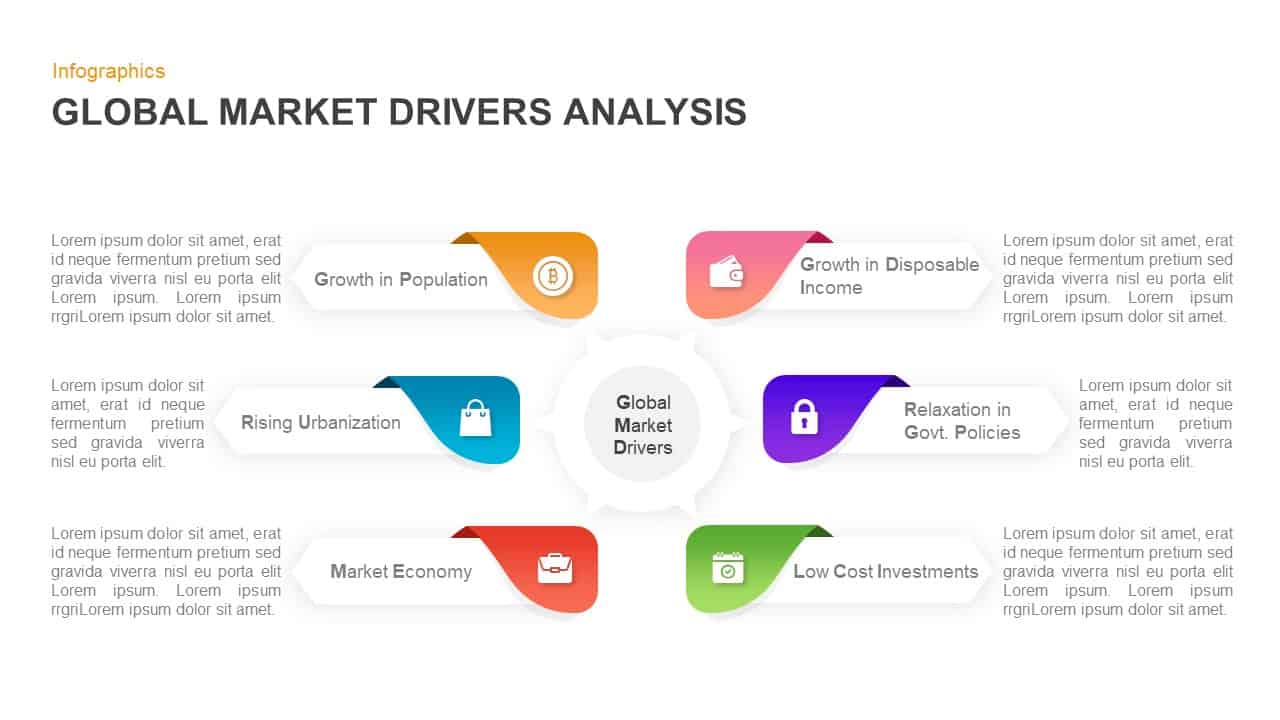
Circular Market Drivers Infographic Template for PowerPoint & Google Slides
Circular
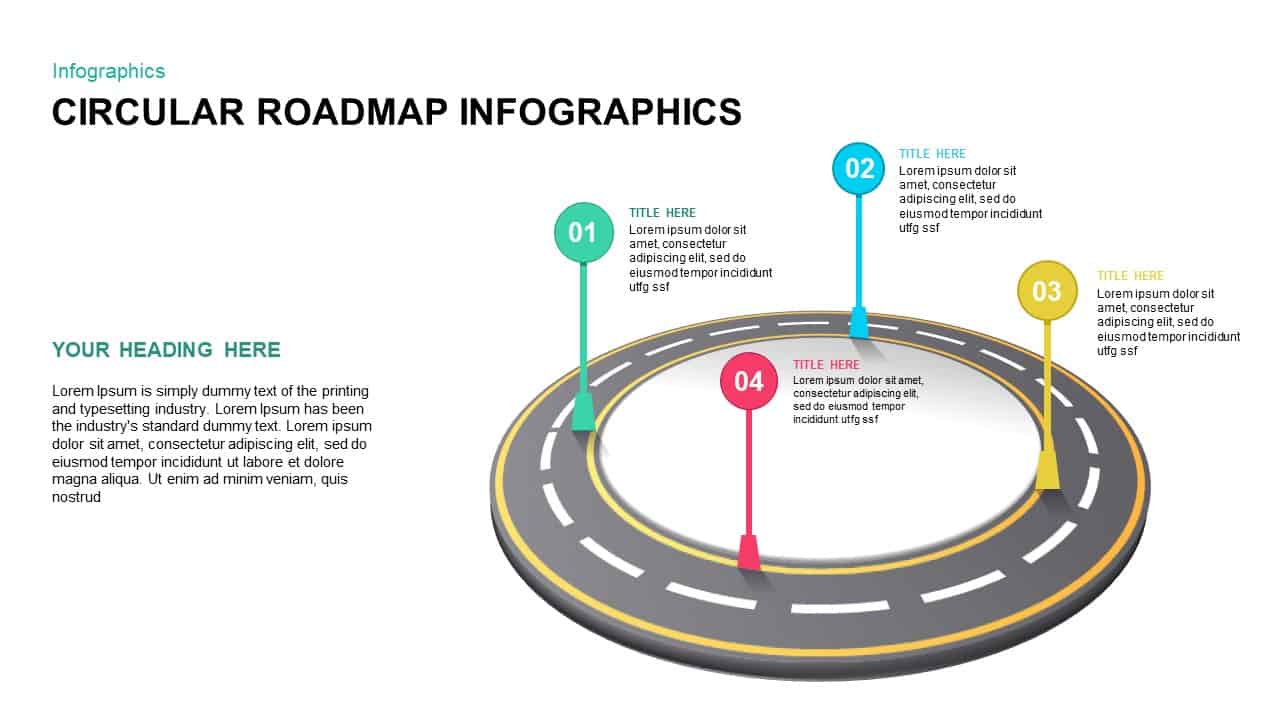
4-Step Circular Roadmap Infographic Template for PowerPoint & Google Slides
Roadmap
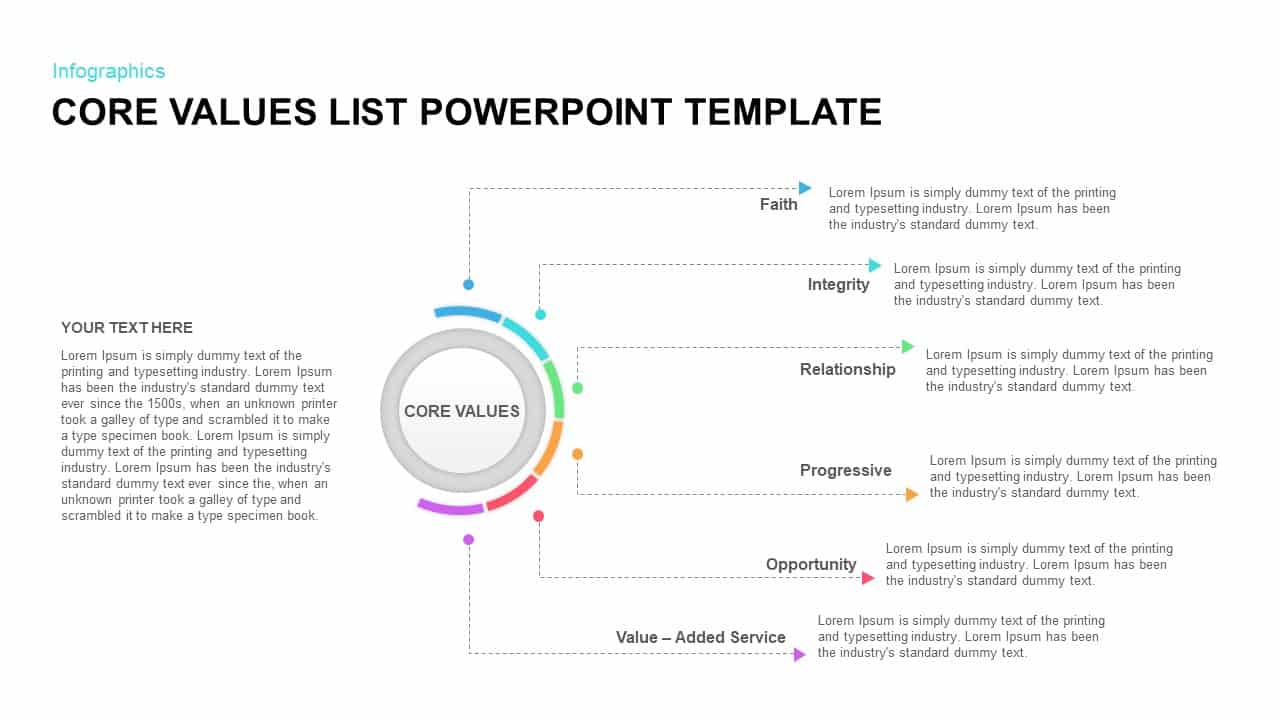
Circular Core Values Infographic List Template for PowerPoint & Google Slides
Circular
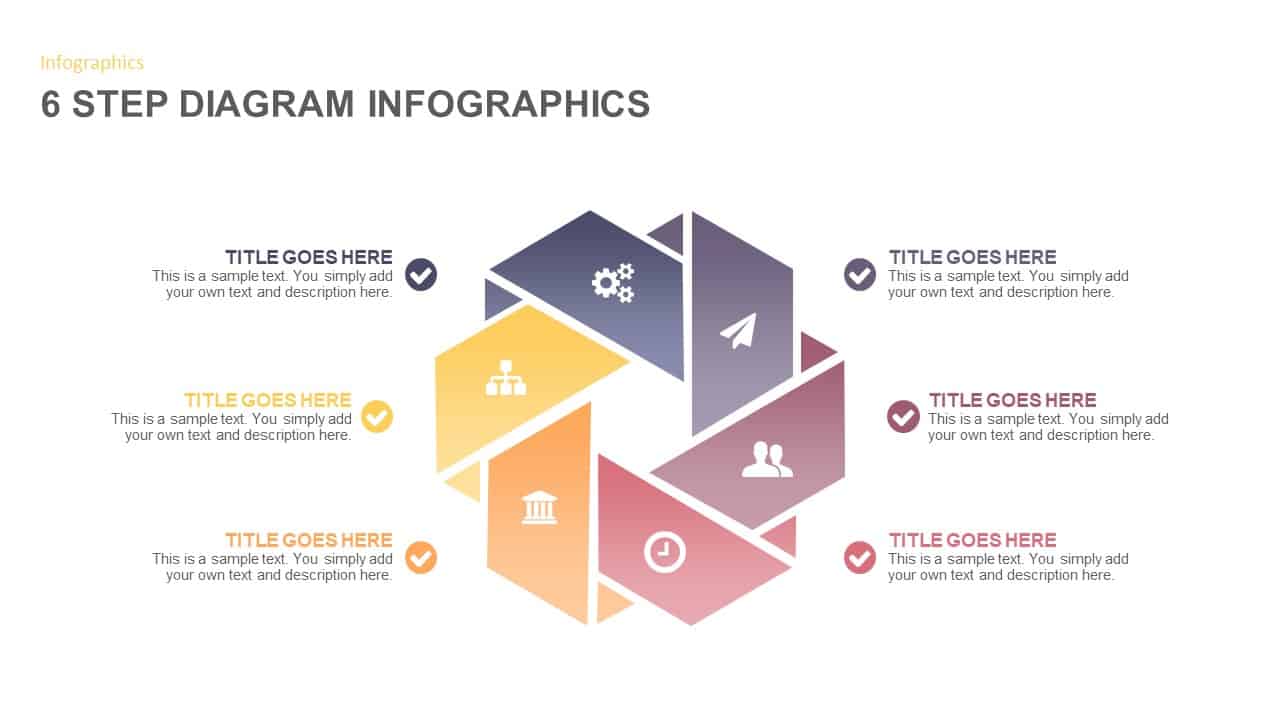
6-Step Circular Diagram Infographic Template for PowerPoint & Google Slides
Circular
8-Step Circular Gear Infographic Diagram Template for PowerPoint & Google Slides
Circular
6-Part Circular Gear Infographic Diagram Template for PowerPoint & Google Slides
Process

Circular CRM Process Infographic Diagram Template for PowerPoint & Google Slides
Circular
4-Step Circular Infographic Diagram Template for PowerPoint & Google Slides
Circular
SWOT Analysis Circular Infographic Template for PowerPoint & Google Slides
SWOT
3 & 4 Step Circular Process Infographic Template for PowerPoint & Google Slides
Process
Modern Circular OODA Loop Infographic Template for PowerPoint & Google Slides
Circular
Circular Arrows Infographic Template for PowerPoint & Google Slides
Business
Circular SWOT Analysis Infographic Template for PowerPoint & Google Slides
SWOT

Free Five-Step Circular Timeline Infographic Template for PowerPoint & Google Slides
Timeline
Free
Five-Stage Circular Arrow Infographic Template for PowerPoint & Google Slides
Circular
Accomplishment Circular Infographic Template for PowerPoint & Google Slides
Accomplishment
Six-Segment Circular Arrow Infographic Template for PowerPoint & Google Slides
Circular
Healthcare Nursing Circular Infographic Template for PowerPoint & Google Slides
Nursing
Ten Step Circular Process Infographic Template for PowerPoint & Google Slides
Process
Ten-Step Circular Process Infographic Template for PowerPoint & Google Slides
Circular
Dynamic Circular Hub-and-Spoke Infographic Template for PowerPoint & Google Slides
Circular
Circular Sustainability Infographic Template for PowerPoint & Google Slides
Process
Circular Timeline Infographic Template for PowerPoint & Google Slides
Timeline
Sustainable Business Model Circular Infographic Template for PowerPoint & Google Slides
Business Strategy
Circular Financial Ratios Infographic Template for PowerPoint & Google Slides
Finance
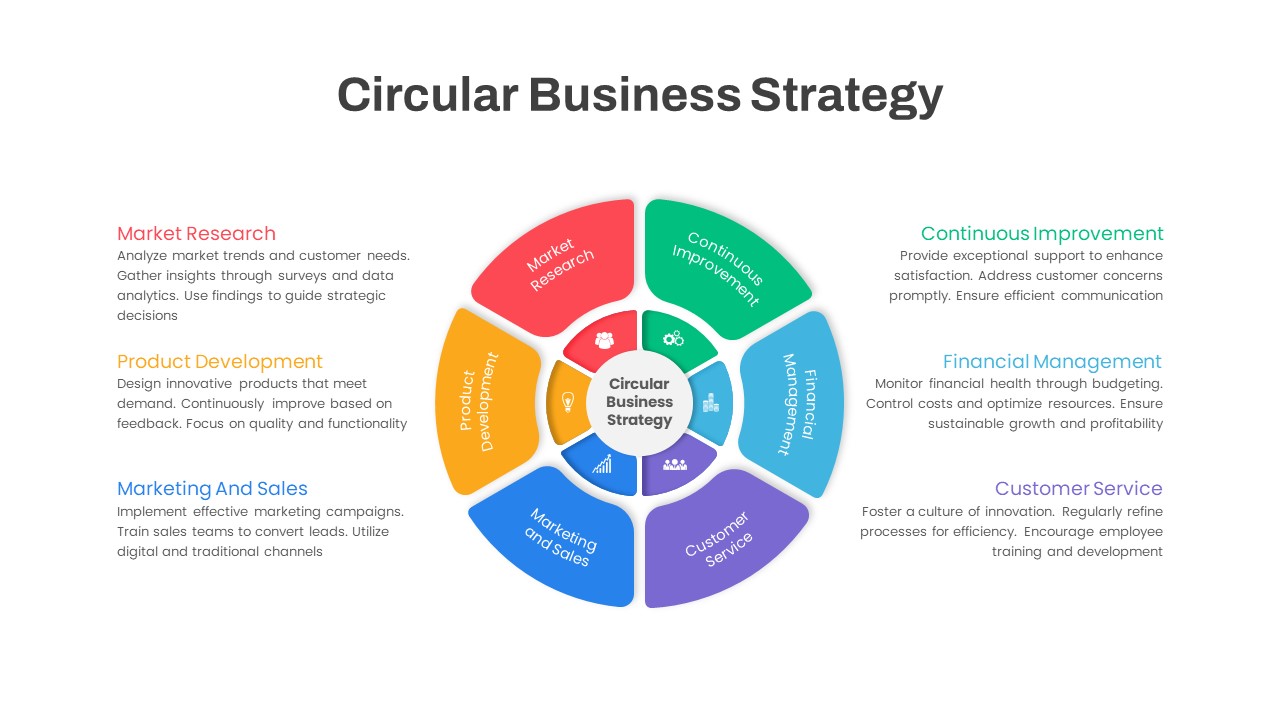
Circular Business Strategy Infographic Template for PowerPoint & Google Slides
Circular
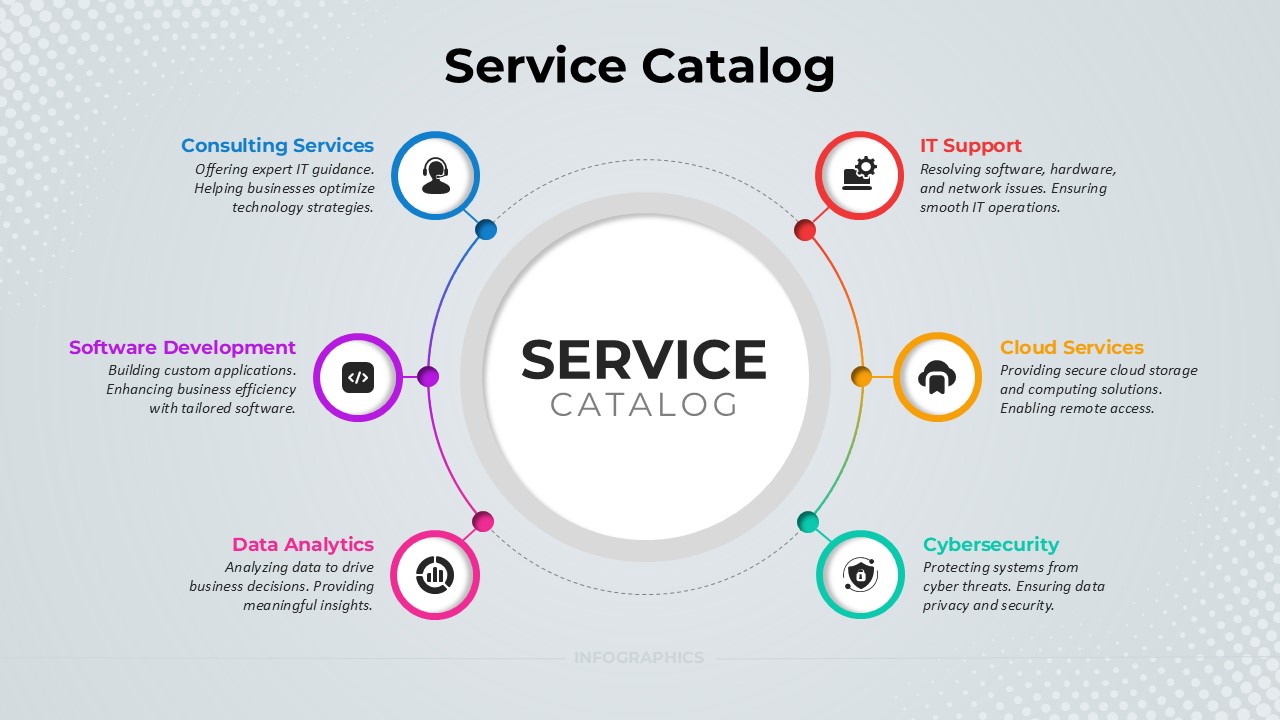
Service Catalog Circular Infographic Template for PowerPoint & Google Slides
Circular
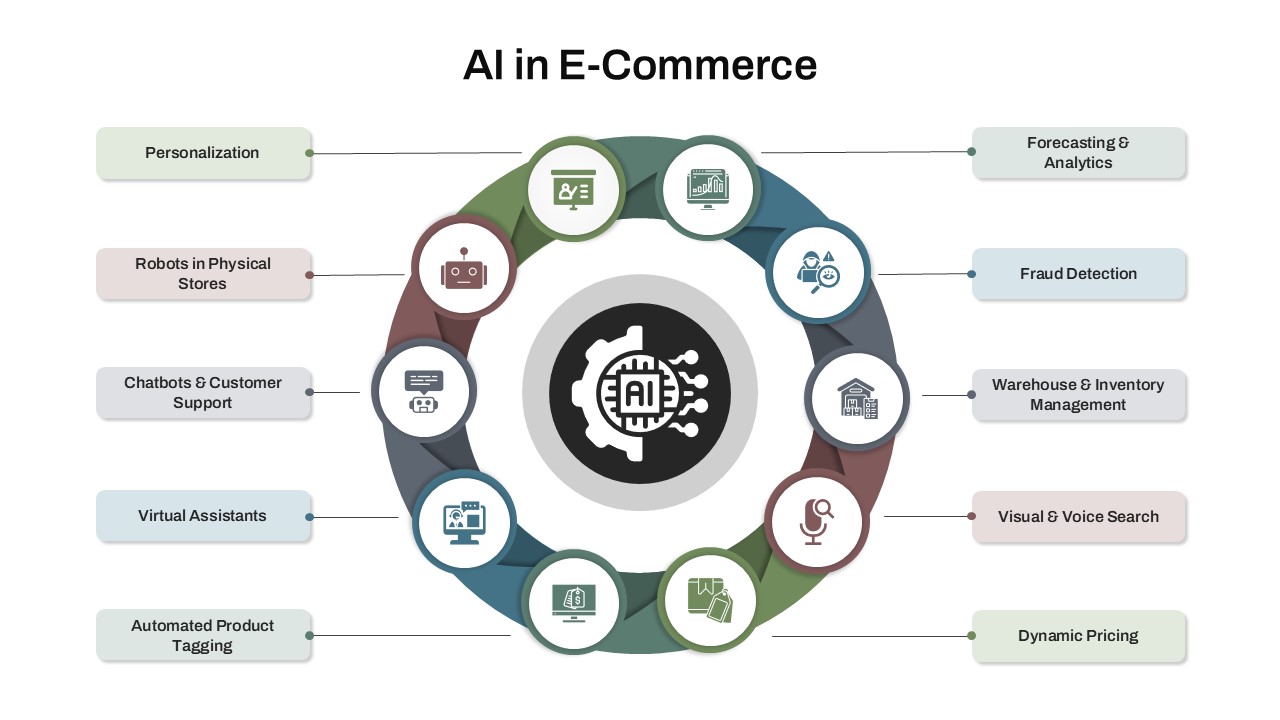
AI in E-Commerce Circular Infographic Template for PowerPoint & Google Slides
AI
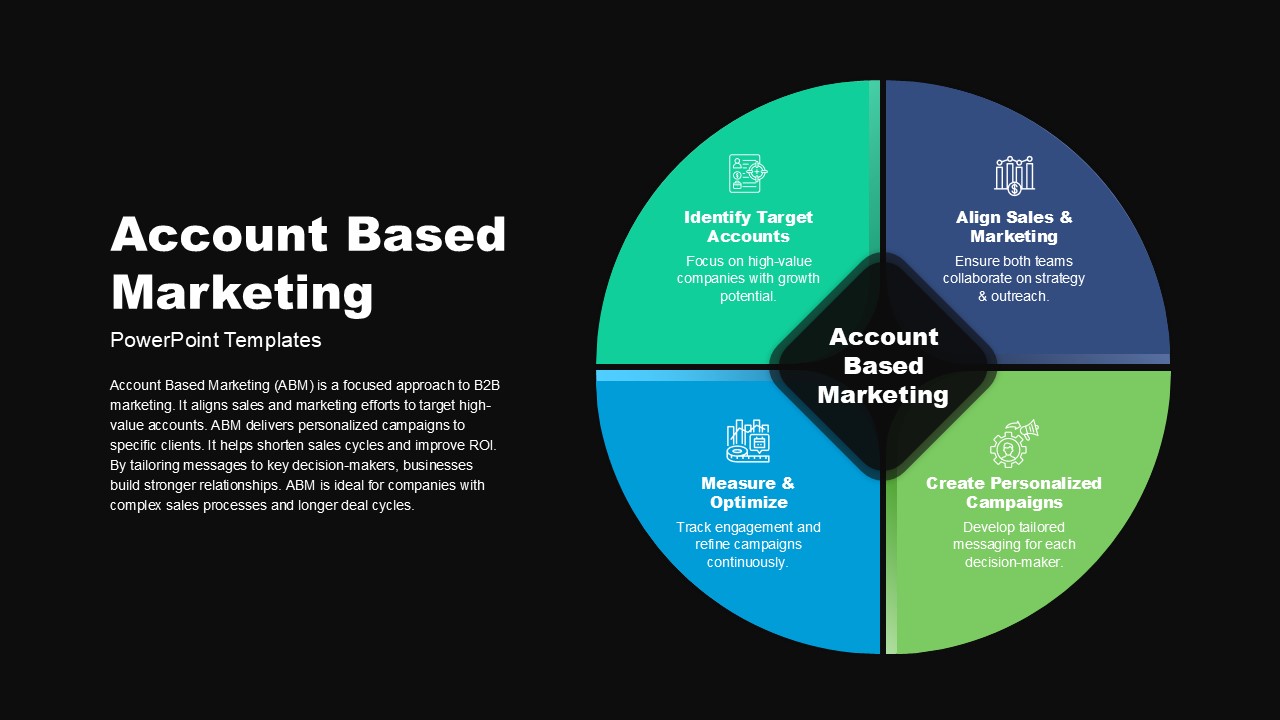
Account Based Marketing Circular Infographic Template for PowerPoint & Google Slides
Marketing
SWOT Analysis Infographic with Circular Icons Template for PowerPoint & Google Slides
SWOT

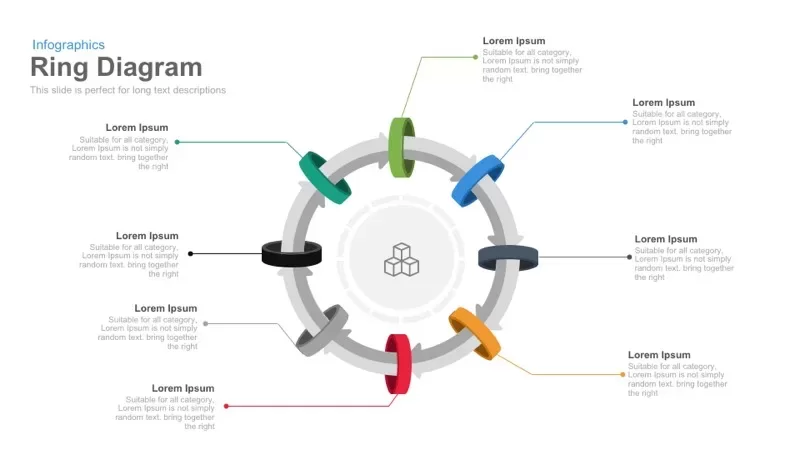
8 Circular Ring Diagram template for PowerPoint & Google Slides
Infographics
Circular Flow Diagram Template for PowerPoint & Google Slides
Infographics
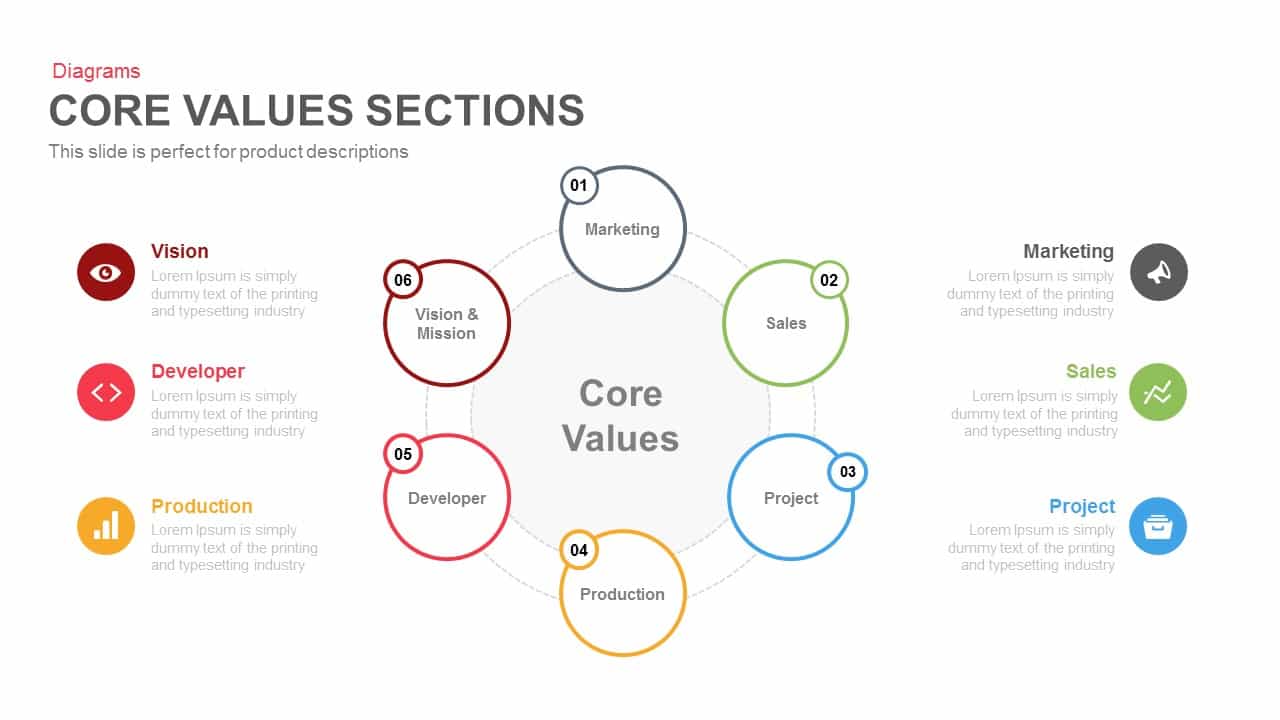
Six-Part Core Values Circular Diagram Template for PowerPoint & Google Slides
Circular
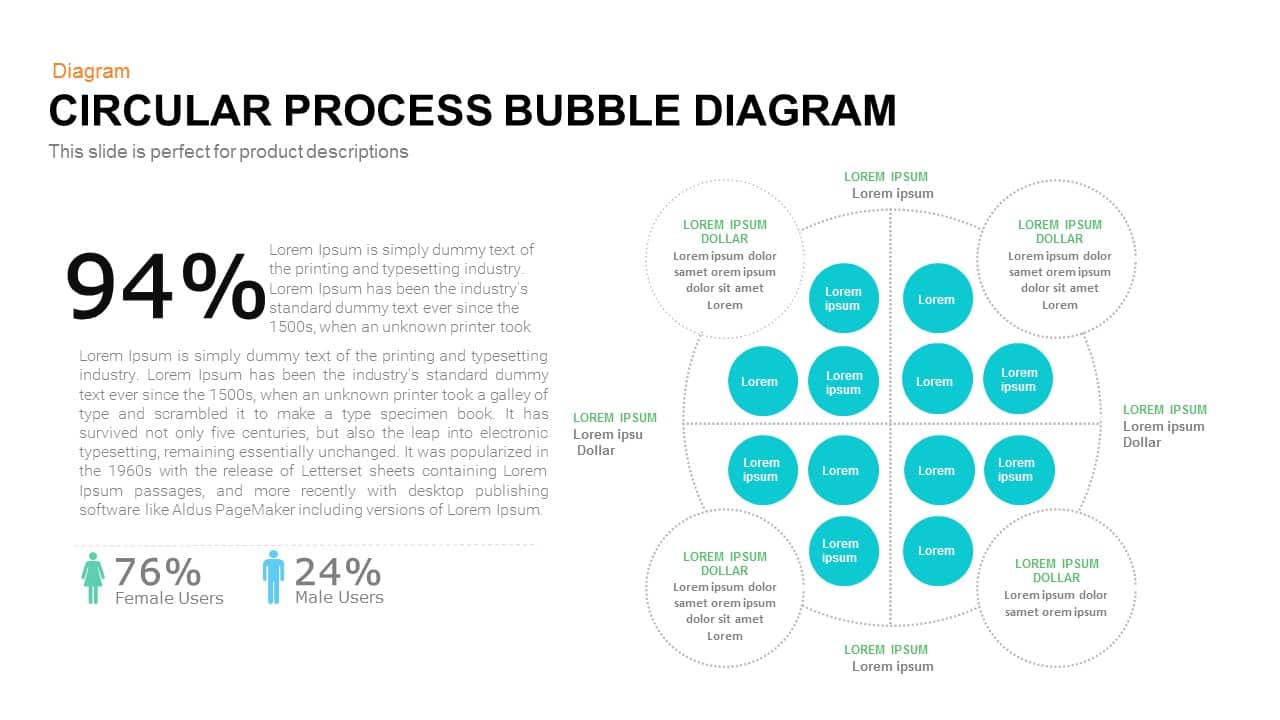
Bubble Circular Process Diagram Template for PowerPoint & Google Slides
Process
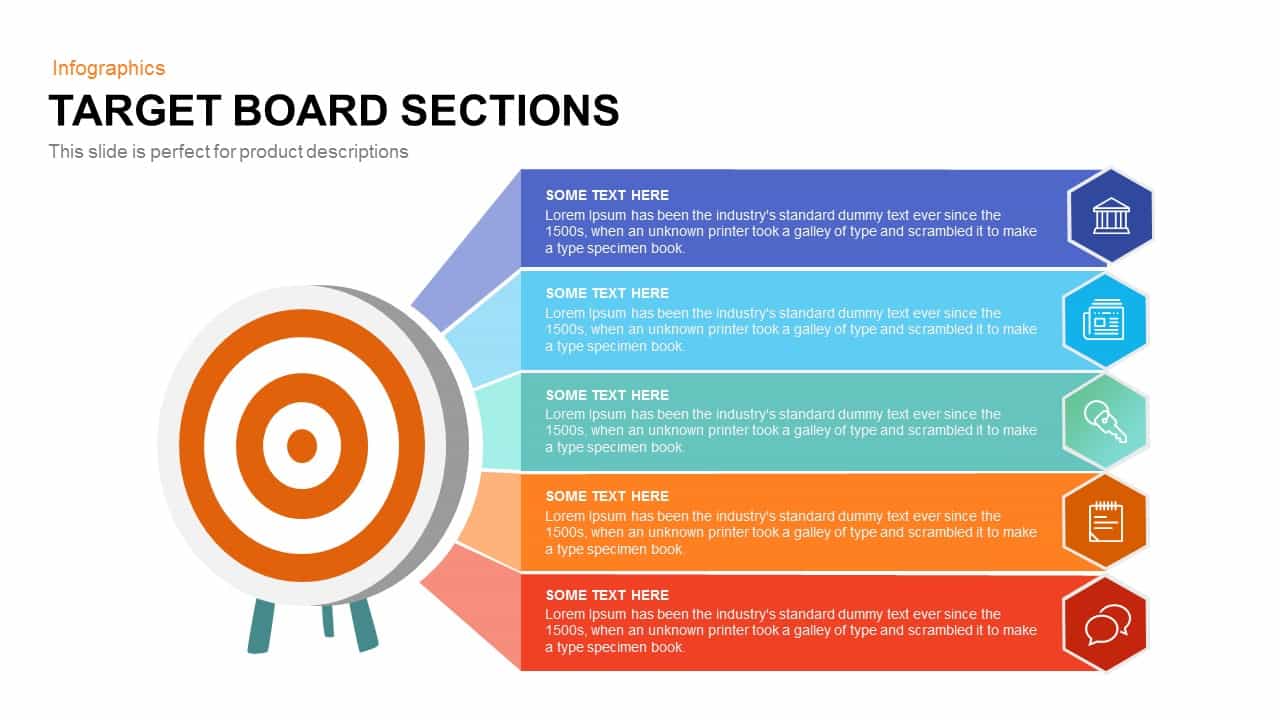
Target Board Sections Circular Diagram Template for PowerPoint & Google Slides
Circular
Three-Stage Circular Options Chart Template for PowerPoint & Google Slides
Comparison
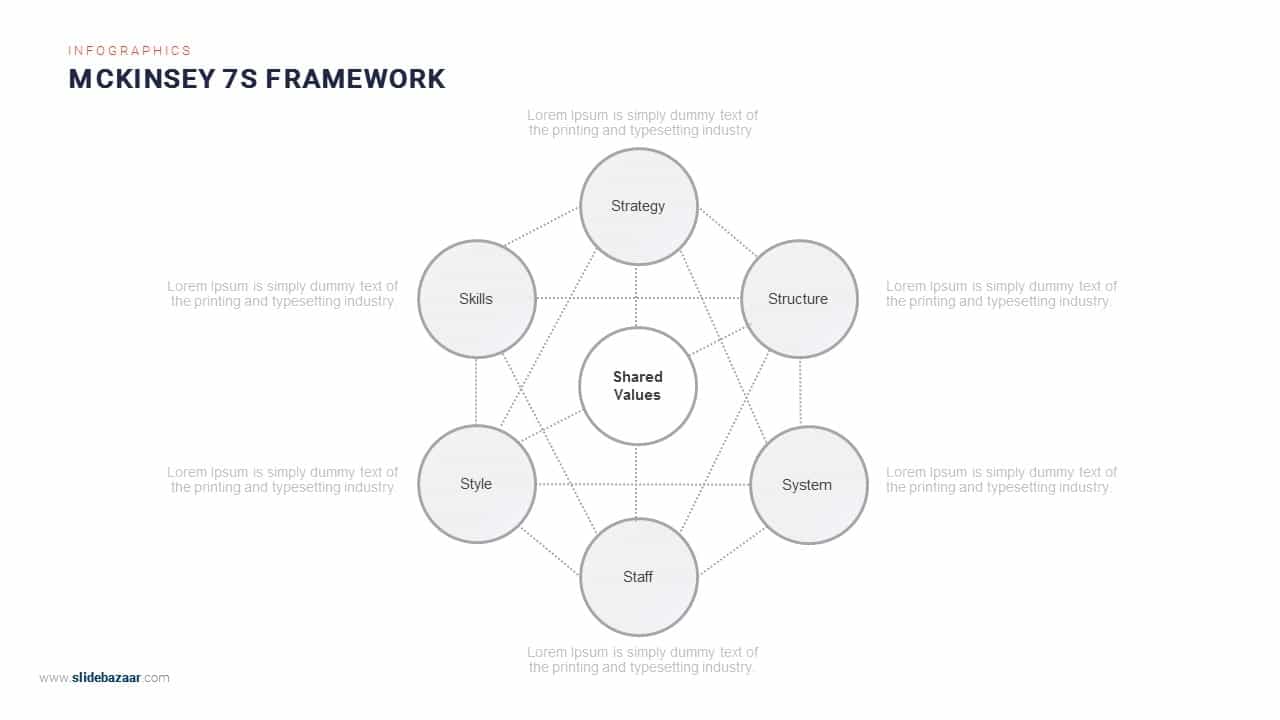
McKinsey 7S Framework Circular Diagram Template for PowerPoint & Google Slides
Circular

Six-Process Circular Arrow Diagram Template for PowerPoint & Google Slides
Circular

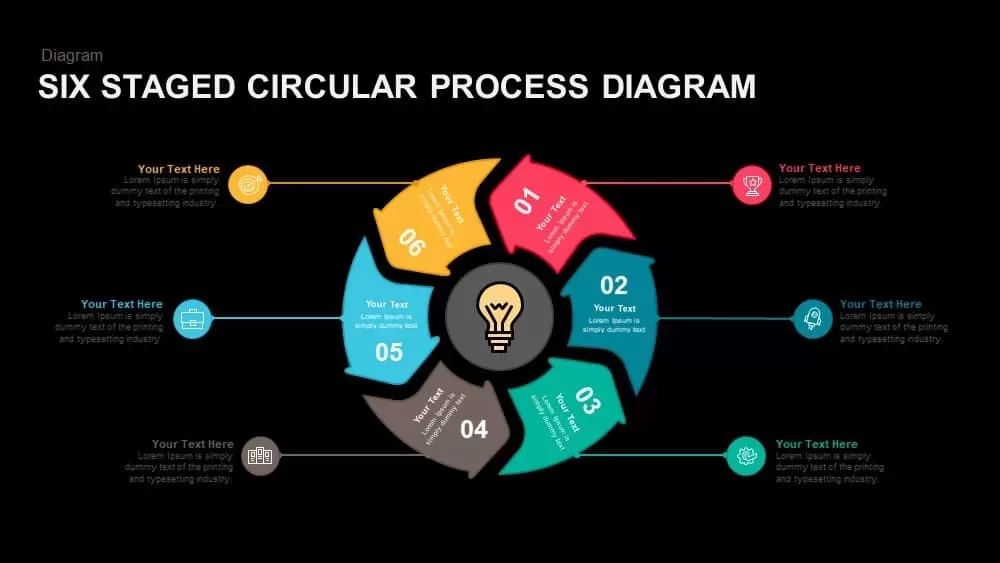
Six-Stage Circular Process Diagram Template for PowerPoint & Google Slides
Process
PEST Analysis Circular Diagram Template for PowerPoint & Google Slides
PEST
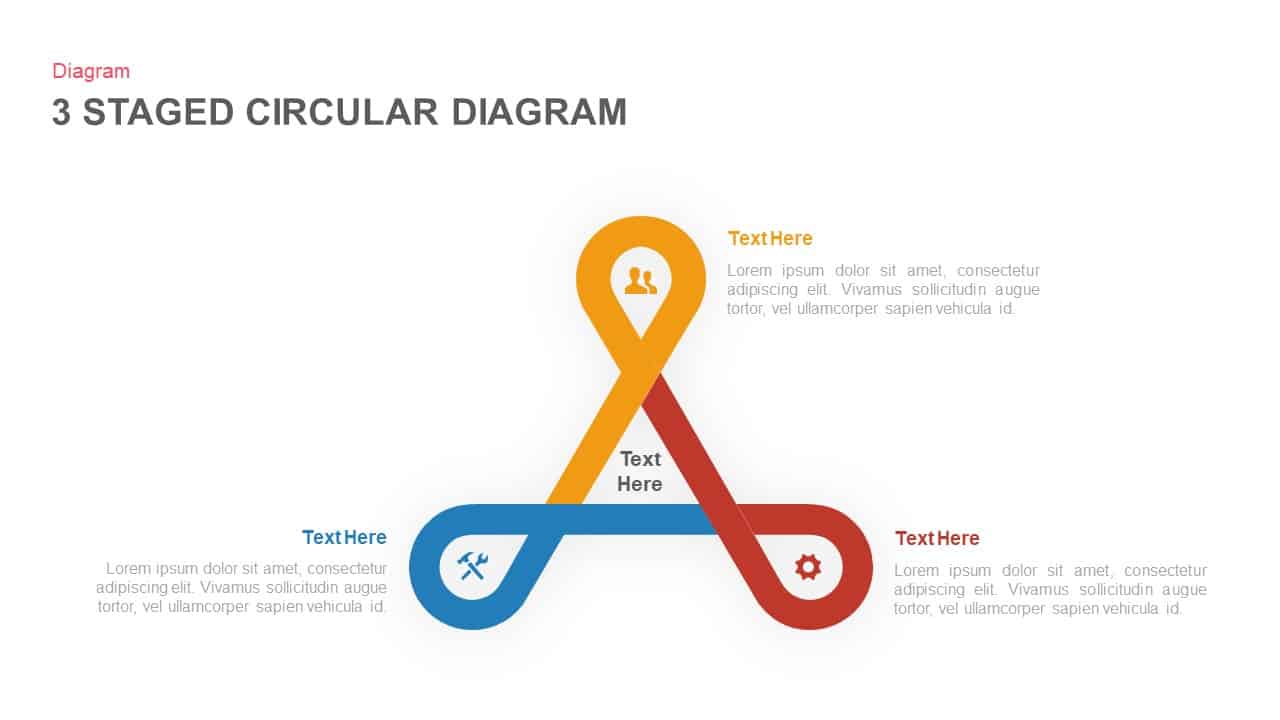
Three to Six Staged Circular Diagram Template for PowerPoint & Google Slides
Process
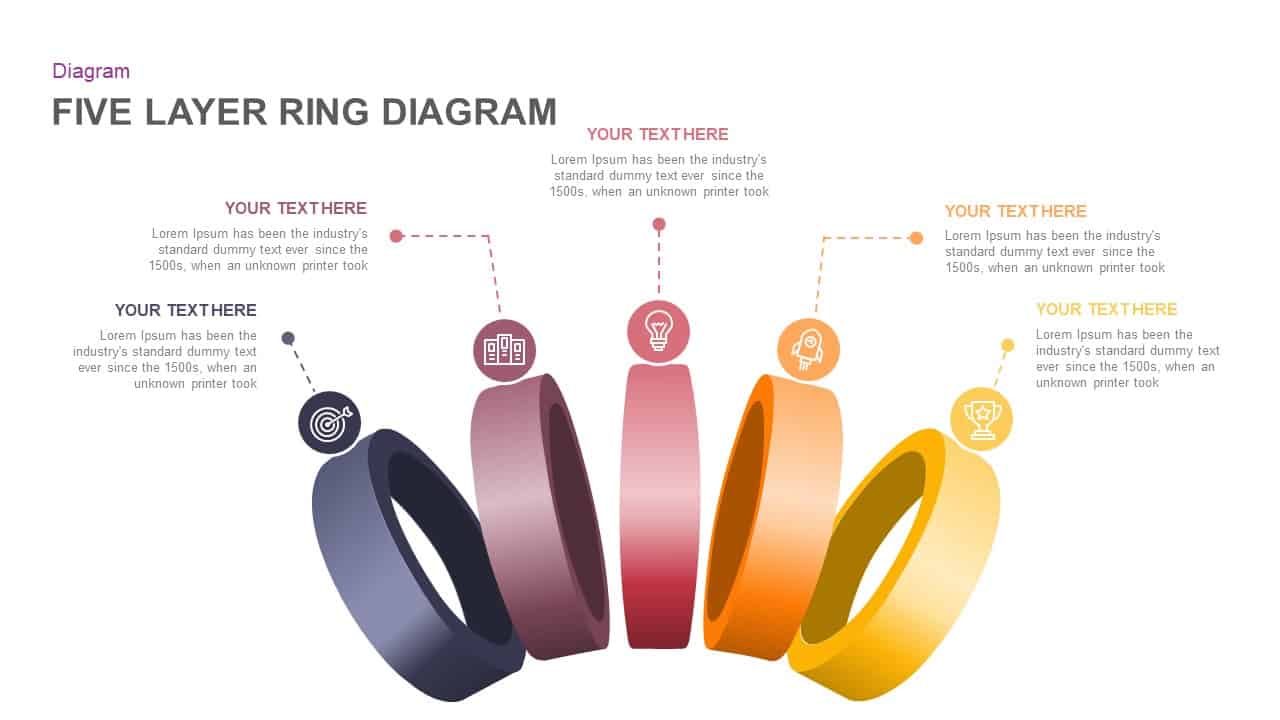
Five Layer Circular Ring Diagram Template for PowerPoint & Google Slides
Circular
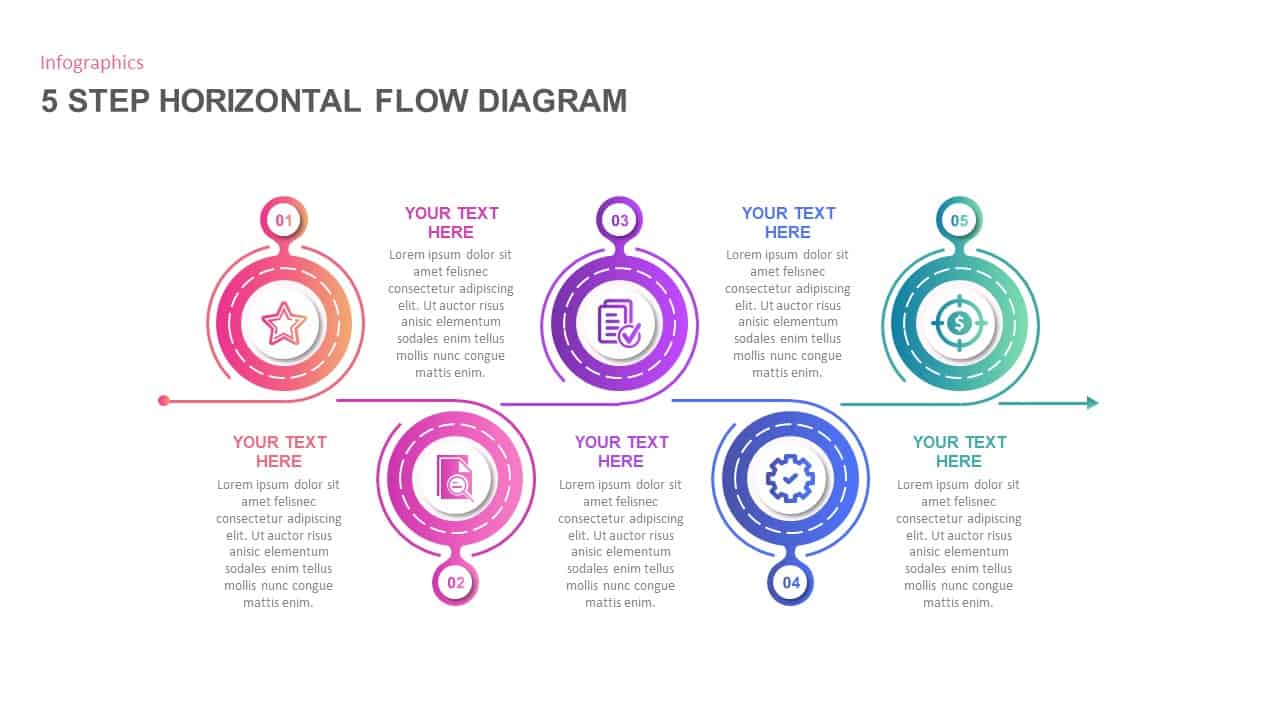
Five-Stage Circular Flow Diagram Template for PowerPoint & Google Slides
Circular
Four-Stage Circular Flow Diagram Template for PowerPoint & Google Slides
Circular
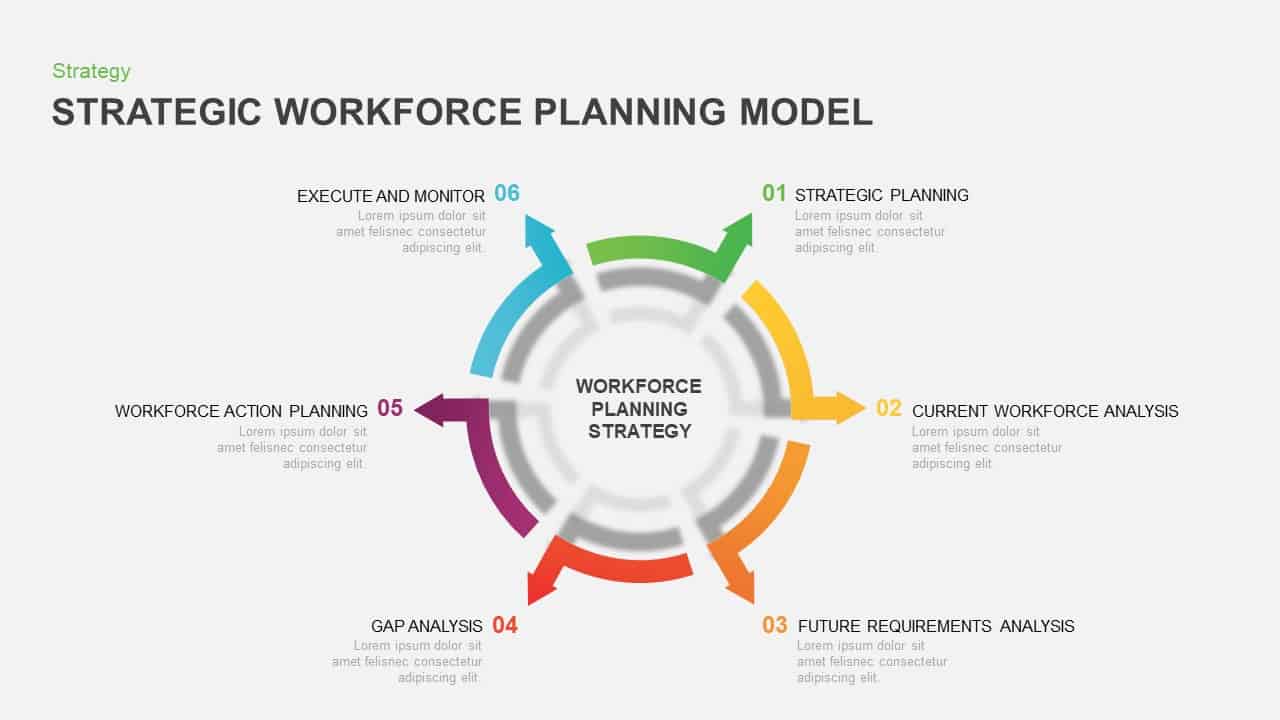
Strategic Workforce Planning Circular Template for PowerPoint & Google Slides
Circular
Value Chain Circular Process Diagram Template for PowerPoint & Google Slides
Business Models
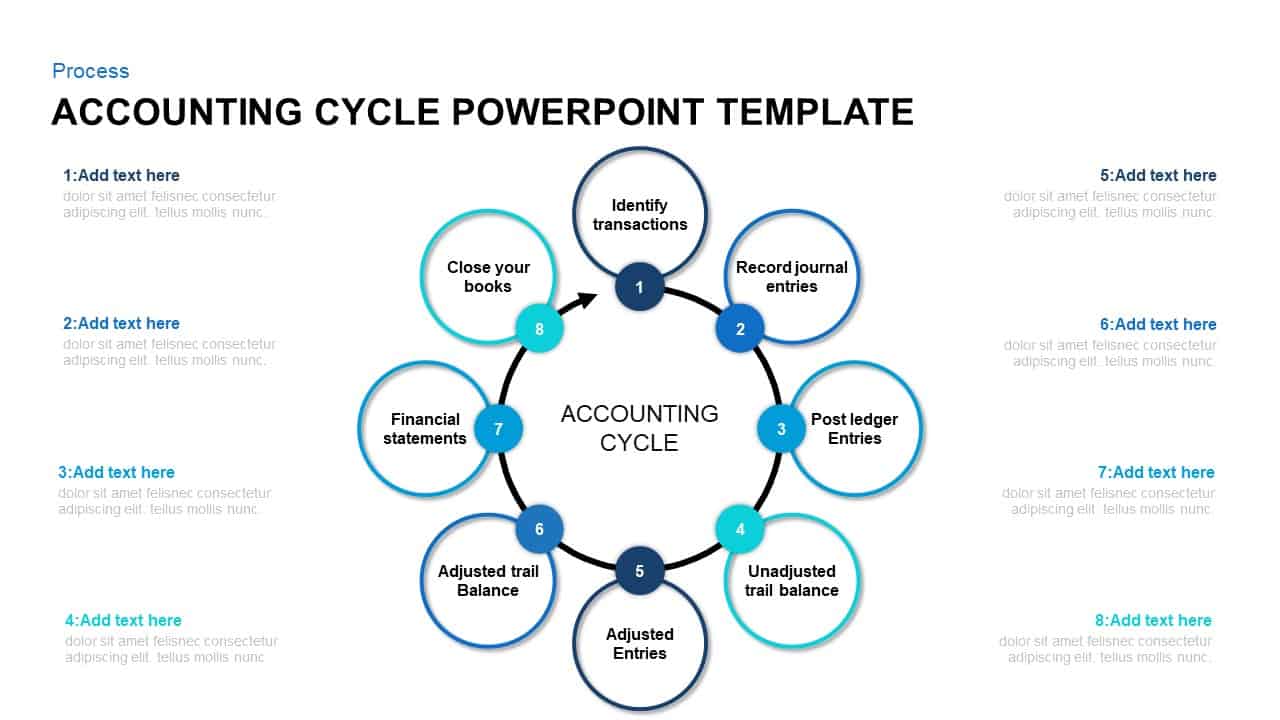
8-Step Circular Accounting Cycle Diagram Template for PowerPoint & Google Slides
Accounting
Six-Stage Circular Flow Diagram Template for PowerPoint & Google Slides
Circular
5-Step Circular Gradient Process Flow Template for PowerPoint & Google Slides
Process
2-8 Step Circular Diagram Template for PowerPoint & Google Slides
Infographics
4-Step Circular PDCA Cycle Diagram Template for PowerPoint & Google Slides
Process
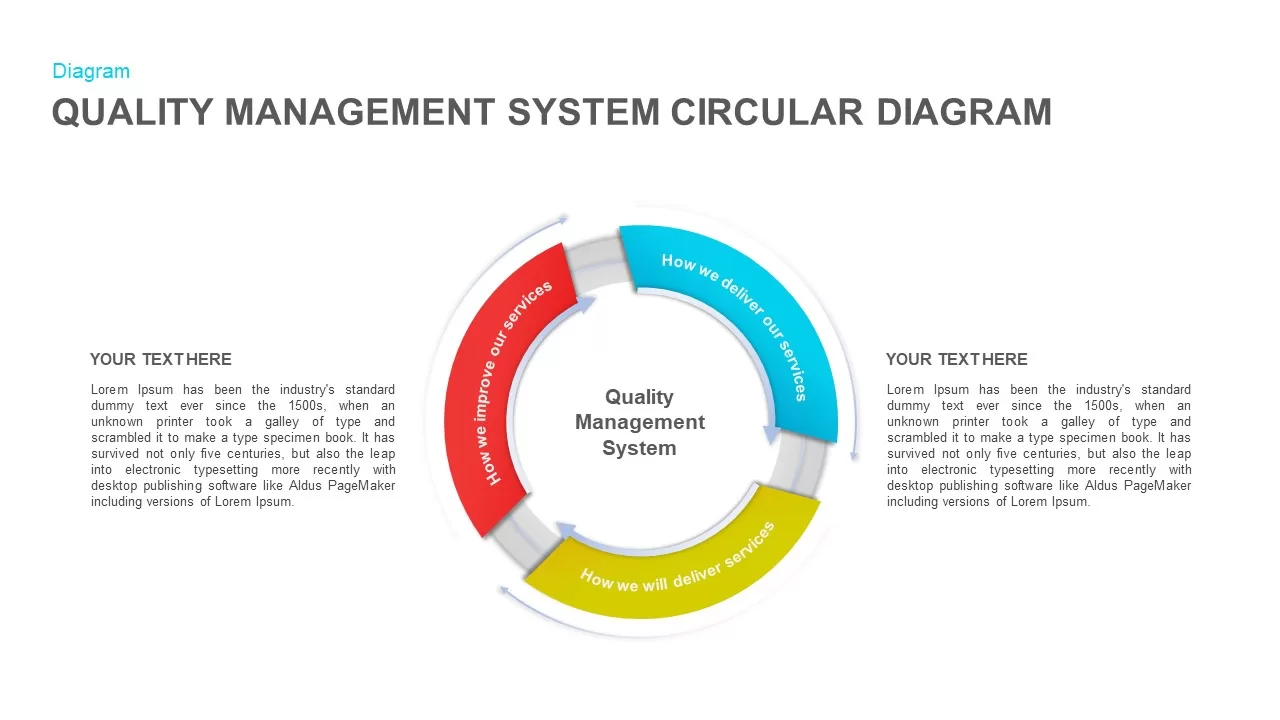
Quality Management System Circular Diagram template for PowerPoint & Google Slides
Process
Six-Step Circular Diagram Infographics Template for PowerPoint & Google Slides
Circular
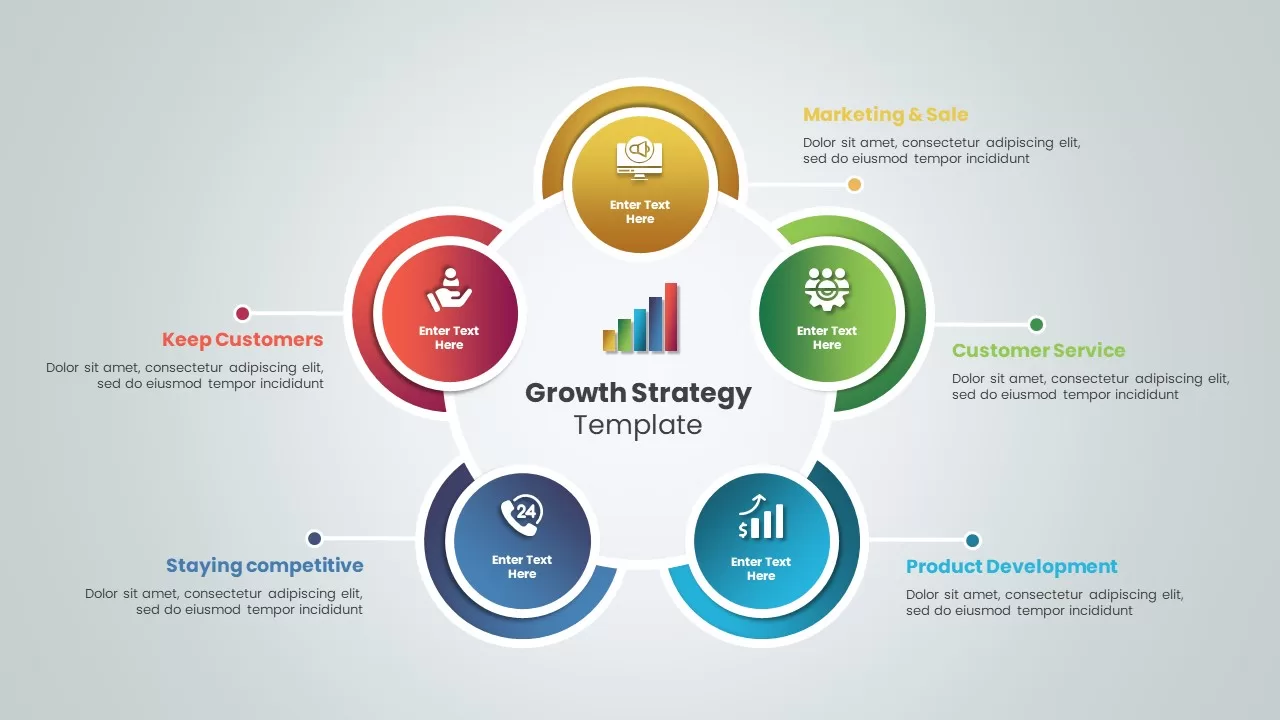
Growth Strategy Circular Diagram Template for PowerPoint & Google Slides
Circular
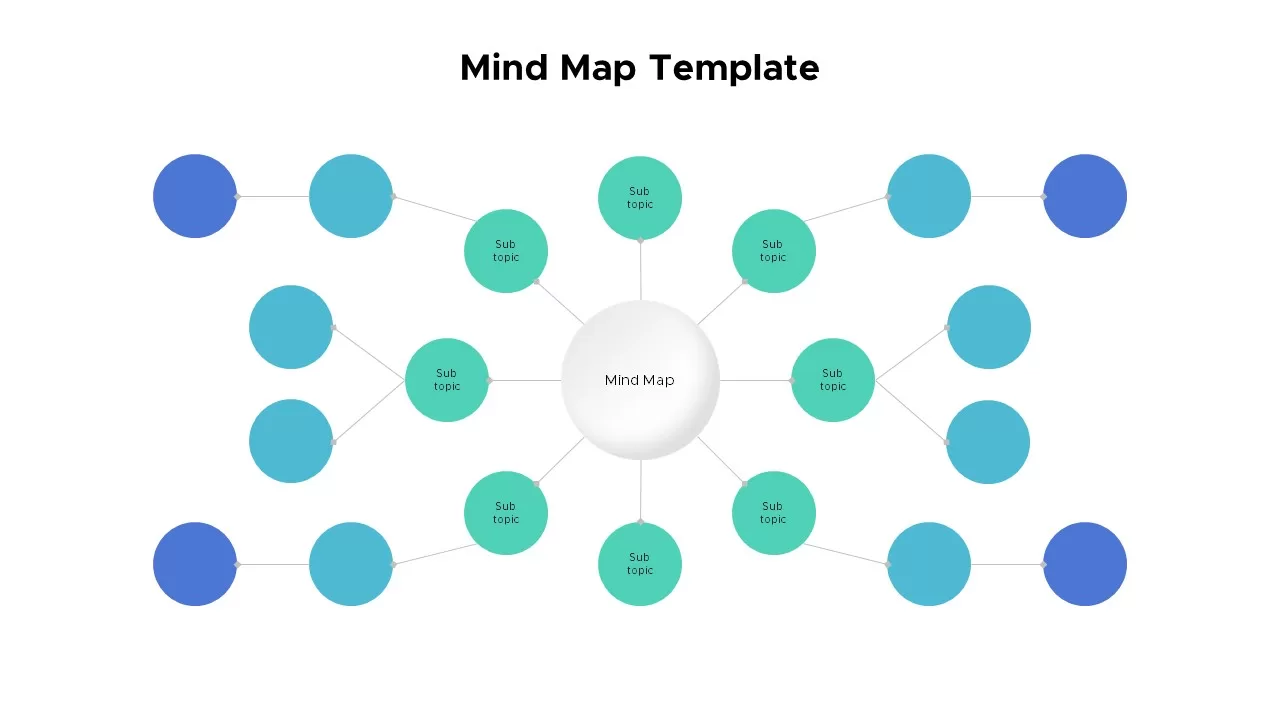
Circular Mind Map Template for PowerPoint & Google Slides
Mind Maps
Six-Segment Circular Arrow Cycle Template for PowerPoint & Google Slides
Circular
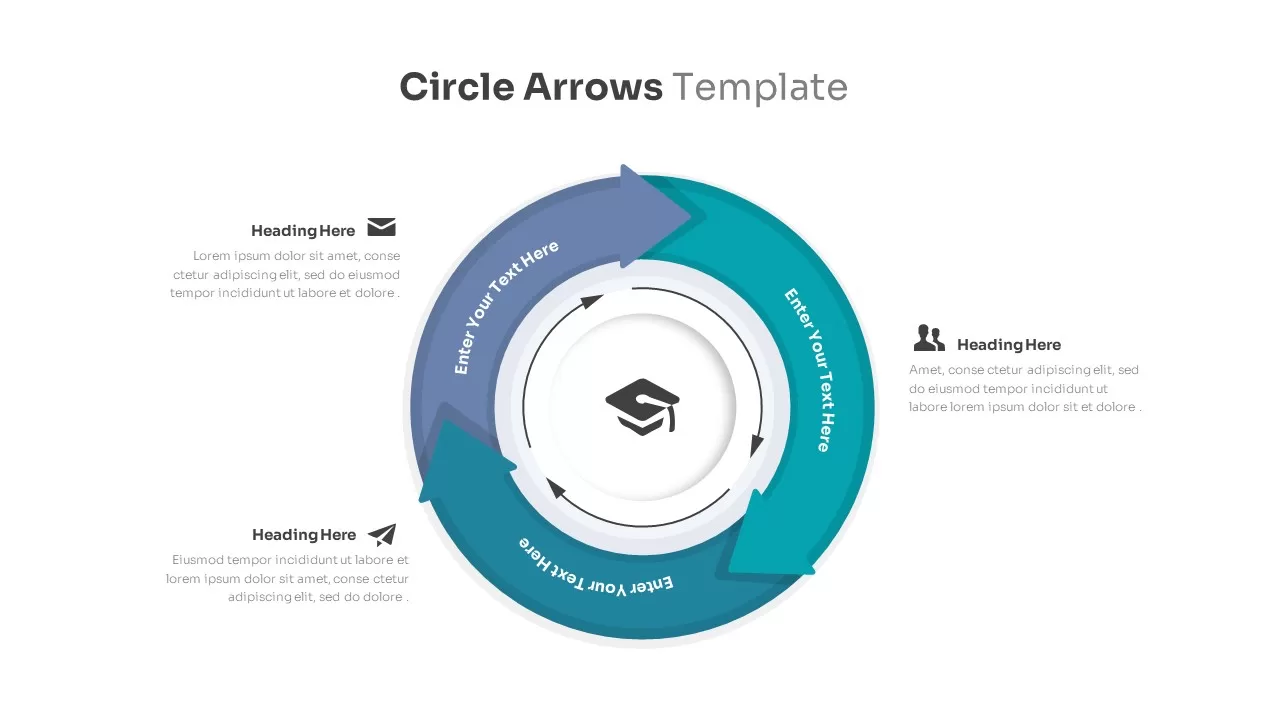
Circular Arrows Process Flow template for PowerPoint & Google Slides
Process
Three-Step Circular Arrows Diagram Template for PowerPoint & Google Slides
Process
10-Step Colorful Circular Diagram Template for PowerPoint & Google Slides
Circular
Geometric Circular Cover Slide Template for PowerPoint & Google Slides
Company Profile
Modern 11-Step Circular Timeline Template for PowerPoint & Google Slides
Timeline
Multi-Variation Circular Chart Diagram Template for PowerPoint & Google Slides
Circular
Circular Go To Market Strategy Template for PowerPoint & Google Slides
Business Strategy
Free
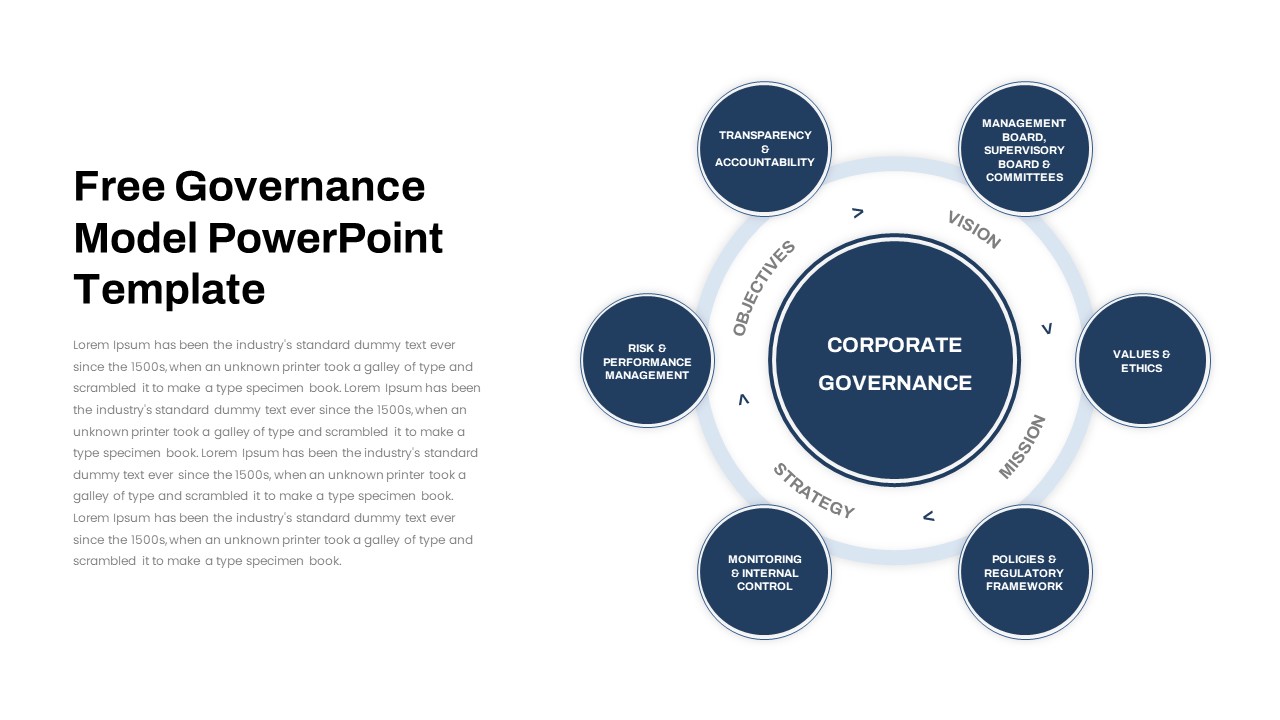
Free Corporate Governance Circular Model Template for PowerPoint & Google Slides
Circular
Free
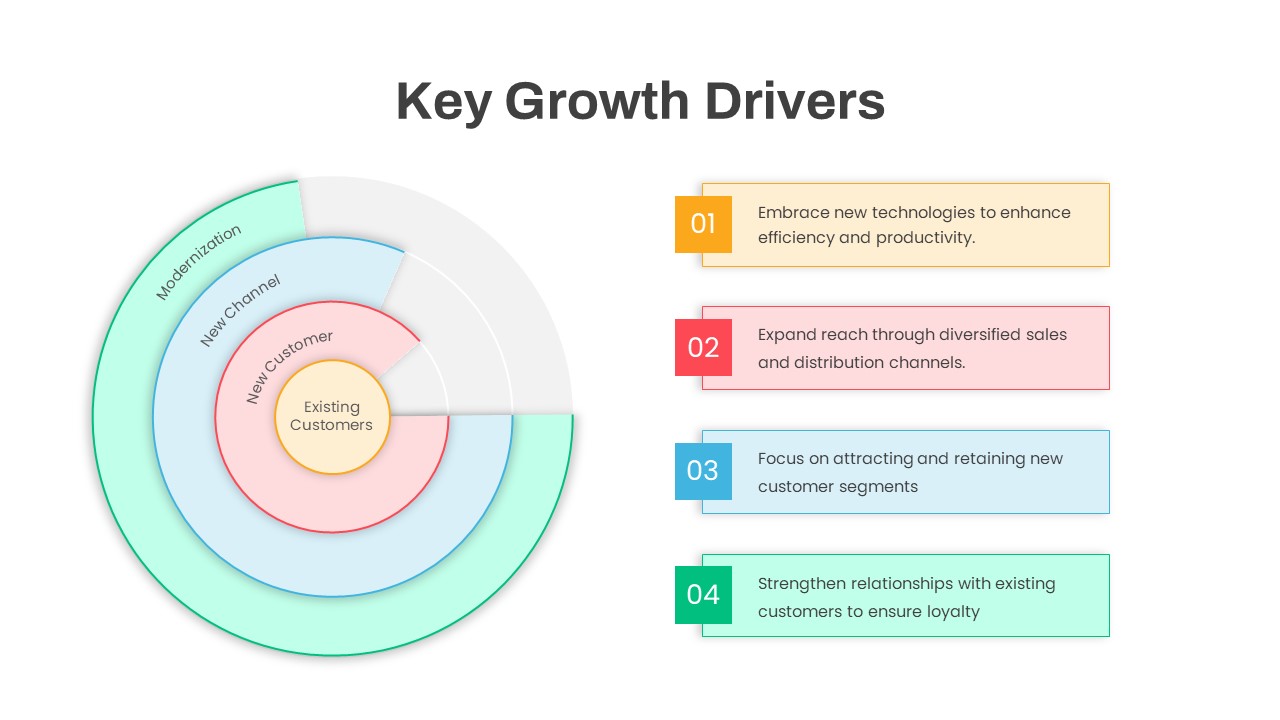
Circular Key Growth Drivers Diagram Template for PowerPoint & Google Slides
Circular
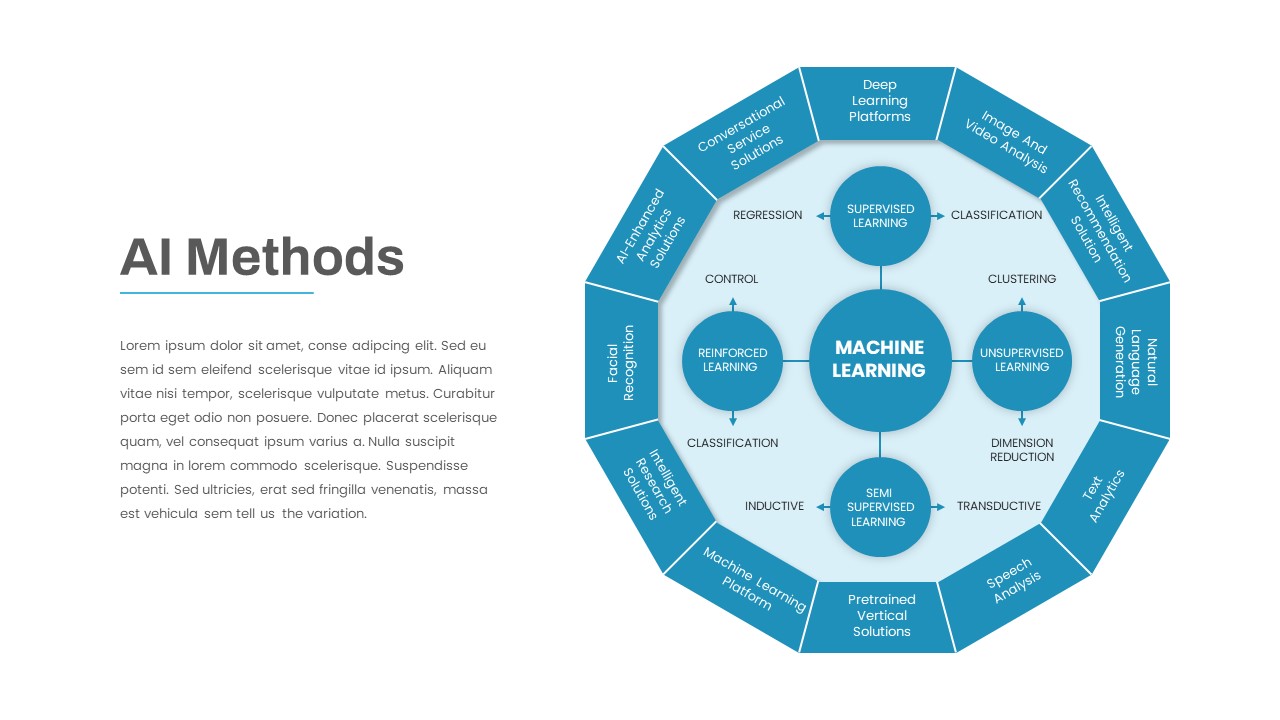
AI Methods Circular Diagram Slide Template for PowerPoint & Google Slides
AI
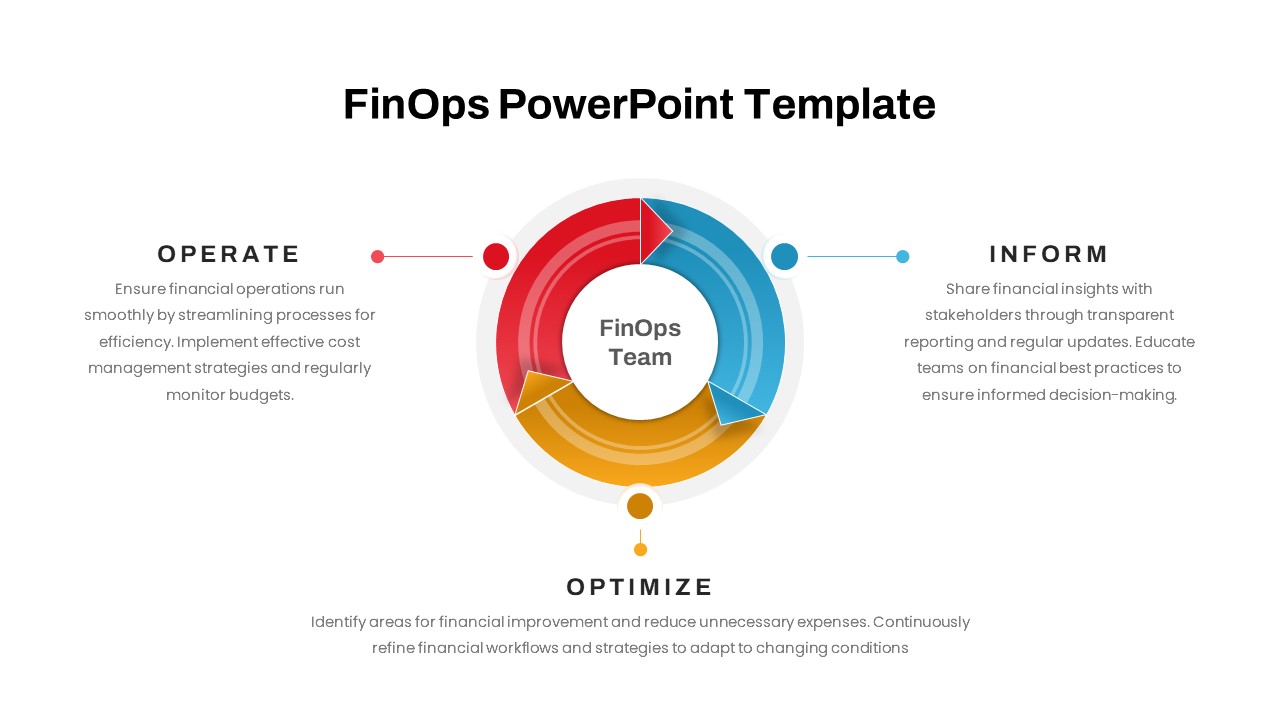
FinOps Circular Workflow Template for PowerPoint & Google Slides
Circular
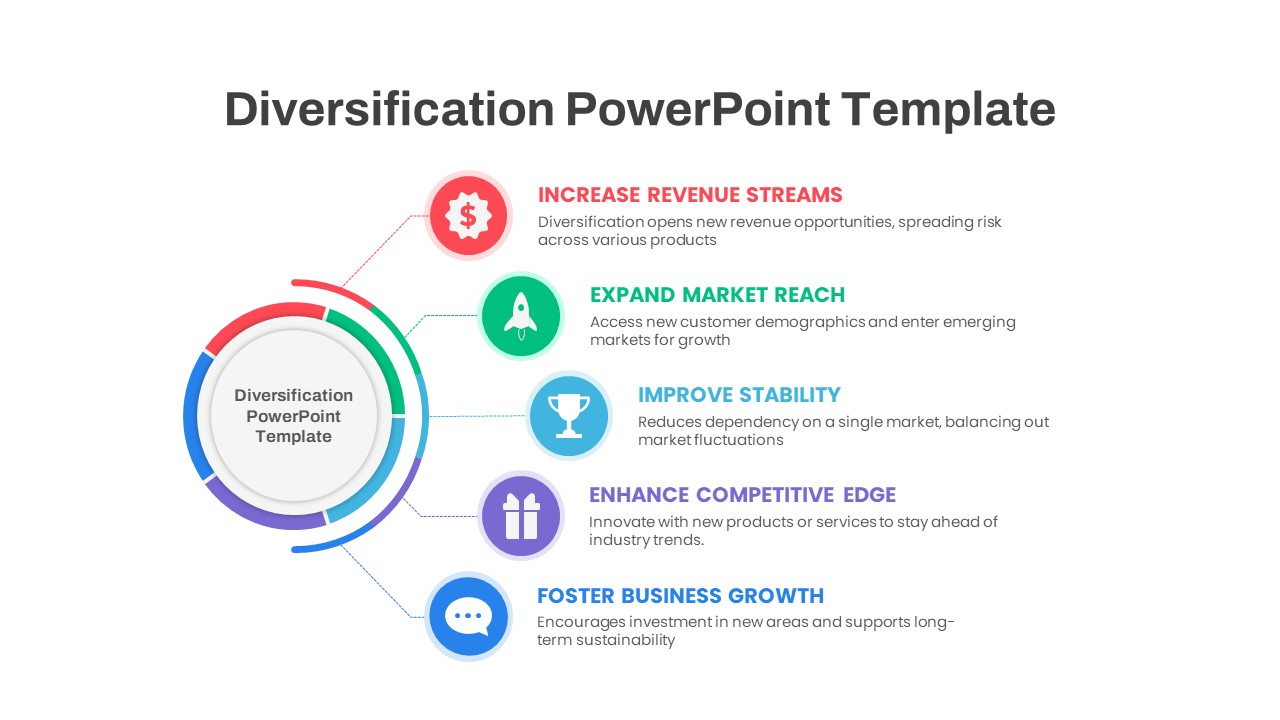
Circular Diversification Strategy Template for PowerPoint & Google Slides
Circular
5Cs of Network Effect Circular Diagram Template for PowerPoint & Google Slides
Circular
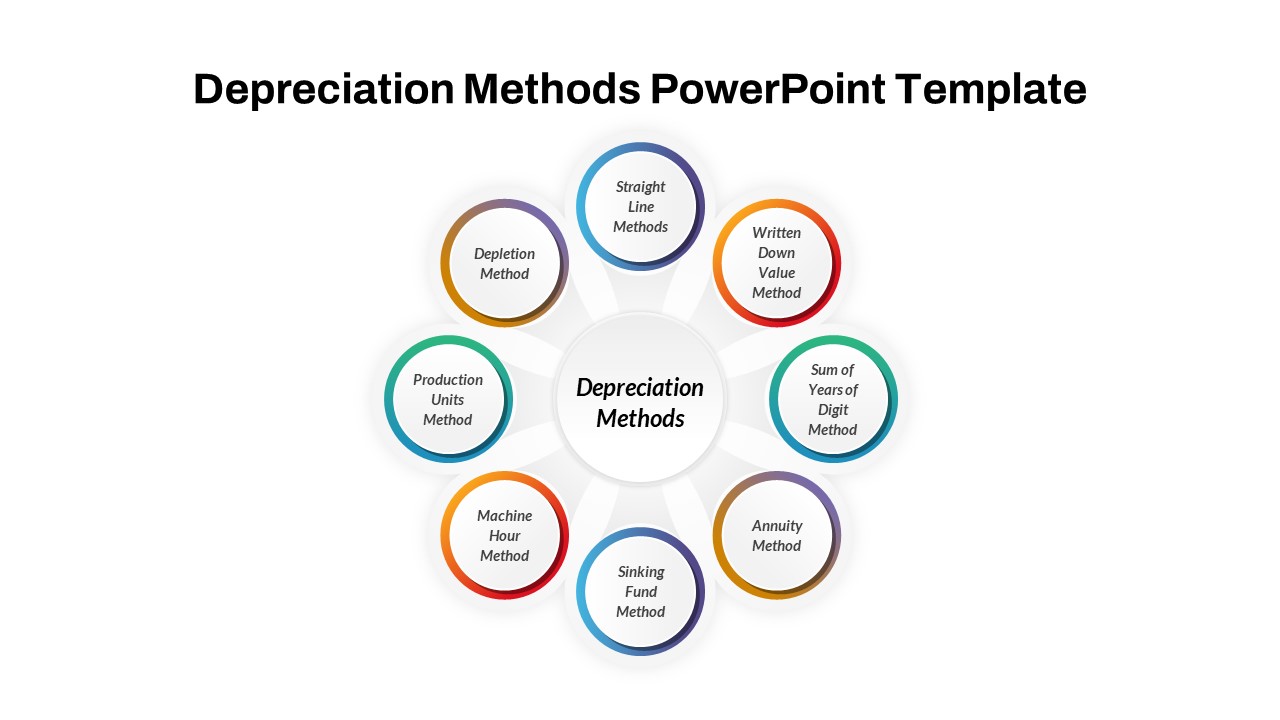
Depreciation Methods Circular Diagram Template for PowerPoint & Google Slides
Circular
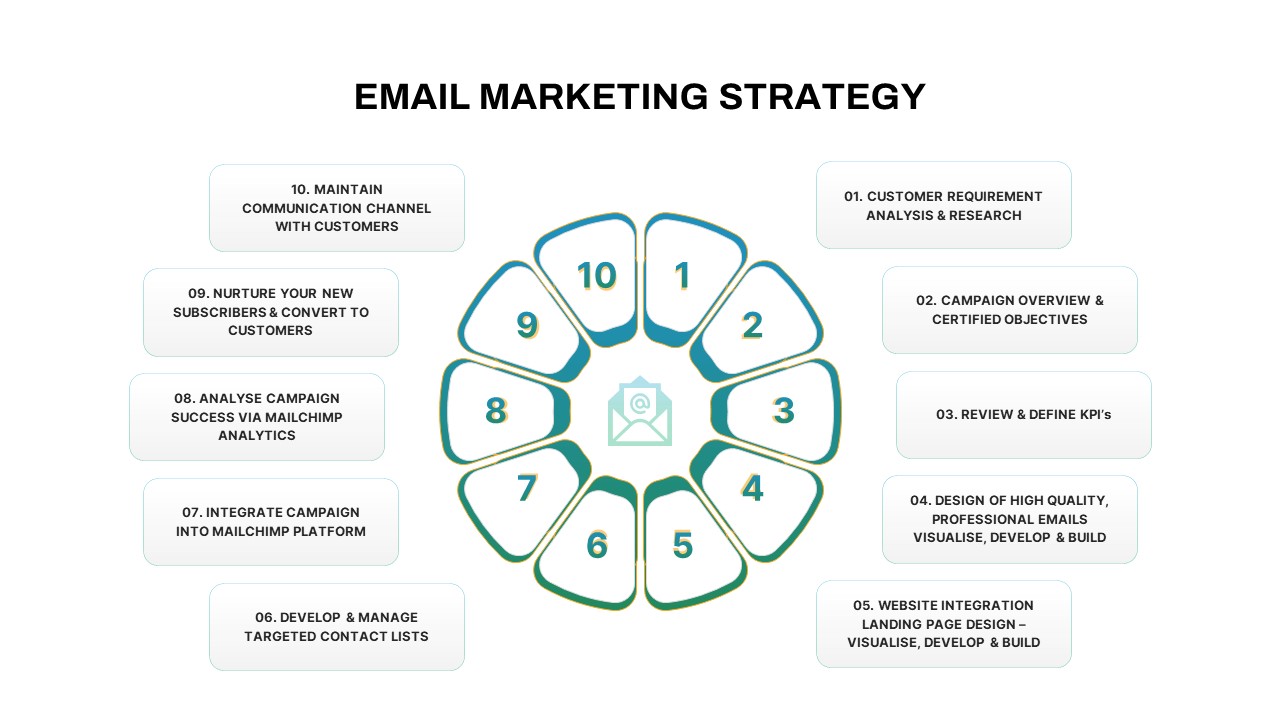
Email Marketing Strategy Circular Template for PowerPoint & Google Slides
Process
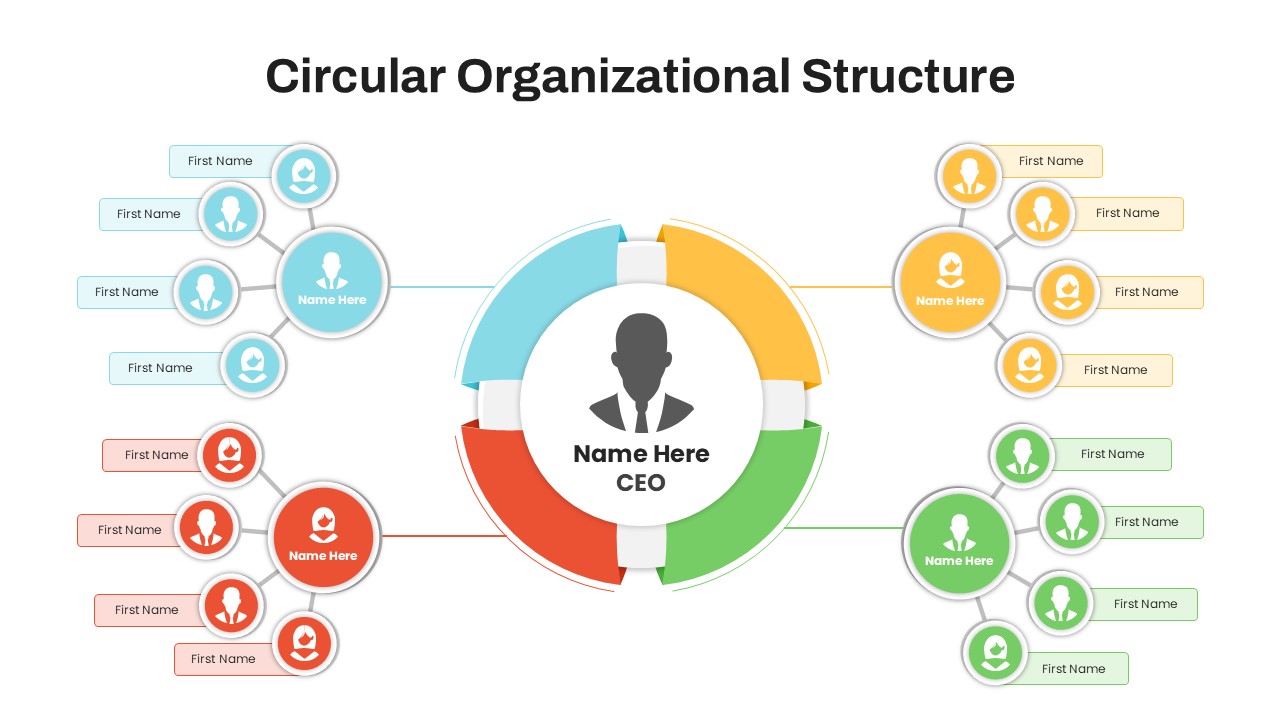
Circular Organizational Structure Template for PowerPoint & Google Slides
Org Chart
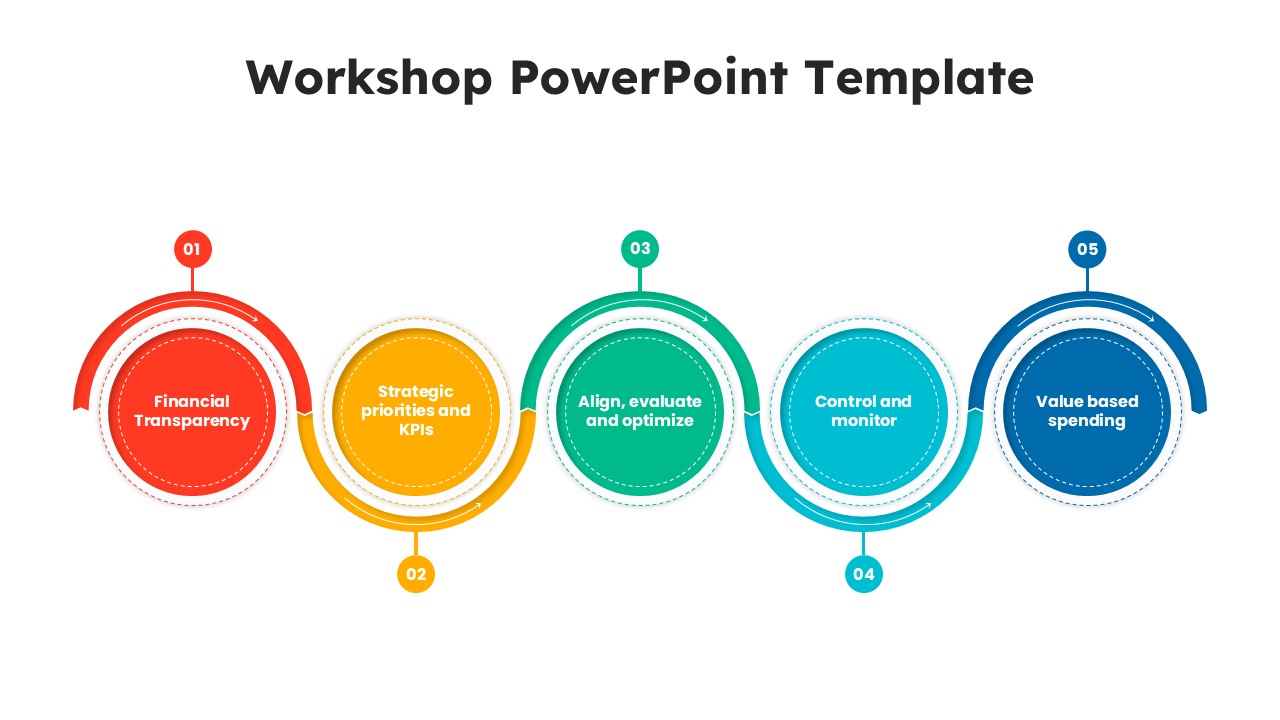
Workshop 5-Step Circular Process Diagram Template for PowerPoint & Google Slides
Circular
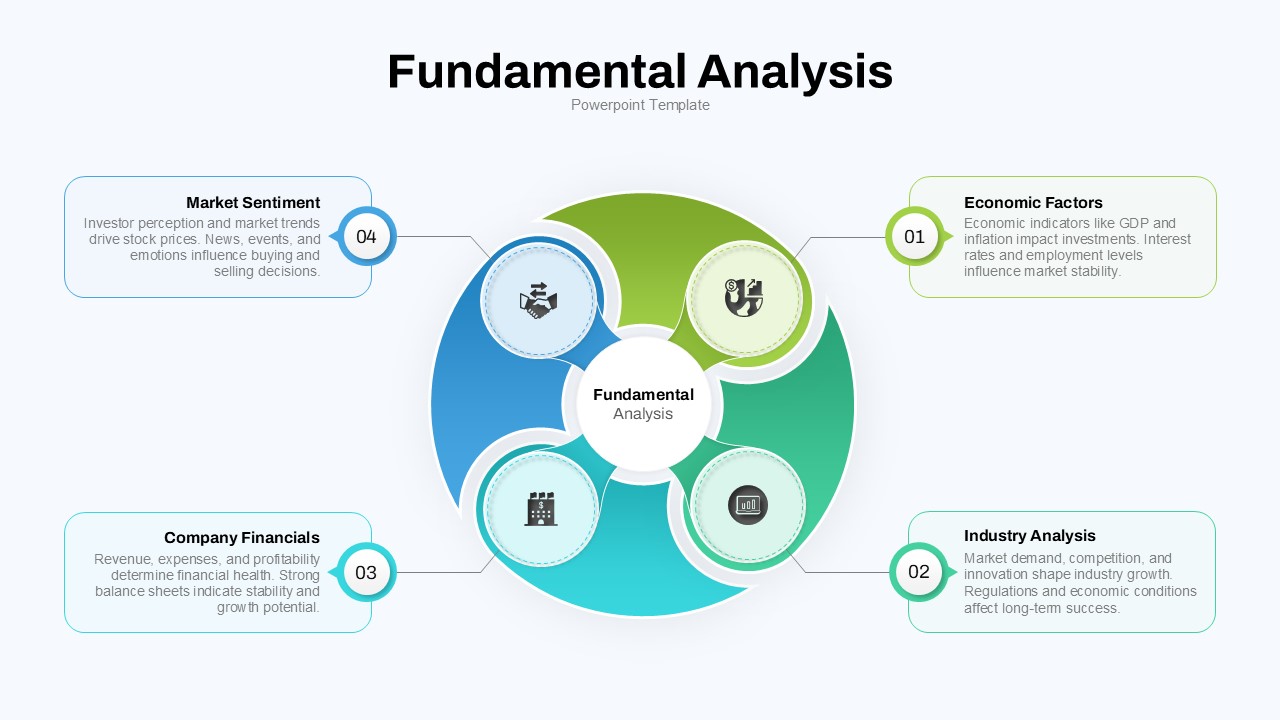
Fundamental Analysis Circular Diagram Template for PowerPoint & Google Slides
Circular
Cultural Web Analysis Circular Diagram Template for PowerPoint & Google Slides
Circular
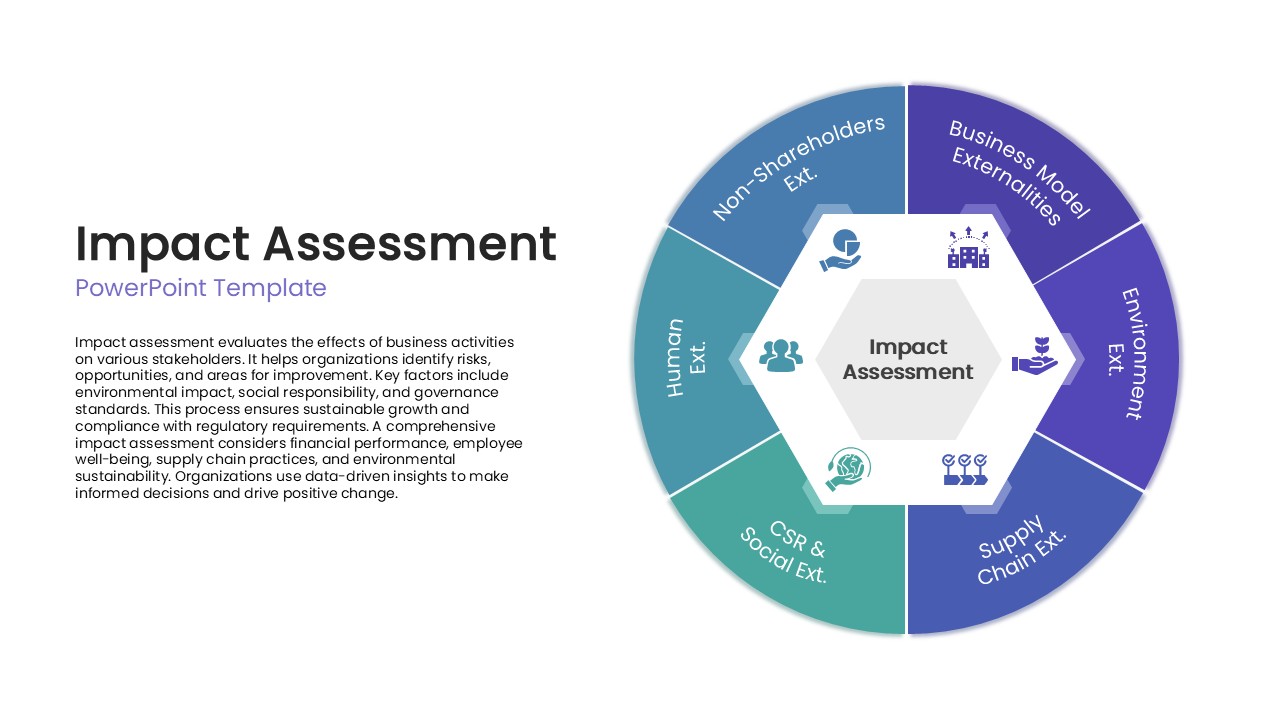
Impact Assessment Circular Diagram Template for PowerPoint & Google Slides
Circular
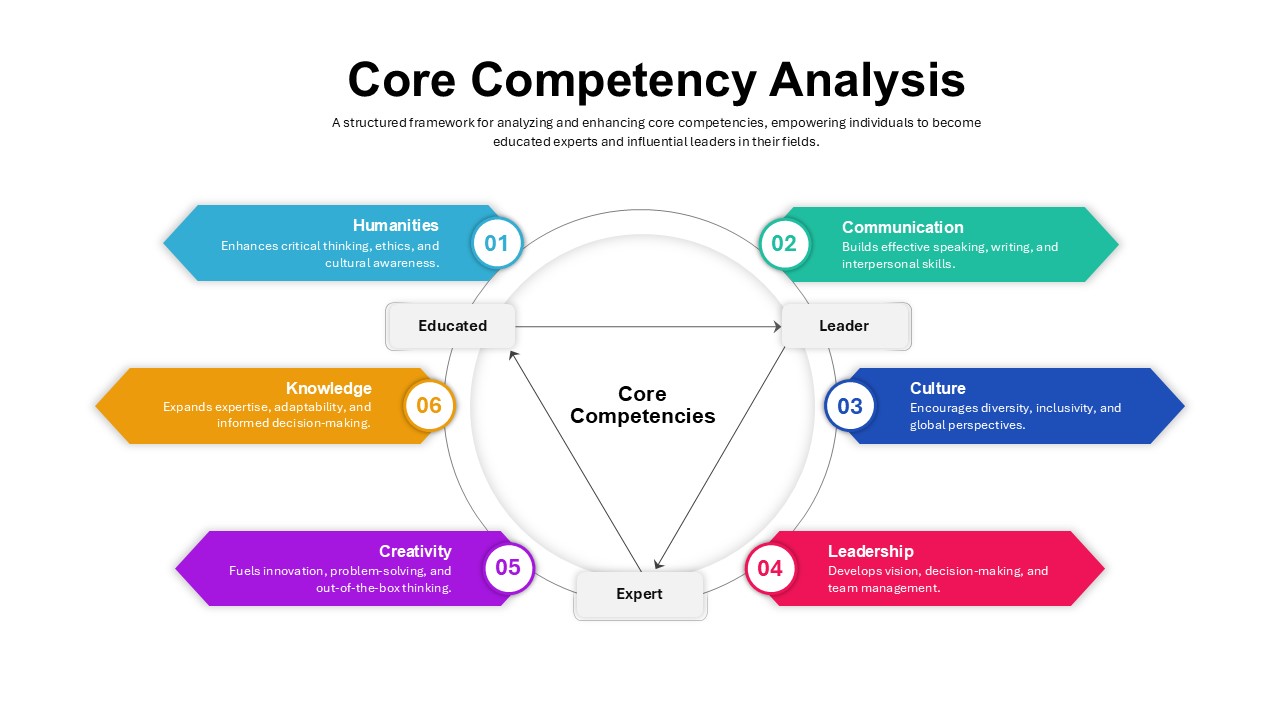
Core Competency Analysis Circular Template for PowerPoint & Google Slides
Circular
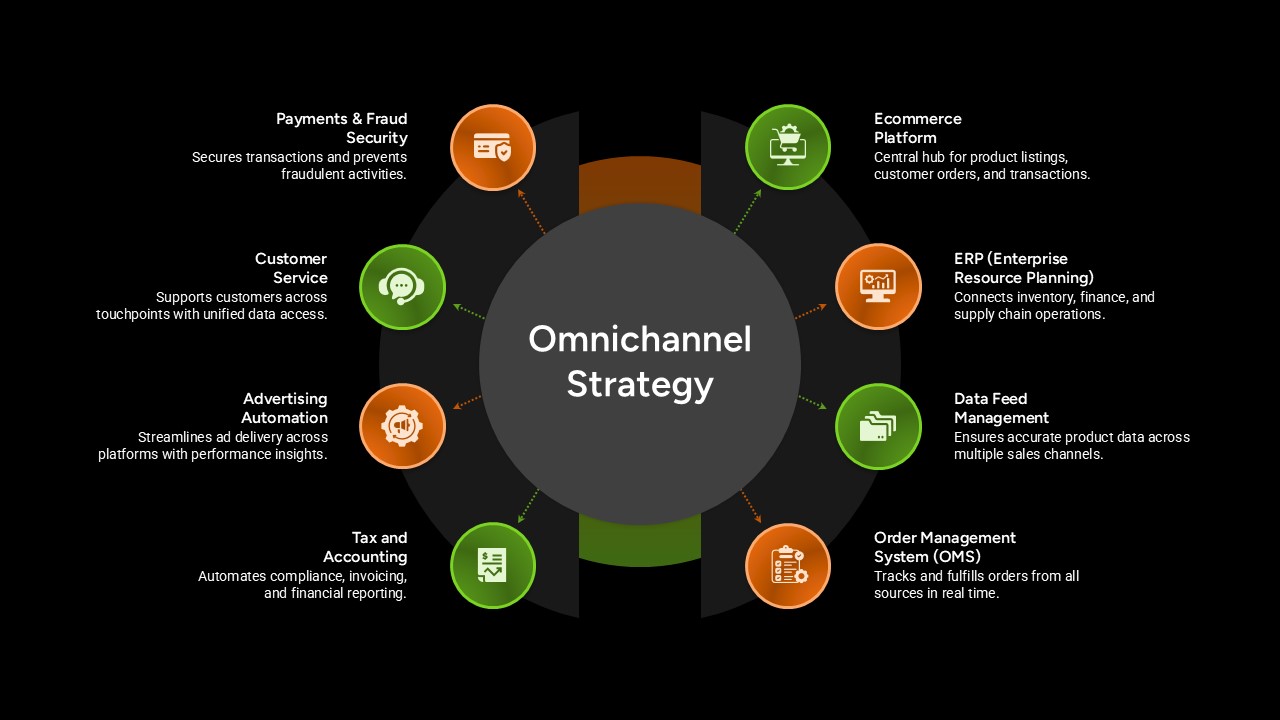
Omnichannel Strategy Circular Diagram Template for PowerPoint & Google Slides
Digital Marketing
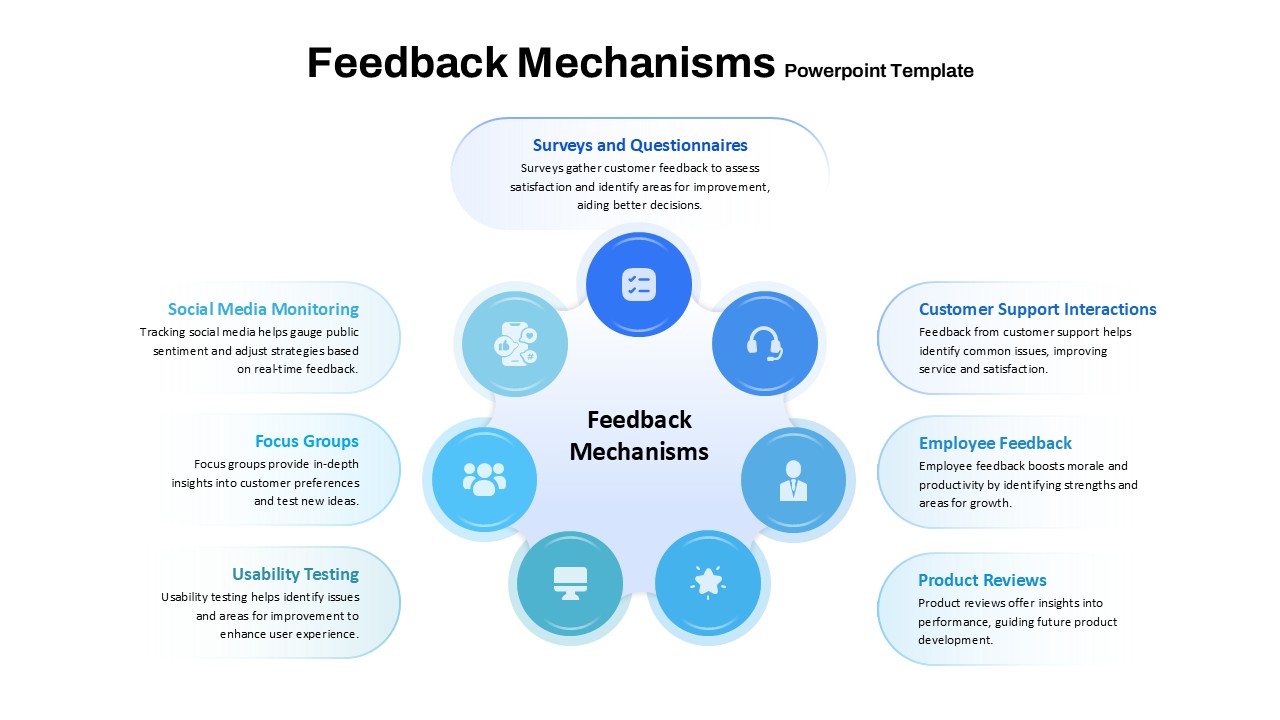
Feedback Mechanisms Circular Diagram Template for PowerPoint & Google Slides
Circular
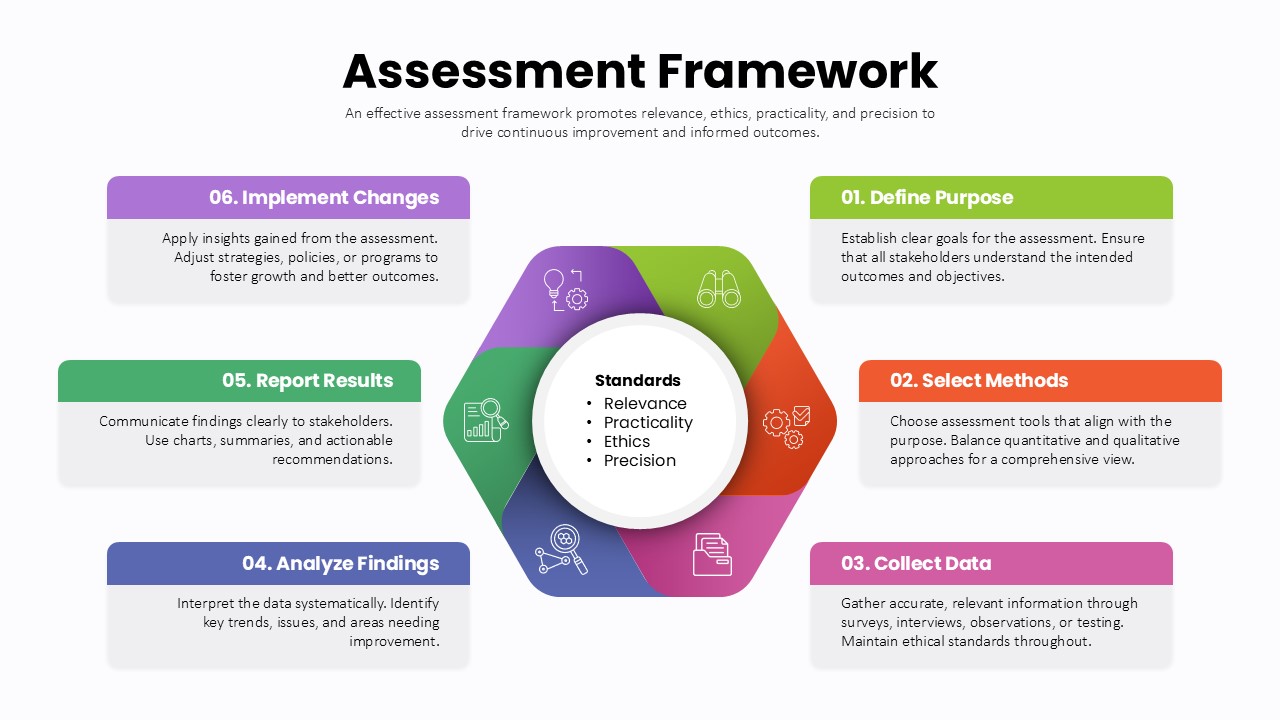
Assessment Framework Circular Diagram Template for PowerPoint & Google Slides
Circular
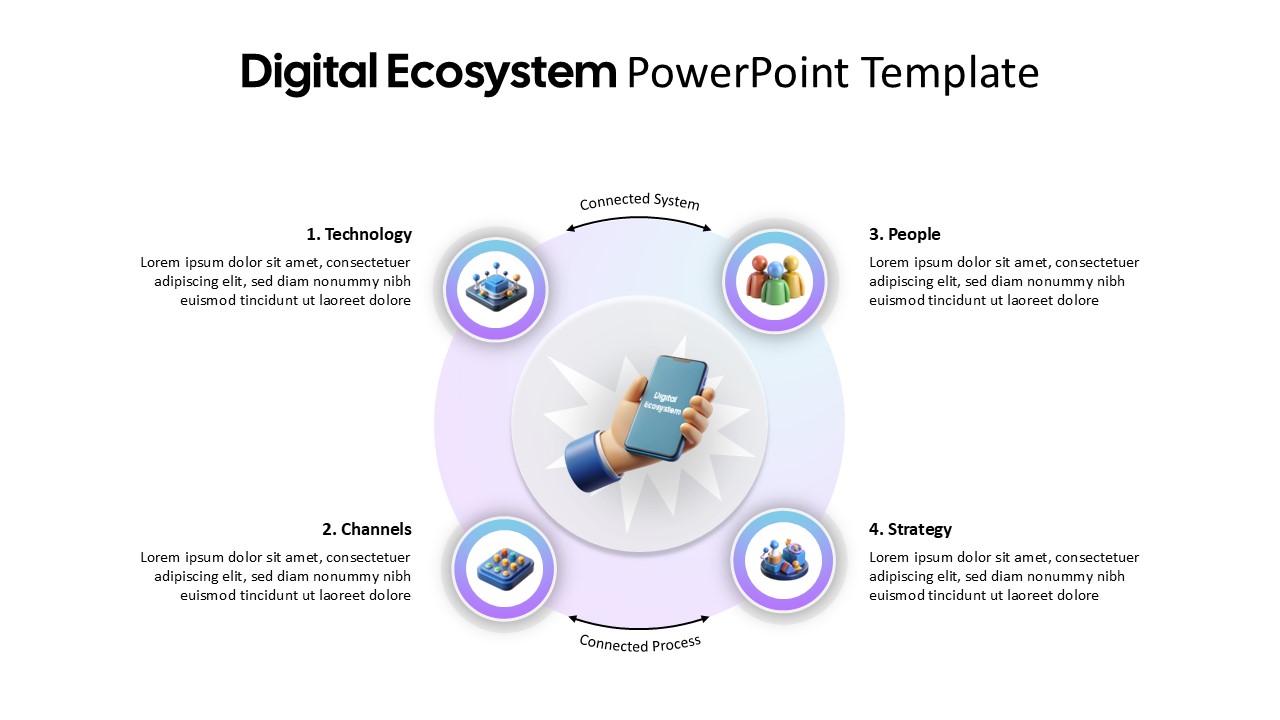
Digital Ecosystem Circular Model Template for PowerPoint & Google Slides
Information Technology
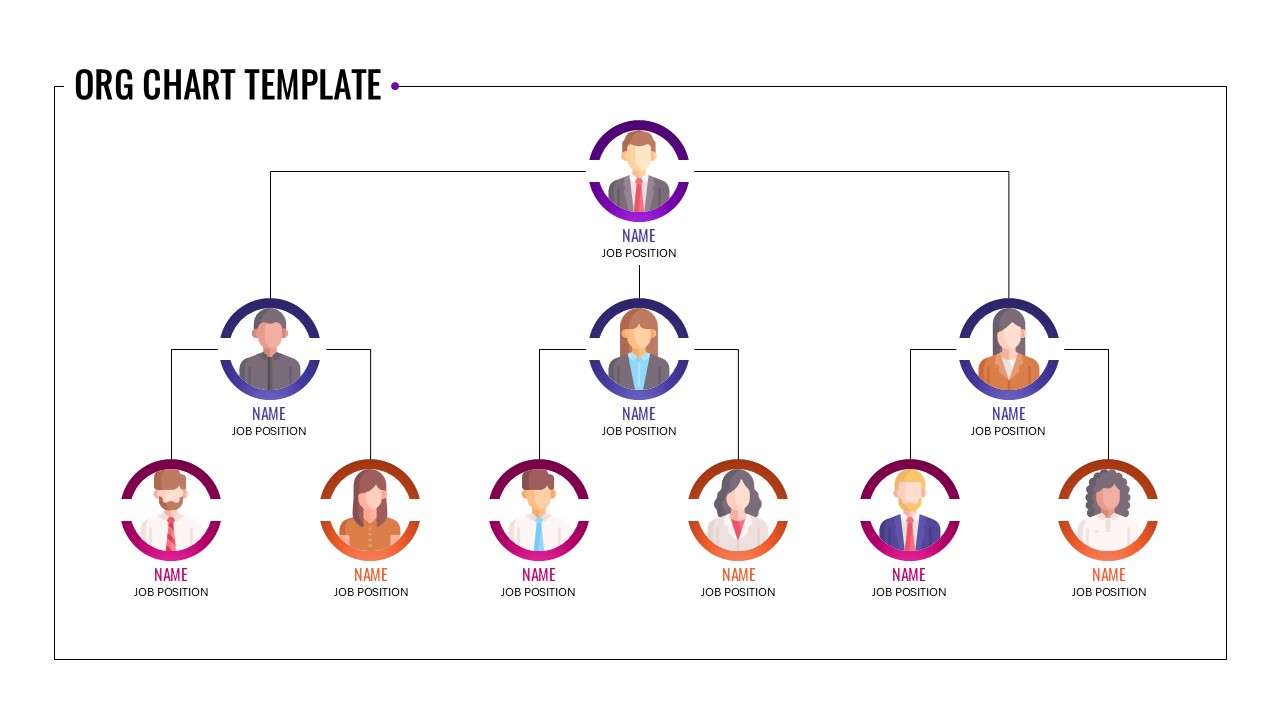
Circular Sample Org Chart Template for PowerPoint & Google Slides
Org Chart
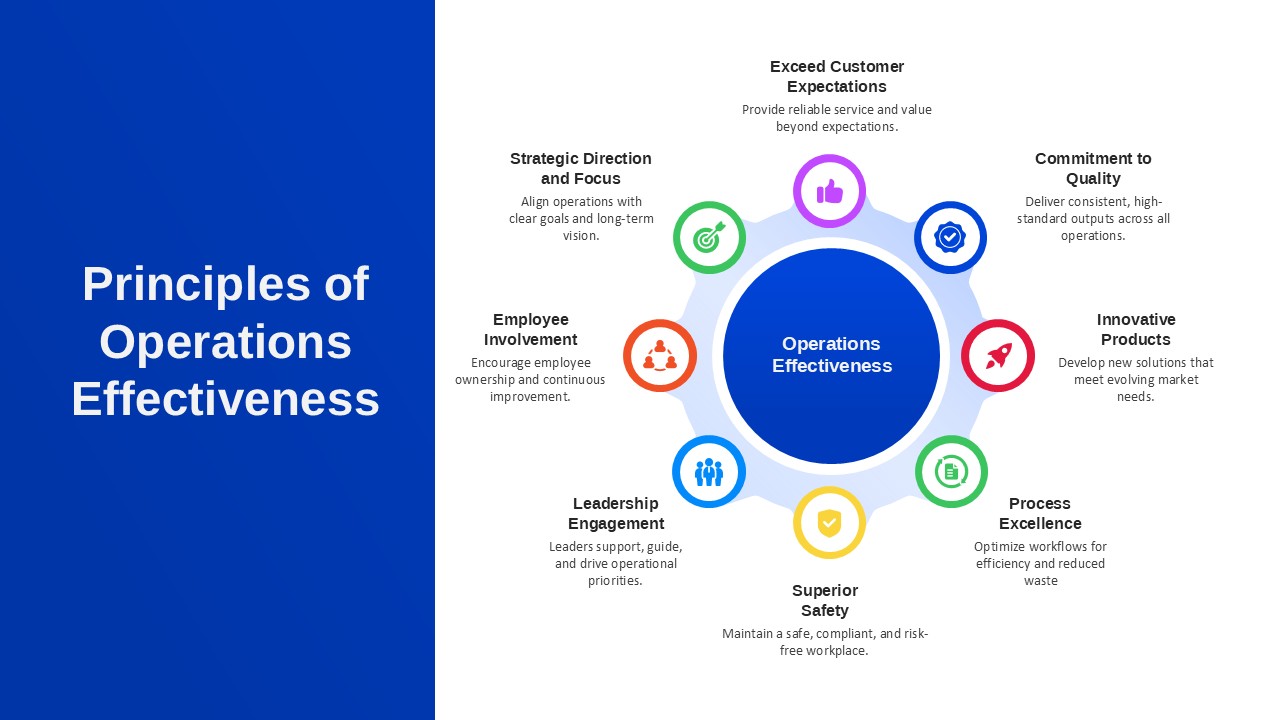
Principles of Operations Effectiveness Circular Diagram Template for PowerPoint & Google Slides
Leadership