Capability Maturity Model Infographic Template for PowerPoint & Google Slides


Description
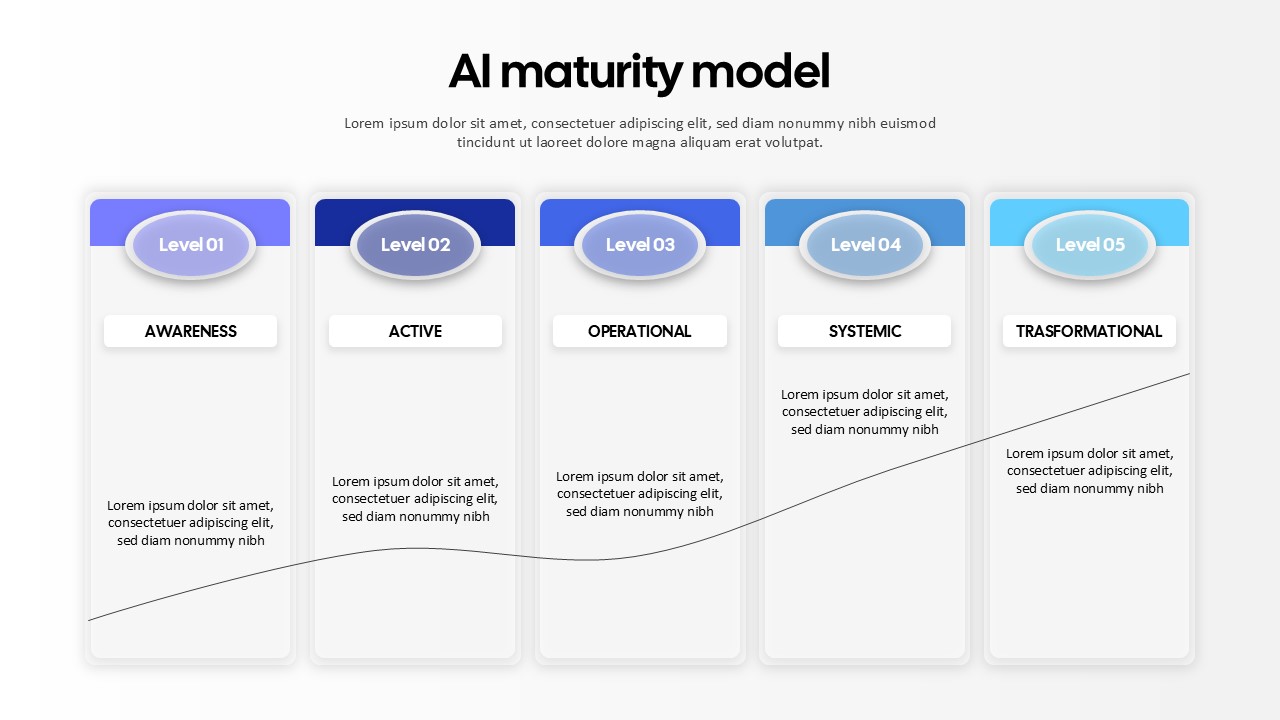
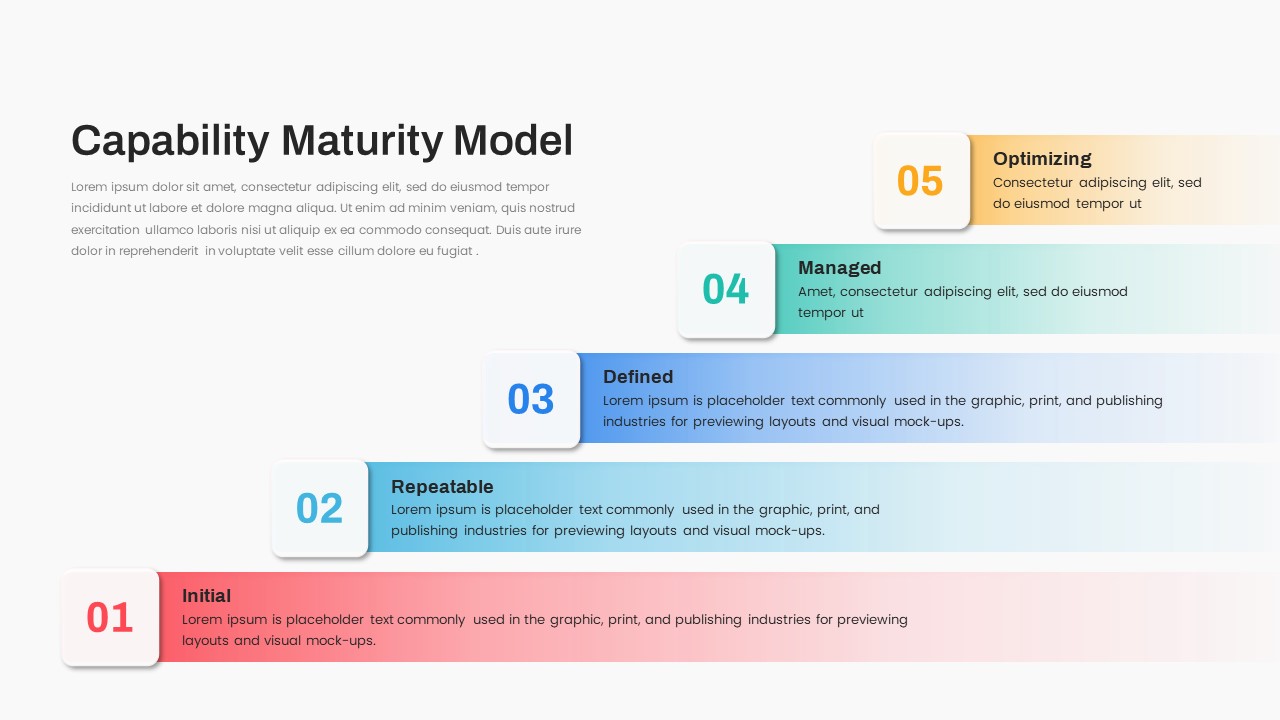
Present your process maturity journey with this comprehensive Capability Maturity Model infographic slide, designed to clearly communicate five progressive stages. The slide opens with a bold title placeholder and a customizable subtitle area for context or introductory text. Below, five staggered horizontal bars represent each level—Initial, Repeatable, Defined, Managed, and Optimizing—each featuring vibrant gradient fills in red, cyan, blue, green, and yellow tones. The numbered step markers appear in crisp white callouts that overlap the colored bars, ensuring quick stage identification and visual hierarchy. Soft drop shadows and smooth corner rounding create depth and dimensionality, while subtle gradient overlays and layered shapes reinforce a clean, professional aesthetic.
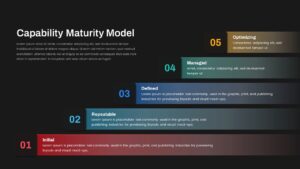
This editable infographic template leverages master slide functionality and intuitive placeholders for seamless content updates: swap bar labels, adjust colors to match your brand palette, resize number badges, or modify descriptive text blocks in seconds. All graphical elements are vector-based, guaranteeing resizing without loss of quality. Smart alignment guides and organized layer structure simplify customization and maintain consistent layouts across slides.
Optimized for both PowerPoint and Google Slides, this Capability Maturity Model slide preserves full-resolution clarity and ensures cross-platform compatibility. Whether you’re detailing software development processes, assessing organizational capabilities, or planning process improvements, this infographic provides a structured visual framework that resonates with project managers, business analysts, and senior leadership teams. Deploy it in maturity assessments, project status reports, strategic planning workshops, or training sessions to illustrate progression, benchmark performance, and foster informed decision-making.
With its balanced design and editable components, this infographic slide empowers you to articulate complex maturity concepts with clarity and impact, making your presentation both informative and visually engaging.
Who is it for
Project managers, business analysts, enterprise architects, and maturity assessment consultants will find this slide invaluable for mapping capability levels, communicating process improvements, and aligning stakeholder expectations. IT managers, quality assurance teams, and organizational development leaders can also leverage this model to benchmark performance, identify gaps, and drive continuous improvement initiatives.
Other Uses
Repurpose this layout to illustrate phased roadmaps, software development life cycles, organizational change frameworks, or multi-step workflows in presentations across industries. Customize level labels to showcase audit processes, risk management stages, marketing funnel steps, or product development milestones with ease.
Login to download this file

Item ID
SB03488
Related Templates

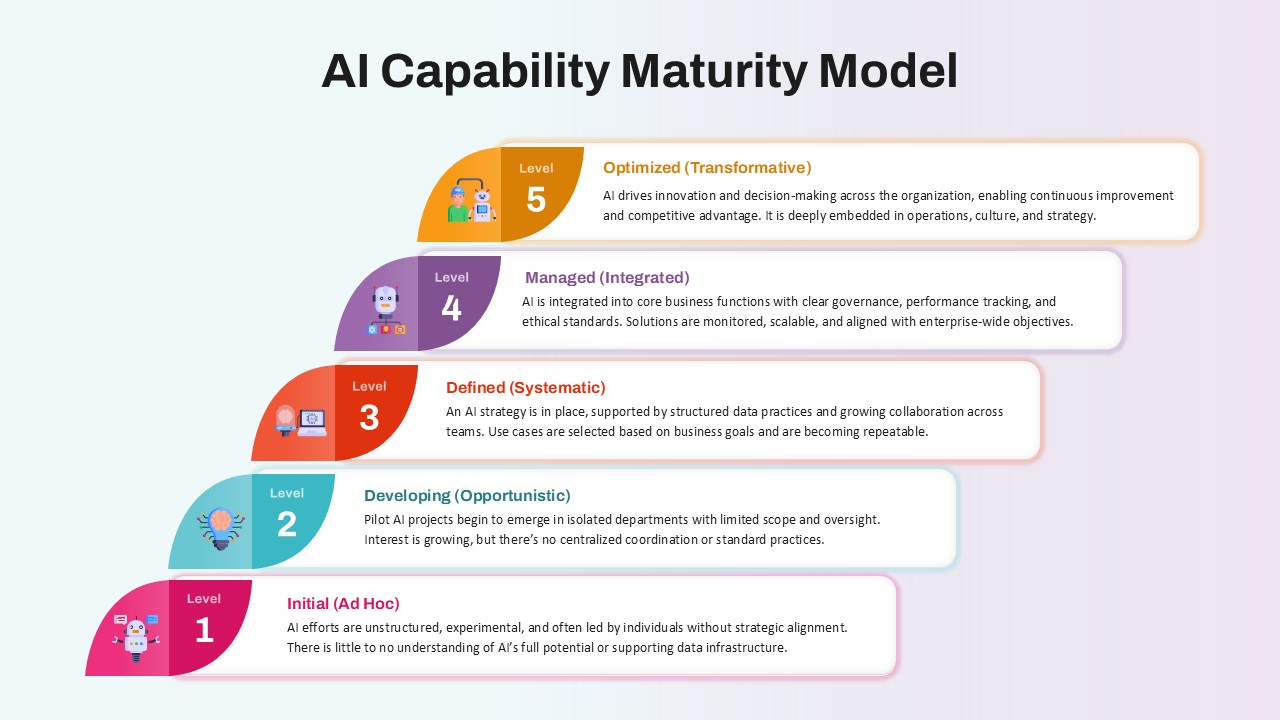
AI Capability Maturity Model Overview for PowerPoint & Google Slides
Technology
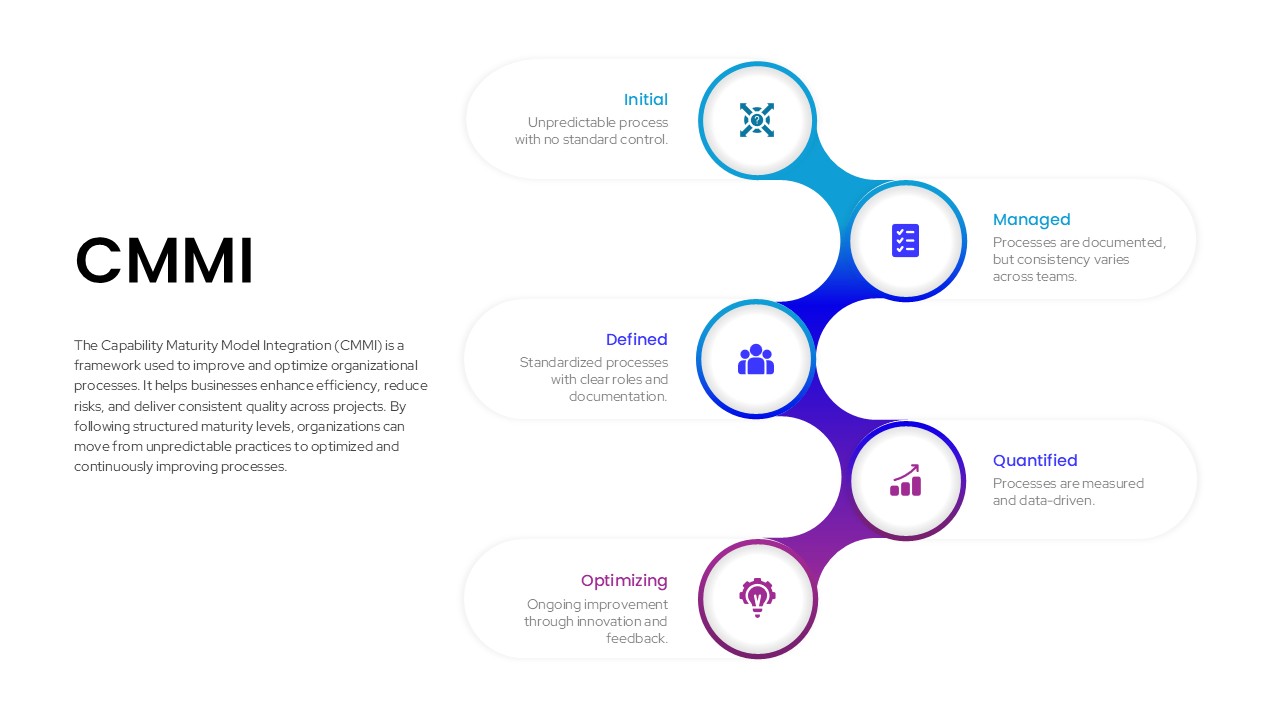
CMMI Process Maturity Model Infographic Template for PowerPoint & Google Slides
Process
Comprehensive Data & AI Capability Model Template for PowerPoint & Google Slides
AI

Four-Phase Maturity Model Diagram Template for PowerPoint & Google Slides
Process
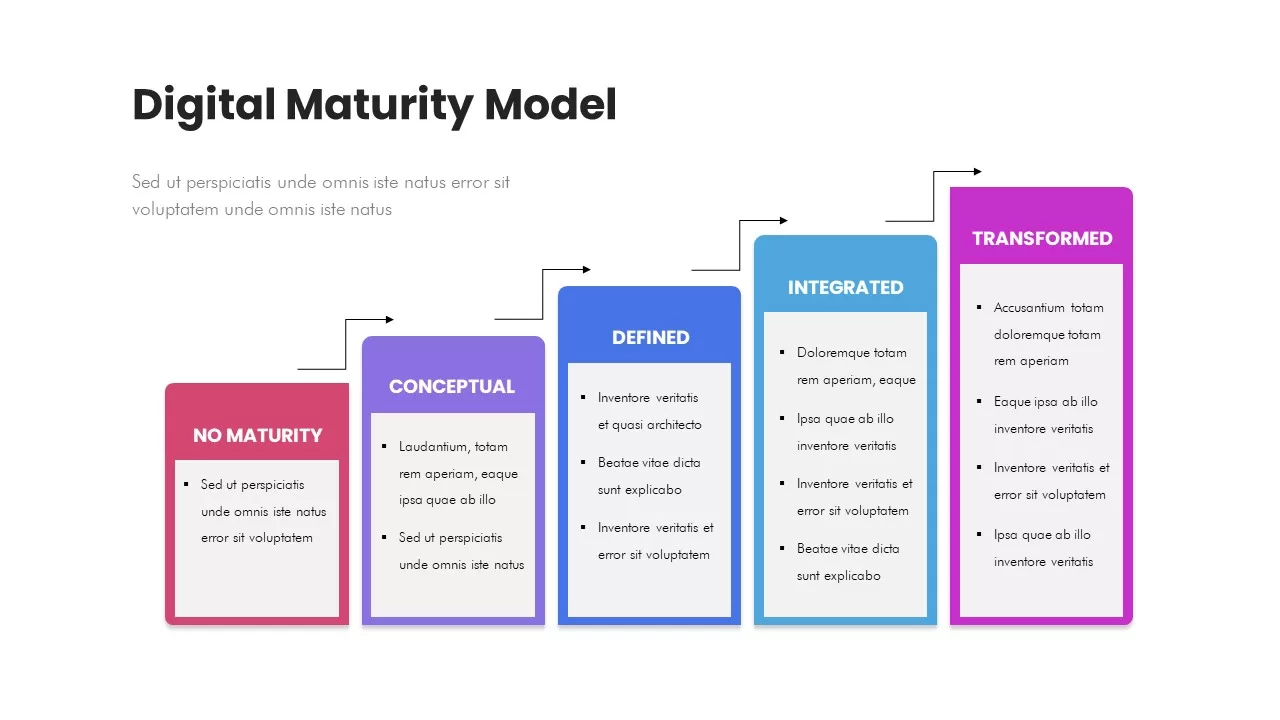
Digital Maturity Model Stages Diagram Template for PowerPoint & Google Slides
Process
Five-Stage Digital Maturity Model Diagram Template for PowerPoint & Google Slides
Process
Organizational Maturity Model Diagram Template for PowerPoint & Google Slides
Process
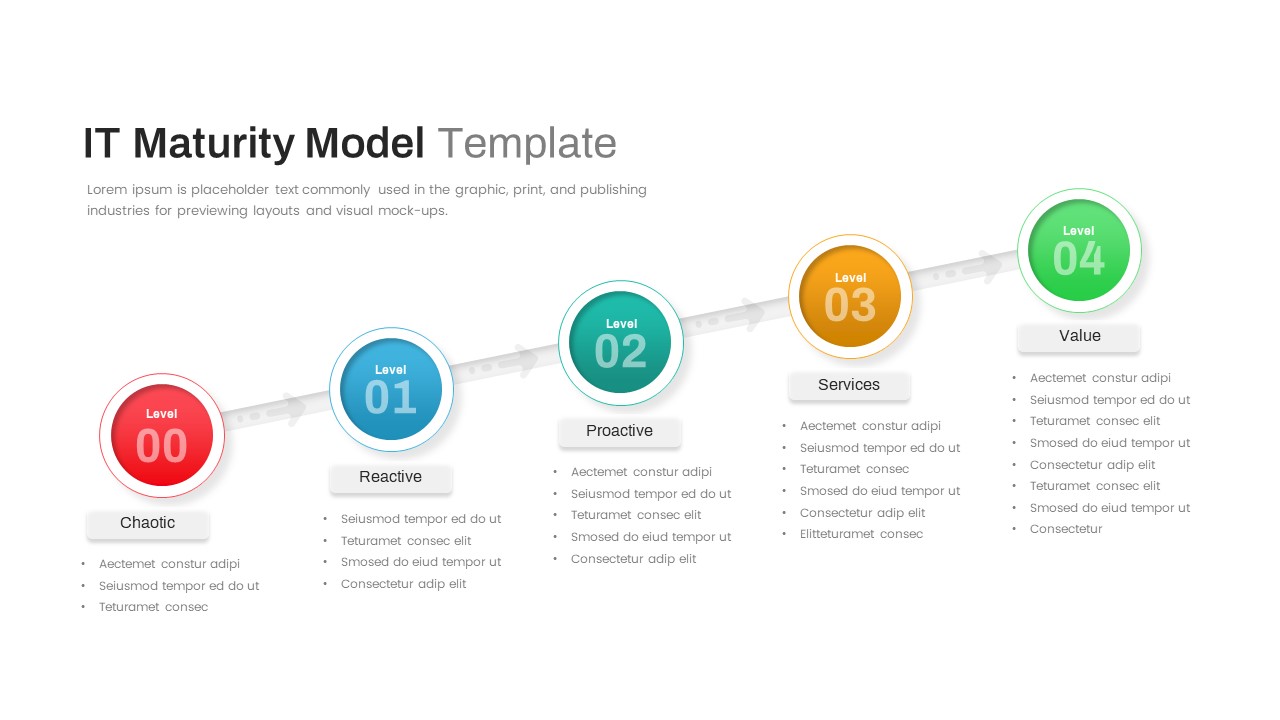
IT Maturity Model with Five Stages Template for PowerPoint & Google Slides
Timeline
Layered Data Governance Maturity Model Template for PowerPoint & Google Slides
Process
AI Maturity Model Levels template for PowerPoint & Google Slides
Technology
Six-Block Capability Statement Template for PowerPoint & Google Slides
Business Report
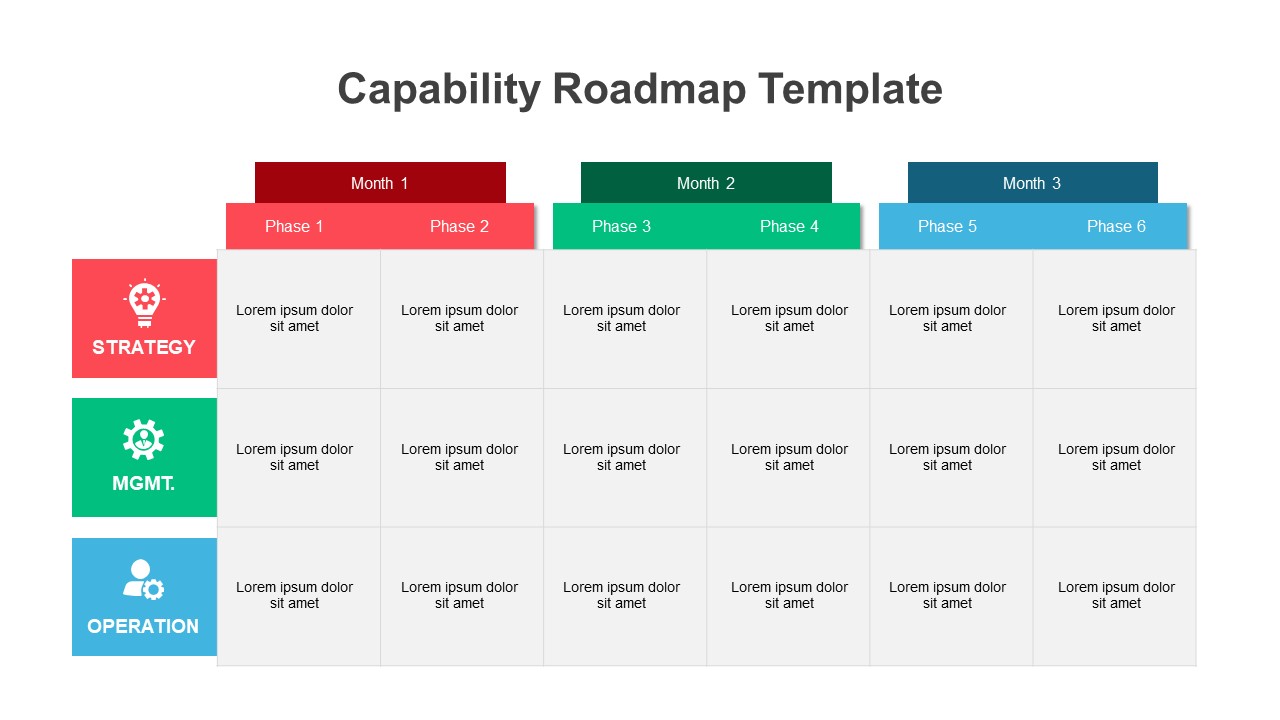
Interactive Strategic Capability Roadmap Template for PowerPoint & Google Slides
Roadmap
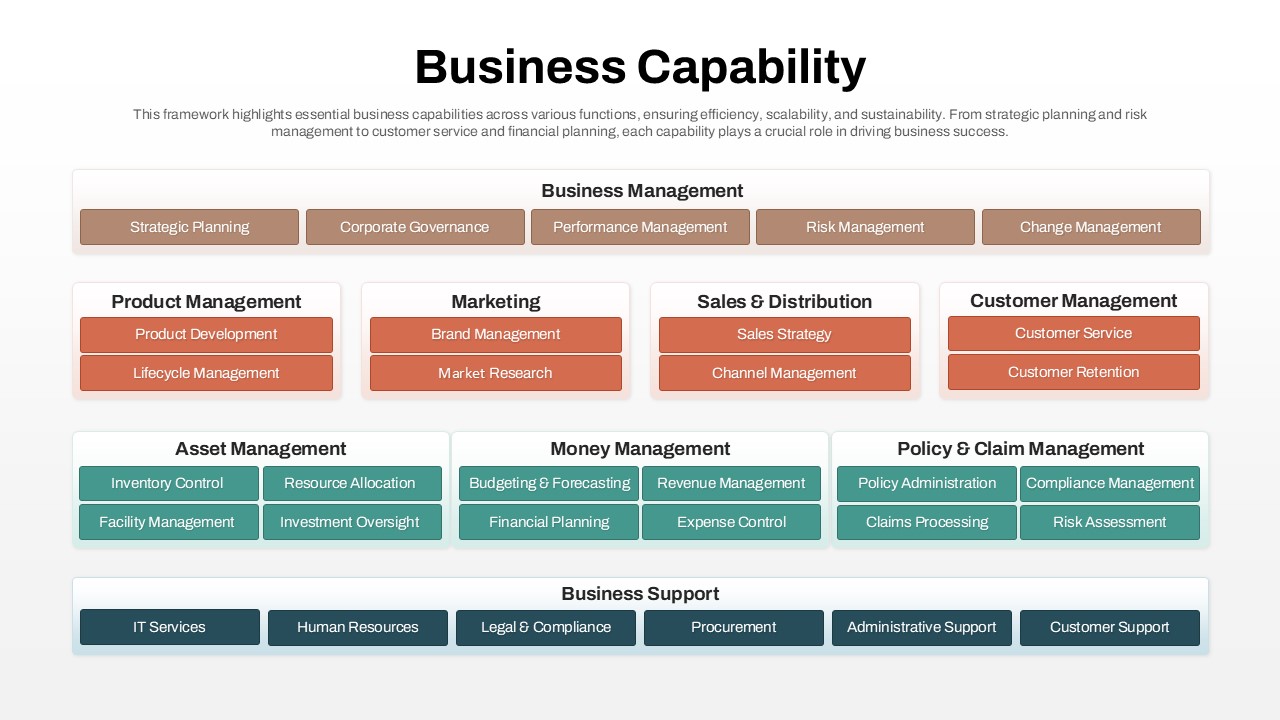
Business Capability Framework Diagram Template for PowerPoint & Google Slides
Business Models
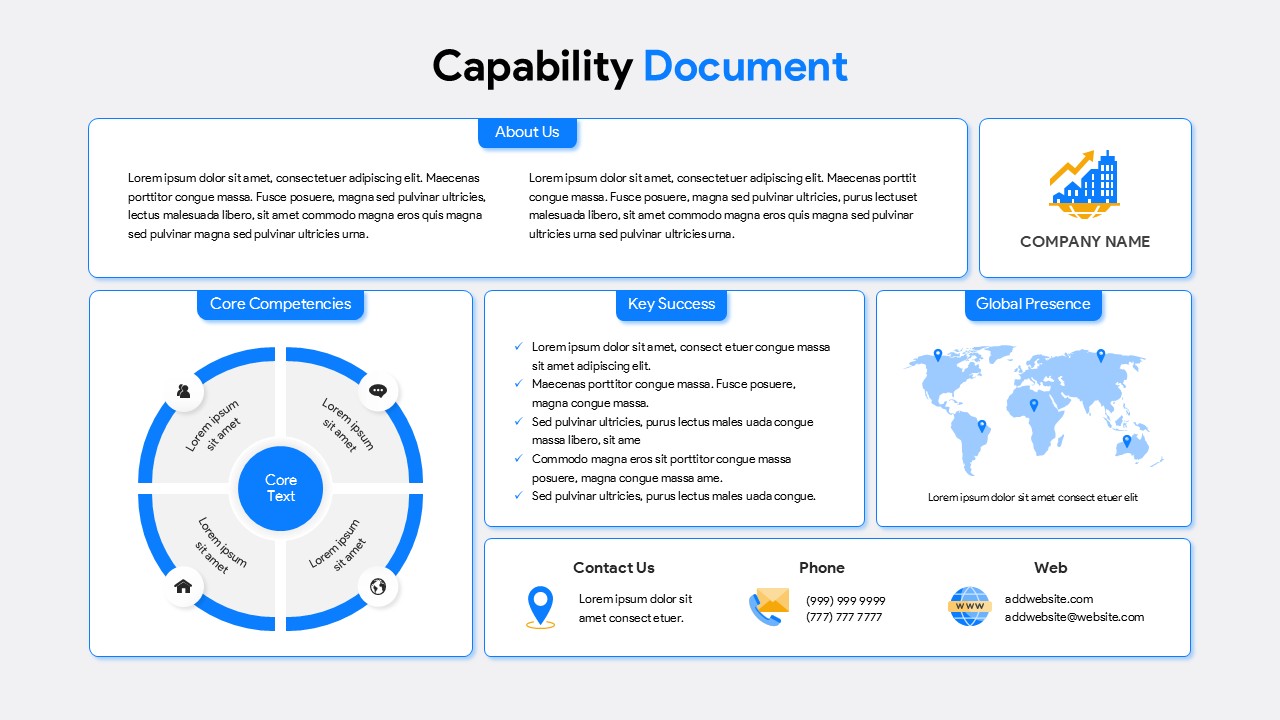
Capability Document template for PowerPoint & Google Slides
Business
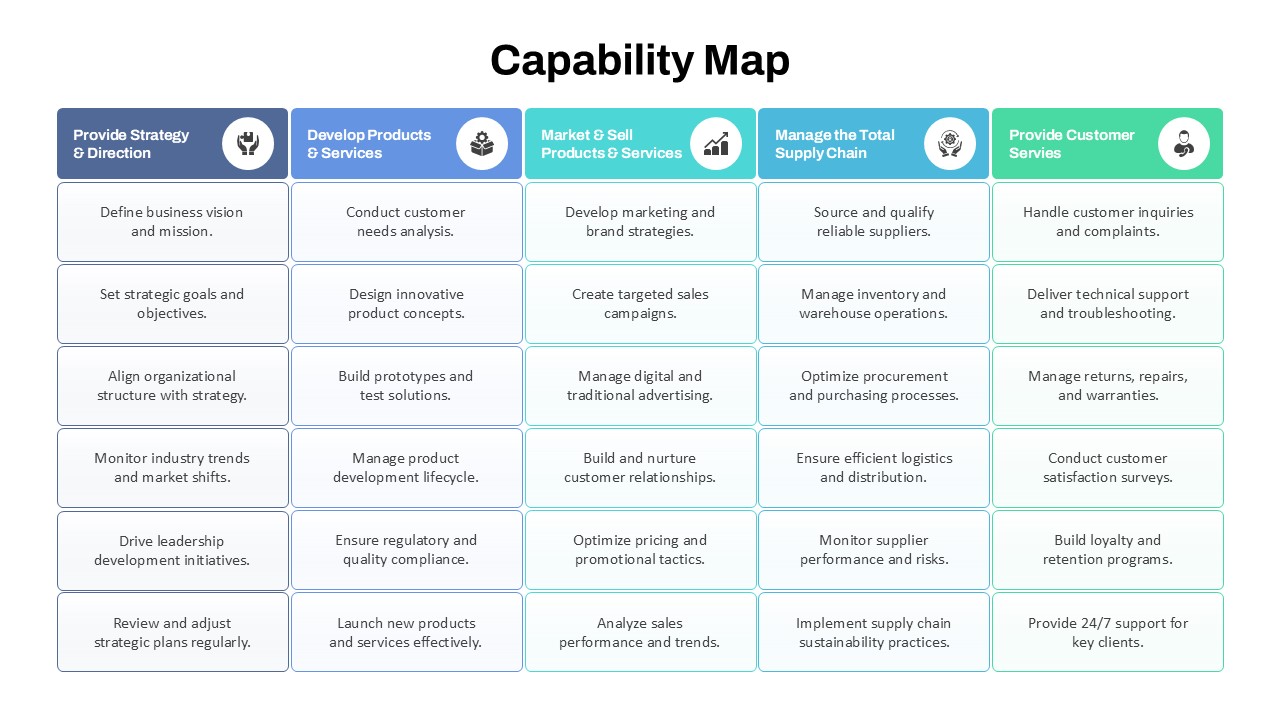
Capability Map Overview Template for PowerPoint & Google Slides
Business Strategy
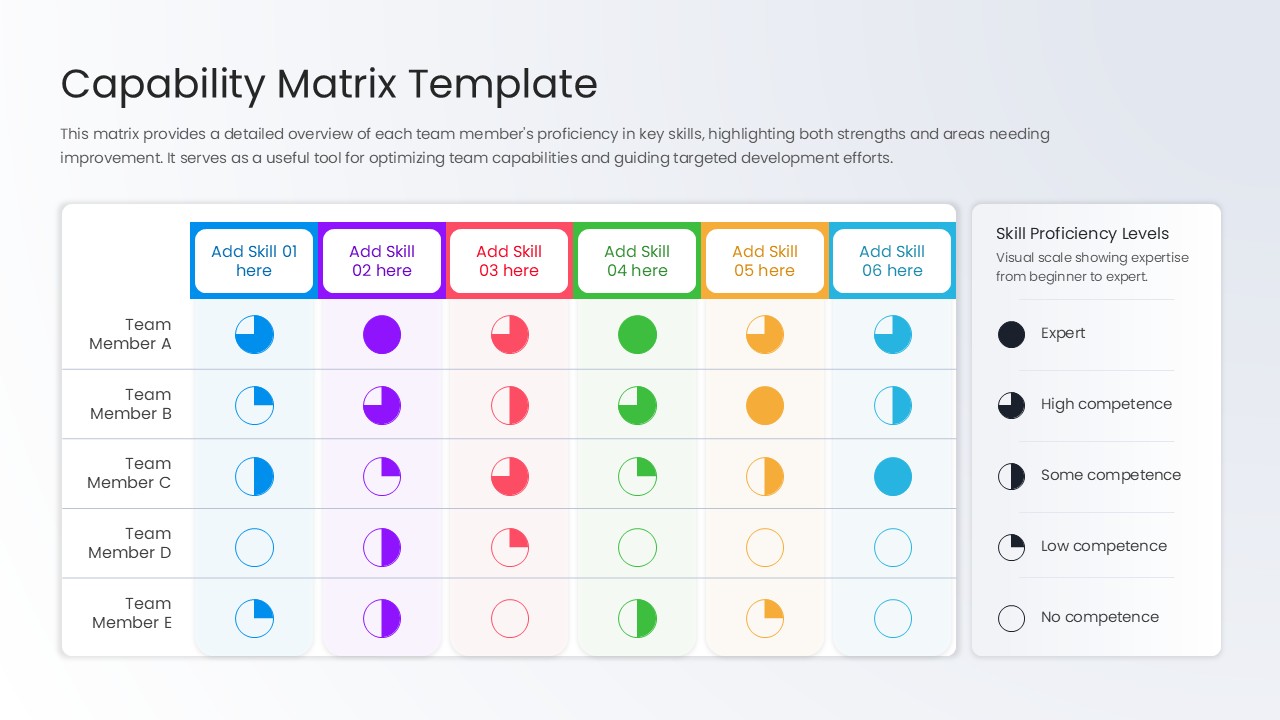
Capability Matrix Template for PowerPoint & Google Slides
HR
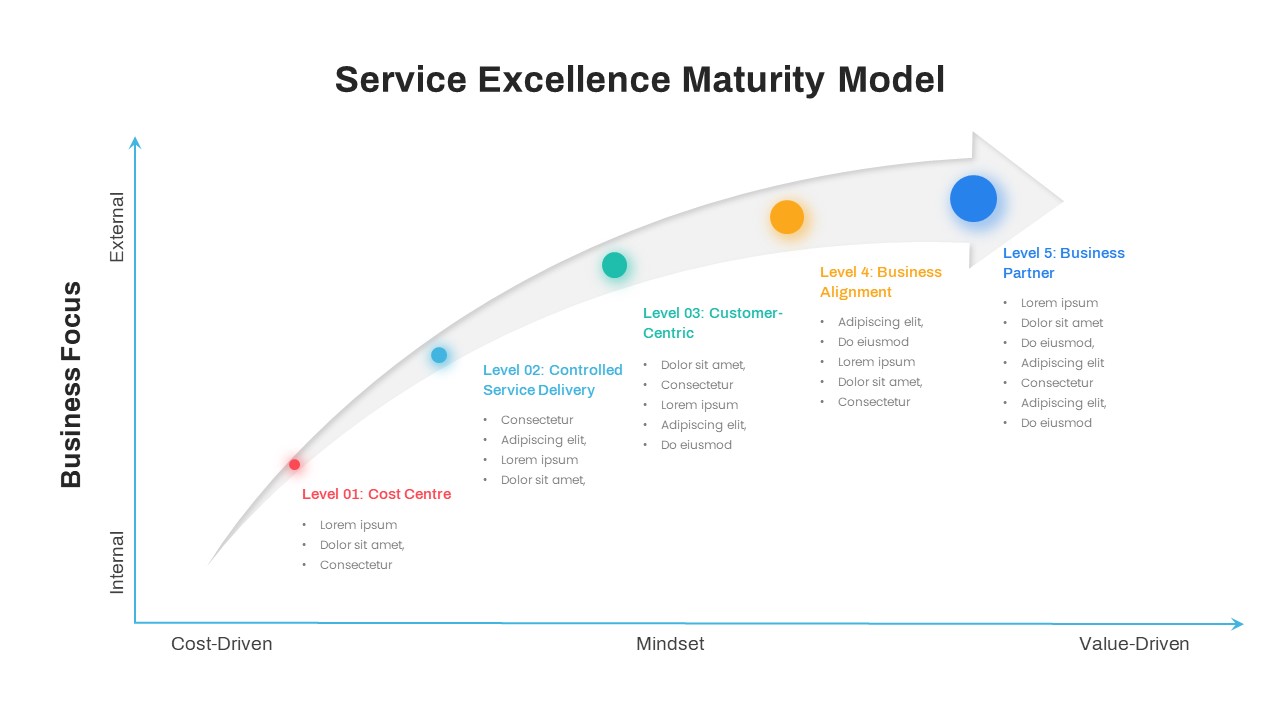
Service Excellence Maturity 5-Stage Template for PowerPoint & Google Slides
Process
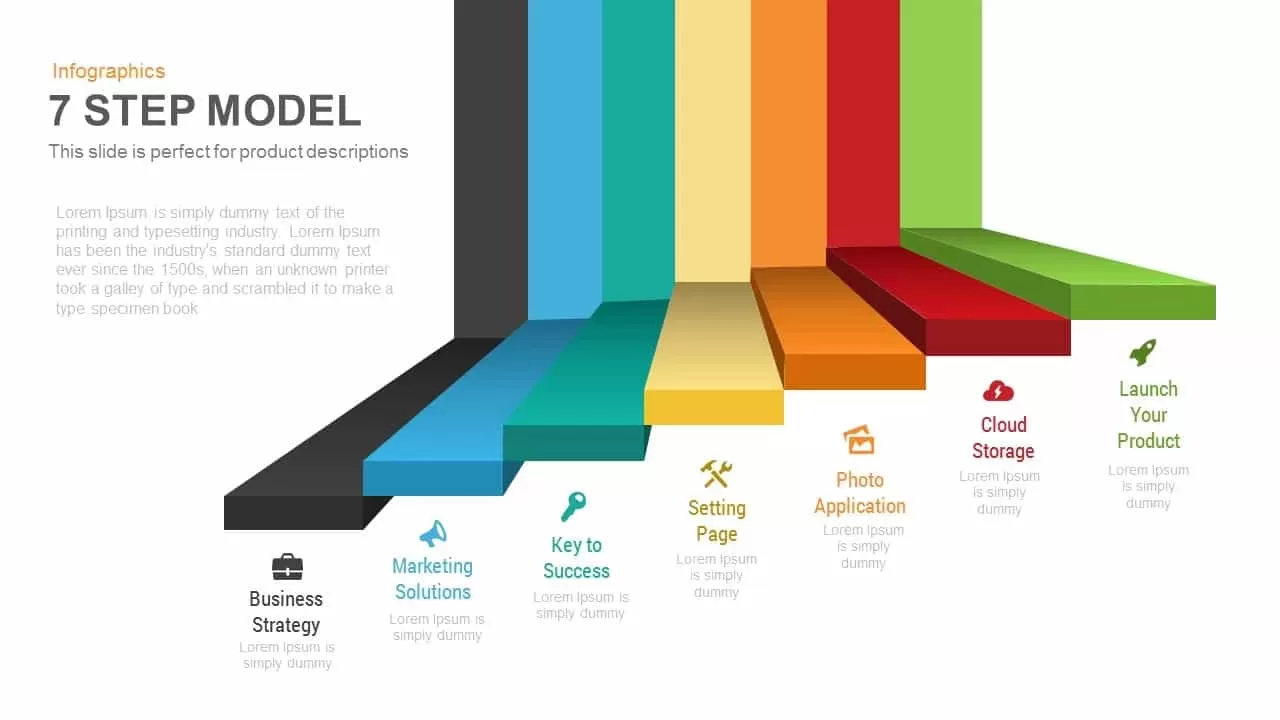
7-Step 3D Process Infographic Model template for PowerPoint & Google Slides
Process

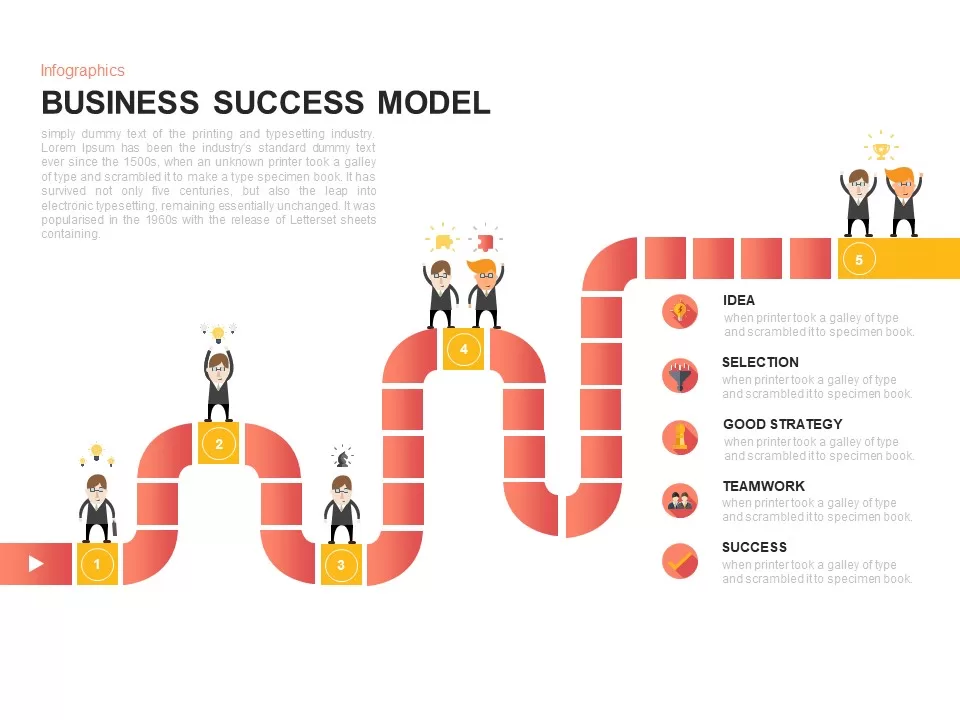
Business Success Model Infographic Template for PowerPoint & Google Slides
Roadmap
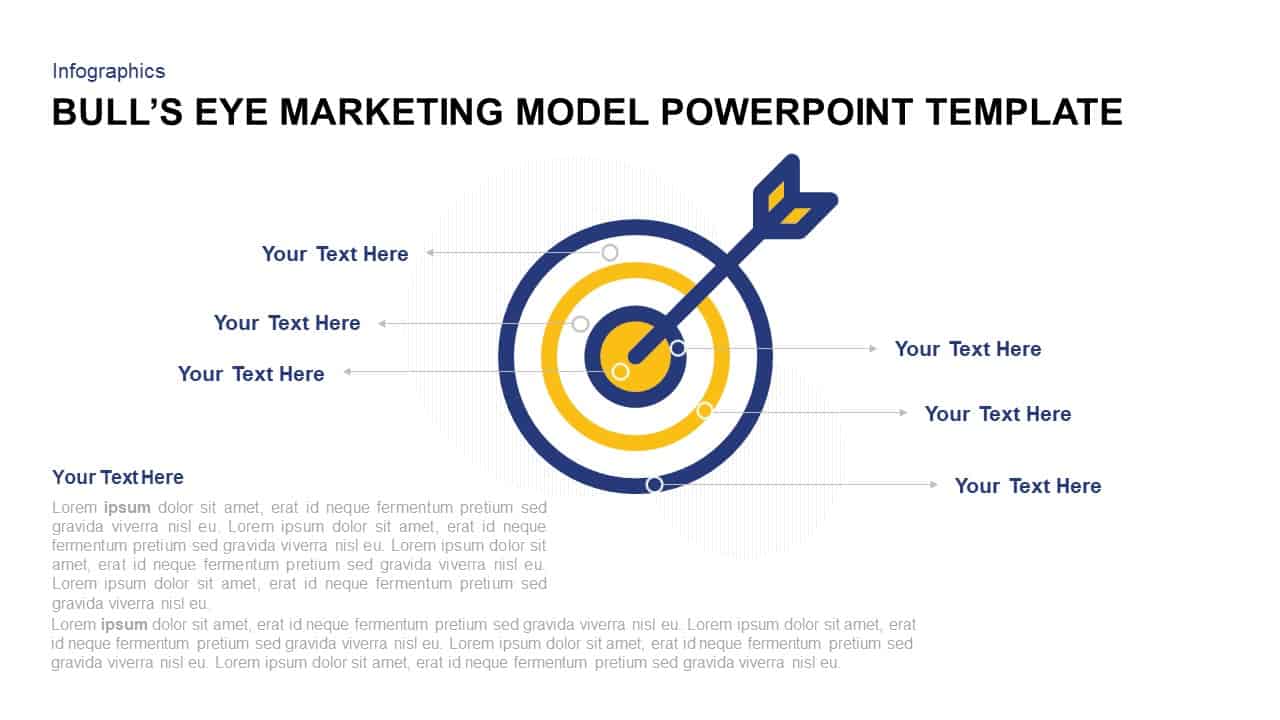
Bull’s Eye Marketing Model Infographic Template for PowerPoint & Google Slides
Circular
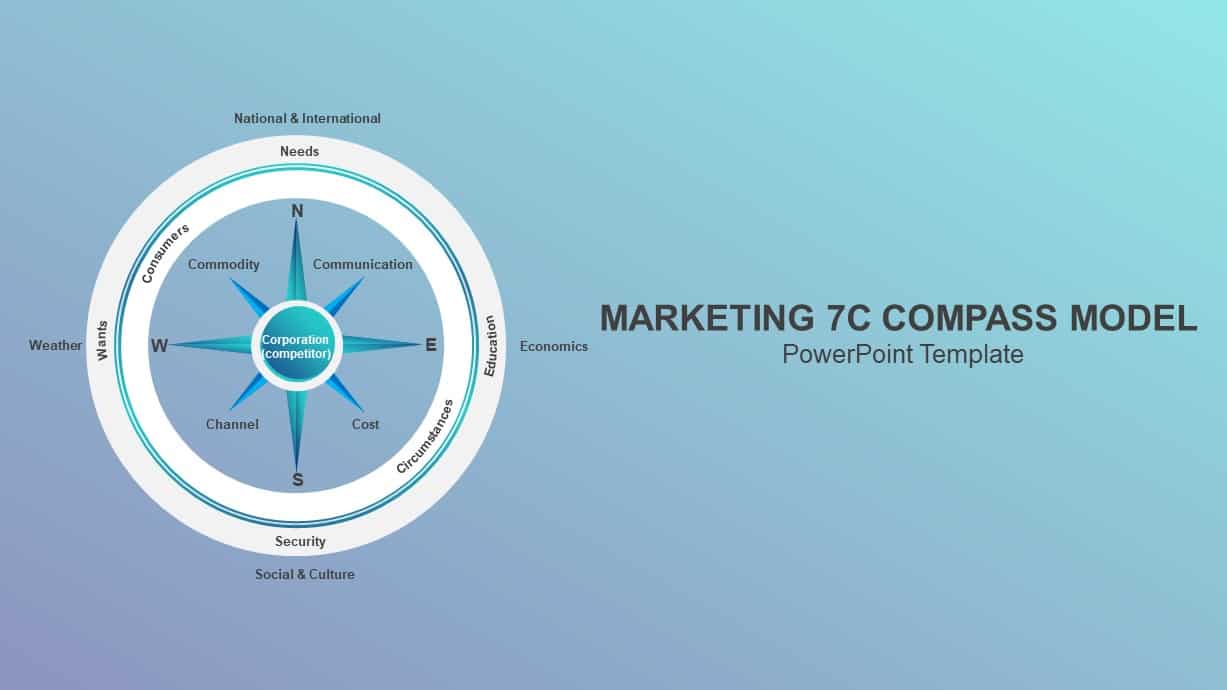
Marketing 7C Compass Model Infographic Template for PowerPoint & Google Slides
Circular
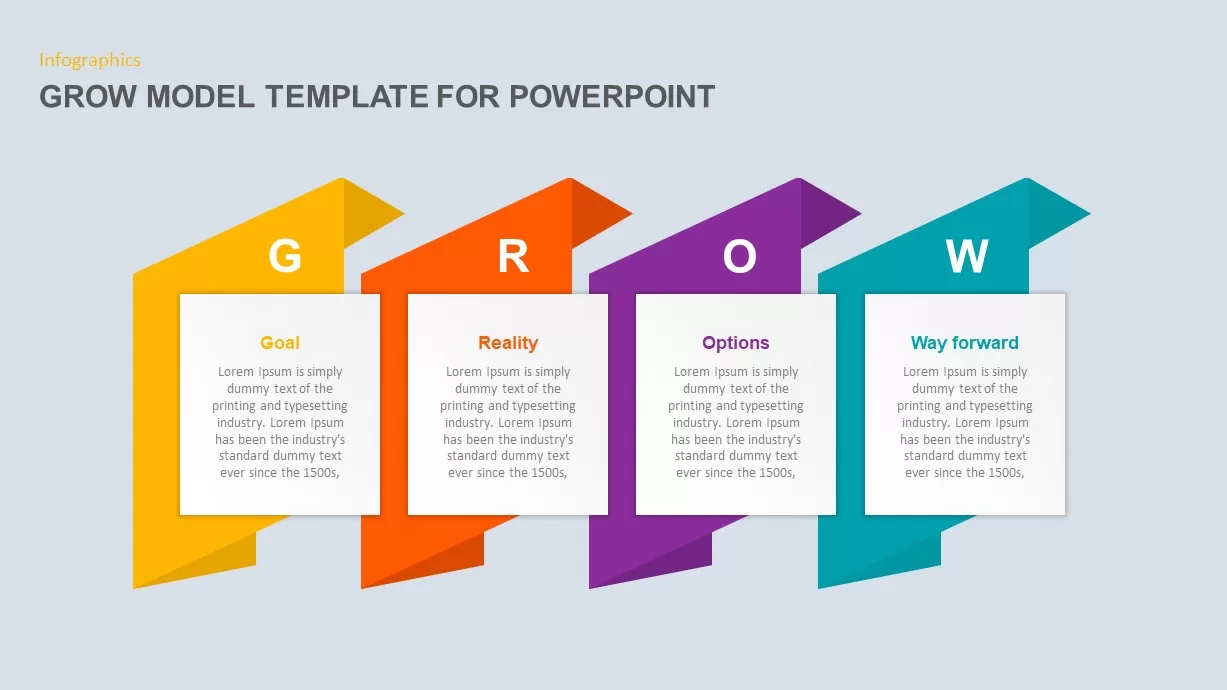
GROW Model Coaching Infographic Template for PowerPoint & Google Slides
Process
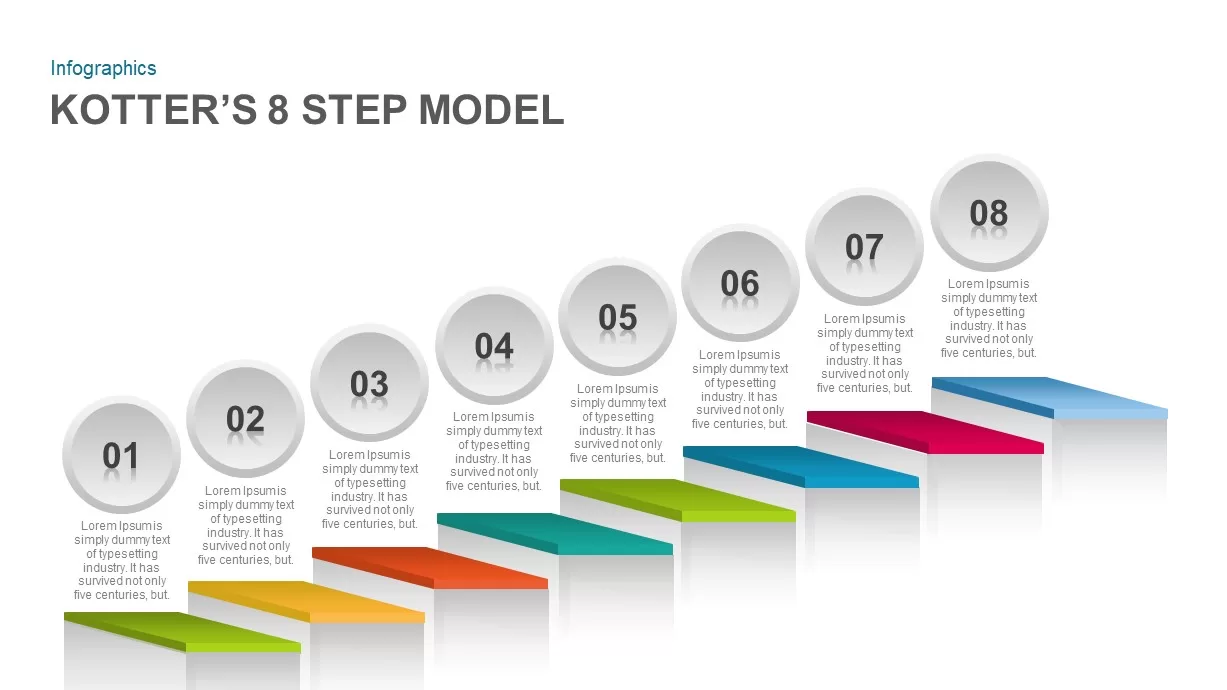
Kotter’s 8-Step Model Infographic Template for PowerPoint & Google Slides
Process
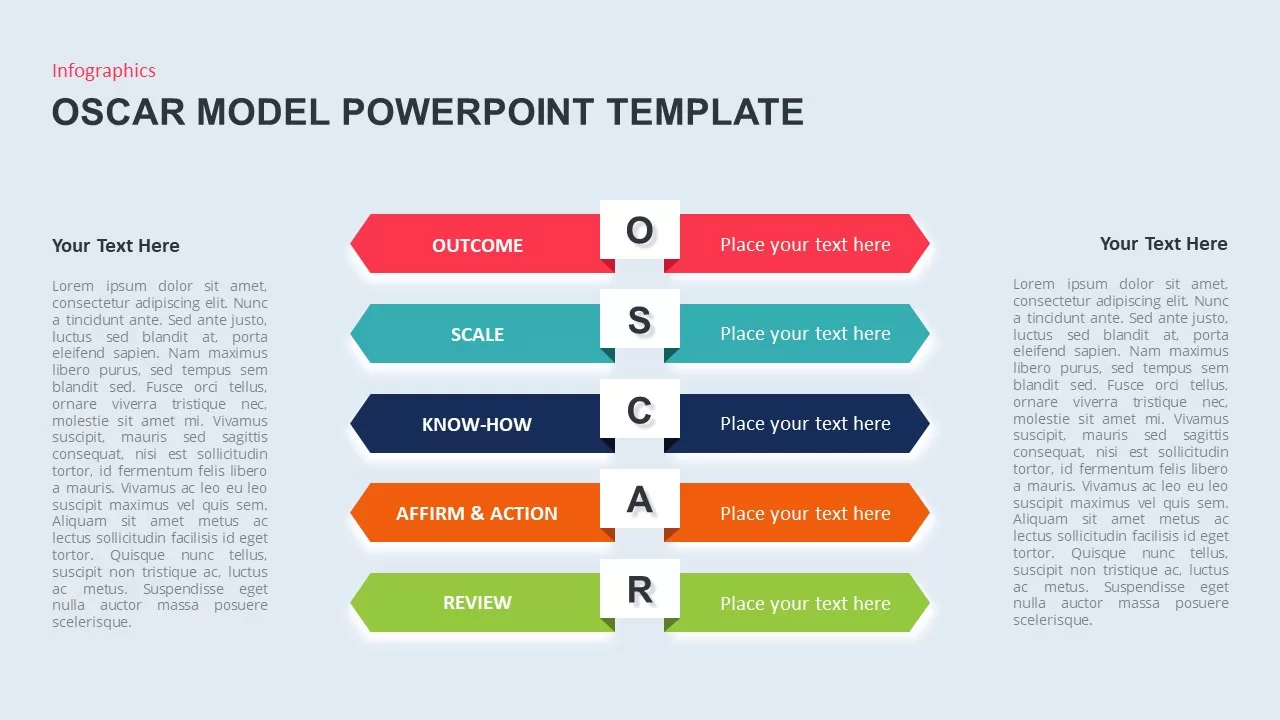
OSCAR Behavior Model Infographic Template for PowerPoint & Google Slides
HR
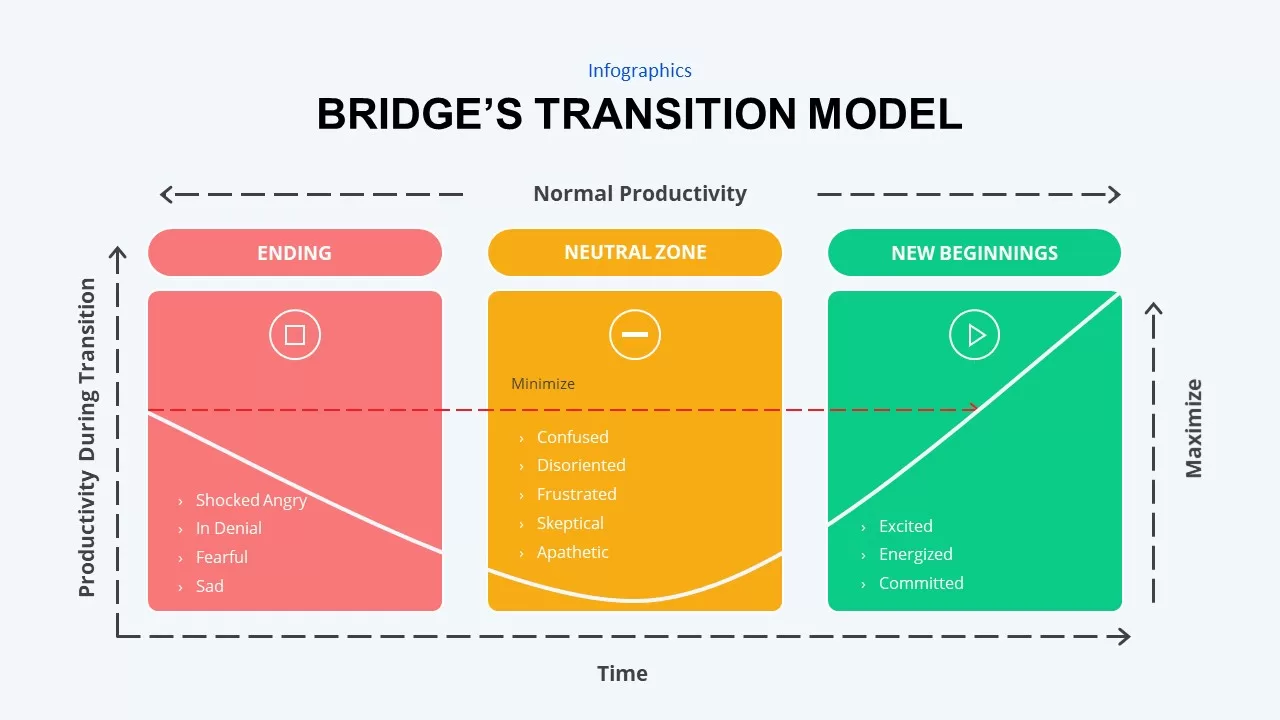
Bridge’s Transition Model Infographic Template for PowerPoint & Google Slides
HR
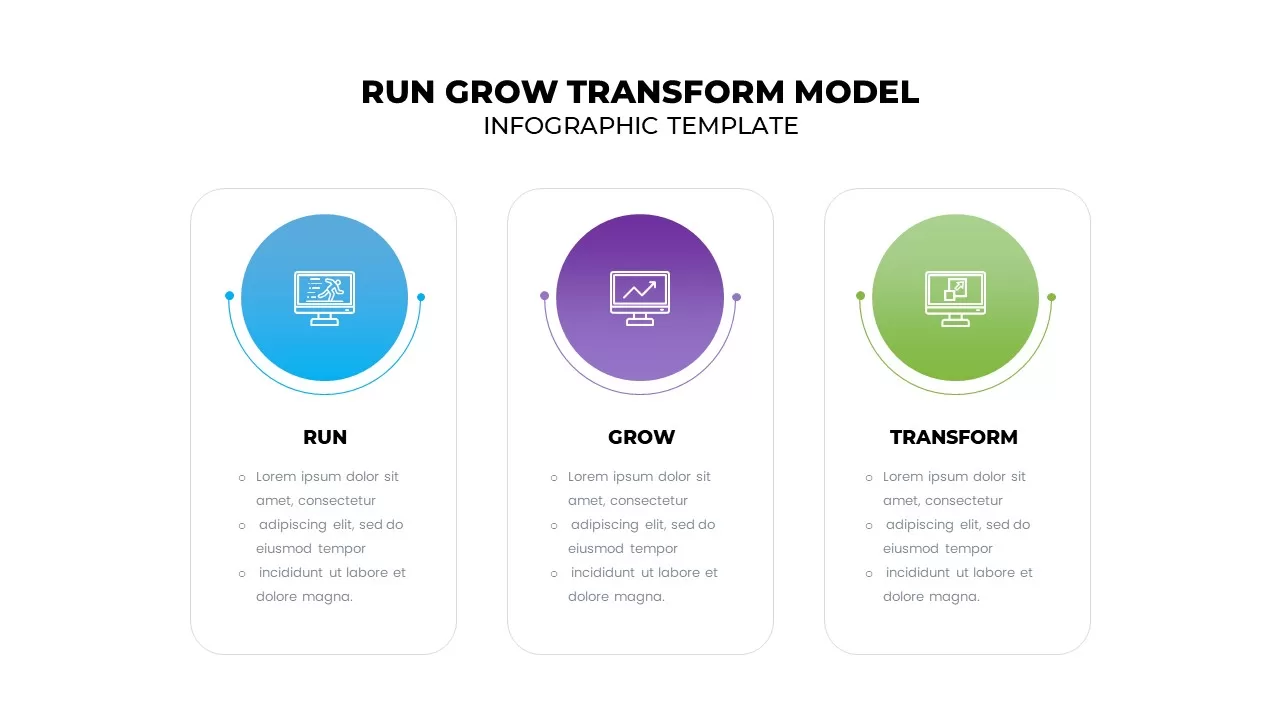
Run Grow Transform Model Infographic Template for PowerPoint & Google Slides
Business
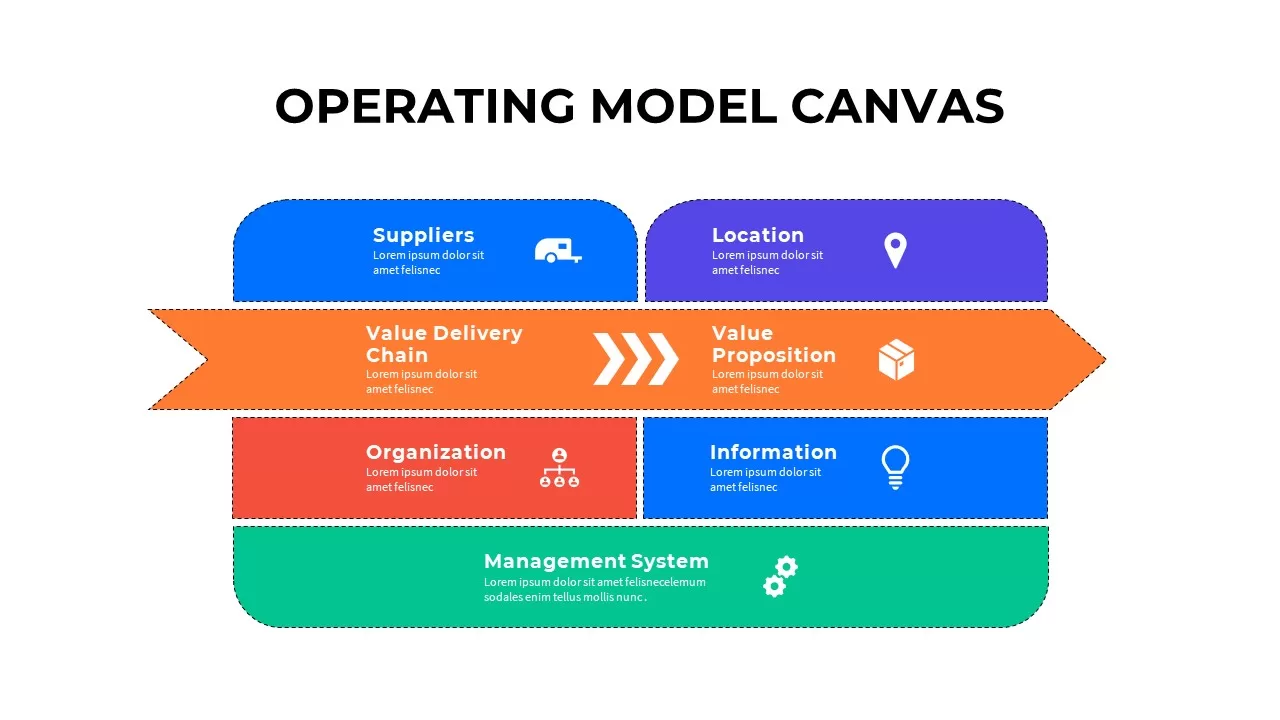
Operating Model Canvas Infographic Template for PowerPoint & Google Slides
Business Models
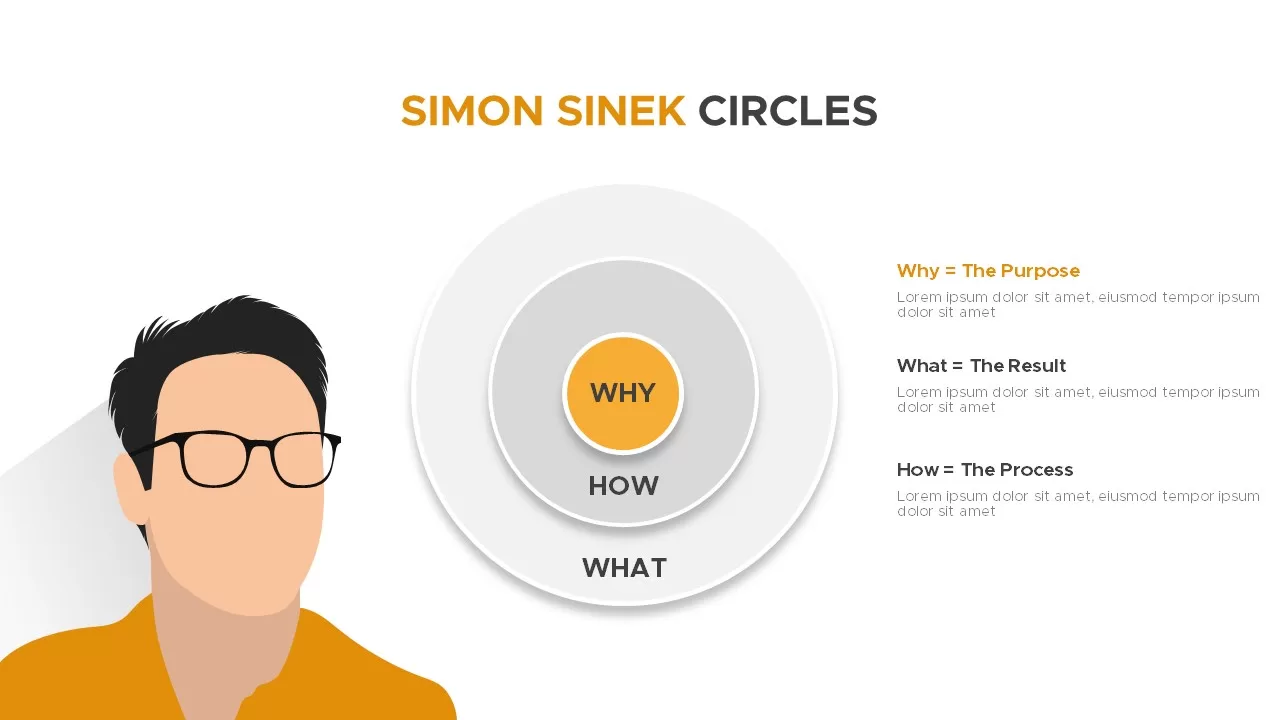
Simon Sinek Circles Model Infographic template for PowerPoint & Google Slides
Business Strategy
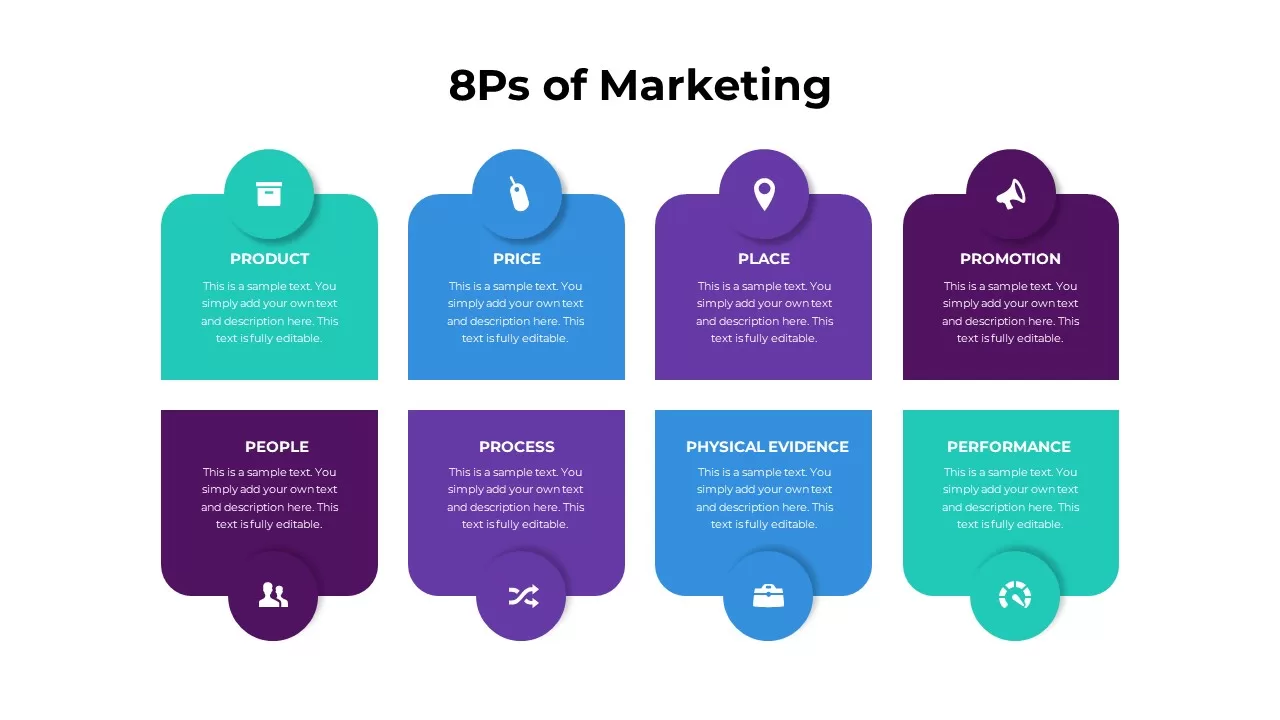
8Ps of Marketing Model Infographic Template for PowerPoint & Google Slides
Marketing
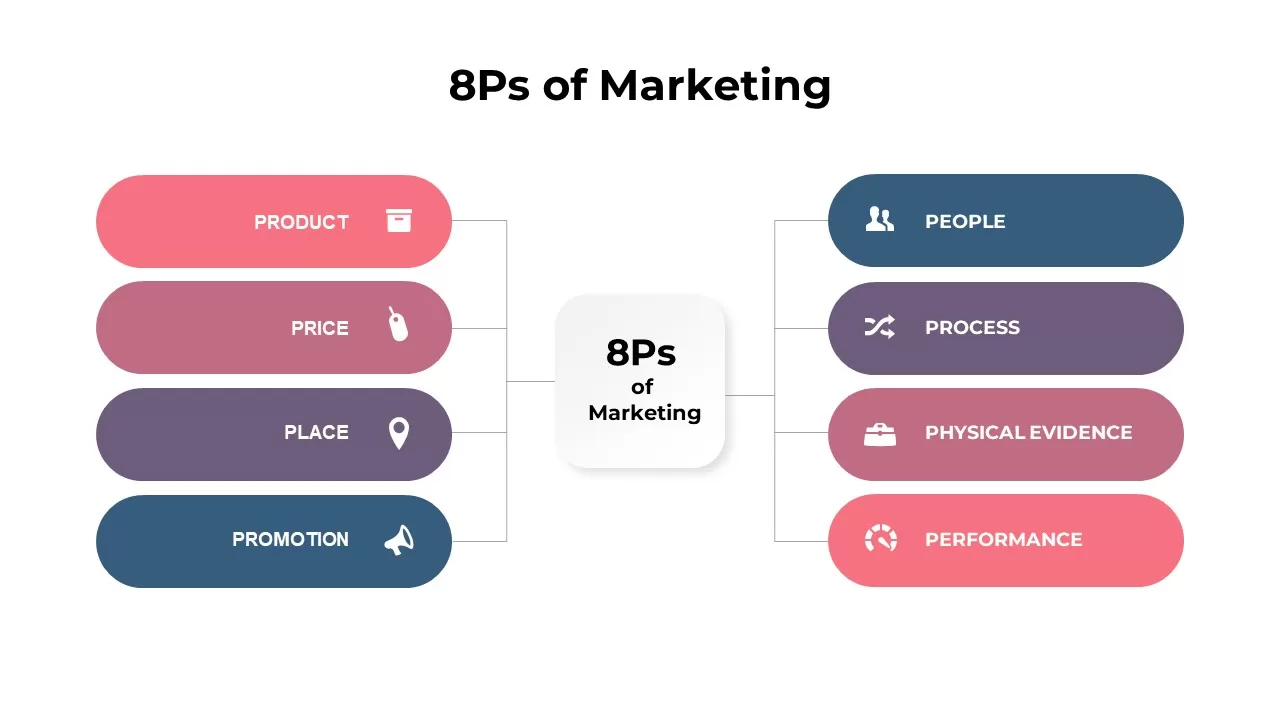
8Ps of Marketing Infographic Model Template for PowerPoint & Google Slides
Comparison
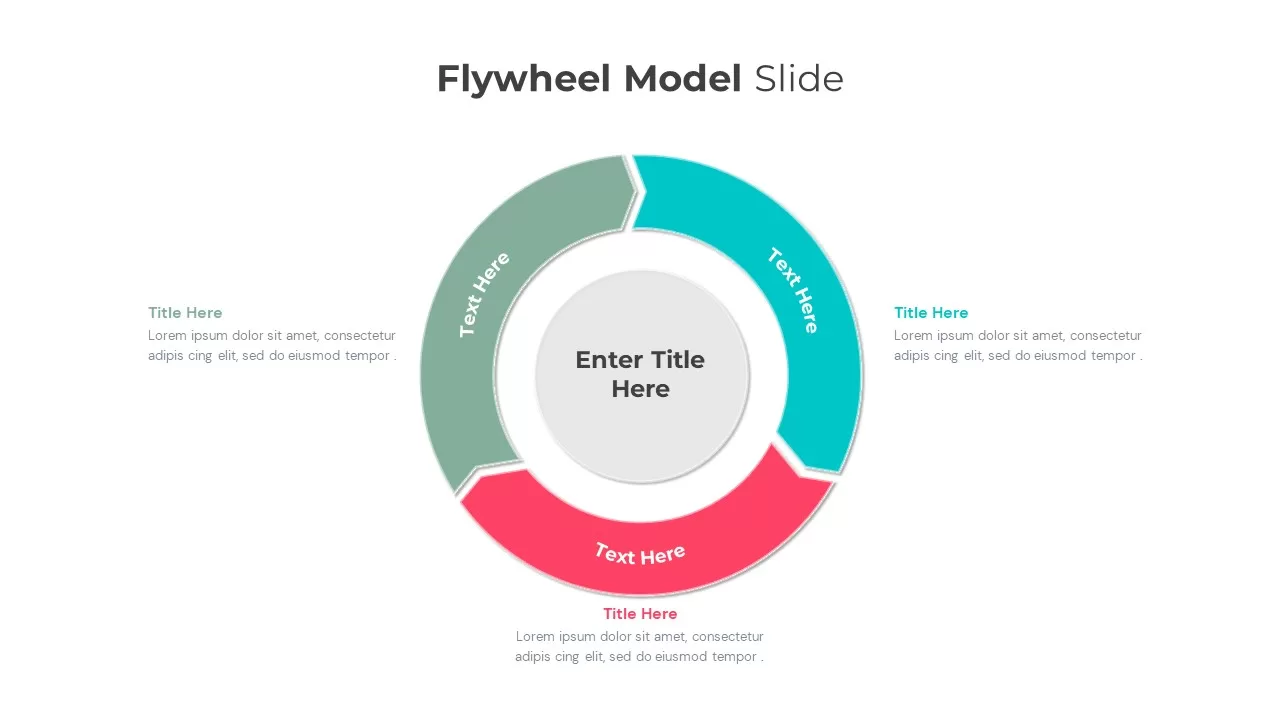
Flywheel Model Infographic Template for PowerPoint & Google Slides
Process
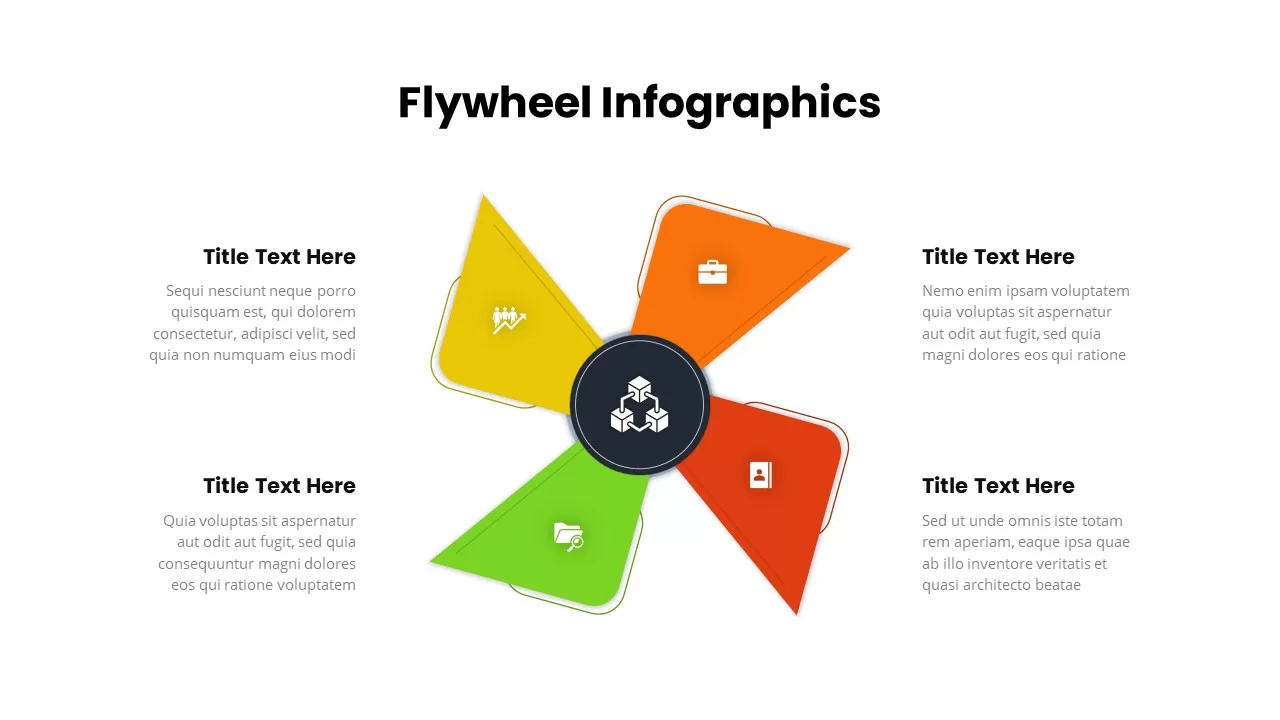
Four-Segment Flywheel Infographic Model Template for PowerPoint & Google Slides
Process
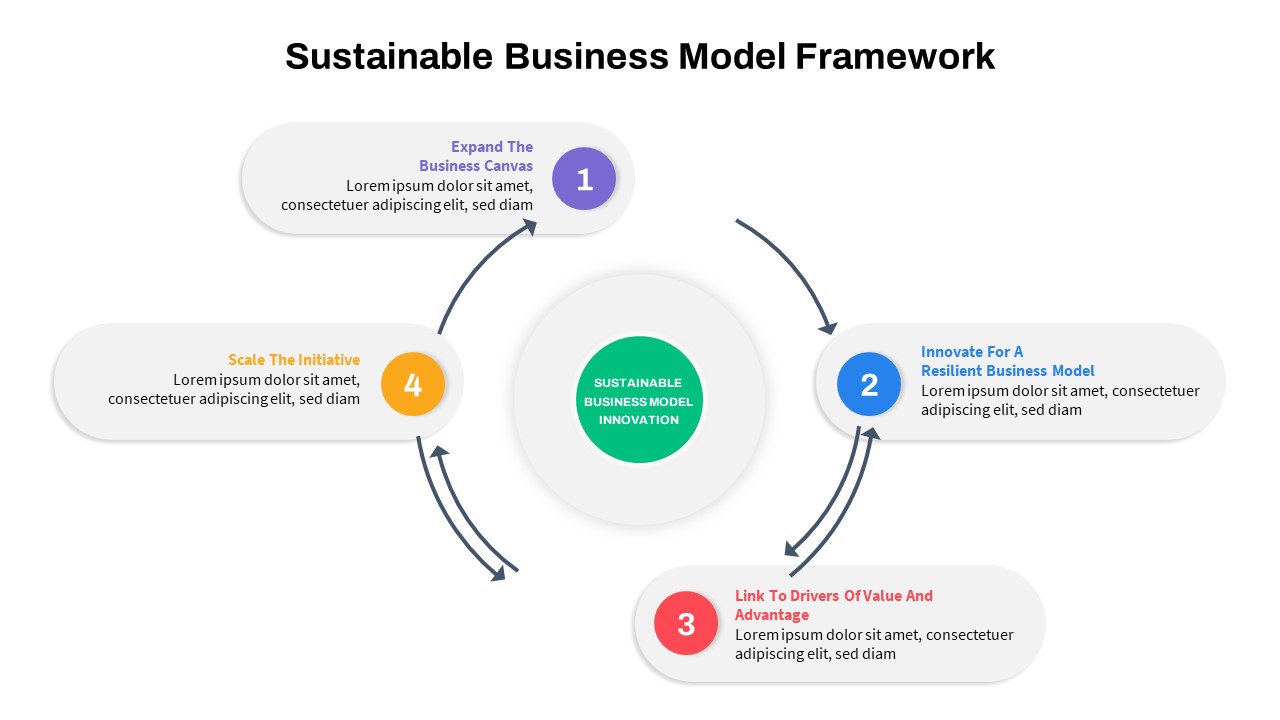
Sustainable Business Model Circular Infographic Template for PowerPoint & Google Slides
Business Strategy
Salience Model Venn Diagram Infographic Template for PowerPoint & Google Slides
Circular
Pricing Model Types Comparison Infographic Template for PowerPoint & Google Slides
Pitch Deck
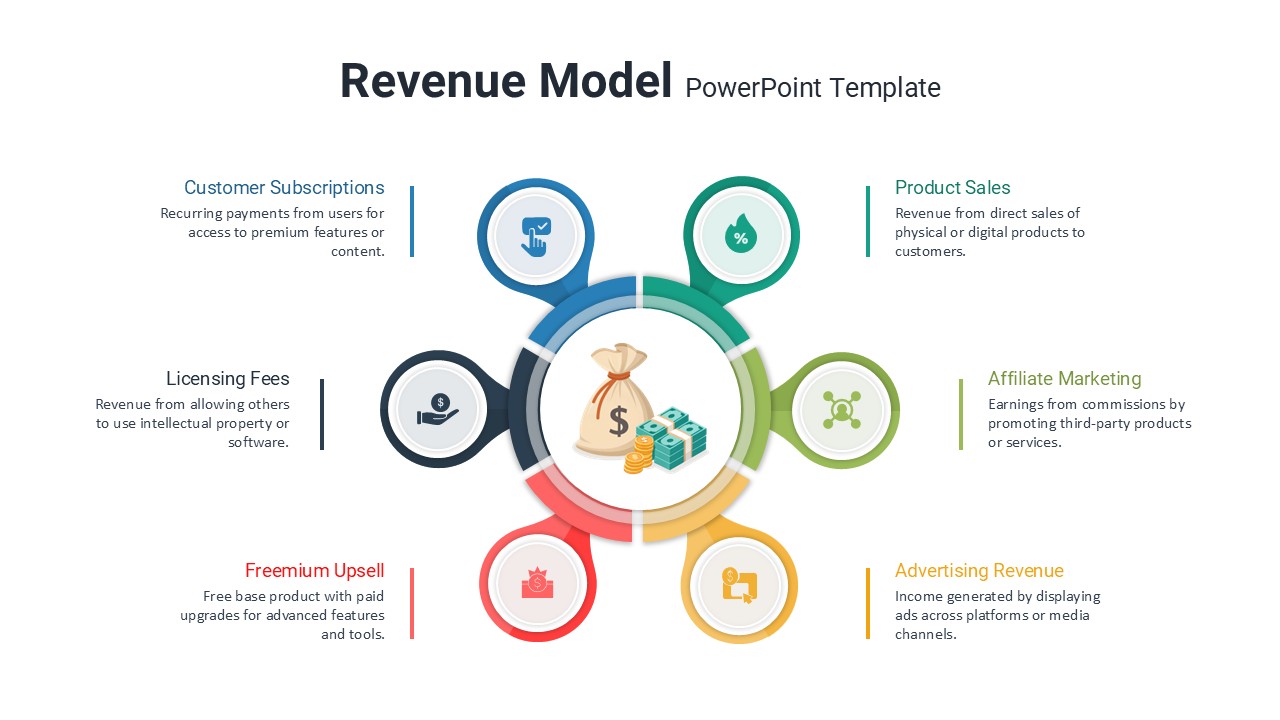
Six Revenue Stream Model Infographic Template for PowerPoint & Google Slides
Circular
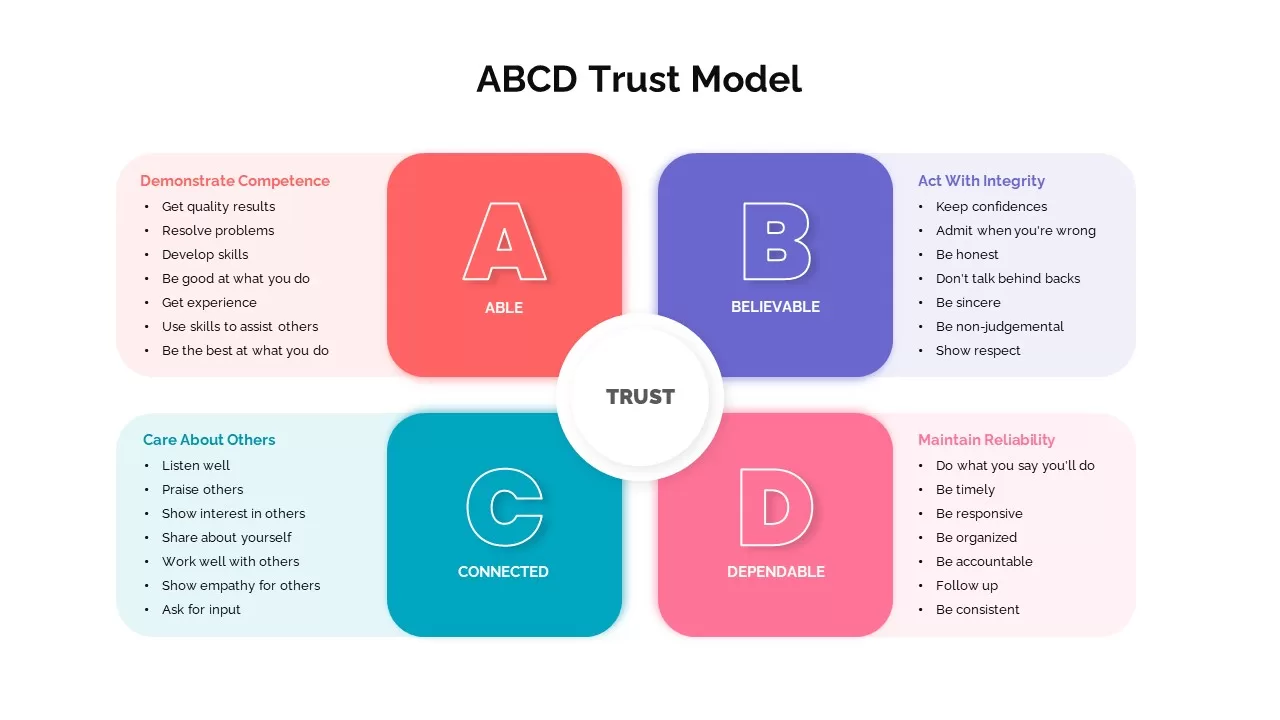
ABCD Trust Model Infographic for PowerPoint & Google Slides
Infographics
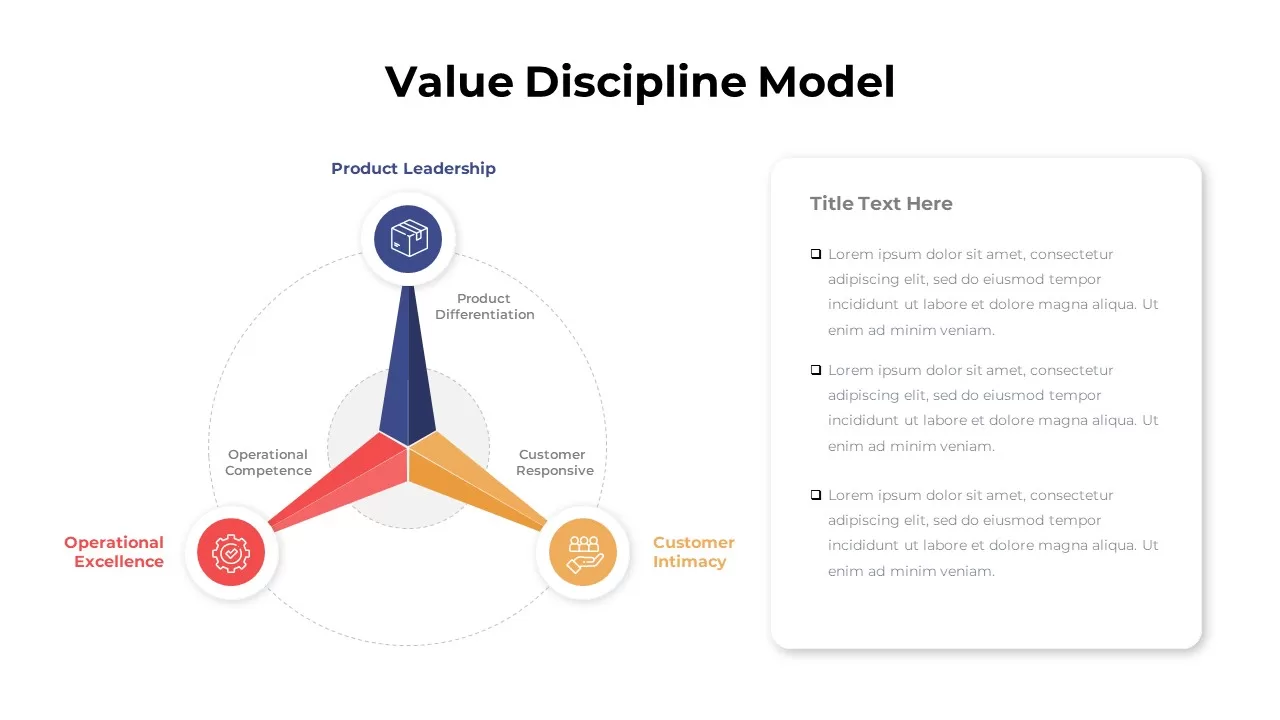
Value Discipline Model infographic for PowerPoint & Google Slides
Marketing
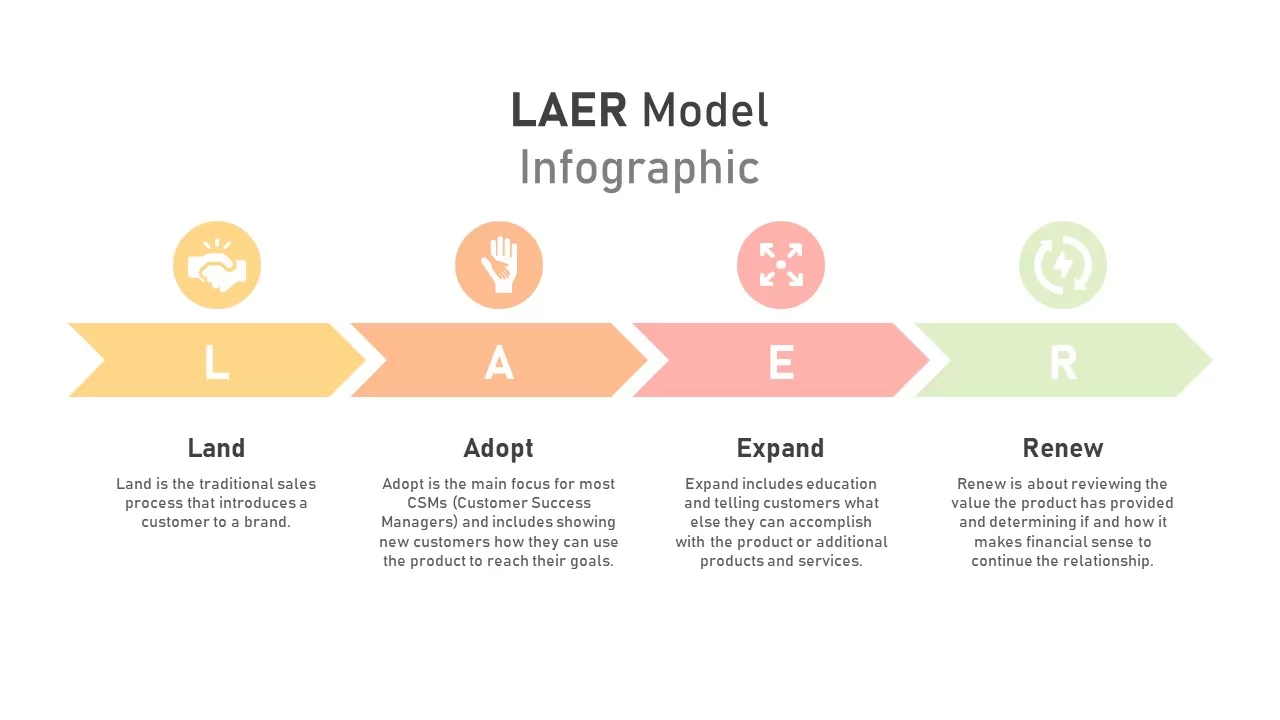
LAER Model Infographic for PowerPoint & Google Slides
Business Strategy
Google Ads Optimization & Performance Infographic Template for PowerPoint & Google Slides
Digital Marketing
SQ3R Study Strategy Infographic Slides Template for PowerPoint & Google Slides
Business Strategy
Six Double Diamond Infographic Slides Template for PowerPoint & Google Slides
Process

Sales Process Infographic Slides Pack Template for PowerPoint & Google Slides
Process
Casino/Poker Chips Infographic Slides template for PowerPoint & Google Slides
Business Strategy
Agenda Infographic Pack of 2 Slides Template for PowerPoint & Google Slides
Agenda
Quad Chart Infographic Pack of 8 Slides Template for PowerPoint & Google Slides
Comparison Chart
Four Options Infographic Slides Template for PowerPoint & Google Slides
Comparison
Game Plan Infographic Slides Pack Template for PowerPoint & Google Slides
Infographics
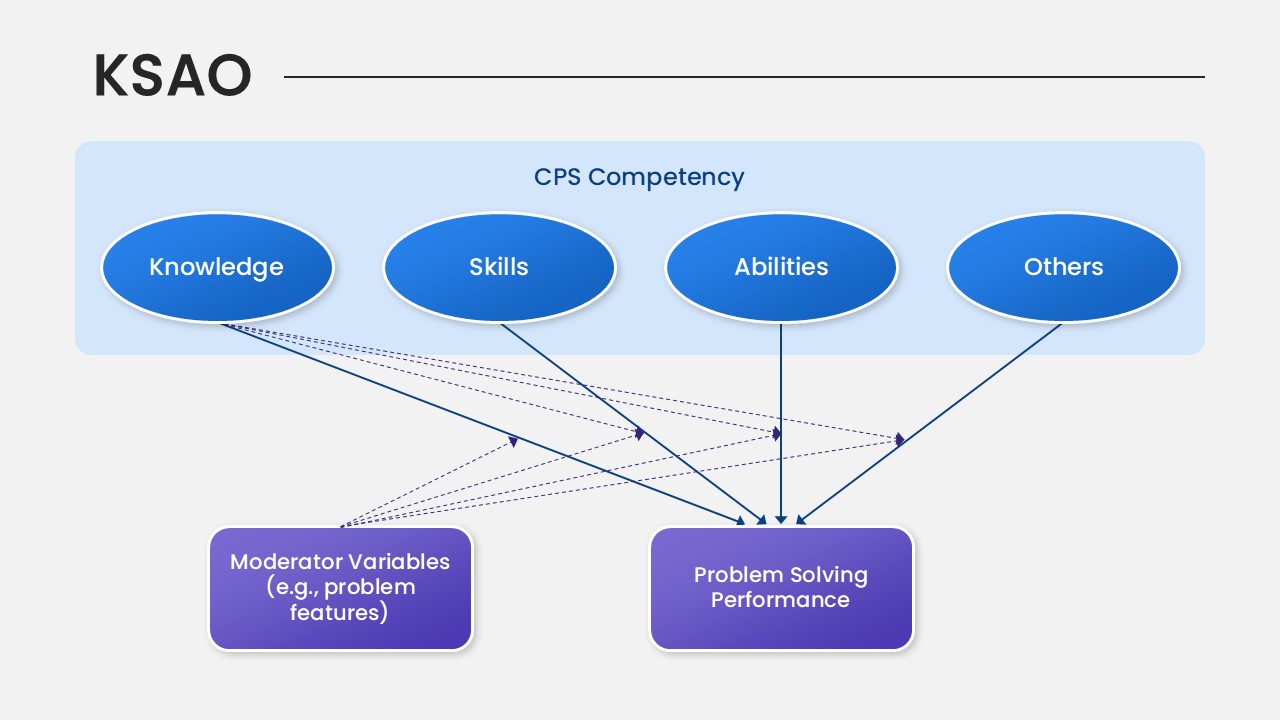
KSAO Model PowerPoint Template for PowerPoint & Google Slides
Business Strategy
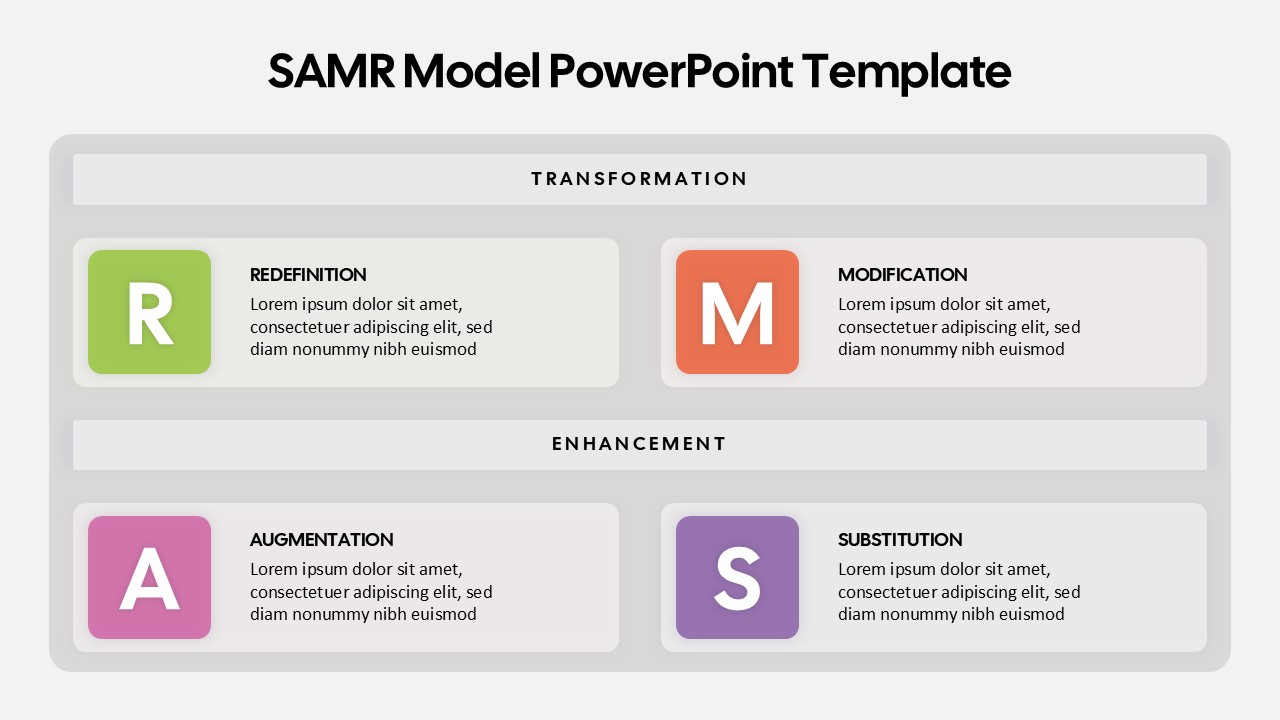
SAMR Model PowerPoint Template for PowerPoint & Google Slides
Business
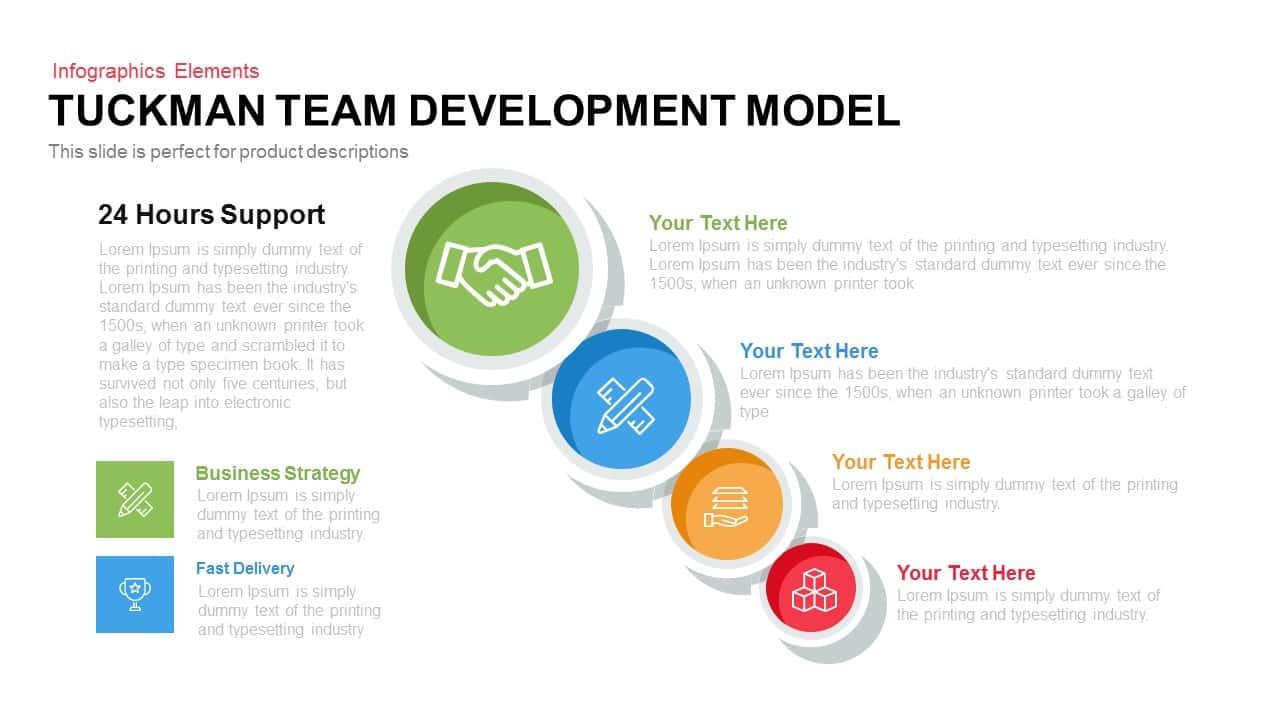
Tuckman Team Model Template for PowerPoint & Google Slides
Infographics
Ansoff Matrix Growth Strategy Model Template for PowerPoint & Google Slides
BCG
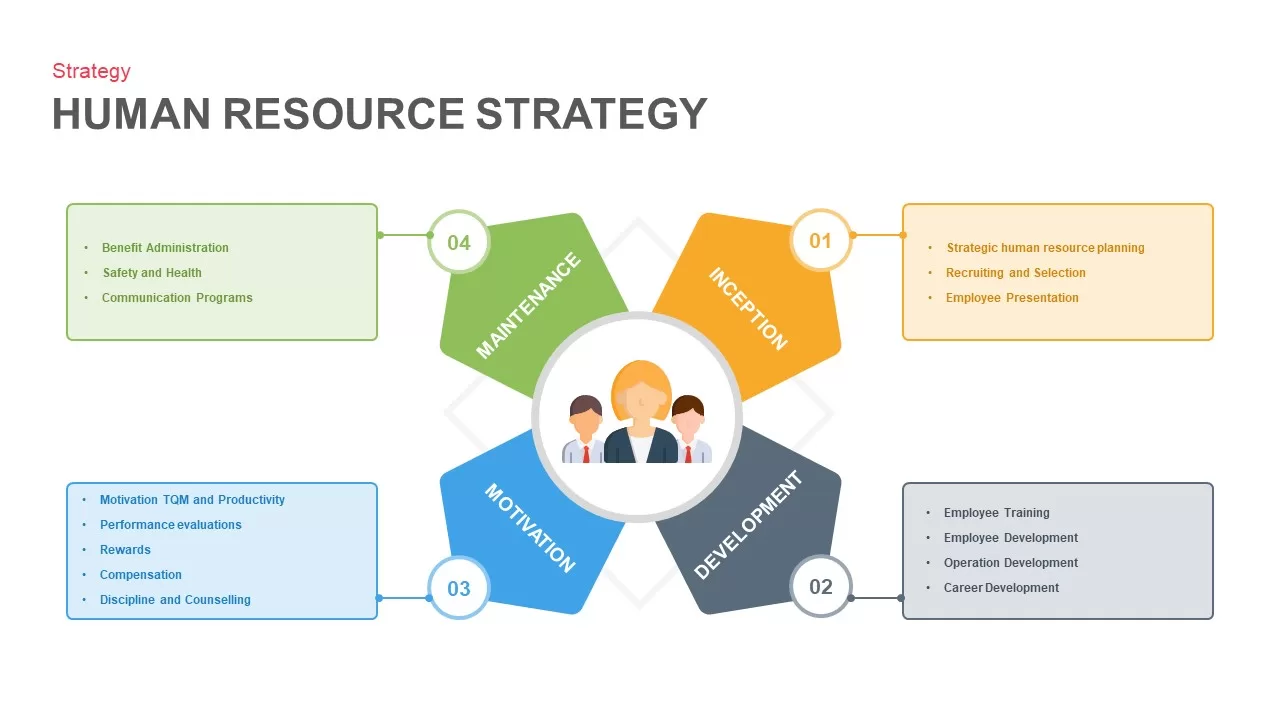
Human Resource Strategy Model Pack Template for PowerPoint & Google Slides
HR

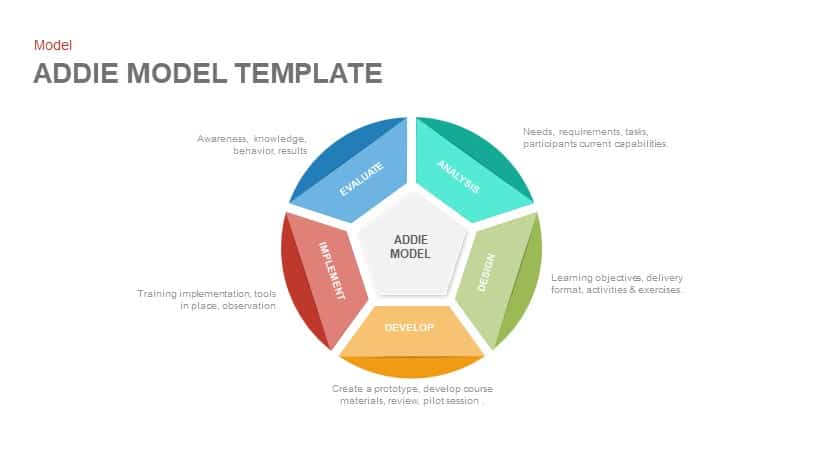
ADDIE Model Instructional Design Template for PowerPoint & Google Slides
Circular
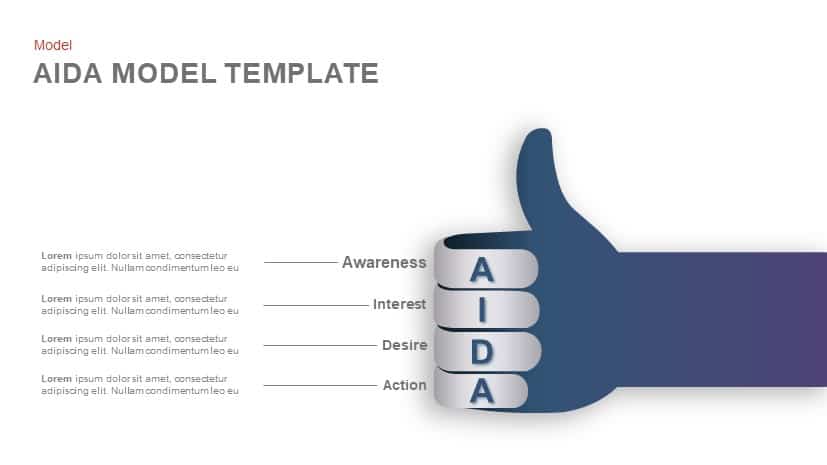
AIDA Model Funnel Thumb Diagram Template for PowerPoint & Google Slides
Process
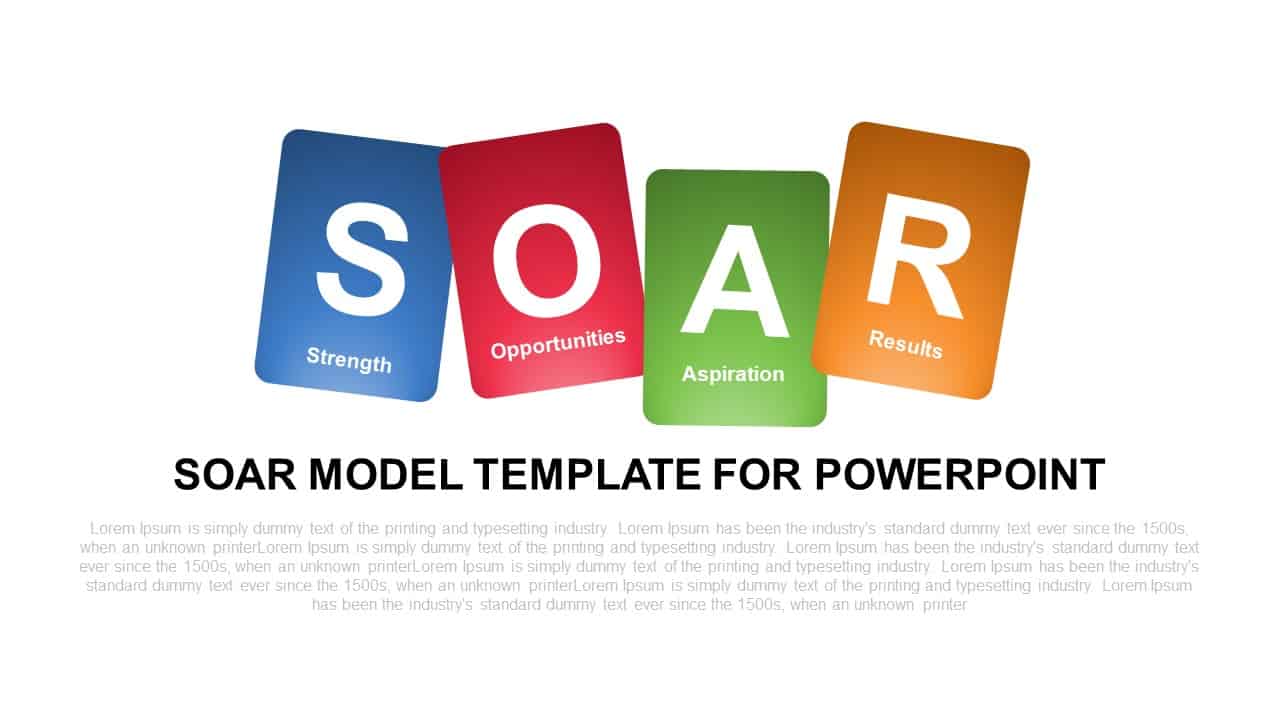
SOAR Strategic Model Card Diagram Template for PowerPoint & Google Slides
Process
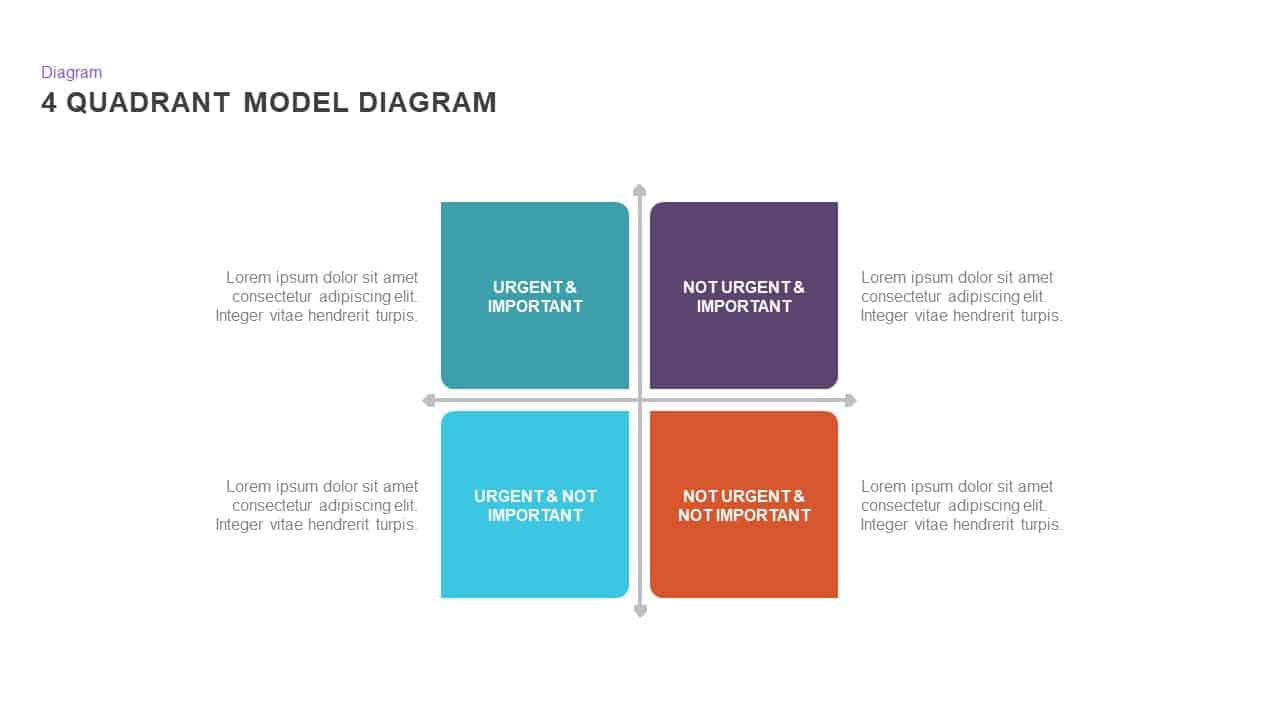
4 Quadrant Model Diagram template for PowerPoint & Google Slides
Process
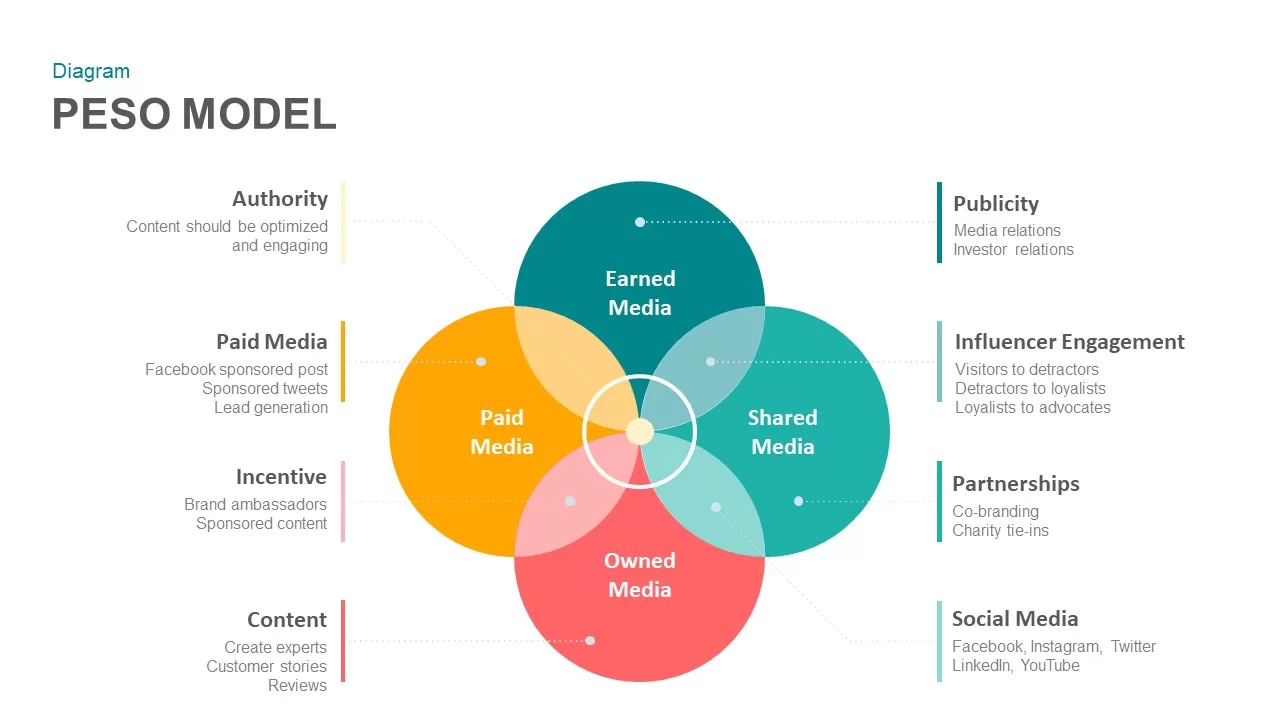
PESO Model Marketing Diagram Template for PowerPoint & Google Slides
Digital Marketing
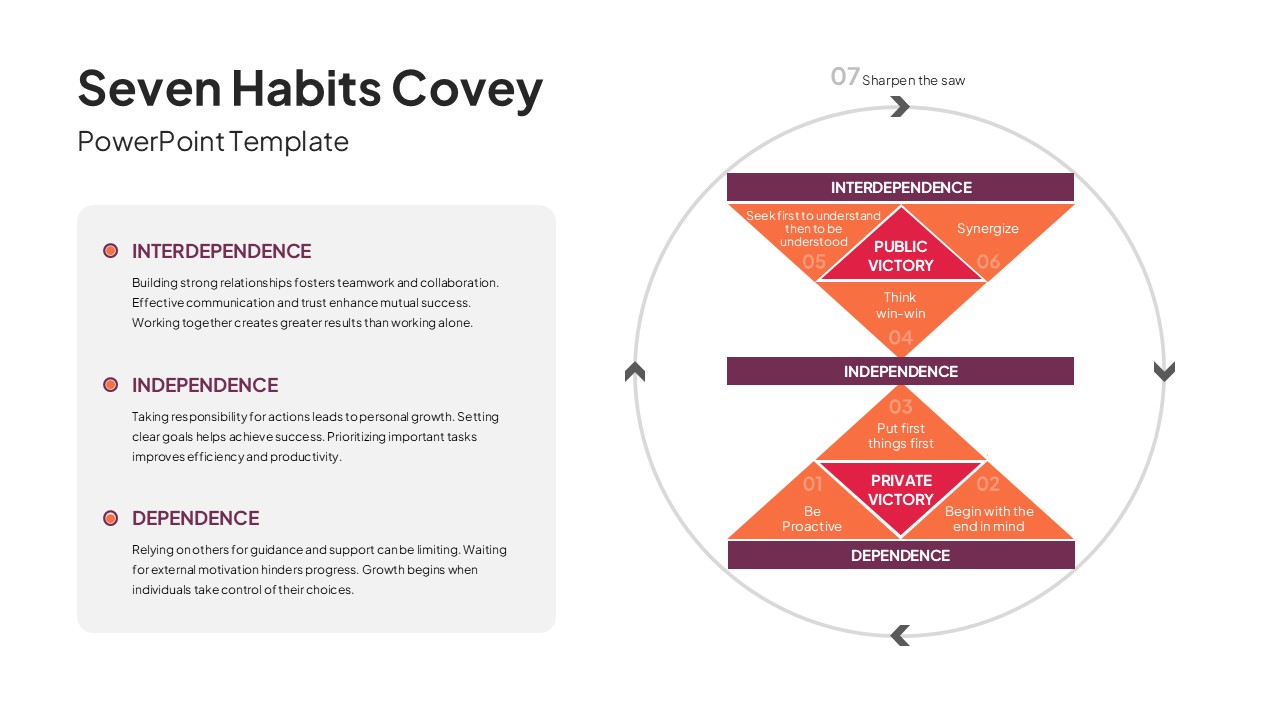
7 Habits of Highly Effective People Covey Model Template for PowerPoint & Google Slides
Leadership
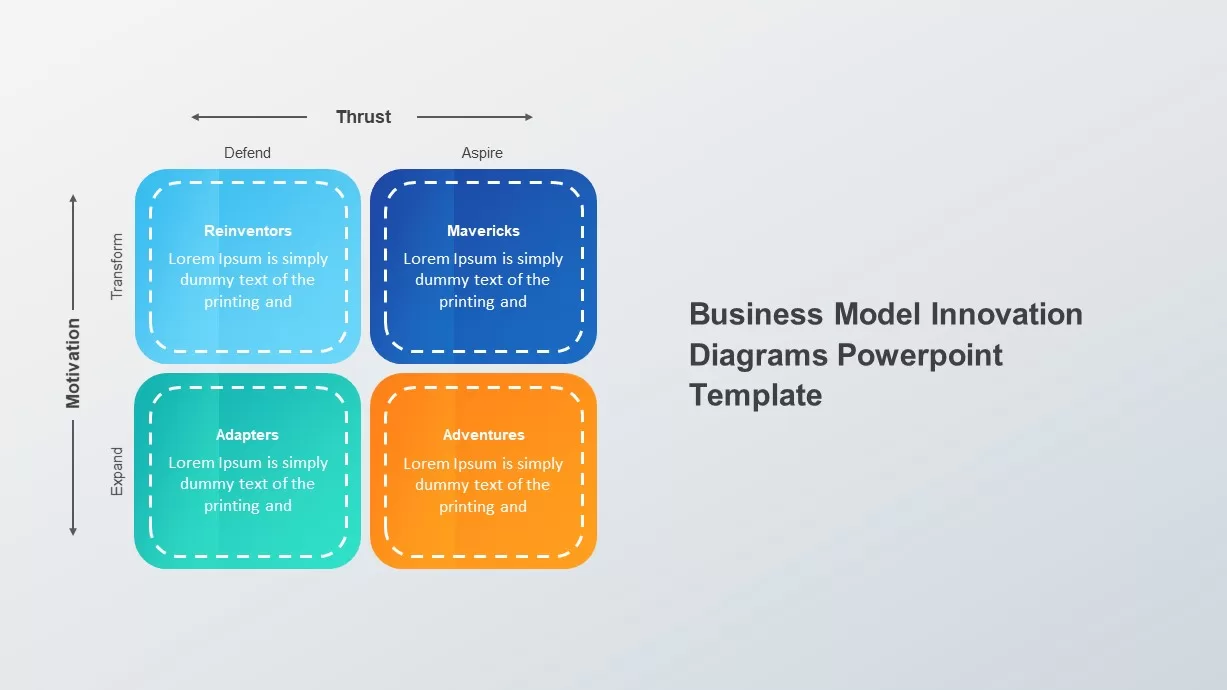
Business Model Innovation Diagrams template for PowerPoint & Google Slides
Process
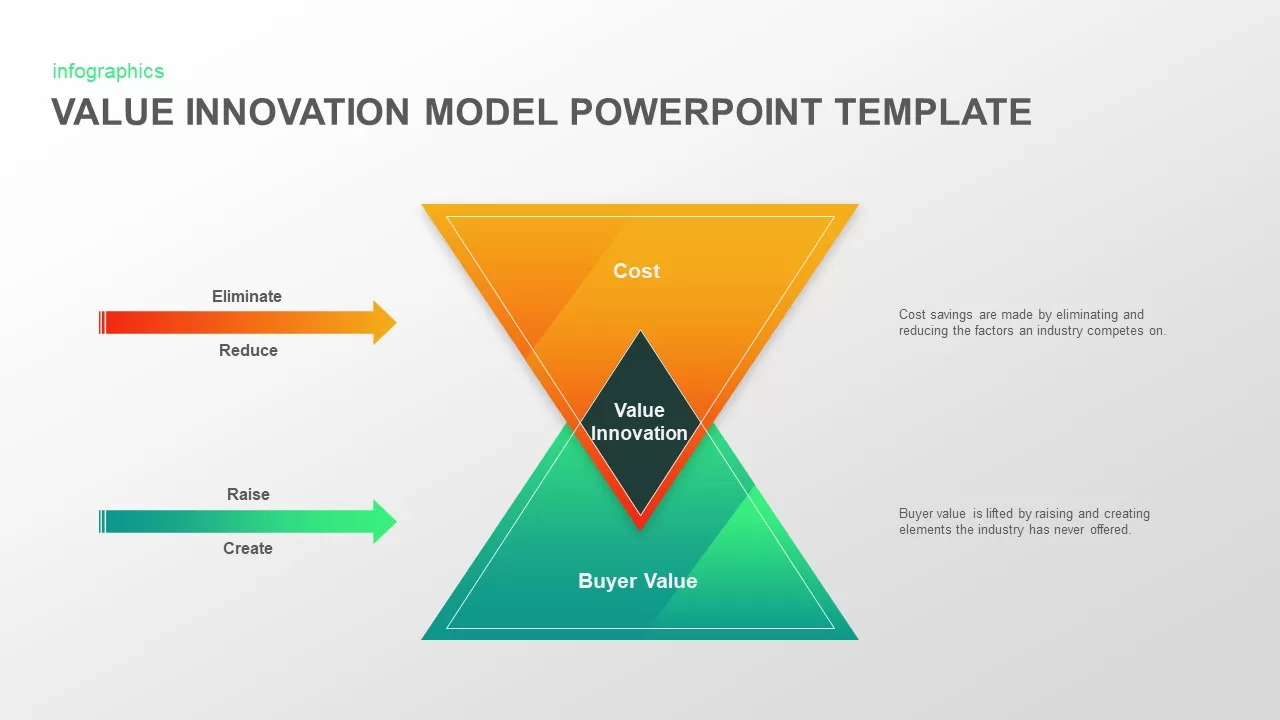
Value Innovation Model PowerPoint & Google Slides Template for Presentations
Business Proposal
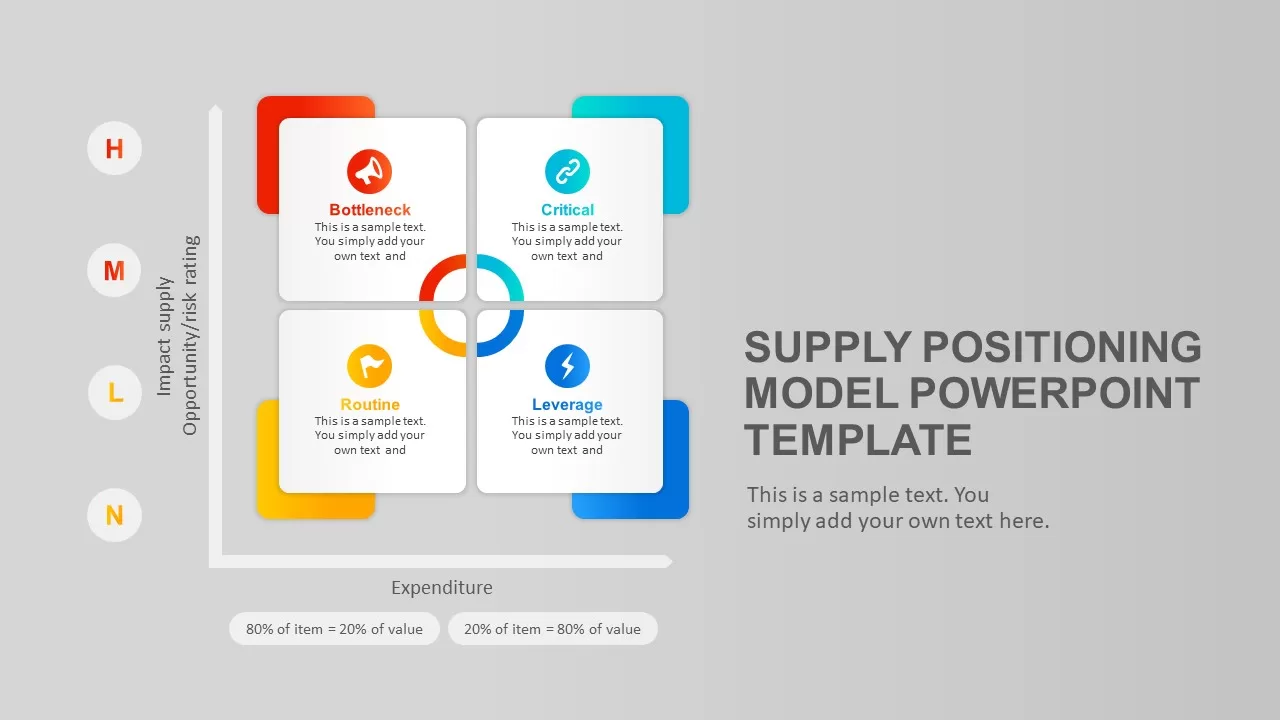
Supply Positioning Model Template for PowerPoint & Google Slides
Business Models
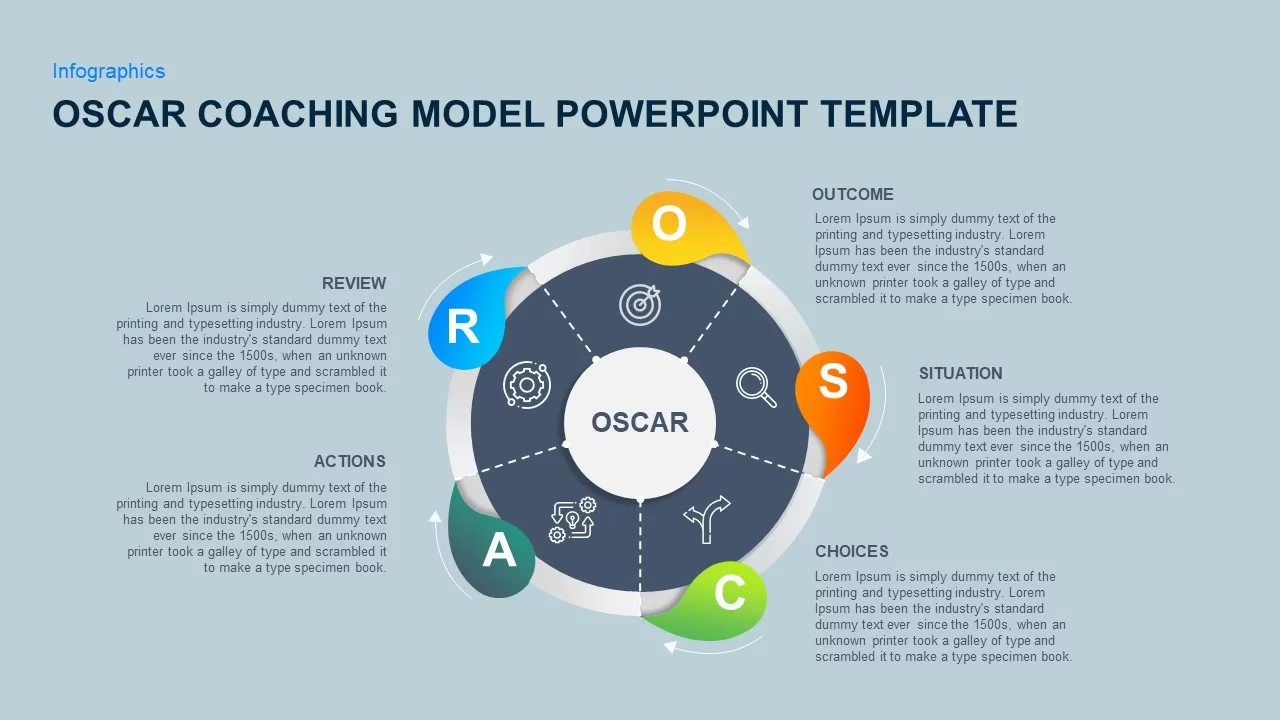
OSCAR Coaching Model Template for PowerPoint & Google Slides
Business Models
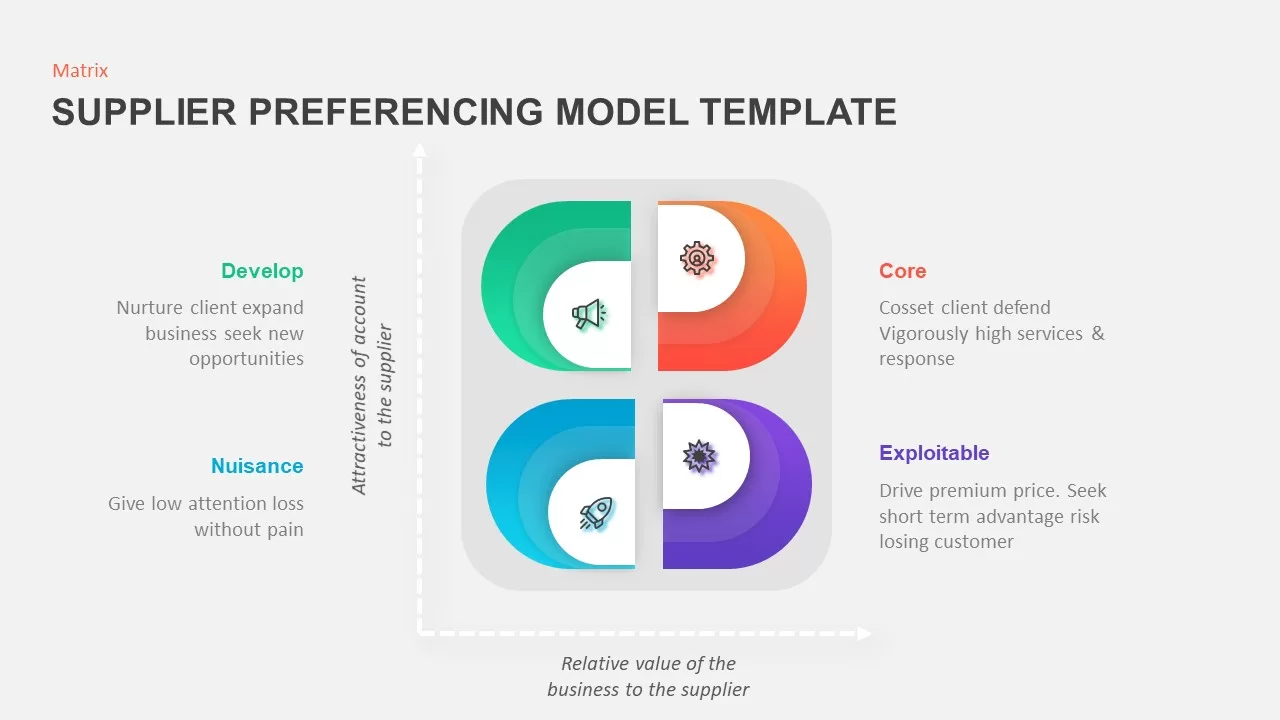
Supplier Preferencing Model Matrix Template for PowerPoint & Google Slides
Business Strategy
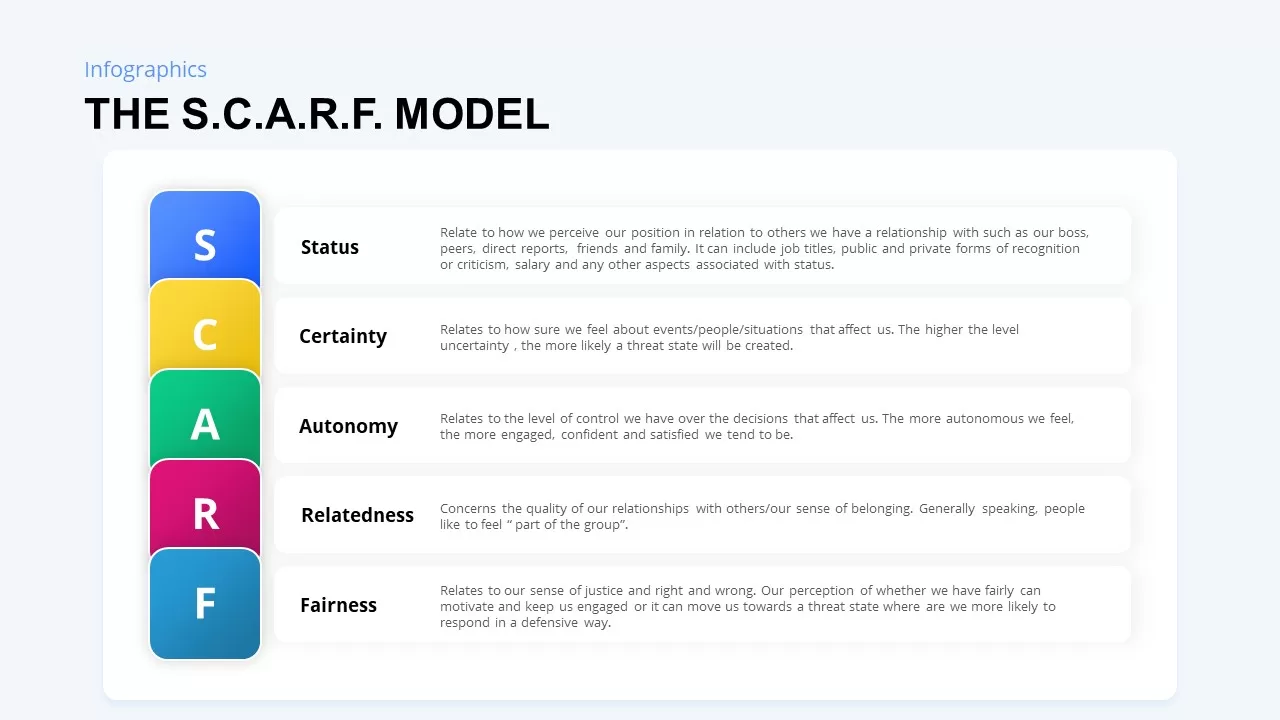
SCARF Model Social Threats & Rewards Template for PowerPoint & Google Slides
Business Strategy
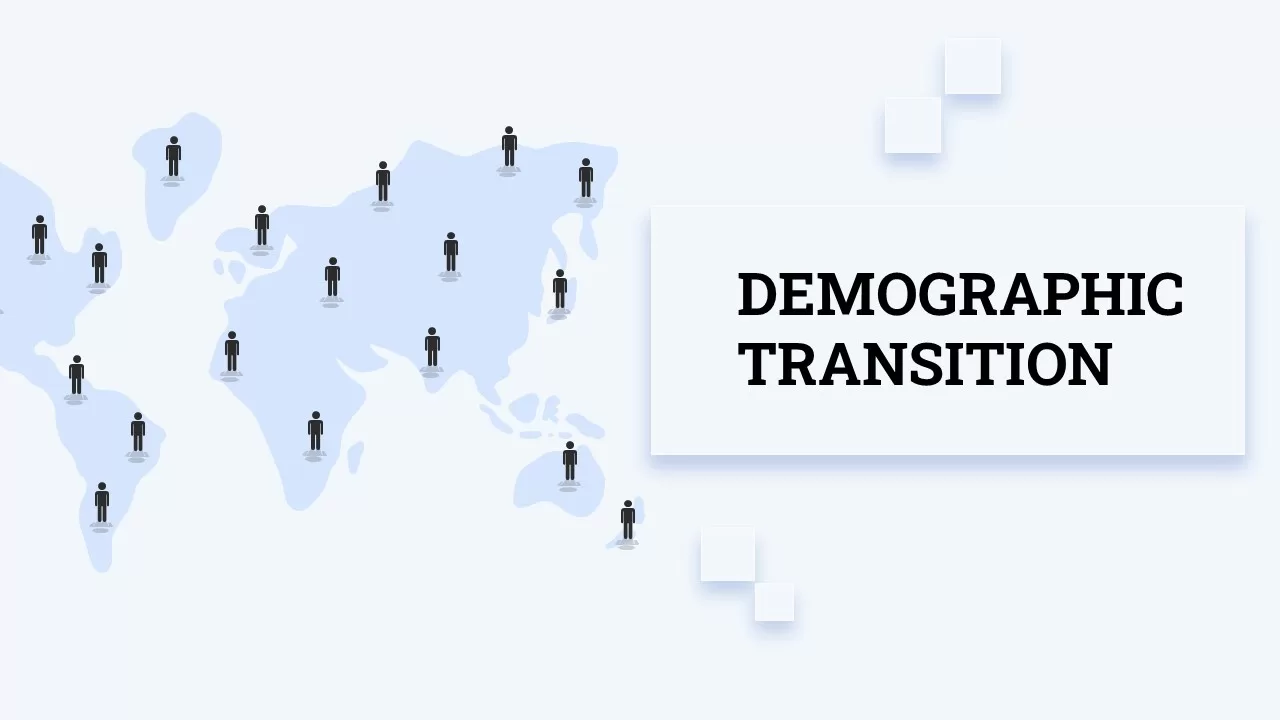
Demographic Transition Model Template for PowerPoint & Google Slides
Process
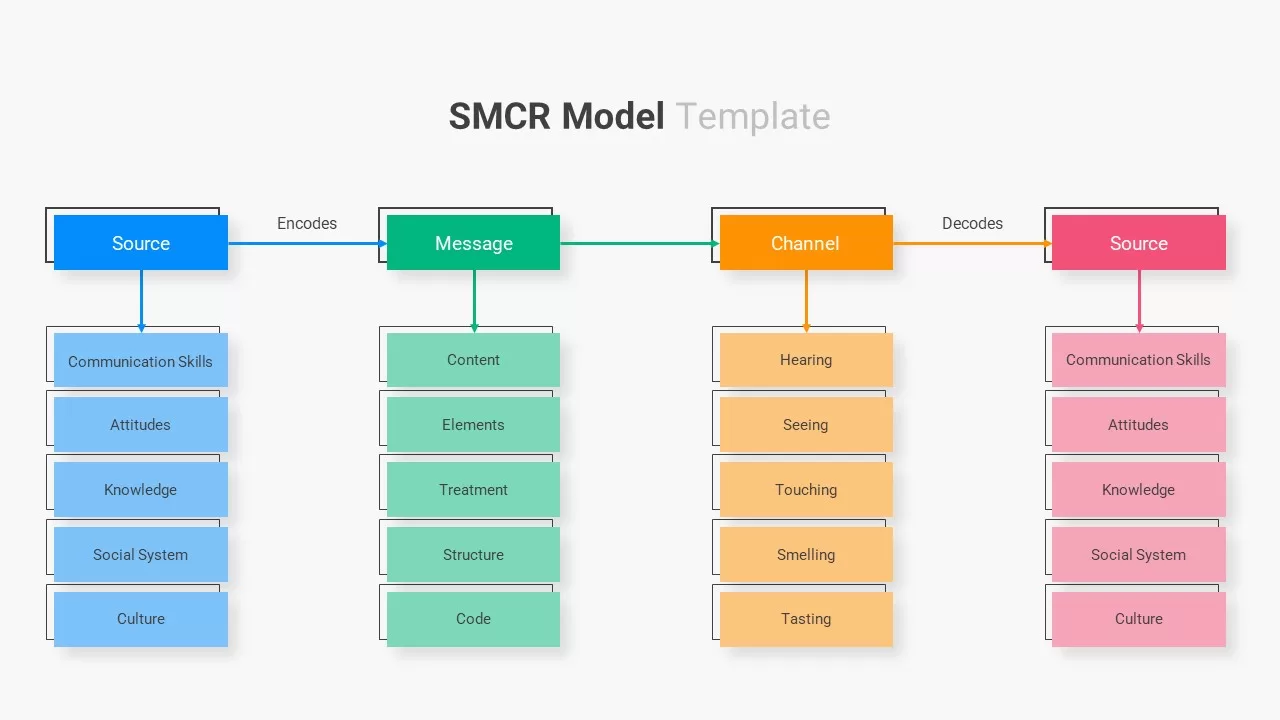
SMCR Model Template for PowerPoint & Google Slides
Infographics
DIKW Data to Wisdom Pyramid Model Template for PowerPoint & Google Slides
Pyramid
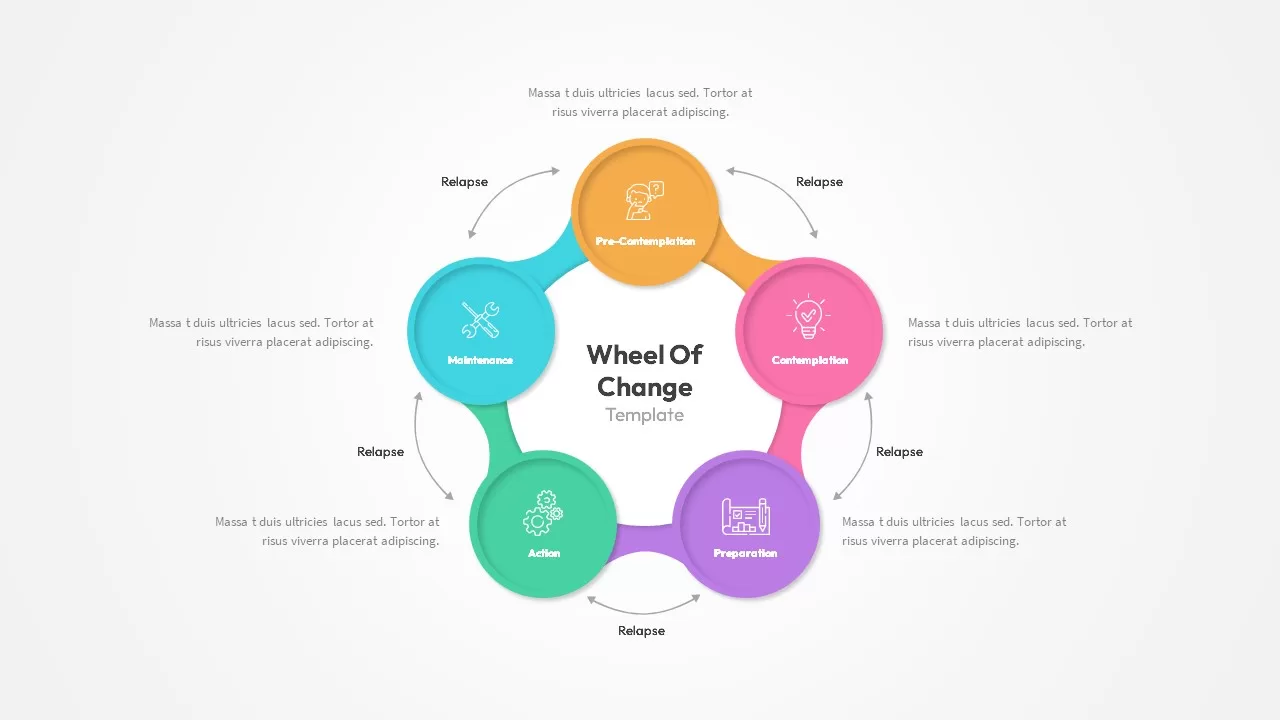
Wheel of Change Model template for PowerPoint & Google Slides
Business Strategy
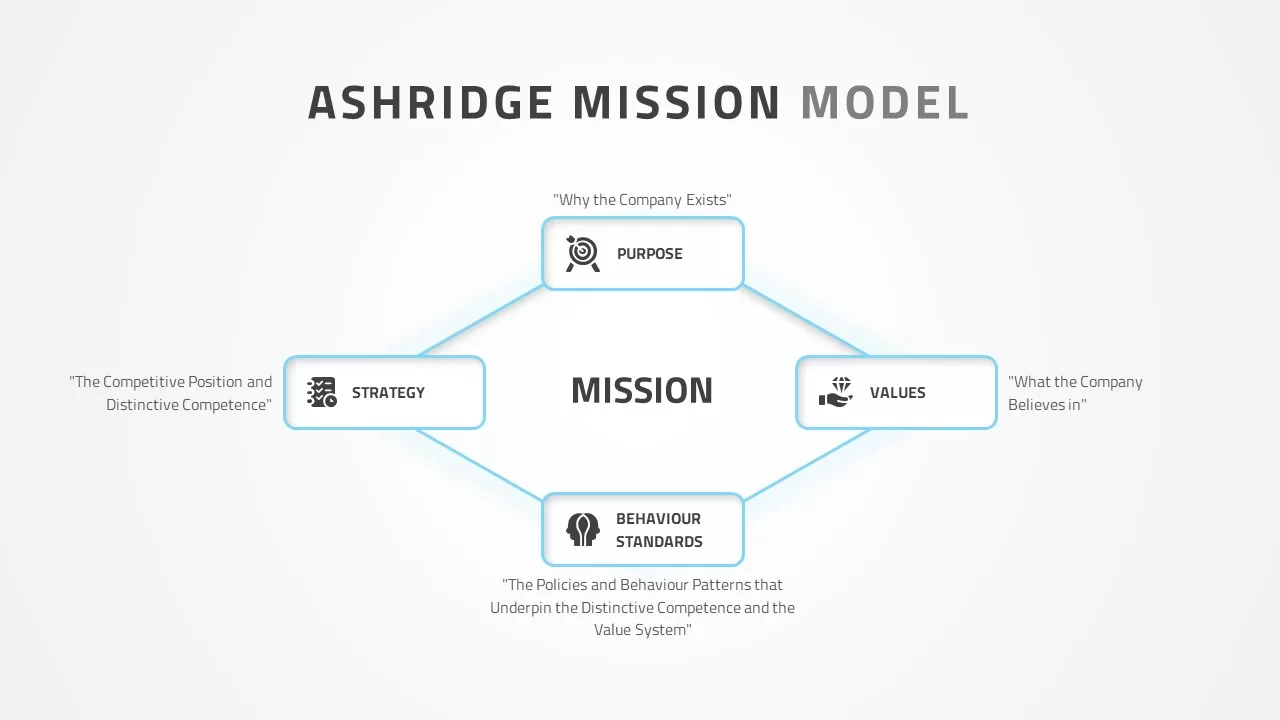
Ashridge Mission Model template for PowerPoint & Google Slides
Competitor Analysis
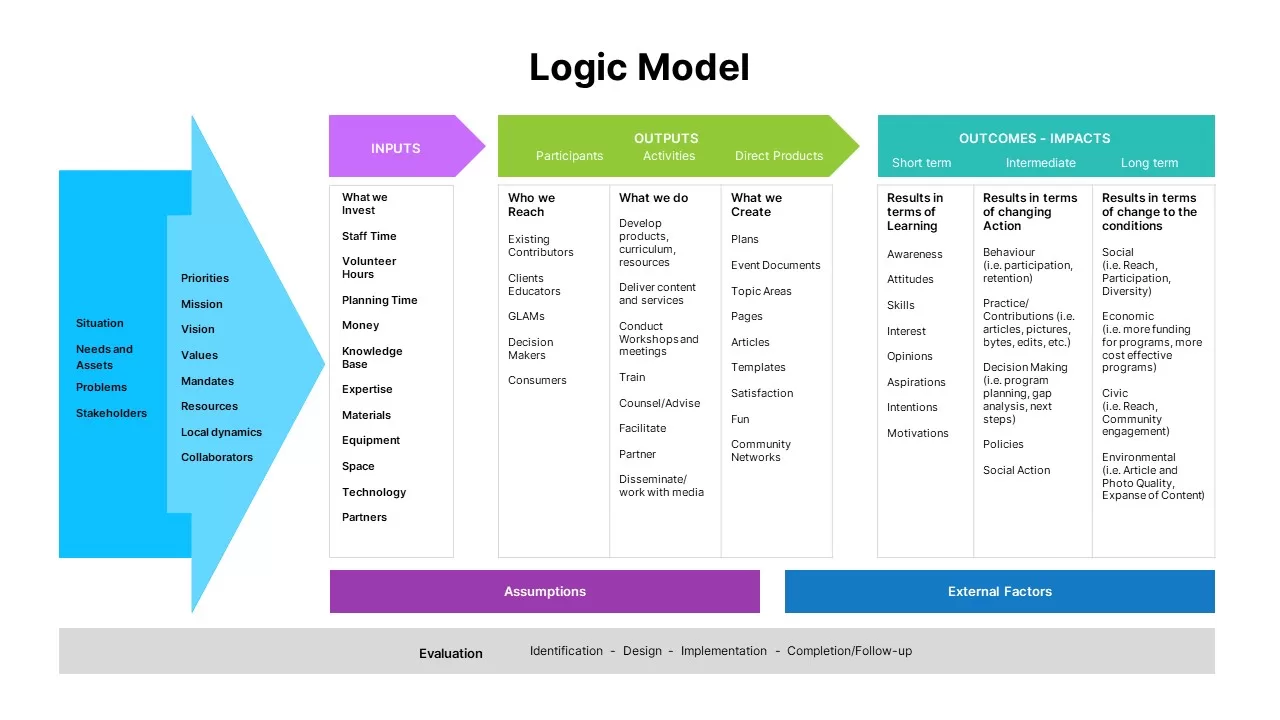
Logic Model template for PowerPoint & Google Slides
Infographics
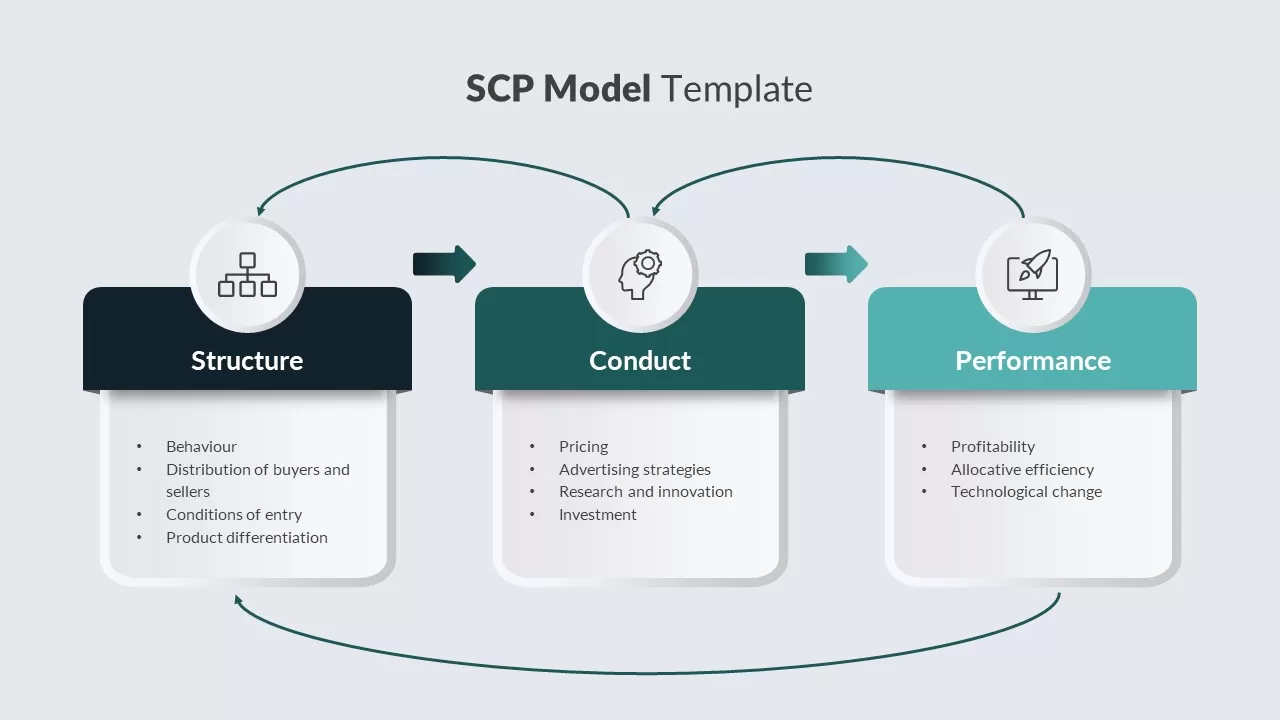
SCP Model Template for PowerPoint & Google Slides
Process
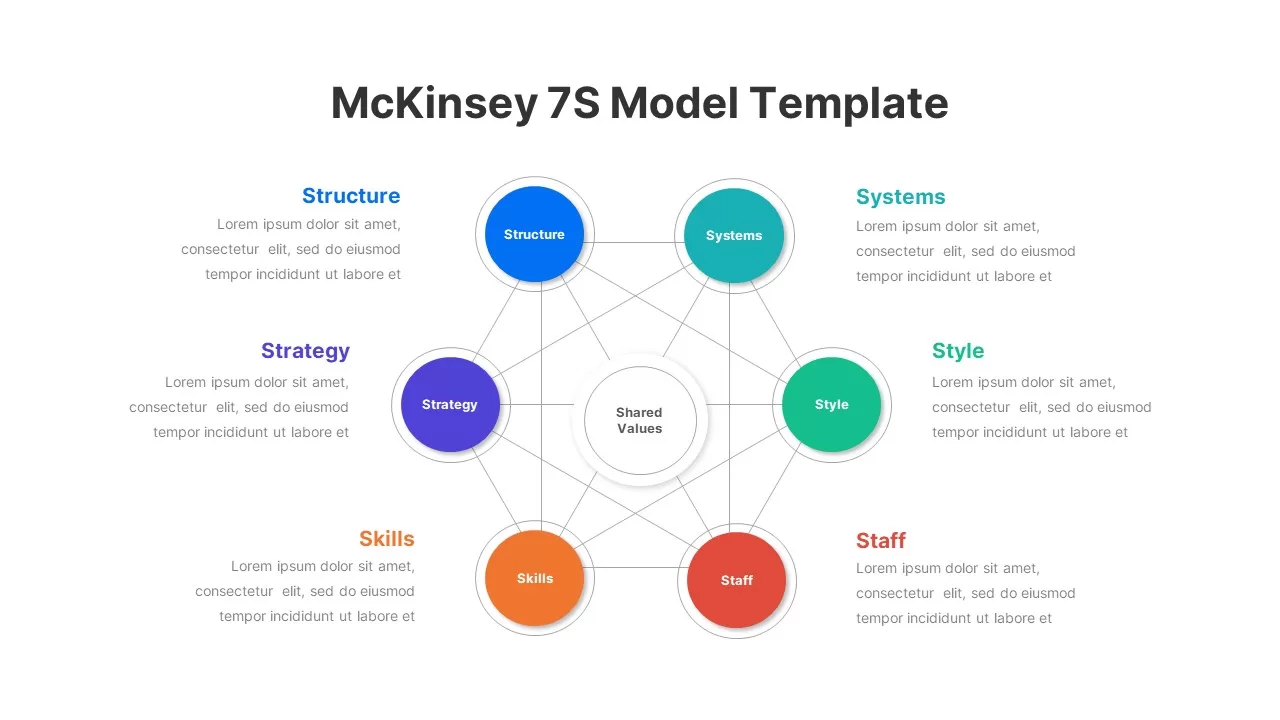
McKinsey 7S Model Strategic Alignment Template for PowerPoint & Google Slides
Circular
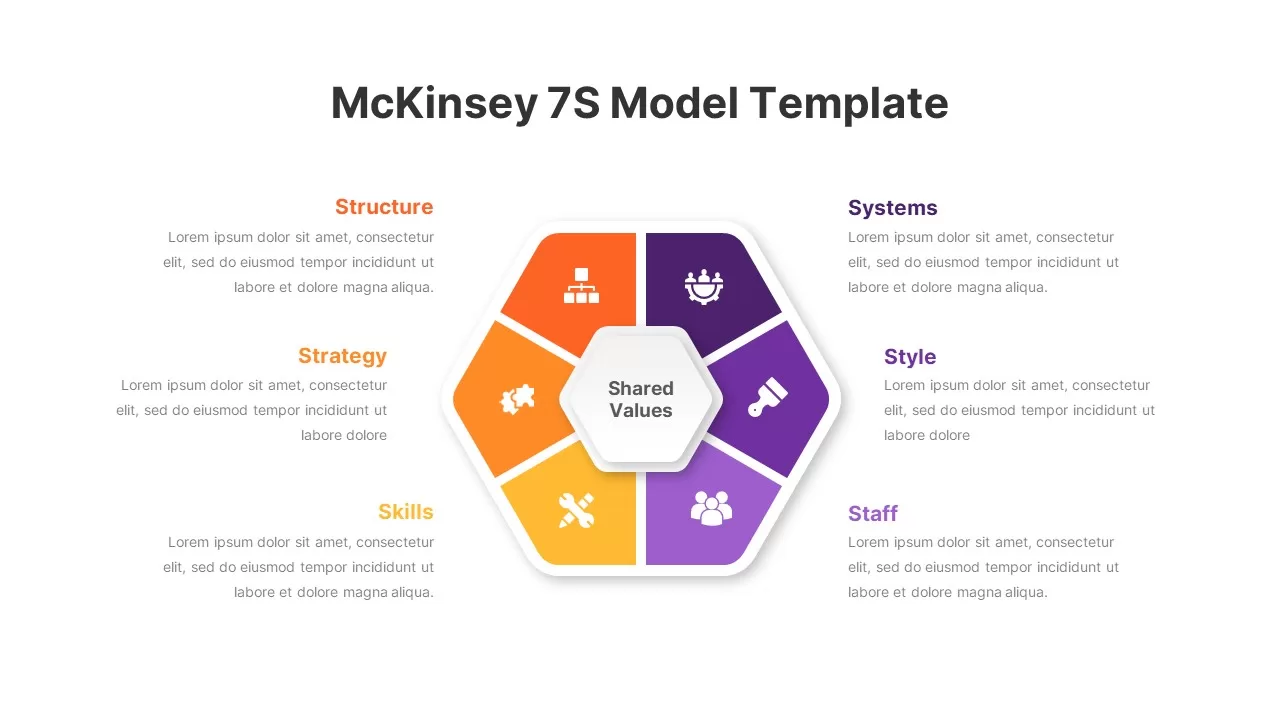
Hexagon 7S Strategic Alignment Model Template for PowerPoint & Google Slides
Business Strategy
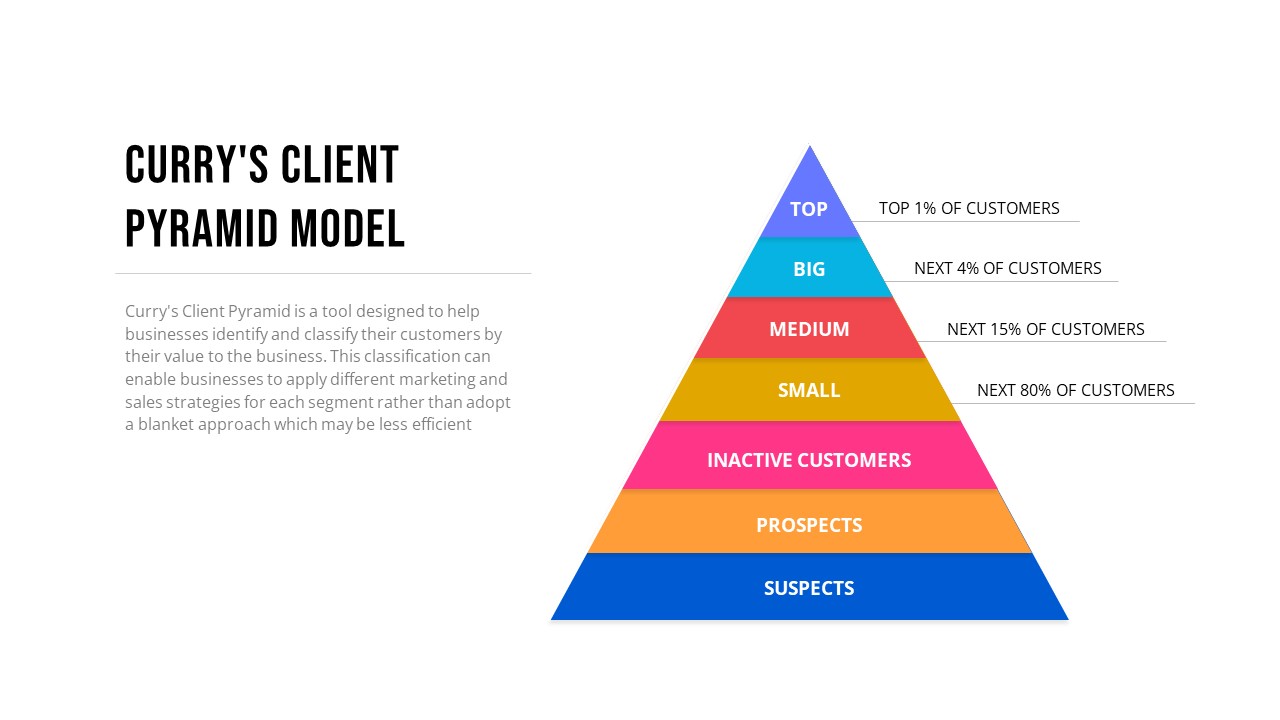
Curry’s Client Segmentation Pyramid Model Template for PowerPoint & Google Slides
Pyramid
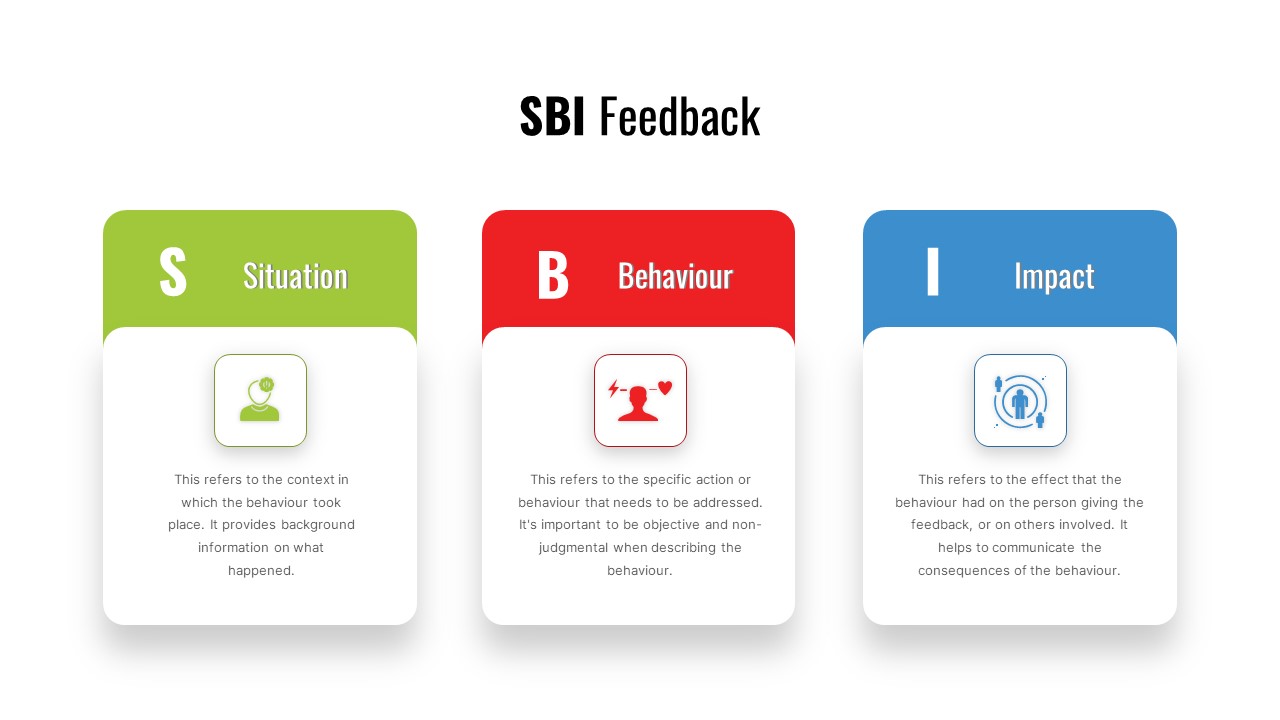
SBI Feedback Model Process Diagram Template for PowerPoint & Google Slides
Process
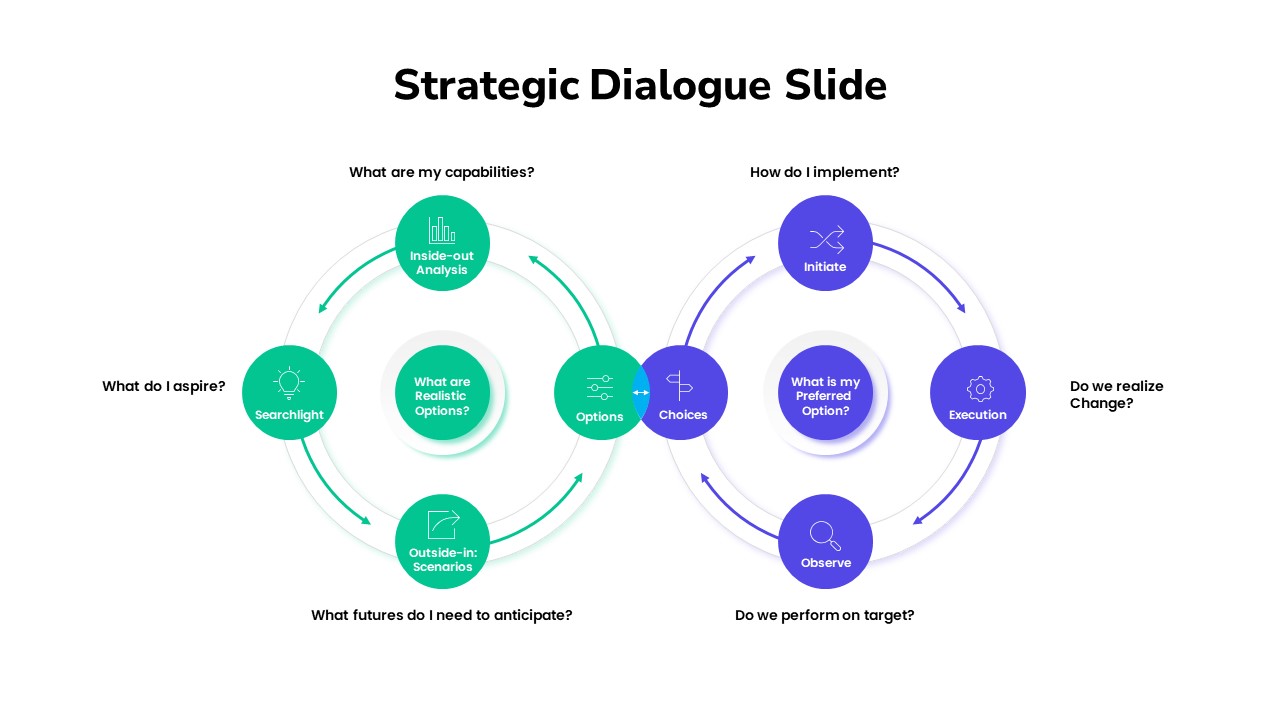
Strategic Dialogue Model Cycle Template for PowerPoint & Google Slides
Circular
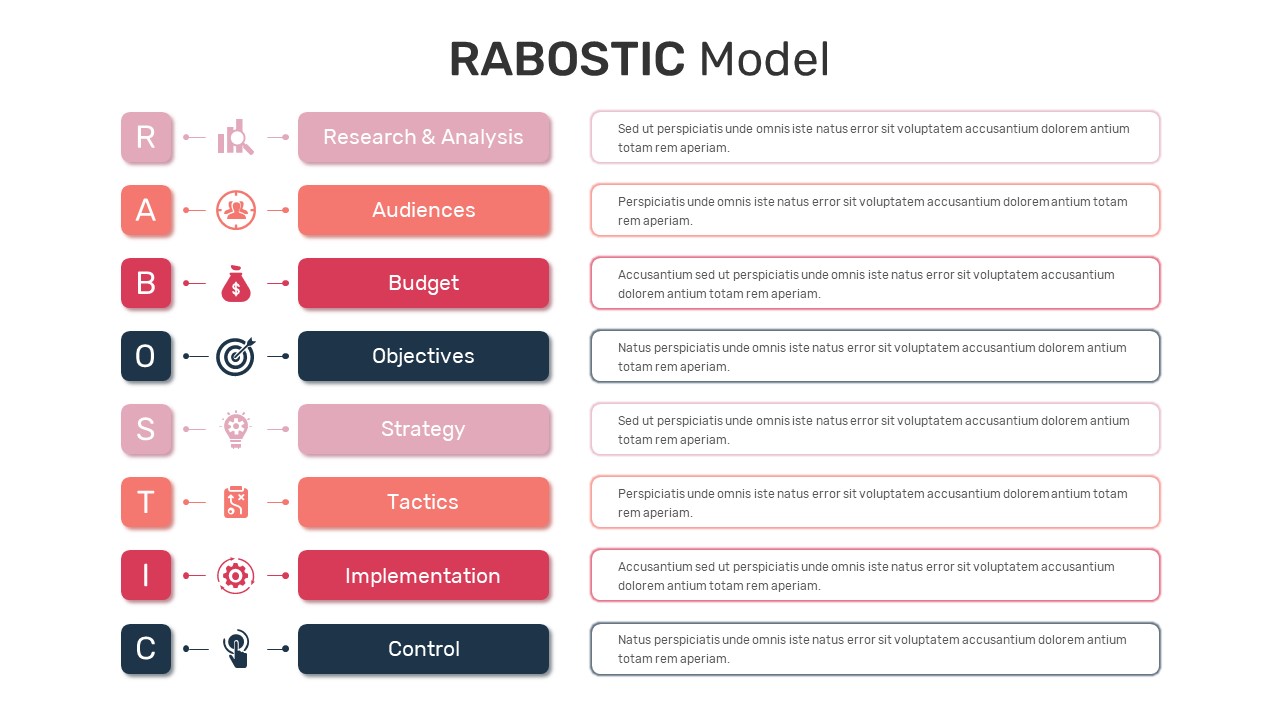
RABOSTIC Marketing Model Process Diagram Template for PowerPoint & Google Slides
Process
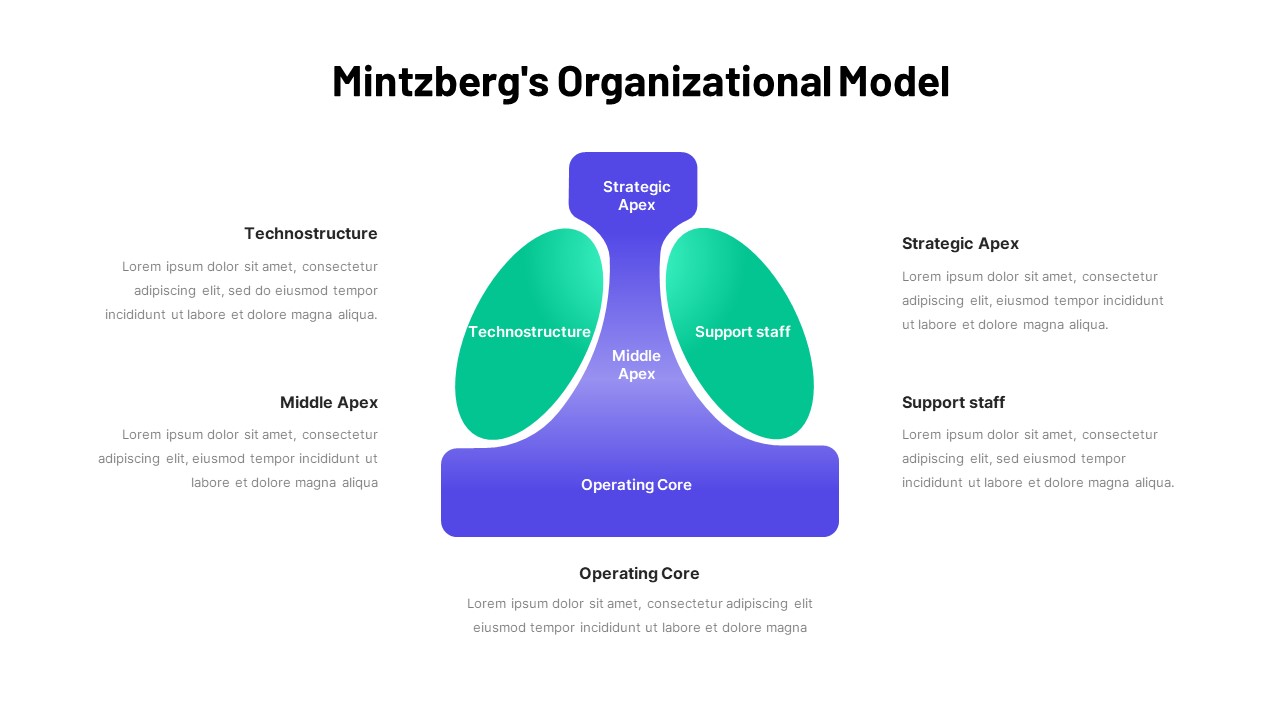
Mintzberg Organizational Model Gradient Template for PowerPoint & Google Slides
Business
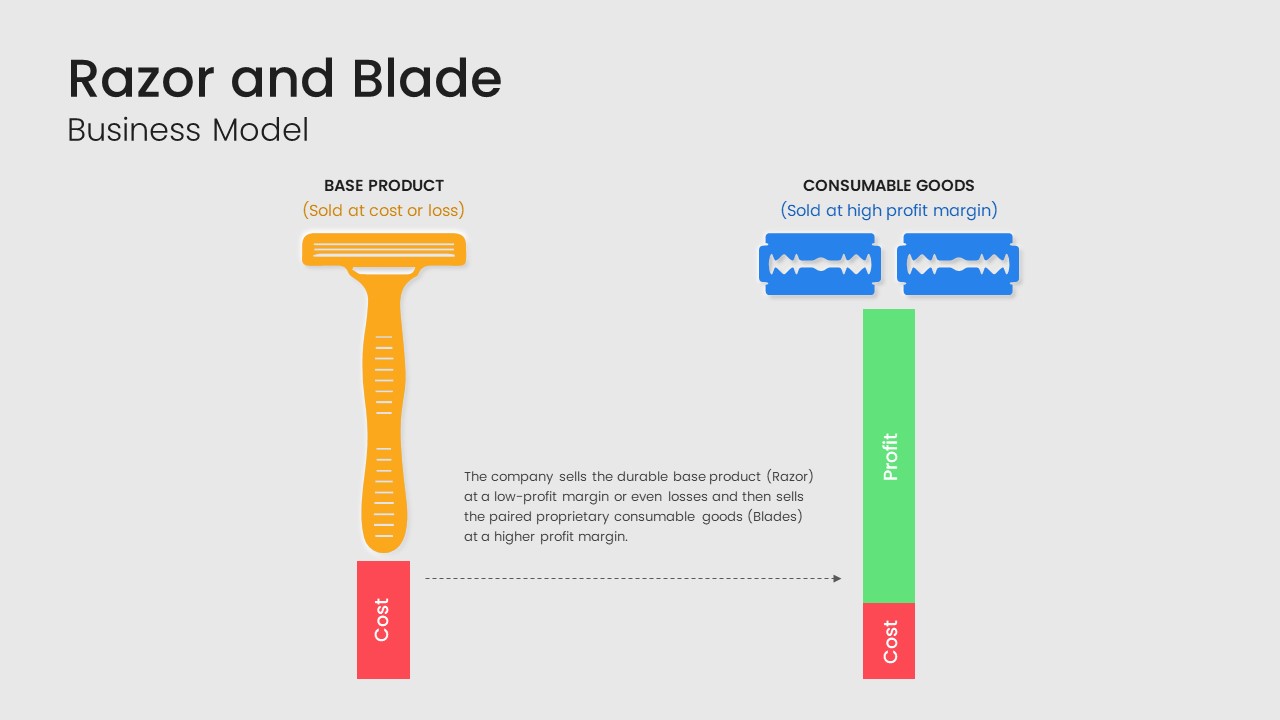
Razor and Blade Business Model Diagram Template for PowerPoint & Google Slides
Business Models
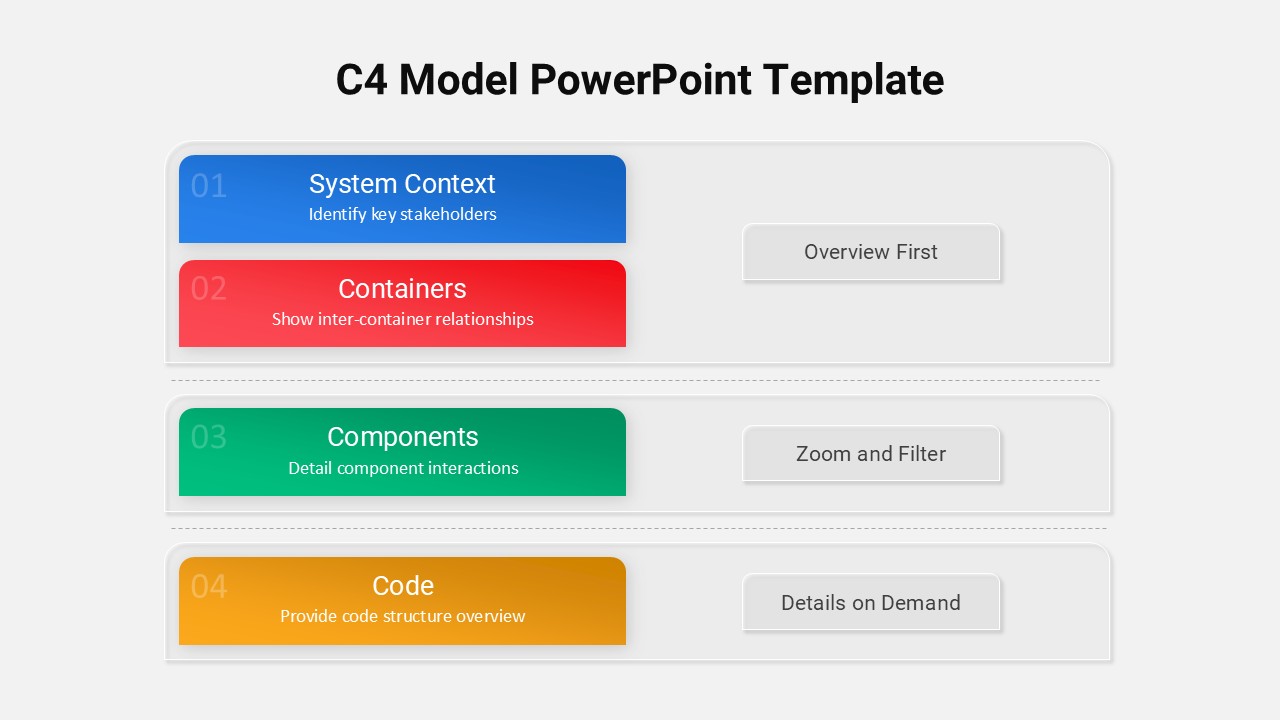
C4 Model Architecture Overview Template for PowerPoint & Google Slides
Software Development
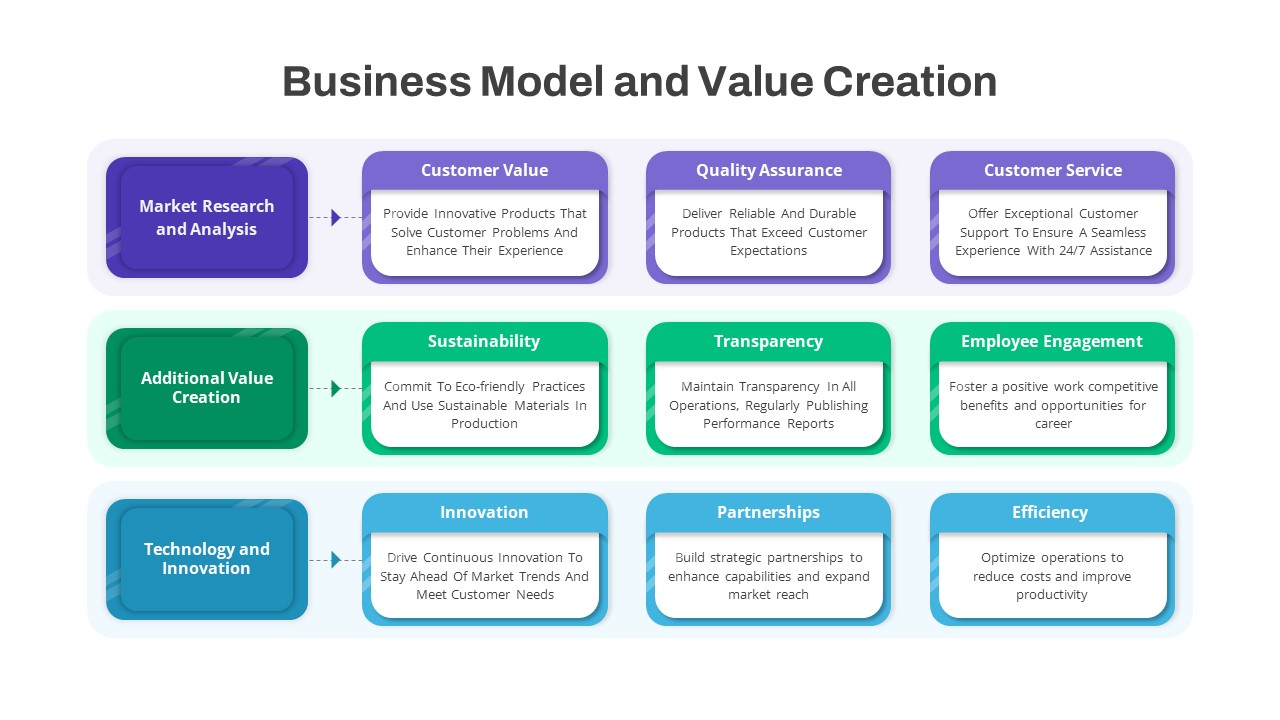
Business Model & Value Creation Template for PowerPoint & Google Slides
Process
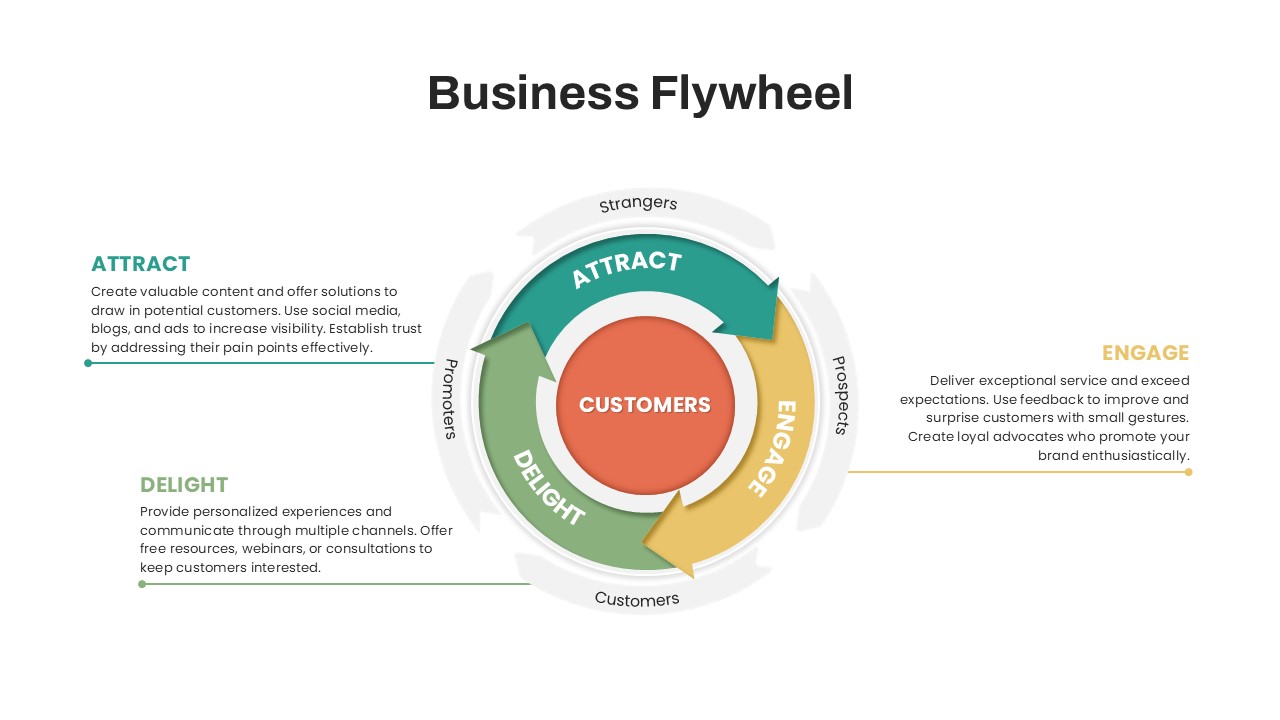
Business Flywheel Lifecycle Model Template for PowerPoint & Google Slides
Circular
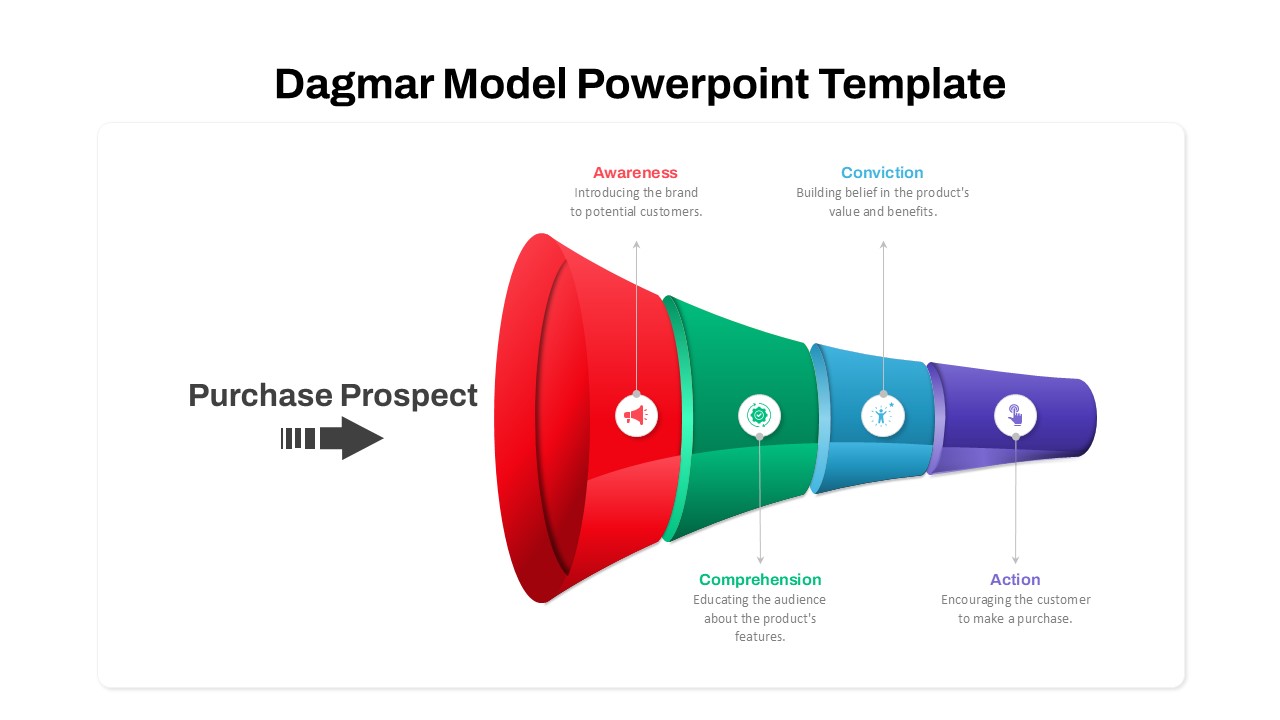
Dagmar Model Marketing Funnel Diagram Template for PowerPoint & Google Slides
Funnel
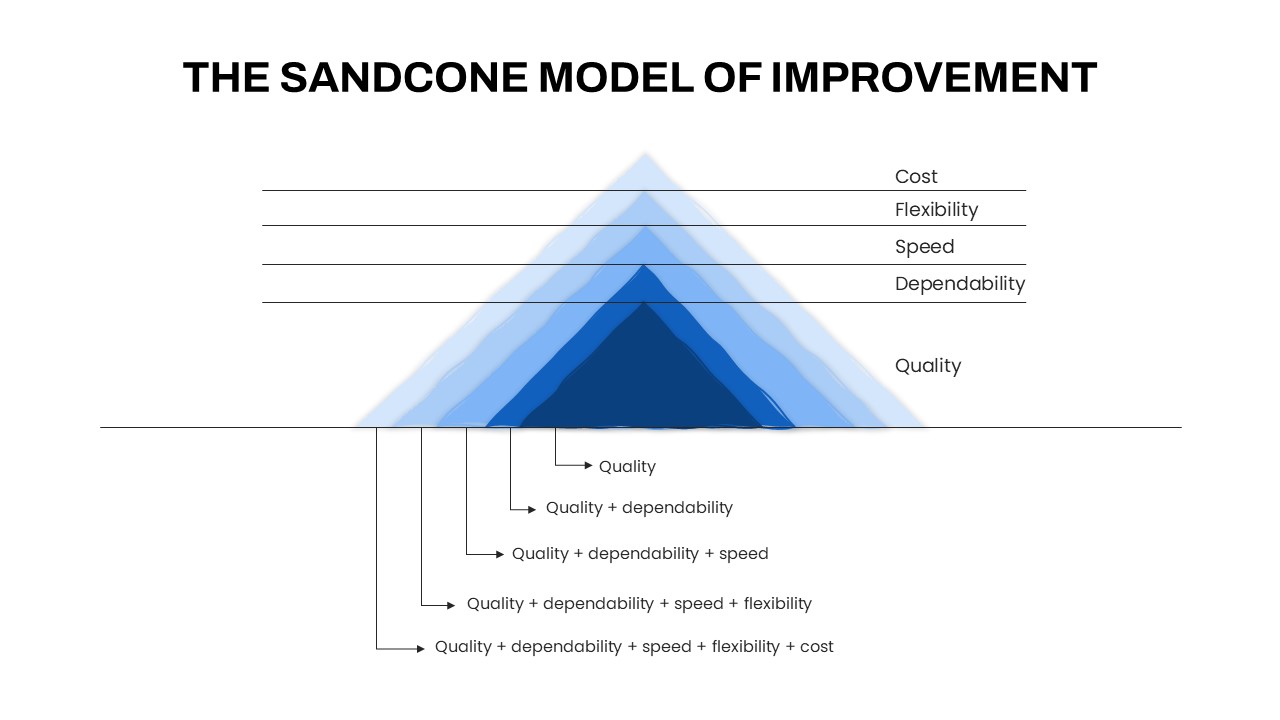
Sandcone Model of Improvement Diagram Template for PowerPoint & Google Slides
Pyramid
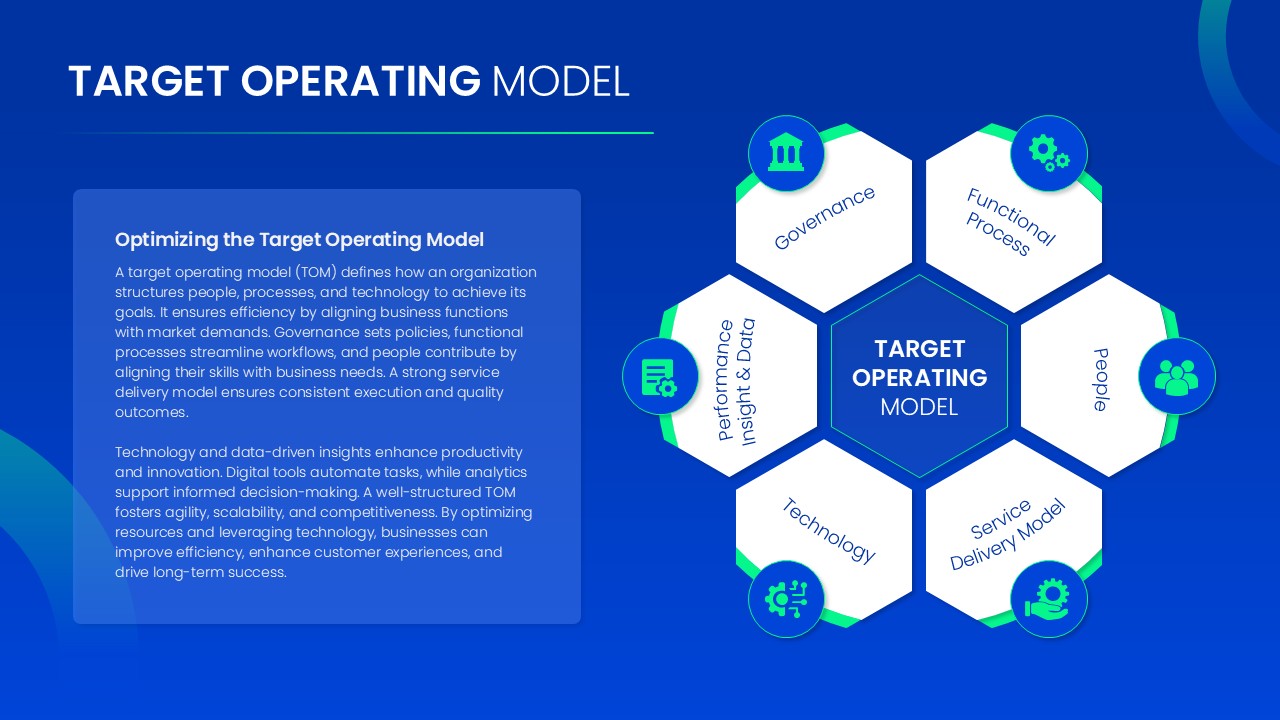
Target Operating Model Diagram Template for PowerPoint & Google Slides
Business Strategy
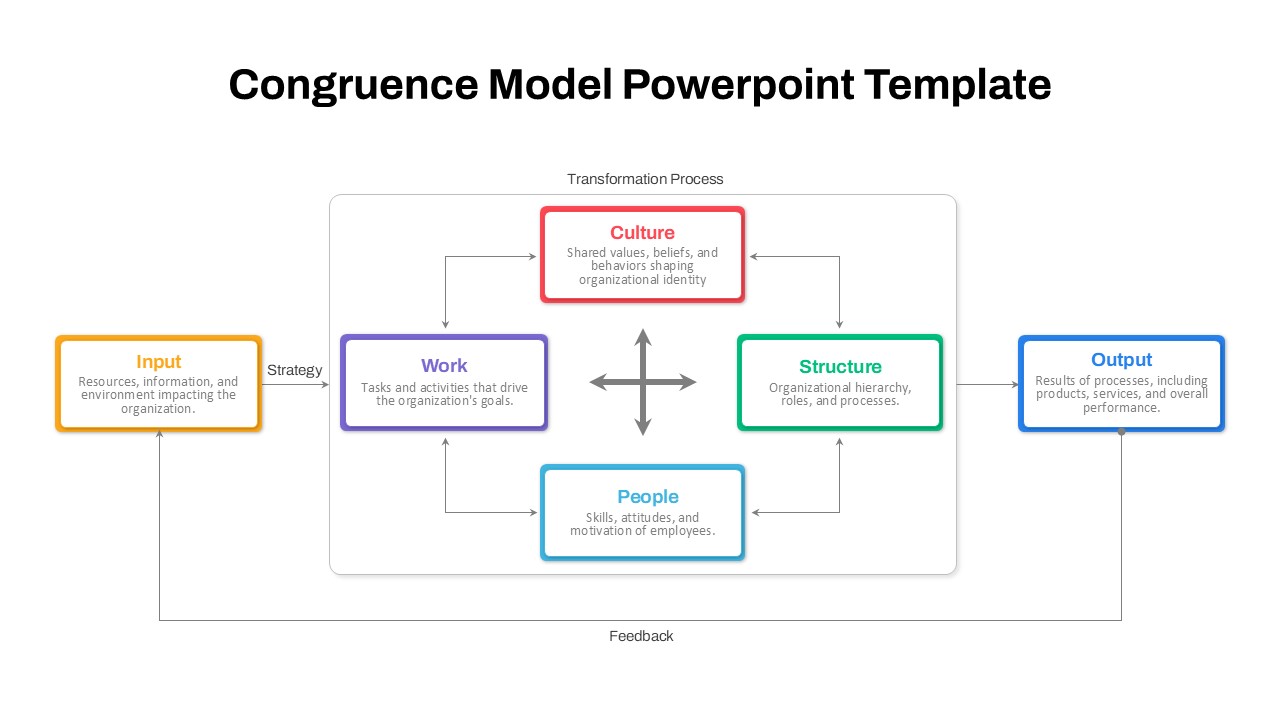
Organizational Congruence Model Diagram Template for PowerPoint & Google Slides
Process
Seeds Growth Cycle Business Model Template for PowerPoint & Google Slides
Process
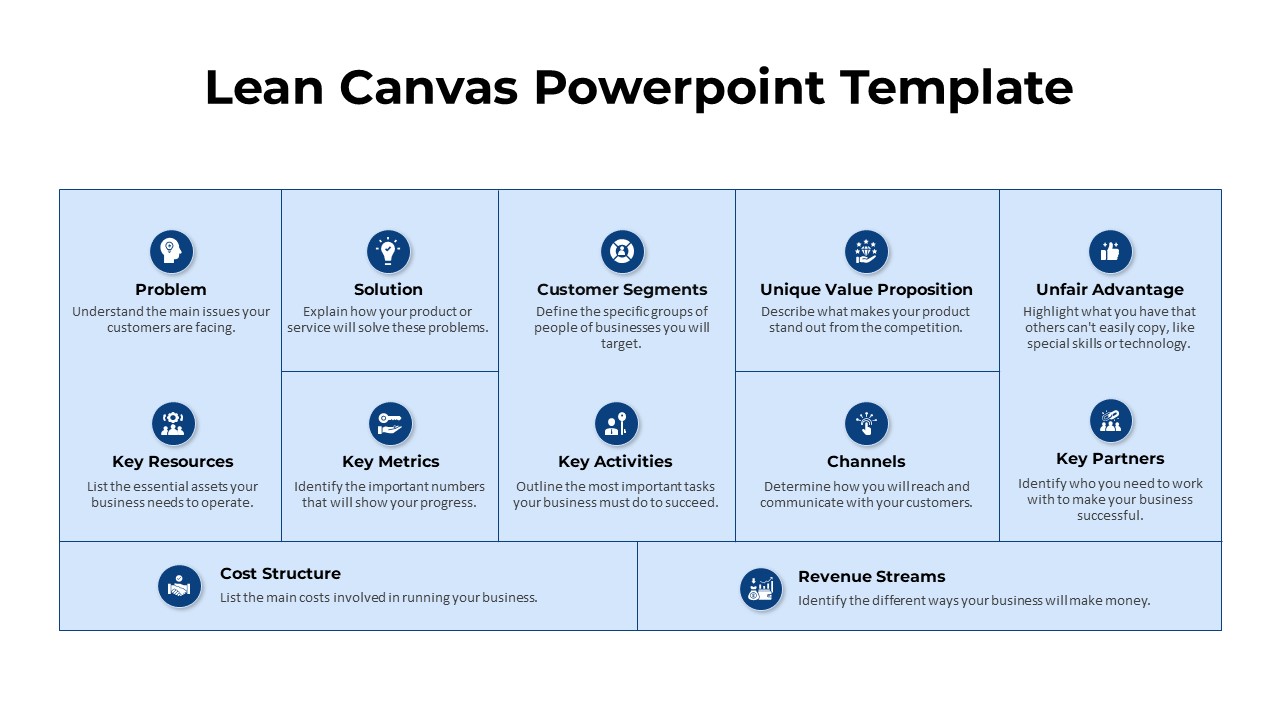
Strategic Lean Canvas Business Model Template for PowerPoint & Google Slides
Business Models
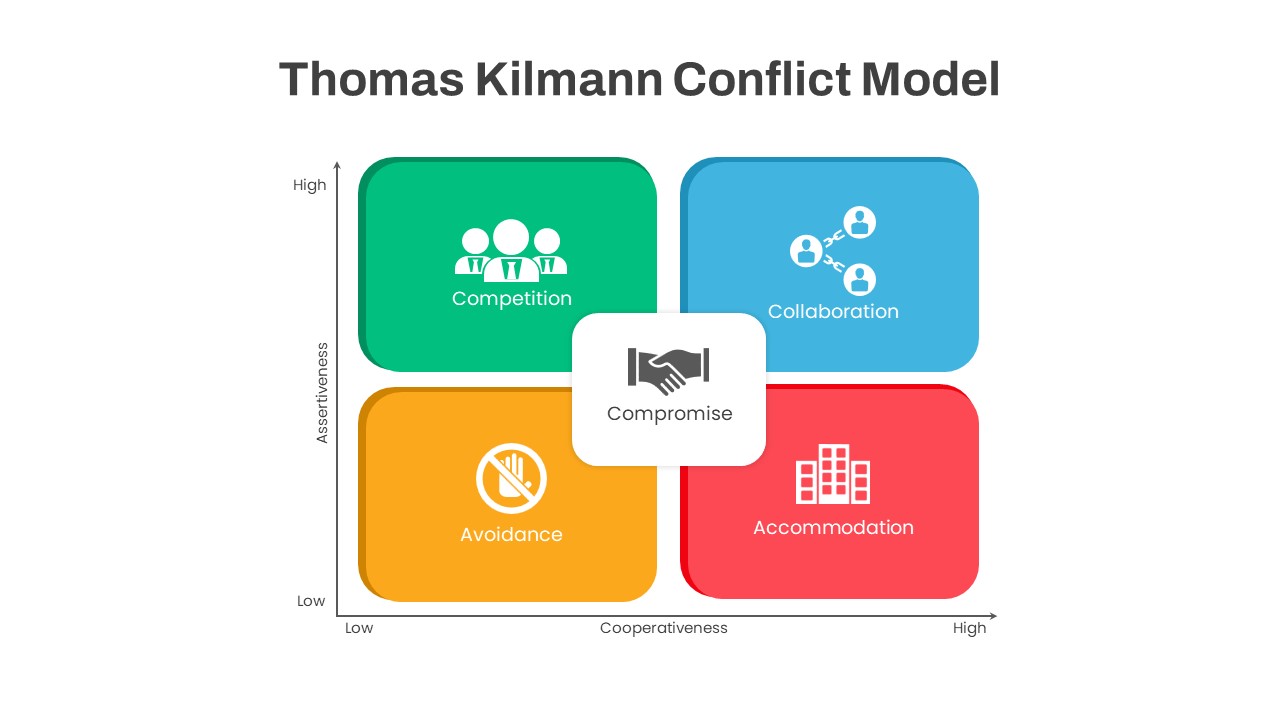
Thomas Kilmann Conflict Model Diagram Template for PowerPoint & Google Slides
Leadership
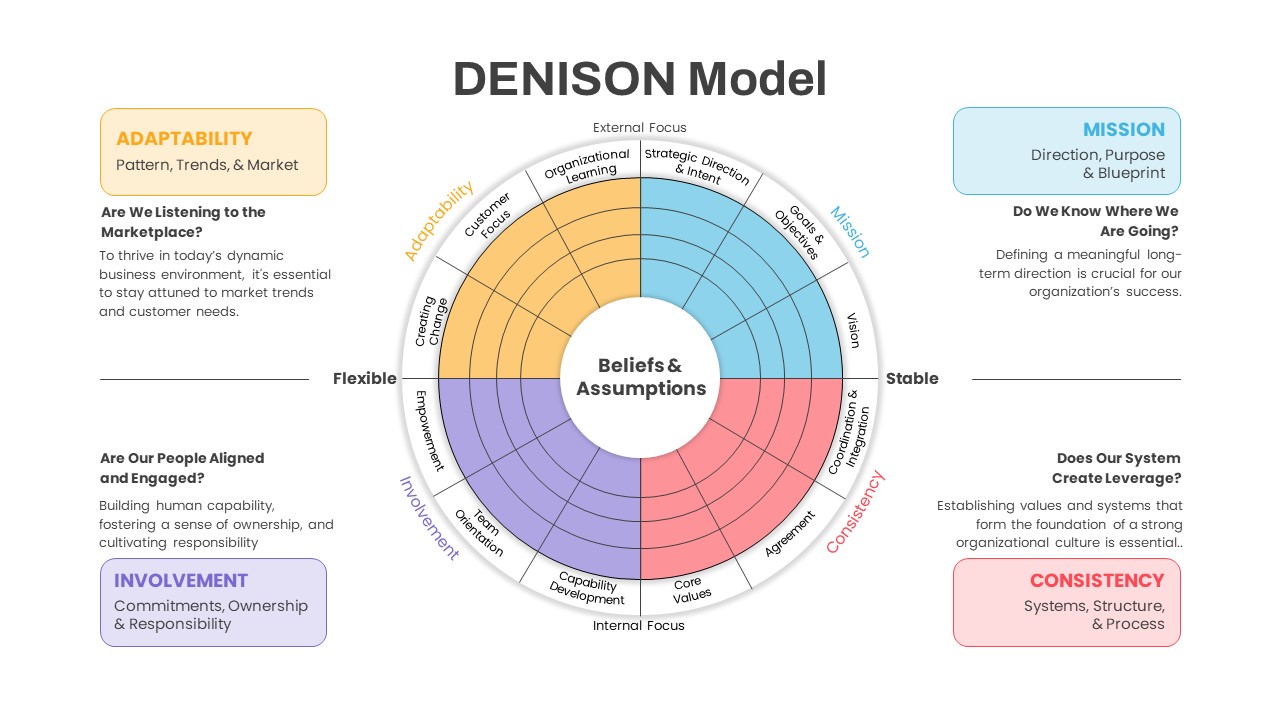
Denison Culture Model Wheel template for PowerPoint & Google Slides
Leadership
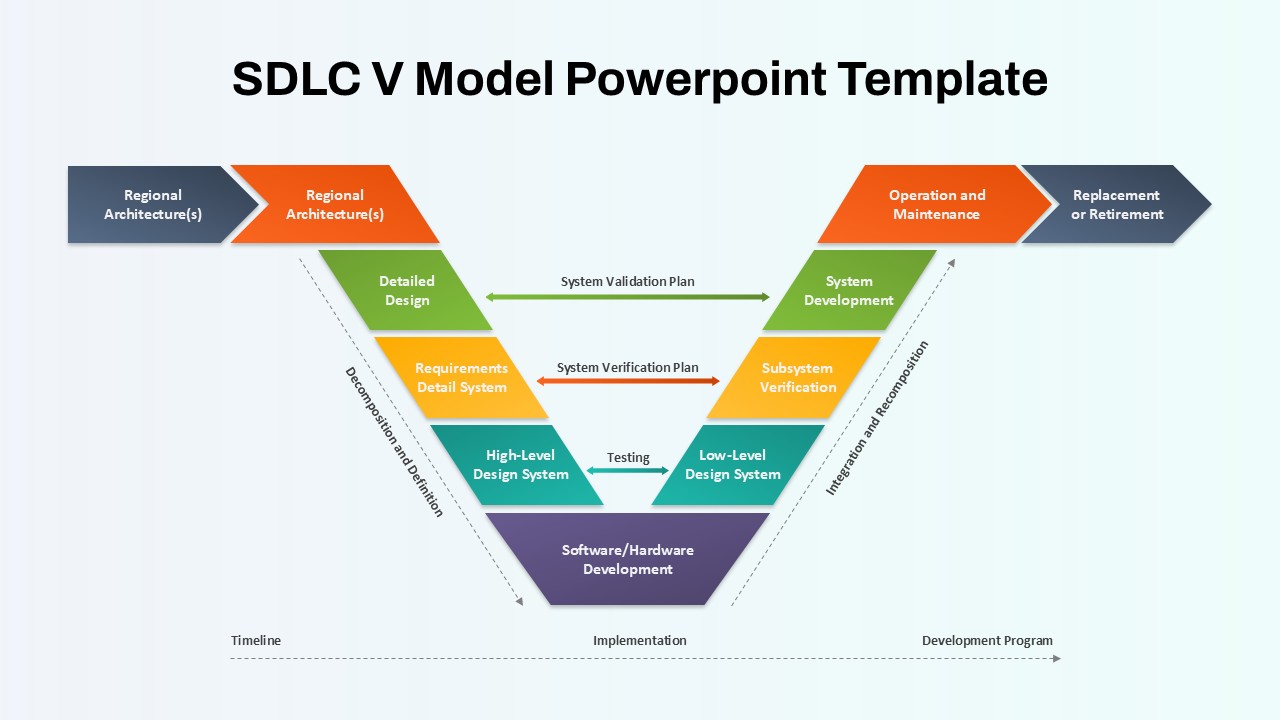
SDLC V Model Lifecycle Diagram Template for PowerPoint & Google Slides
Process
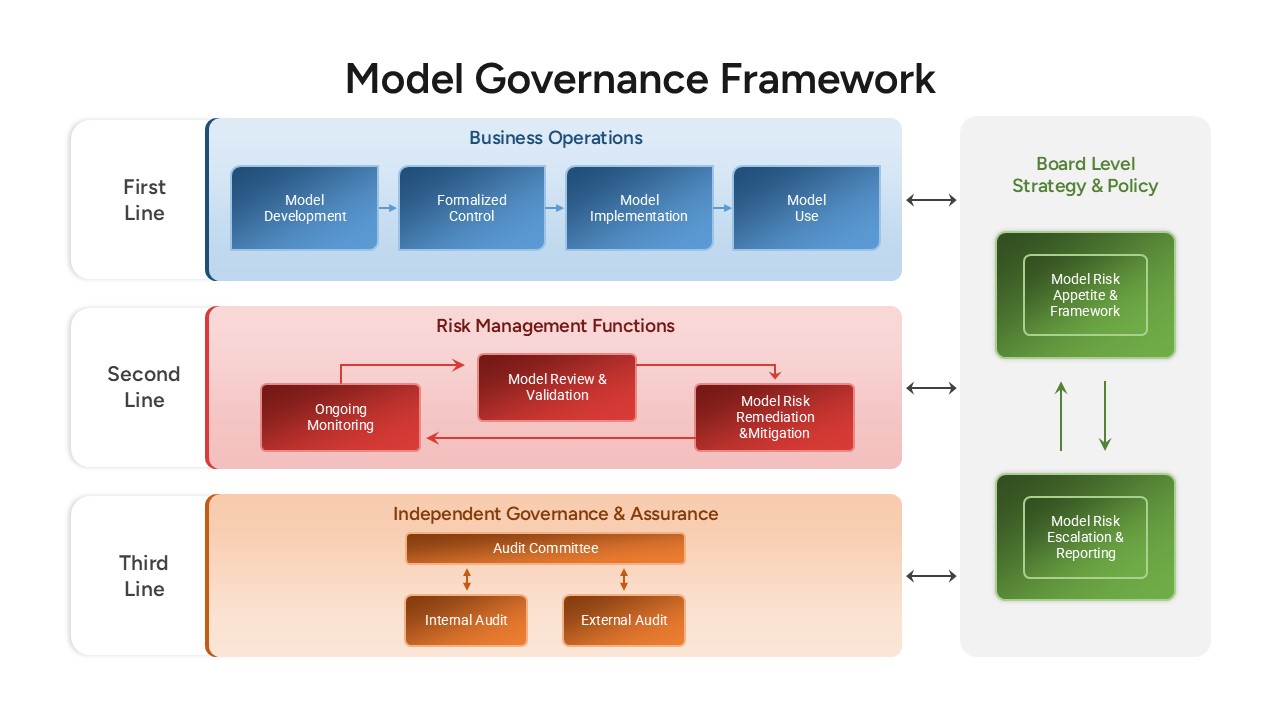
Model Governance Framework Template for PowerPoint & Google Slides
Risk Management
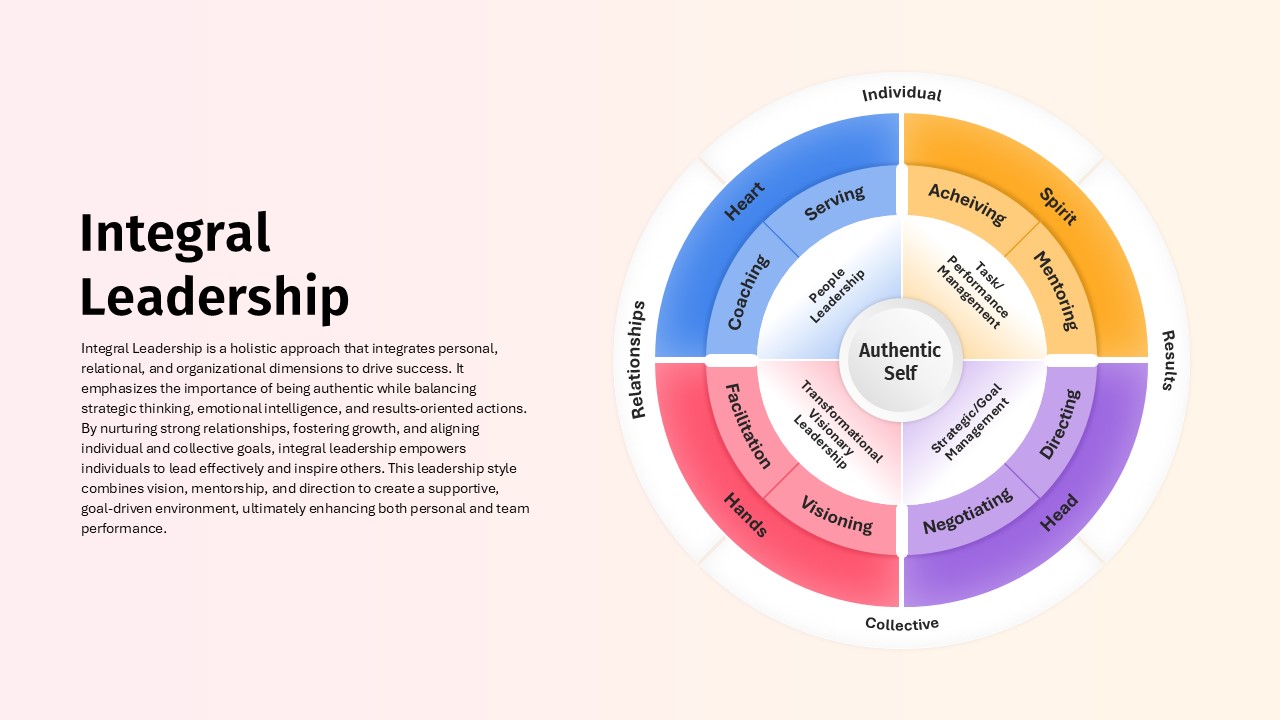
Integral Leadership Model Overview template for PowerPoint & Google Slides
Leadership
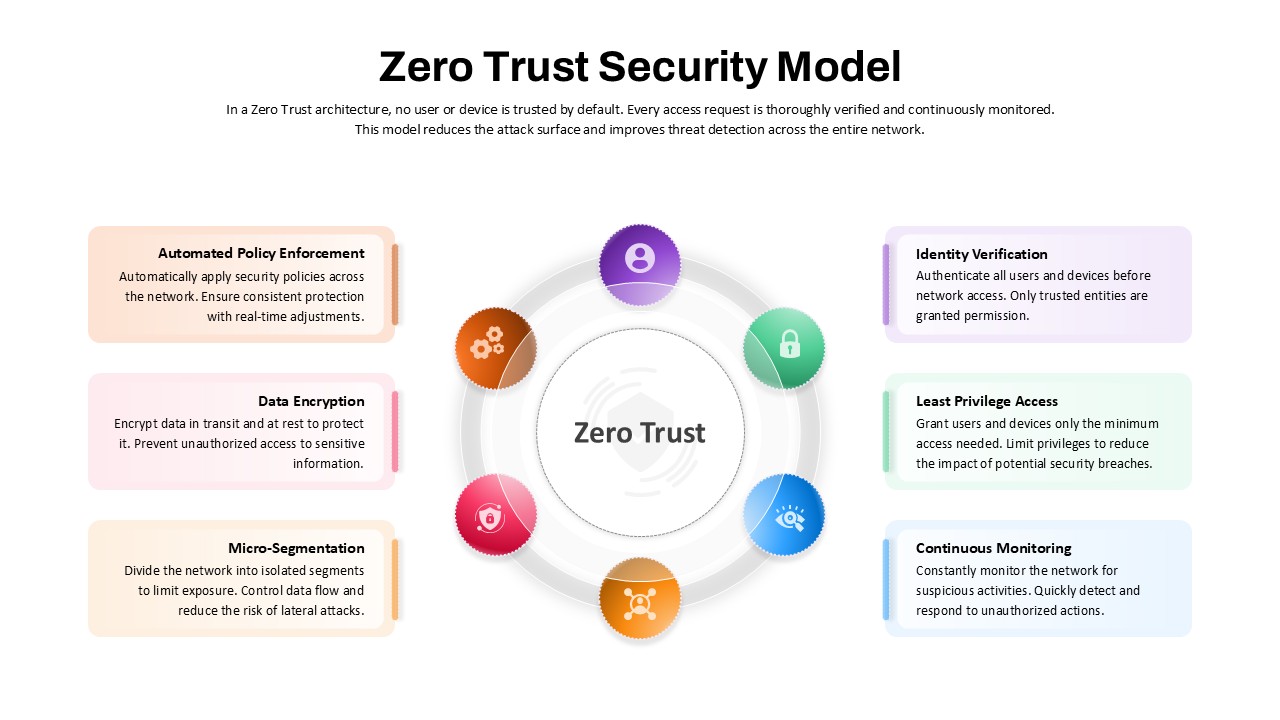
Zero Trust Security Model Overview template for PowerPoint & Google Slides
Risk Management
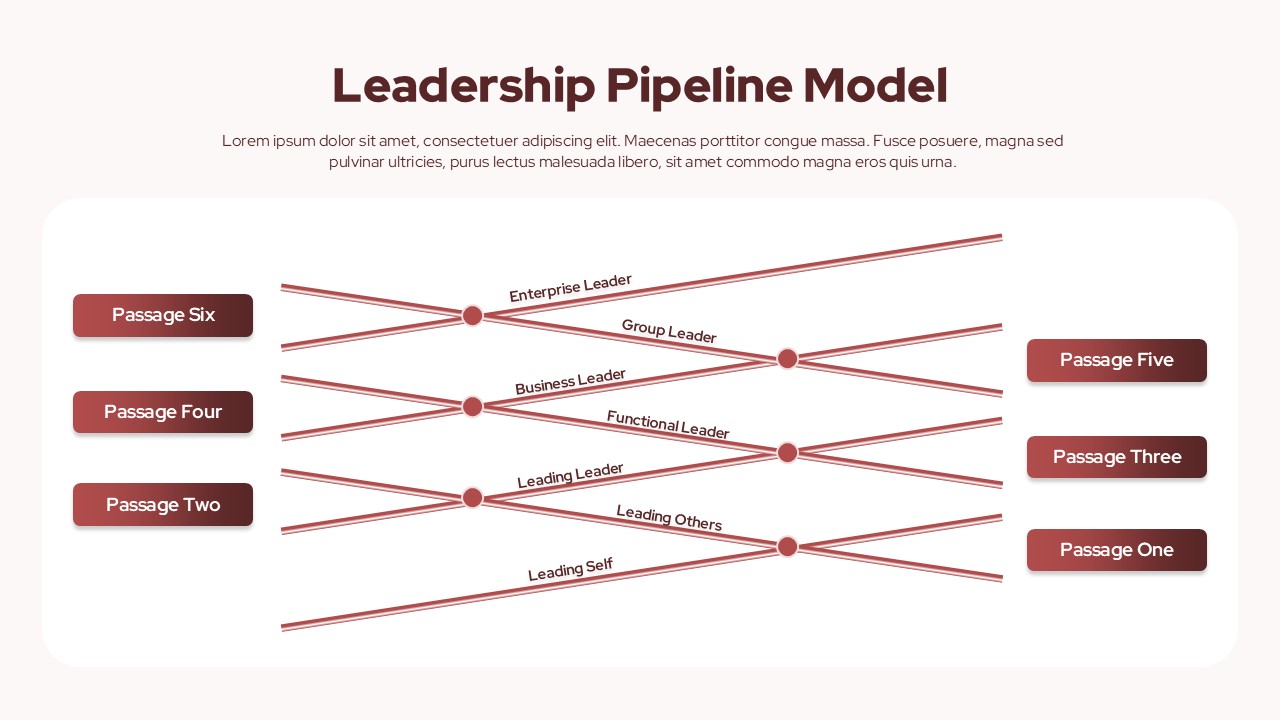
Leadership Pipeline Model Overview template for PowerPoint & Google Slides
Leadership
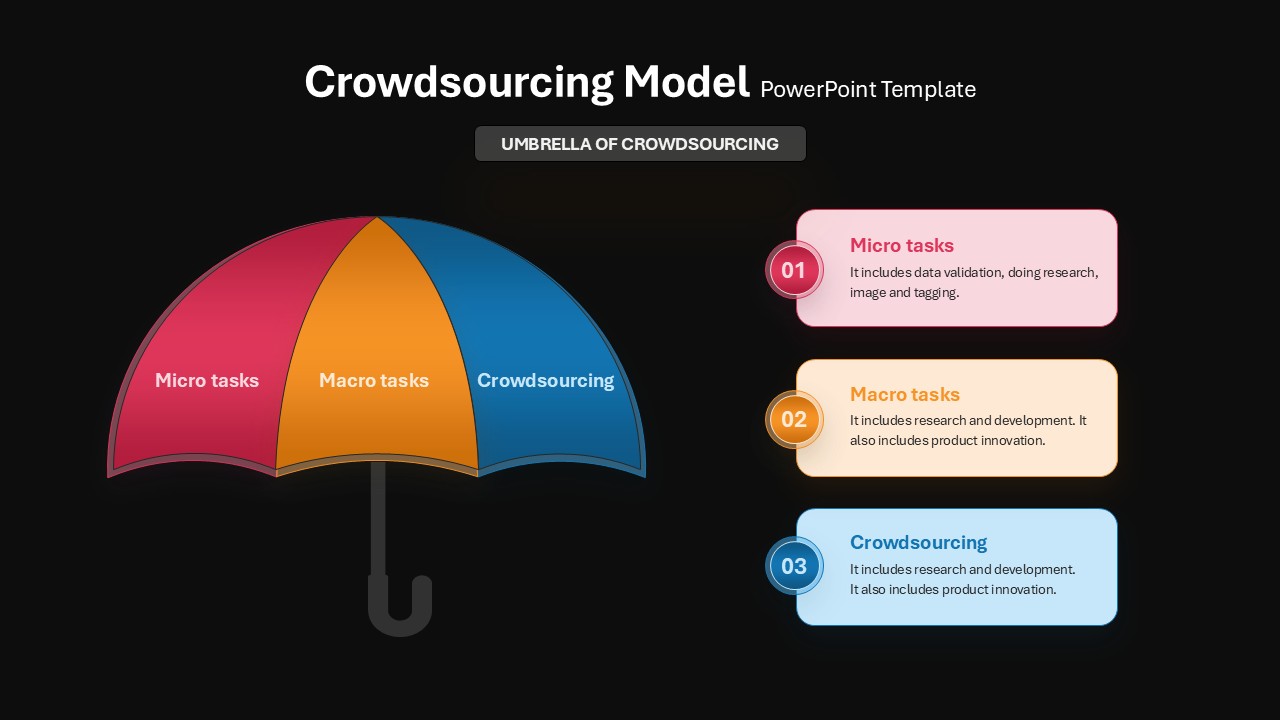
Crowdsourcing Model Umbrella & Process Template for PowerPoint & Google Slides
Infographics
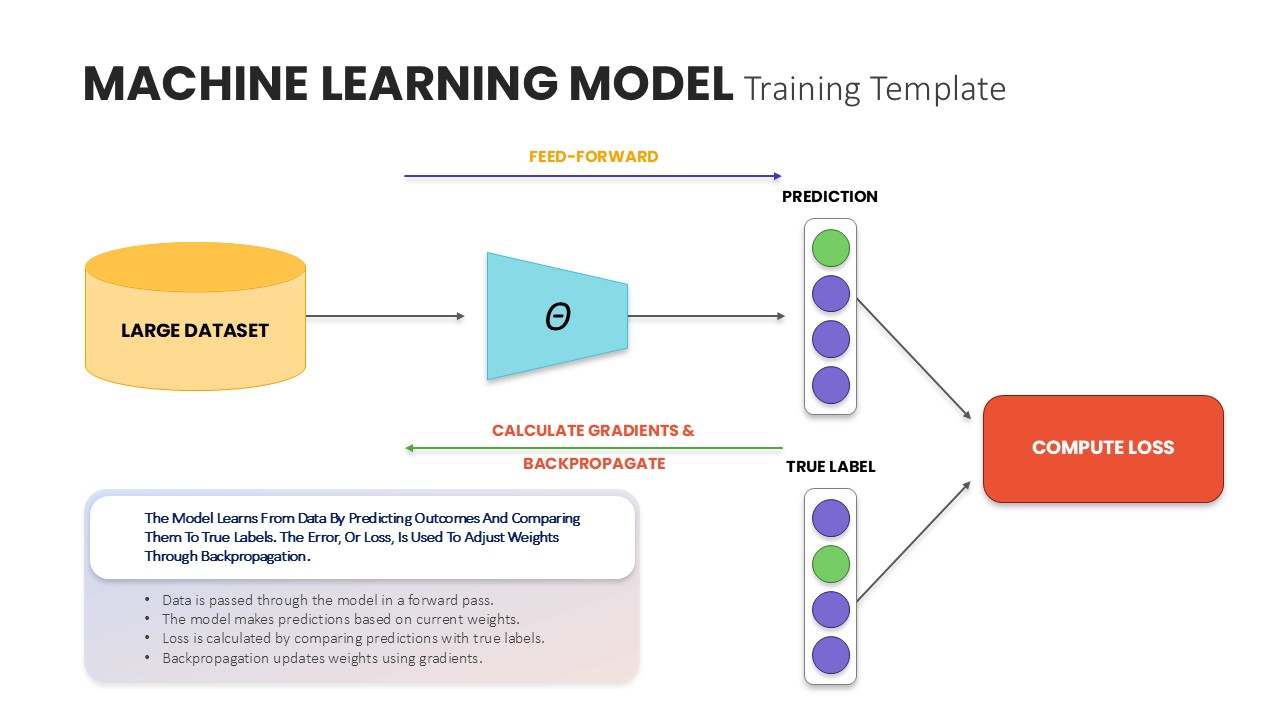
Machine Learning Model Training Template for PowerPoint & Google Slides
Machine Learning
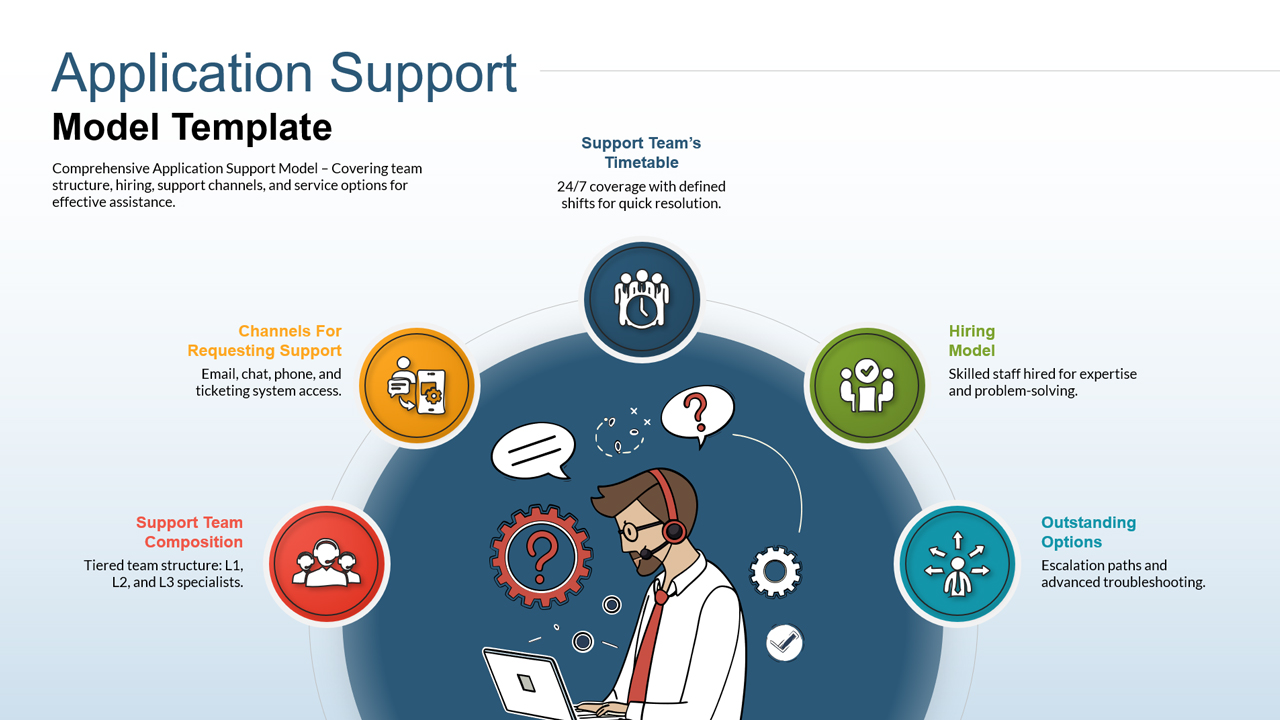
Application Support Operating Model Framework Slide Template for PowerPoint & Google Slides
Information Technology
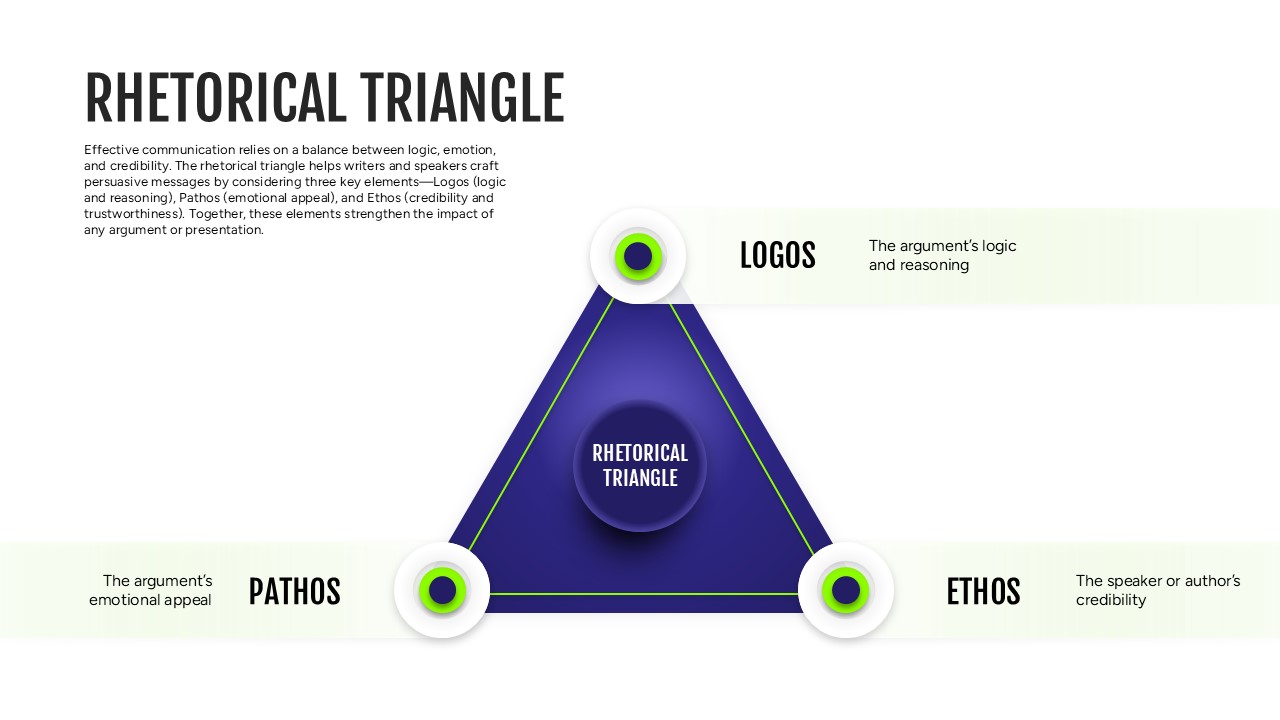
Rhetorical Triangle Model Diagram Template for PowerPoint & Google Slides
Leadership