CAGE Distance Analysis Framework Template for PowerPoint & Google Slides


Description
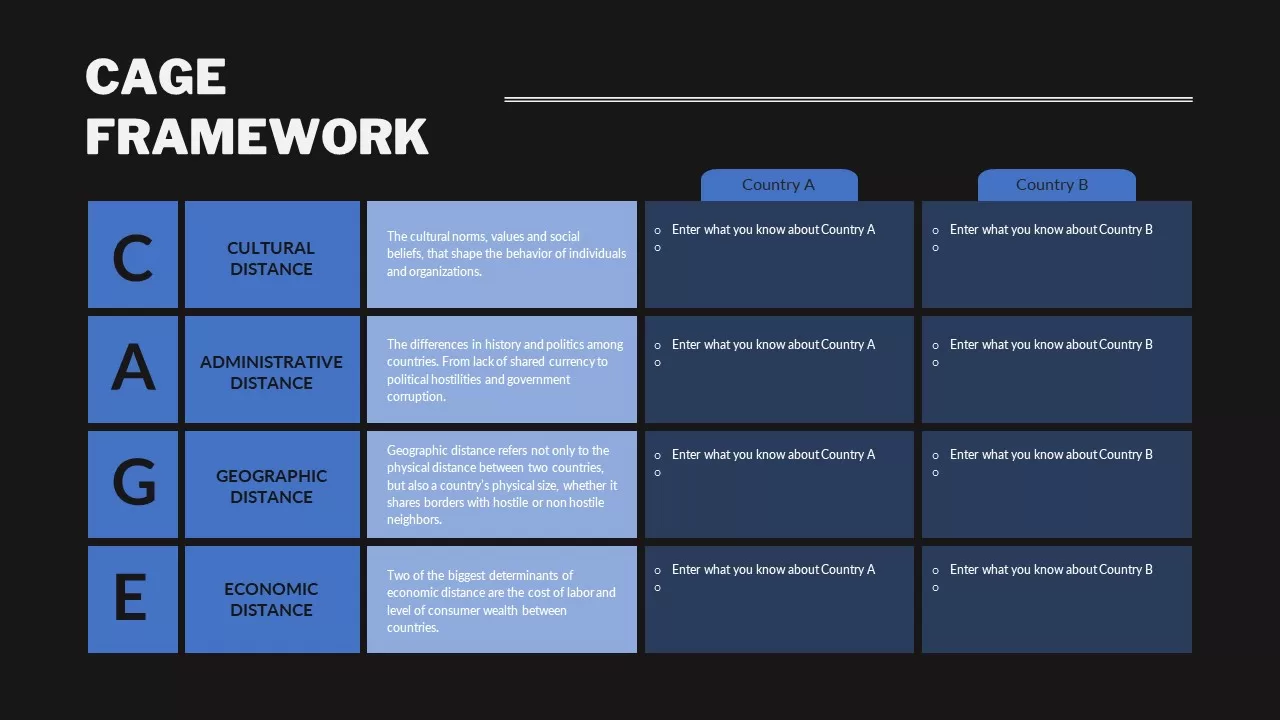
Leverage this CAGE (Cultural, Administrative, Geographic, Economic) Distance Analysis template to systematically compare market entry factors across two countries. The primary slide features a clean four-row grid beginning with oversized “C, A, G, E” labels alongside bold headings for each distance dimension. Adjacent content panels include concise definitions—illustrating cultural norms, political and legal variations, physical separation, and economic disparities—and paired input boxes for Country A and Country B. The consistent blue-tone palette and subtle divider lines enhance readability, while vector icons and placeholder bullets guide rapid data entry without manual alignment work.
Built on master slides for both PowerPoint and Google Slides, this template ensures you can adjust row counts, swap placeholder text, or recolor elements in seconds. Each content box is fully vector-editable: change header backgrounds, modify text styles, or replace the accompanying tabs to suit brand guidelines. The design accommodates light-theme default layouts as well as optional dark-theme variants, maintaining visual contrast in boardroom or virtual presentation environments. With uniform typography, grid alignment, and intelligent spacing baked in, you avoid formatting inconsistencies when duplicating slides or importing into larger decks.
Ideal for international business reviews, strategic planning sessions, and cross-border partnership pitches, the CAGE Distance Analysis template drives structured discussions around market similarities and gaps. Use it to benchmark emerging economies, evaluate supply-chain feasibility, assess competitive landscapes, or shape localization strategies. The modular grid also doubles as a high-level risk matrix—relabel rows to reflect legal, financial, operational, or social variables. Simply duplicate the slide to layer successive country comparisons or integrate into a broader market-entry roadmap. By distilling complex distance factors into a concise, repeatable format, this template streamlines stakeholder alignment and accelerates data-driven decision-making.
Who is it for
International business strategists, market-entry teams, and global expansion managers will leverage this template to compare cross-border distances. Consultants, trade analysts, and investment teams benefit from its structured framework in client reports.
Other Uses
Beyond market entry, repurpose the grid as a multi-factor risk assessment matrix, compliance gap analysis, or cross-departmental process comparison. Add rows for additional criteria such as technological readiness or environmental factors.
Login to download this file

Item ID
SB02442
Related Templates

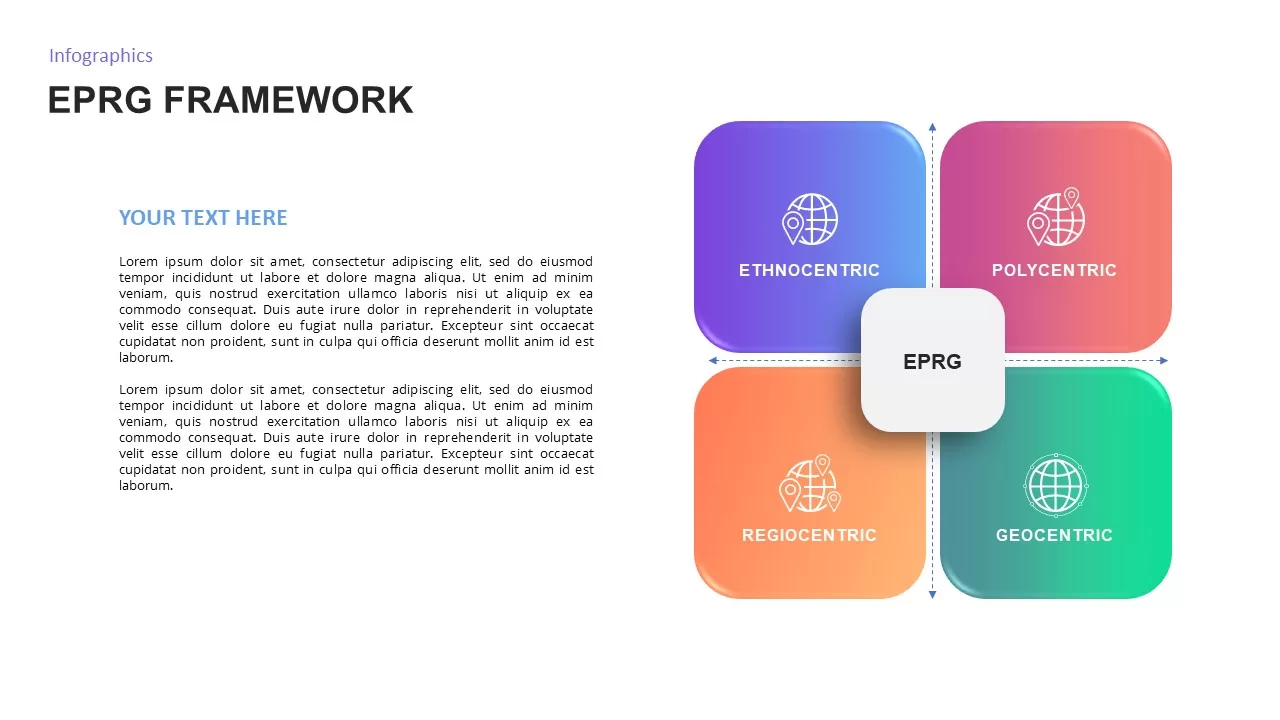
EPRG Framework Analysis template for PowerPoint & Google Slides
Business Strategy
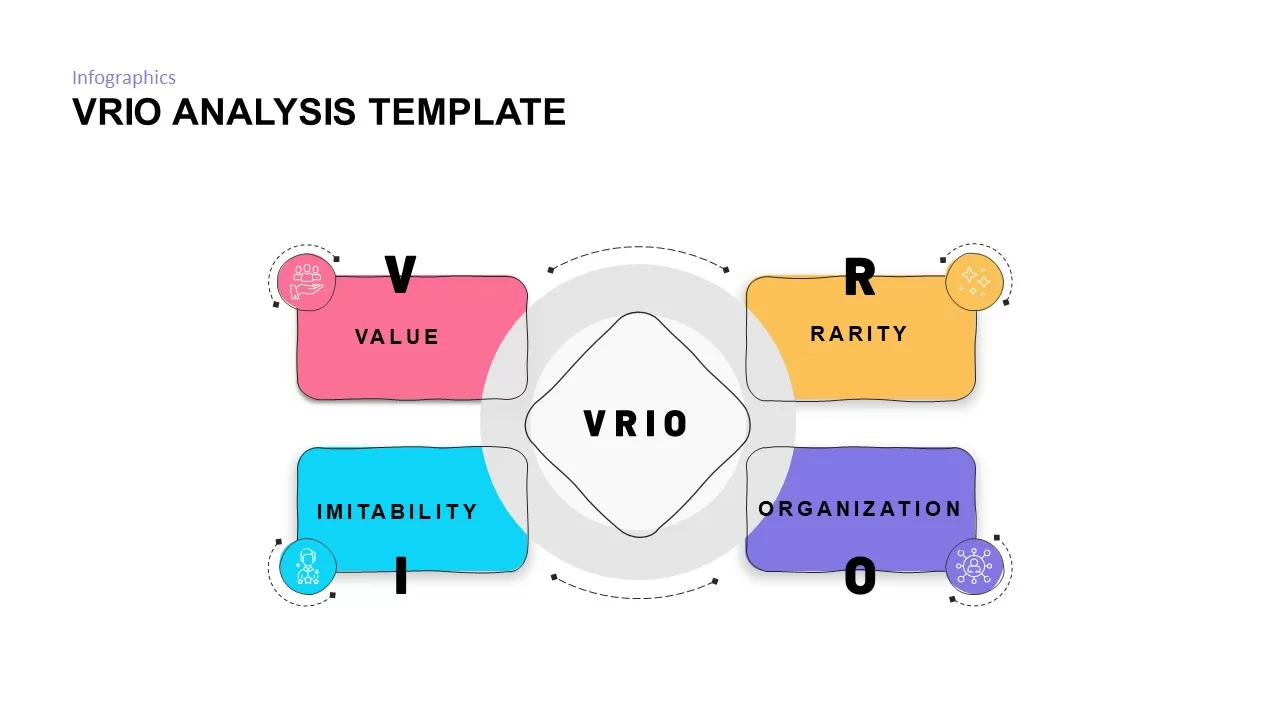
VRIO Analysis Framework template for PowerPoint & Google Slides
Business Strategy
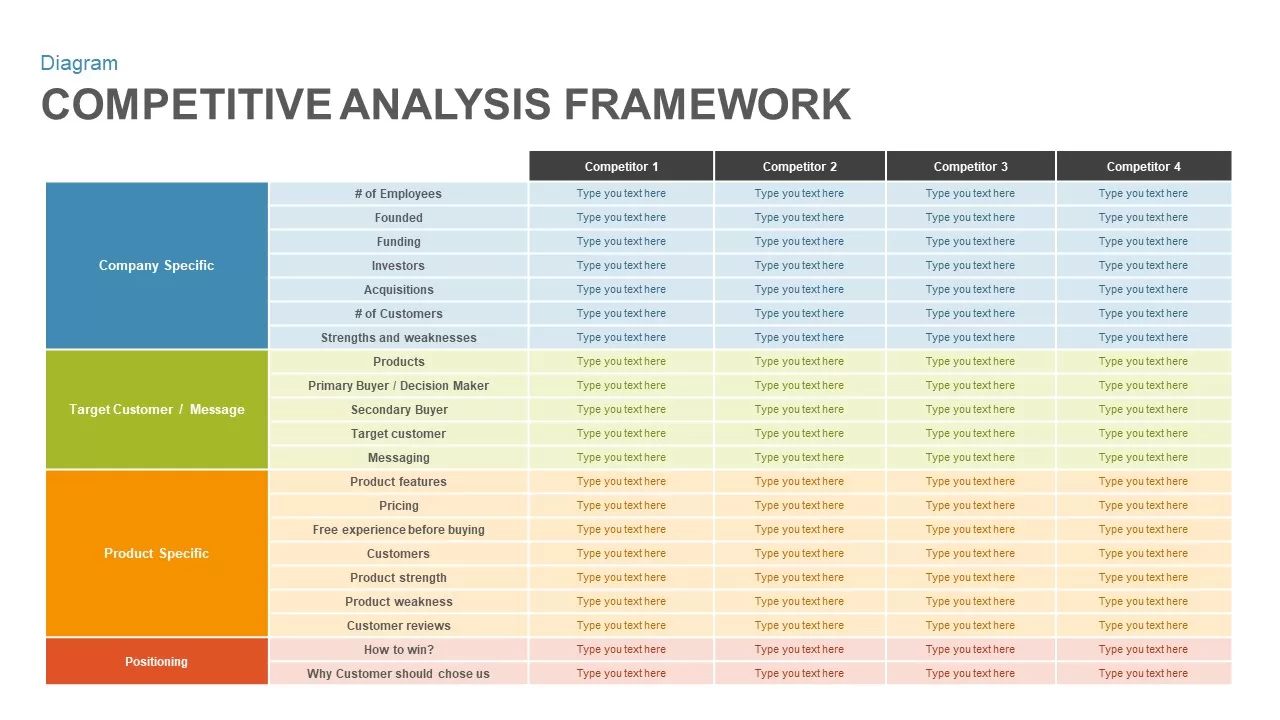
Competitive Analysis Framework template for PowerPoint & Google Slides
Business Report
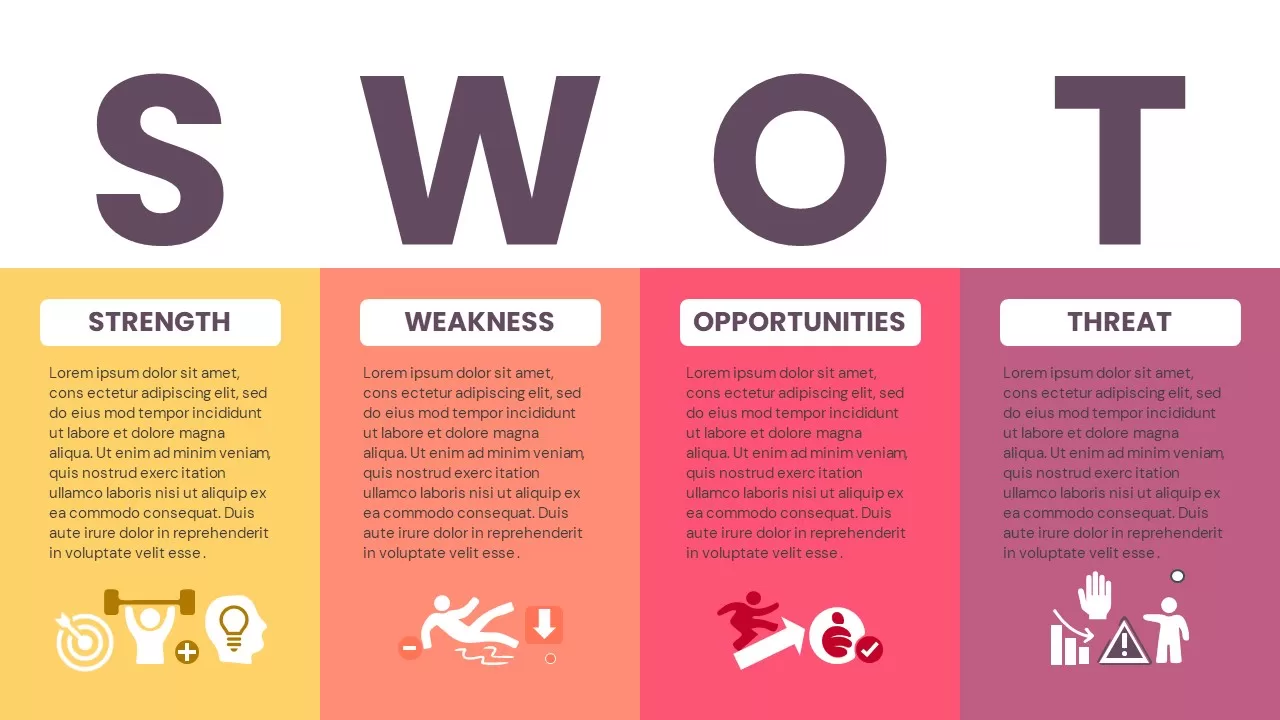
SWOT Analysis Framework template for PowerPoint & Google Slides
SWOT
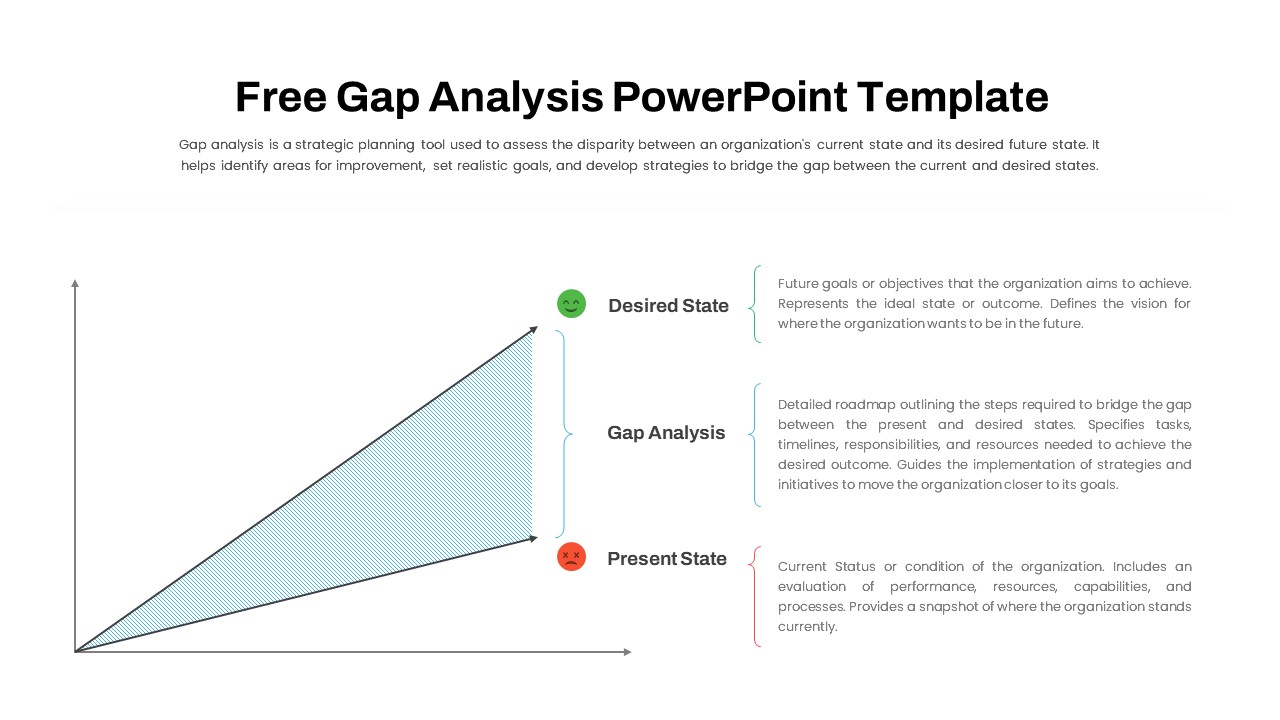
Free Comprehensive Gap Analysis Framework Template for PowerPoint & Google Slides
Opportunities Challenges
Free
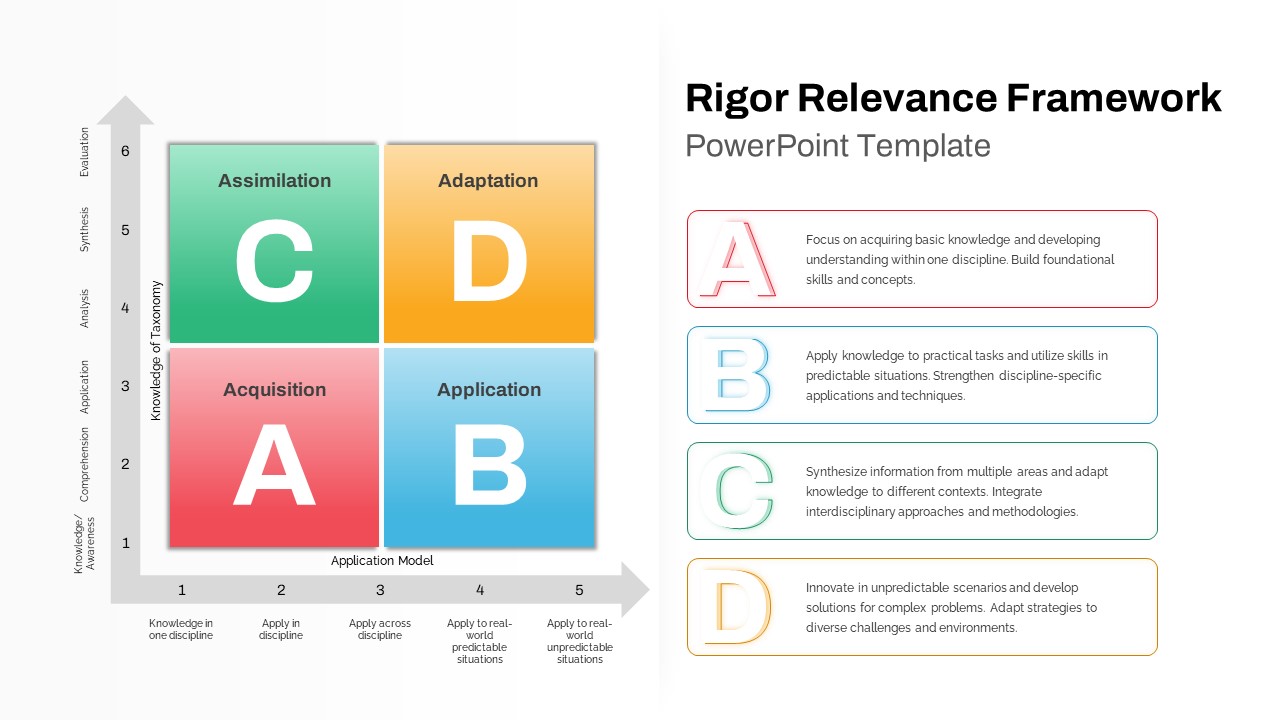
Rigor Relevance Framework Analysis Template for PowerPoint & Google Slides
Comparison
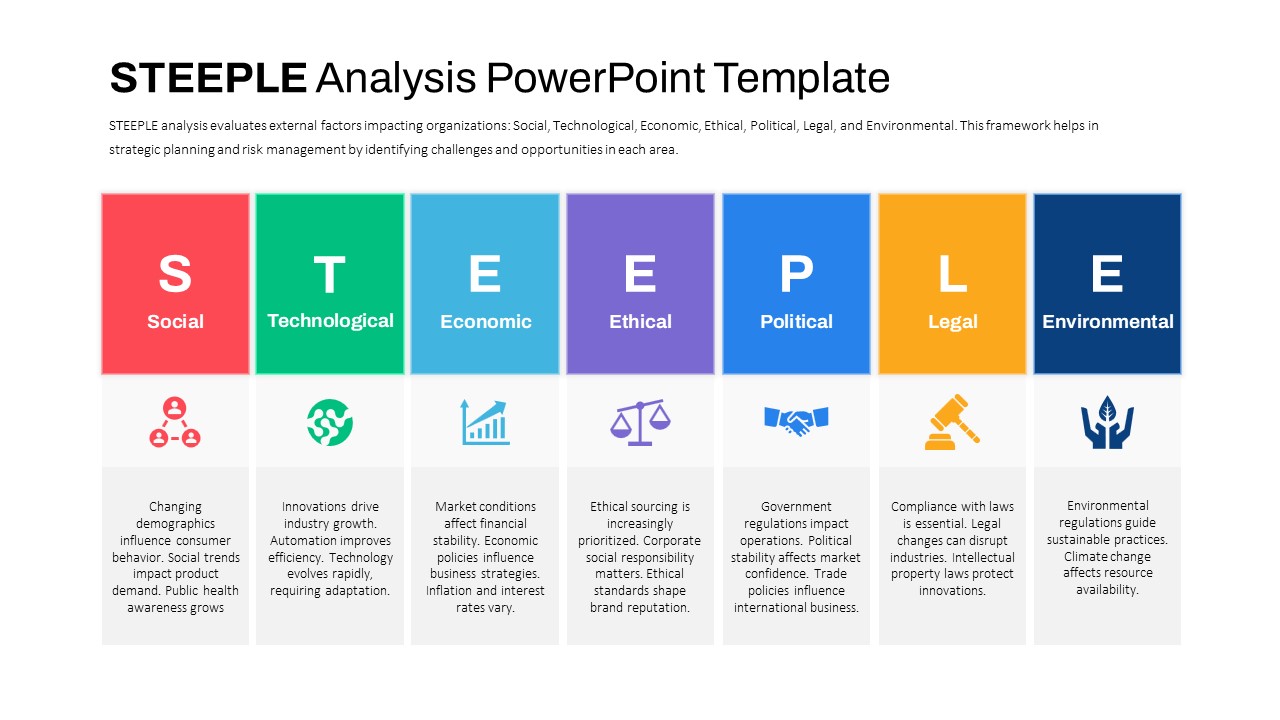
STEEPLE Analysis framework template for PowerPoint & Google Slides
Business Strategy
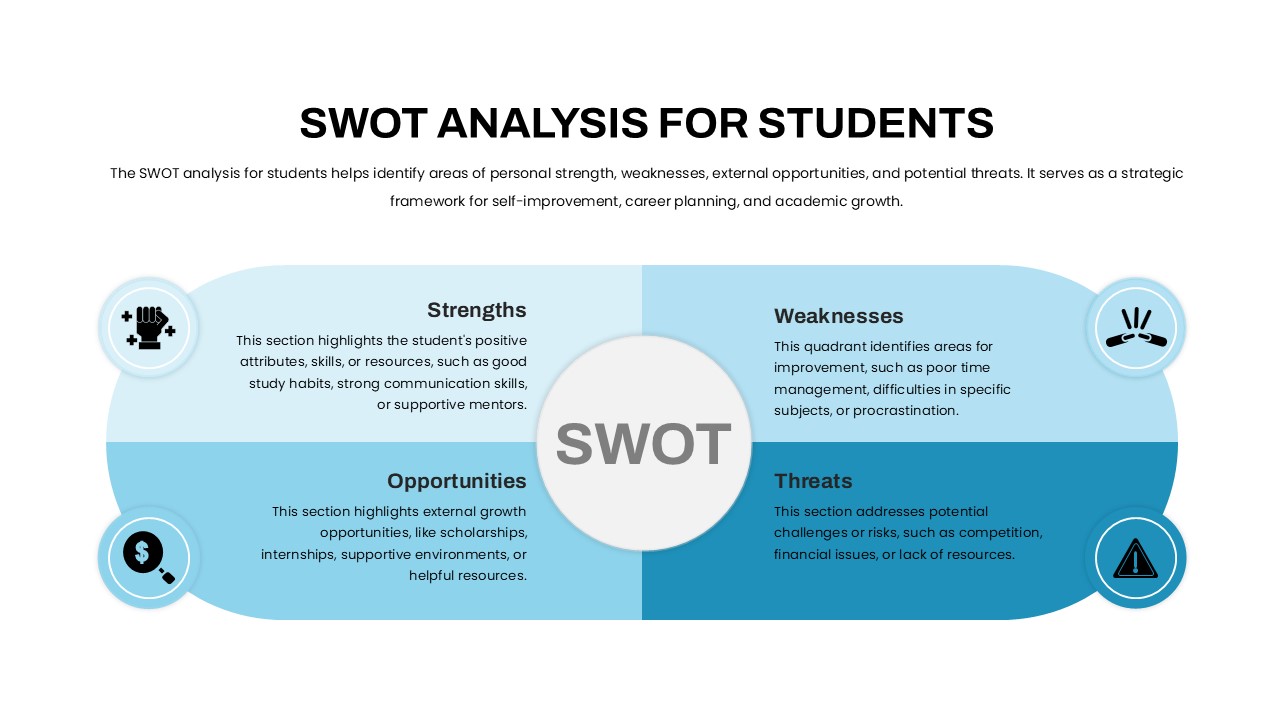
Student SWOT Analysis Framework Template for PowerPoint & Google Slides
SWOT
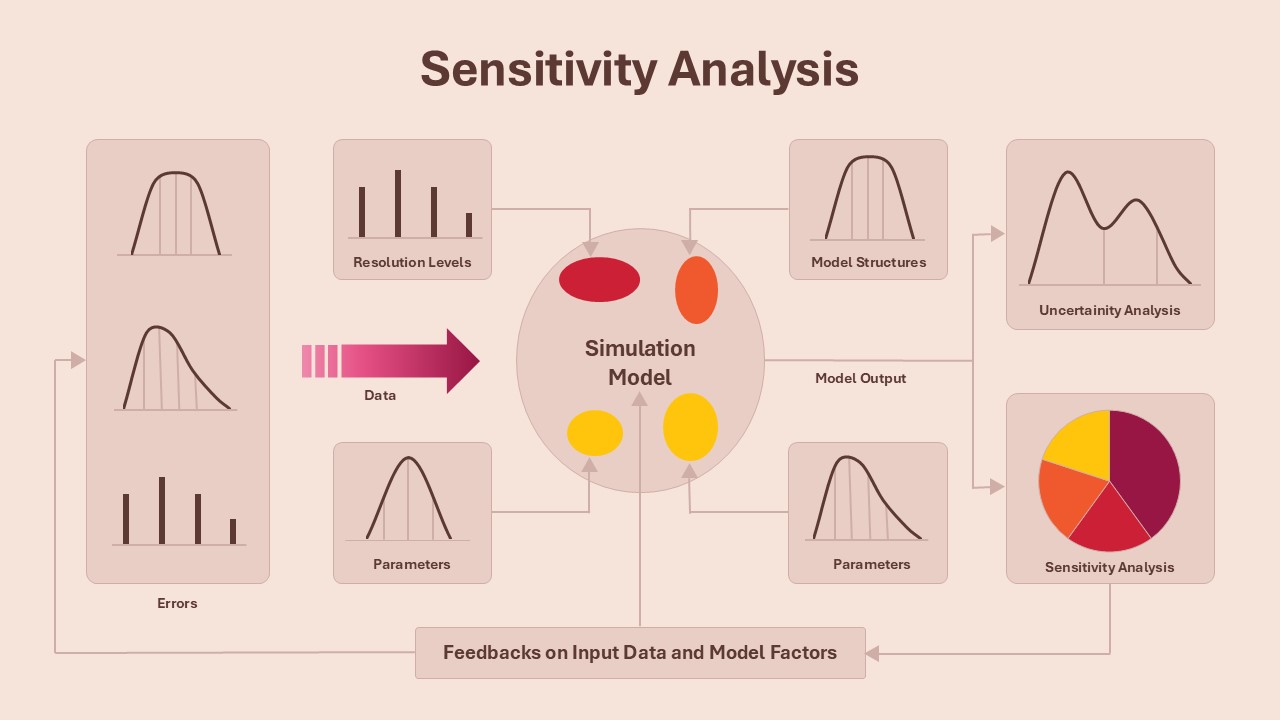
Sensitivity Analysis Framework template for PowerPoint & Google Slides
Business Strategy
Financial Gap Analysis Framework Template for PowerPoint & Google Slides
Finance
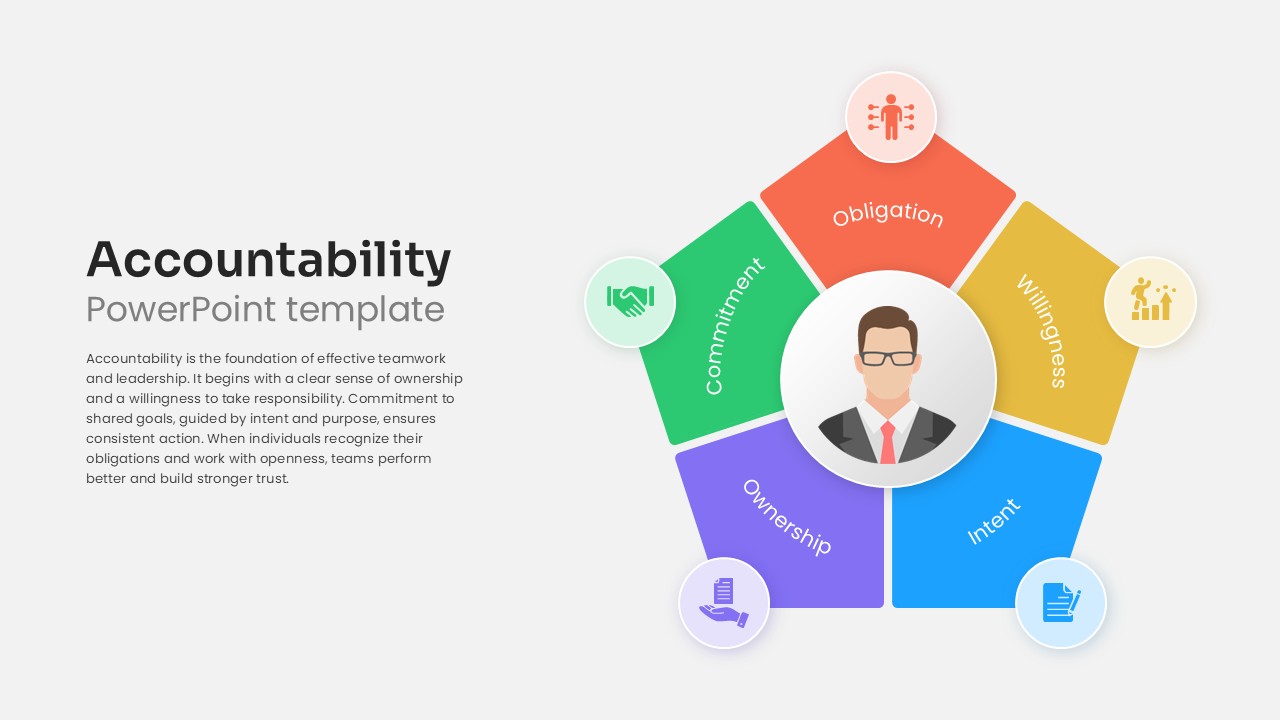
Accountability Framework PowerPoint template for PowerPoint & Google Slides
Leadership
Six-Staged Gear Diagram Framework Template for PowerPoint & Google Slides
Process
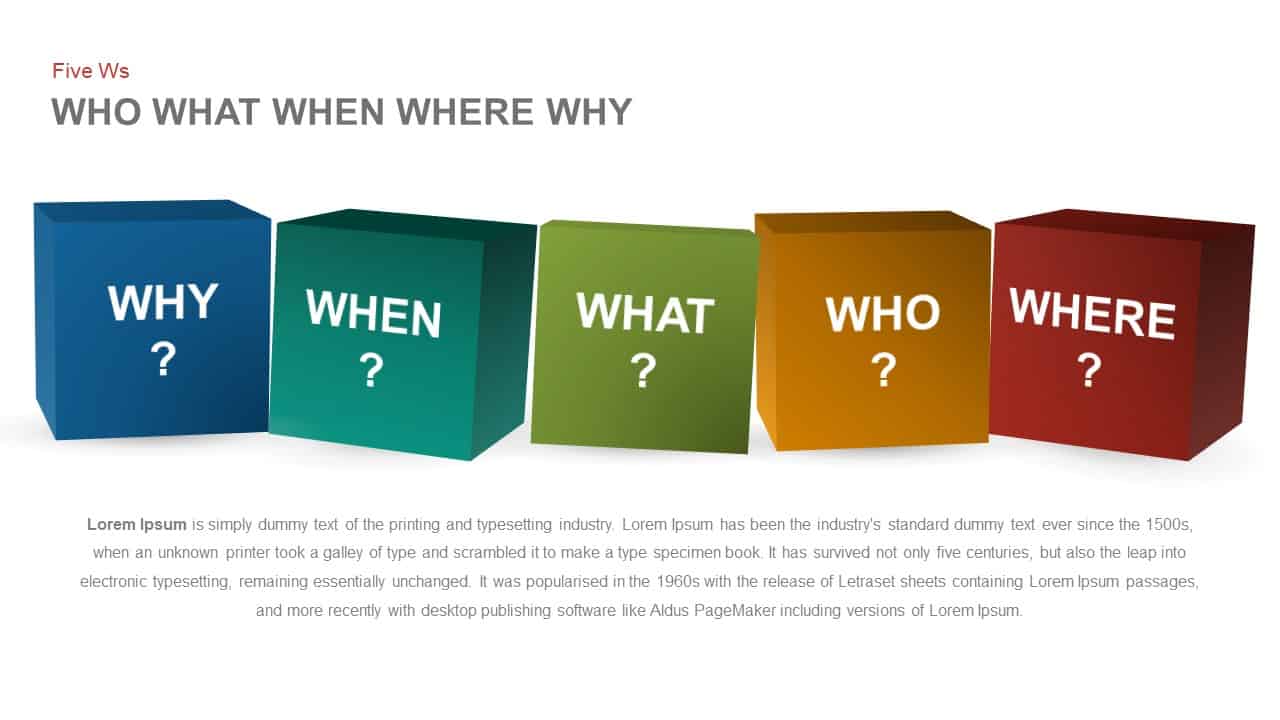
Five Ws Framework Cube Diagram Template for PowerPoint & Google Slides
Comparison
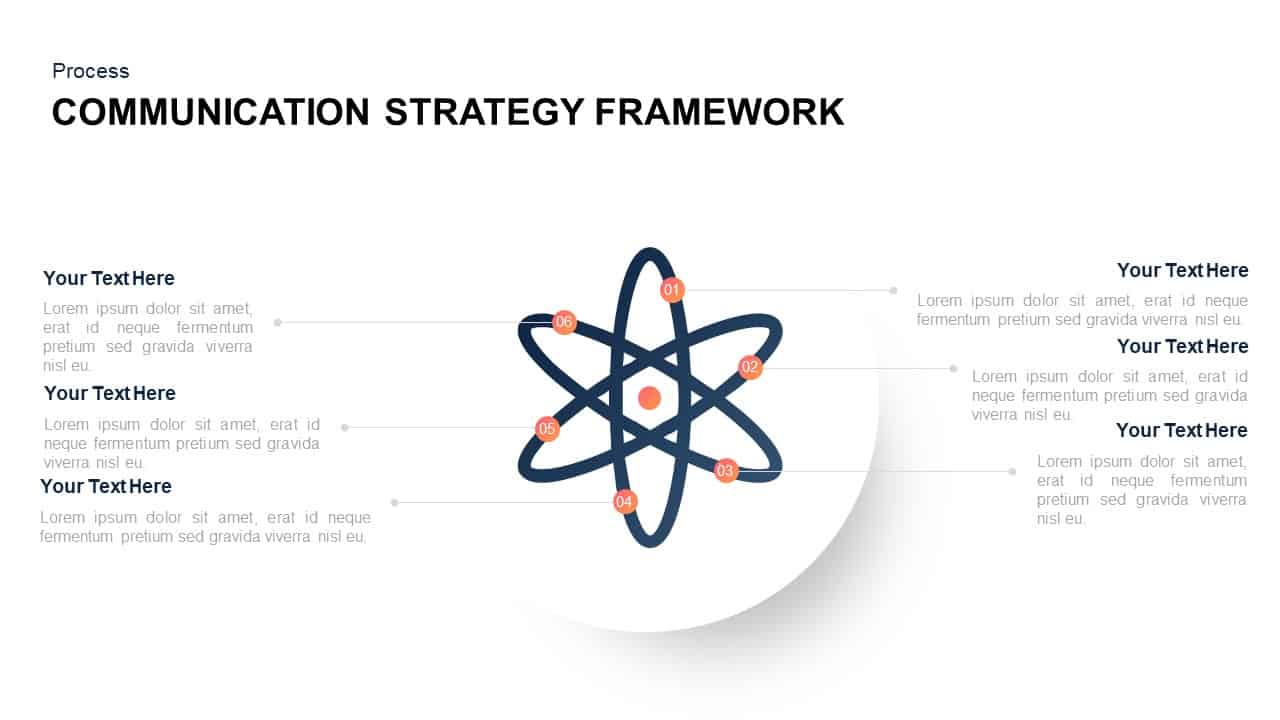
Communication Strategy Framework Diagram Template for PowerPoint & Google Slides
Circular
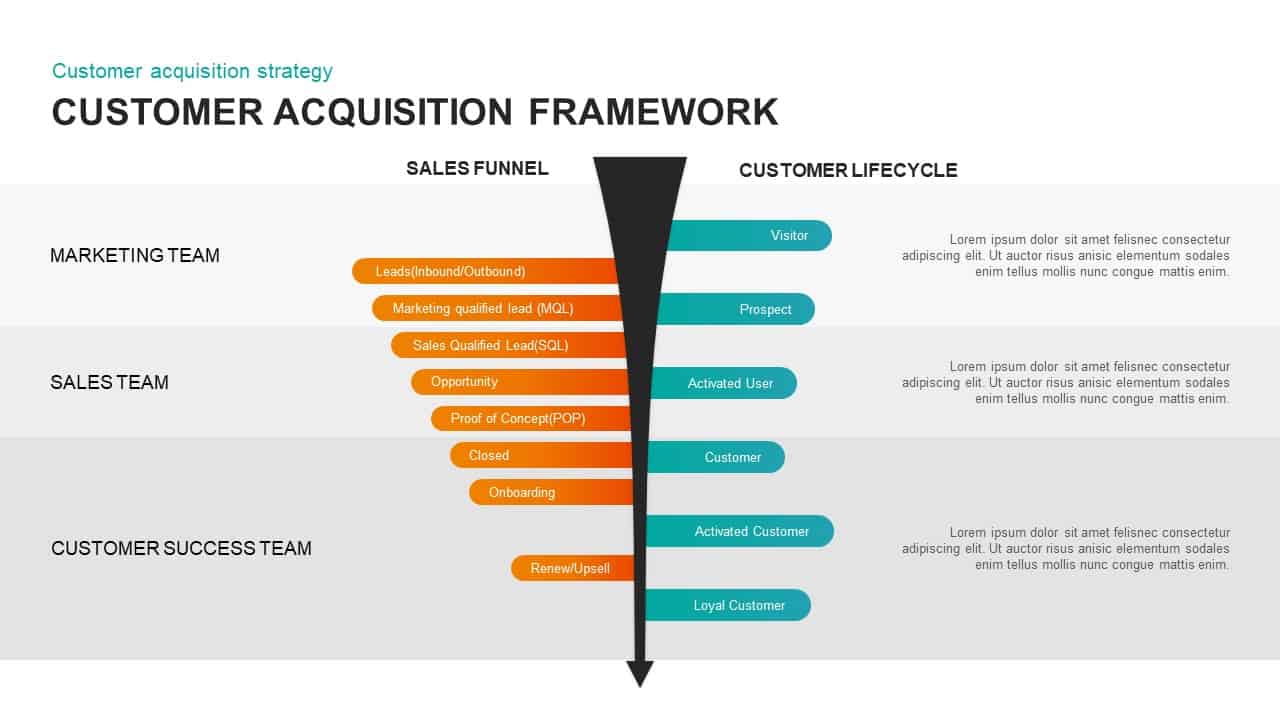
Customer Acquisition Framework Template for PowerPoint & Google Slides
Funnel
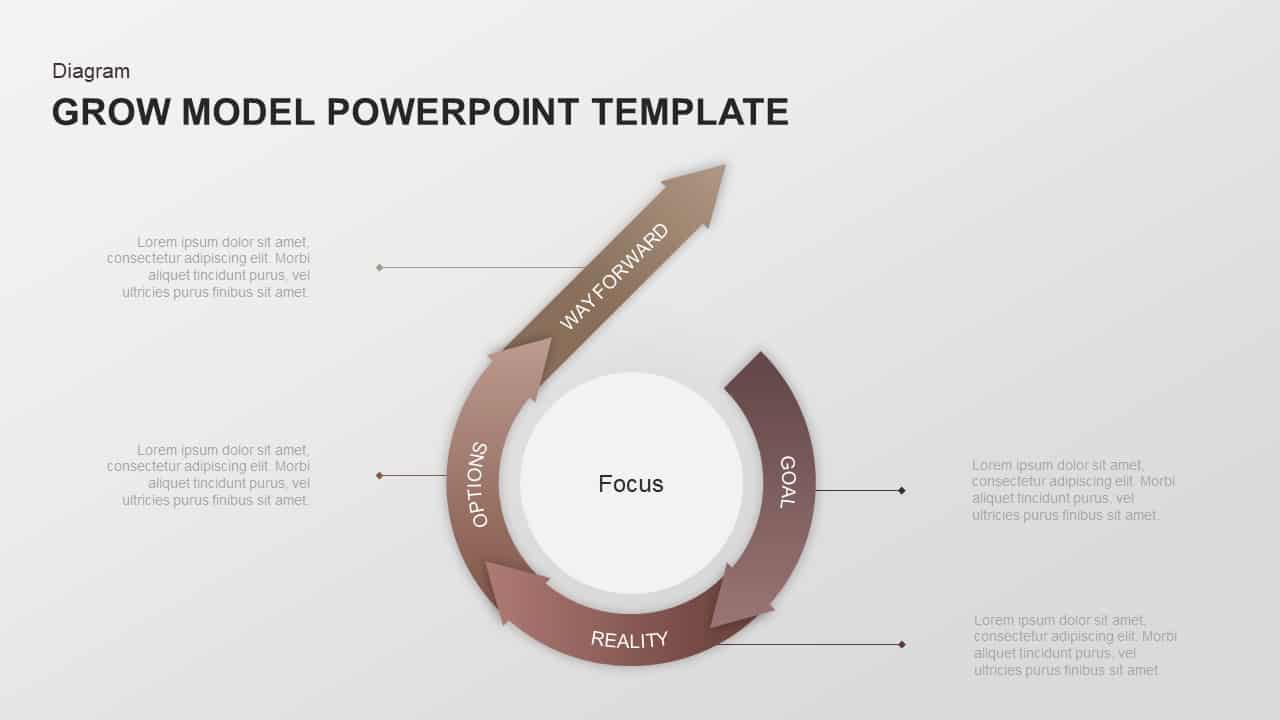
GROW Coaching Framework Diagram Template for PowerPoint & Google Slides
Process
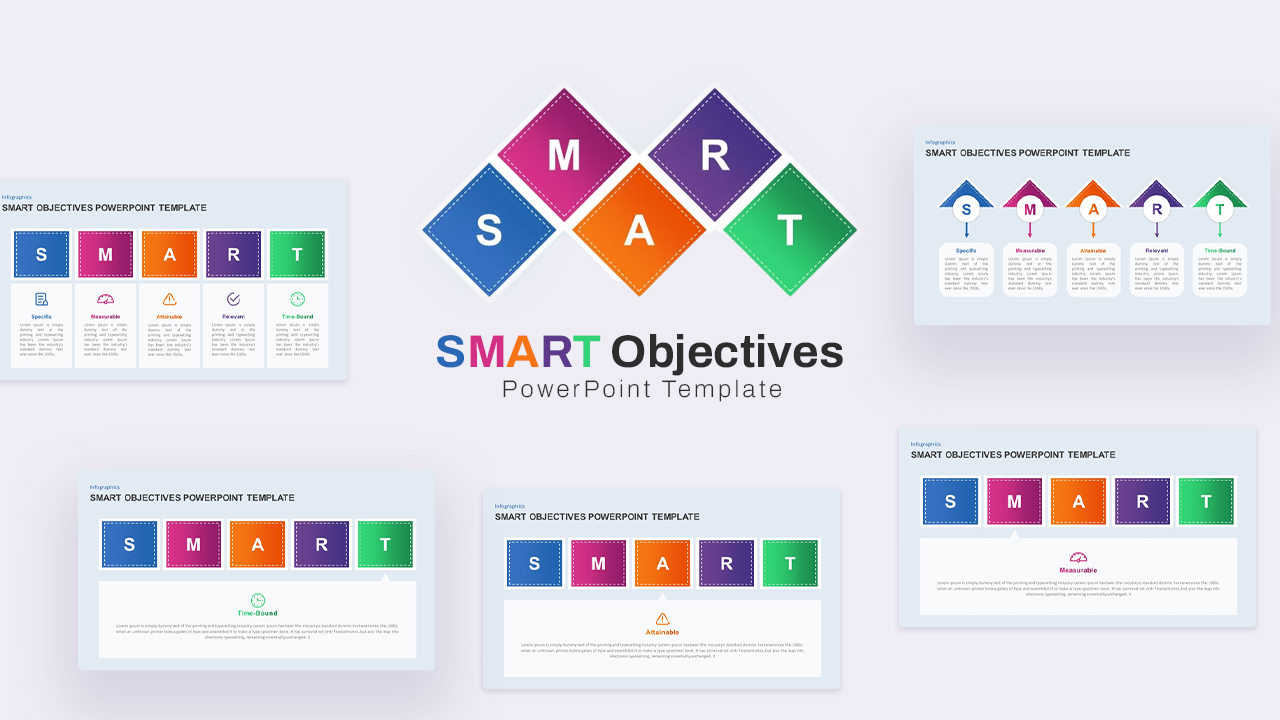
SMART Objectives – 5 Goals Framework Template for PowerPoint & Google Slides
Goals
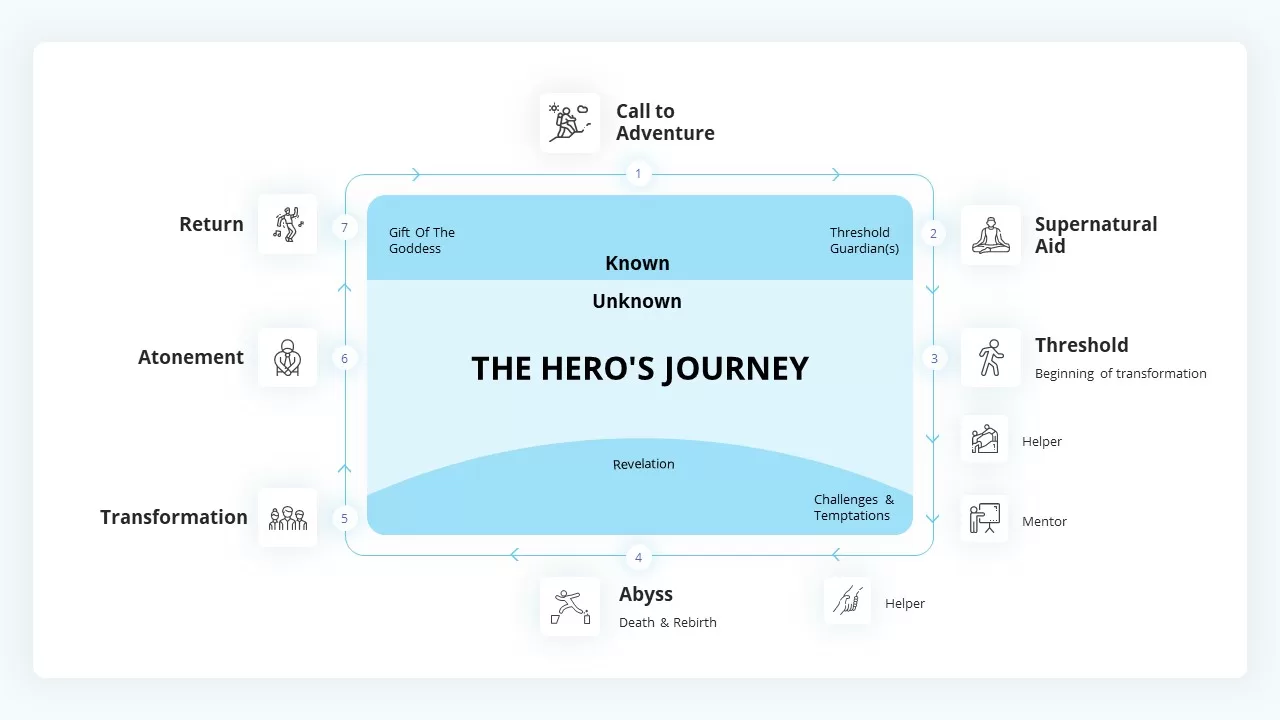
The Hero’s Journey Infographic Framework Template for PowerPoint & Google Slides
Customer Journey
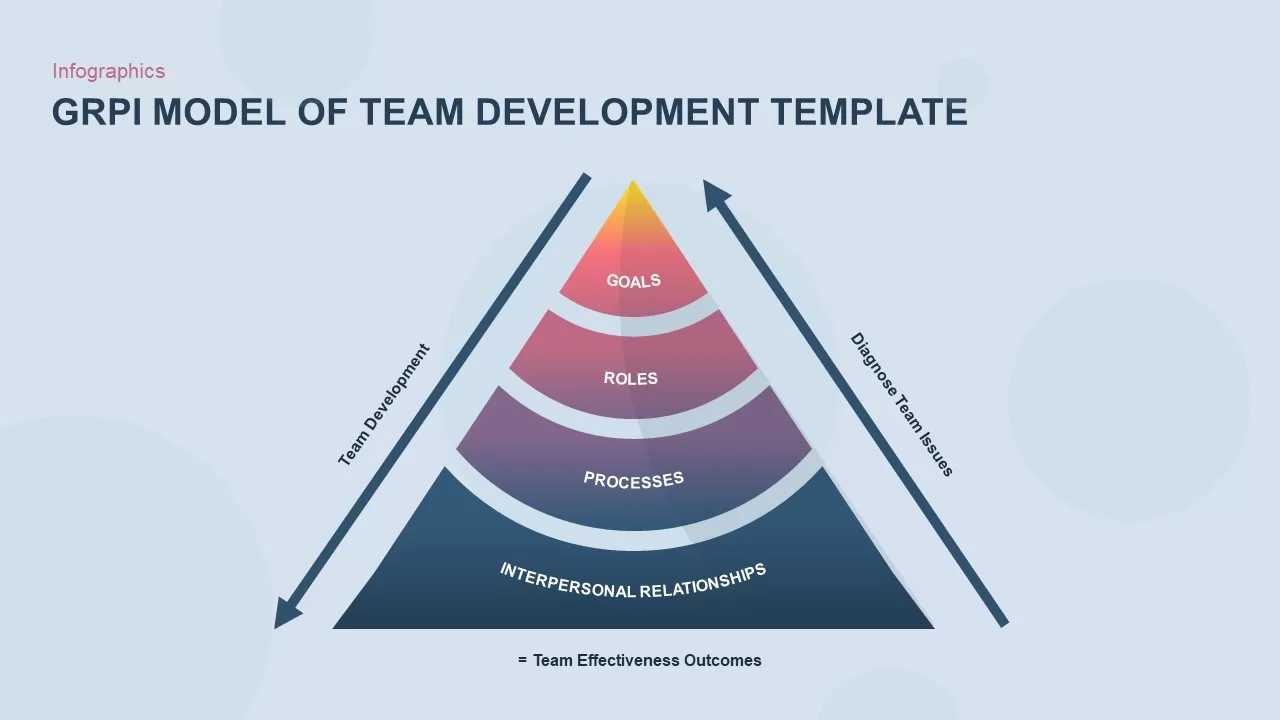
GRPI Model of Team Development Framework Template for PowerPoint & Google Slides
Leadership
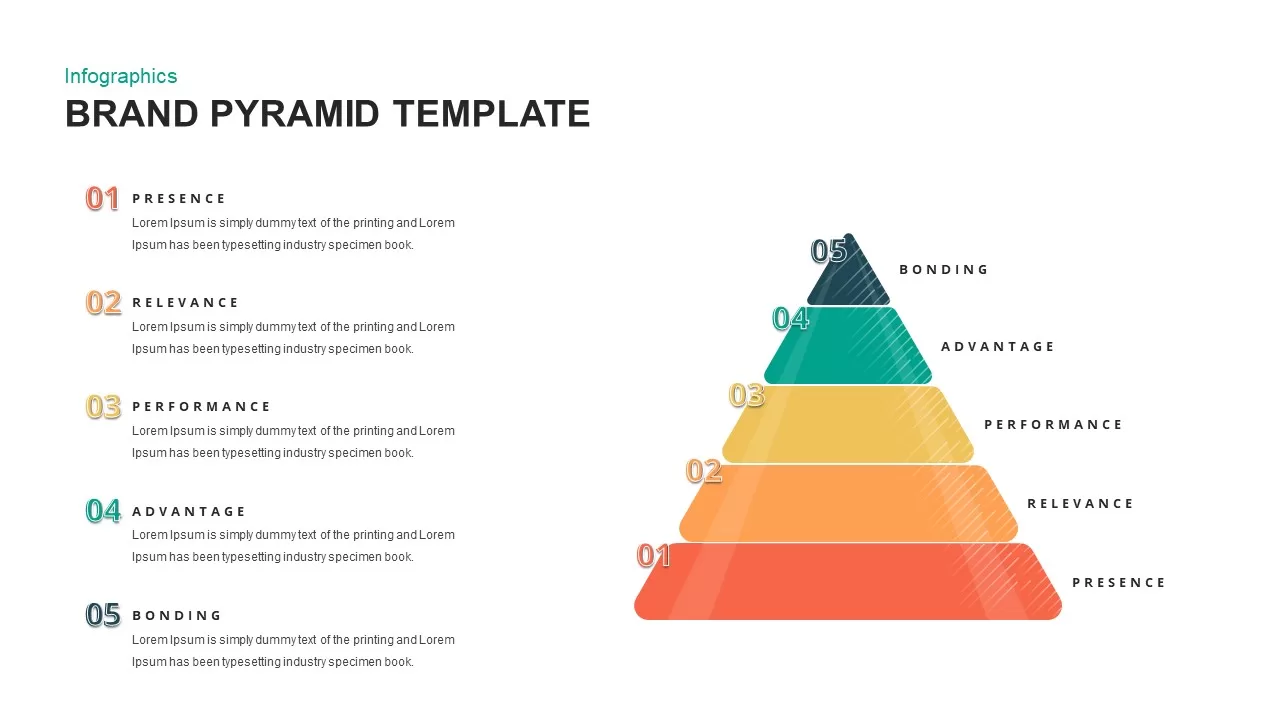
Brand Pyramid Framework template for PowerPoint & Google Slides
Pyramid
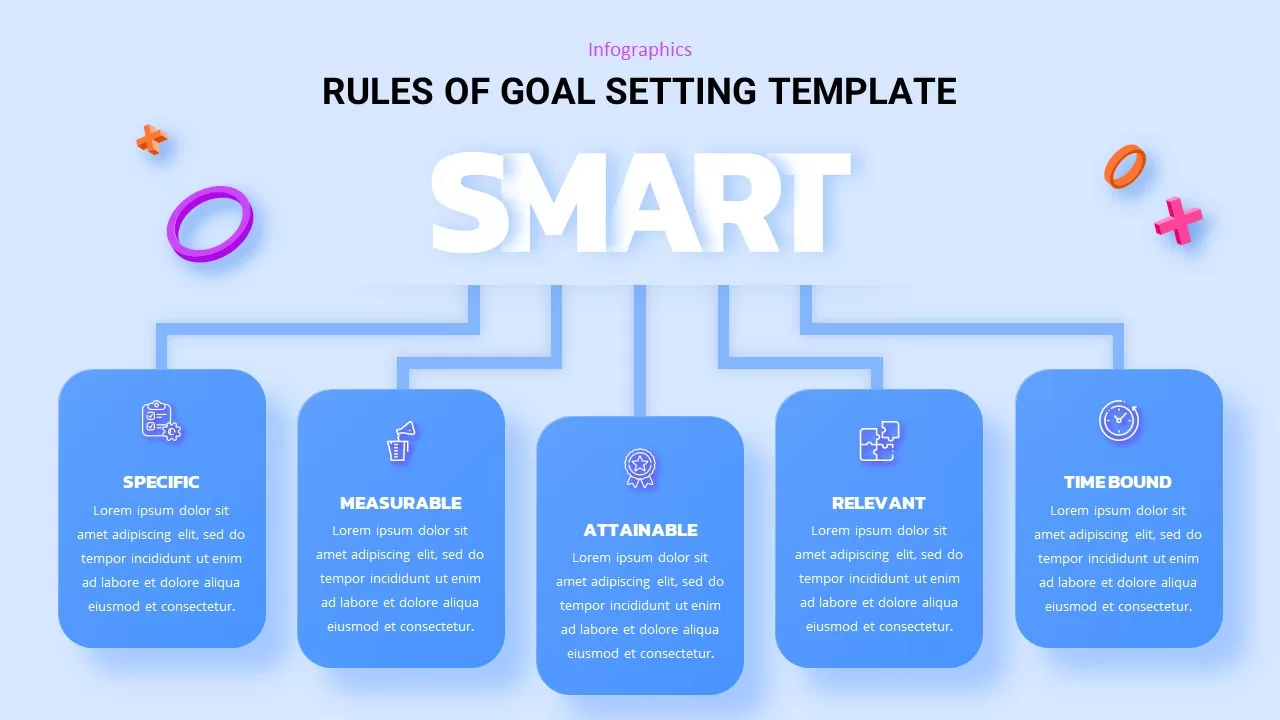
SMART Goals Framework Rules Template for PowerPoint & Google Slides
Business
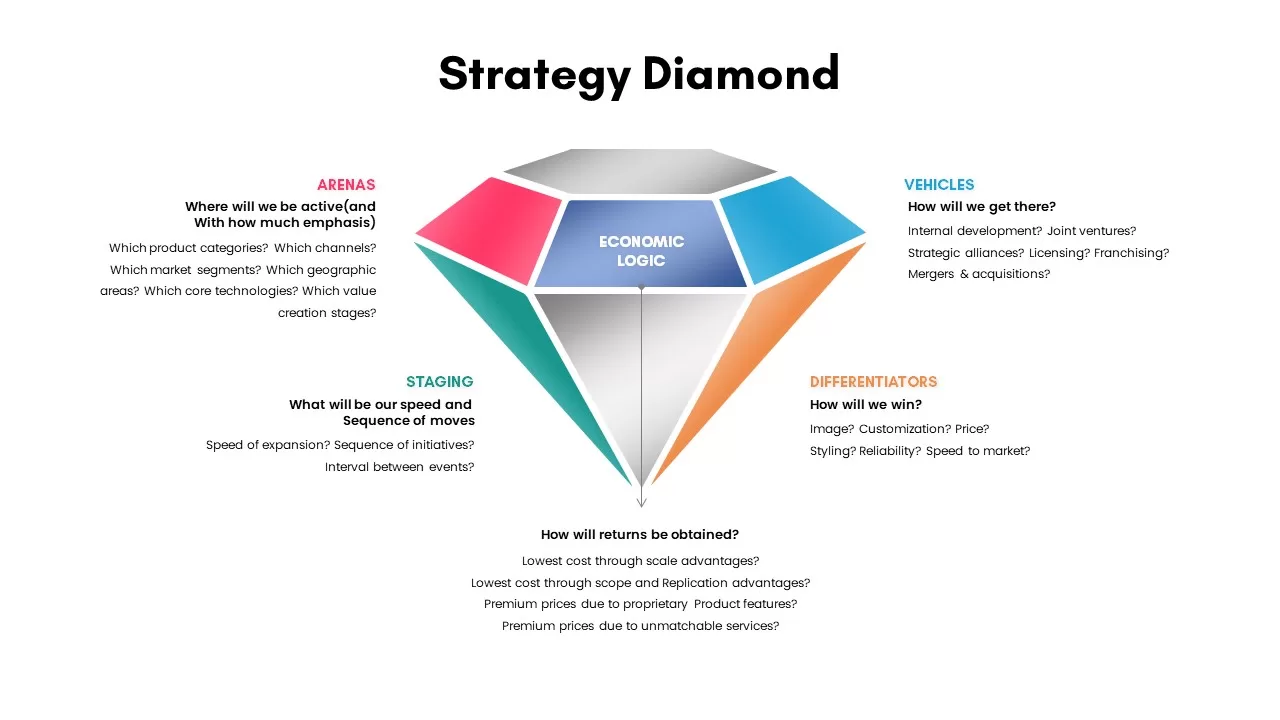
Strategy Diamond Framework Visual Template for PowerPoint & Google Slides
Competitor Analysis
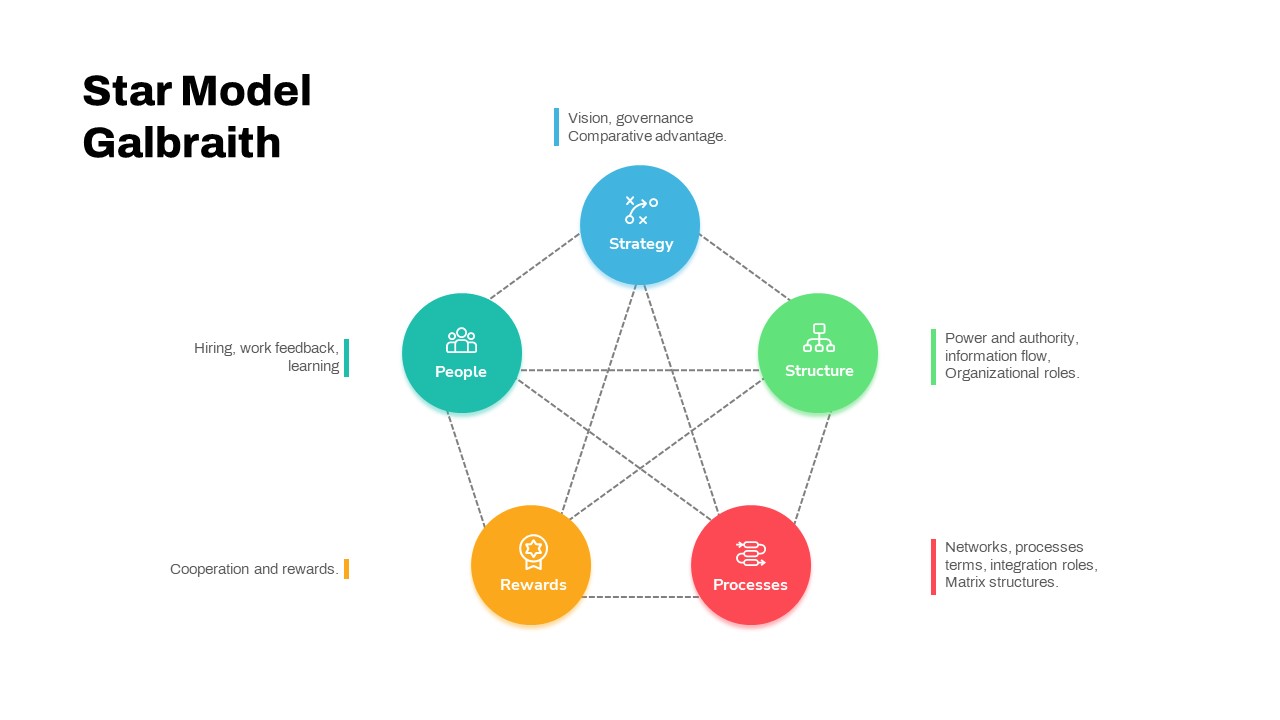
Star Model Galbraith Framework Template for PowerPoint & Google Slides
Business Strategy
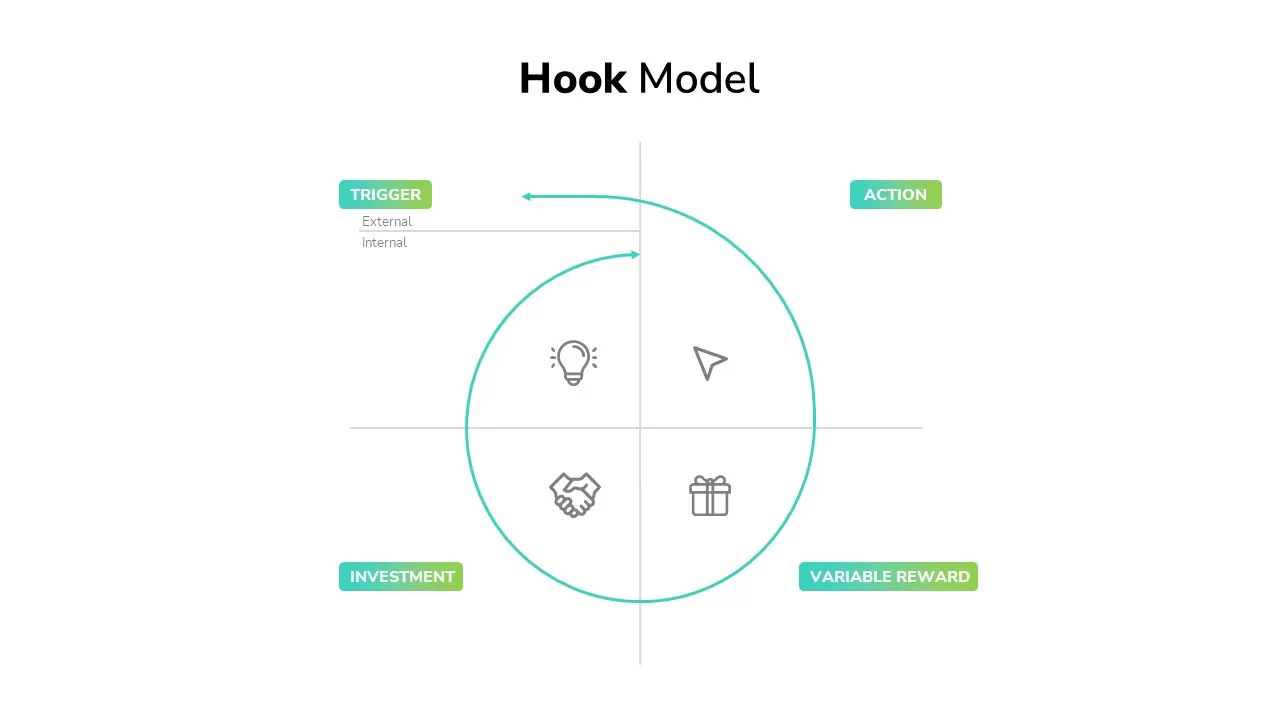
Hook Model Framework Template for PowerPoint & Google Slides
Business Strategy
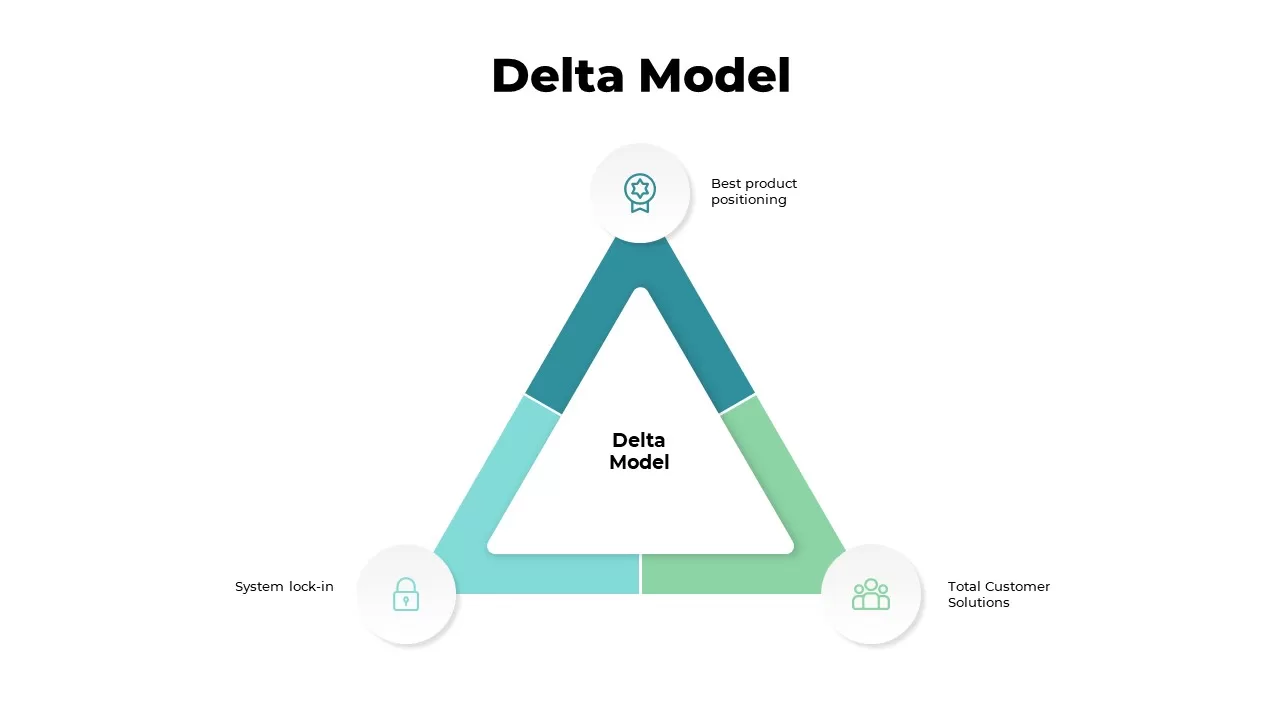
Delta Model Strategic Framework Template for PowerPoint & Google Slides
Business Strategy
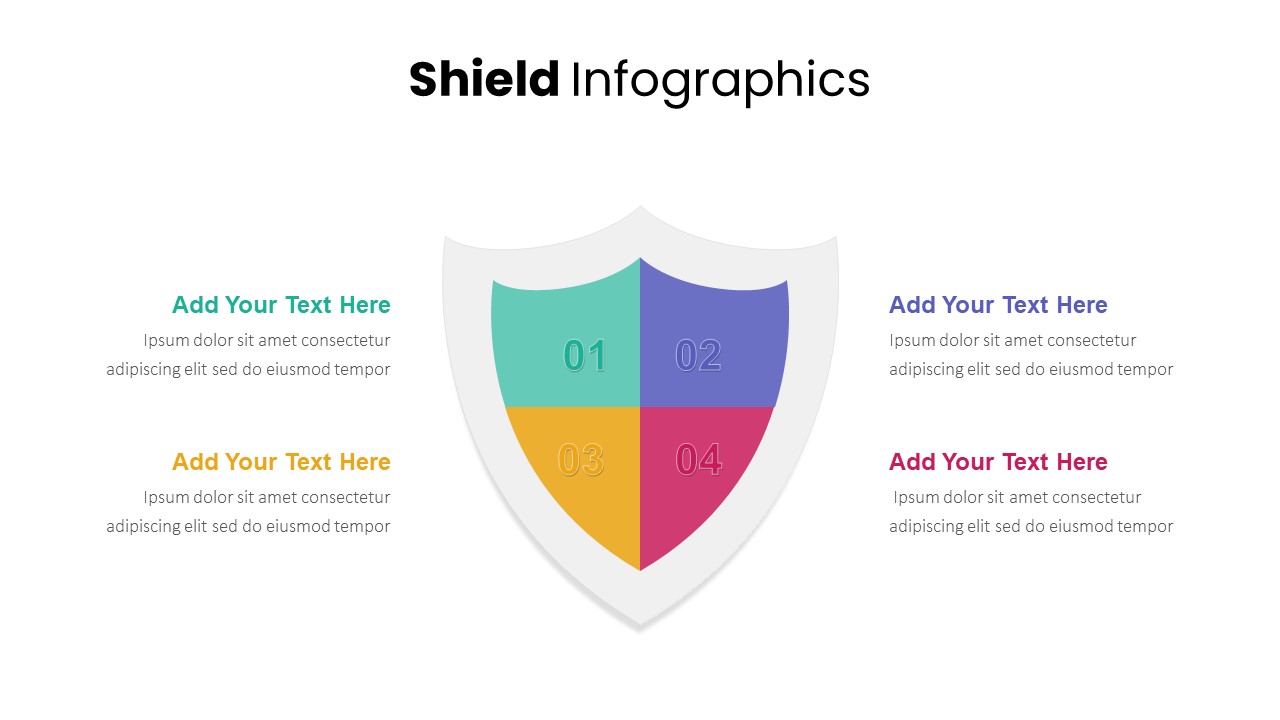
Shield Infographics Four-Part Framework Template for PowerPoint & Google Slides
Process
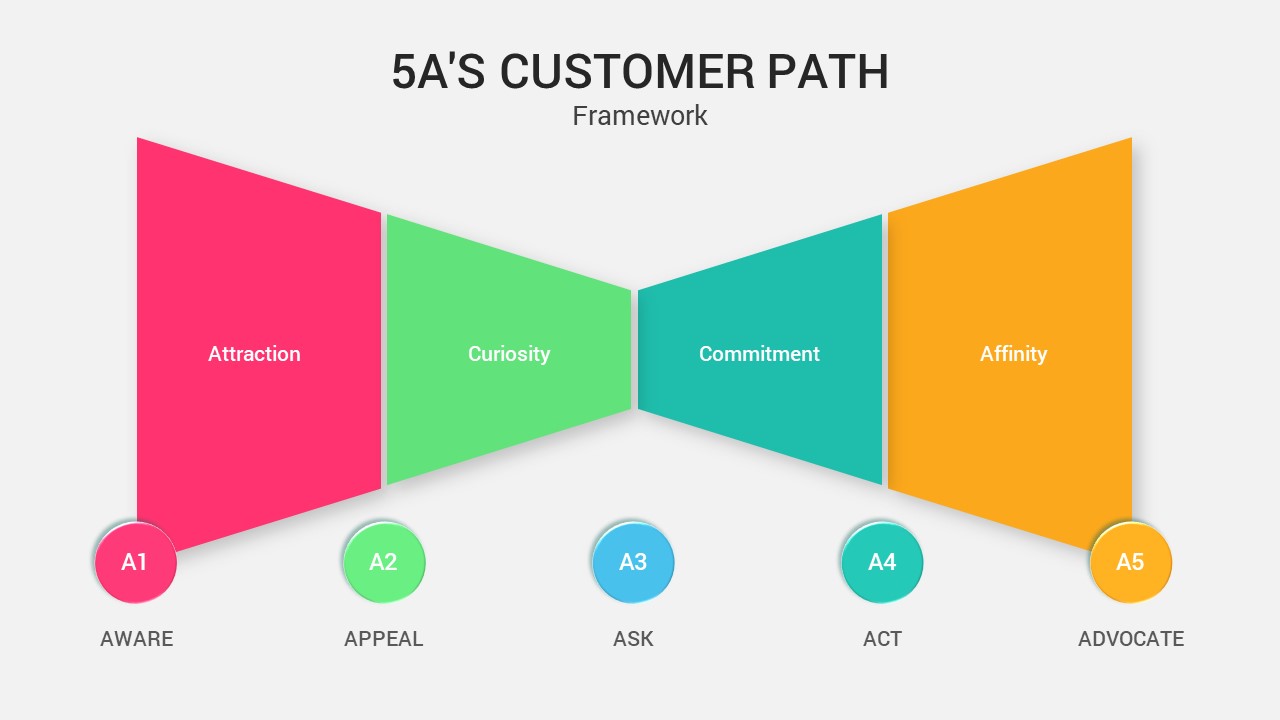
5A’s Customer Path Framework Diagram Template for PowerPoint & Google Slides
Process
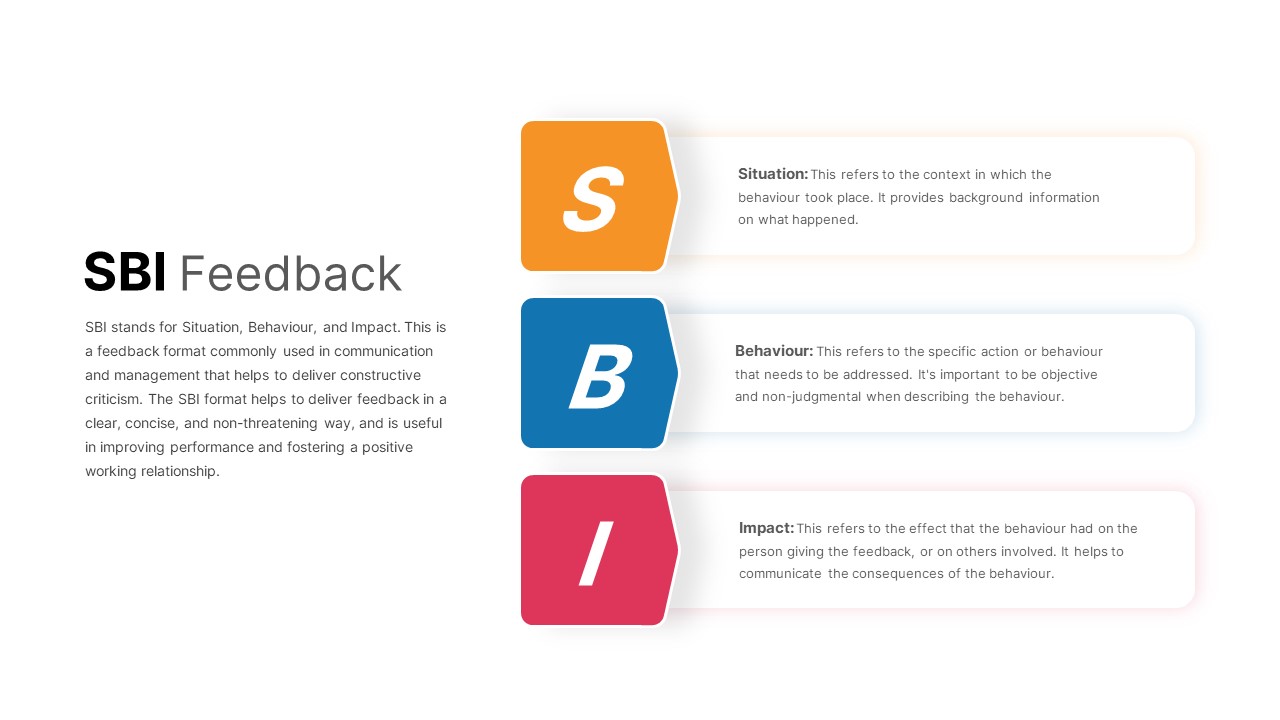
Concise SBI Feedback Framework Template for PowerPoint & Google Slides
Process
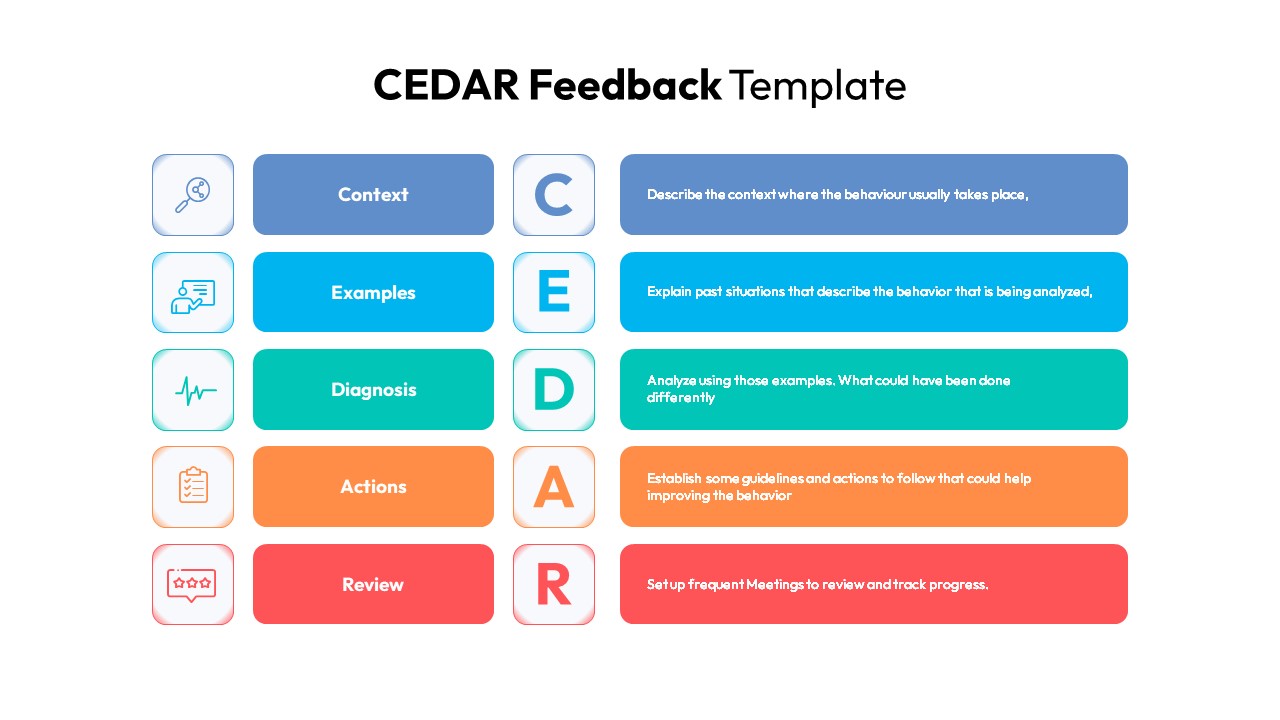
CEDAR Feedback Framework Diagram Template for PowerPoint & Google Slides
Employee Performance
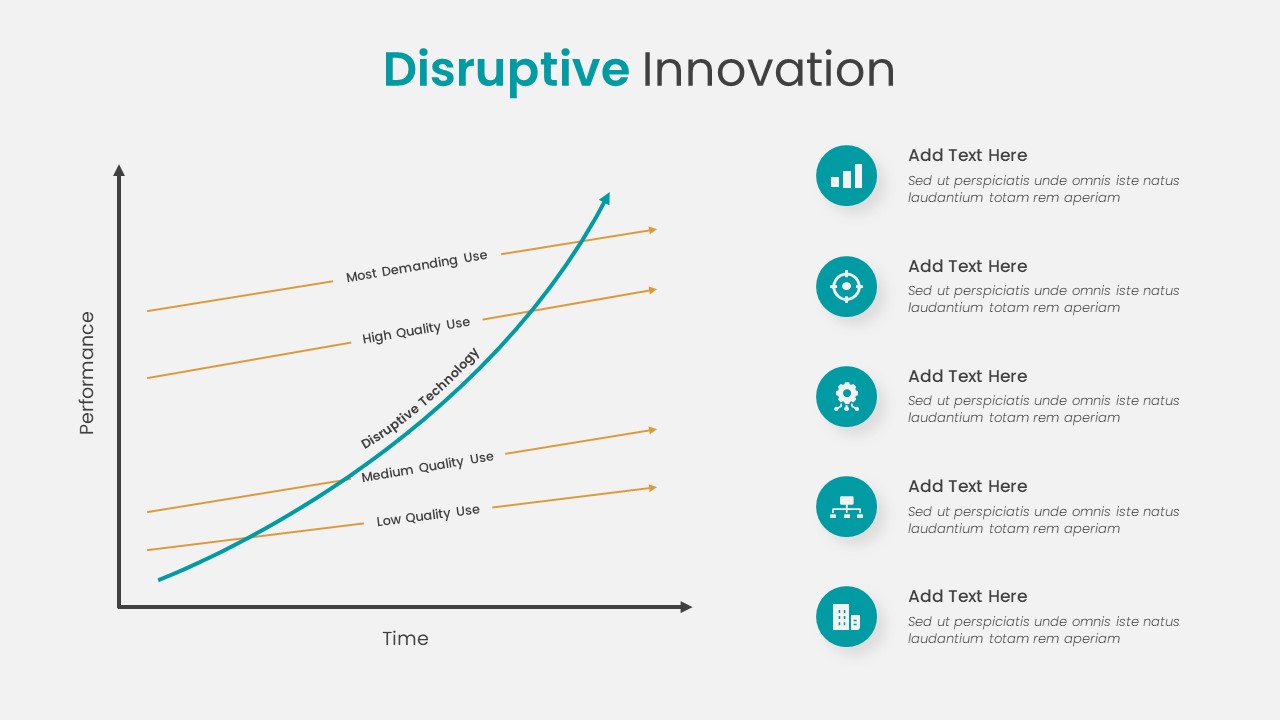
Disruptive Innovation Framework Diagram Template for PowerPoint & Google Slides
Comparison Chart
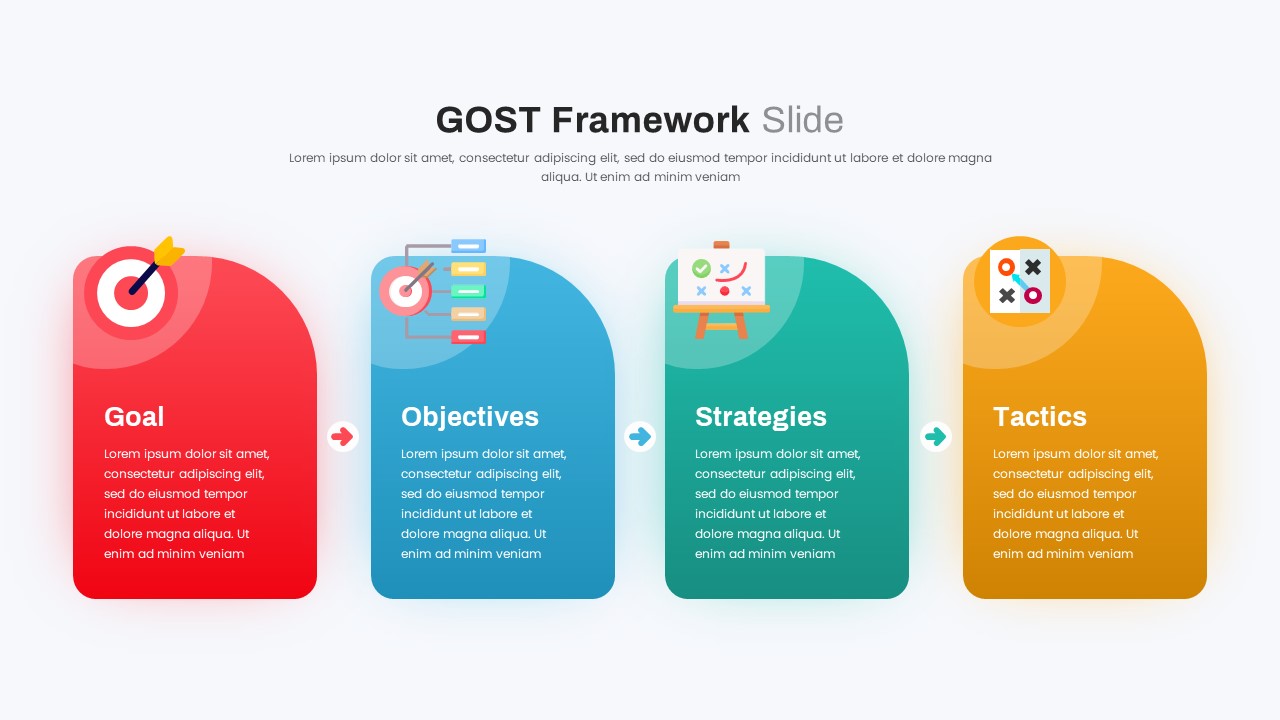
GOST Strategy Framework Template for PowerPoint & Google Slides
Business Strategy
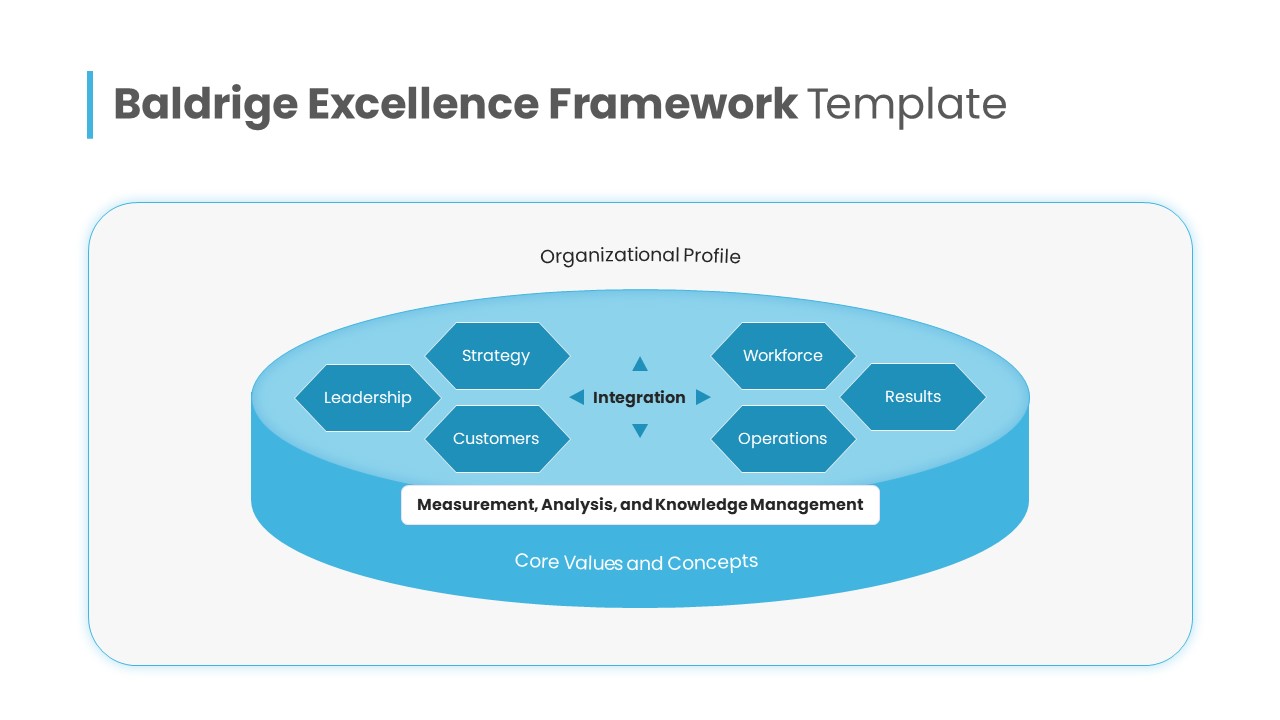
Baldrige Excellence Framework Overview Template for PowerPoint & Google Slides
Leadership
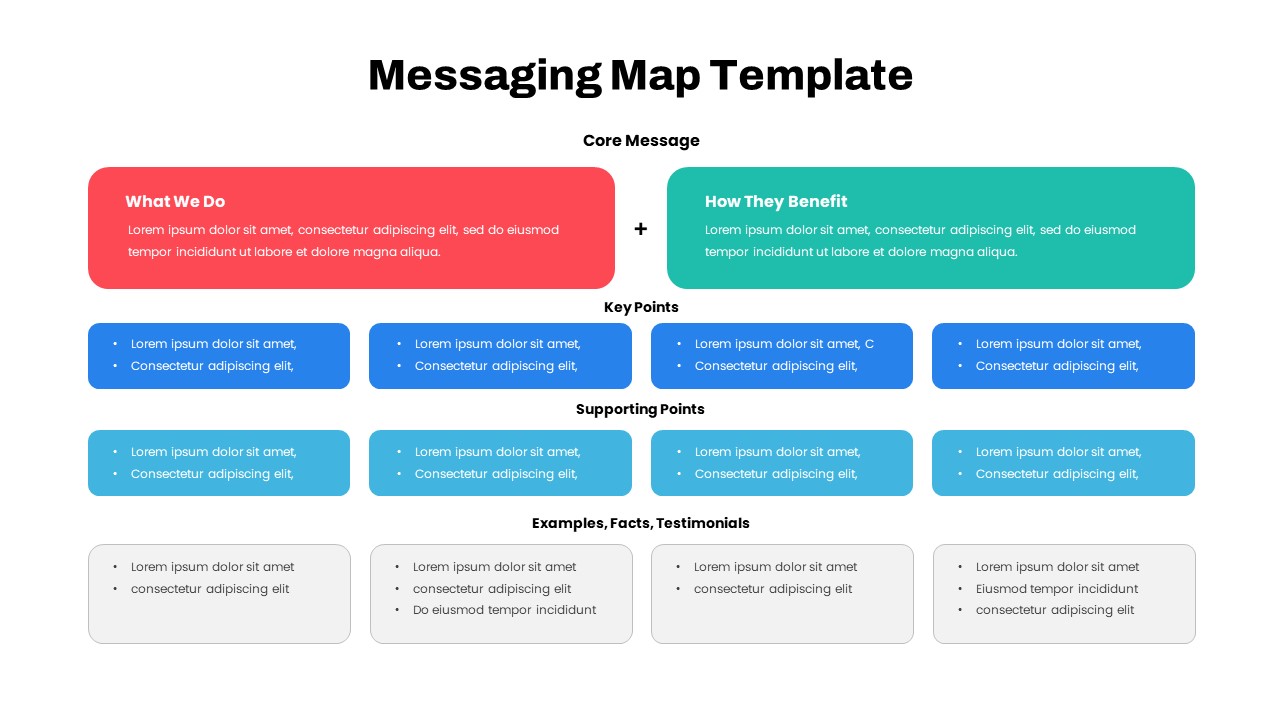
Comprehensive Messaging Map Framework Template for PowerPoint & Google Slides
Process
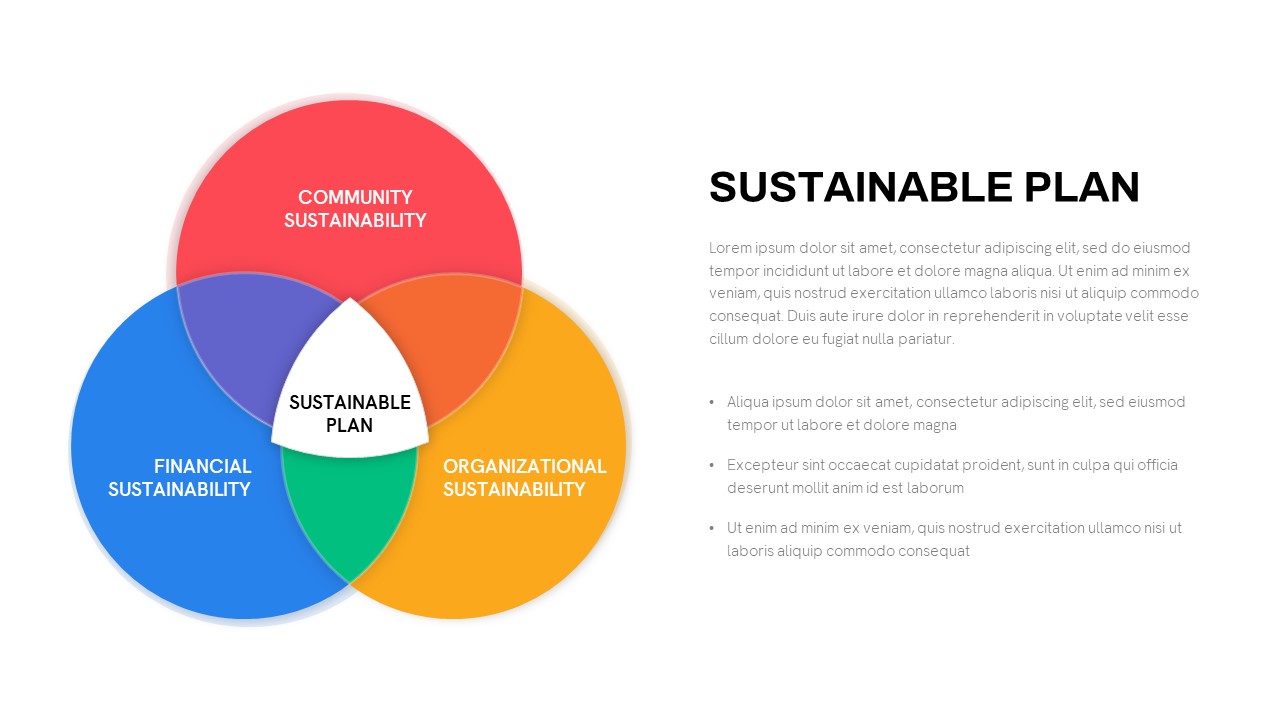
Sustainable Plan Strategy Framework Template for PowerPoint & Google Slides
Business
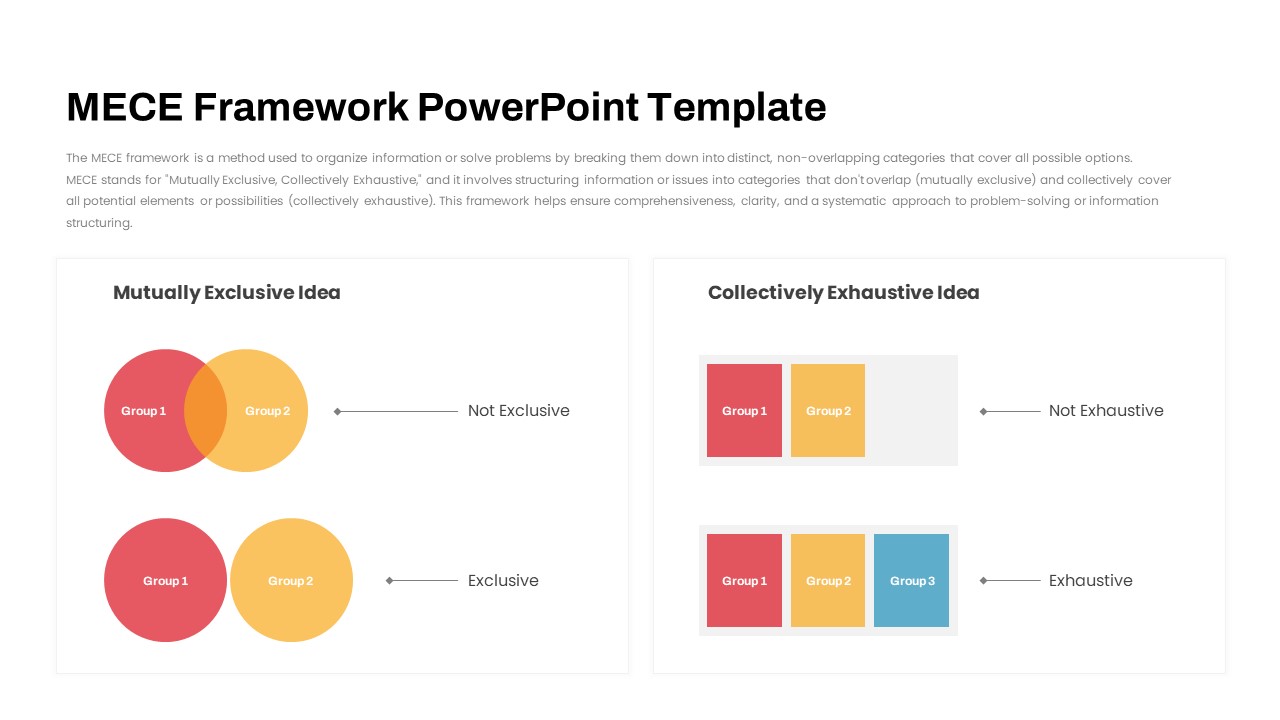
MECE Framework Venn & Block Diagram Template for PowerPoint & Google Slides
Comparison
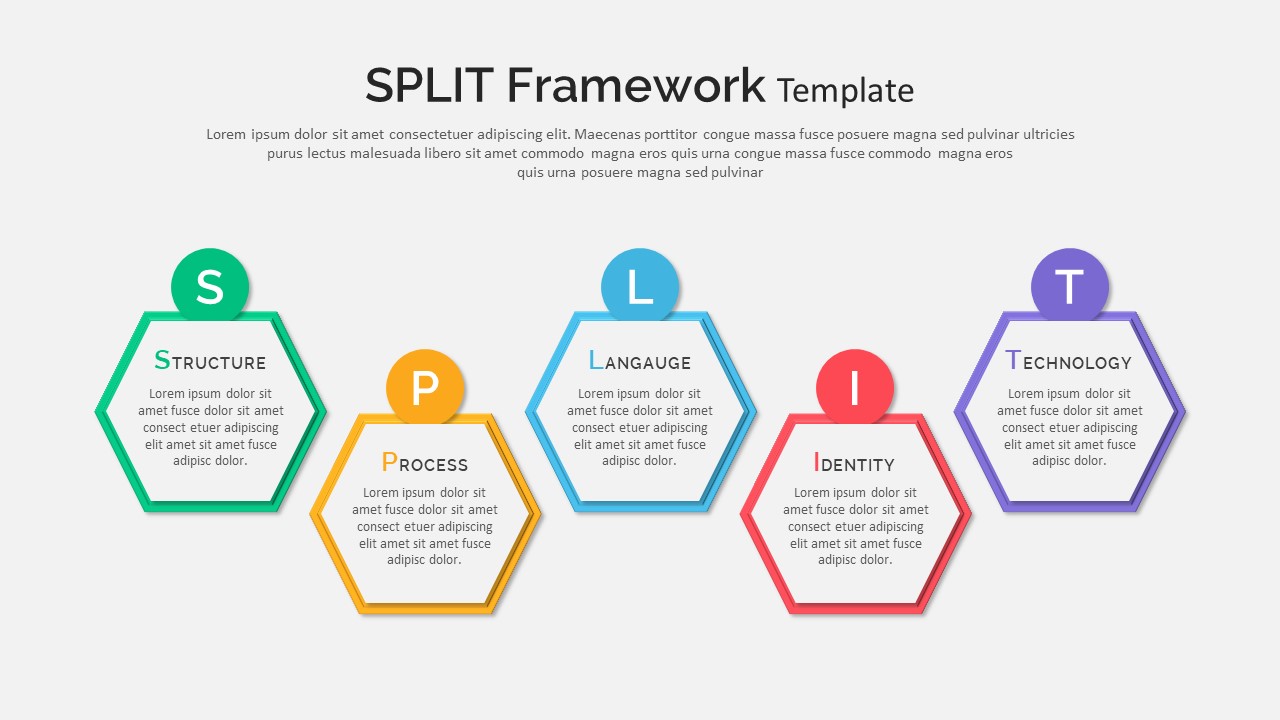
Split Framework Hexagon Diagram Slide Template for PowerPoint & Google Slides
Process
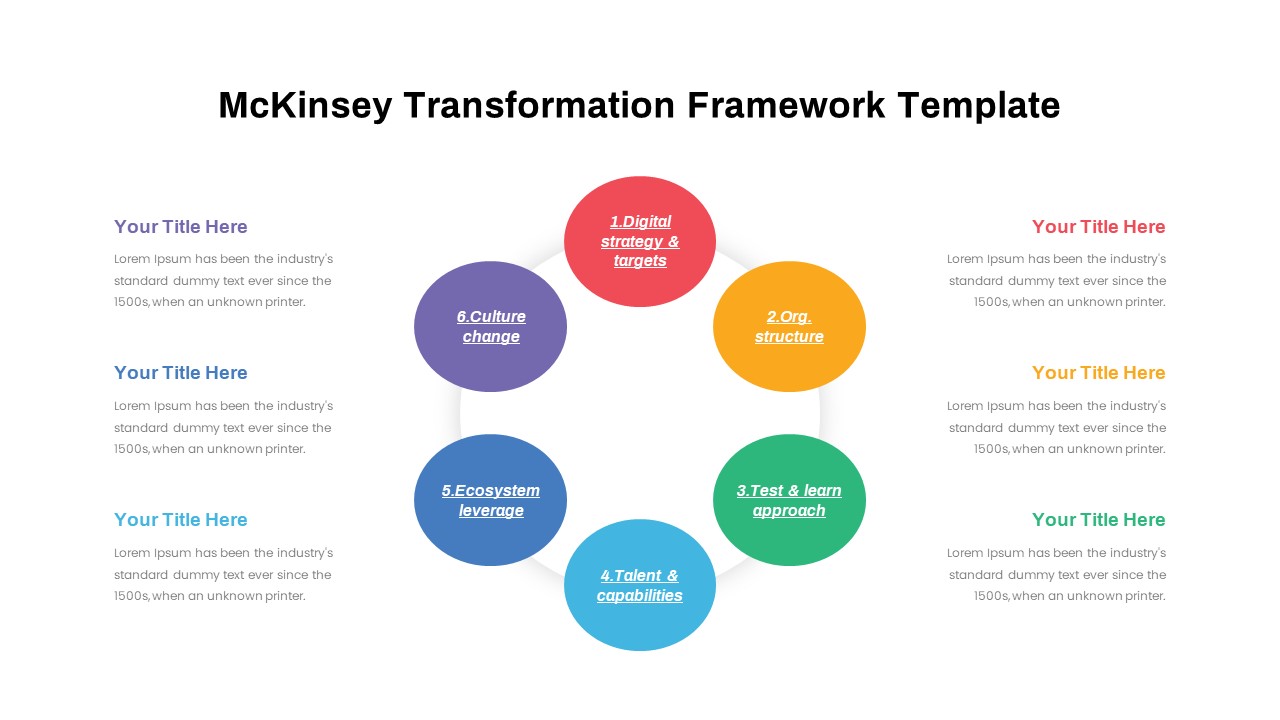
BCG Transformation Framework Diagram Template for PowerPoint & Google Slides
BCG
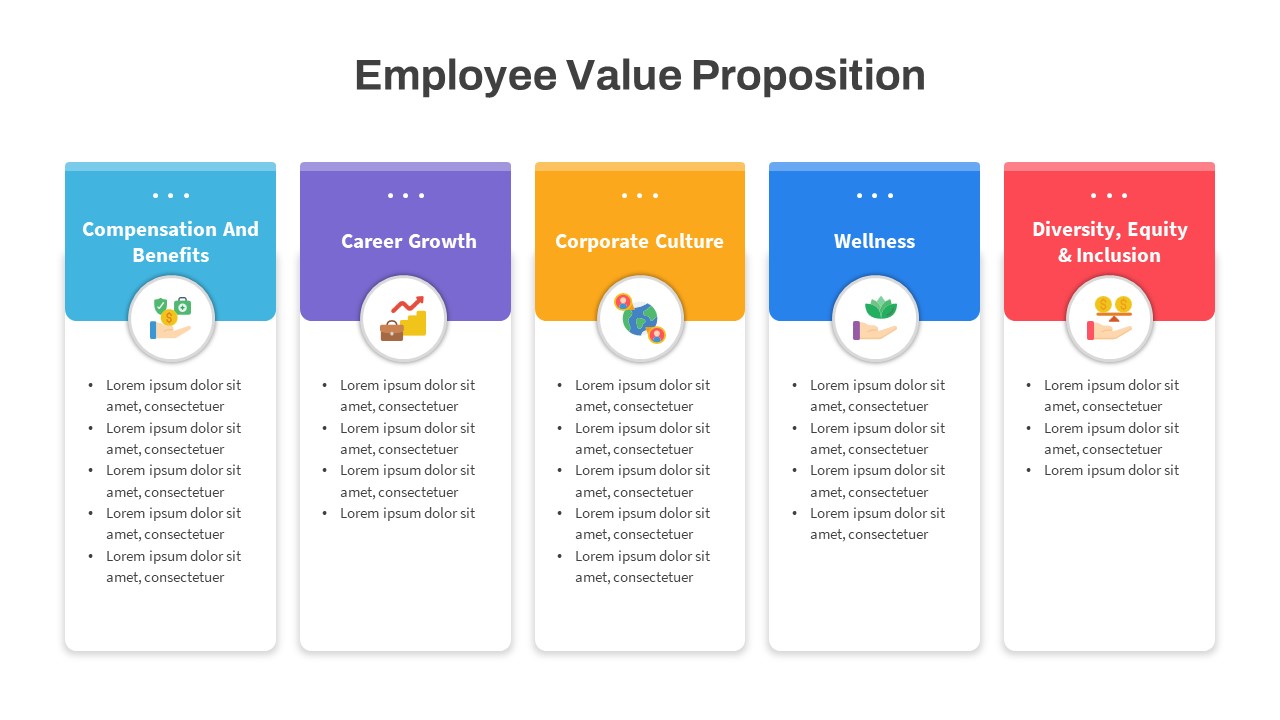
Employee Value Proposition Framework Template for PowerPoint & Google Slides
Recruitment
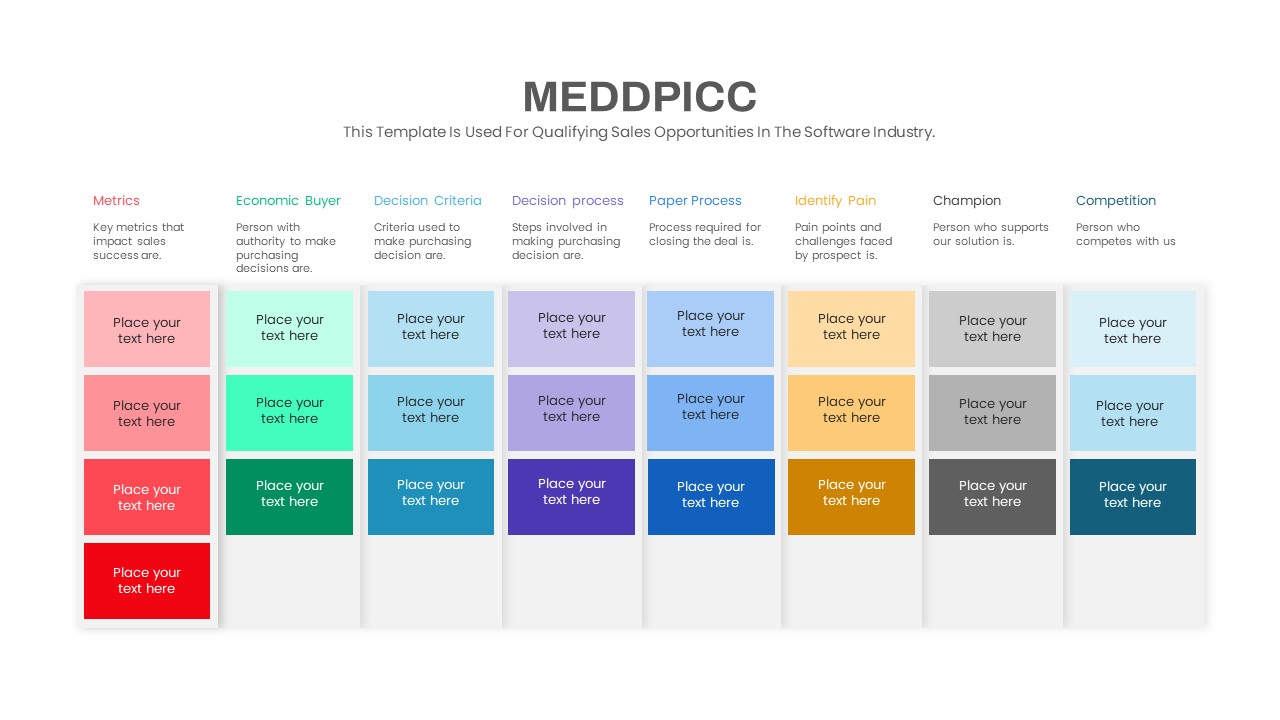
MEDDPICC Sales Qualification Framework Template for PowerPoint & Google Slides
Process
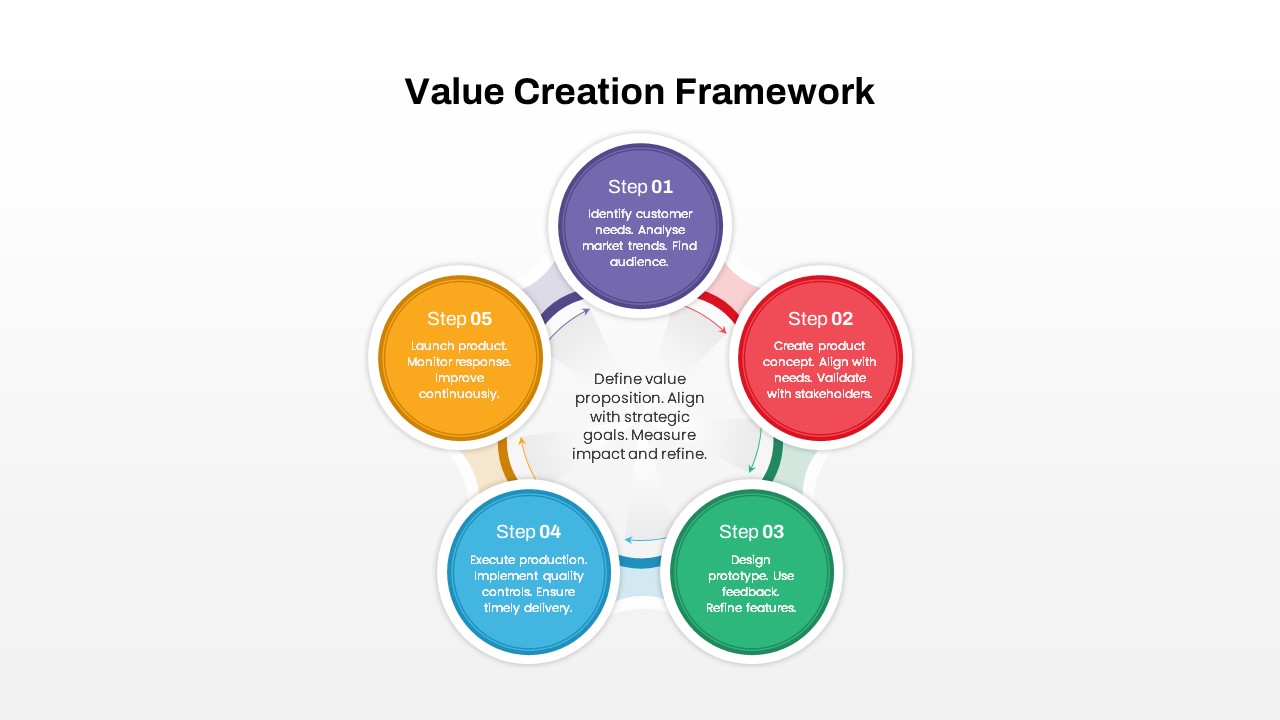
Value Creation Framework Process Diagram Template for PowerPoint & Google Slides
Business Plan
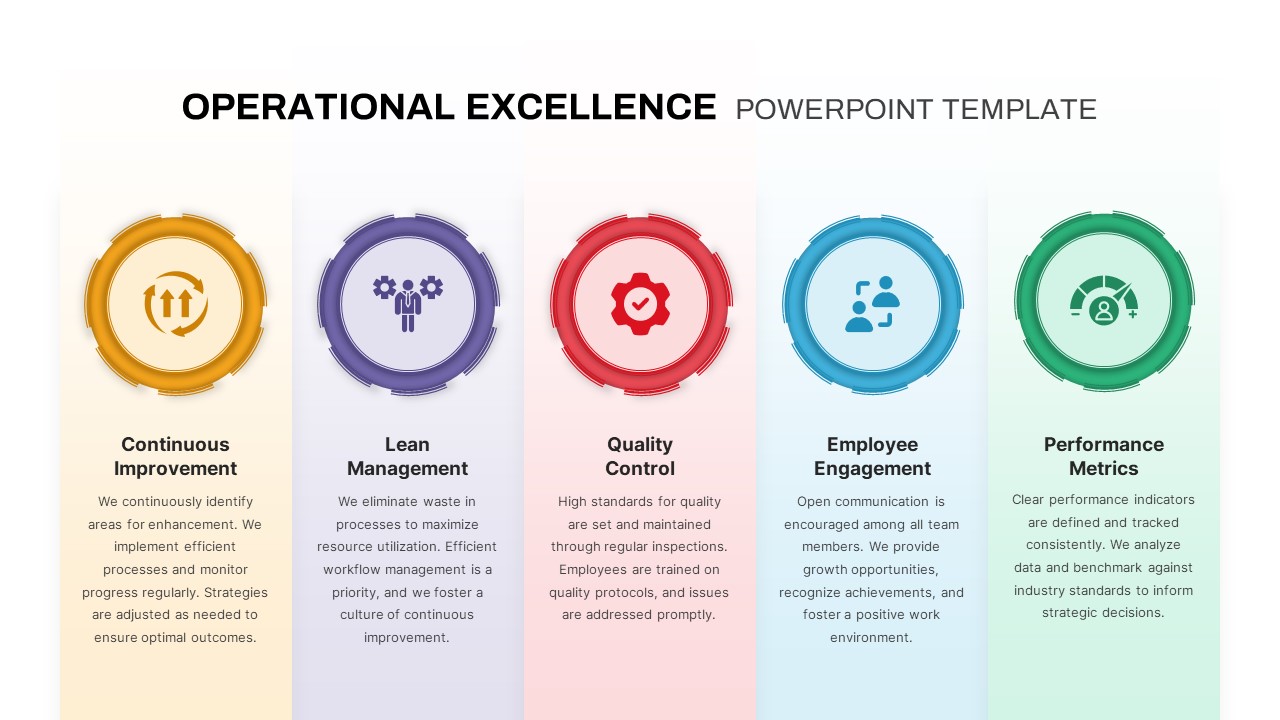
Operational Excellence Framework Template for PowerPoint & Google Slides
Business Strategy
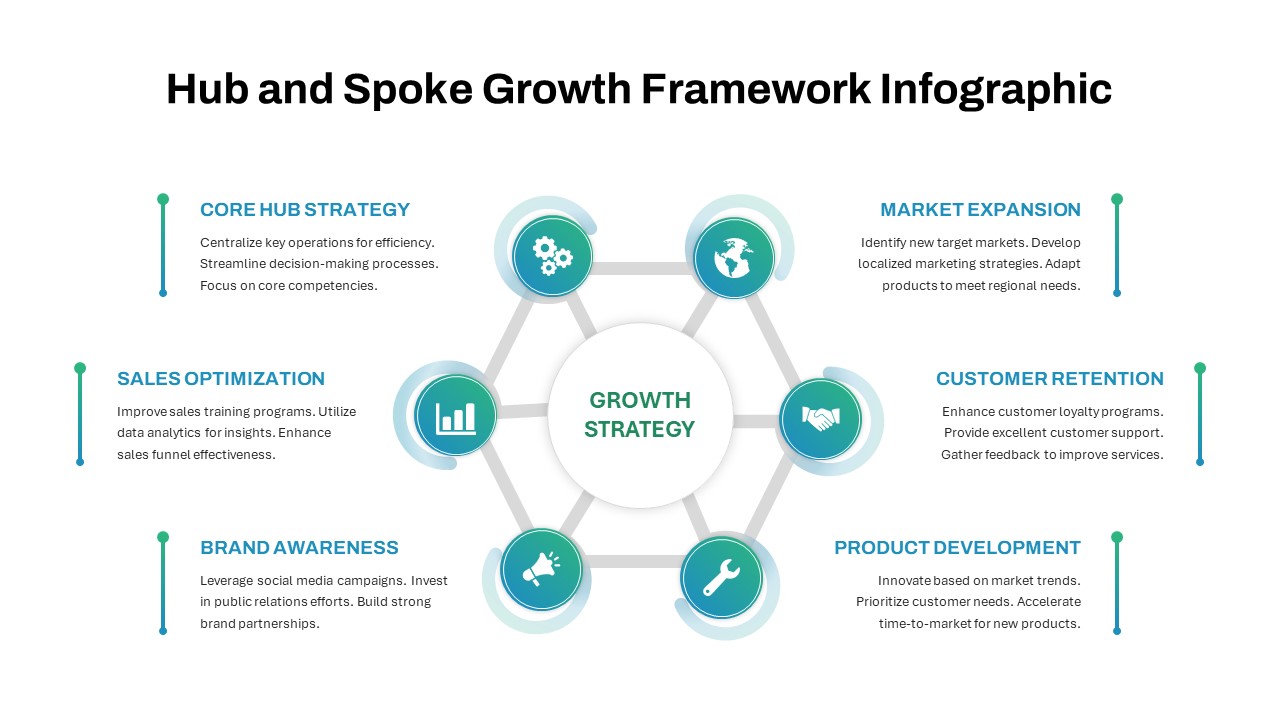
Hub and Spoke Growth Framework Template for PowerPoint & Google Slides
Circular
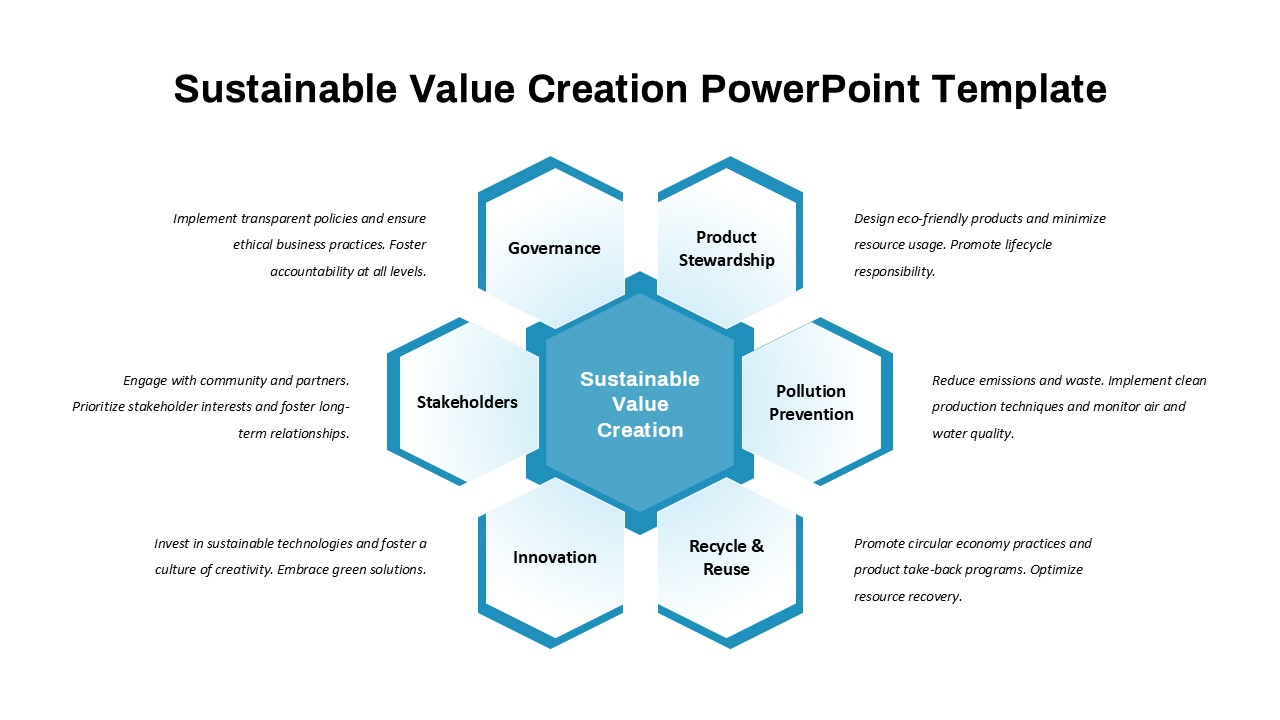
Sustainable Value Creation Framework Template for PowerPoint & Google Slides
Process
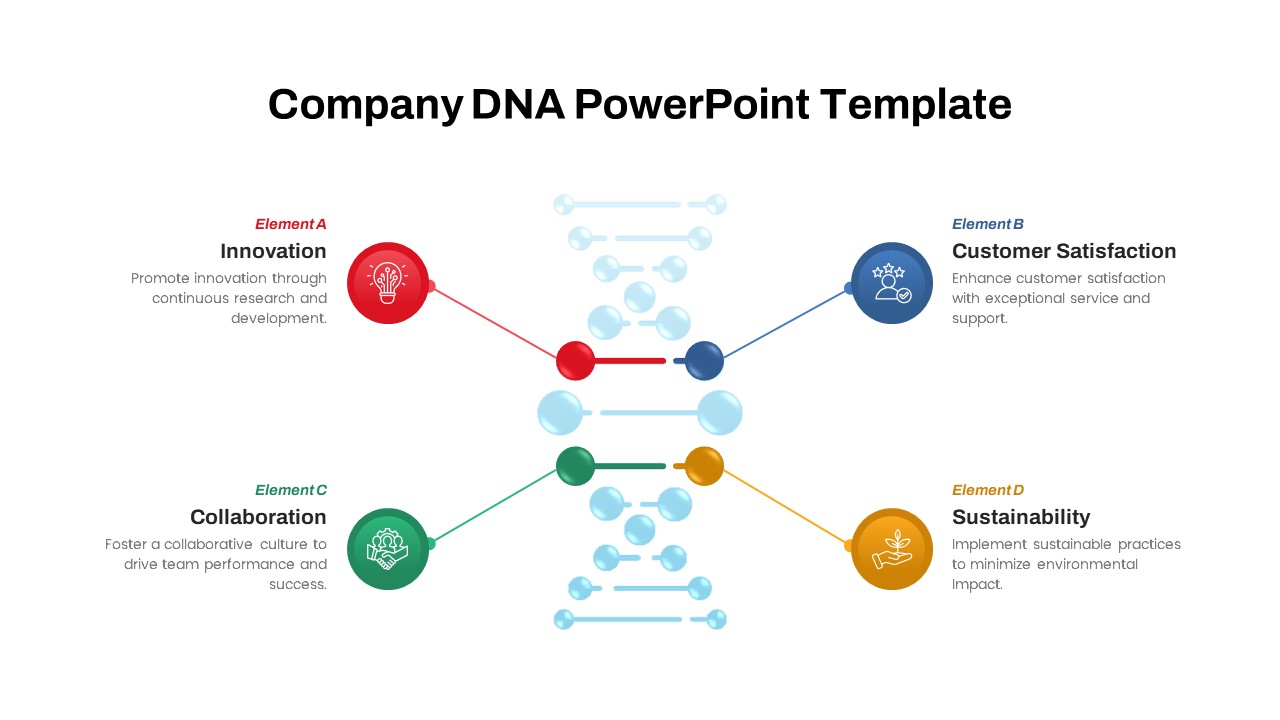
Company DNA Framework Slide Deck Template for PowerPoint & Google Slides
Circular
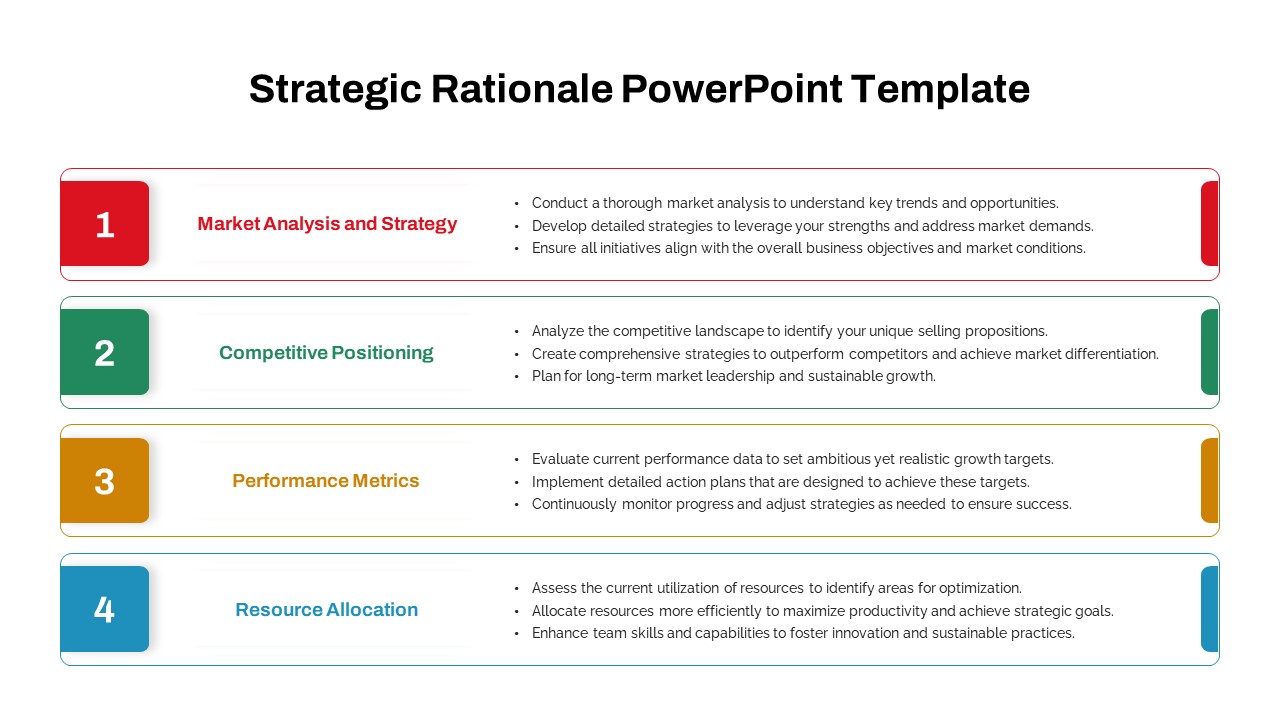
Strategic Rationale Framework Diagram Template for PowerPoint & Google Slides
Process
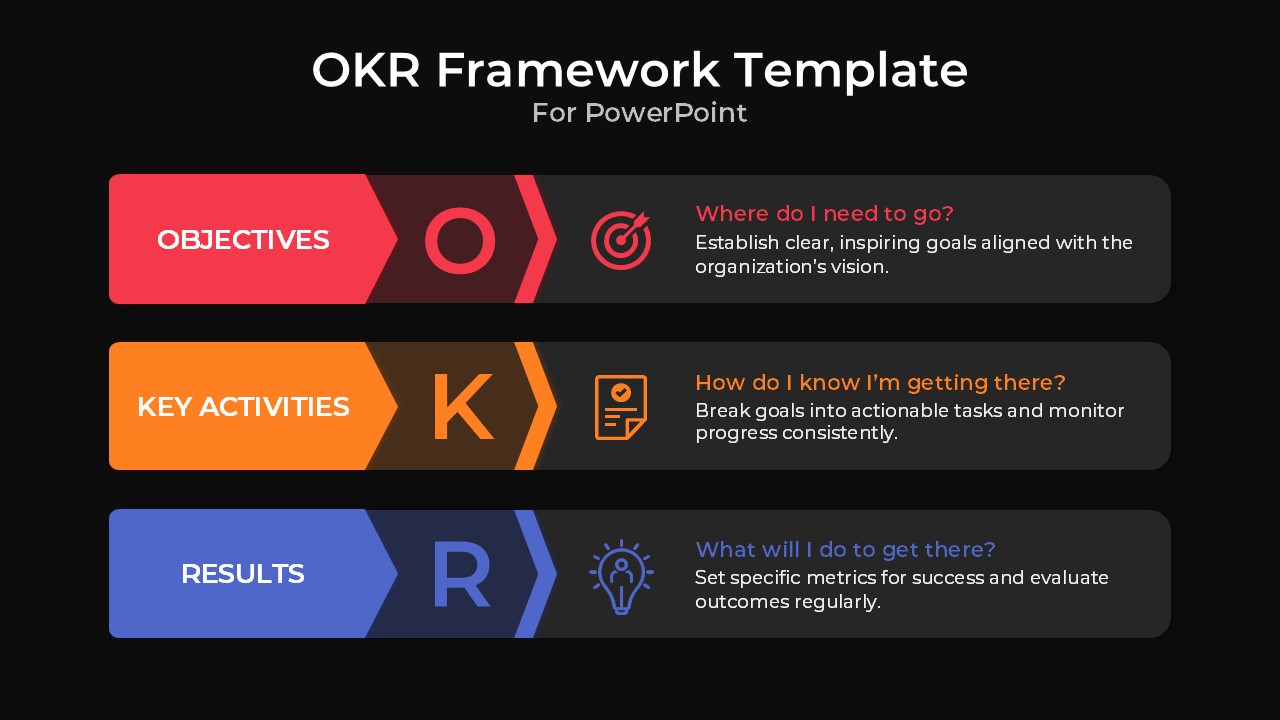
OKR Framework Template for PowerPoint & Google Slides
Process
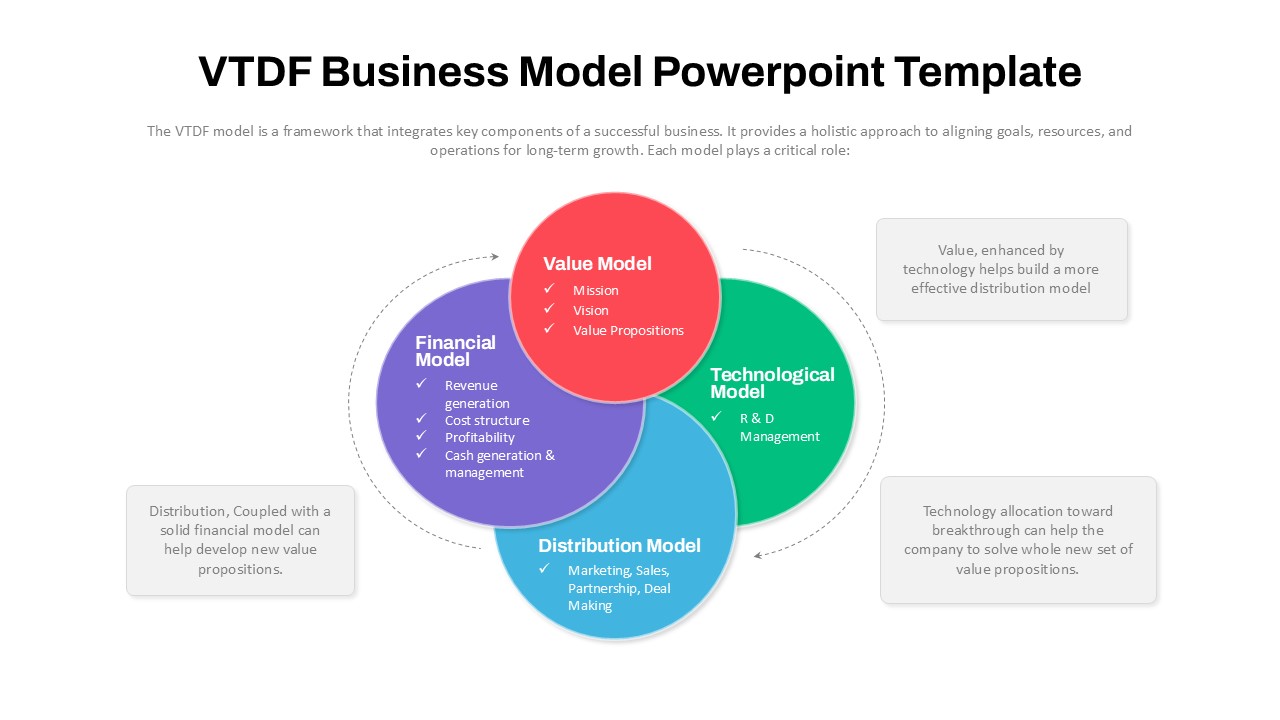
VTDF Business Model Framework Diagram Template for PowerPoint & Google Slides
Business Models
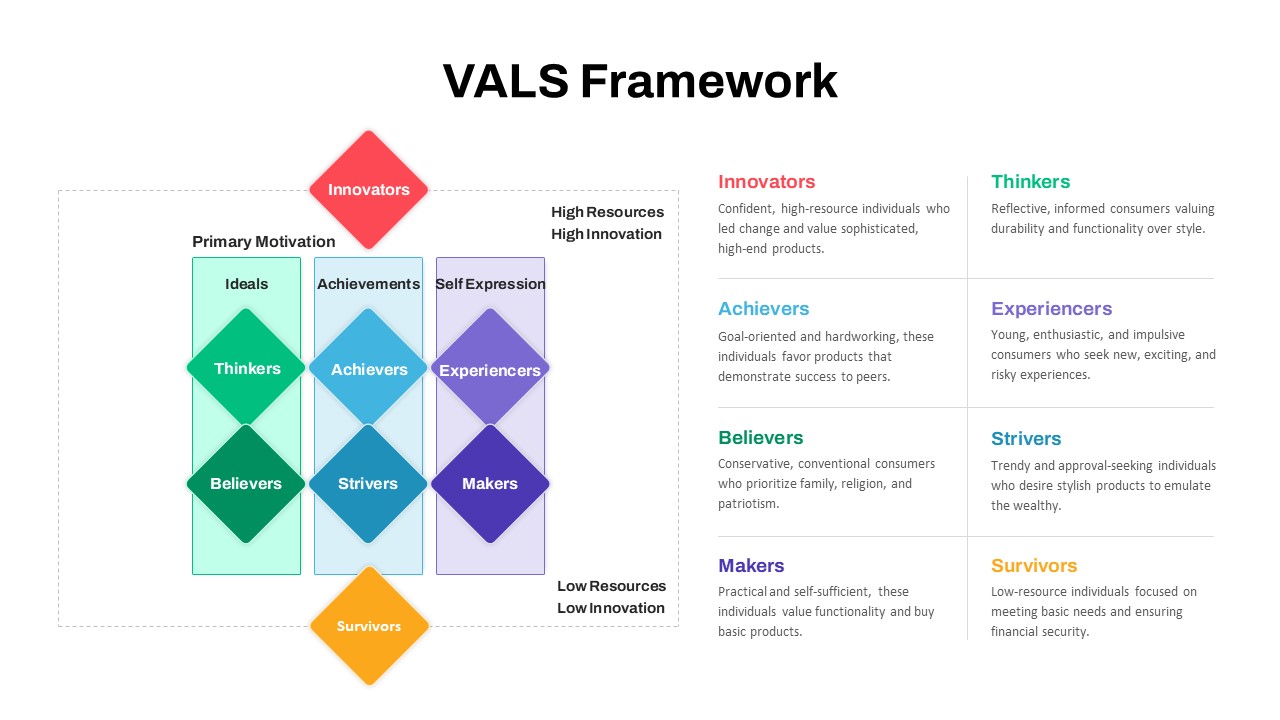
VALS Segmentation Framework Diagram Template for PowerPoint & Google Slides
Marketing
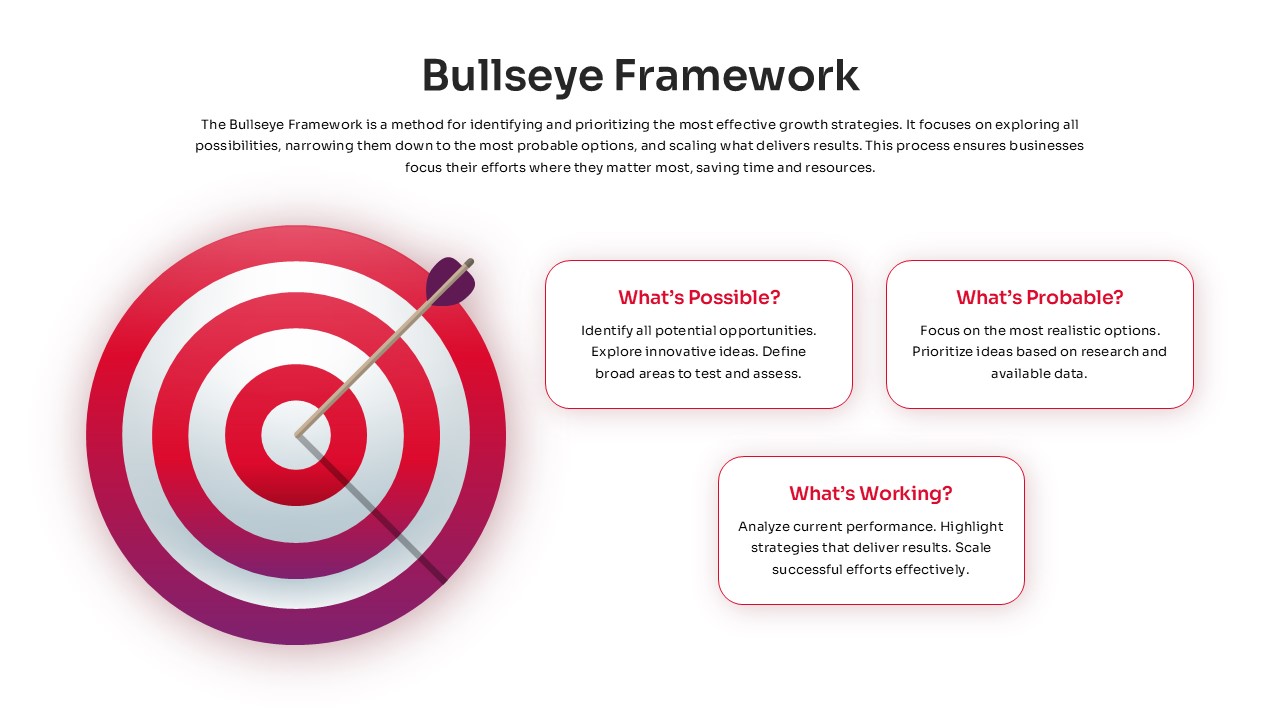
Bullseye Framework Growth Strategy Template for PowerPoint & Google Slides
Business Strategy
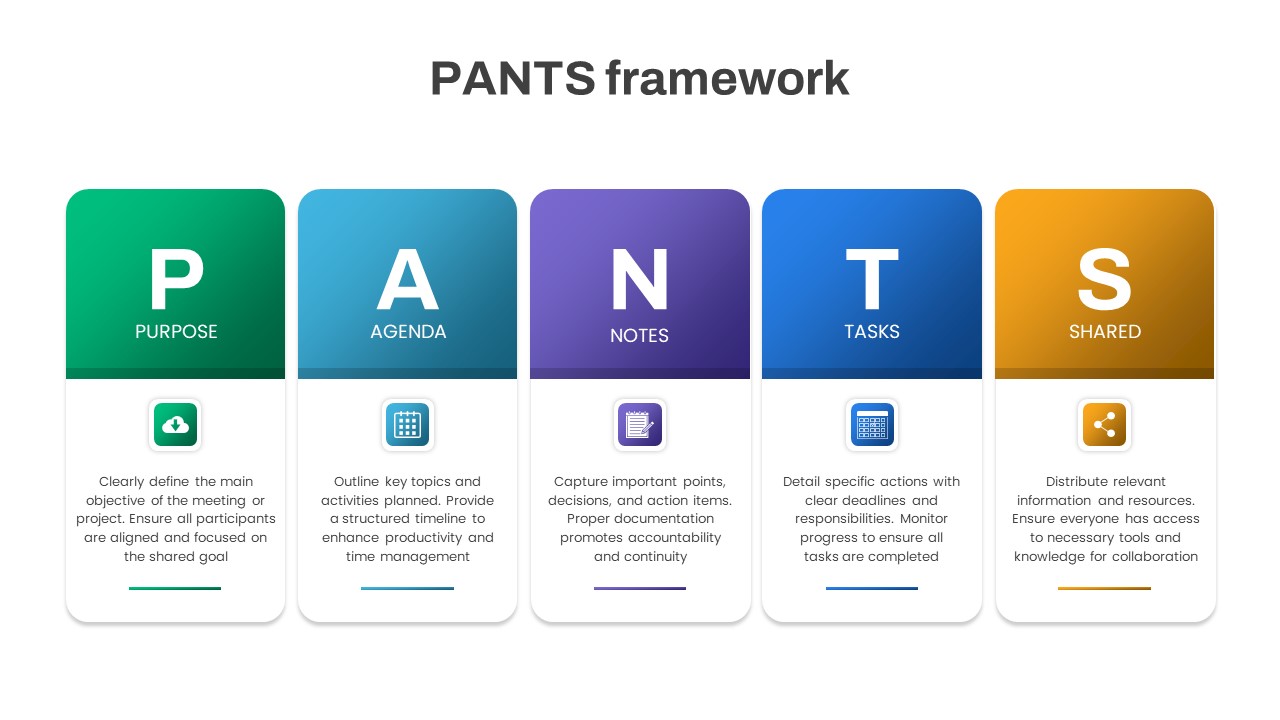
PANTS Framework for Effective Meetings Template for PowerPoint & Google Slides
Process
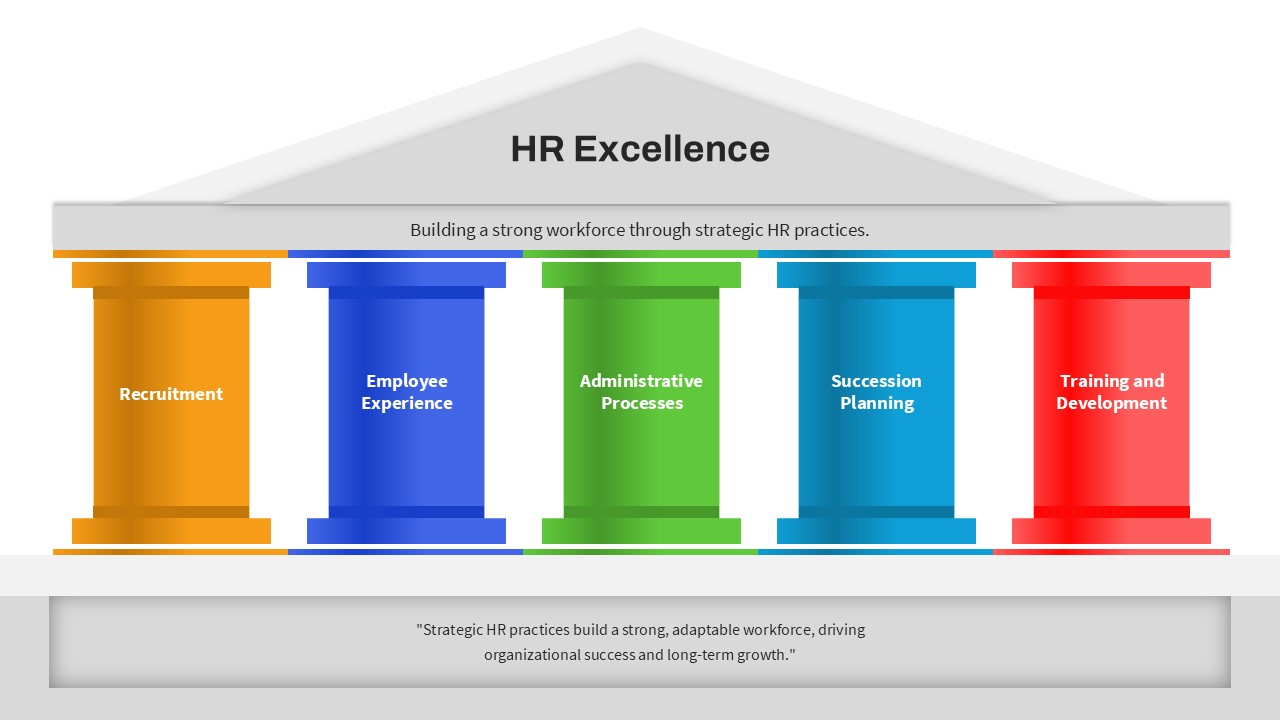
HR Excellence Five Pillar Framework Template for PowerPoint & Google Slides
Business Models
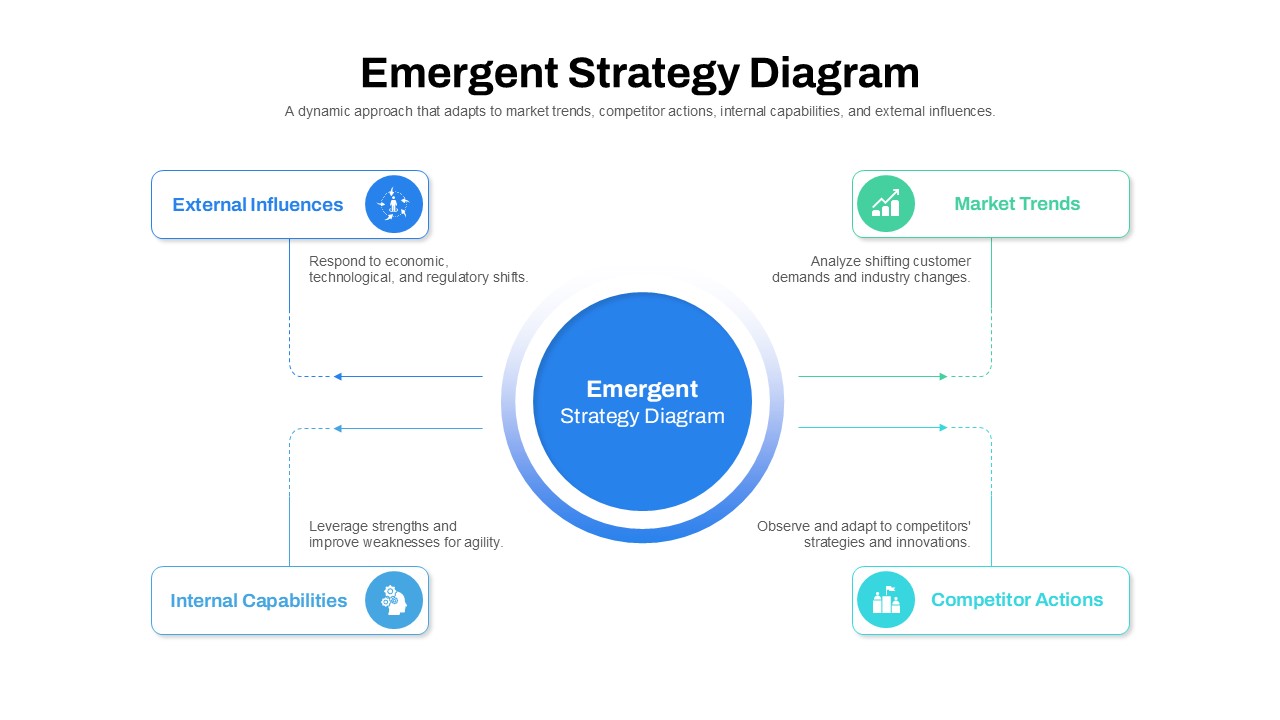
Emergent Strategy Diagram Framework Template for PowerPoint & Google Slides
Process
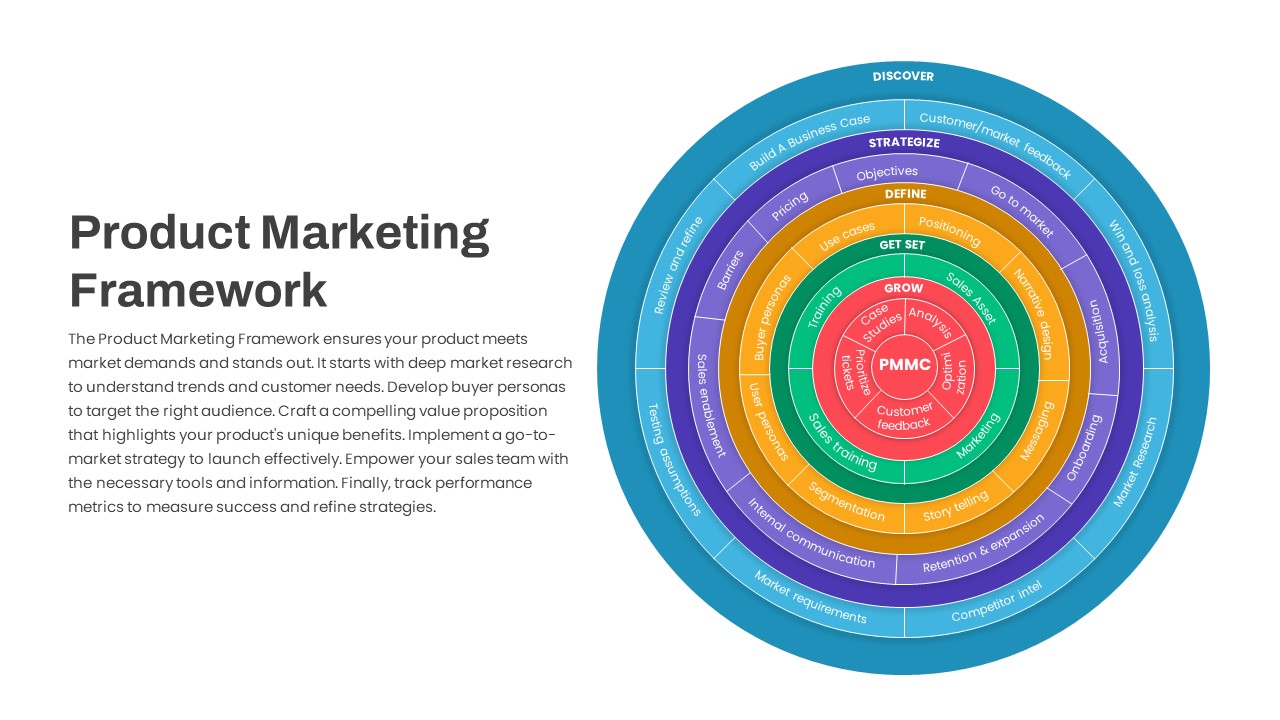
Product Marketing Framework Circular Template for PowerPoint & Google Slides
Circular
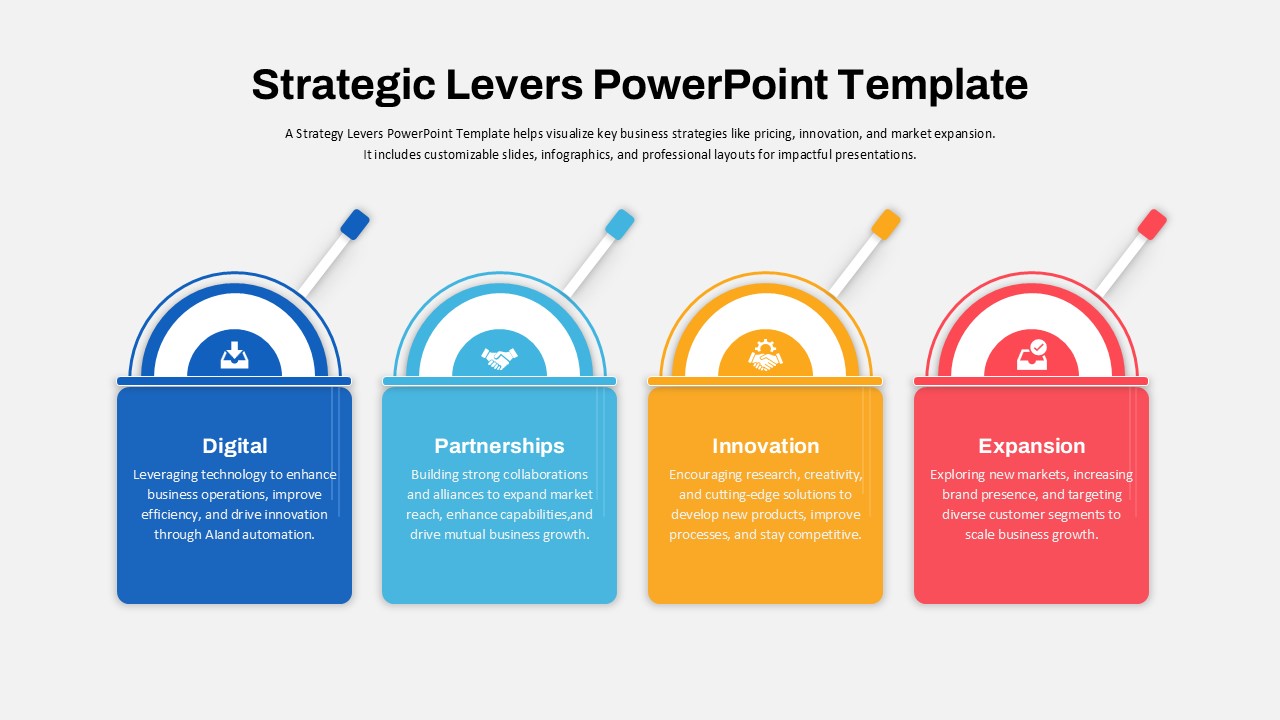
Strategic Levers Business Framework Template for PowerPoint & Google Slides
Business Strategy
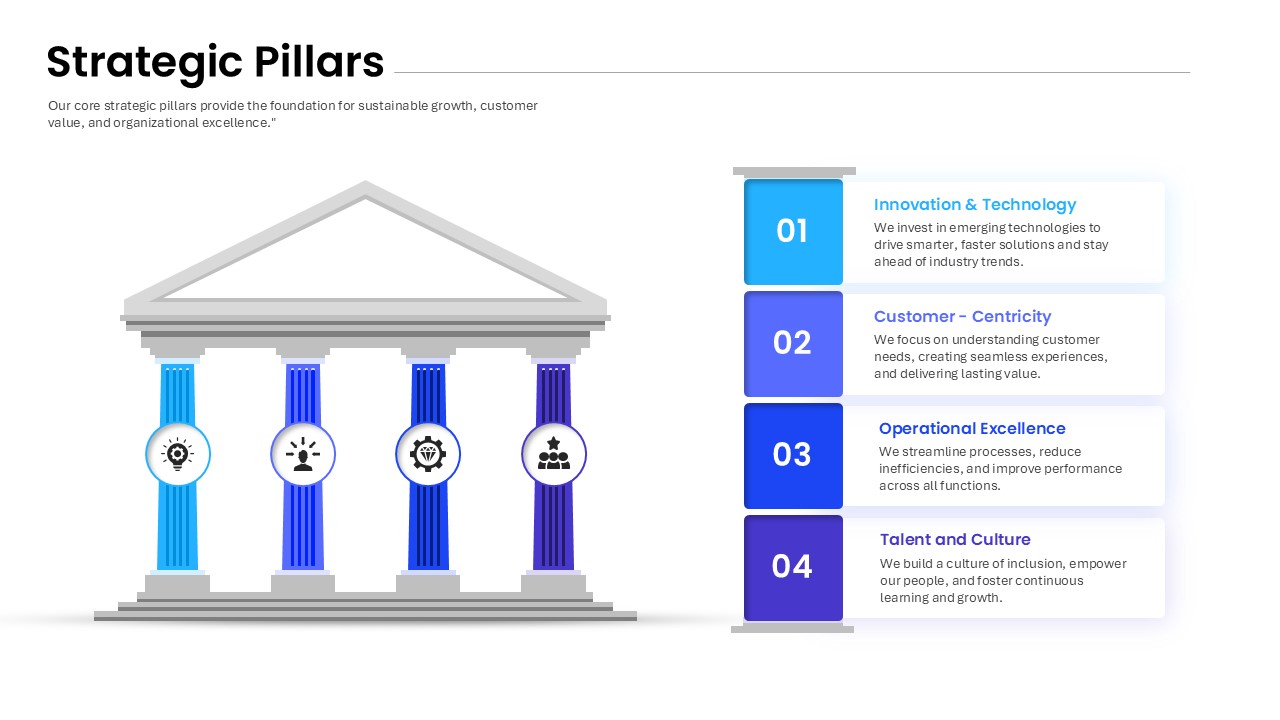
Strategic Pillars Foundation Framework Template for PowerPoint & Google Slides
Business Strategy
Personal Branding Canvas Framework Template for PowerPoint & Google Slides
Circular
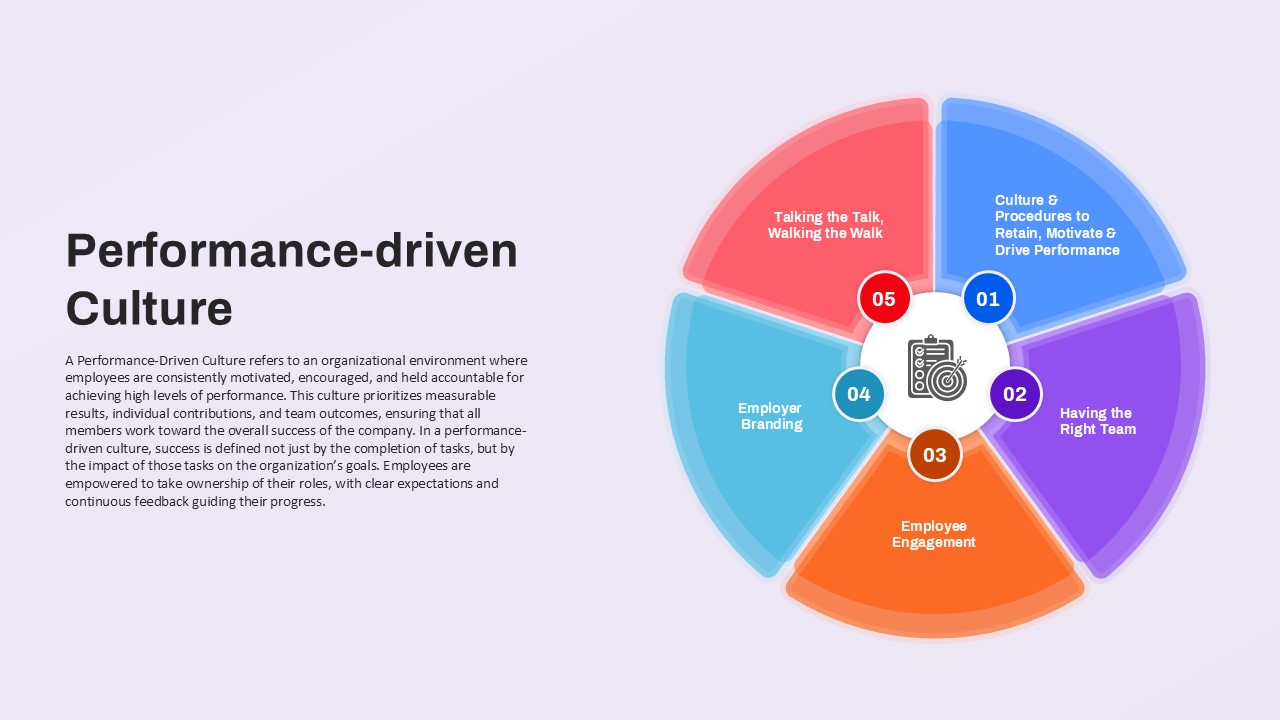
Performance-driven Culture framework template for PowerPoint & Google Slides
Leadership
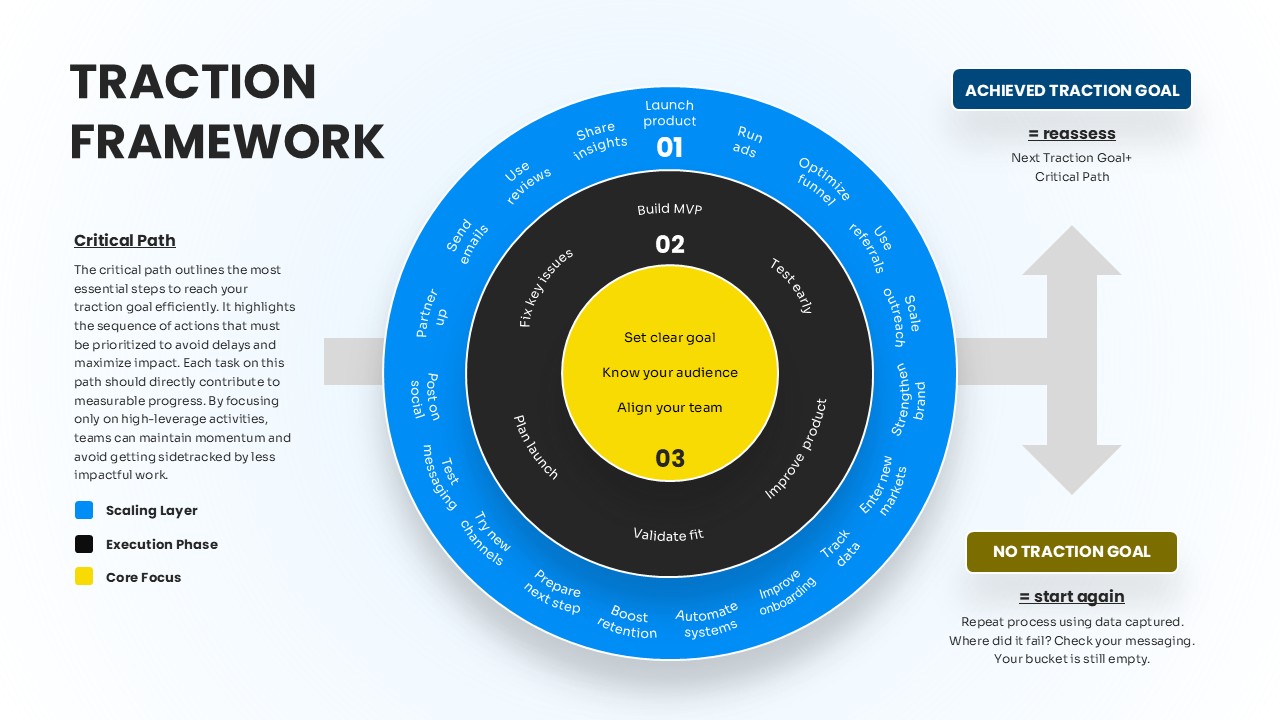
Concentric Traction Framework Diagram Template for PowerPoint & Google Slides
Process
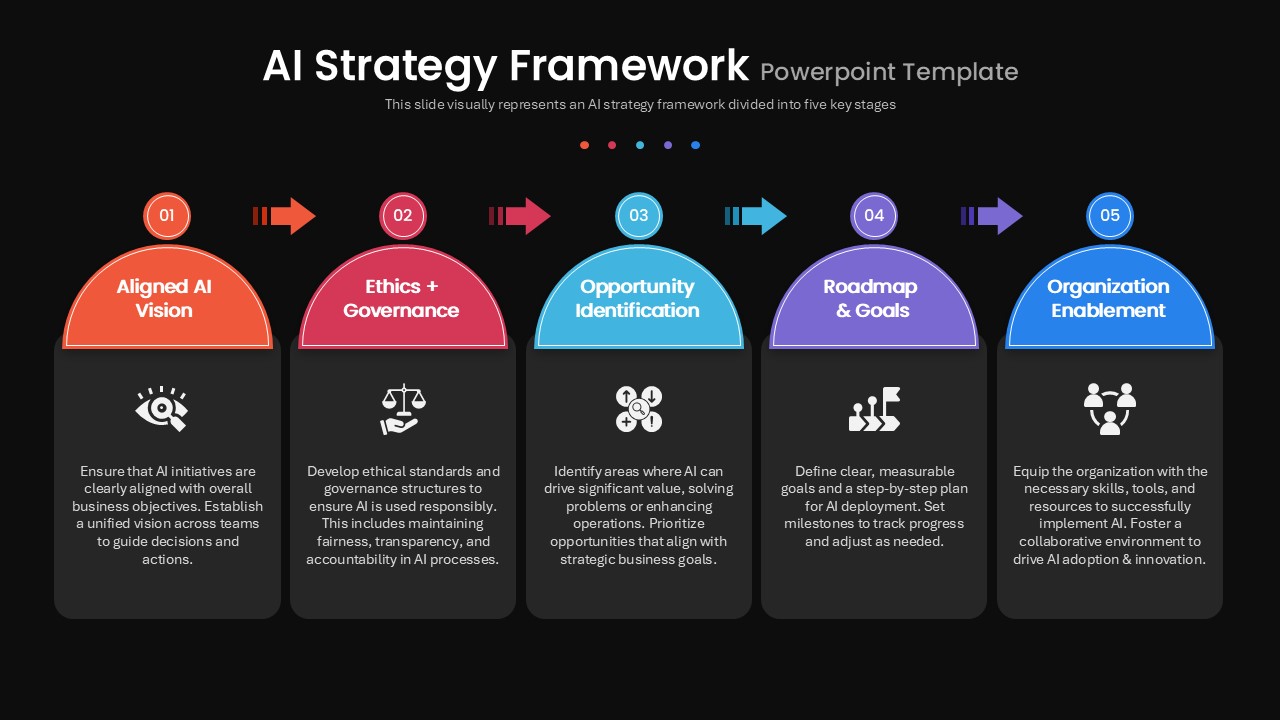
AI Strategy Framework Template for PowerPoint & Google Slides
Business Strategy
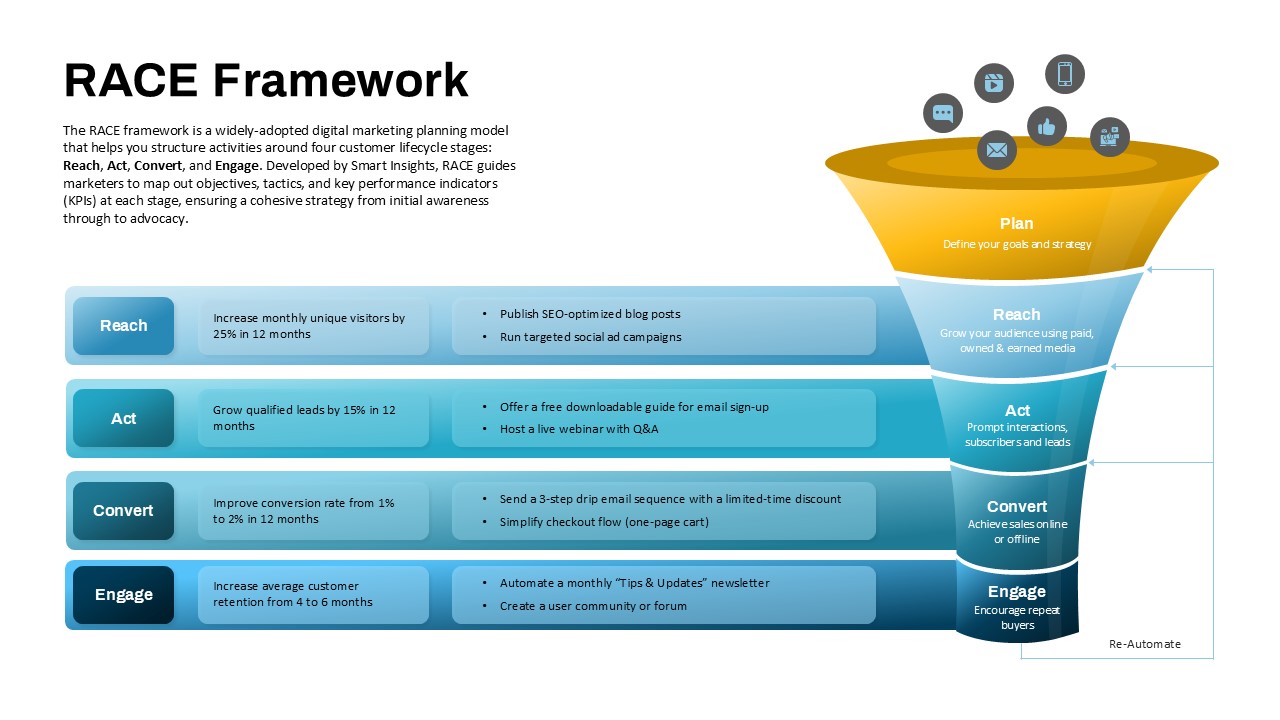
RACE Framework for Digital Marketing Strategy template for PowerPoint & Google Slides
Funnel
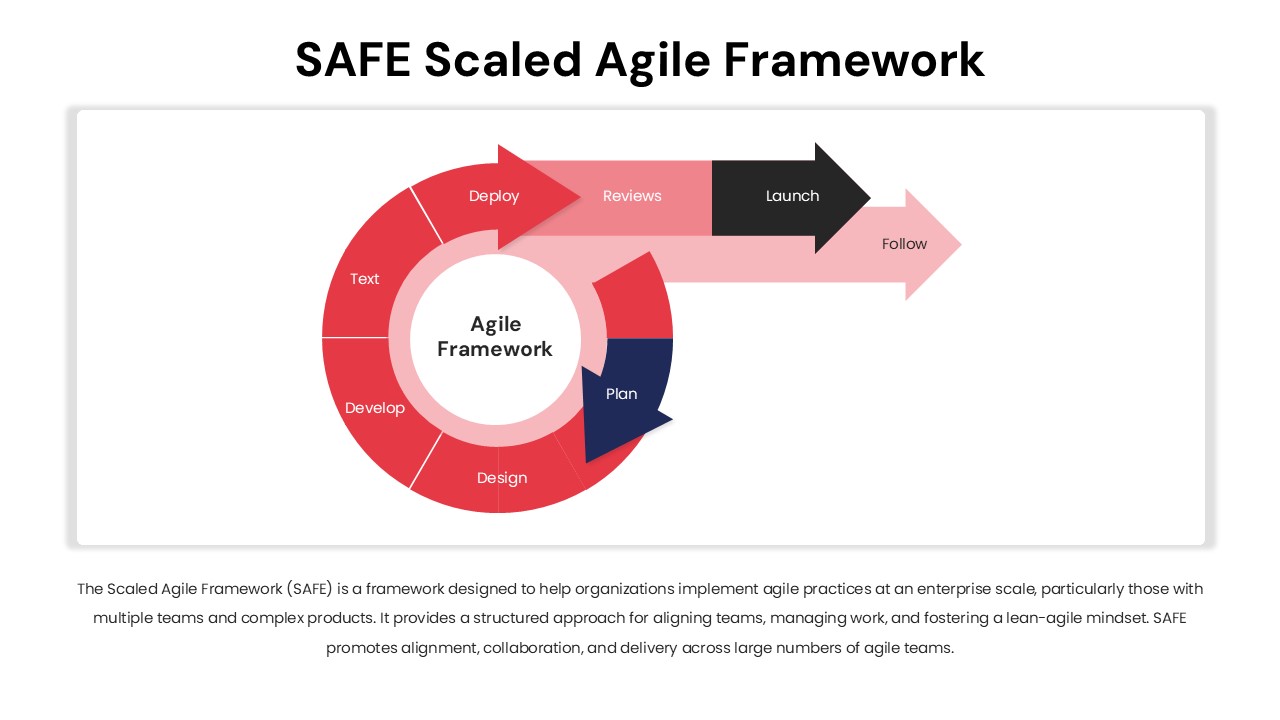
SAFE Scaled Agile Framework Template for PowerPoint & Google Slides
Process
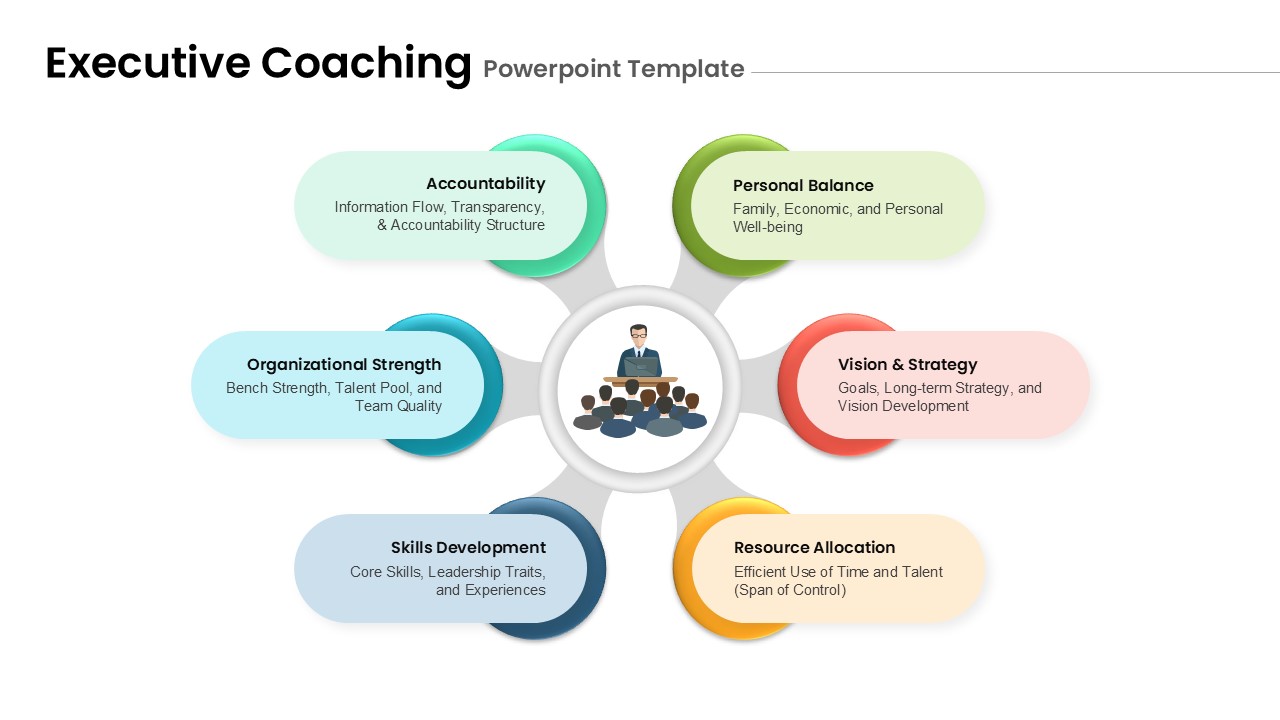
Executive Coaching Framework template for PowerPoint & Google Slides
Leadership
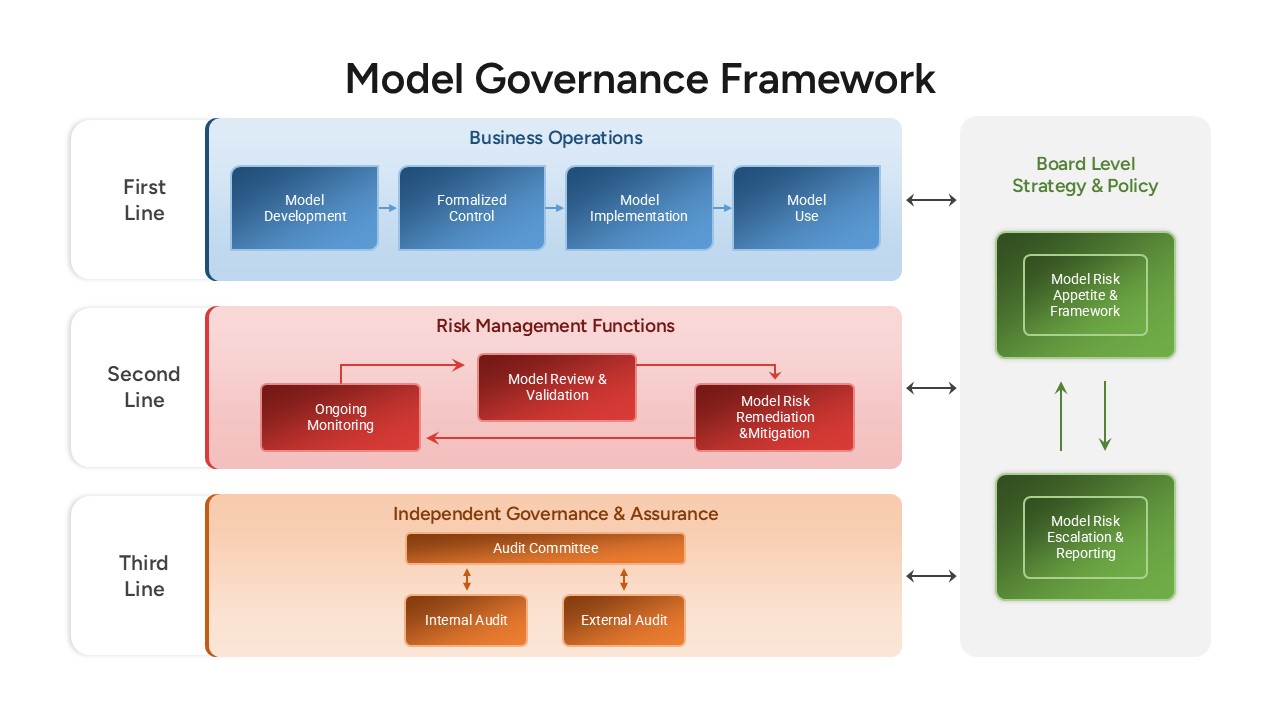
Model Governance Framework Template for PowerPoint & Google Slides
Risk Management
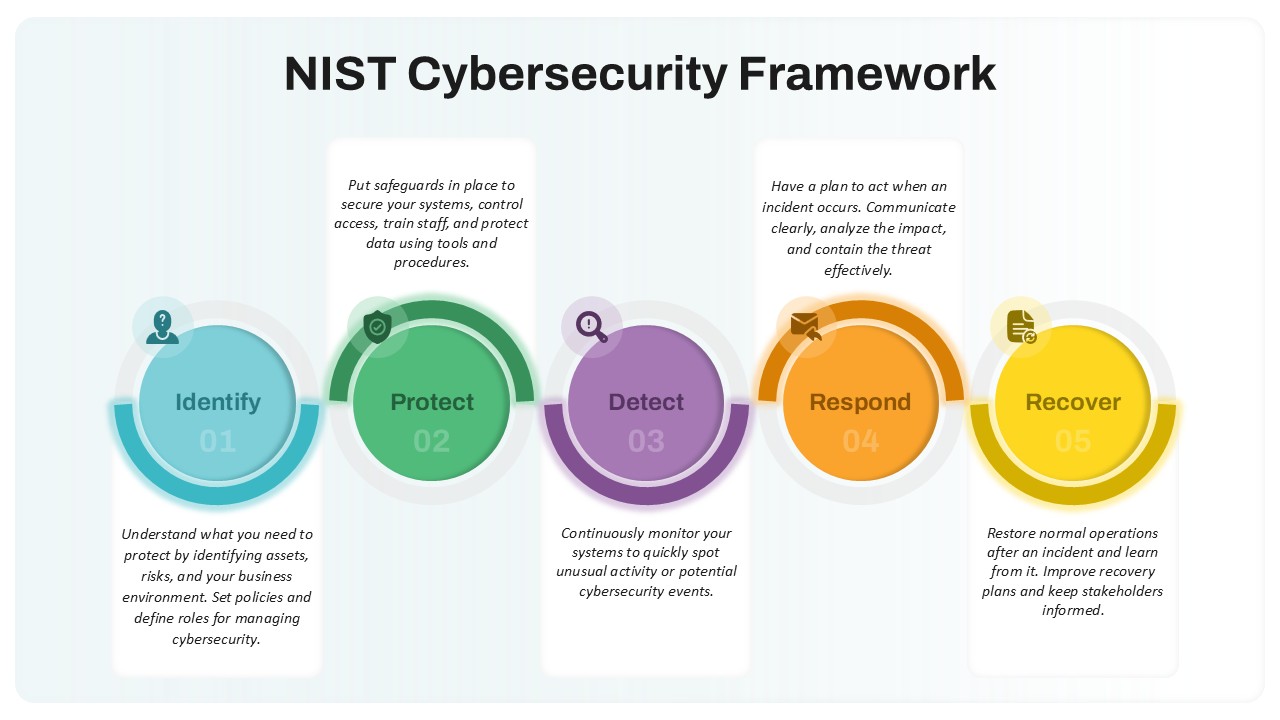
NIST Cybersecurity Framework Overview template for PowerPoint & Google Slides
Technology
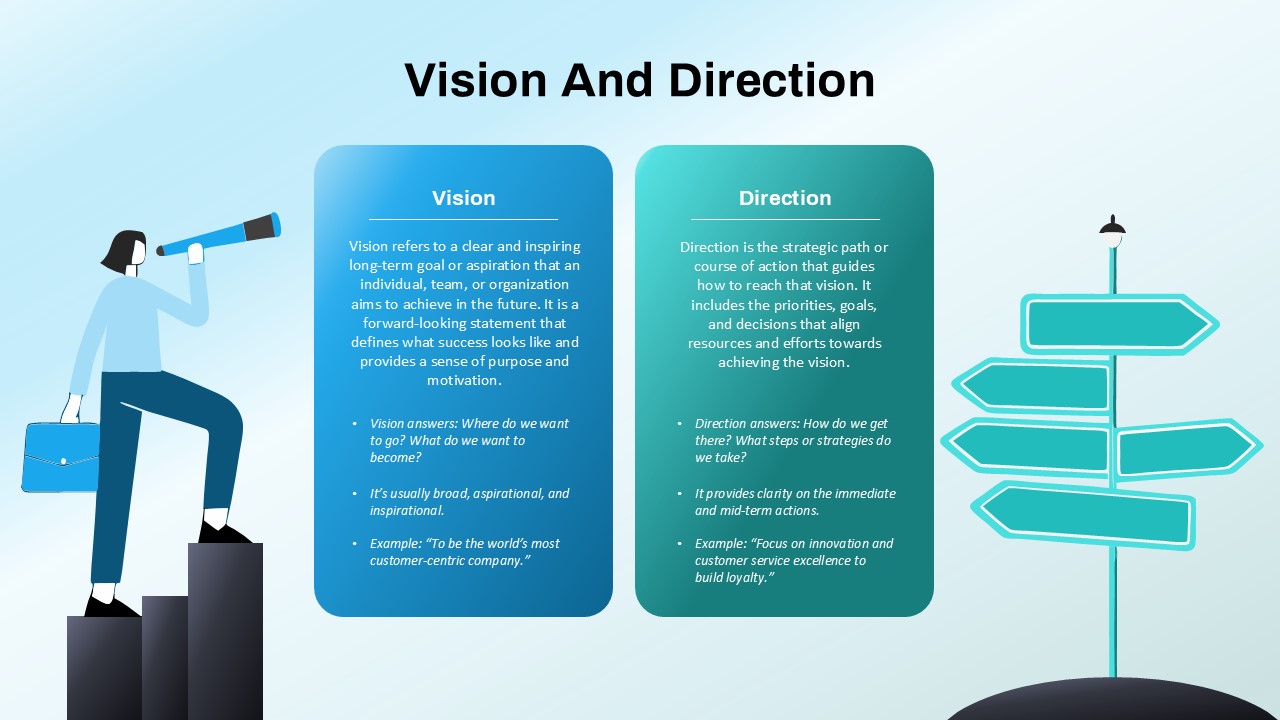
Vision and Direction Framework template for PowerPoint & Google Slides
Business
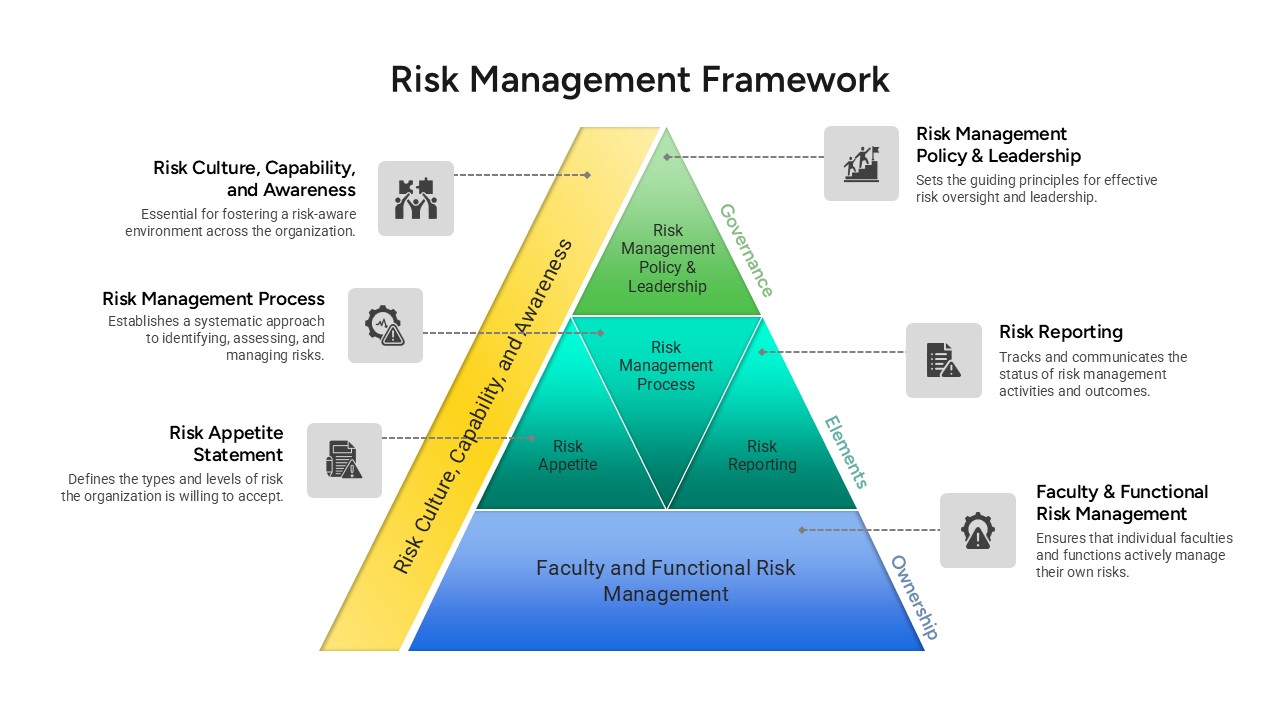
Risk Management Framework Pyramid Template for PowerPoint & Google Slides
Risk Management
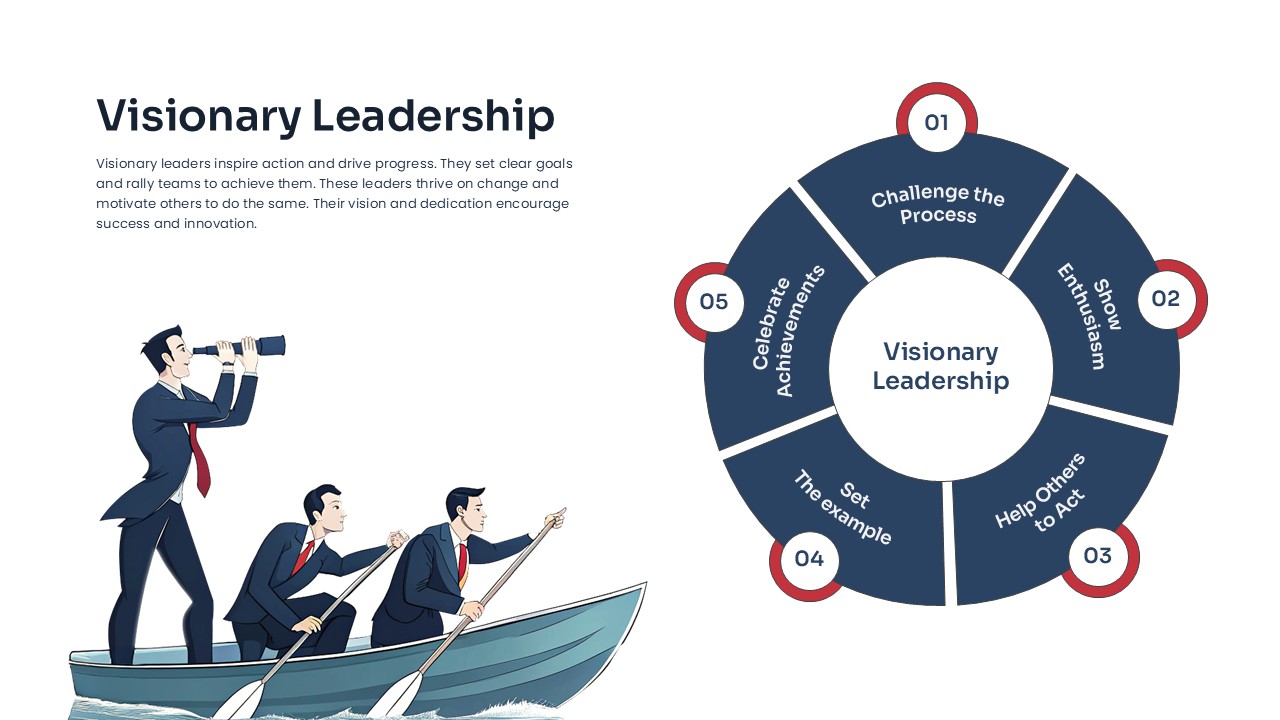
Visionary Leadership Framework template for PowerPoint & Google Slides
Business

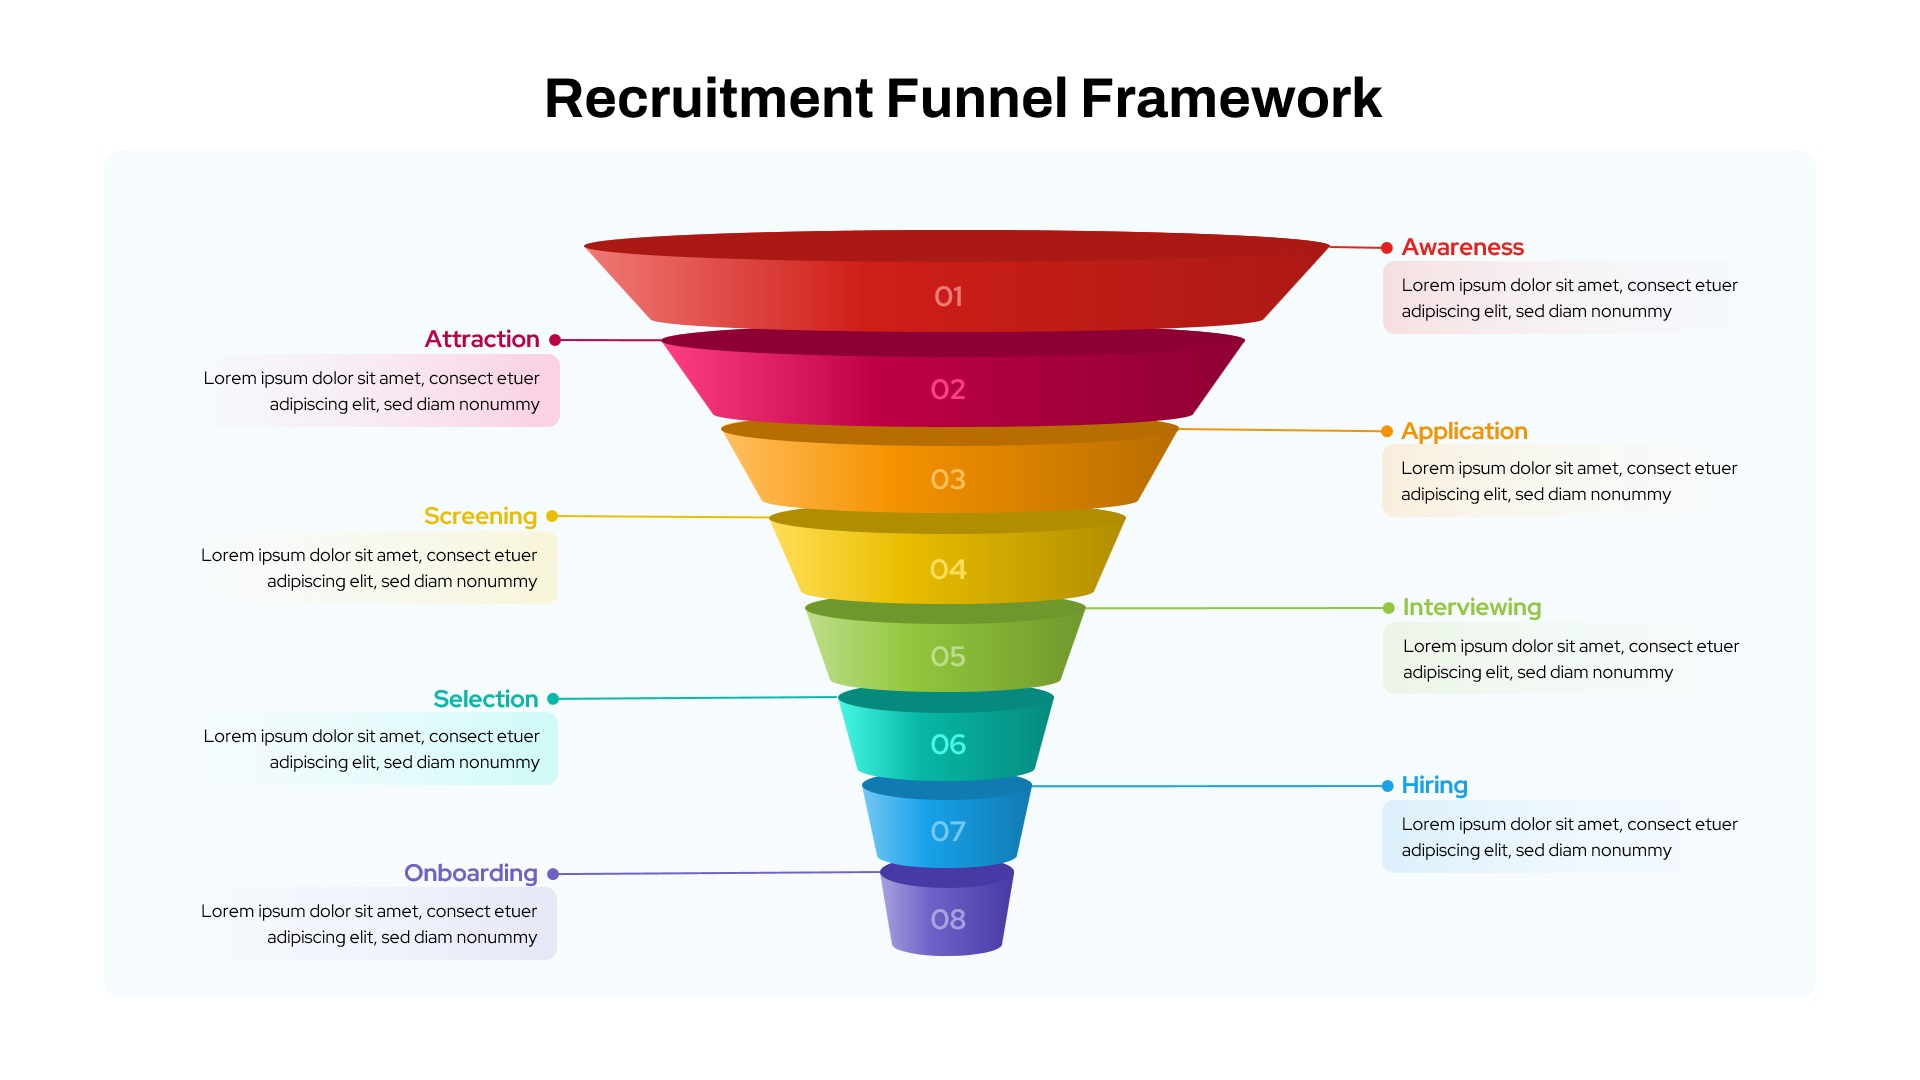
Recruitment Funnel Framework template for PowerPoint & Google Slides
Recruitment
Pirate Metrics AARRR Funnel Framework Template for PowerPoint & Google Slides
Funnel
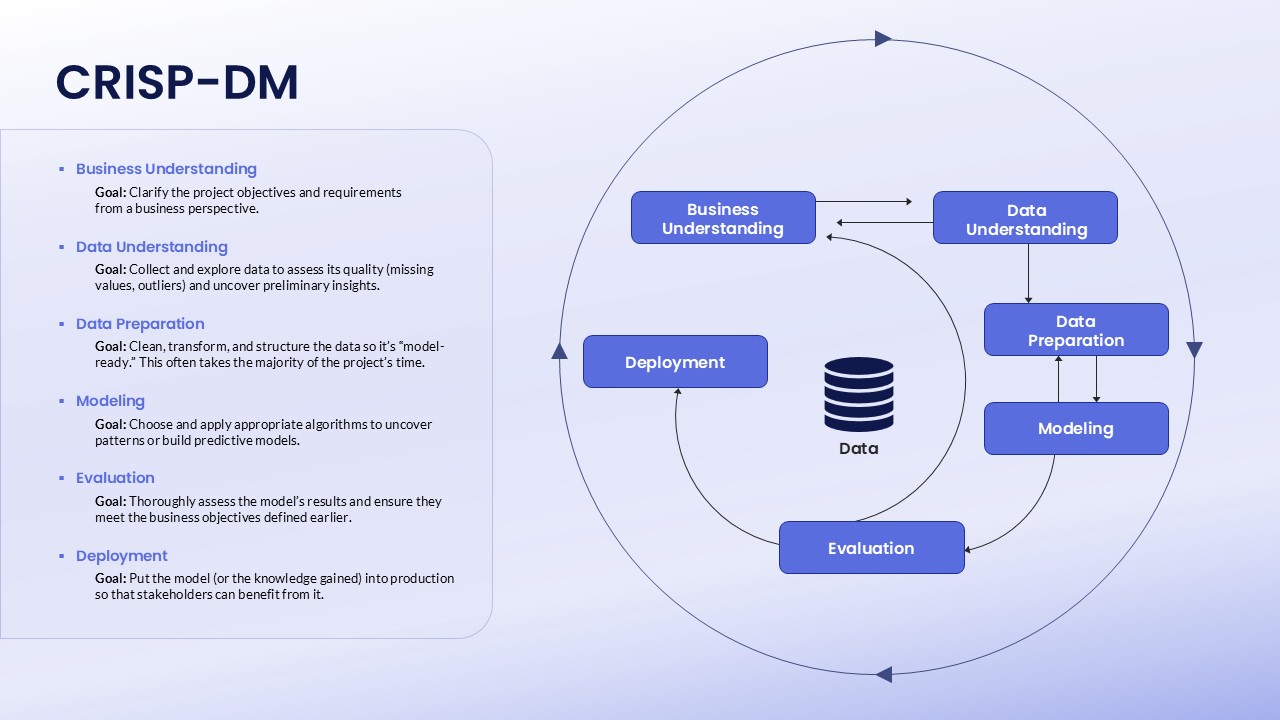
CRISP-DM Process Framework template for PowerPoint & Google Slides
Technology
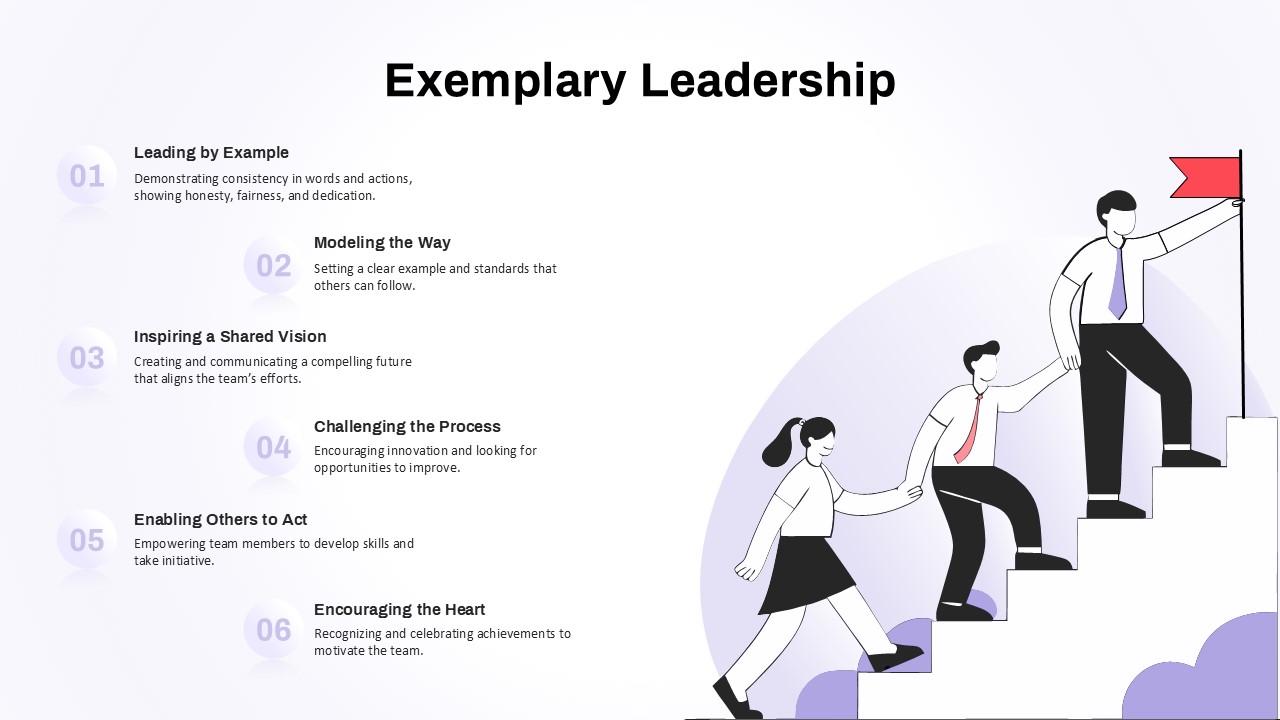
Exemplary Leadership Framework template for PowerPoint & Google Slides
Business
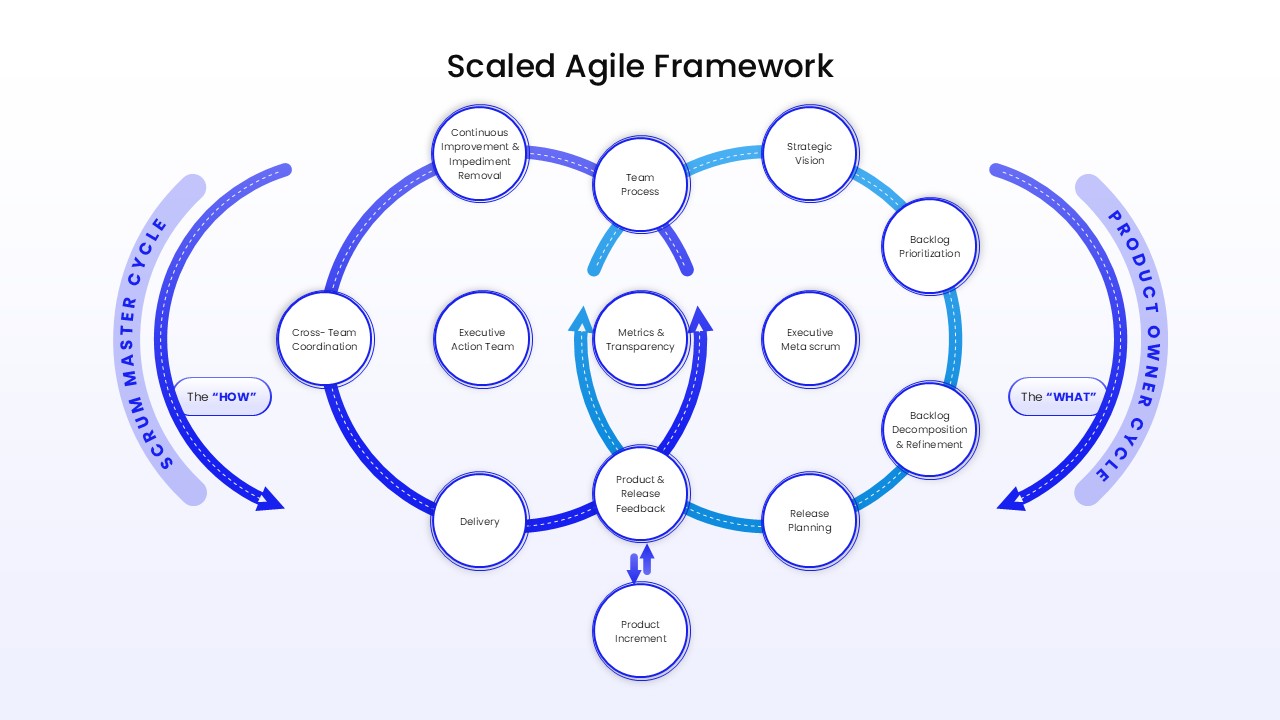
Two-Cycle Scaled Agile Framework Template for PowerPoint & Google Slides
Scrum
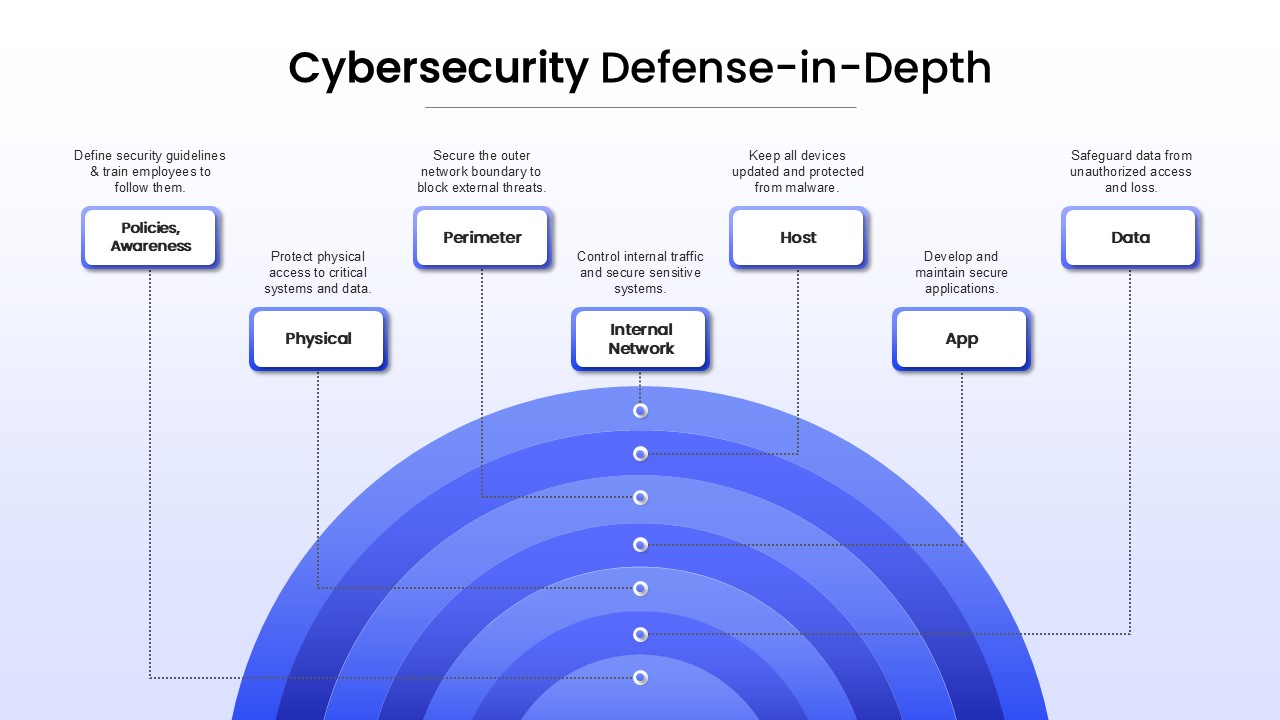
Cybersecurity Defense-in-Depth Framework template for PowerPoint & Google Slides
Technology
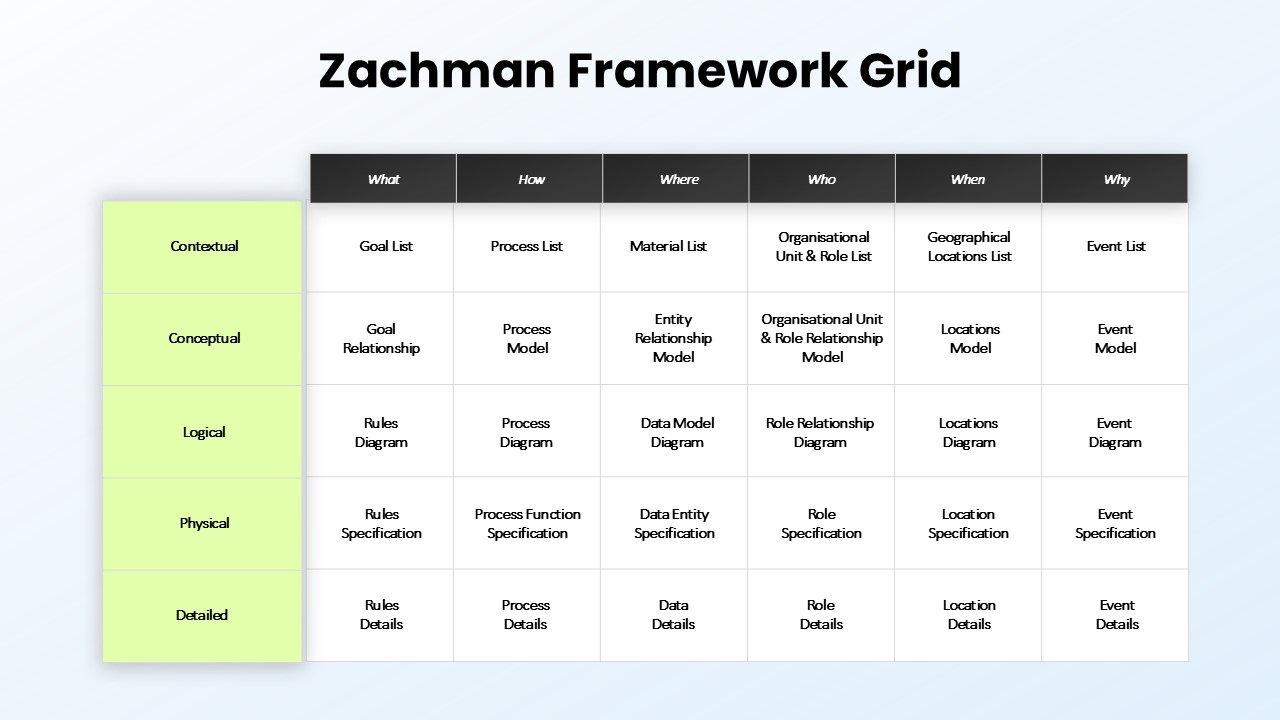
Zachman Framework Grid Overview template for PowerPoint & Google Slides
Process
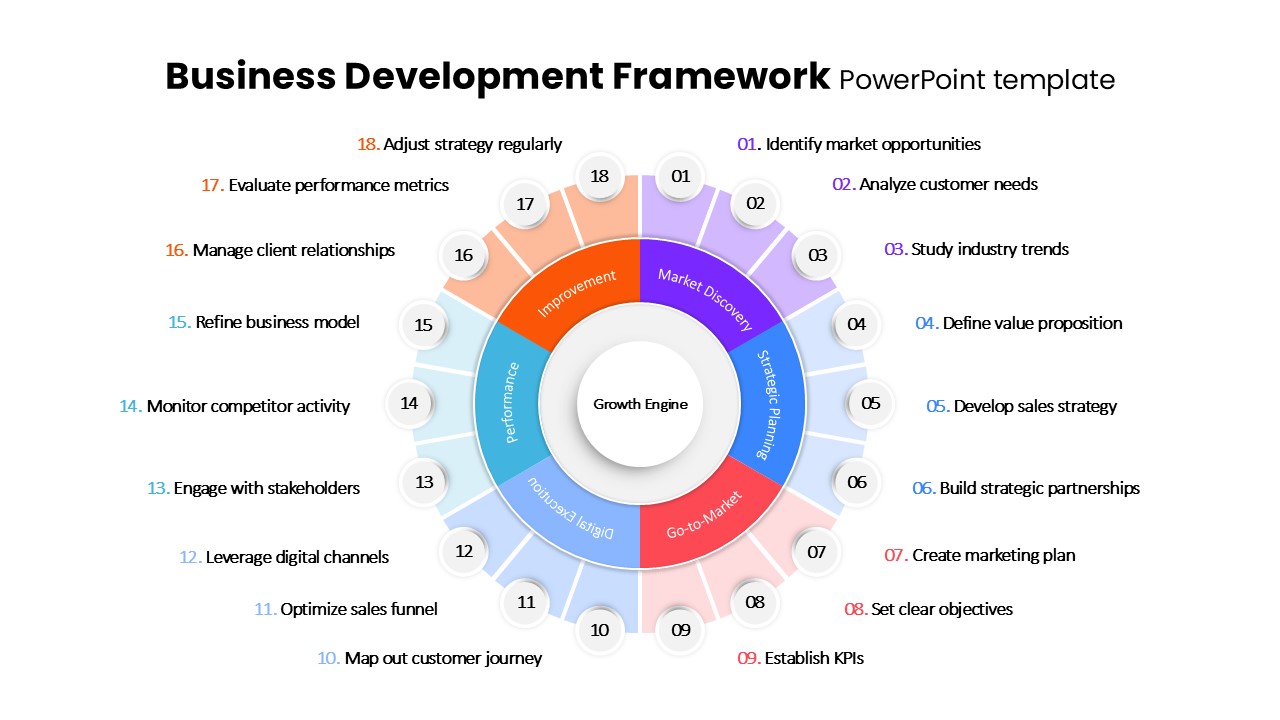
Business Development Framework Pack Template for PowerPoint & Google Slides
Business Strategy
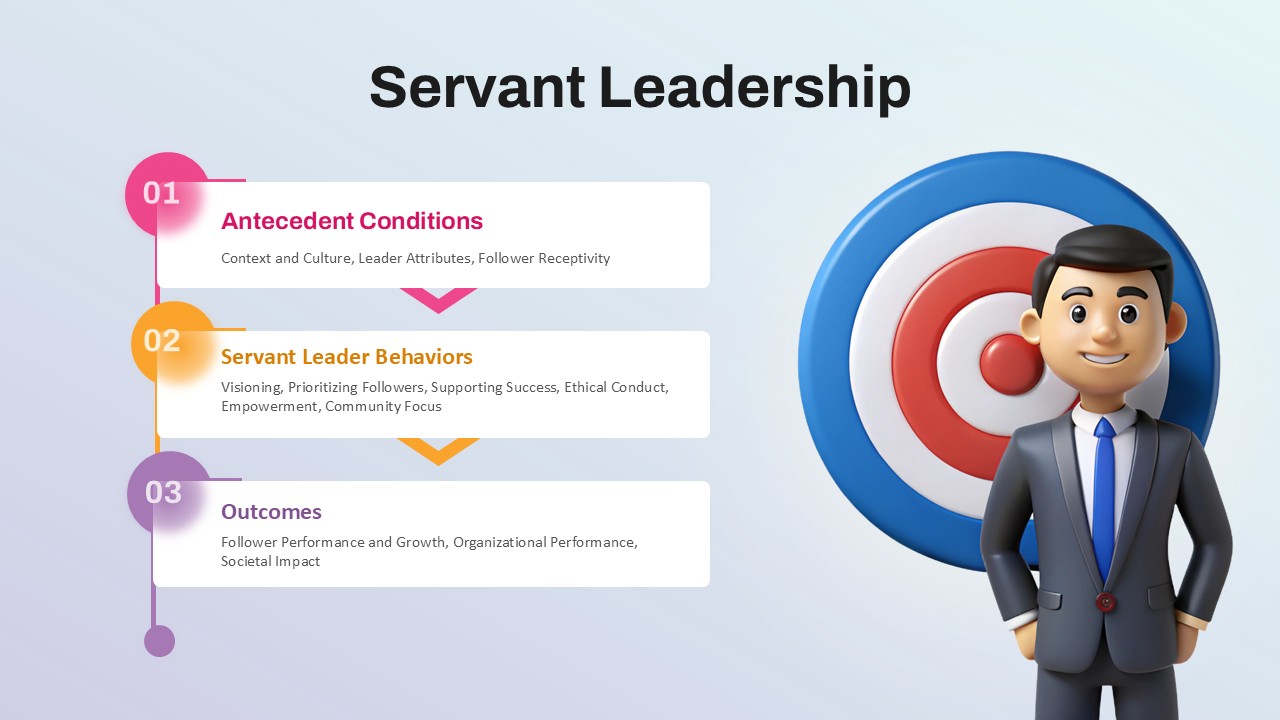
Three-Step Servant Leadership Framework Template for PowerPoint & Google Slides
Leadership
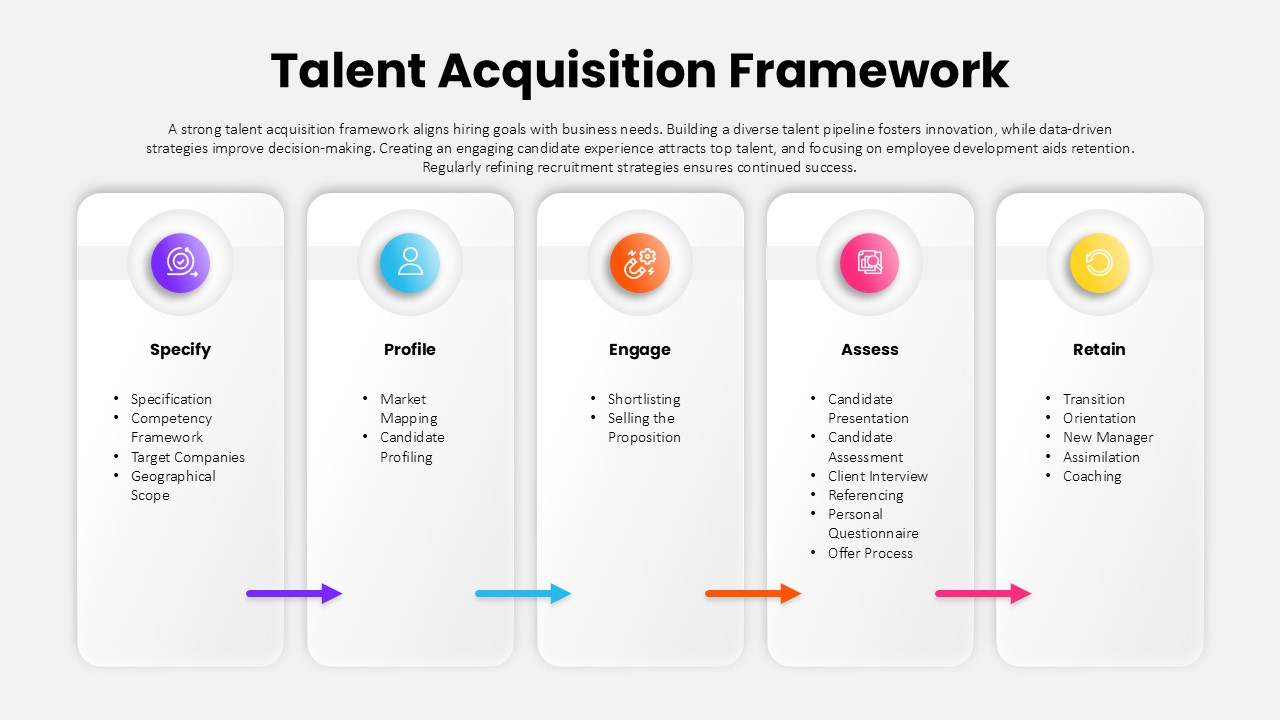
Talent Acquisition Framework Overview template for PowerPoint & Google Slides
Business Strategy
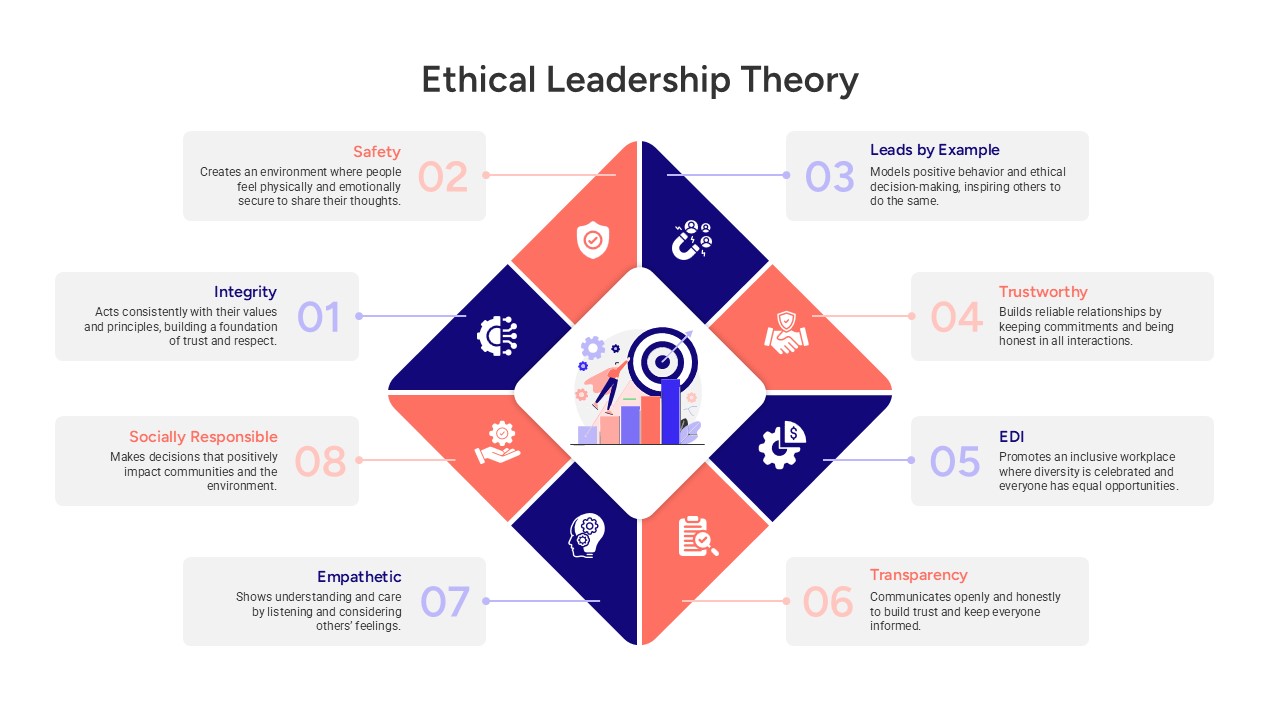
Ethical Leadership Theory Framework Template for PowerPoint & Google Slides
Leadership
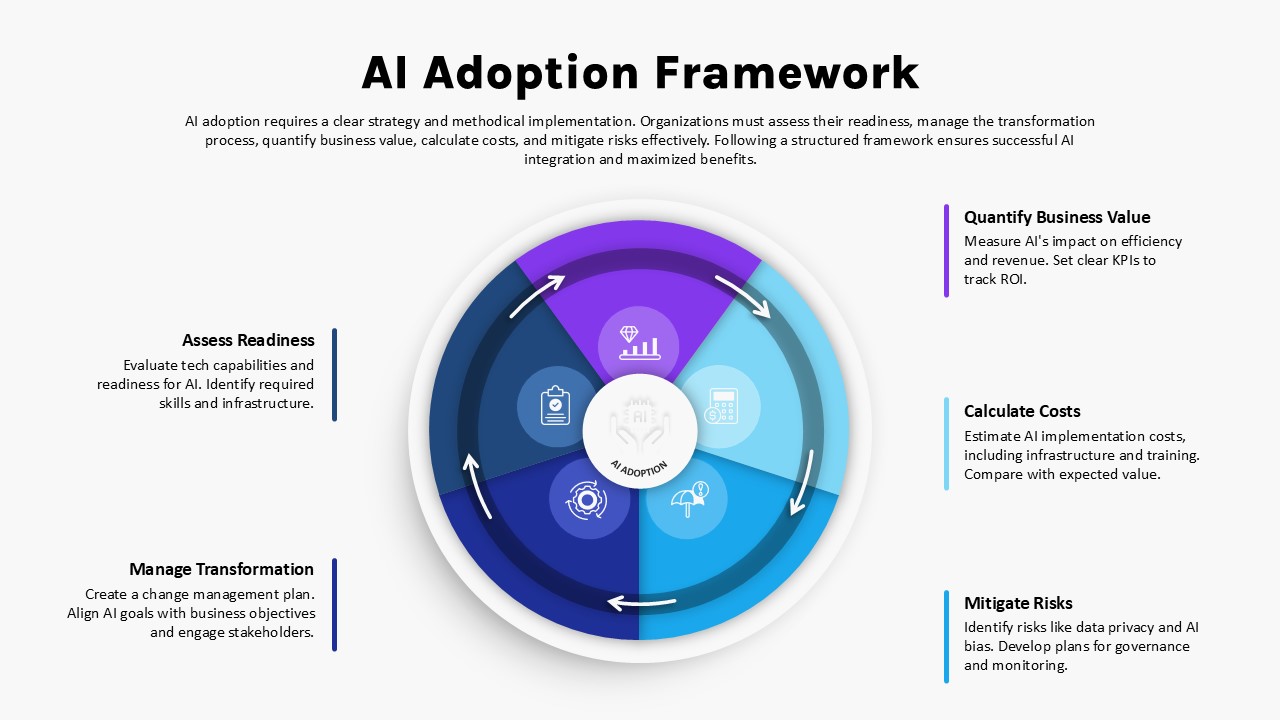
AI Adoption Framework Circular Diagram Template for PowerPoint & Google Slides
AI
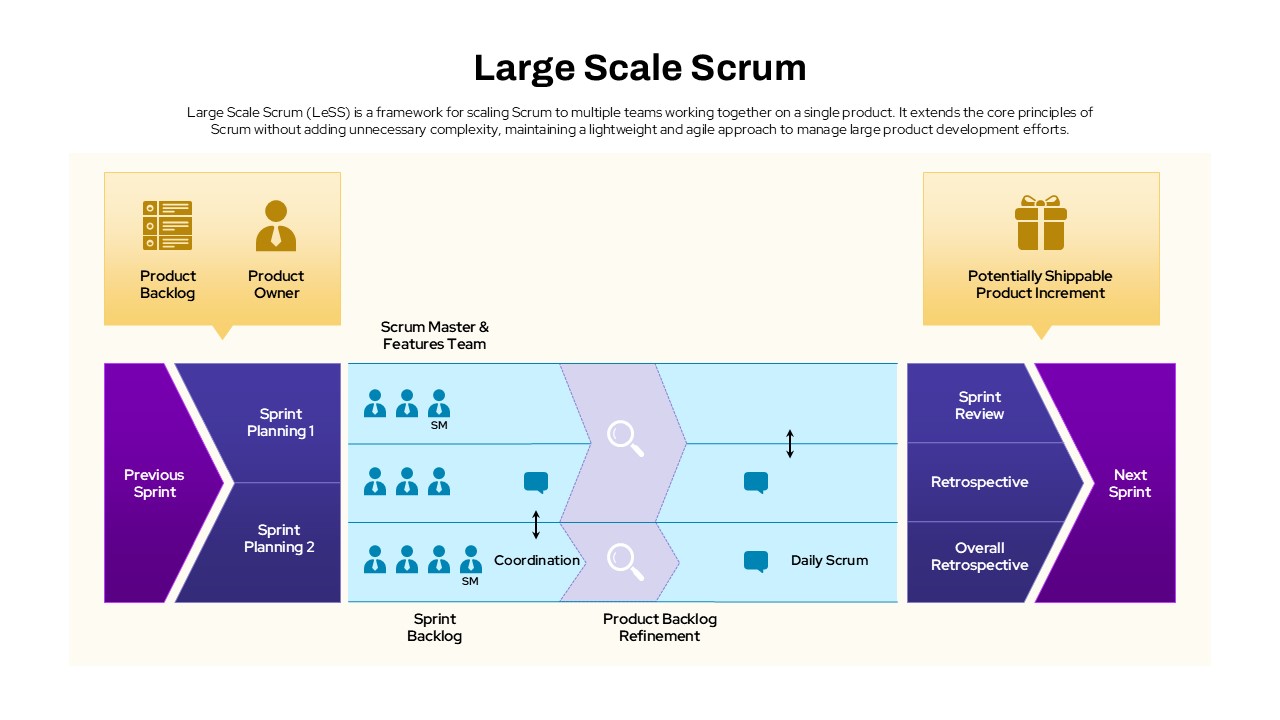
Large Scale Scrum Framework Process Template for PowerPoint & Google Slides
Scrum
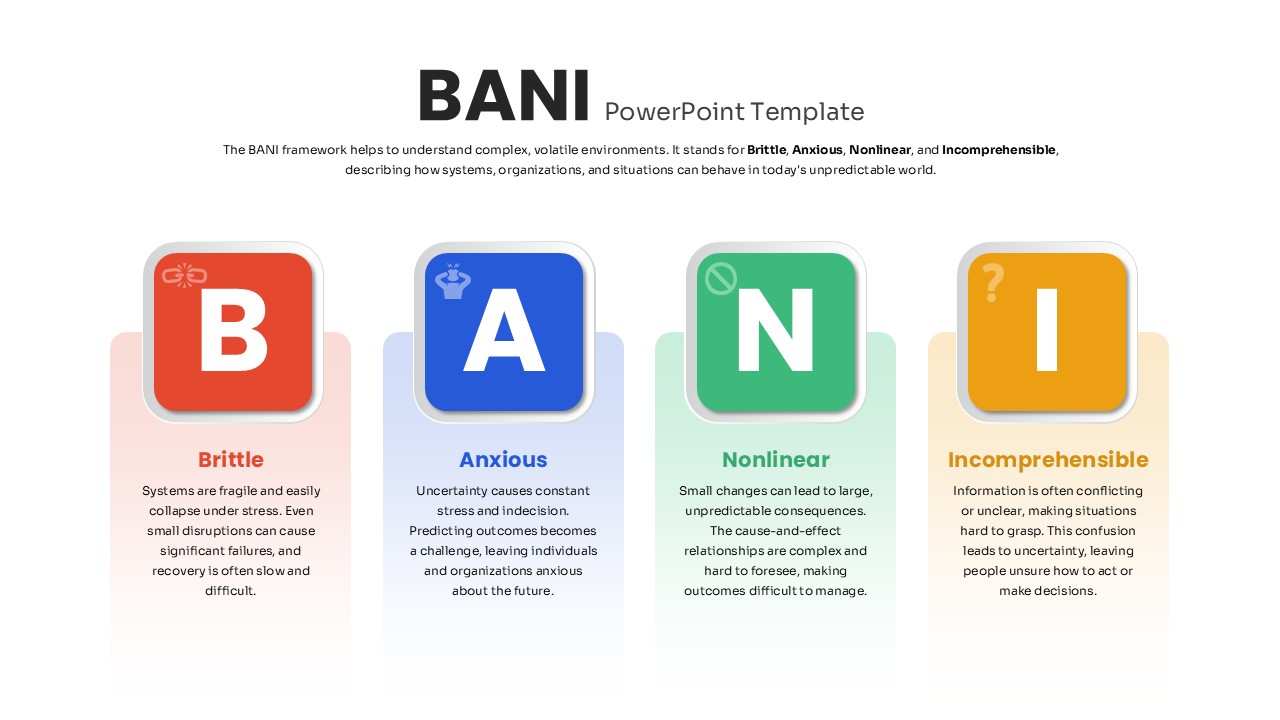
Four-Part BANI Framework Overview Template for PowerPoint & Google Slides
PEST
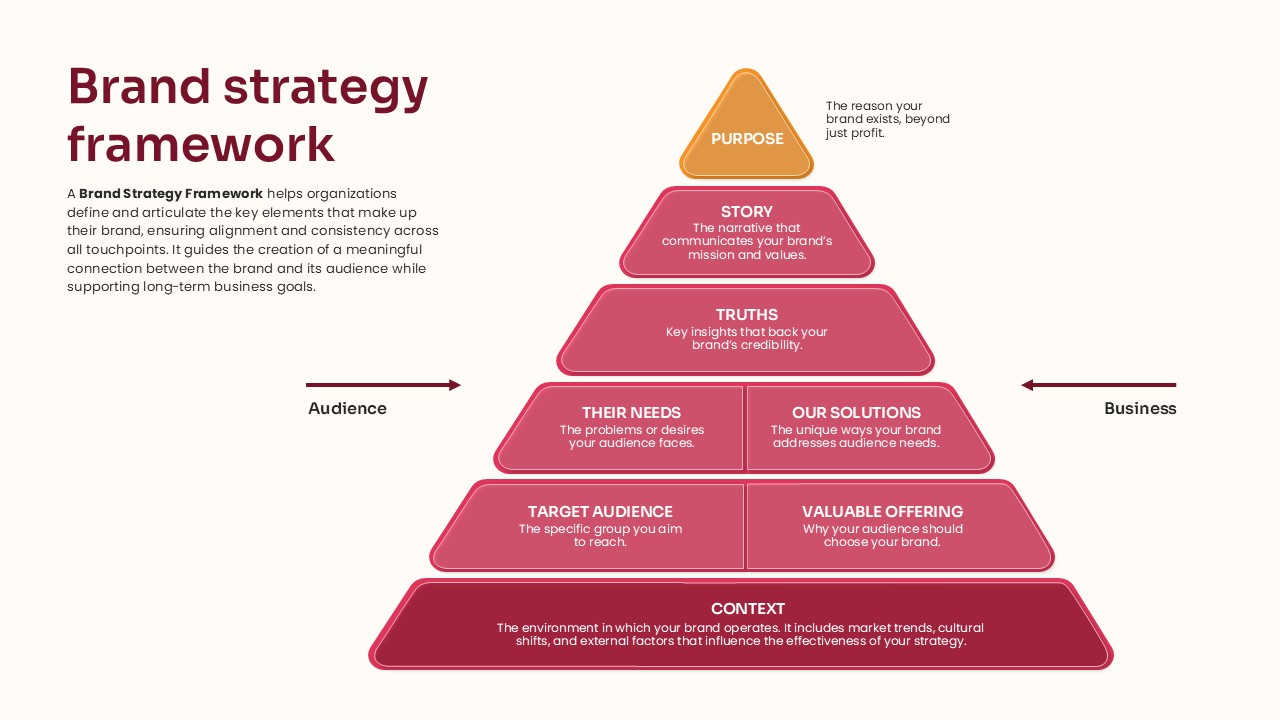
Pyramid Brand Strategy Framework Template for PowerPoint & Google Slides
Business Strategy
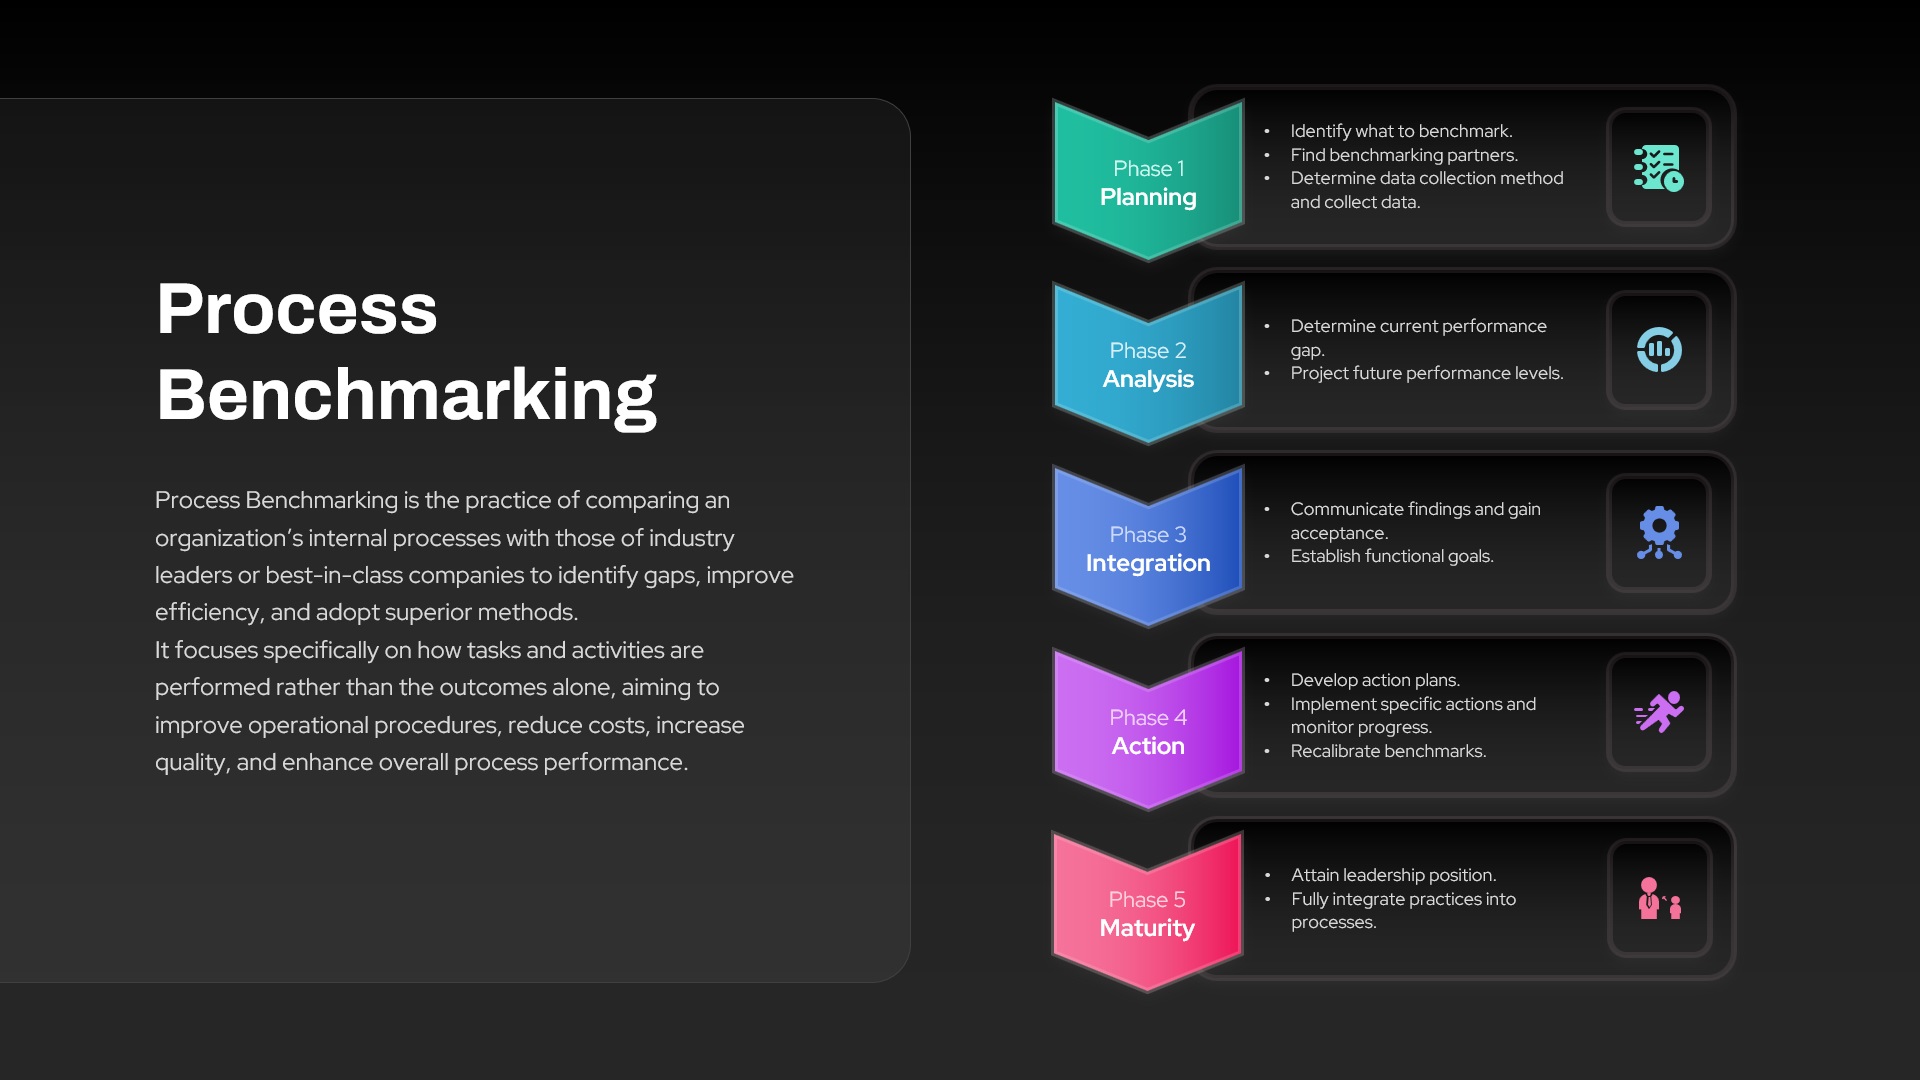
Process Benchmarking Five-Phase Framework Template for PowerPoint & Google Slides
Process
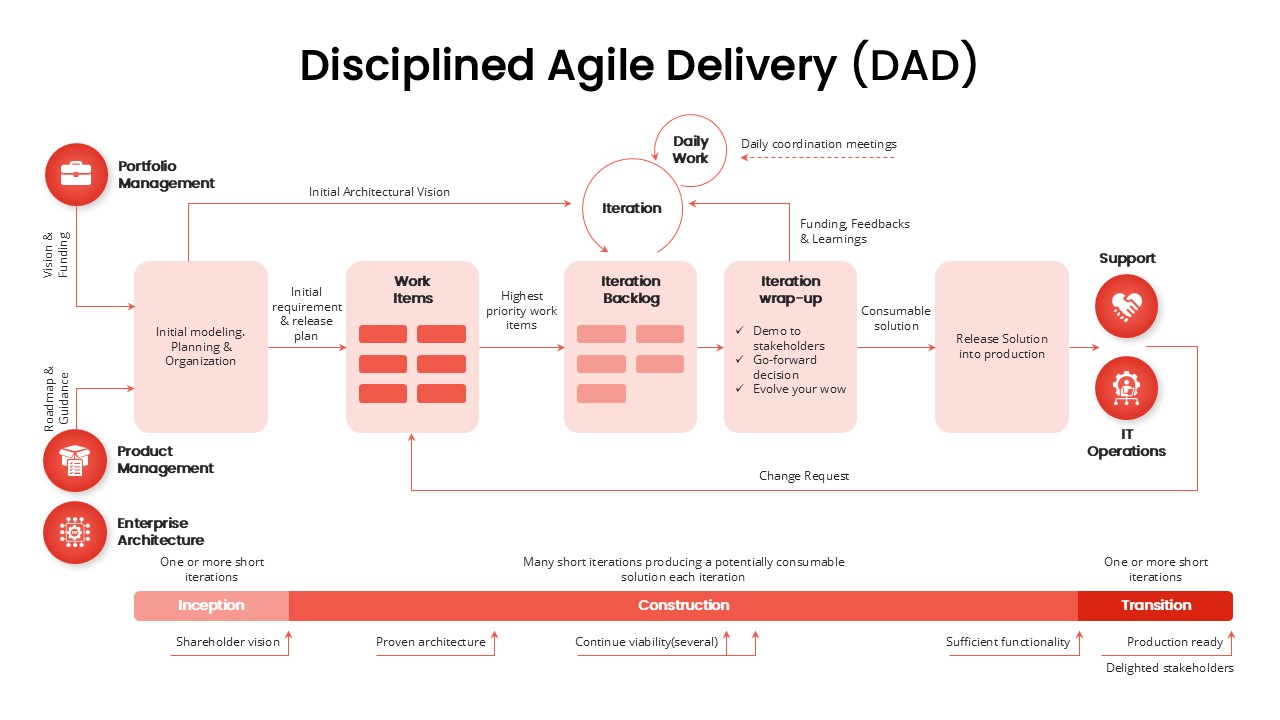
Disciplined Agile Delivery (DAD) Framework template for PowerPoint & Google Slides
Business Strategy
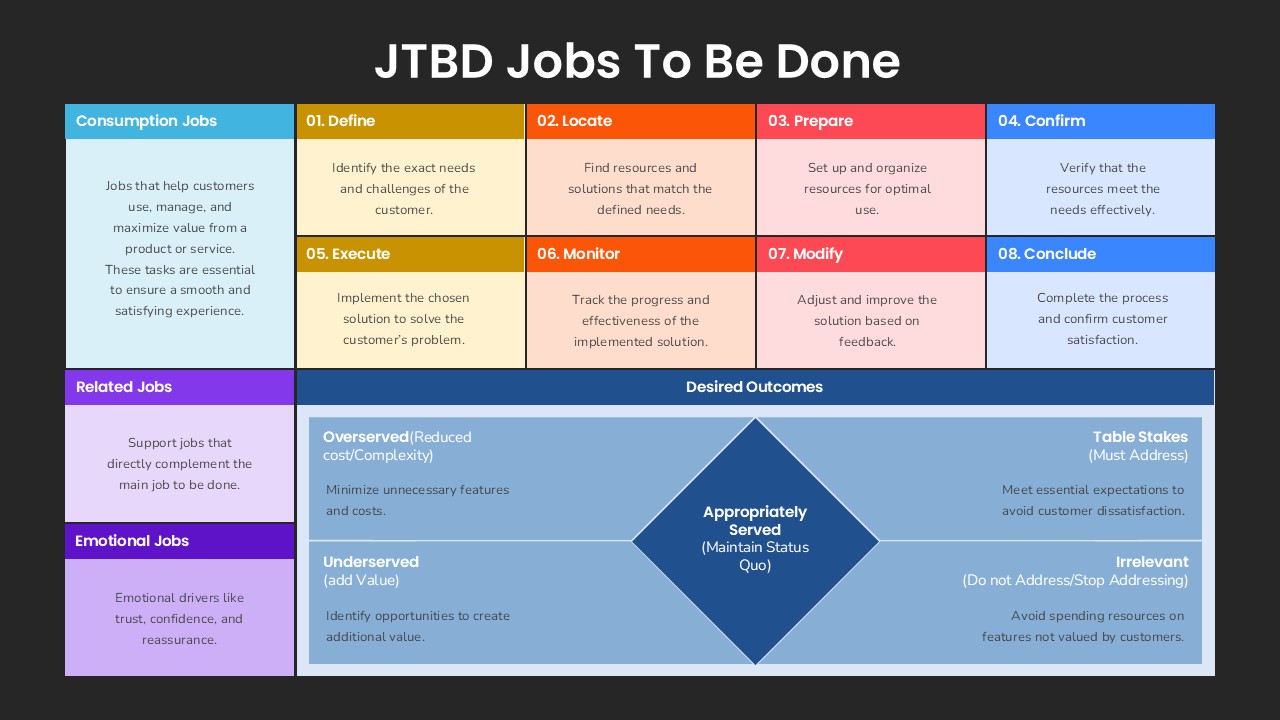
JTBD Jobs To Be Done Outcomes Framework Template for PowerPoint & Google Slides
Process
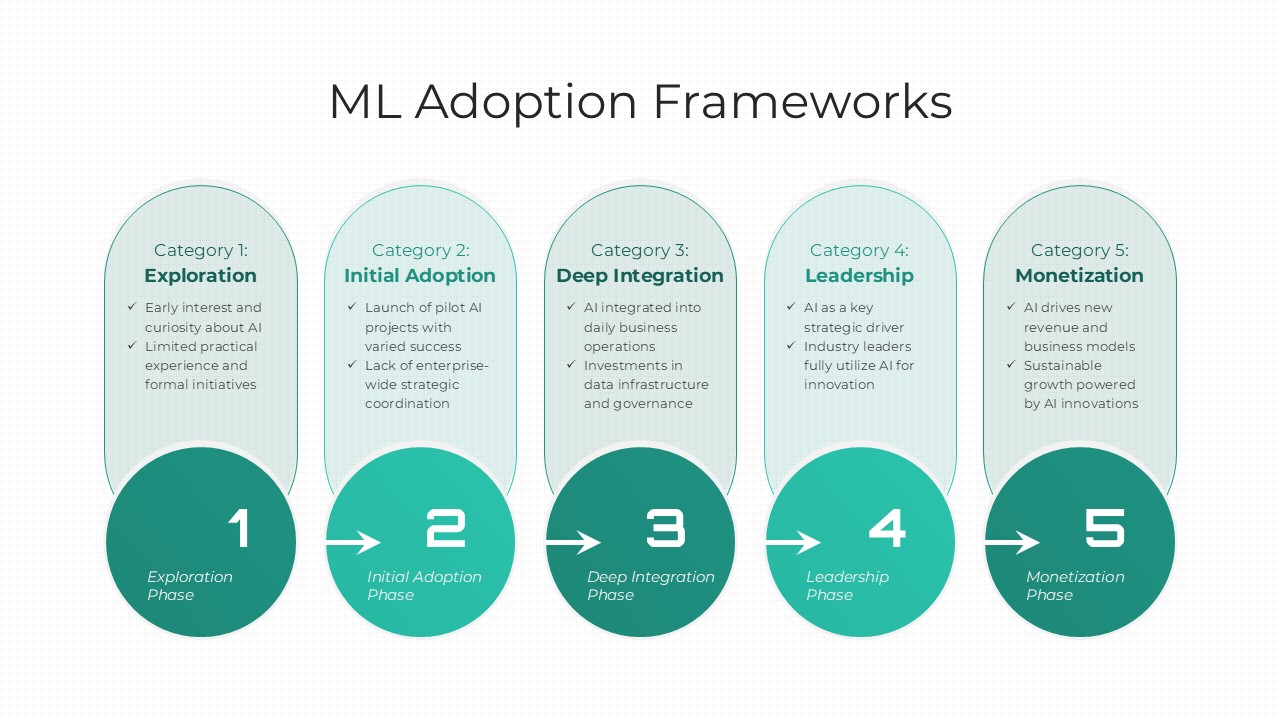
ML Adoption Framework template for PowerPoint & Google Slides
Technology
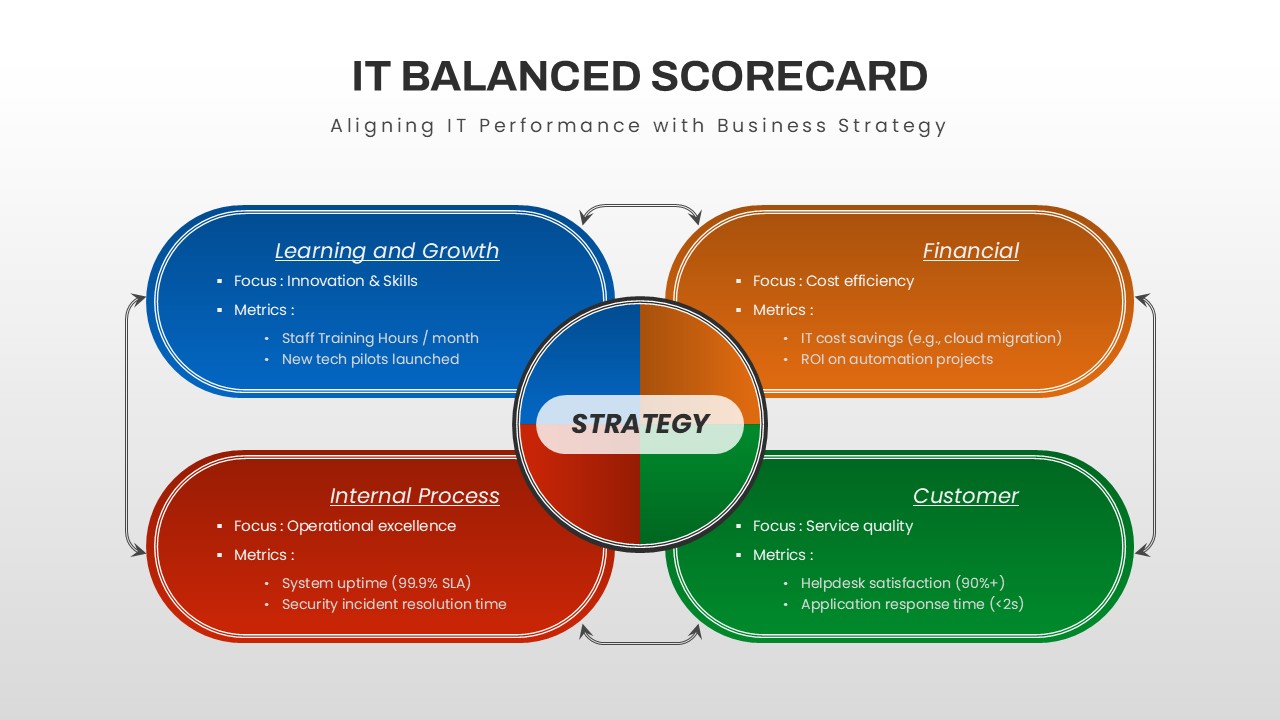
IT Balanced Scorecard Strategy Framework Template for PowerPoint & Google Slides
Business Strategy
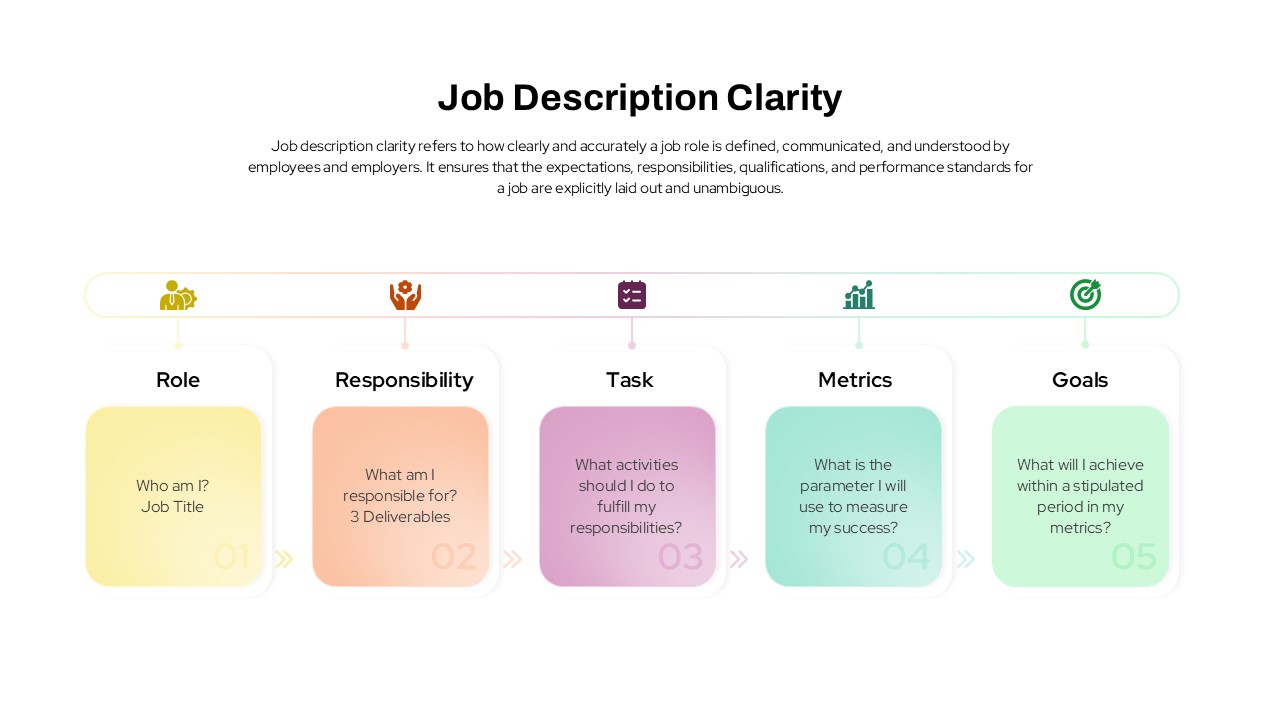
Job Description Clarity Framework template for PowerPoint & Google Slides
Business
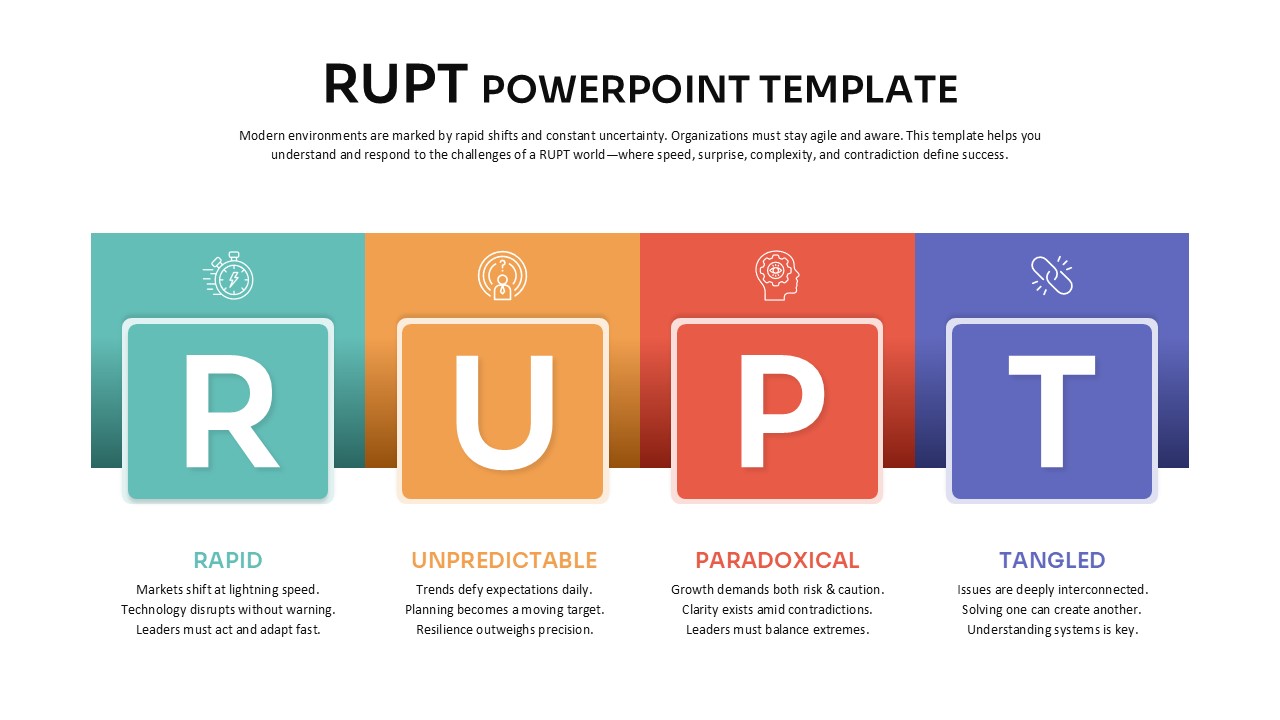
RUPT Framework template for PowerPoint & Google Slides
Business
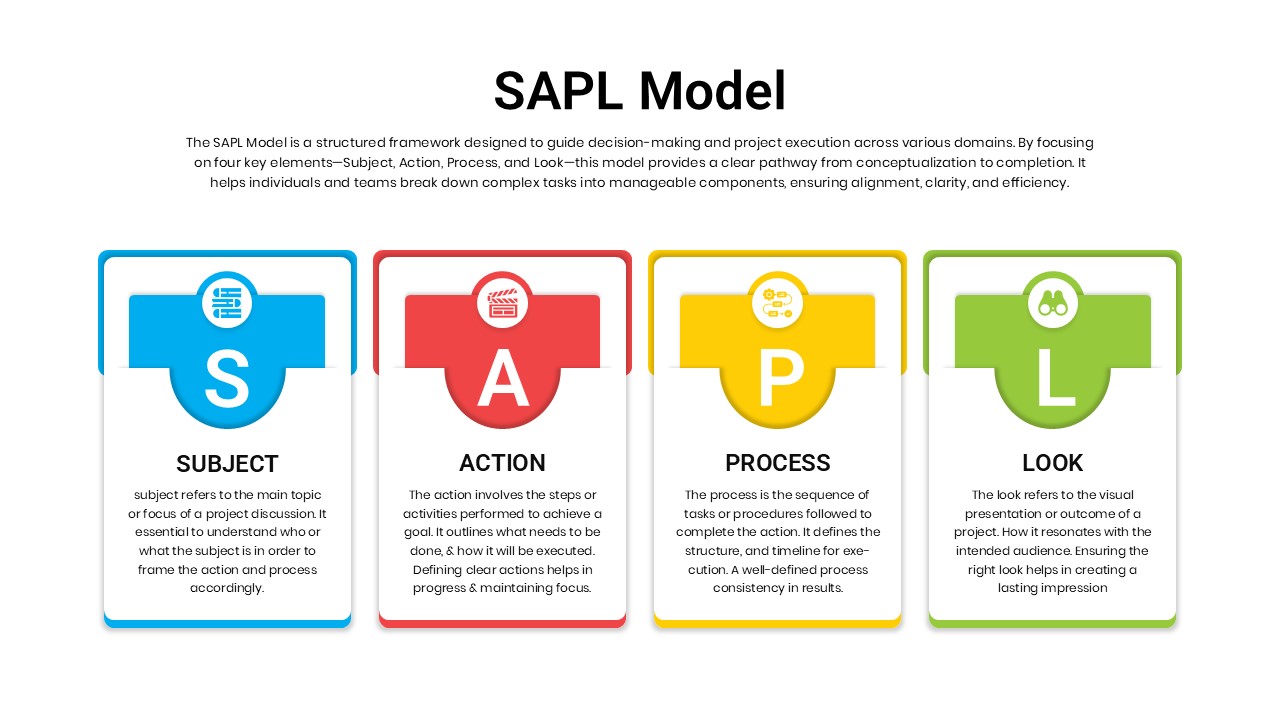
SAPL Model Framework template for PowerPoint & Google Slides
Business
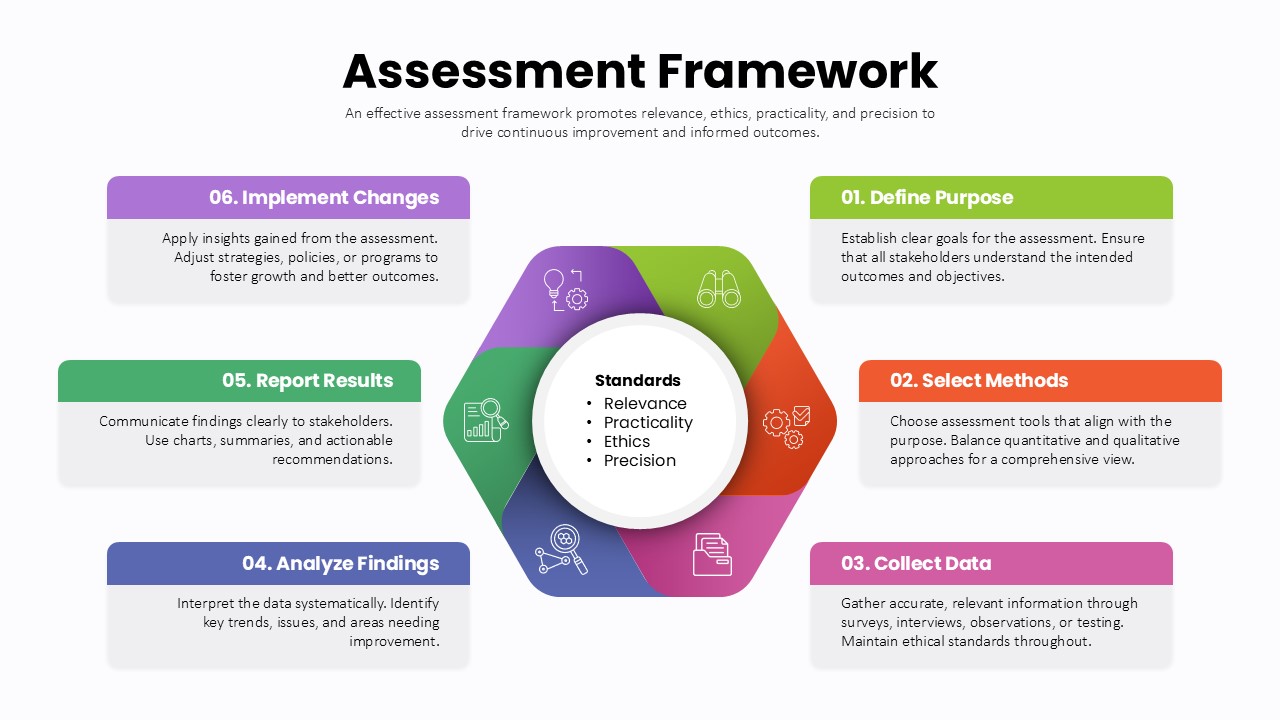
Assessment Framework Circular Diagram Template for PowerPoint & Google Slides
Circular
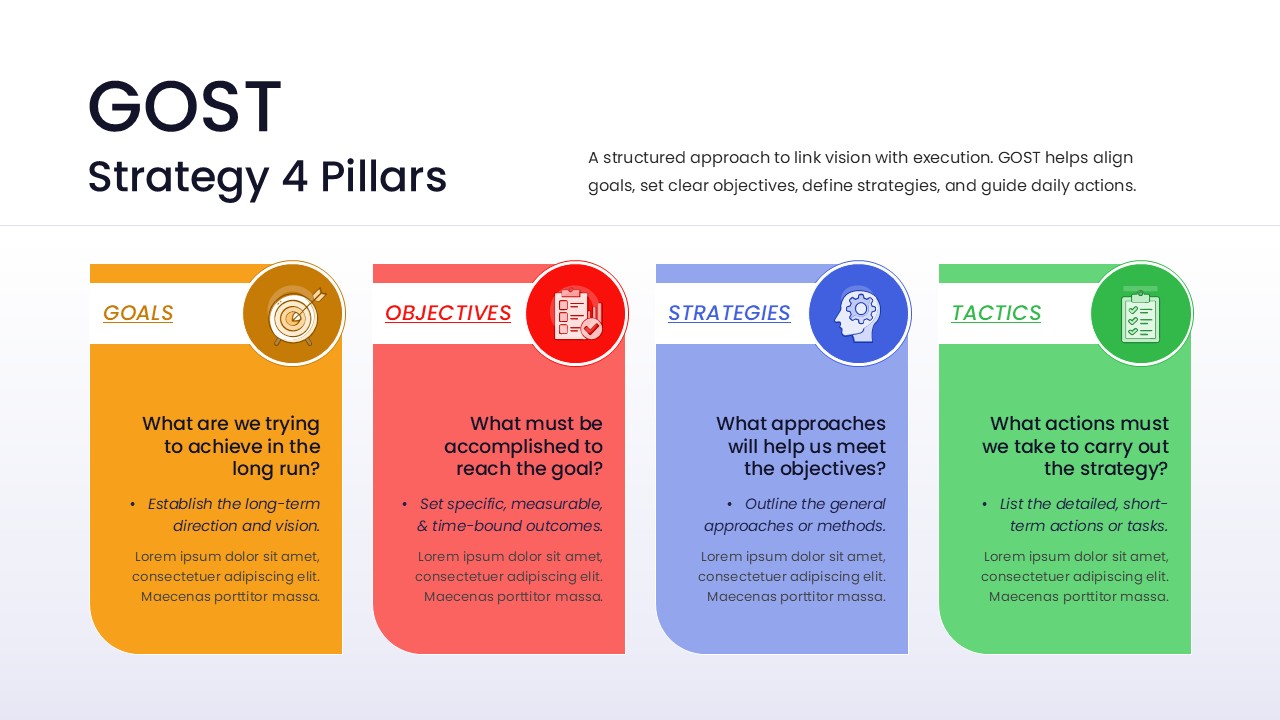
GOST Strategy 4 Pillars Framework Template for PowerPoint & Google Slides
Goals
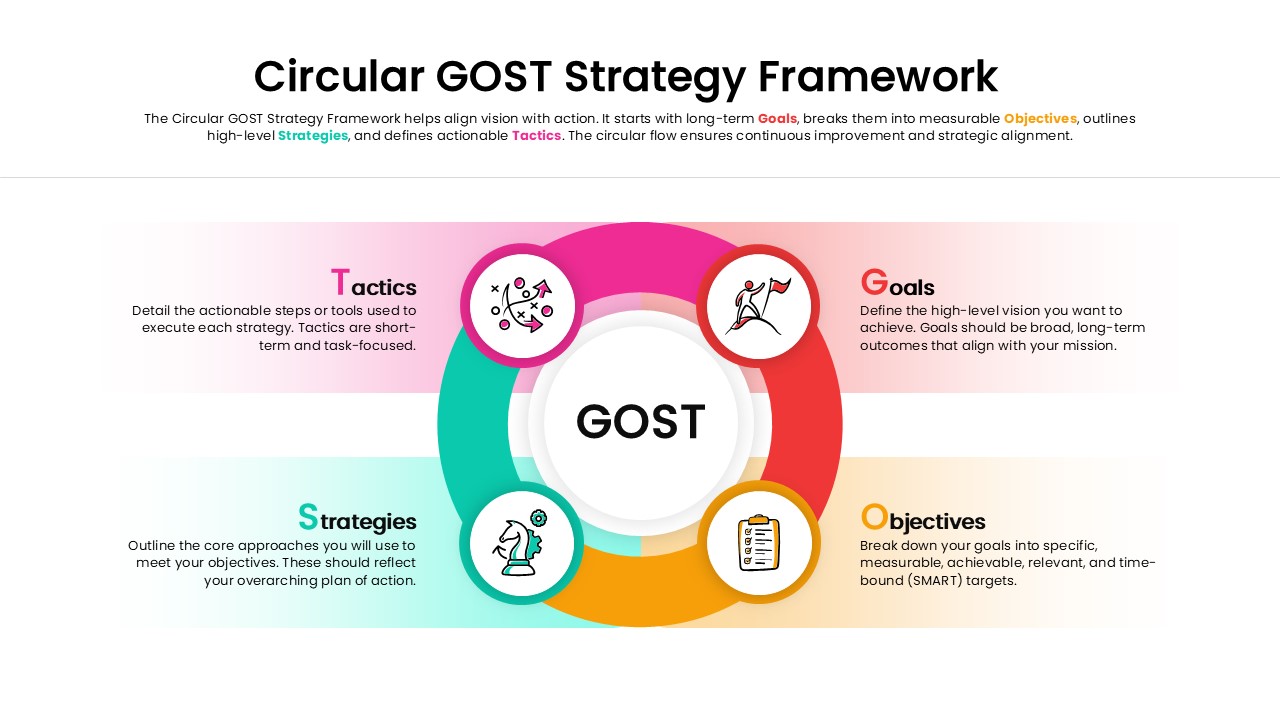
Circular GOST Strategy Framework Template for PowerPoint & Google Slides
Goals
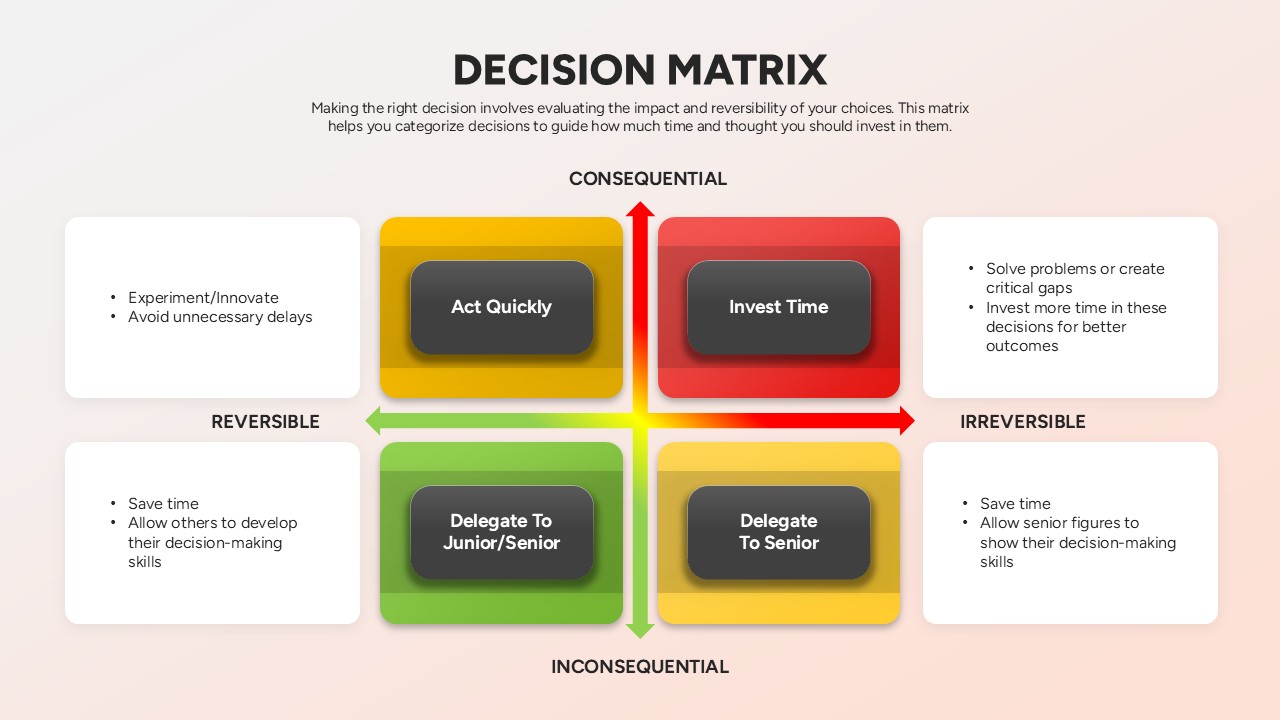
Decision Matrix Evaluation Framework Slide Template for PowerPoint & Google Slides
Leadership
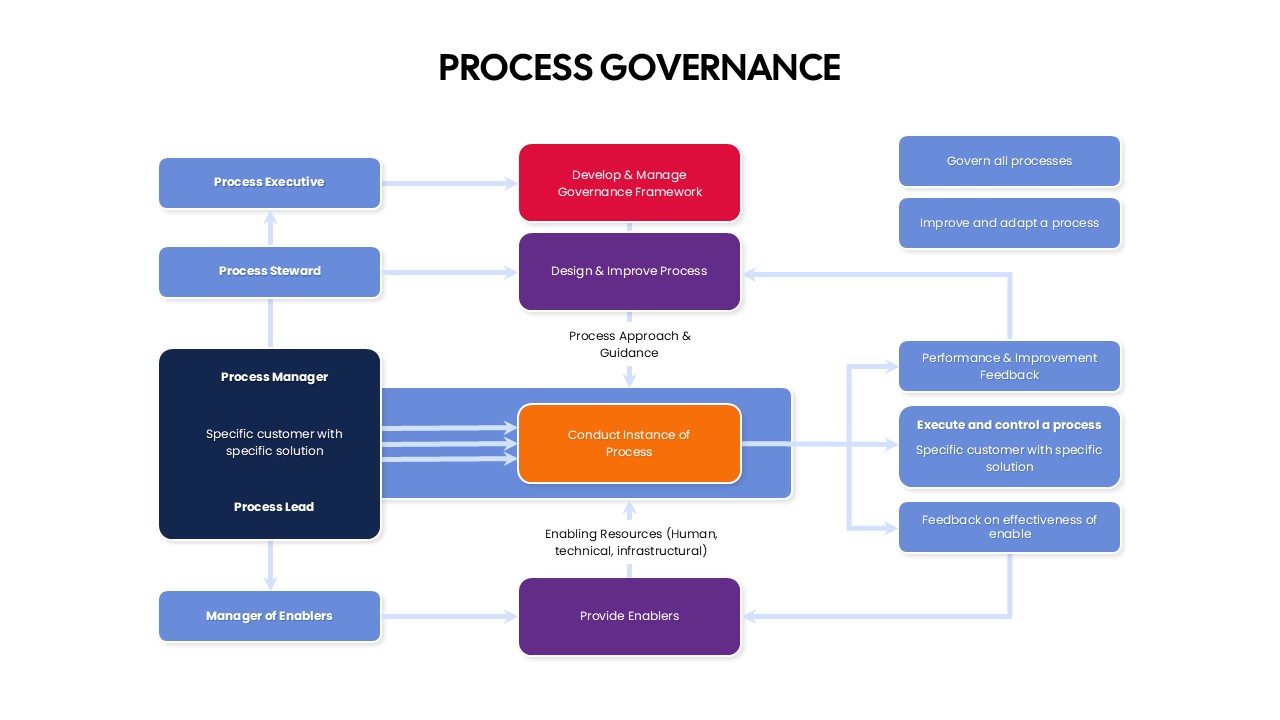
Process Governance Framework Flowchart Template for PowerPoint & Google Slides
Flow Charts
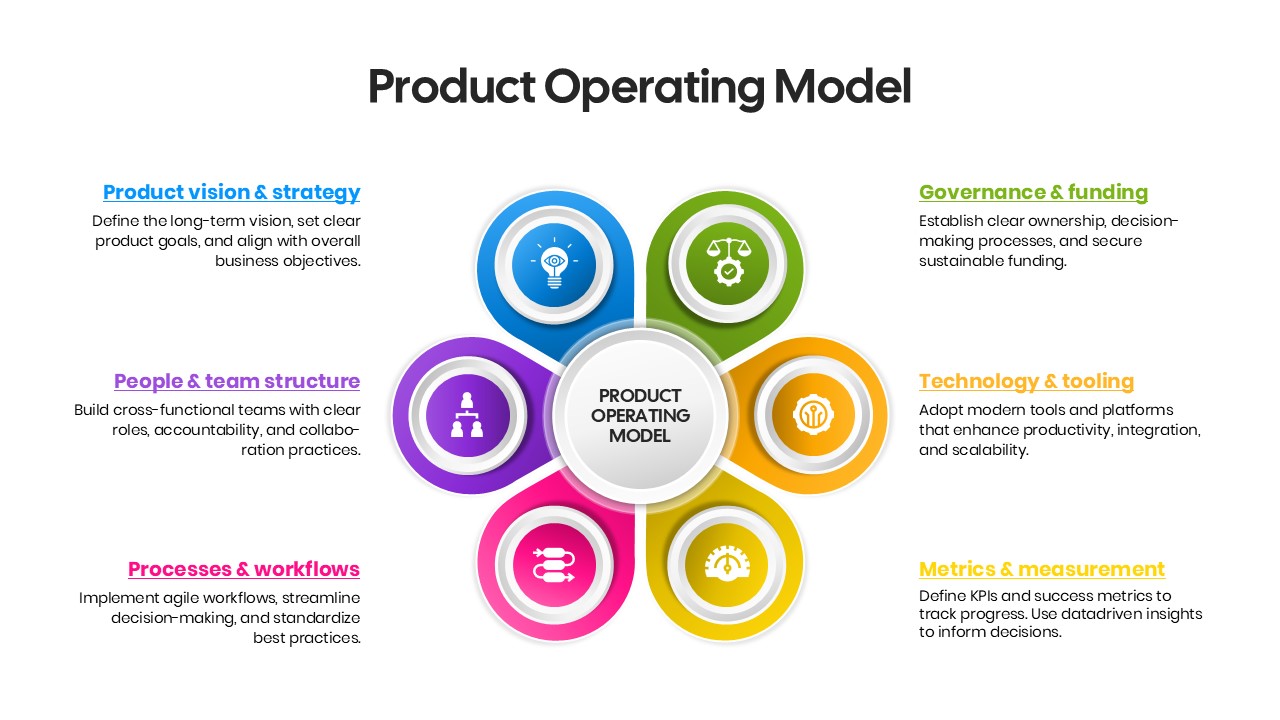
Product Operating Model Framework Template for PowerPoint & Google Slides
Business Strategy
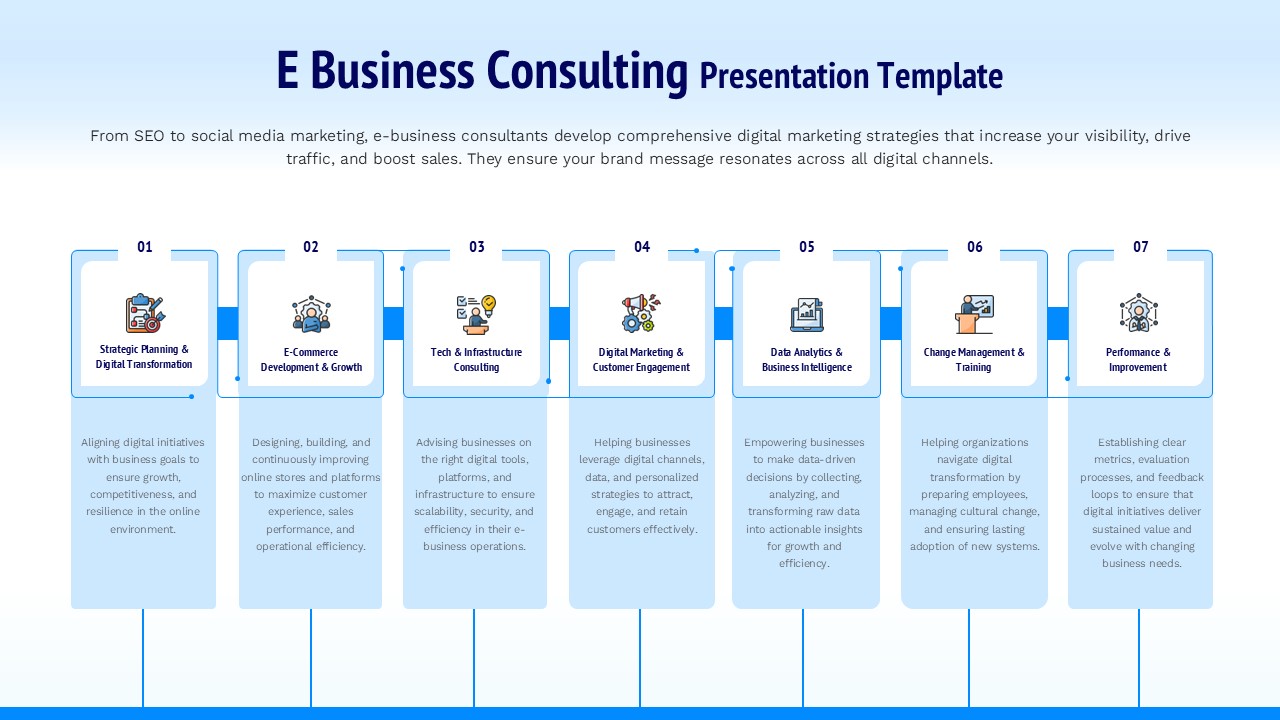
E Business Consulting Service Framework Template for PowerPoint & Google Slides
Business Strategy
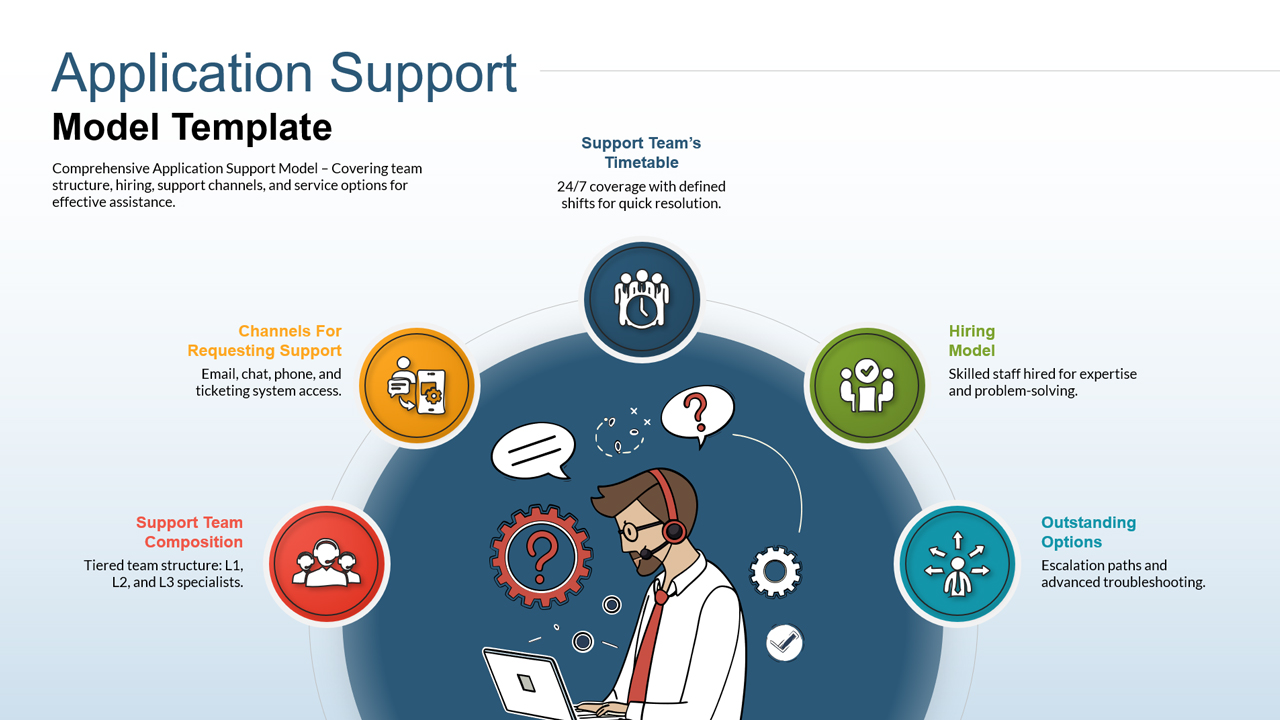
Application Support Operating Model Framework Slide Template for PowerPoint & Google Slides
Information Technology
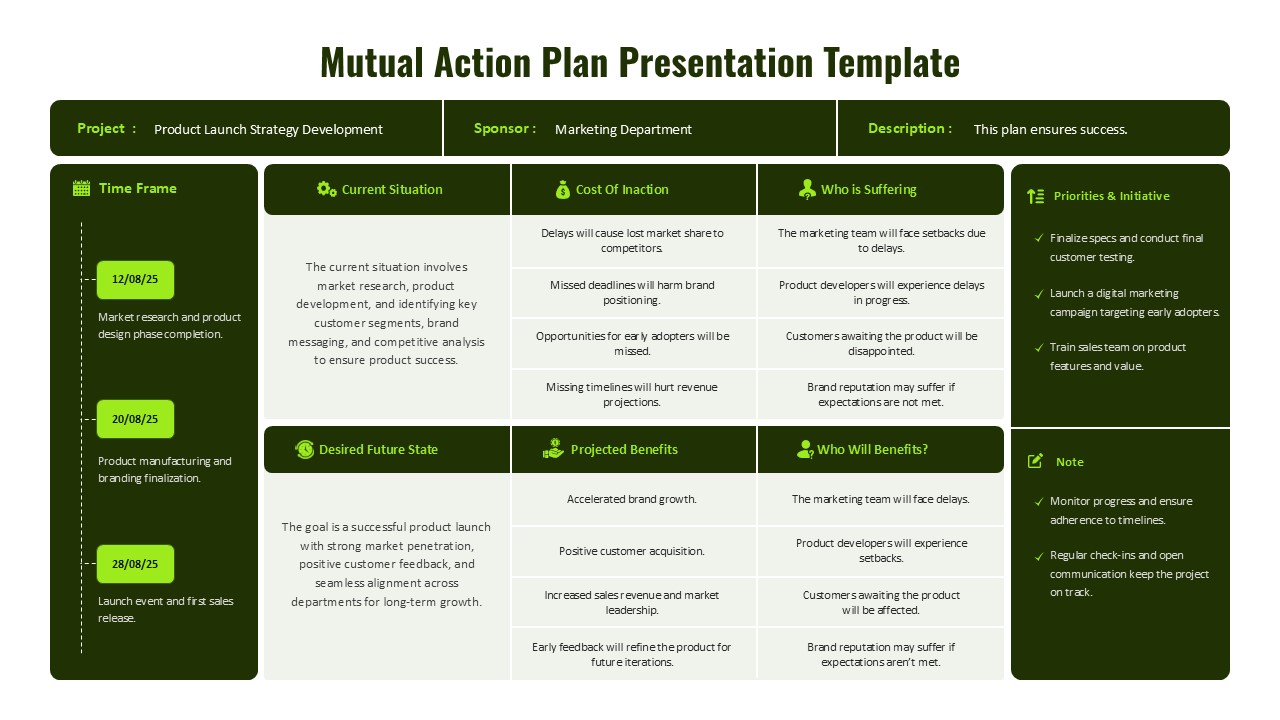
Mutual Action Plan Framework Overview Template for PowerPoint & Google Slides
Project
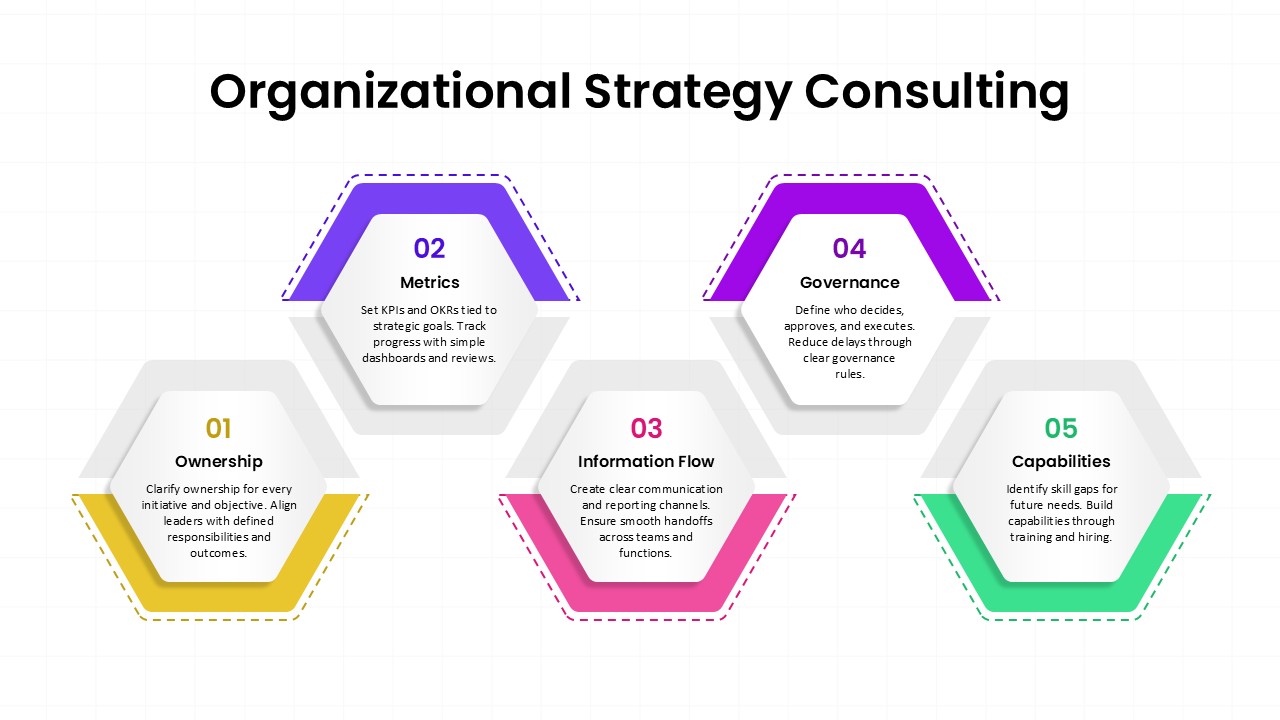
Organizational Strategy Consulting Framework Template for PowerPoint & Google Slides
Consulting