Business Target Analysis Diagram Template for PowerPoint & Google Slides

Description
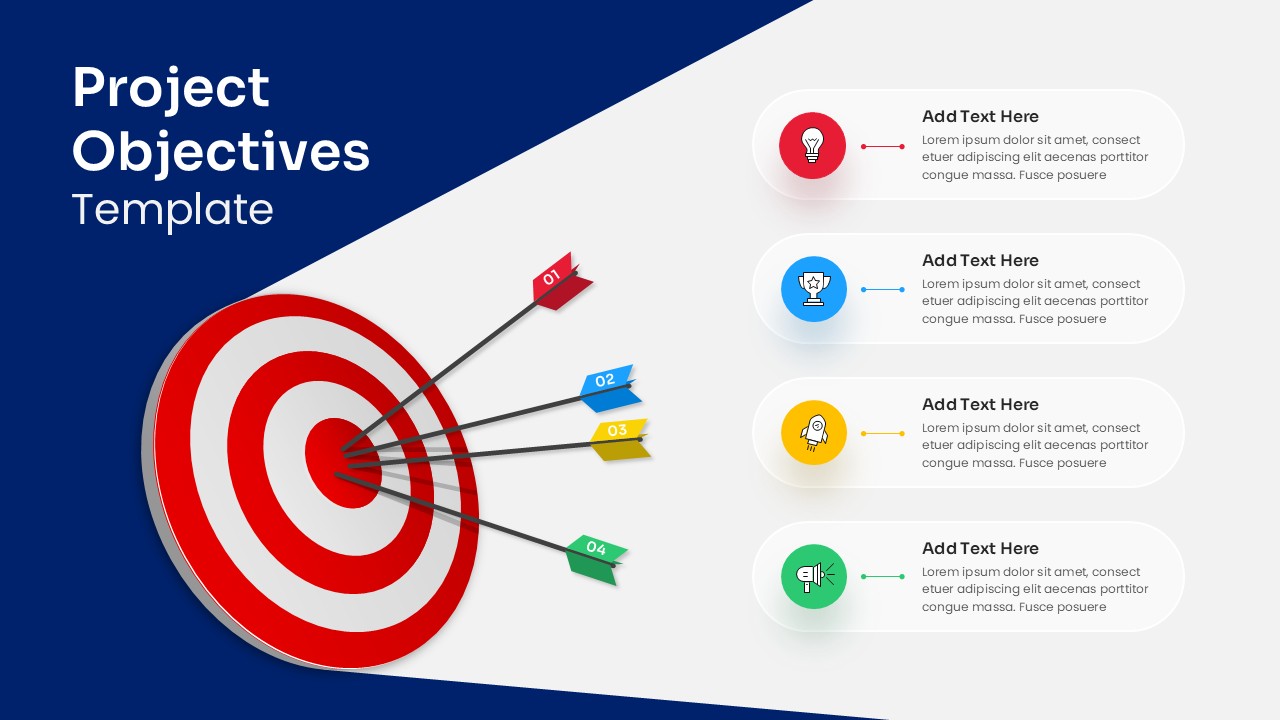
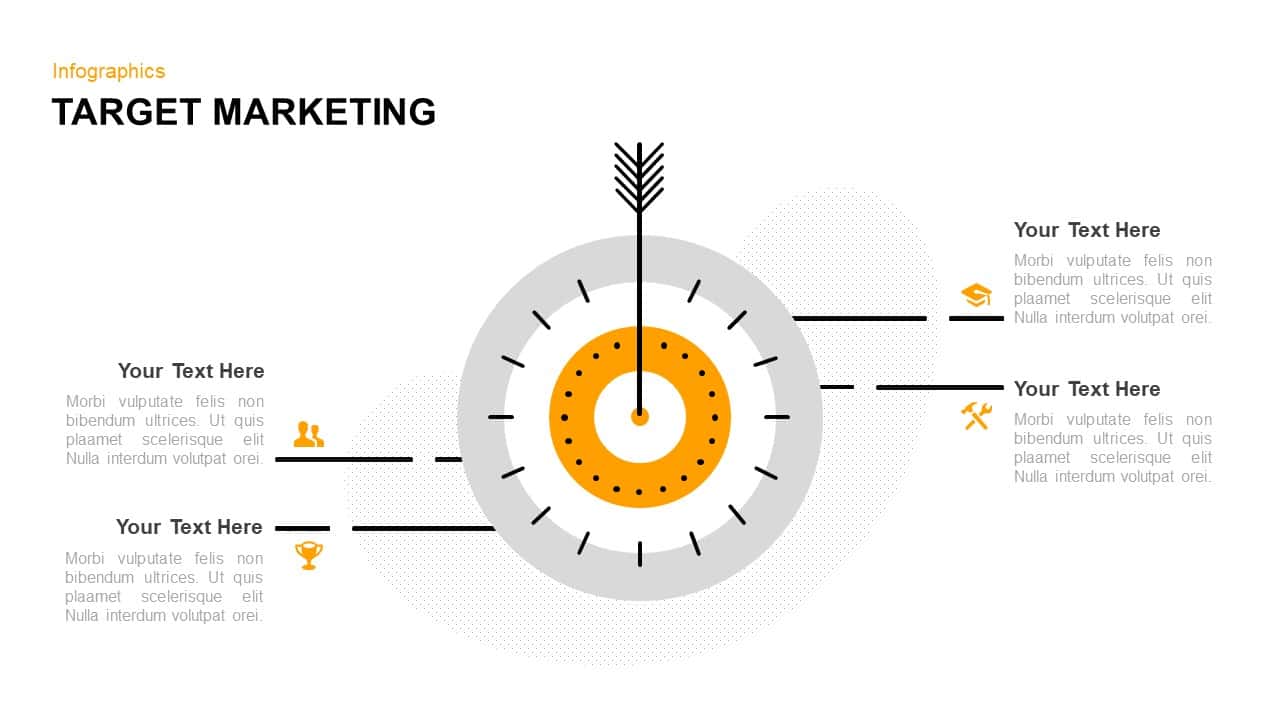
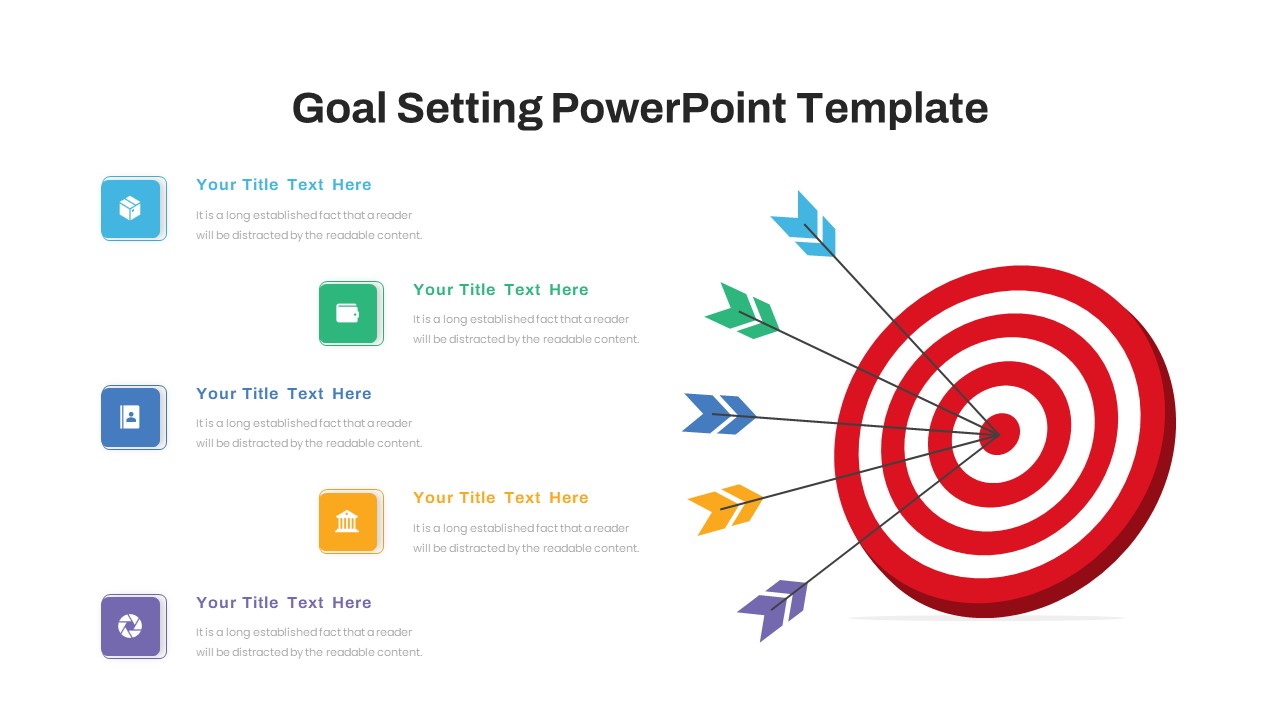
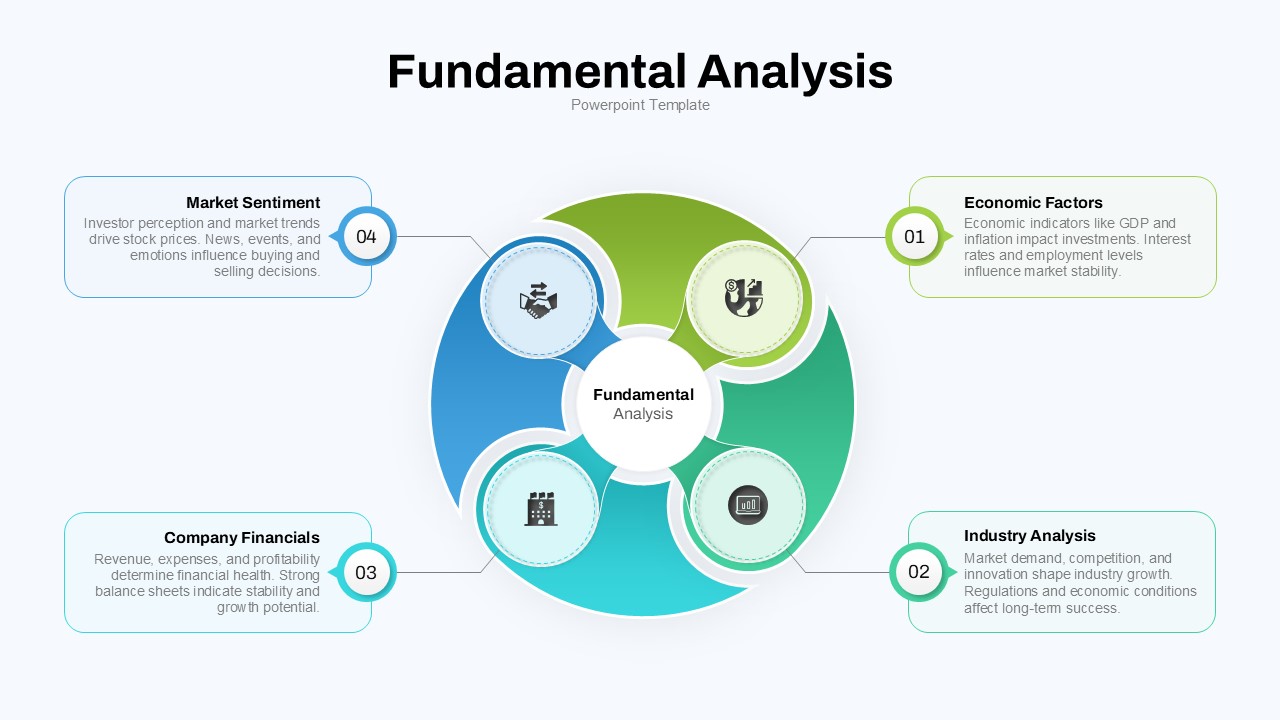
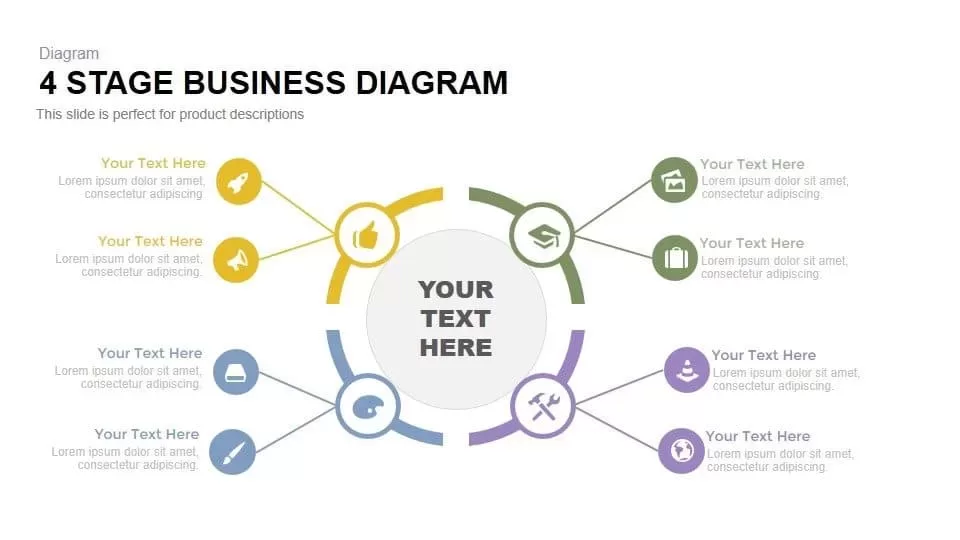
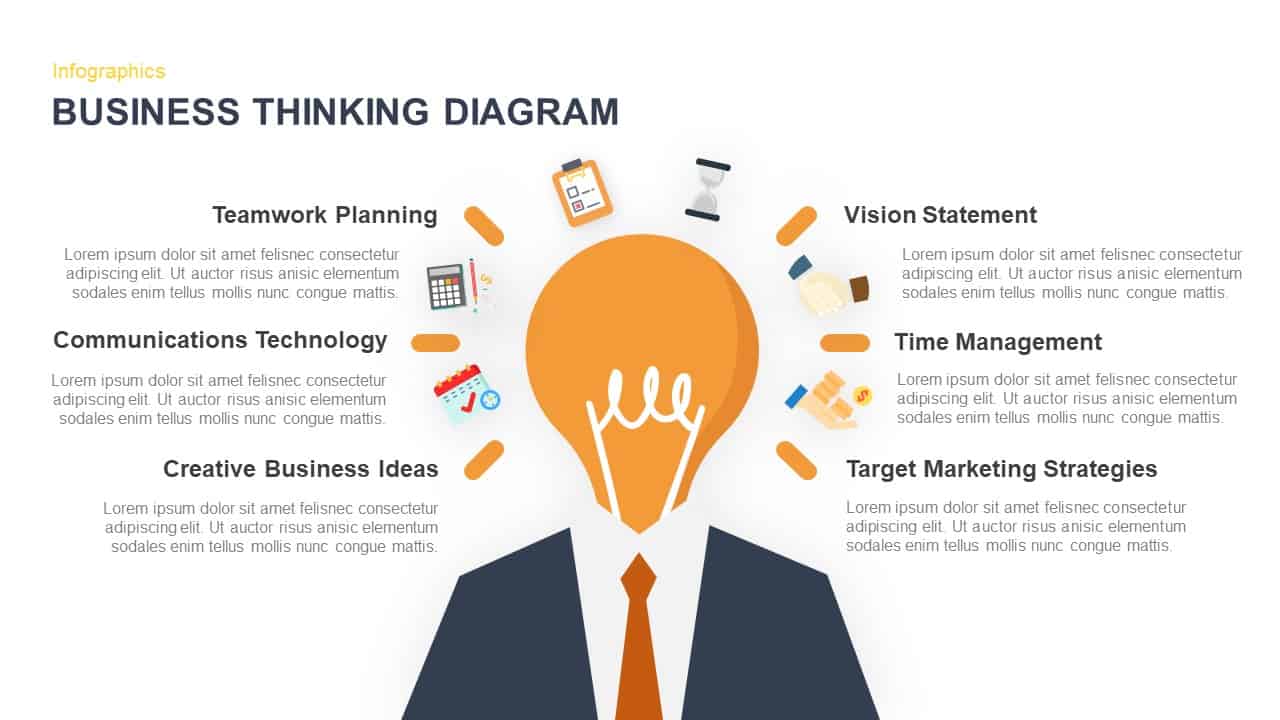
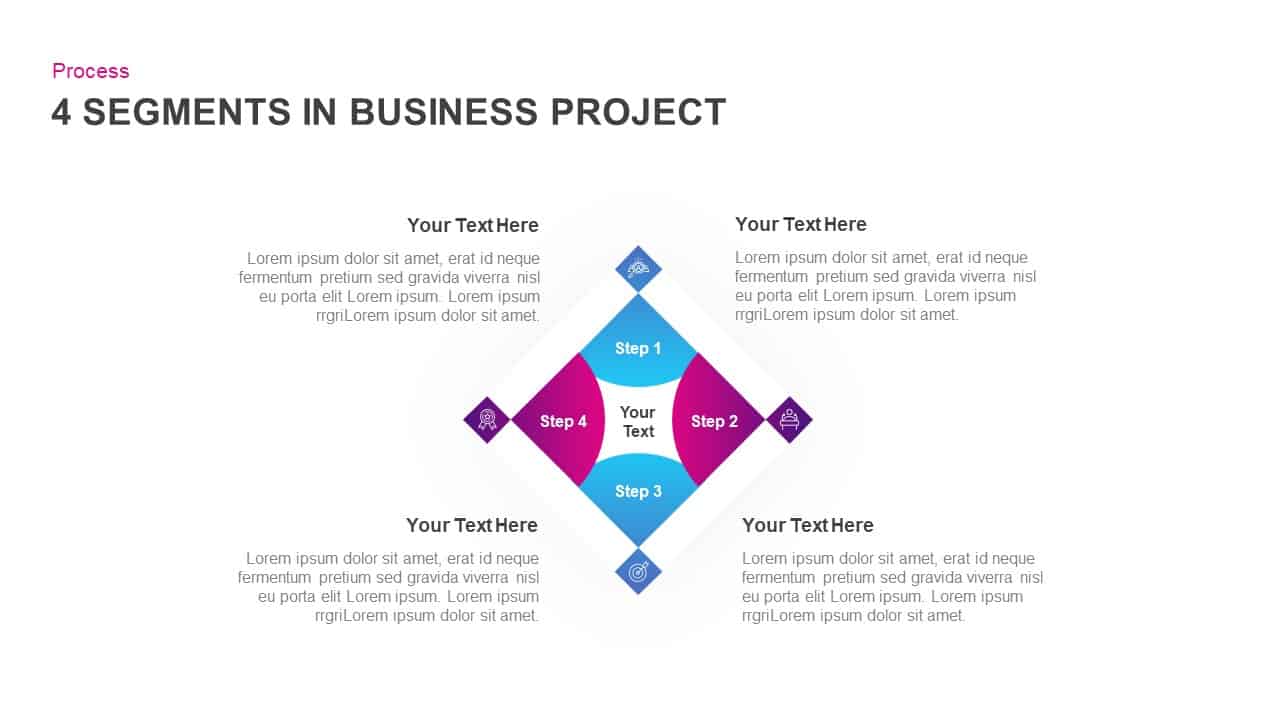
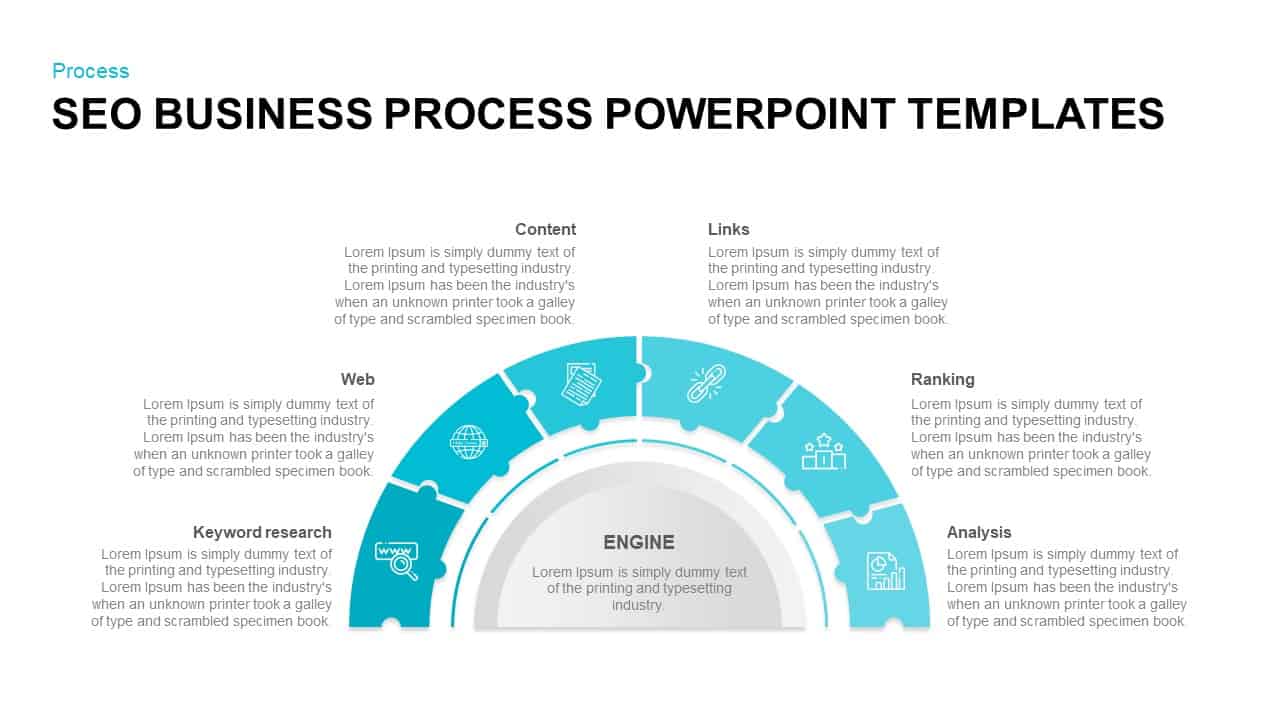
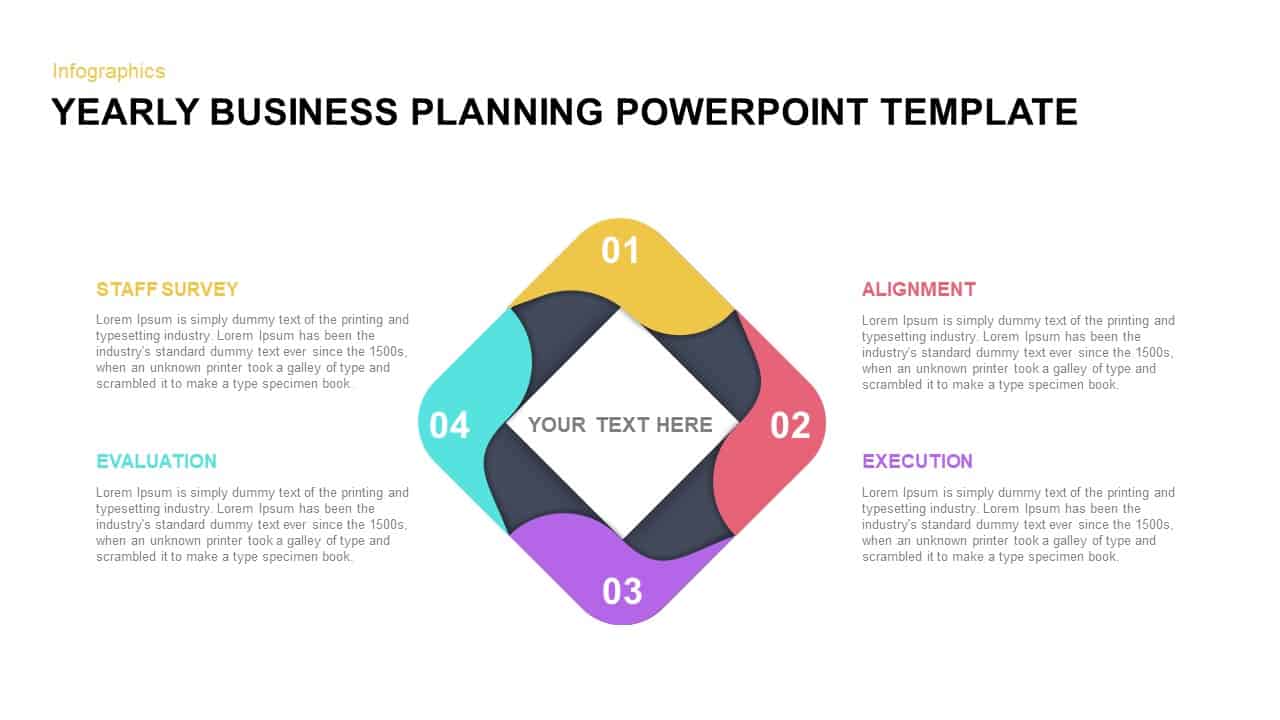
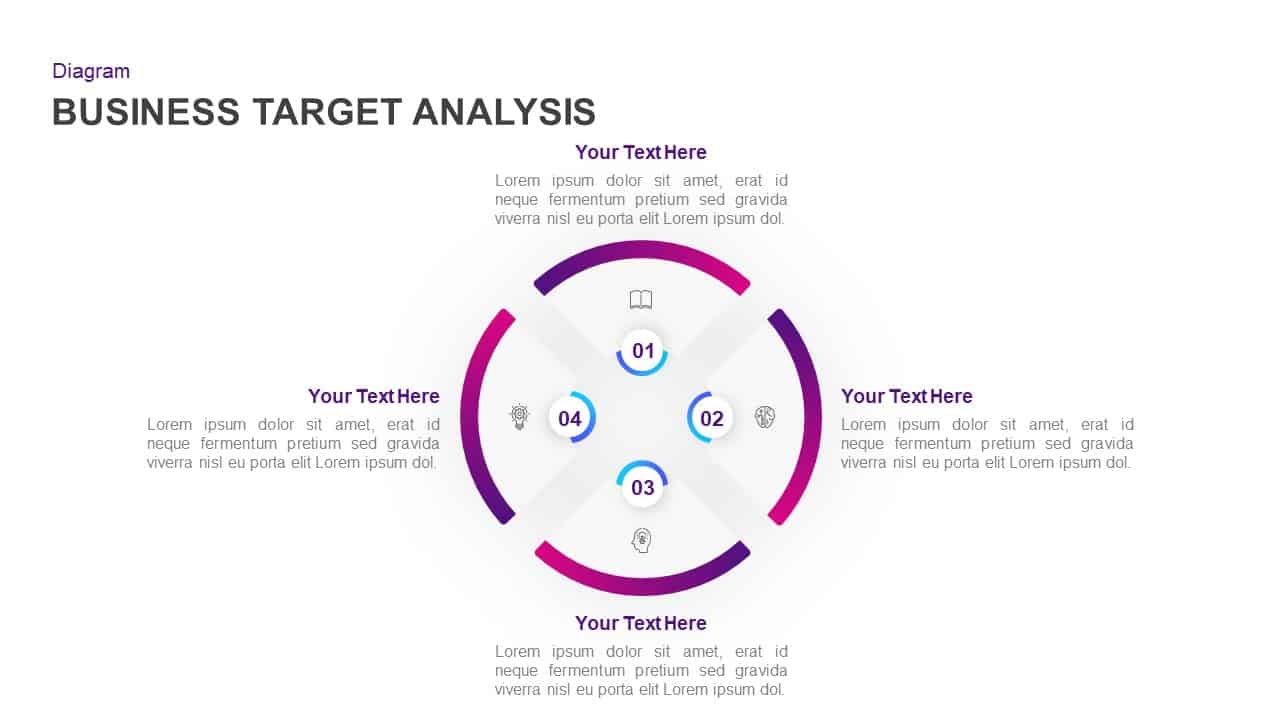
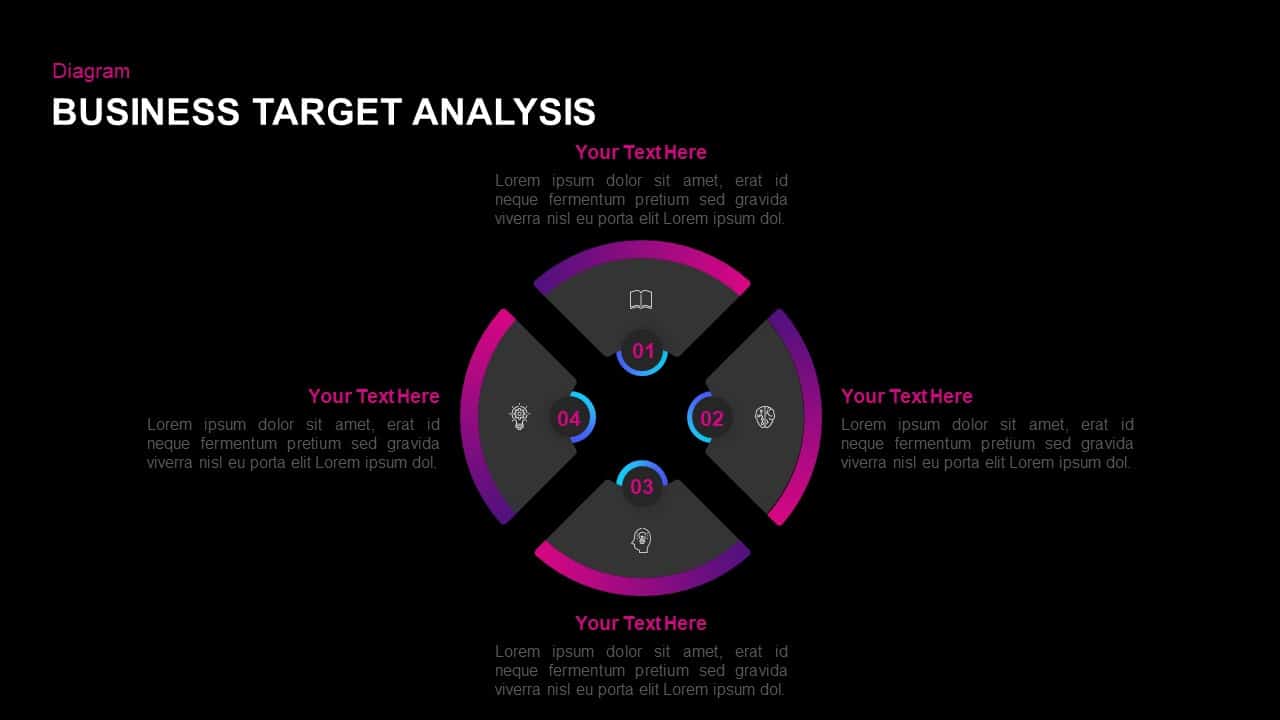
Leverage this business target analysis diagram slide to clearly present strategic objectives, performance metrics, and key focus areas in a visually engaging circular format. At the core, a segmented ring comprised of gradient-colored arcs wraps around four numbered nodes, each paired with a minimalist icon—book, brain, ear, and lightbulb—to symbolize different dimensions such as knowledge, insight, listening, and innovation. Clean radial connectors link each icon to text placeholders positioned at the top, right, bottom, and left, enabling presenters to annotate priorities, KPIs, or departmental goals with precision. The subtle 3D shading on icons, paired with a neutral white background and soft drop shadows, ensures that these visual elements stand out while maintaining a professional, minimalist aesthetic. Vibrant color gradients across the ring segments not only highlight individual stages but also establish visual hierarchy, guiding audience attention toward critical targets.
Engineered for effortless customization, this template includes master slides, fully editable vector shapes, and defined placeholders that let you swap icons, adjust gradient hues, or modify connector styles in seconds. Replace the default symbols with custom graphics, rename the nodes to align with your organizational structure, or extend the ring by duplicating segments if you need additional categories. Built-in alignment guides and layout grids guarantee perfect spacing and uniform stroke widths without manual adjustments. Optimized for both PowerPoint and Google Slides, this diagram renders consistently across devices and software versions, eliminating formatting hassles. Whether you’re conducting stakeholder workshops, performance reviews, or boardroom briefings, this circular target diagram empowers you to map complex relationships, track progress against objectives, and drive data-driven discussions with minimal effort and maximum clarity.
Who is it for
Business leaders, analysts, and project managers will benefit from this target analysis diagram when presenting strategic goals, KPI frameworks, or performance dashboards. Consultants, trainers, and departmental heads can also use it to align teams around key focus areas during workshops, board meetings, or training sessions.
Other Uses
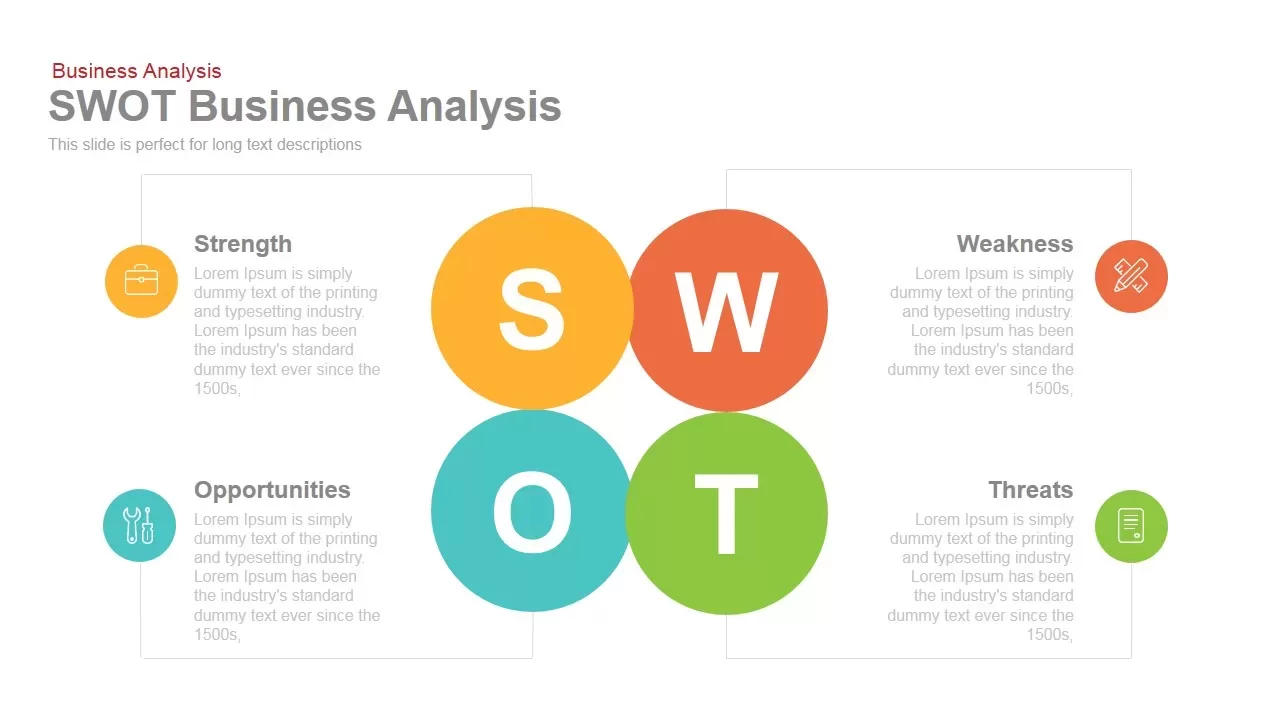
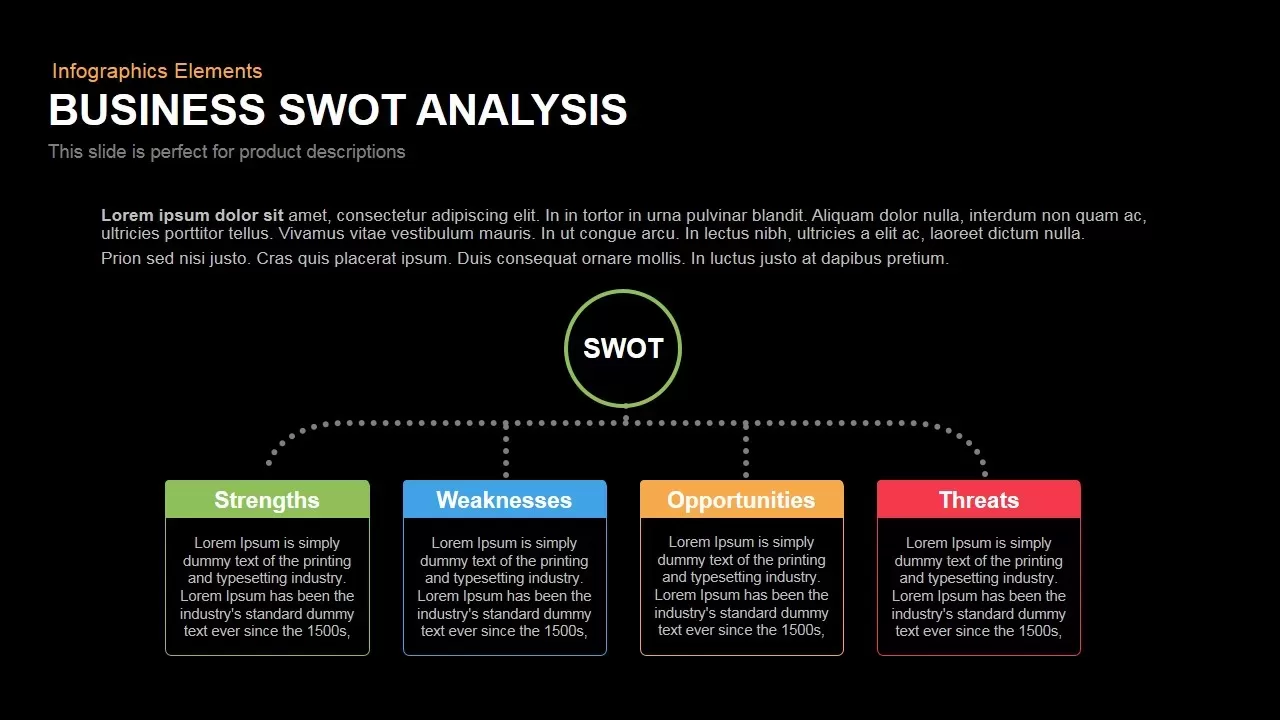
Repurpose this circular layout for SWOT overviews, strategic roadmaps, risk assessments, or process checkpoints. Adapt the icons and labels to illustrate milestone reviews, stakeholder maps, or project phase breakdowns, making this diagram a versatile asset across industries.
Login to download this file

Item ID
SB01337
Related Templates

Two-Box Analysis & Target Comparison Template for PowerPoint & Google Slides
Comparison
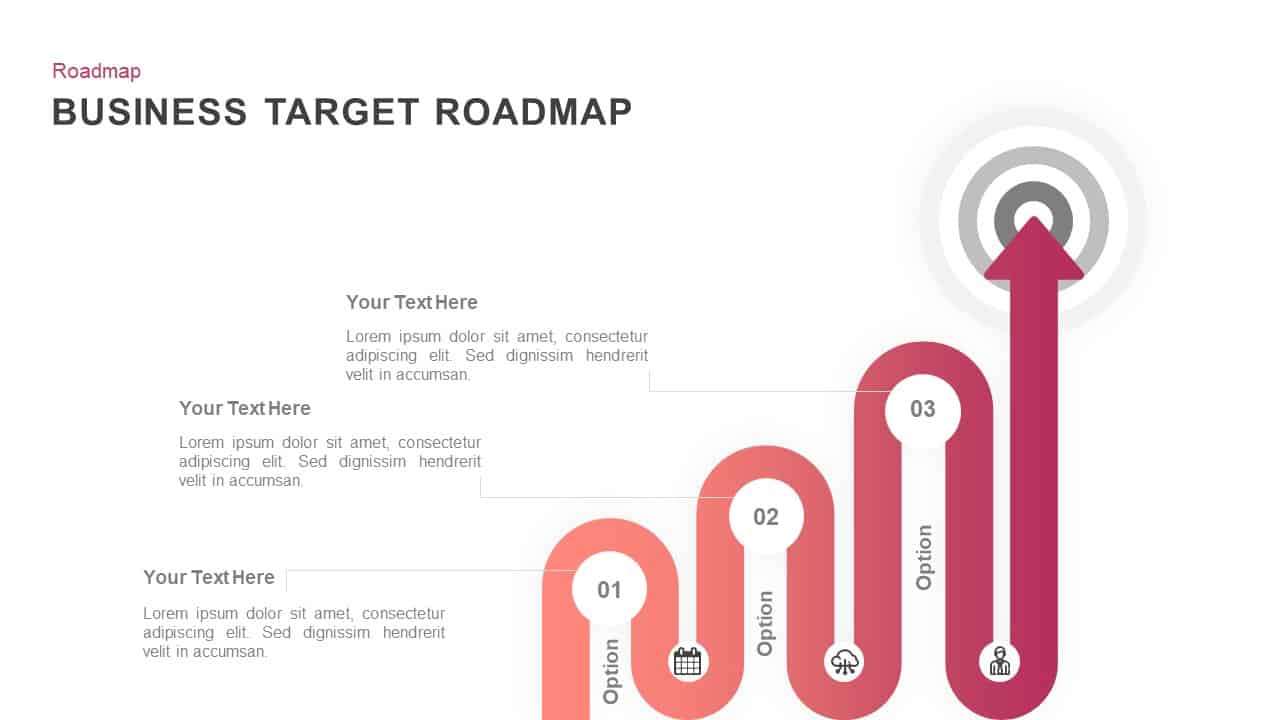
Business Target Milestone Roadmap Template for PowerPoint & Google Slides
Roadmap
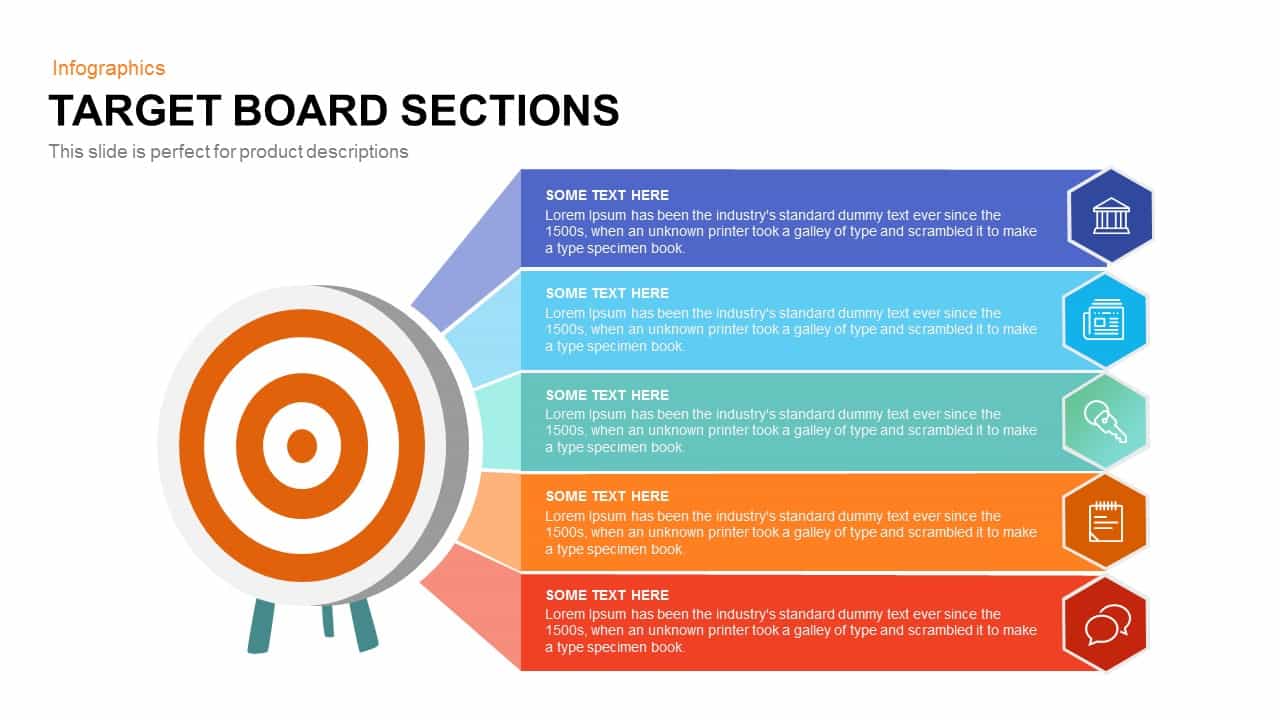
Target Board Sections Circular Diagram Template for PowerPoint & Google Slides
Circular
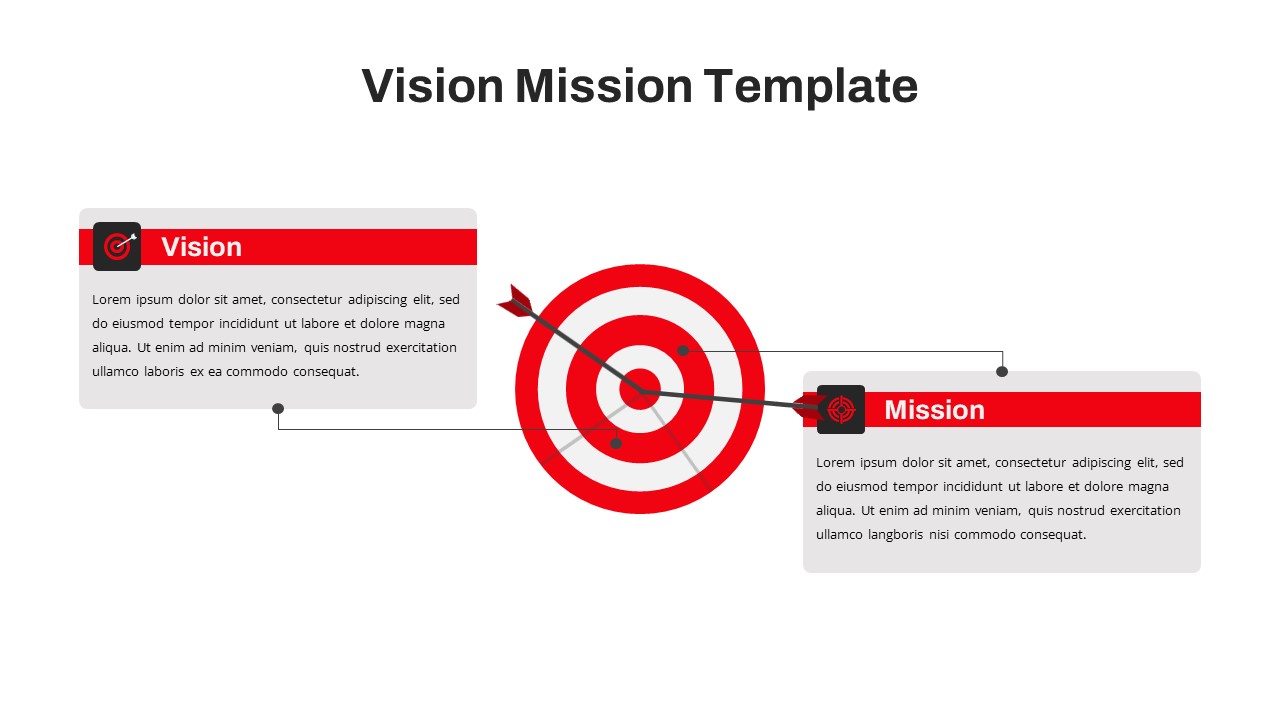
Free Vision and Mission Target Diagram Template for PowerPoint & Google Slides
Vision and Mission
Free
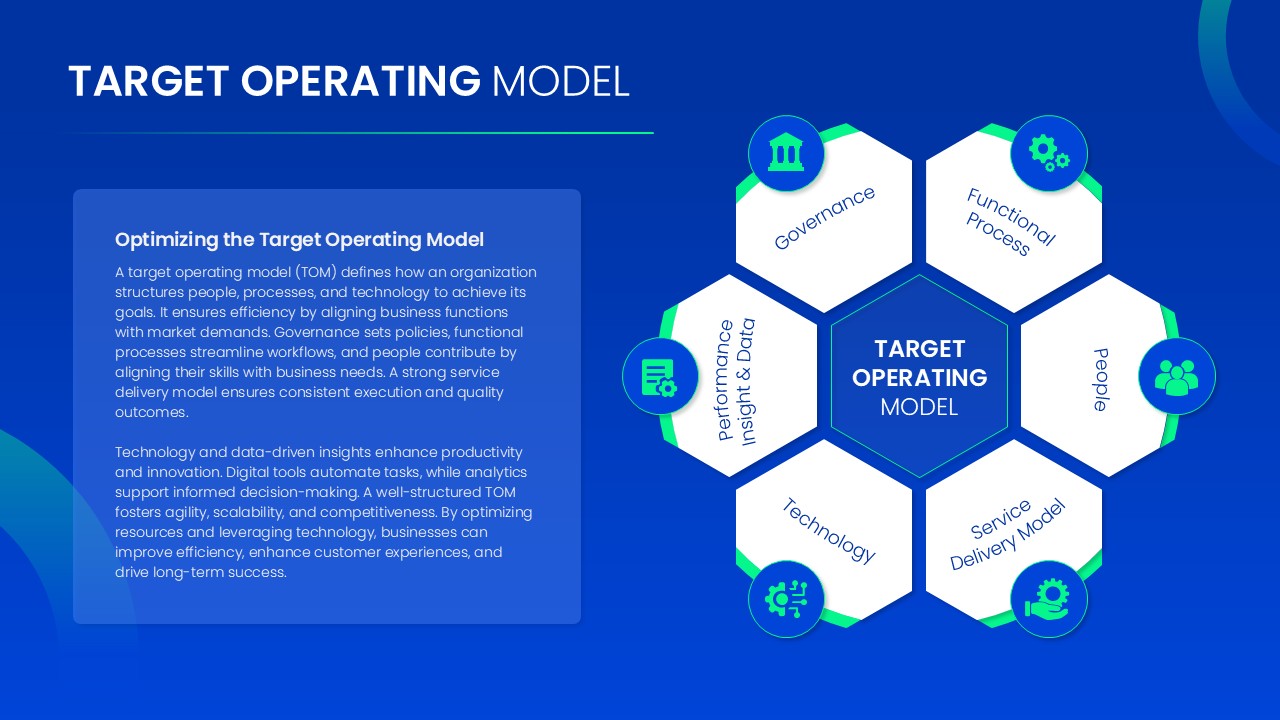
Target Operating Model Diagram Template for PowerPoint & Google Slides
Business Strategy
Project Objectives Target Diagram Template for PowerPoint & Google Slides
Goals
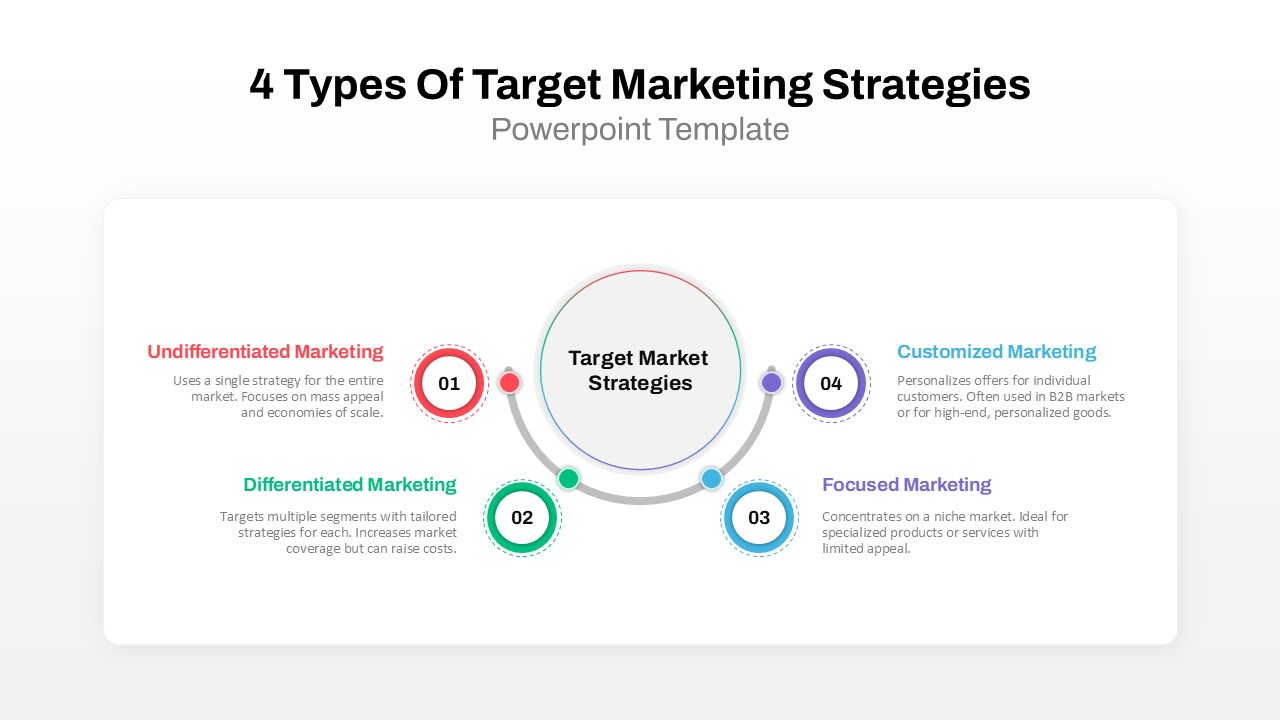
4 Types of Target Marketing Strategies PowerPoint Template for PowerPoint & Google Slides
Comparison
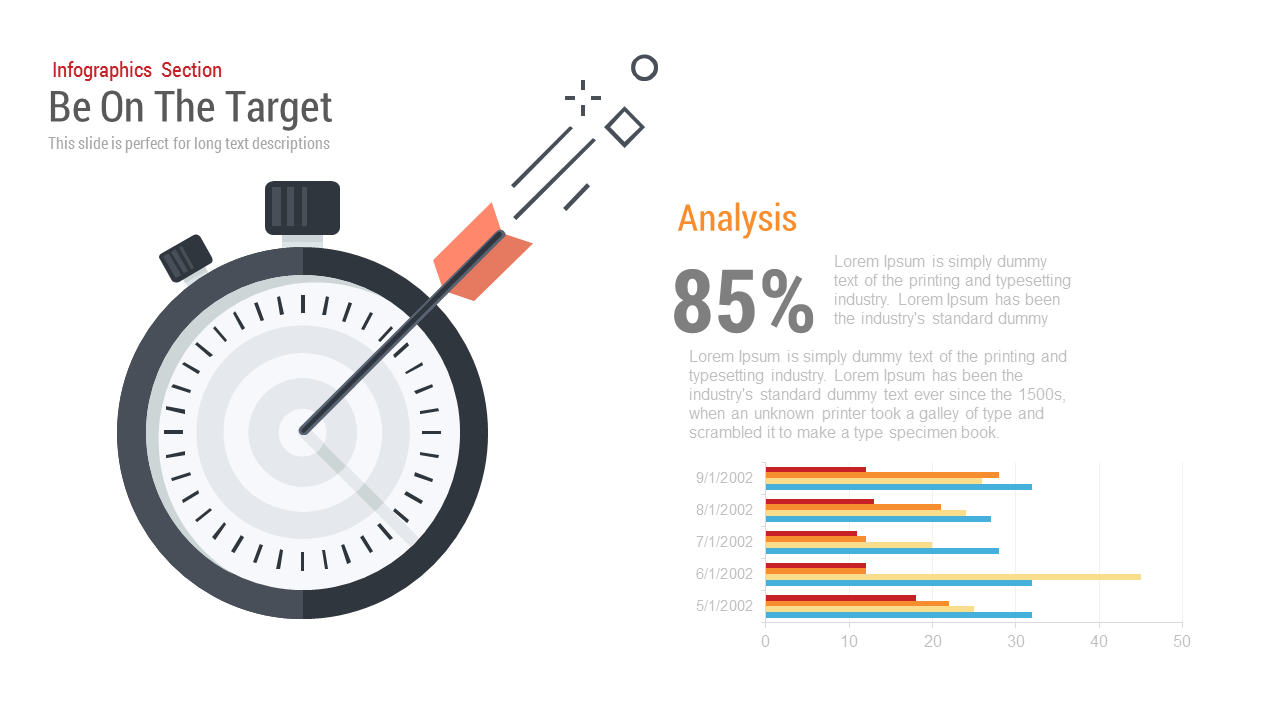
Be On The Target template for PowerPoint & Google Slides
Circular
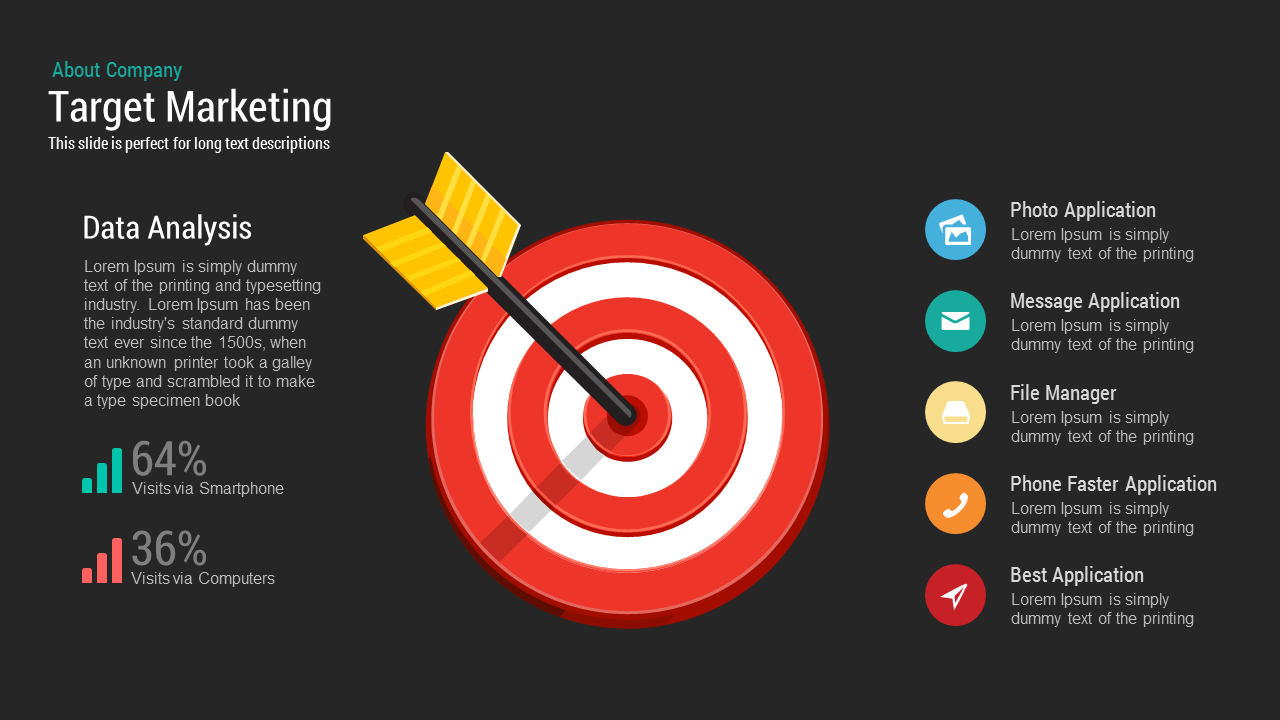
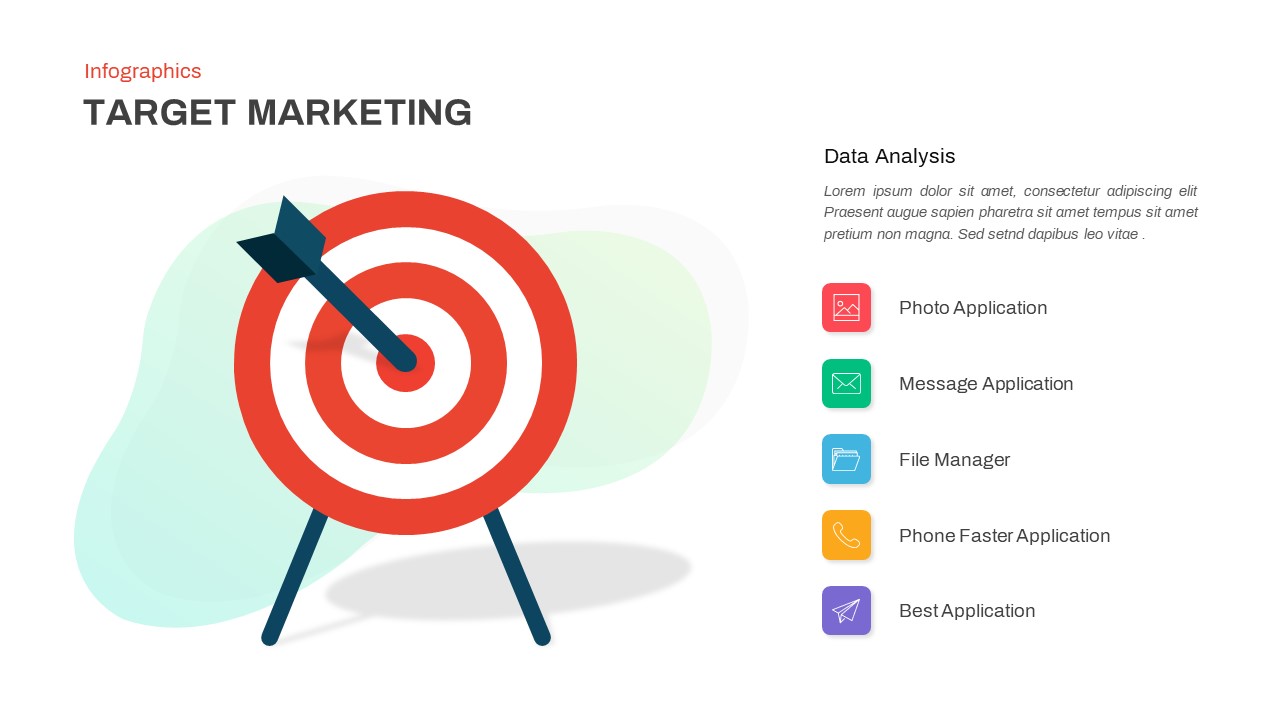
Target Marketing template for PowerPoint & Google Slides
Business
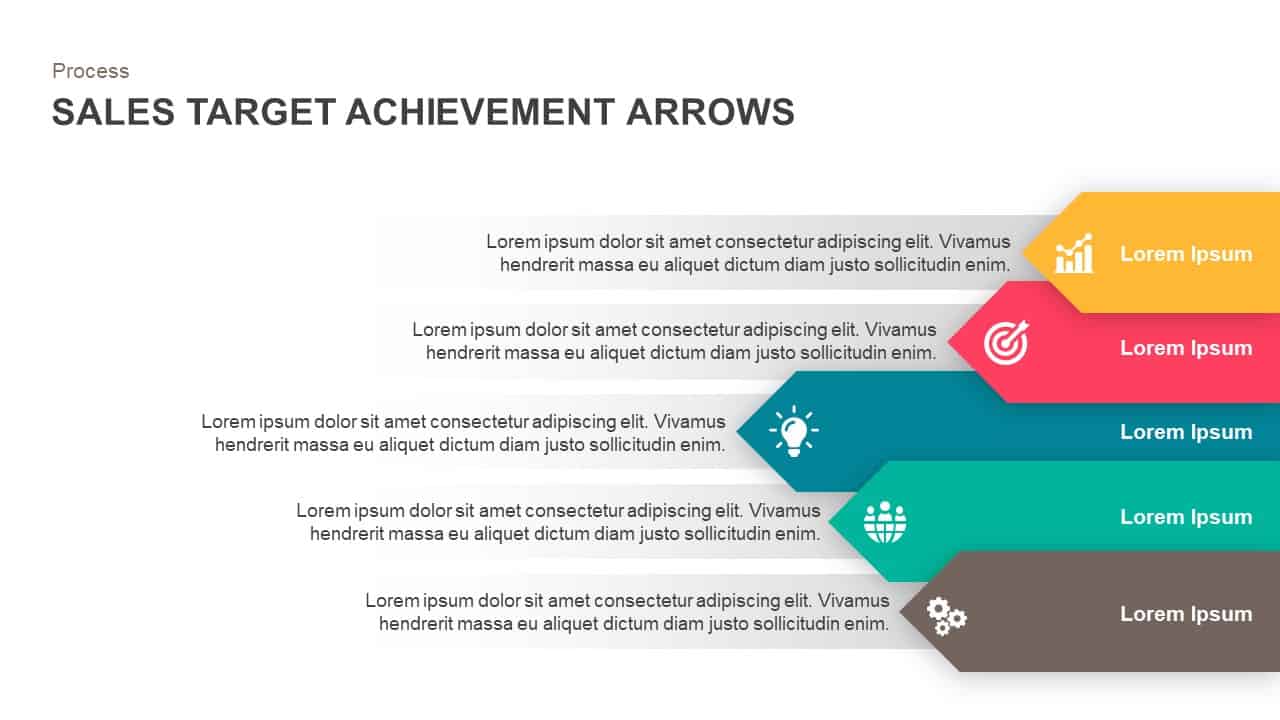
Sales Target Achievement Arrows Template for PowerPoint & Google Slides
Arrow
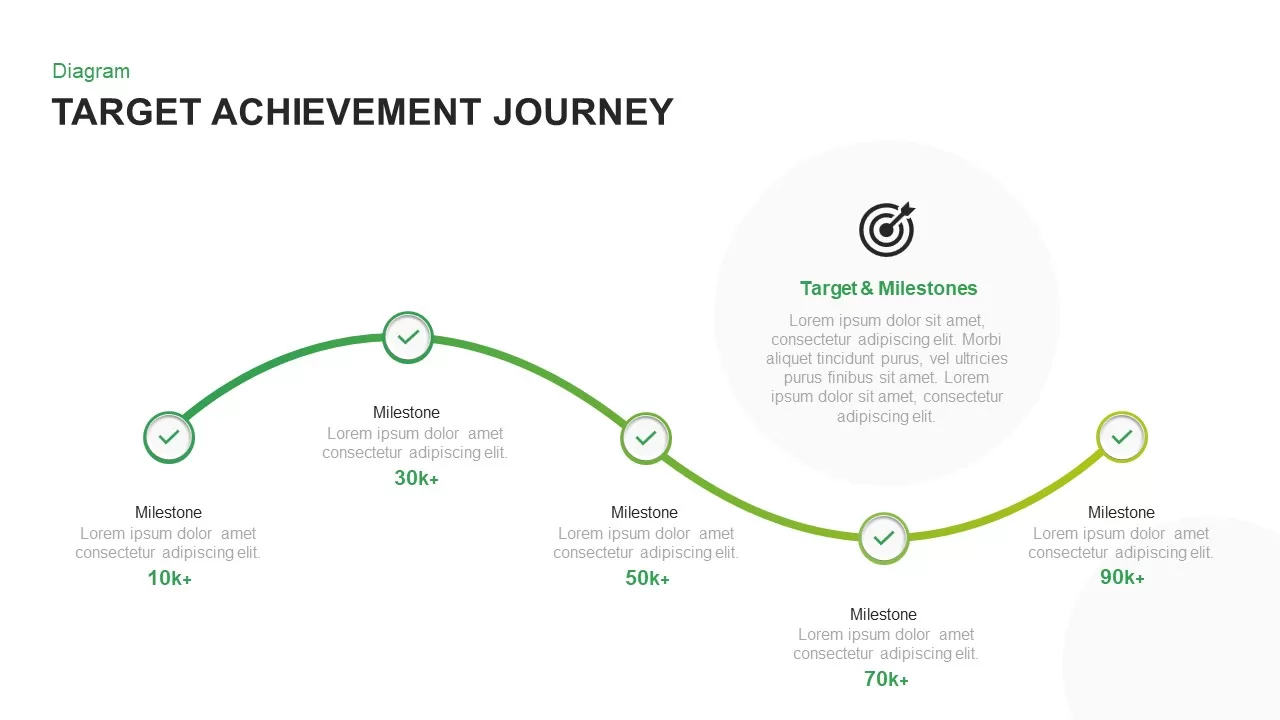
Target Achievement Milestone Curve Template for PowerPoint & Google Slides
Roadmap
Target Marketing Infographic Slide Pack Template for PowerPoint & Google Slides
Infographics
Target Marketing Infographic Callouts Template for PowerPoint & Google Slides
Circular
Education Target Achievement Infographic Template for PowerPoint & Google Slides
Goals
Goal Arrow and Target Infographic Template for PowerPoint & Google Slides
Goals
Target Goals Infographic Slide Template for PowerPoint & Google Slides
Goals
Shooting Target Process Infographic Template for PowerPoint & Google Slides
Process
Free Goal Setting Target Infographic Slide Template for PowerPoint & Google Slides
Goals
Free

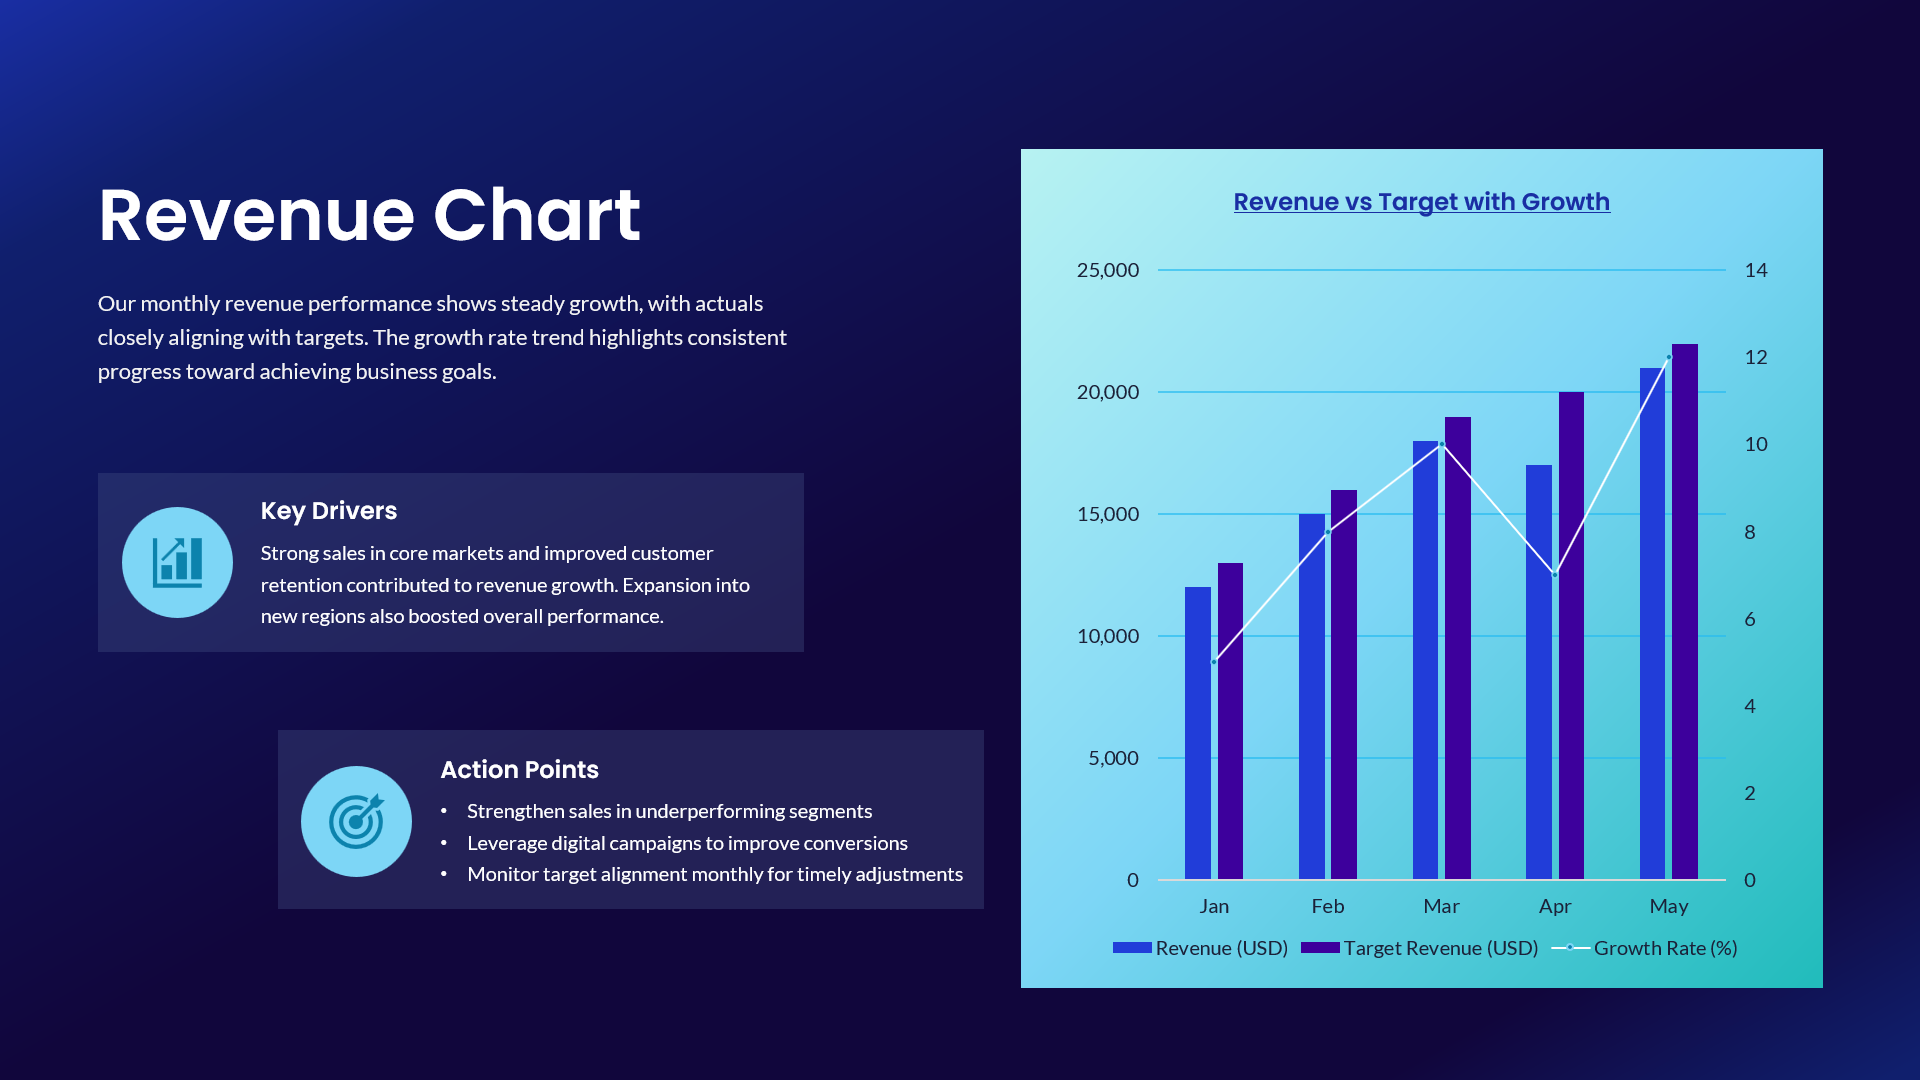
Revenue vs Target Growth Chart Template for PowerPoint & Google Slides
Revenue
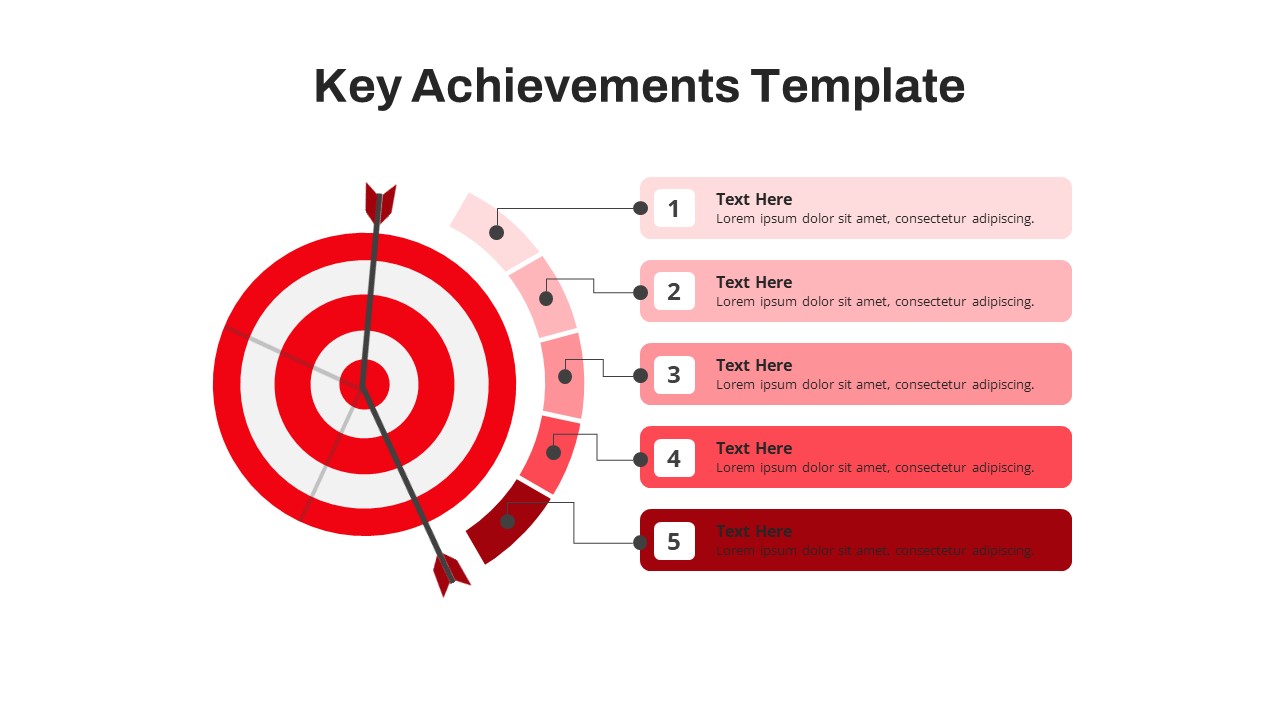
Free Target Milestone Achievements Slide for PowerPoint & Google Slides
Accomplishment
Free
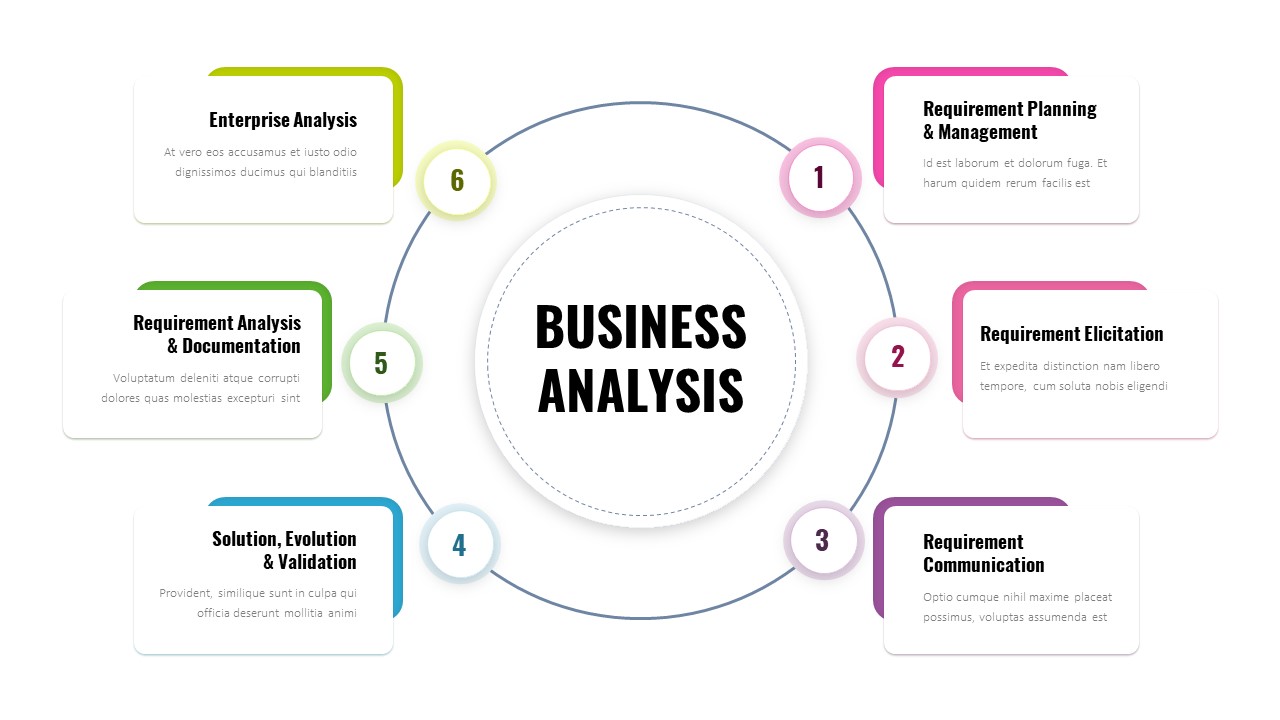
Six-Step Business Analysis Diagram template for PowerPoint & Google Slides
Circular
Business Process Analysis Cycle Diagram Template for PowerPoint & Google Slides
Business Strategy
SWOT Business Analysis template for PowerPoint & Google Slides
SWOT
Box Business SWOT Analysis Template for PowerPoint & Google Slides
SWOT
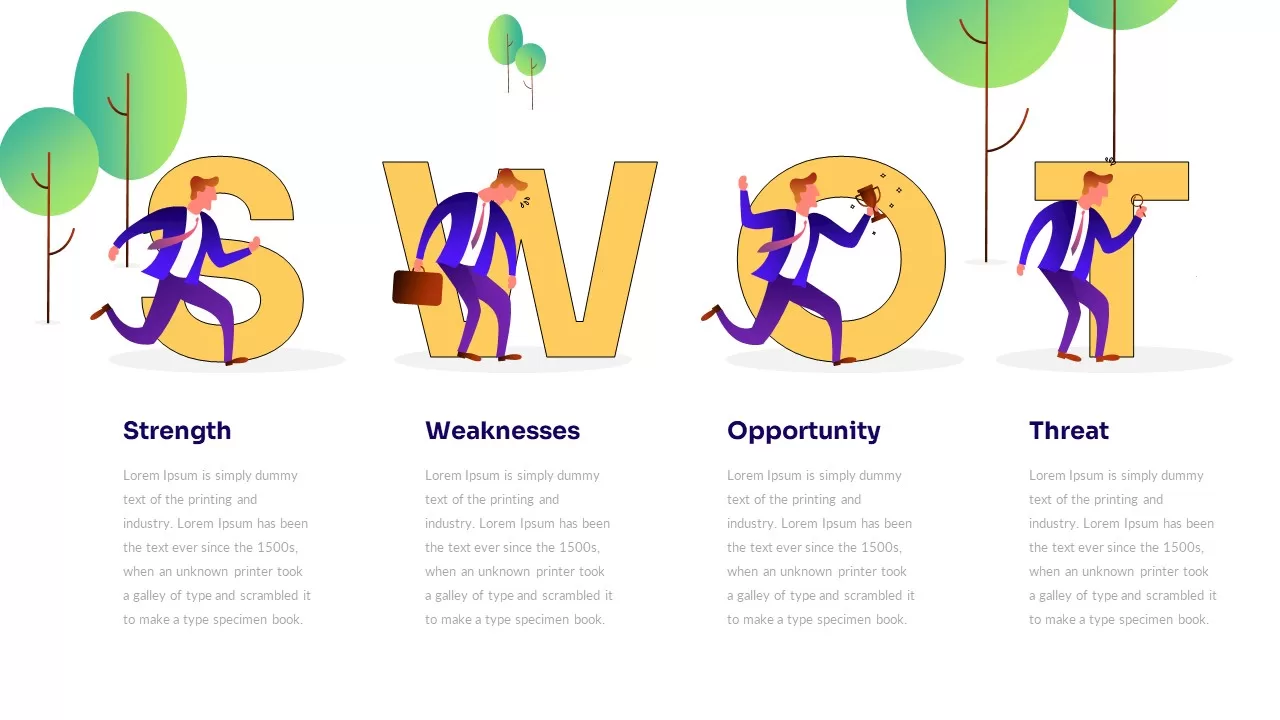
Illustrated Business SWOT Analysis Template for PowerPoint & Google Slides
SWOT
Business Case Deck with Market Analysis Template for PowerPoint & Google Slides
Business Report
Six-Step Business Analysis Template for PowerPoint & Google Slides
Process
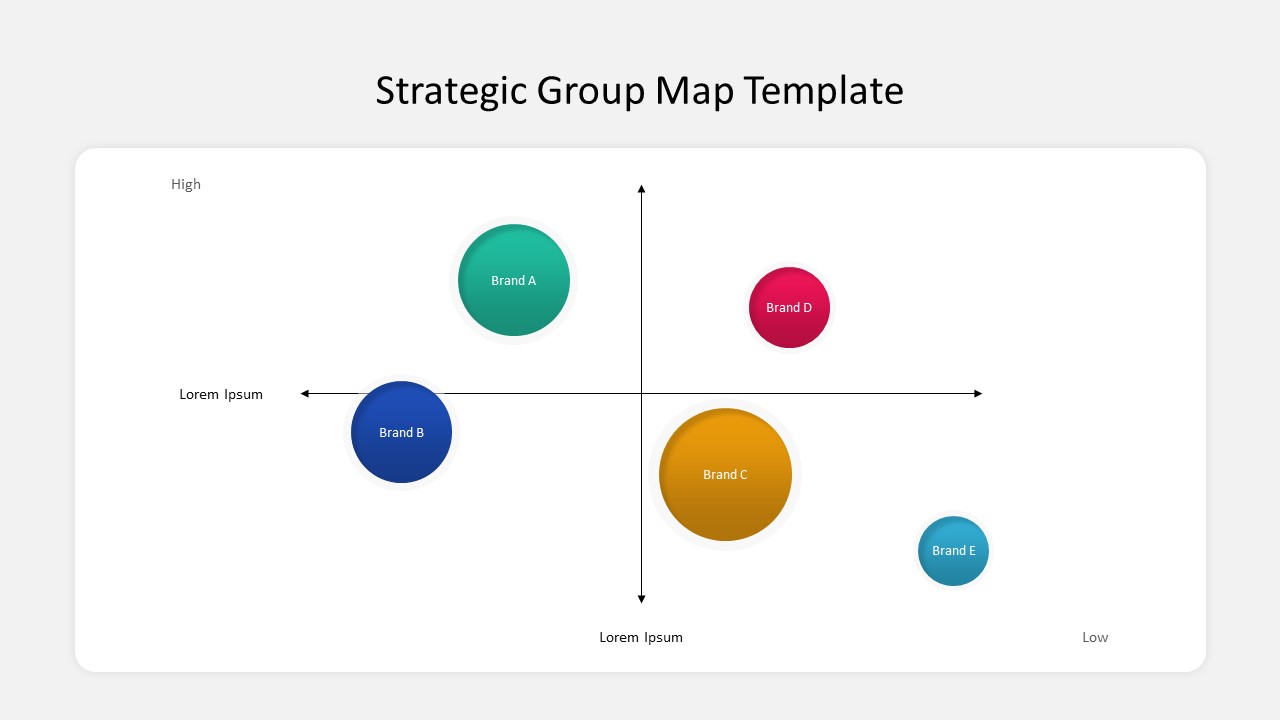
Business Strategic Group Map Analysis Template for PowerPoint & Google Slides
Competitor Analysis
Free
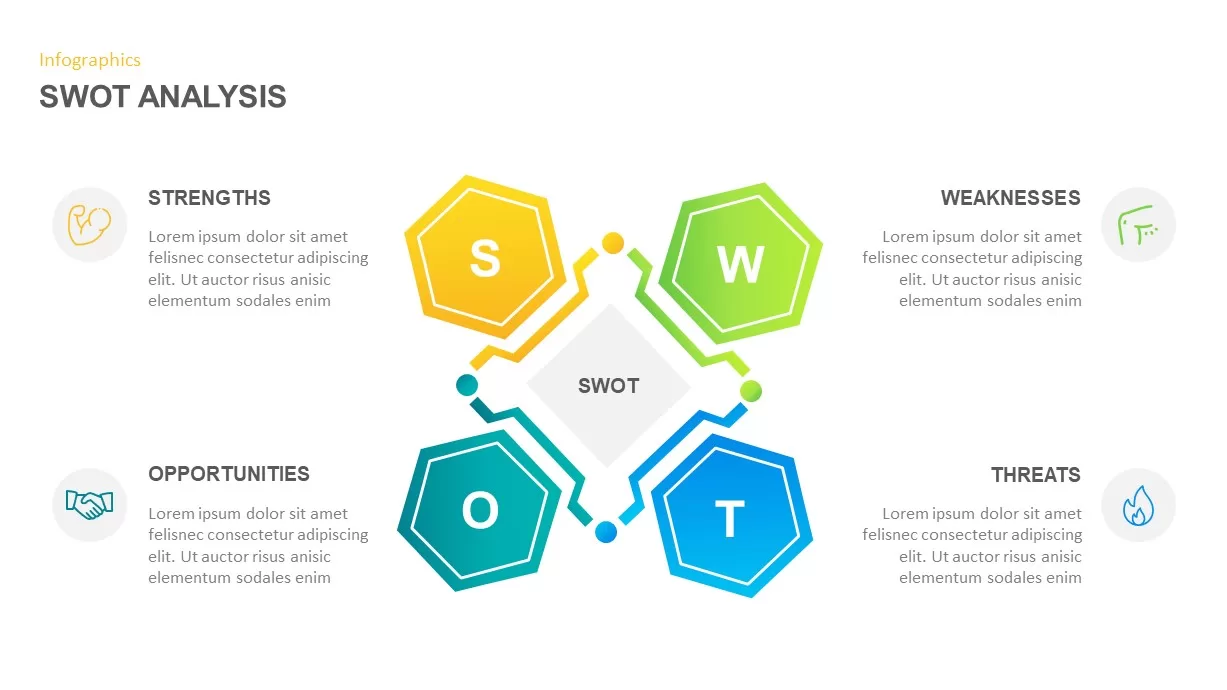
Modern Circle SWOT Analysis Diagram Template for PowerPoint & Google Slides
SWOT
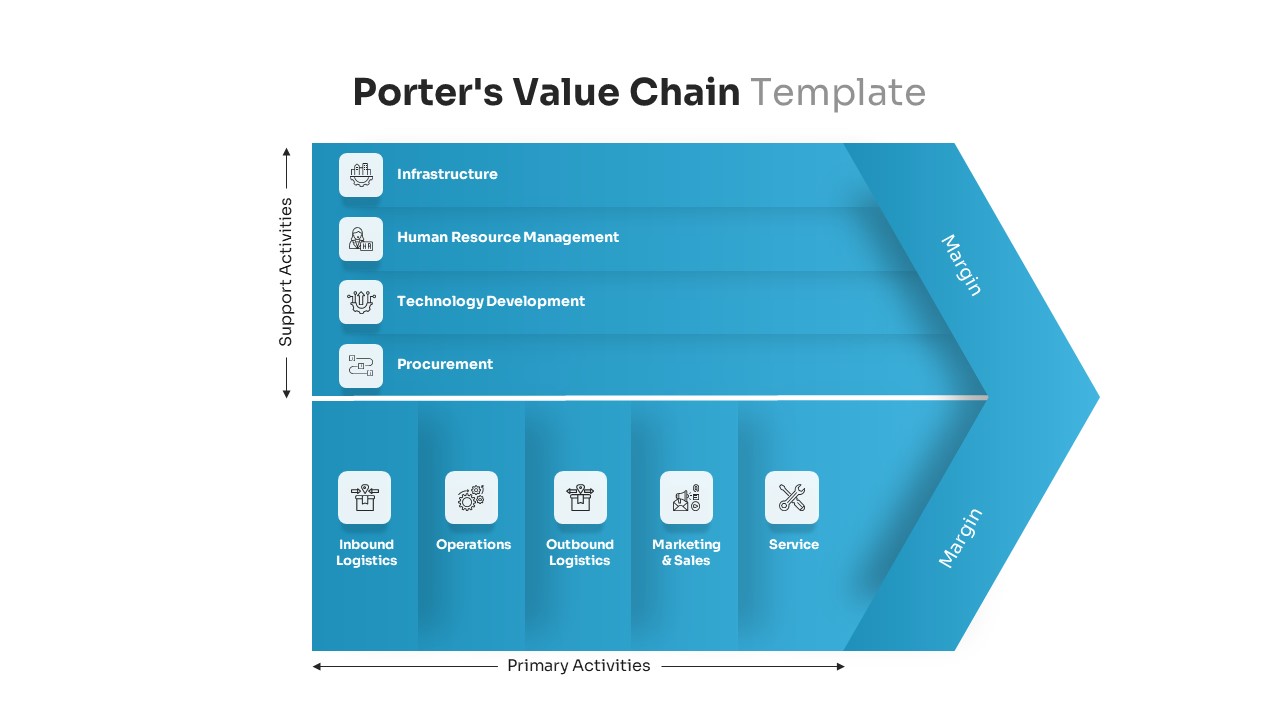
Porter’s Value Chain Analysis Diagram Template for PowerPoint & Google Slides
Business Strategy
Editable Force Field Analysis Diagram Template for PowerPoint & Google Slides
Business Plan

Professional PESTEL Analysis Diagram Template for PowerPoint & Google Slides
PEST
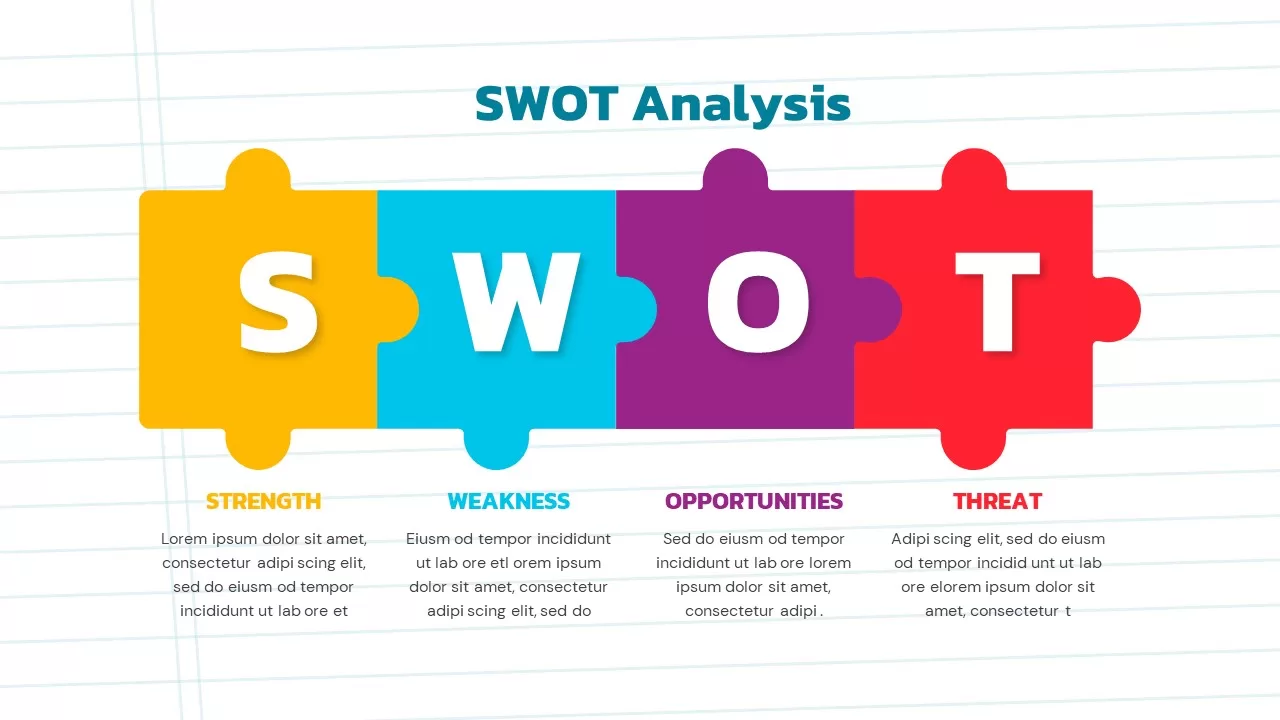
Puzzle-Style SWOT Analysis Table Diagram Template for PowerPoint & Google Slides
SWOT
PEST Analysis Circular Diagram Template for PowerPoint & Google Slides
PEST
PESTLE Analysis Table Layout Diagram Template for PowerPoint & Google Slides
PEST
SWOT Analysis Gear Diagram Slide Template for PowerPoint & Google Slides
SWOT

Interactive Gap Analysis Puzzle Diagram Template for PowerPoint & Google Slides
Gap
Cluster Analysis Infographic Diagram Template for PowerPoint & Google Slides
Business
Fishbone Diagram Analysis Template for PowerPoint & Google Slides
Flow Charts
Four-Quadrant SWOT Analysis Diagram Template for PowerPoint & Google Slides
SWOT
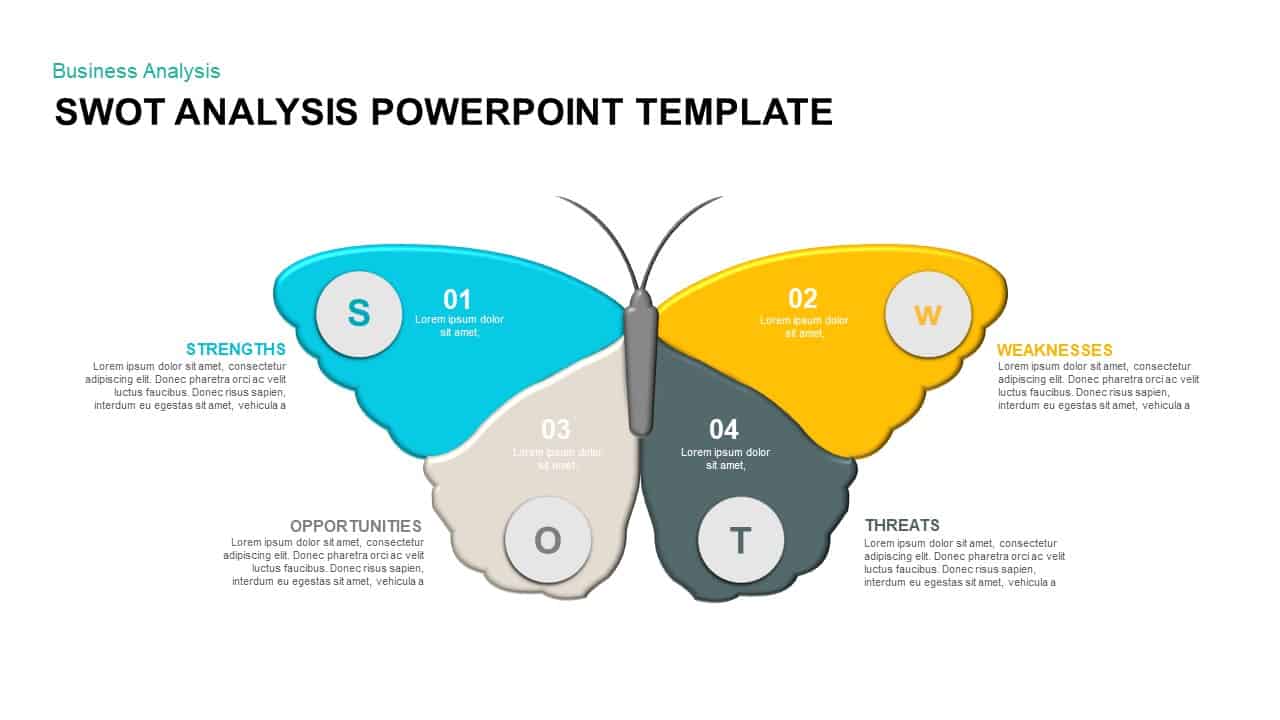
Butterfly SWOT Analysis Diagram Template for PowerPoint & Google Slides
SWOT
Four-Part SWOT Analysis Diagram Template for PowerPoint & Google Slides
SWOT
Fishbone Cause Analysis Diagram Template for PowerPoint & Google Slides
Process

SWOT Analysis Infographic Diagram Template for PowerPoint & Google Slides
SWOT
IQ Scale Analysis Diagram template for PowerPoint & Google Slides
Employee Performance
Puzzle Piece SWOT Analysis Diagram Template for PowerPoint & Google Slides
Opportunities Challenges
Free Root Cause Analysis Fishbone Diagram Template for PowerPoint & Google Slides
Process
Free
Experience Curve Analysis Diagram Template for PowerPoint & Google Slides
Business Strategy
Cost-Volume-Profit Analysis Diagram Template for PowerPoint & Google Slides
Finance

Colorful SWOT Analysis Diagram Template for PowerPoint & Google Slides
SWOT
Bottleneck Process Analysis Diagram Template for PowerPoint & Google Slides
Process
Fundamental Analysis Circular Diagram Template for PowerPoint & Google Slides
Circular
Cultural Web Analysis Circular Diagram Template for PowerPoint & Google Slides
Circular
DESTEP Marketing Analysis Diagram Template for PowerPoint & Google Slides
Circular
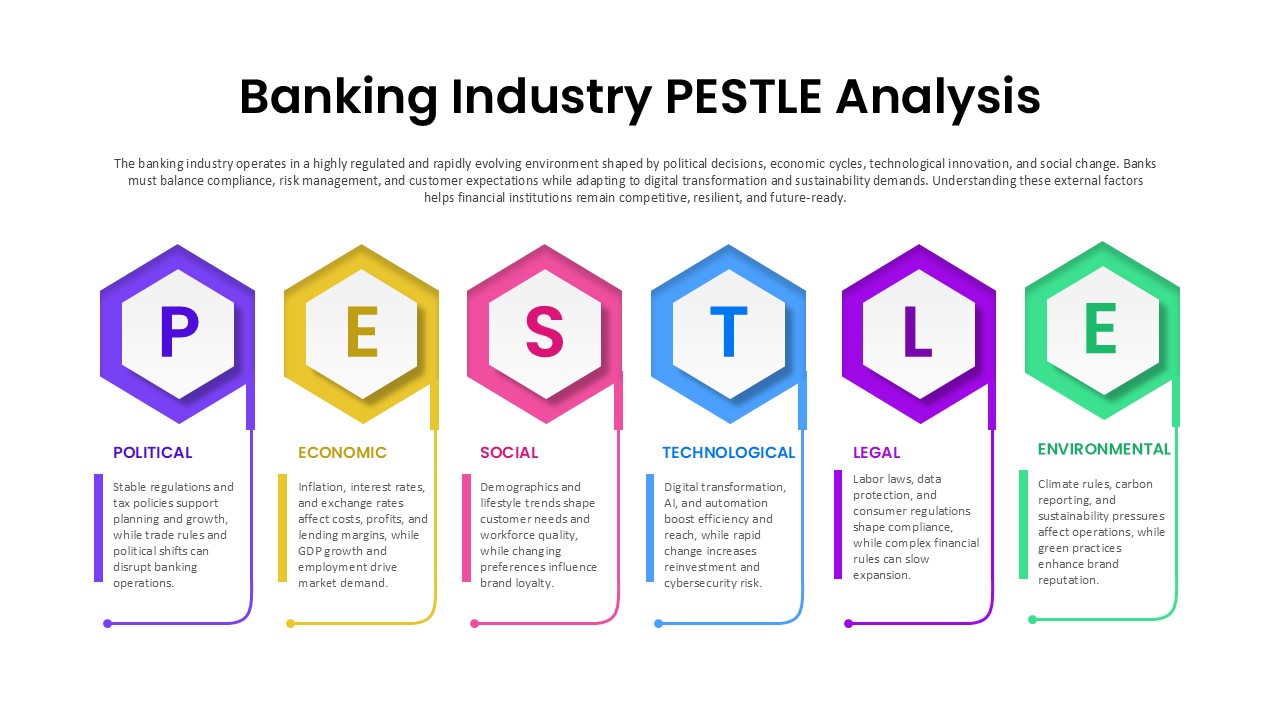
Banking Industry PESTLE Analysis Diagram Template for PowerPoint & Google Slides
PEST
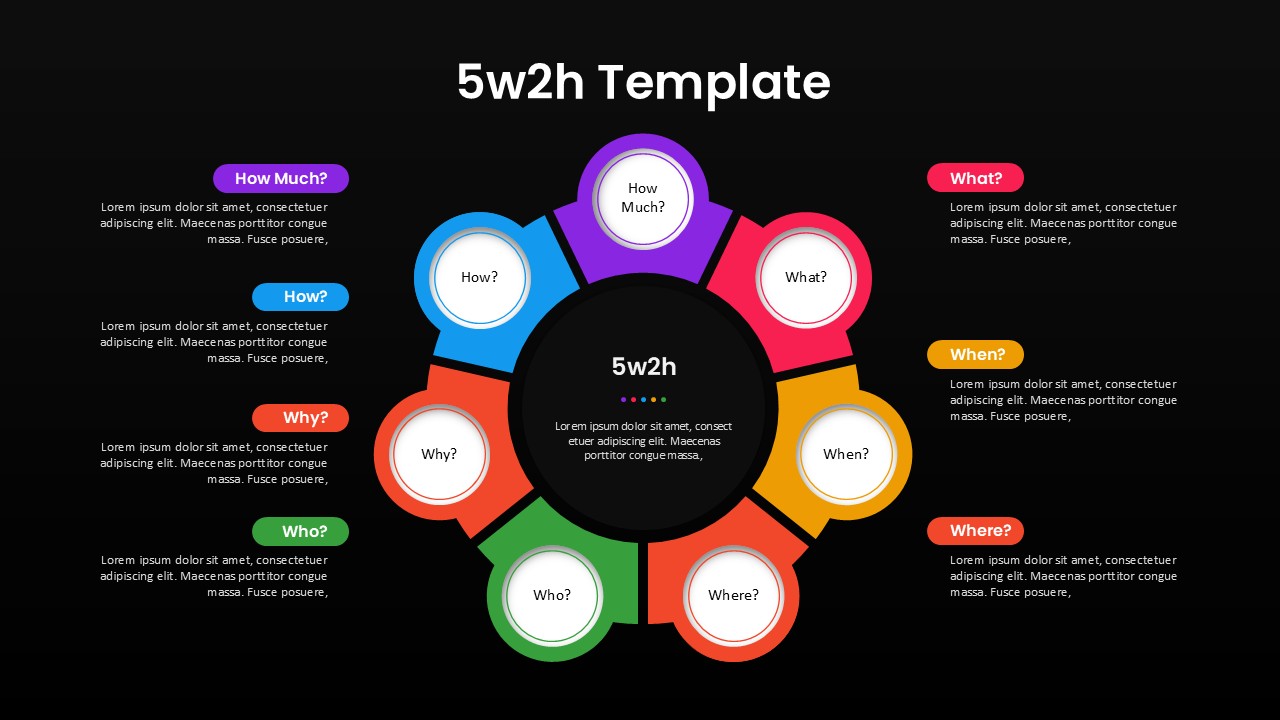
5W2H Analysis Radial Diagram Template for PowerPoint & Google Slides
Decision Tree
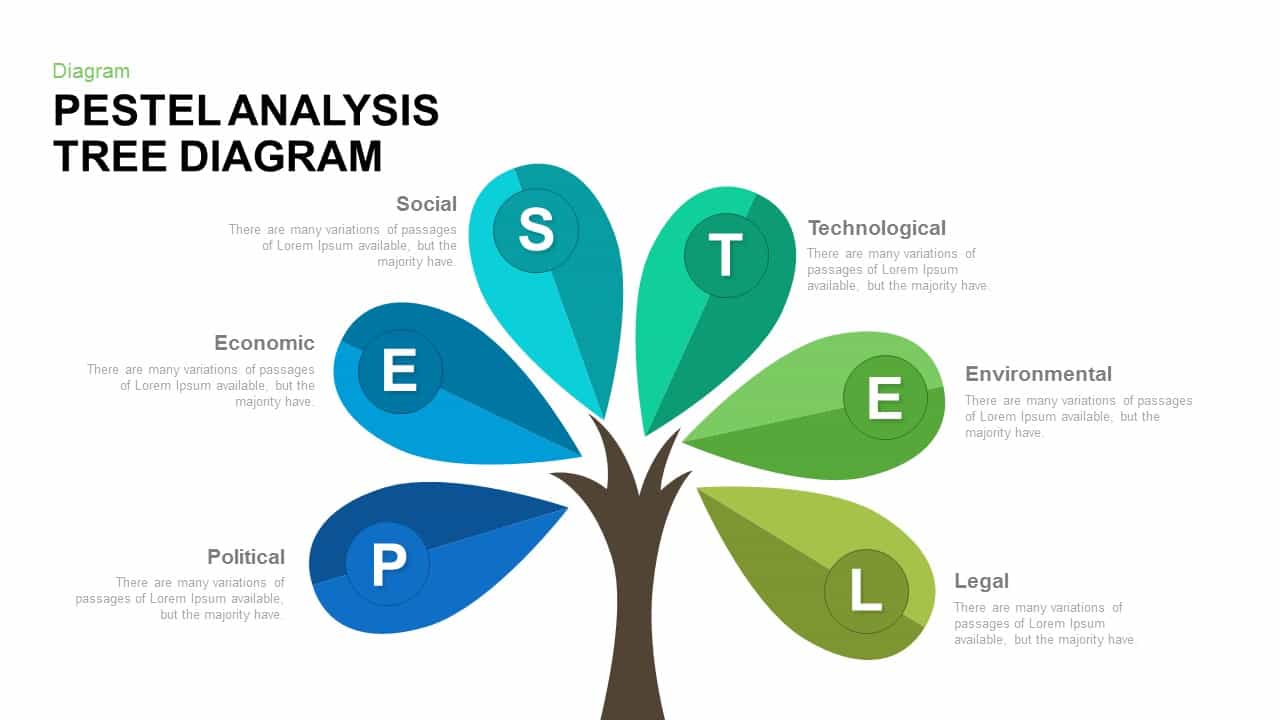
PESTEL Analysis Tree Diagram for PowerPoint & Google Slides
Process
5 Why Fishbone Diagram for Root Cause Analysis in PowerPoint & Google Slides
Process
Business Process Diagram template for PowerPoint & Google Slides
Process
Business Tree Diagram template for PowerPoint & Google Slides
Business Strategy
Business Funnel Diagram template for PowerPoint & Google Slides
Funnel
Business Concept 4 section Diagram template for PowerPoint & Google Slides
Infographics
Four Arrows Business Process Diagram template for PowerPoint & Google Slides
Process
Four-Step Business Staircase Diagram template for PowerPoint & Google Slides
Process
Four-Stage Business Circular Diagram Template for PowerPoint & Google Slides
Process
Six-Part Business Idea Bulb Diagram Template for PowerPoint & Google Slides
Circular
Business Section Diamond Process Diagram Template for PowerPoint & Google Slides
Process
Strategic Business Diamond Diagram Template for PowerPoint & Google Slides
Business Strategy
Vertical Business Process Flow Diagram Template for PowerPoint & Google Slides
Process
Business Strategy Infographics Diagram Template for PowerPoint & Google Slides
Business Strategy
Business Management Hexagon Diagram Template for PowerPoint & Google Slides
Comparison
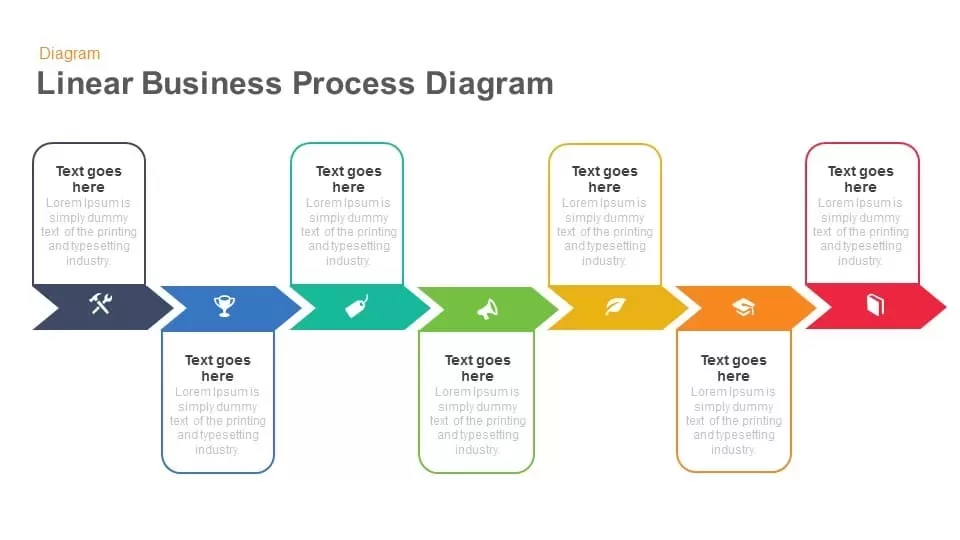
Linear Business Process Diagram template for PowerPoint & Google Slides
Process
10 Stages Business Flow Process Diagram template for PowerPoint & Google Slides
Business

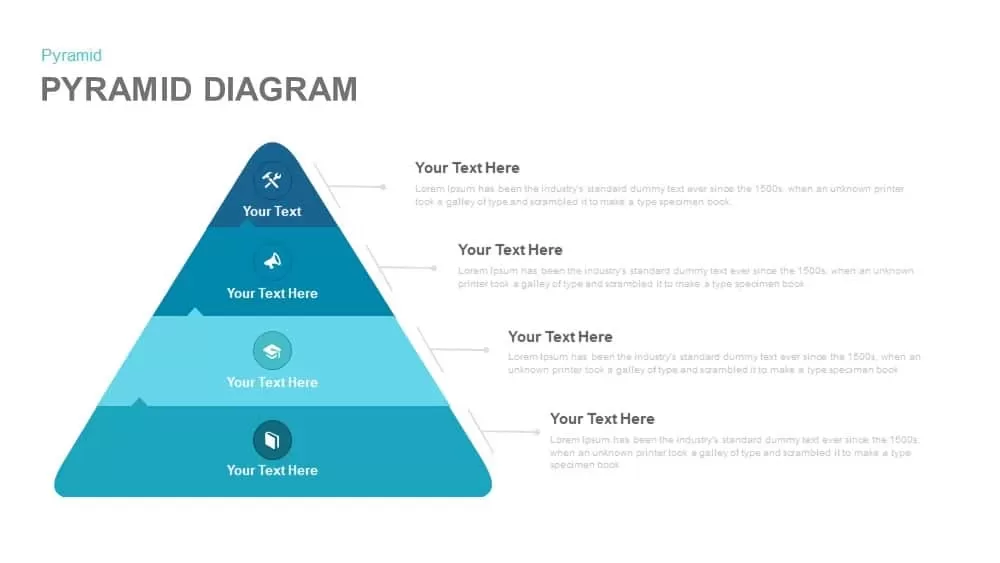
Four-Level Business Pyramid Diagram Template for PowerPoint & Google Slides
Pyramid
Four-Staged Business Arrow Diagram Template for PowerPoint & Google Slides
Process
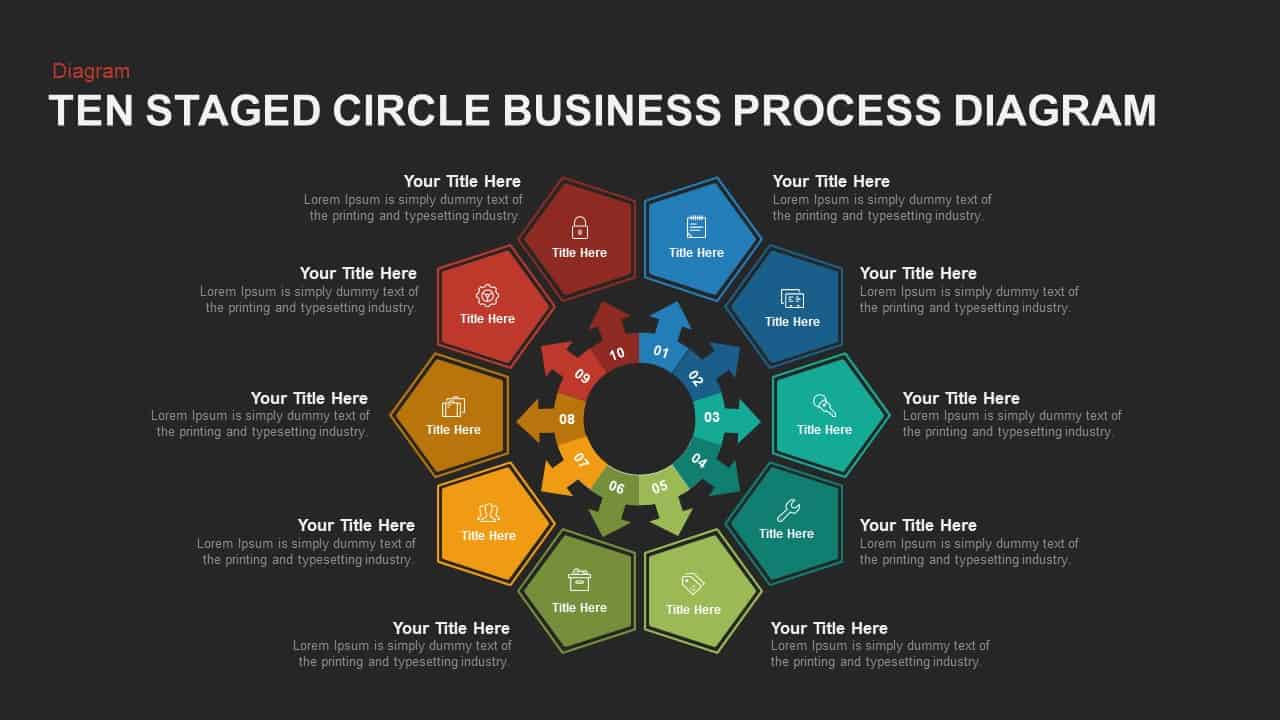
Ten-Stage Business Process Diagram Template for PowerPoint & Google Slides
Process

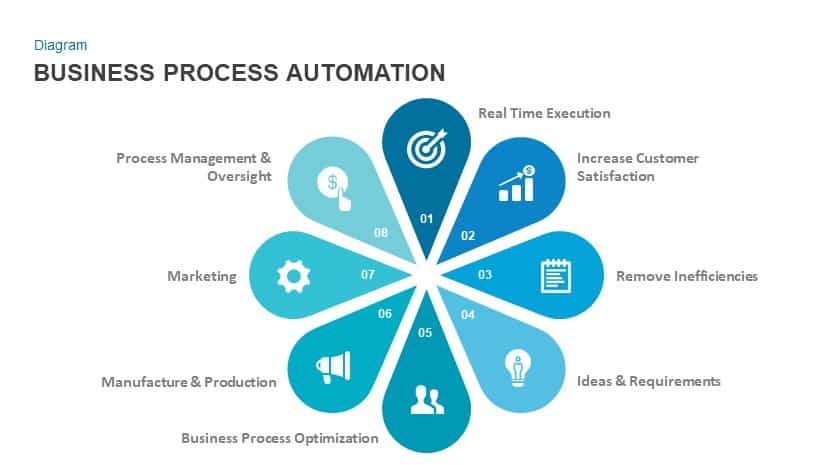
Business Process Automation Diagram Template for PowerPoint & Google Slides
Process
Business Thinking Concept Diagram Template for PowerPoint & Google Slides
Business Strategy
Business Services Infographic Diagram Template for PowerPoint & Google Slides
Infographics
4-Segment Business Project Diamond Diagram Template for PowerPoint & Google Slides
Process
6-Step Business Process Flow Diagram Template for PowerPoint & Google Slides
Process
SEO Business Process Puzzle Diagram Template for PowerPoint & Google Slides
Process
Yearly Business Planning Diamond Diagram Template for PowerPoint & Google Slides
Process
Four Business Structure Types Comparison Diagram Template for PowerPoint & Google Slides
Business Strategy
4 Step Business Concept Diagram Template for PowerPoint & Google Slides
Business
Business Ecosystem Strategy Diagram template for PowerPoint & Google Slides
Business Strategy
Business Model Canvas Diagram Template for PowerPoint & Google Slides
Business Models
Business Strategy House Model Diagram Template for PowerPoint & Google Slides
Business Strategy
Business Process Reengineering Diagram Template for PowerPoint & Google Slides
Circular
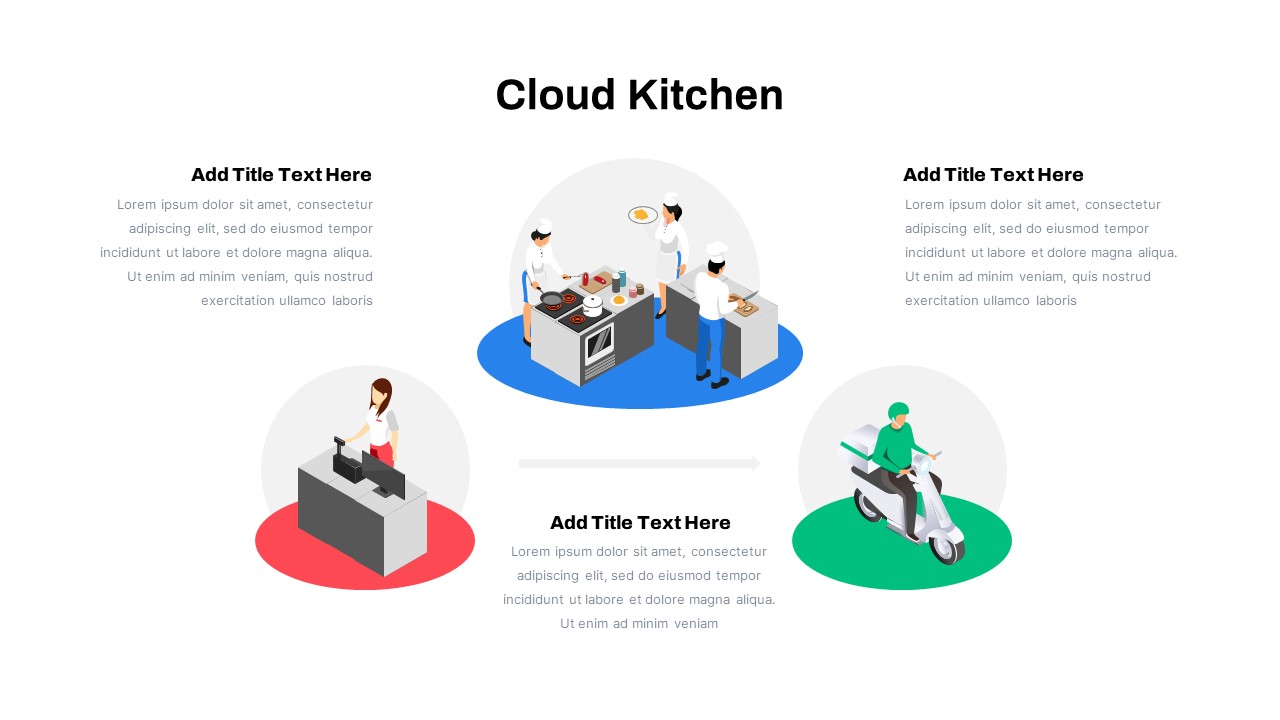
Cloud Kitchen Business Process Diagram Template for PowerPoint & Google Slides
Process
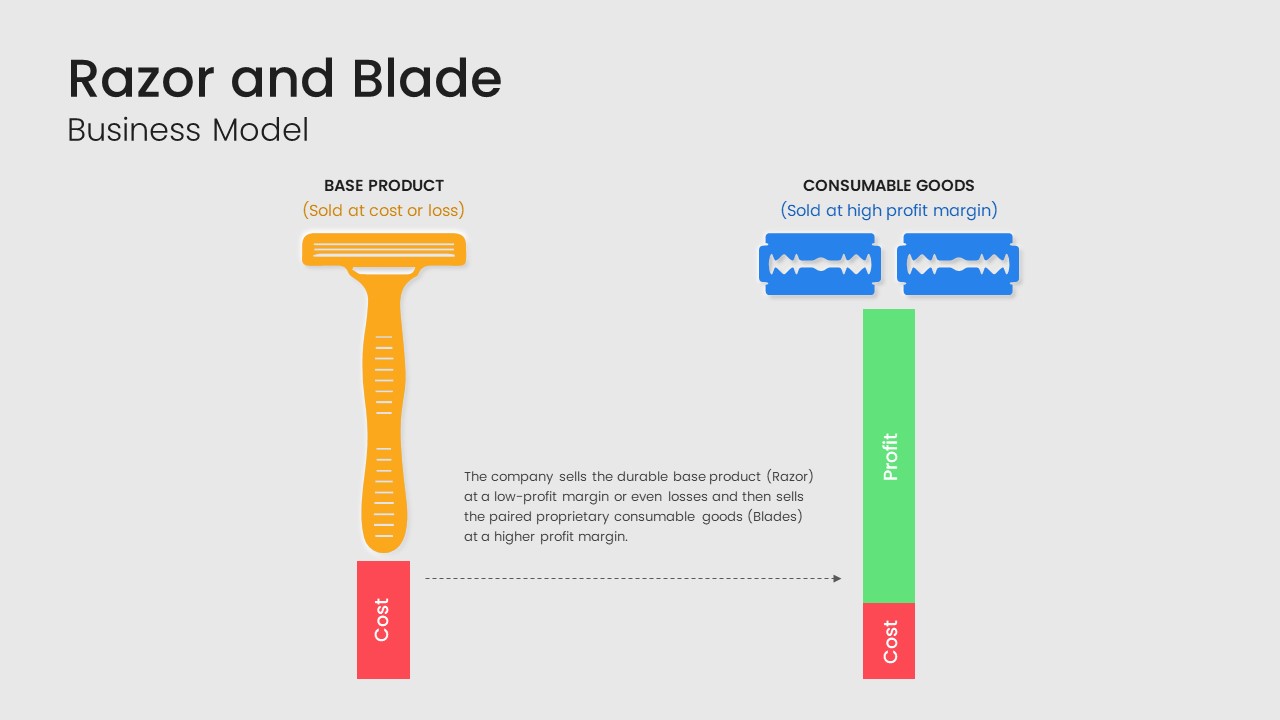
Razor and Blade Business Model Diagram Template for PowerPoint & Google Slides
Business Models
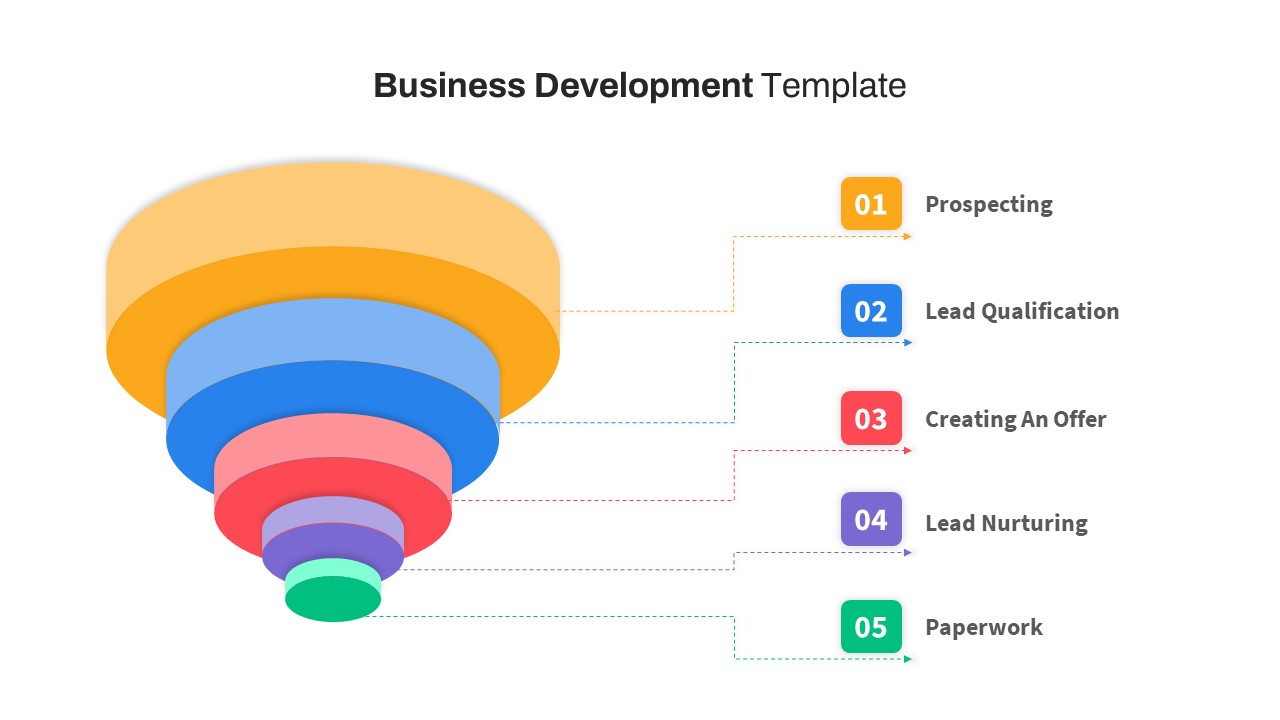
Free Business Development Funnel Diagram Template for PowerPoint & Google Slides
Marketing Funnel
Free
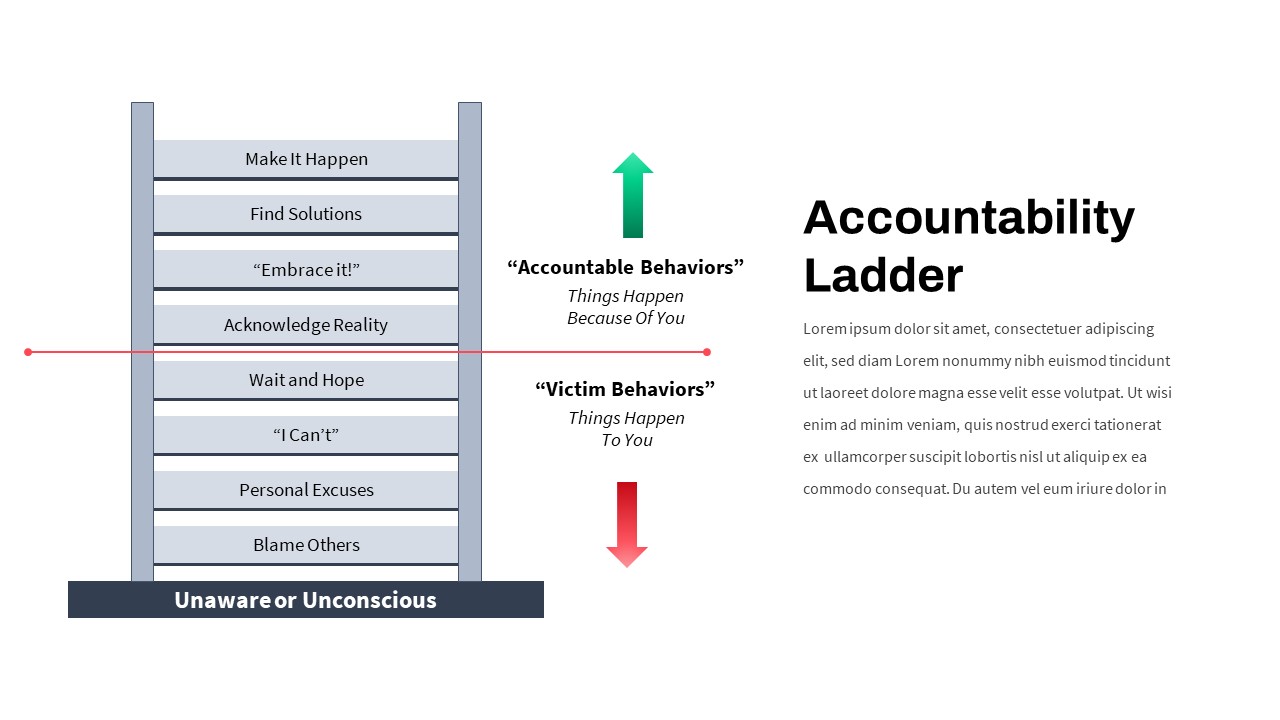
Business Accountability Ladder Diagram Template for PowerPoint & Google Slides
Process
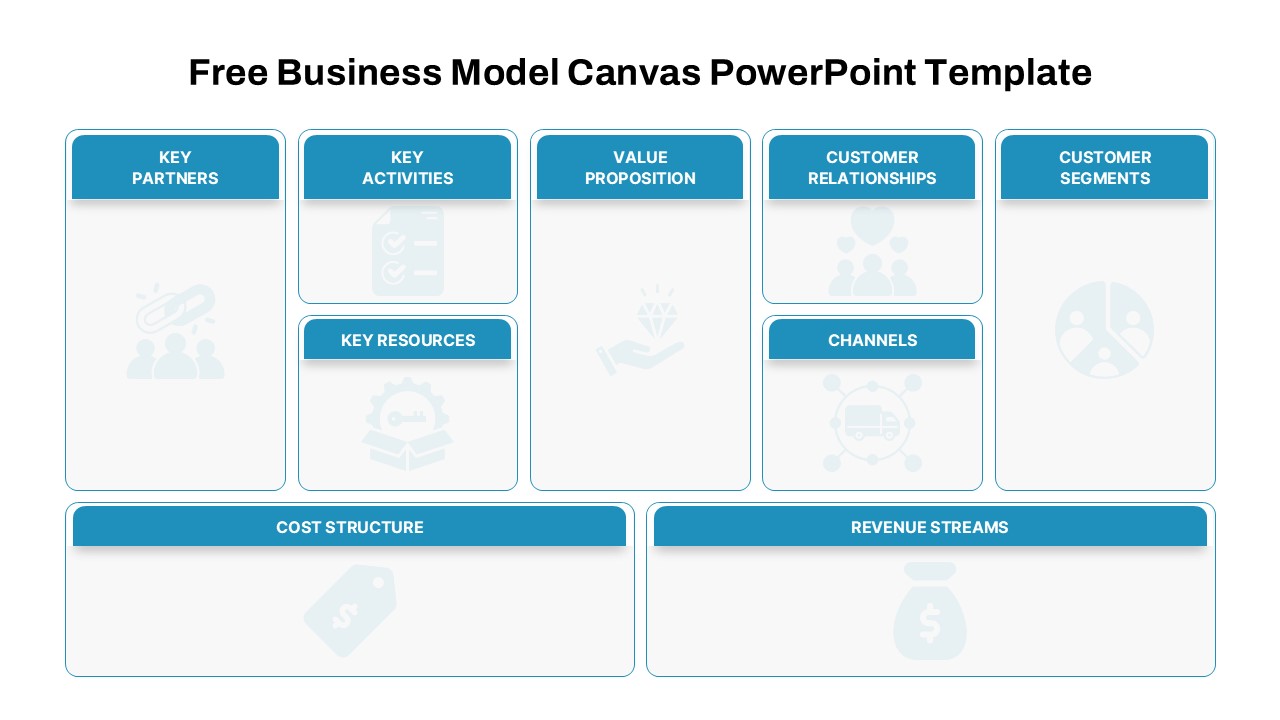
Free Business Model Canvas Diagram Slide Template for PowerPoint & Google Slides
Business Models
Free
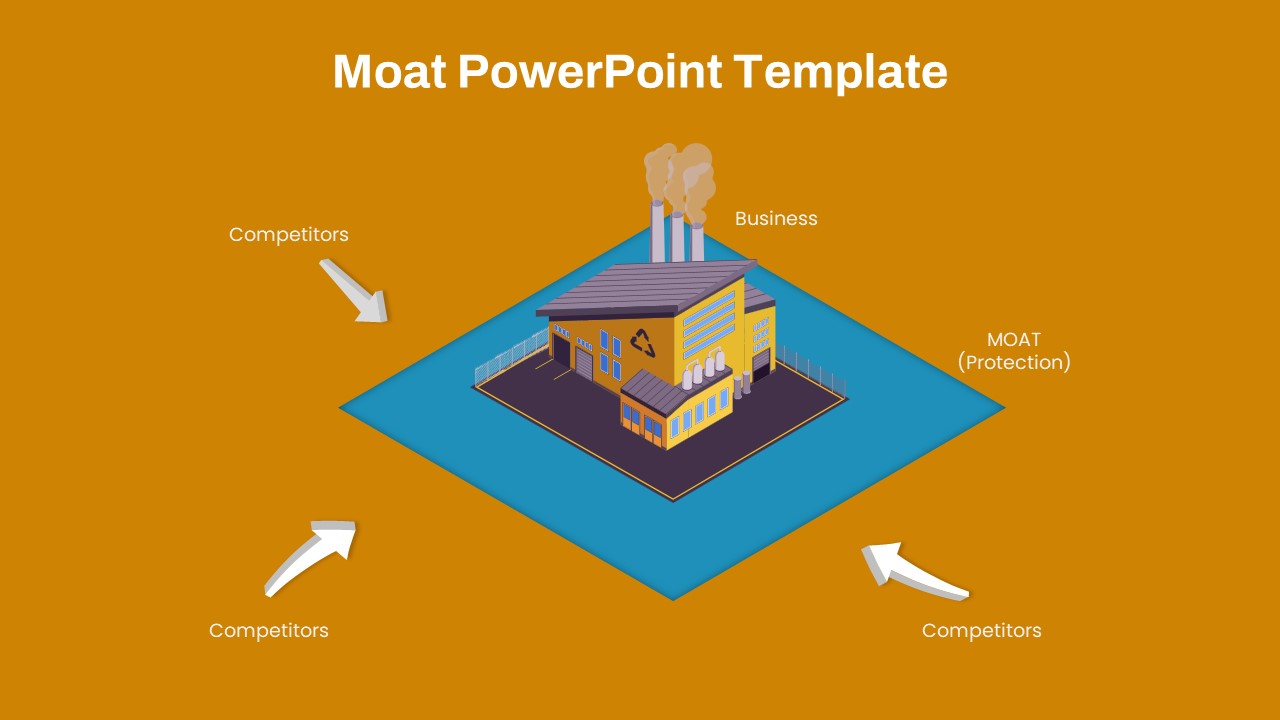
Moat Diagram Business Strategy Template for PowerPoint & Google Slides
Competitor Analysis
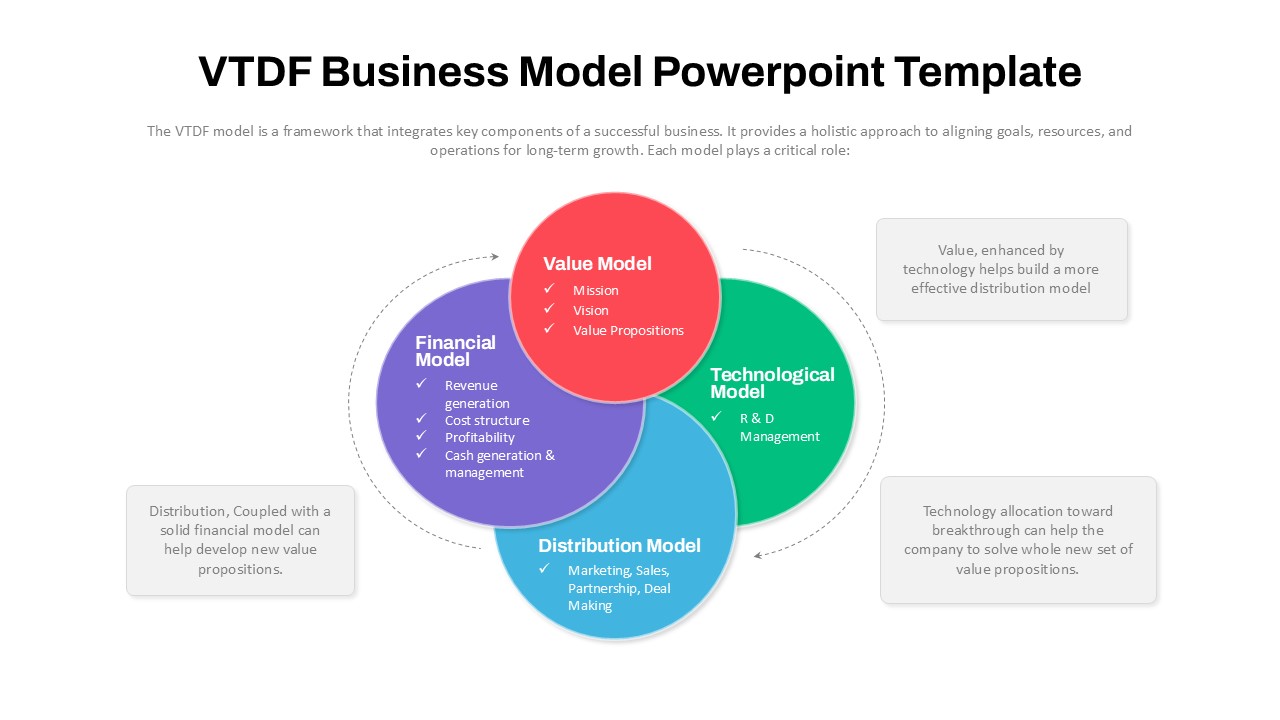
VTDF Business Model Framework Diagram Template for PowerPoint & Google Slides
Business Models
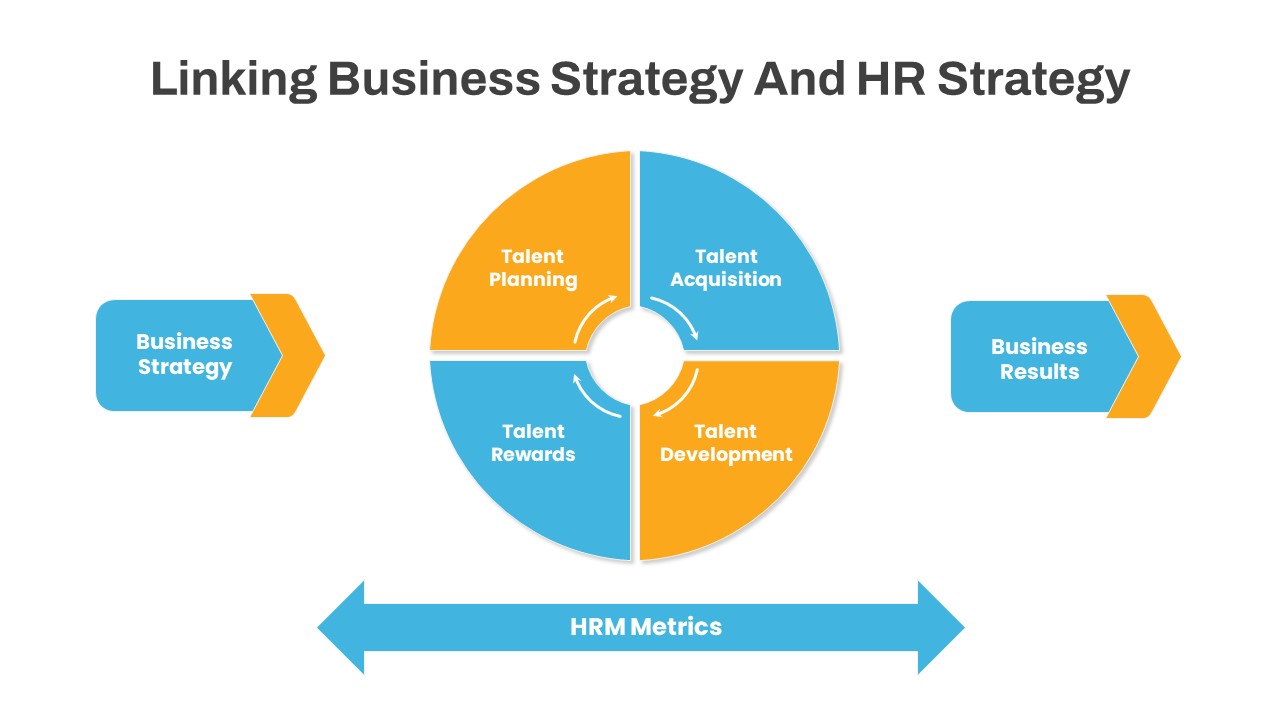
Linking Business HR Strategy Circular Diagram Template for PowerPoint & Google Slides
Business Strategy
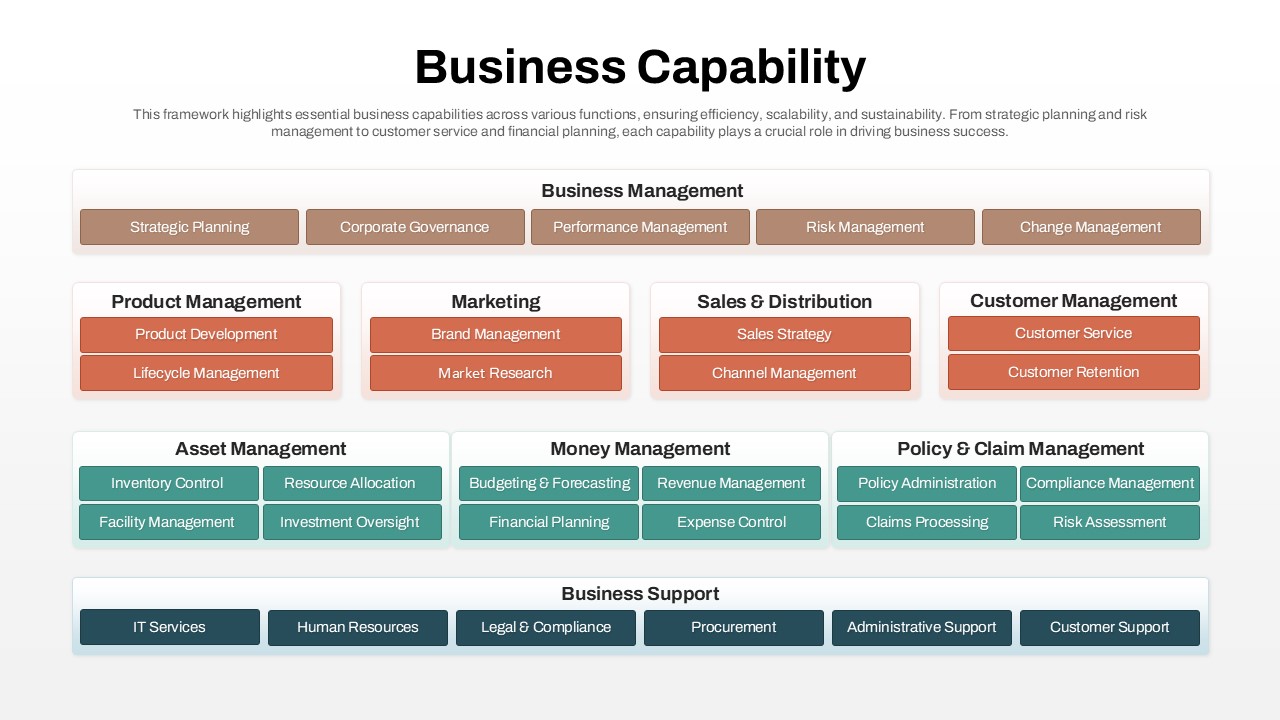
Business Capability Framework Diagram Template for PowerPoint & Google Slides
Business Models
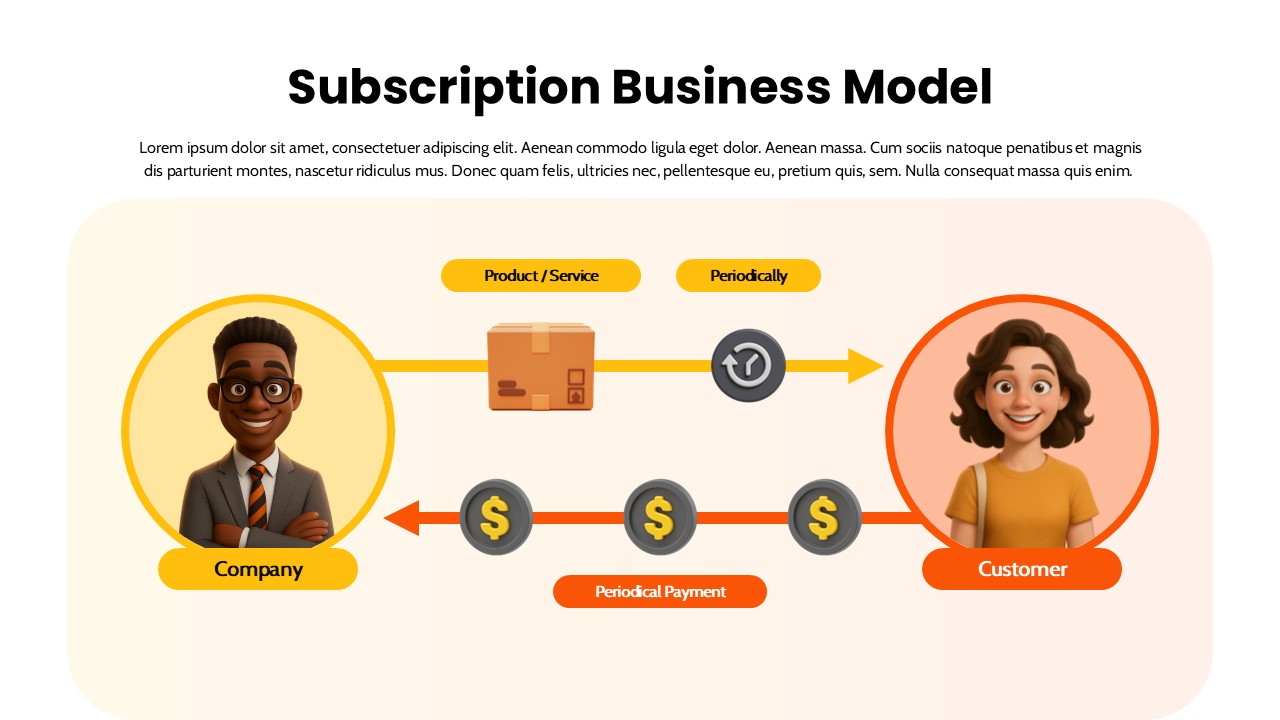
Subscription Business Model Flow Diagram Template for PowerPoint & Google Slides
Business Models
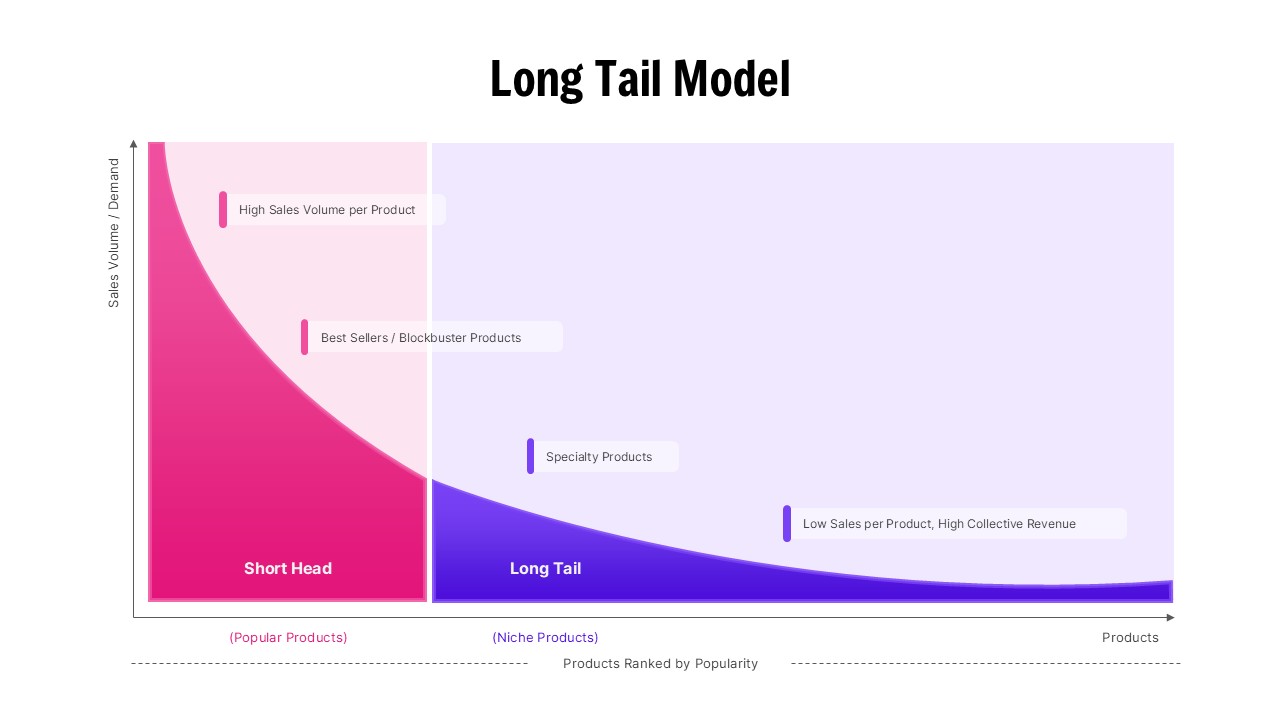
Long Tail Model Business Strategy Diagram Template for PowerPoint & Google Slides
Business