Business Quarter Roadmap Timeline Template for PowerPoint & Google Slides


Description
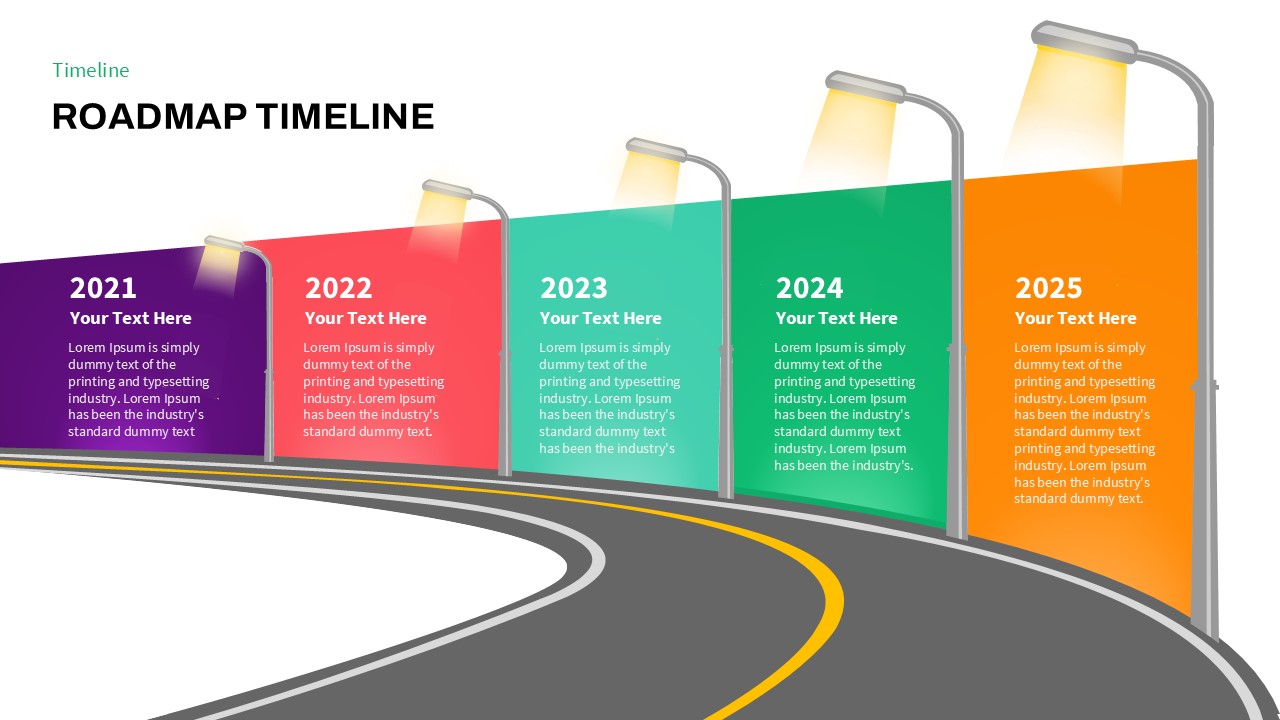
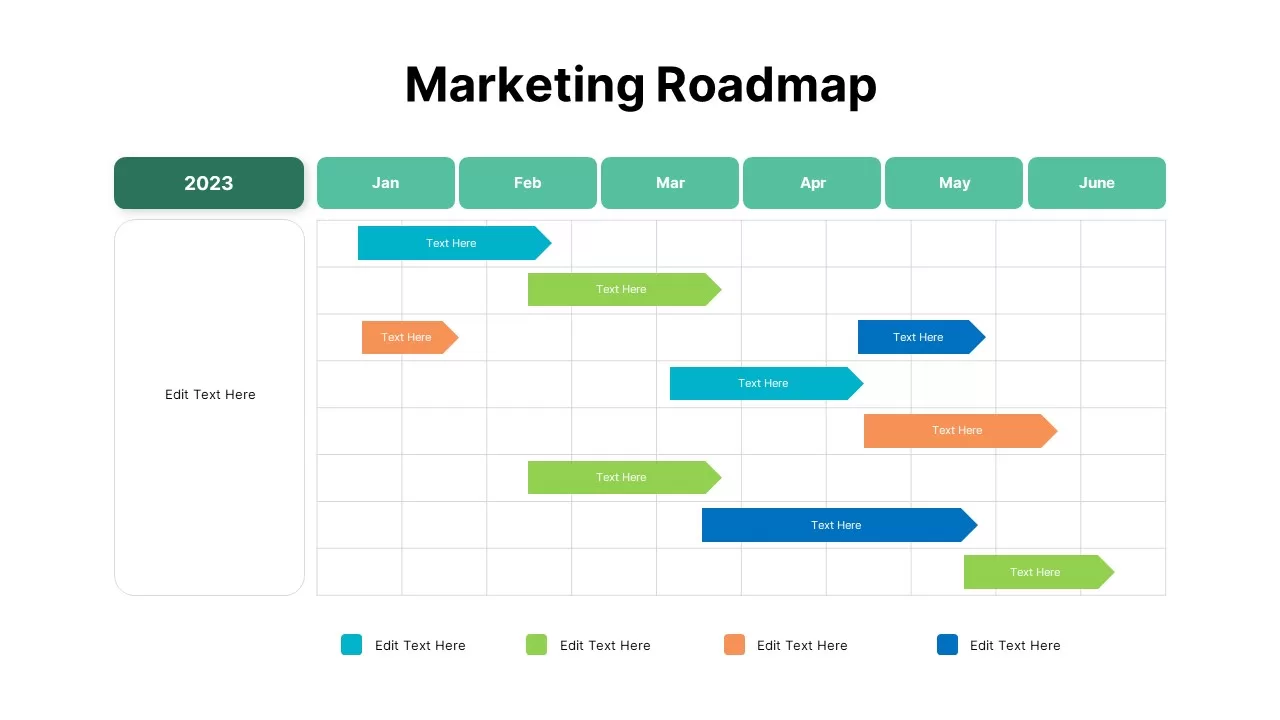
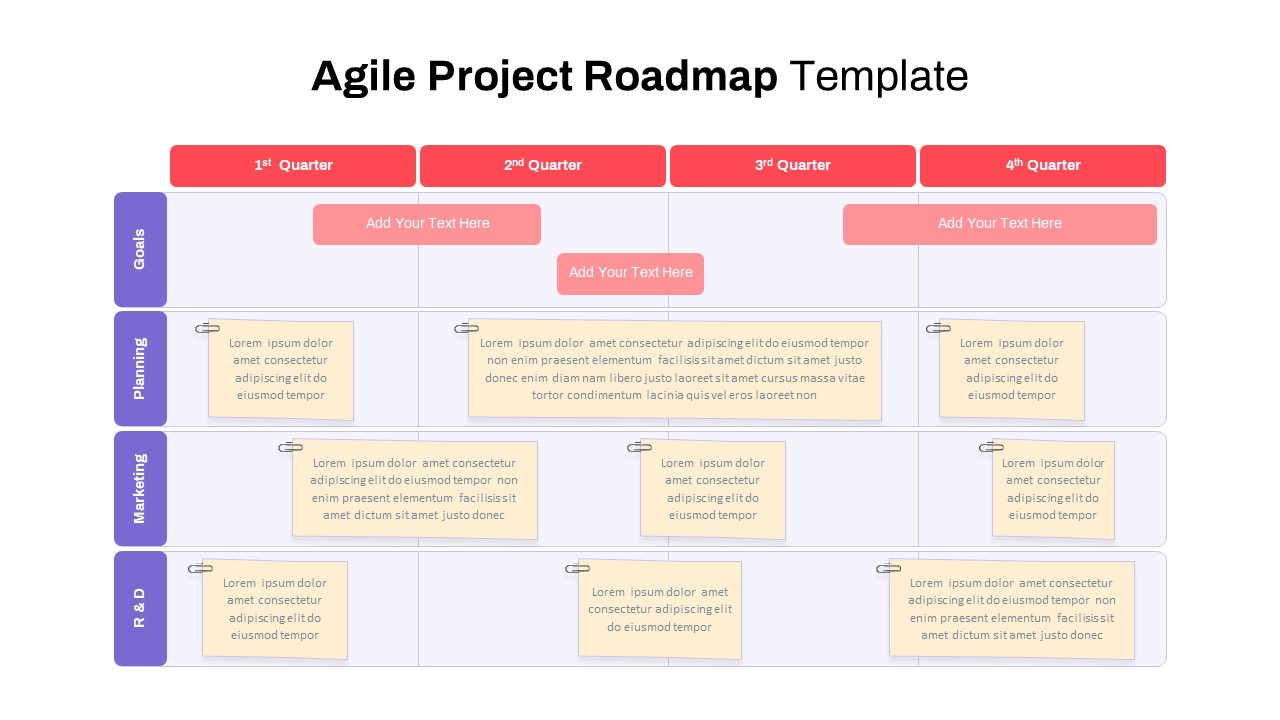
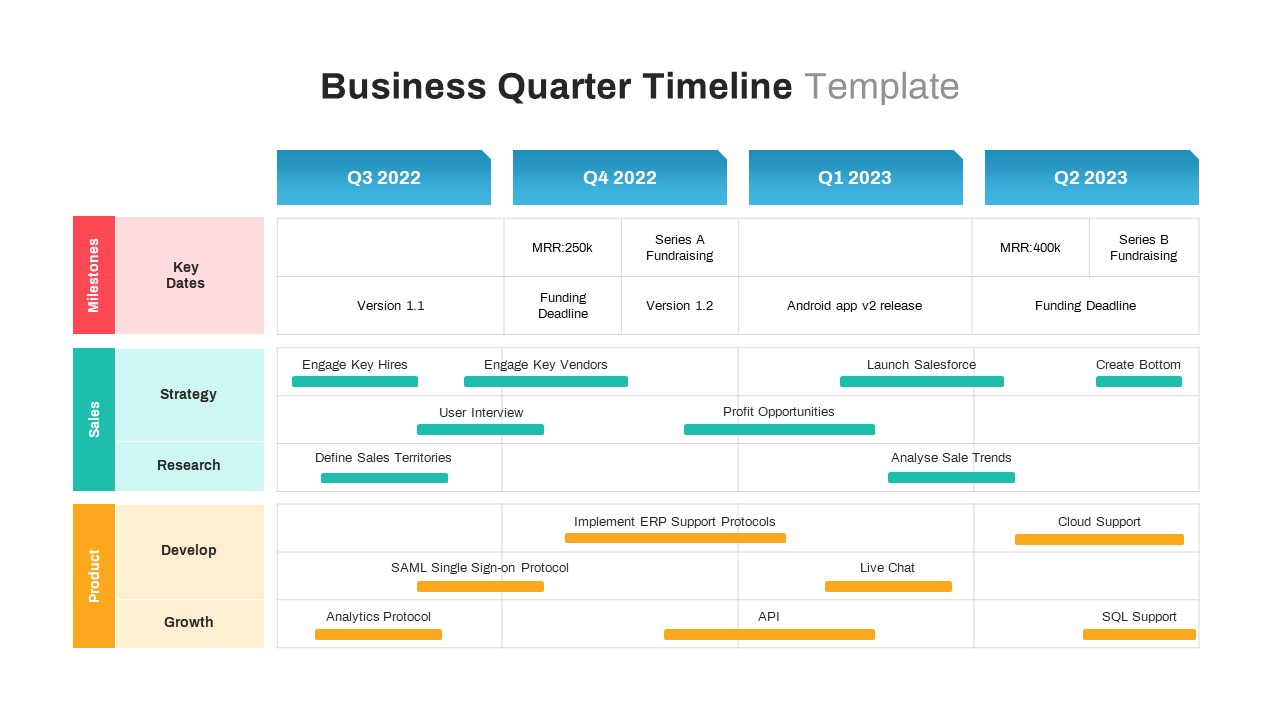
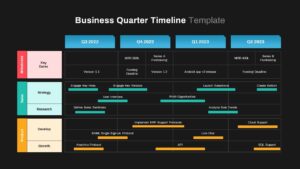
This business quarter timeline slide presents a structured, four-column layout that maps key milestones and departmental initiatives across fiscal quarters Q3 2022 to Q2 2023. Each column features a crisp gradient header block with quarter labels, and the leftmost colored sidebar identifies Milestones (pink), Sales (teal), and Product (amber) categories. Within the grid, strategically placed horizontal bars in matching accent hues denote high-level Strategy and Research tasks, while gold bars illustrate Development and Growth activities. The clean white background, thin gray gridlines, and consistent typographic hierarchy ensure information remains accessible and visually coherent.
Icon placeholders are easily swapped with your own vector graphics, and text placeholders support rich formatting for headings, subheaders, and bullet points. The visual separation between quarter headers and task bars allows audiences to trace schedules at a glance.
Designed for quick adaptation, the fully editable slide leverages PowerPoint master layouts and Google Slides themes so you can update dates, swap bar colors, or adjust category labels in seconds while preserving the overall composition. Duplicate or remove rows to reflect additional teams, extend the timeline by adding columns for future quarters, or convert the layout into a vertical roadmap in just a few clicks. Editable vector shapes, simple accent palette, and non-destructive design elements guarantee seamless brand alignment and consistent formatting across screens and printouts. Whether you’re planning sales targets, product roadmaps, or cross-functional project phases, this versatile timeline template streamlines communication and facilitates stakeholder engagement by presenting complex schedules in a cohesive, memorable format.
All elements are vector-based for limitless scalability and crisp printing.
Who is it for
Project managers, sales directors, and product leaders will find this quarter timeline invaluable for mapping strategic initiatives, aligning cross-functional teams, and monitoring progress against financial targets. Marketing teams, operations managers, and executive sponsors can leverage this organized visual framework to enhance transparency and drive informed decision-making across their organizations.
Other Uses
Apart from quarterly business planning, repurpose this layout for sales pipeline reviews, fundraising roadmaps, or product release schedules. Use the grid to outline training modules, compliance timelines, or marketing campaign phases. With minimal adjustments, this slide can also support board updates, investor presentations, and financial reporting dashboards.
Login to download this file

Item ID
SB03428
Related Templates

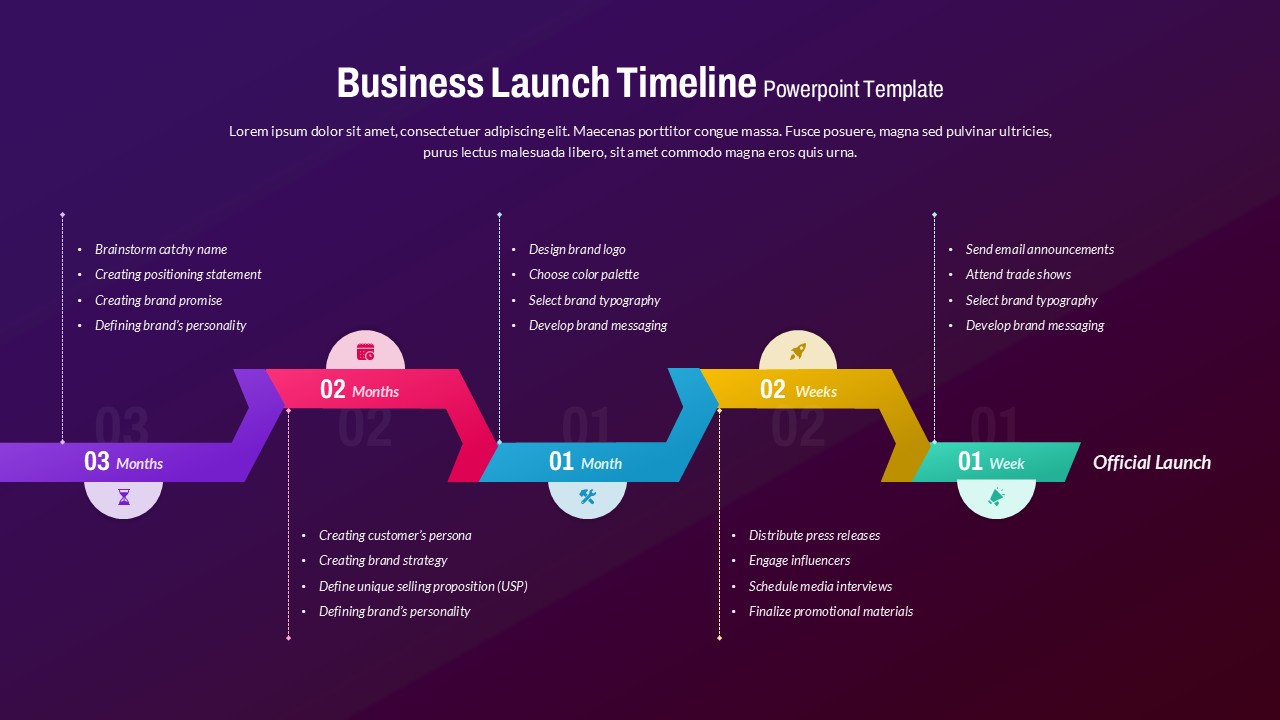
Business Launch Timeline Roadmap 5-Phase Template for PowerPoint & Google Slides
Business

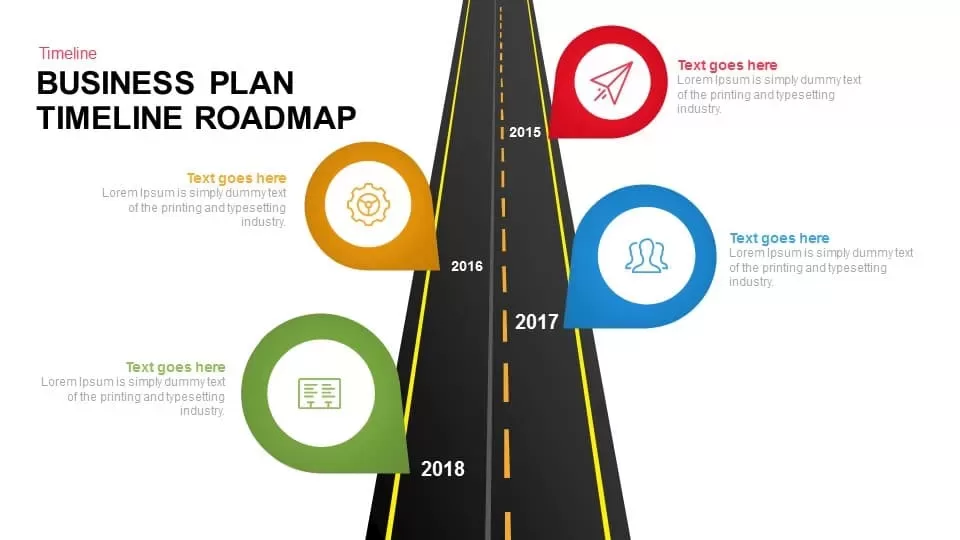
Business Plan Timeline Roadmap for PowerPoint & Google Slides
Roadmap
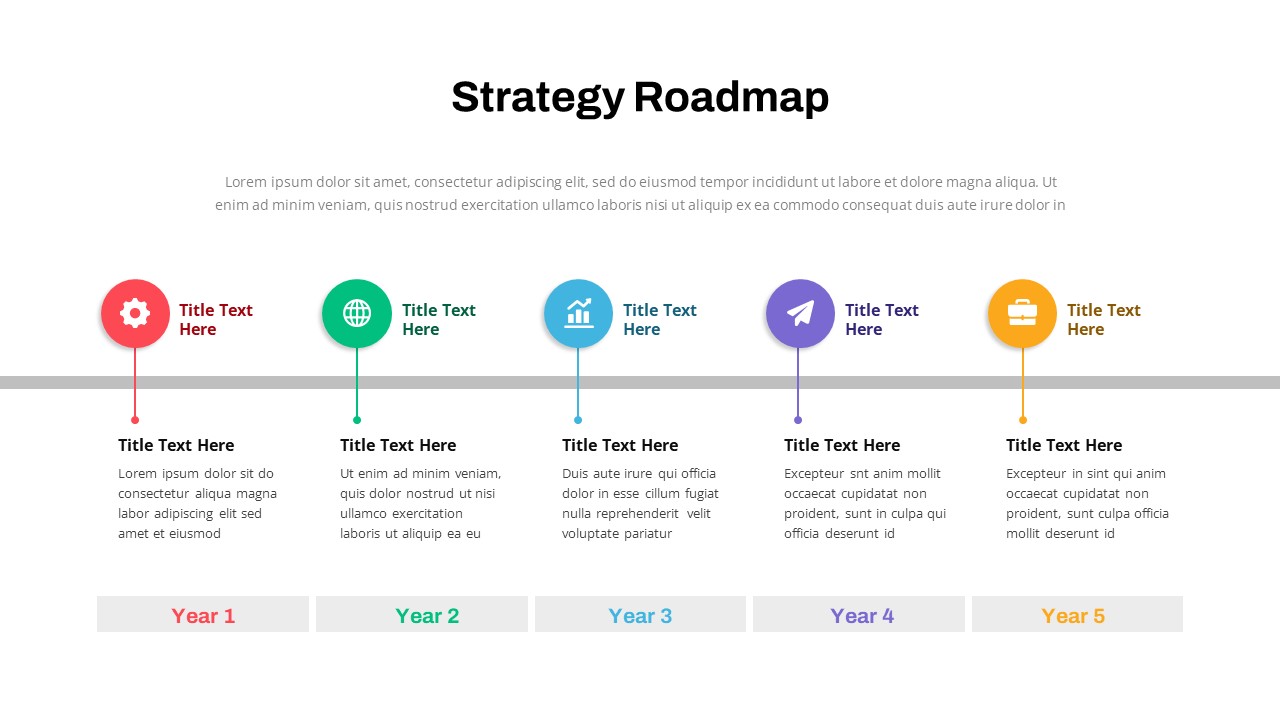
Strategy Roadmap Timeline Slides Template for PowerPoint & Google Slides
Roadmap

Product Roadmap Gantt Chart Timeline template for PowerPoint & Google Slides
Gantt Chart
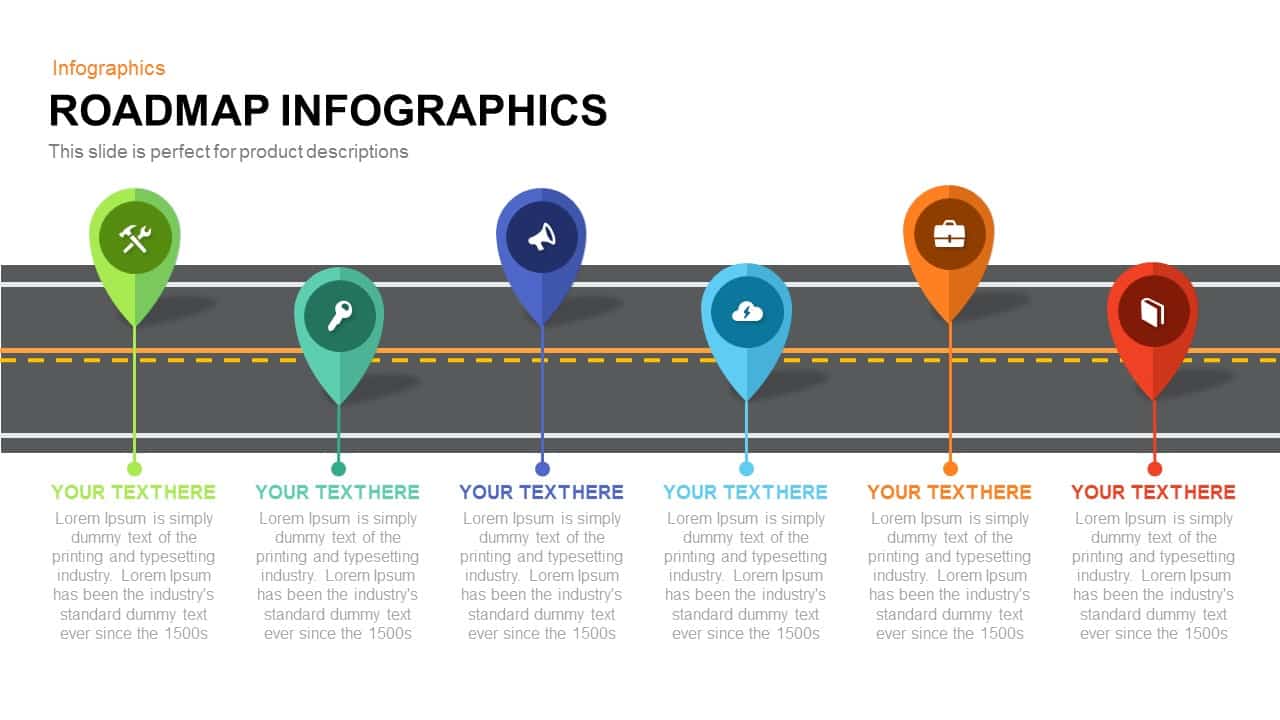
Roadmap Infographic Timeline Slide Template for PowerPoint & Google Slides
Roadmap
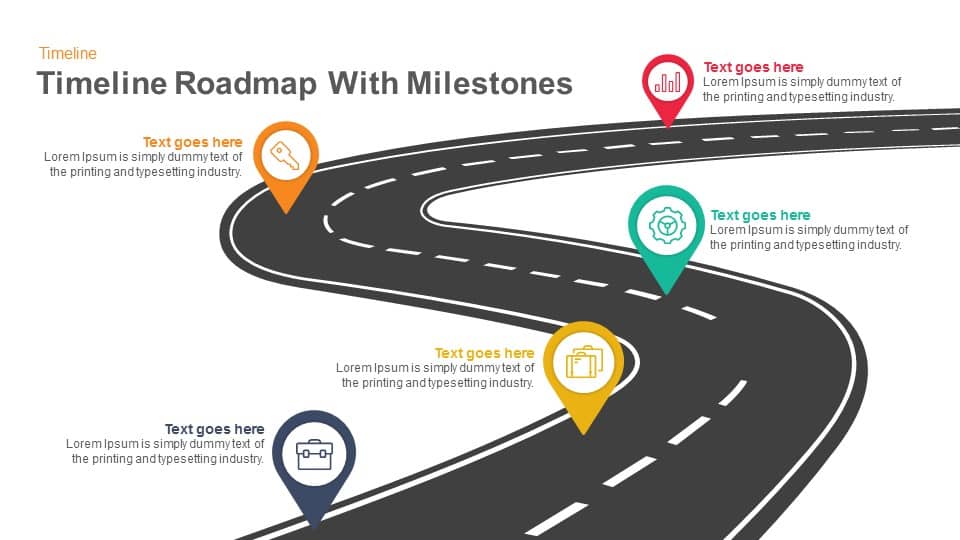
Timeline Roadmap with Milestones template for PowerPoint & Google Slides
Roadmap

Timeline Roadmap Milestones Infographic Template for PowerPoint & Google Slides
Roadmap
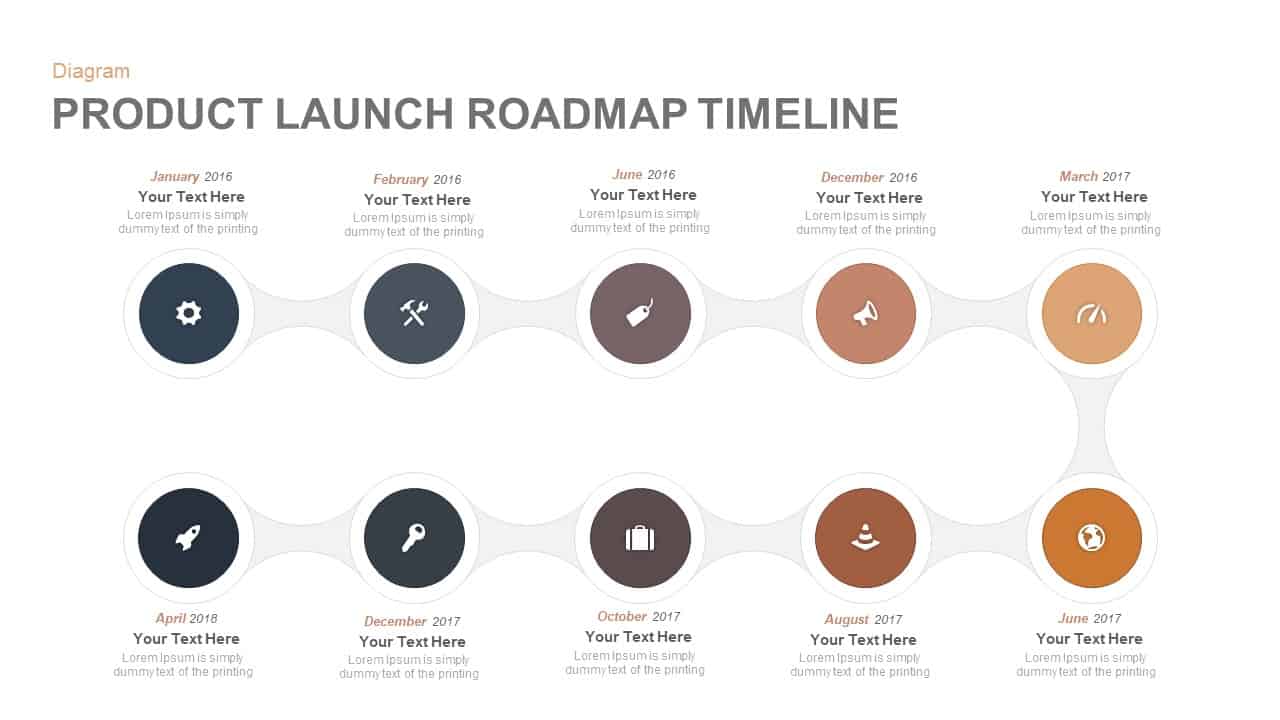
Product Launch Roadmap Timeline Template for PowerPoint & Google Slides
Timeline
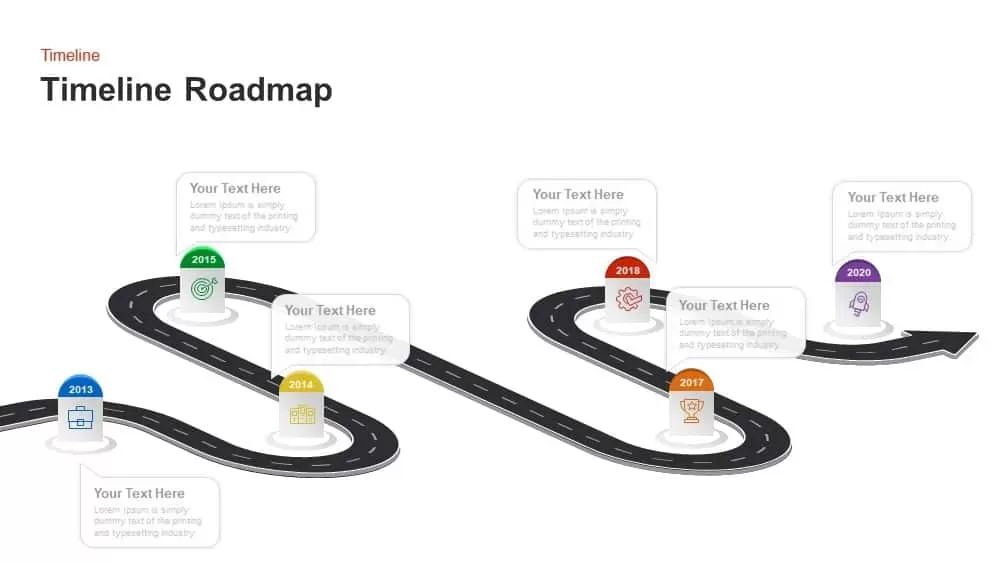
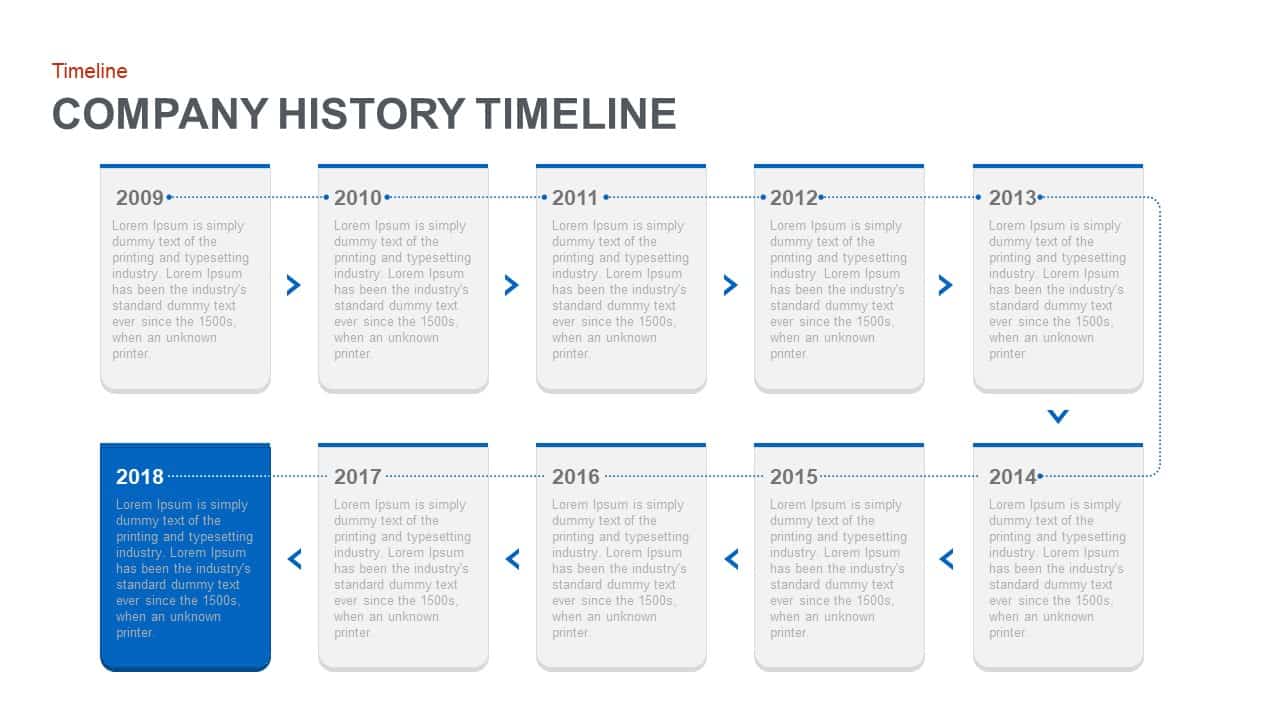
Company History Timeline Roadmap Template for PowerPoint & Google Slides
Timeline
Curved Road Roadmap Timeline Diagram Template for PowerPoint & Google Slides
Roadmap
Product Roadmap Timeline template for PowerPoint & Google Slides
Project Status
Free Colorful Roadmap Timeline Infographic Template for PowerPoint & Google Slides
Roadmap
Free
Roadmap Timeline Template for PowerPoint & Google Slides
Timeline
Customizable Marketing Roadmap Timeline Template for PowerPoint & Google Slides
Roadmap
Quarterly Roadmap Timeline Infographic Template for PowerPoint & Google Slides
Timeline
Six-Month Innovation Roadmap Timeline Template for PowerPoint & Google Slides
Roadmap
Timeline Roadmap with Progress Bar Template for PowerPoint & Google Slides
Timeline
Modern Social Media Timeline Roadmap Template for PowerPoint & Google Slides
Timeline
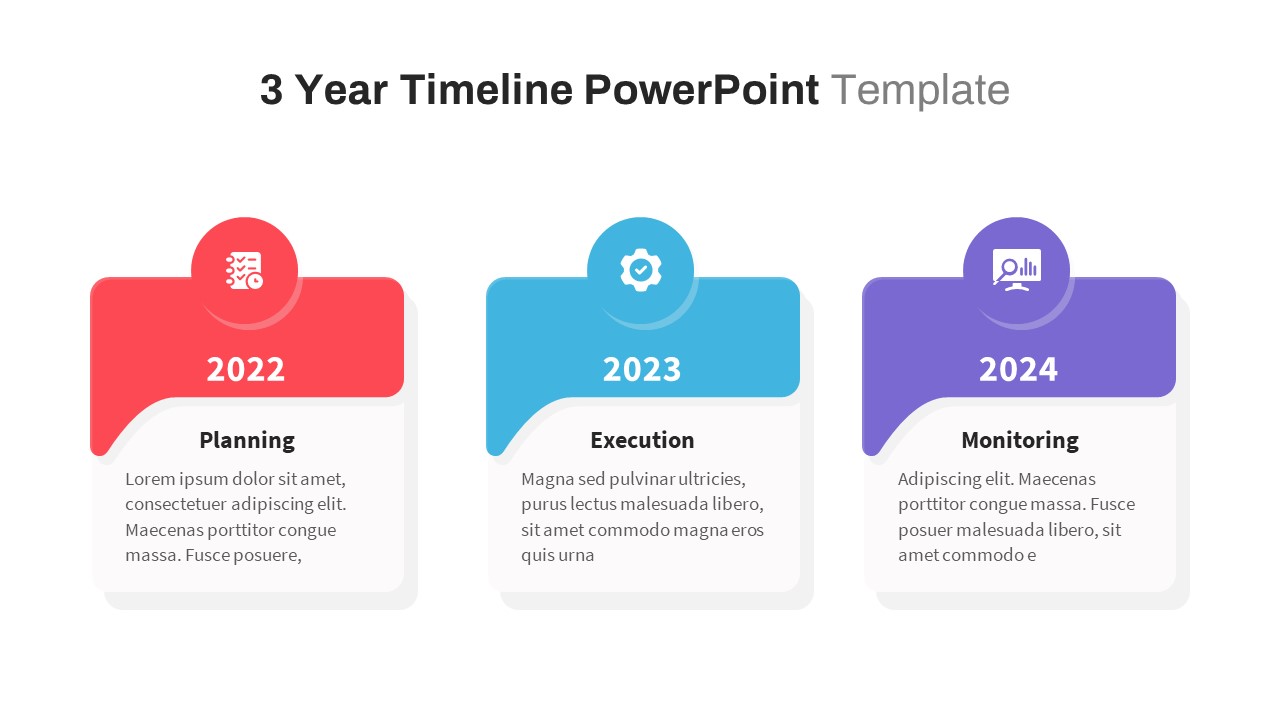
Three-Year Project Roadmap Timeline Template for PowerPoint & Google Slides
Timeline
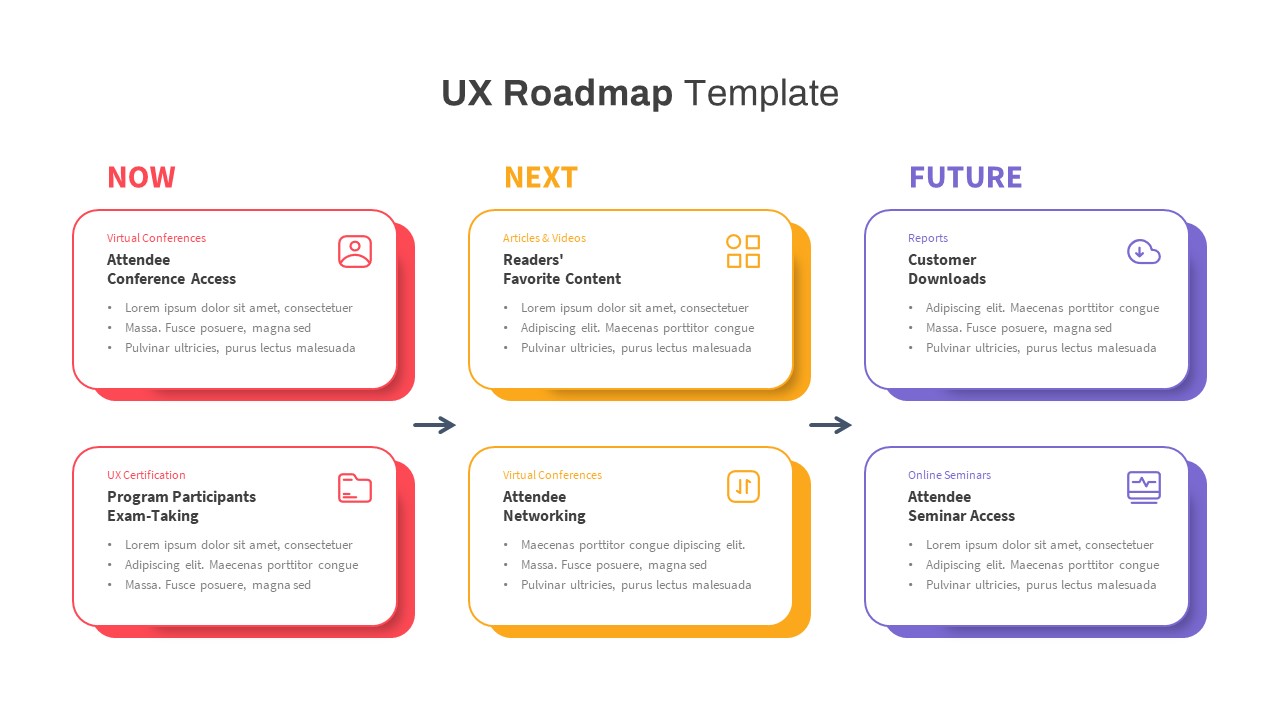
UX Roadmap Timeline Template for PowerPoint & Google Slides
Roadmap
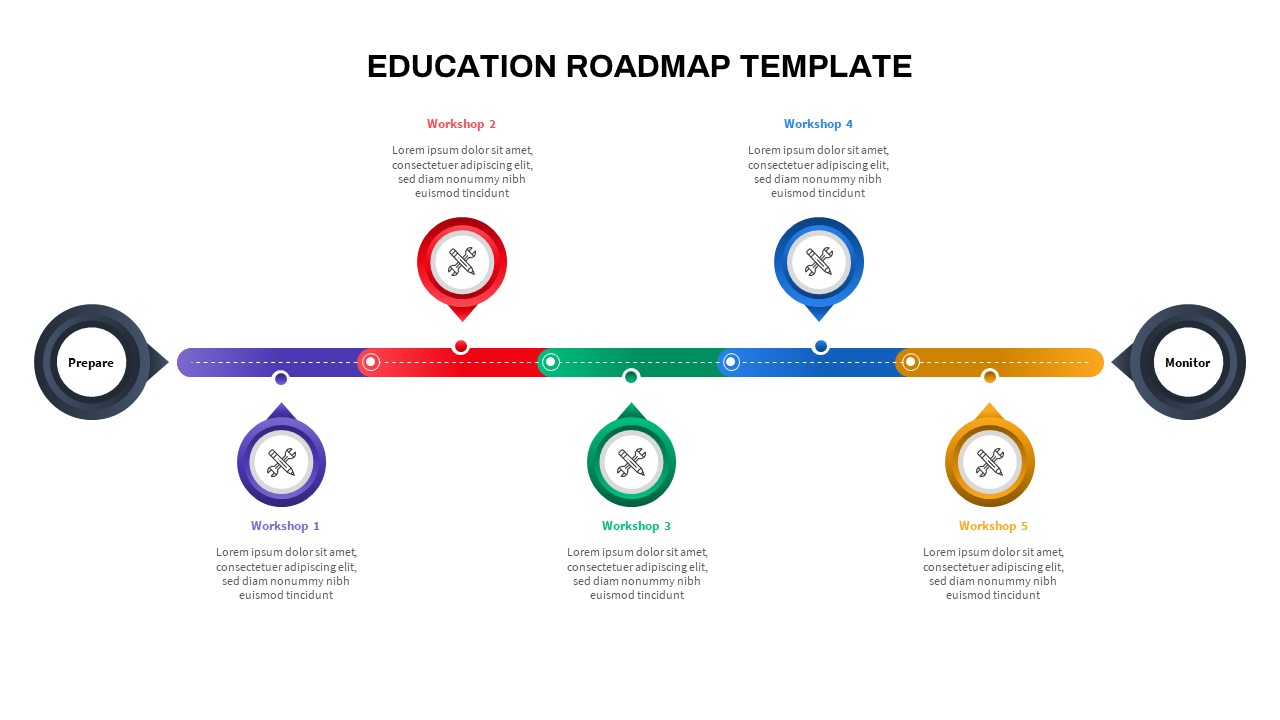
Colorful Education Roadmap Workshop Timeline Template for PowerPoint & Google Slides
Roadmap
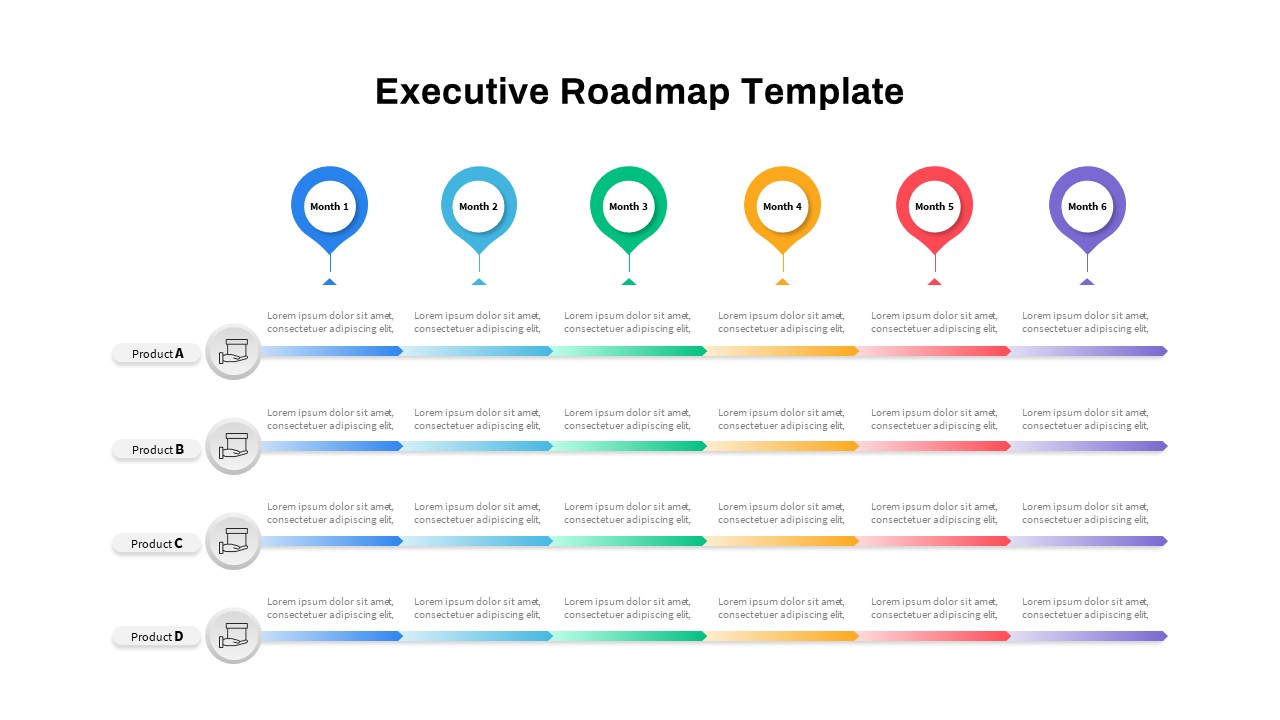
Executive Roadmap Six-Month Timeline Template for PowerPoint & Google Slides
Roadmap
Agile Project Roadmap Timeline Template Pack for PowerPoint & Google Slides
Scrum
Comprehensive PMO Roadmap Timeline Template for PowerPoint & Google Slides
Roadmap
Clean Minimalist Roadmap Timeline Template for PowerPoint & Google Slides
Roadmap
Multi-color Curved Timeline Roadmap Template for PowerPoint & Google Slides
Timeline
Multicolor Alternating Timeline Roadmap Template for PowerPoint & Google Slides
Timeline
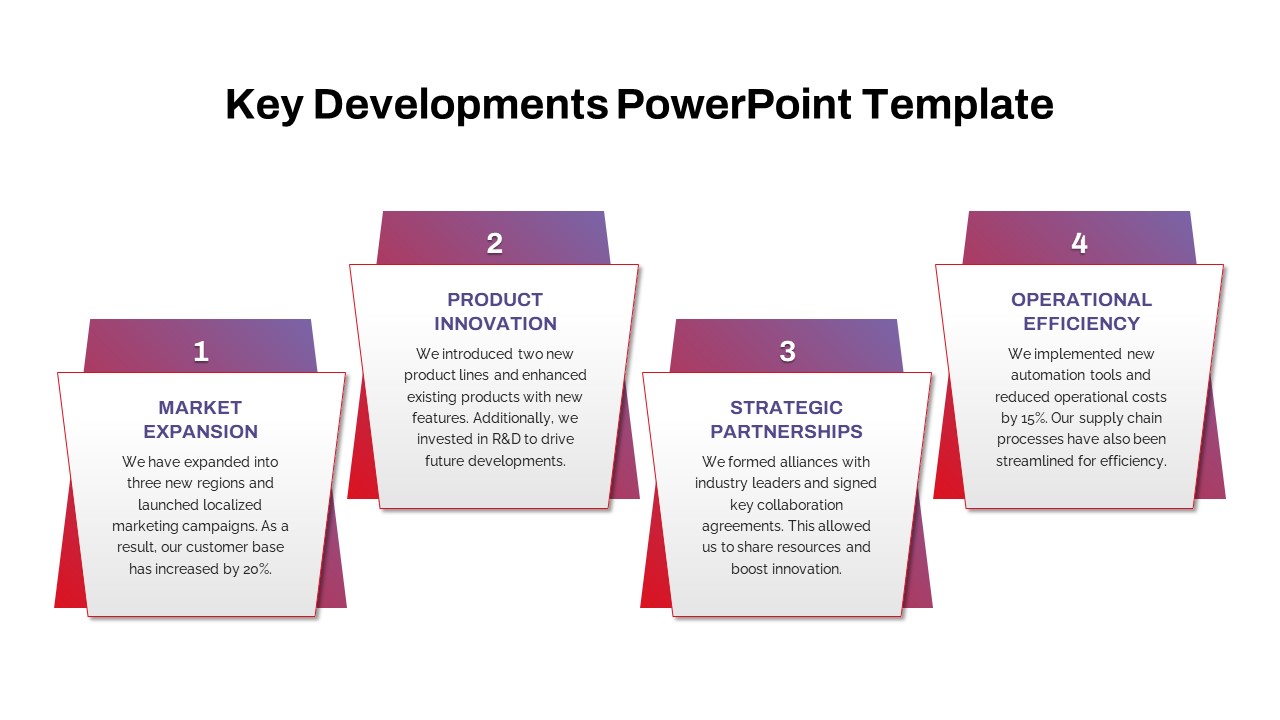
Key Developments Roadmap Timeline Template for PowerPoint & Google Slides
Timeline
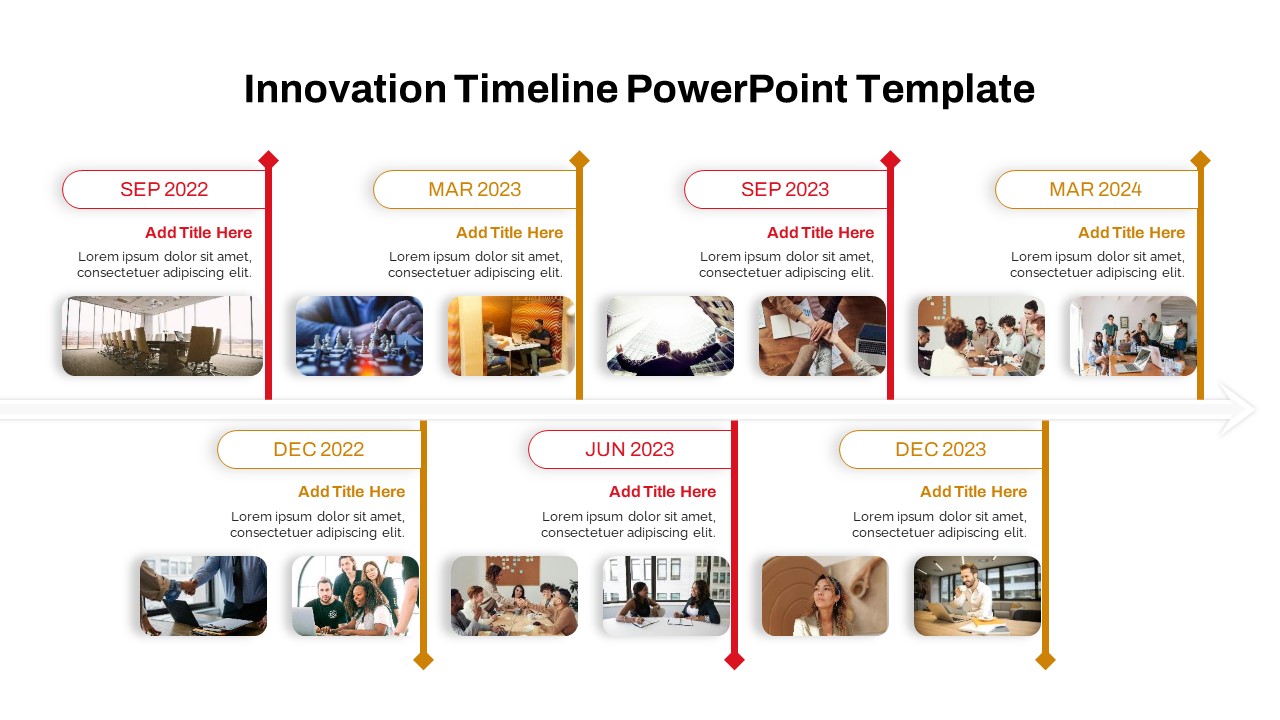
Interactive Innovation Timeline Roadmap Template for PowerPoint & Google Slides
Timeline
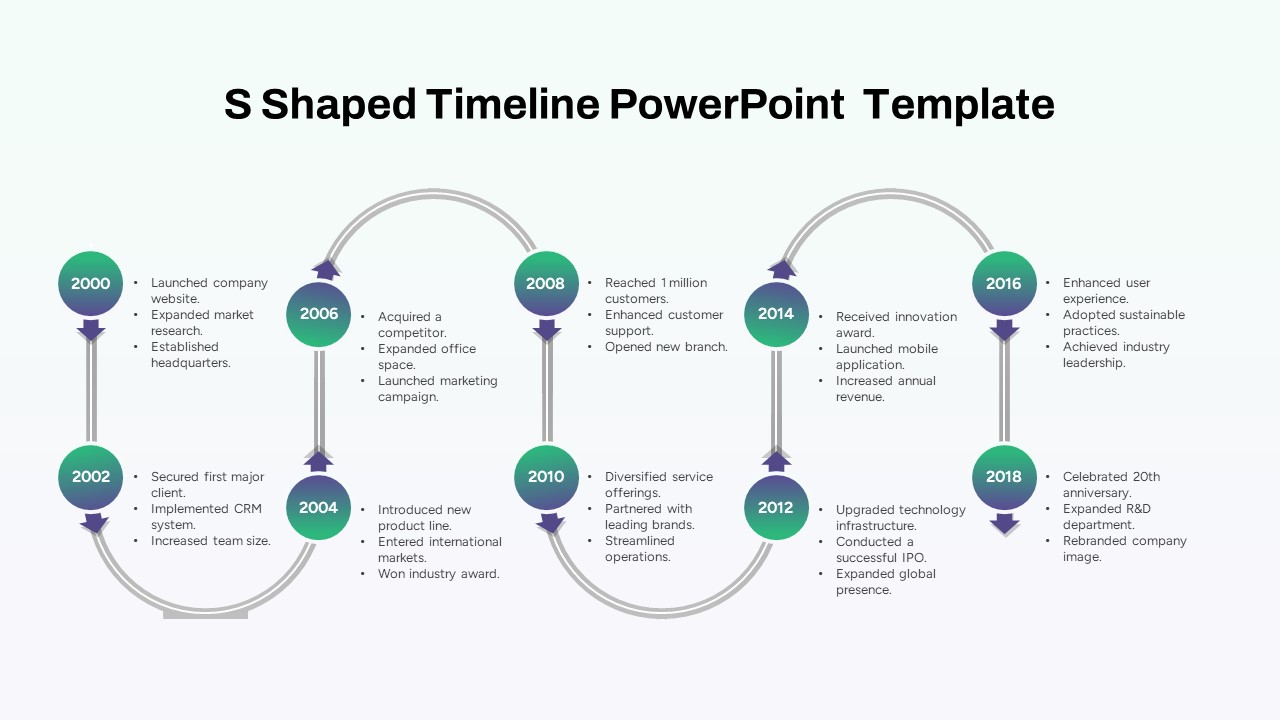
Multi-Year S-Shaped Roadmap Timeline Template for PowerPoint & Google Slides
Timeline
Project Comparison Timeline Roadmap Template for PowerPoint & Google Slides
Comparison
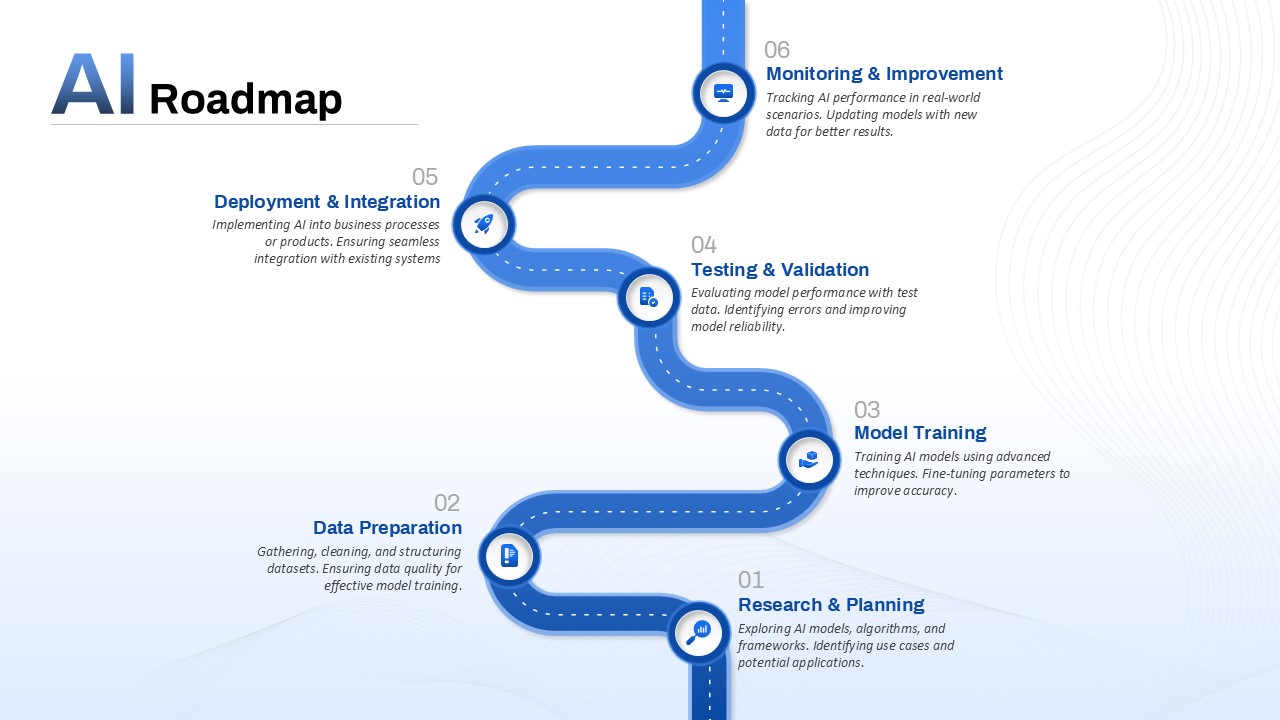
AI Roadmap & Planning Timeline Template for PowerPoint & Google Slides
Roadmap
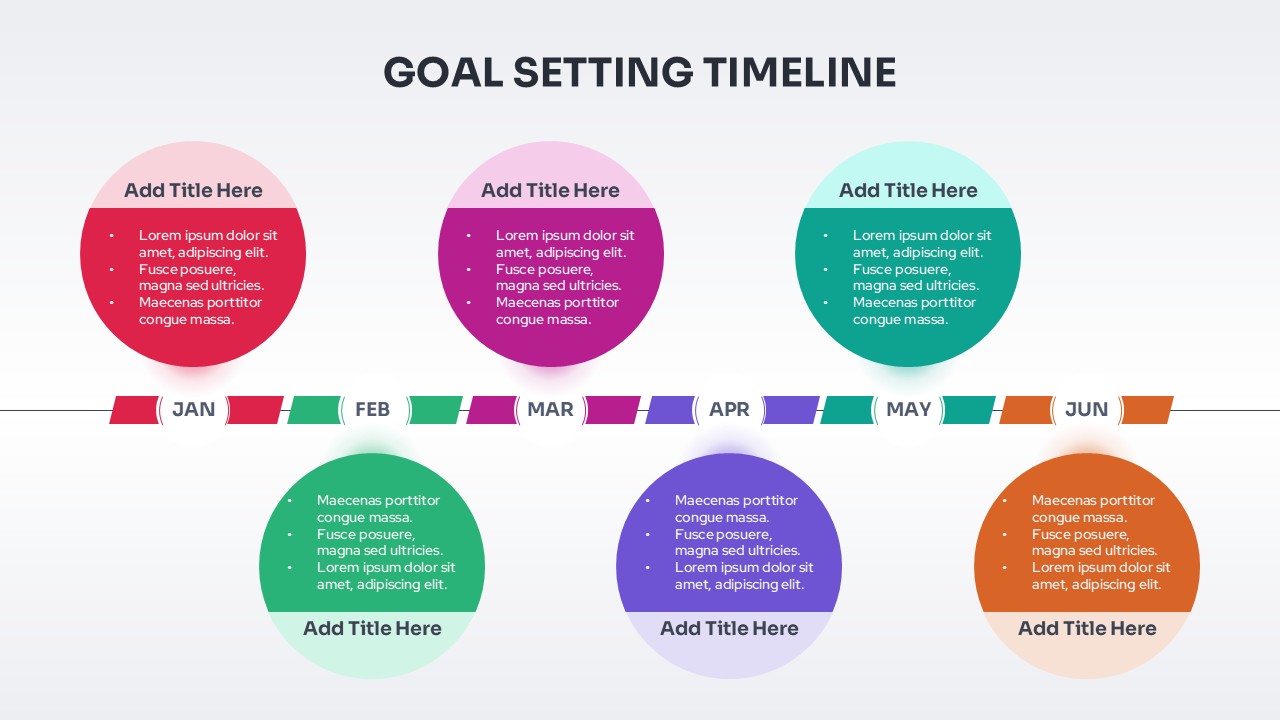
Goal Setting Timeline Roadmap Template for PowerPoint & Google Slides
Goals
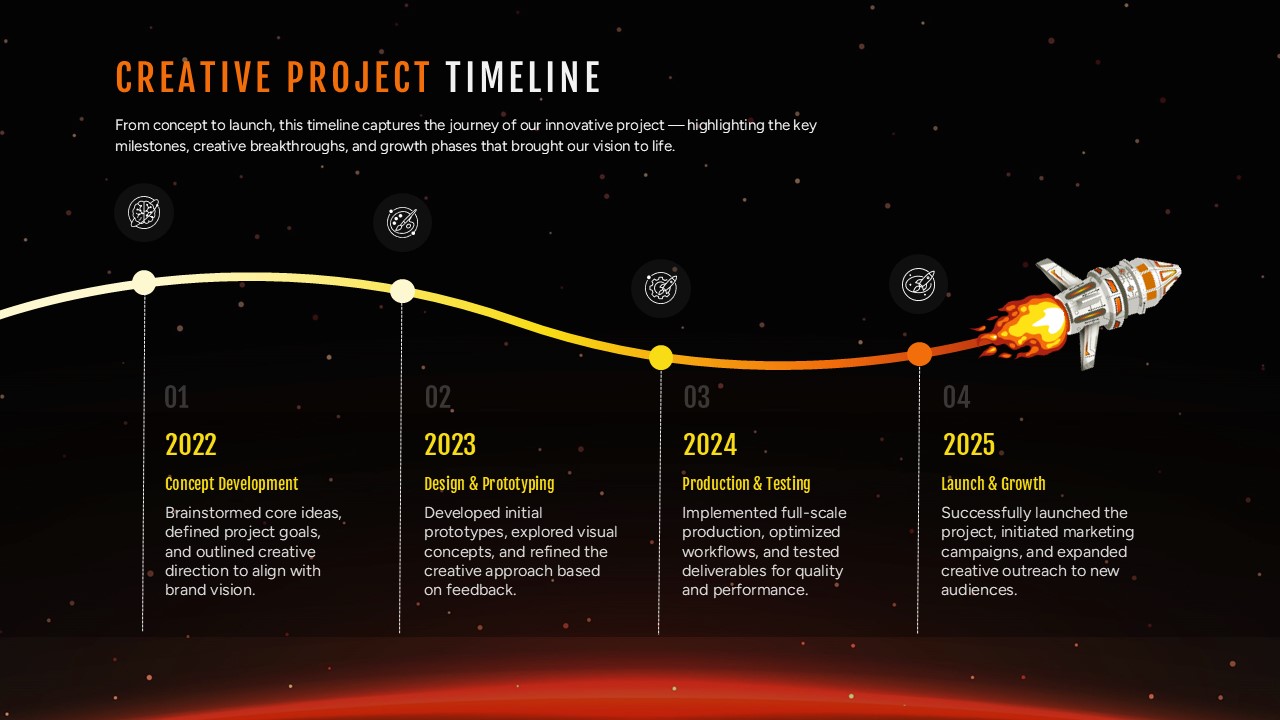
Creative Project Timeline Roadmap Template for PowerPoint & Google Slides
Timeline
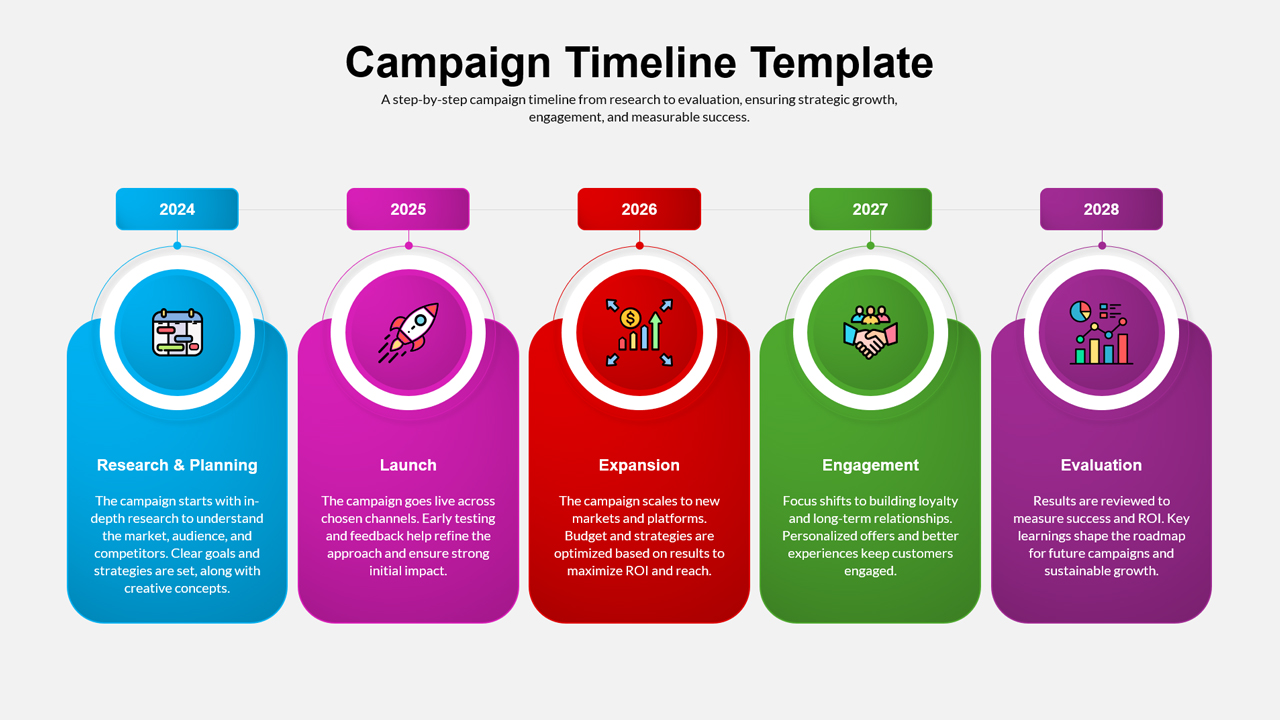
Campaign Timeline Marketing Roadmap Slide Template for PowerPoint & Google Slides
Timeline
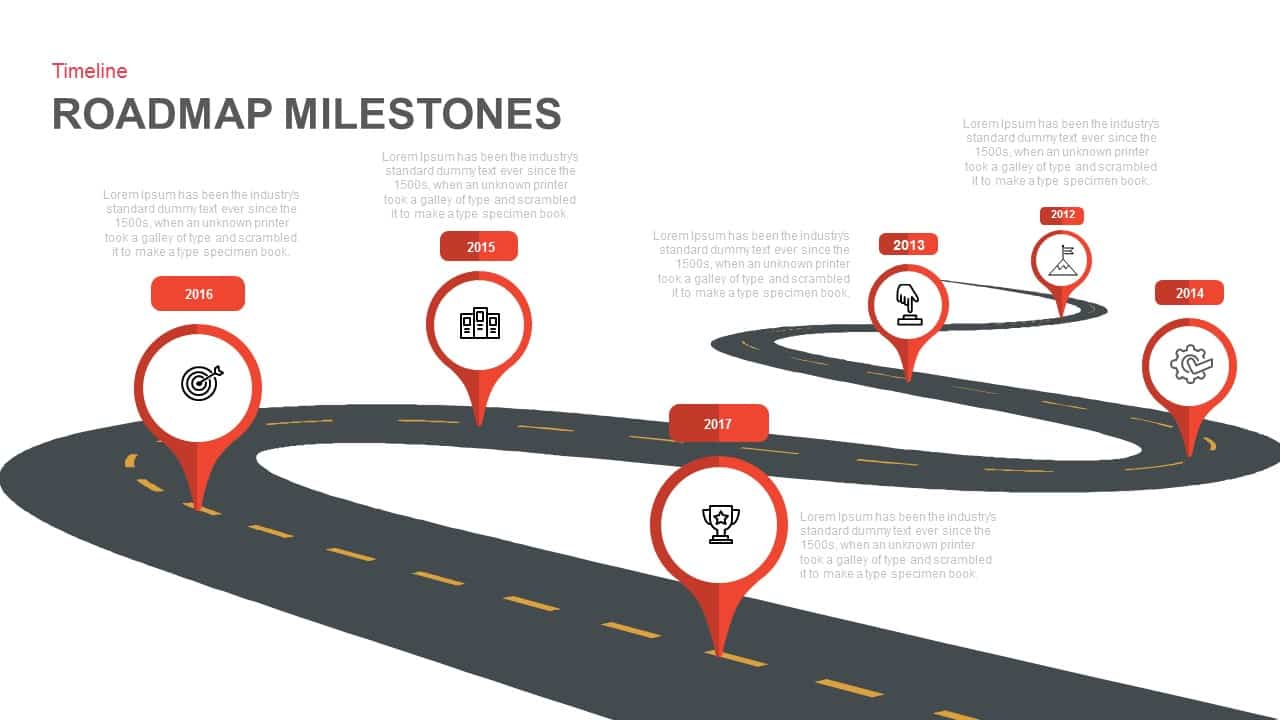
Roadmap Milestones Timeline for PowerPoint & Google Slides
Roadmap
Wavy Timeline Project Roadmap Slide for PowerPoint & Google Slides
Project Status
Cybersecurity Timeline Roadmap Slide for PowerPoint & Google Slides
Information Technology
Business Target Milestone Roadmap Template for PowerPoint & Google Slides
Roadmap
Business Roadmap Infographics template for PowerPoint & Google Slides
Roadmap
Business Roadmap Strategy template for PowerPoint & Google Slides
Business Strategy
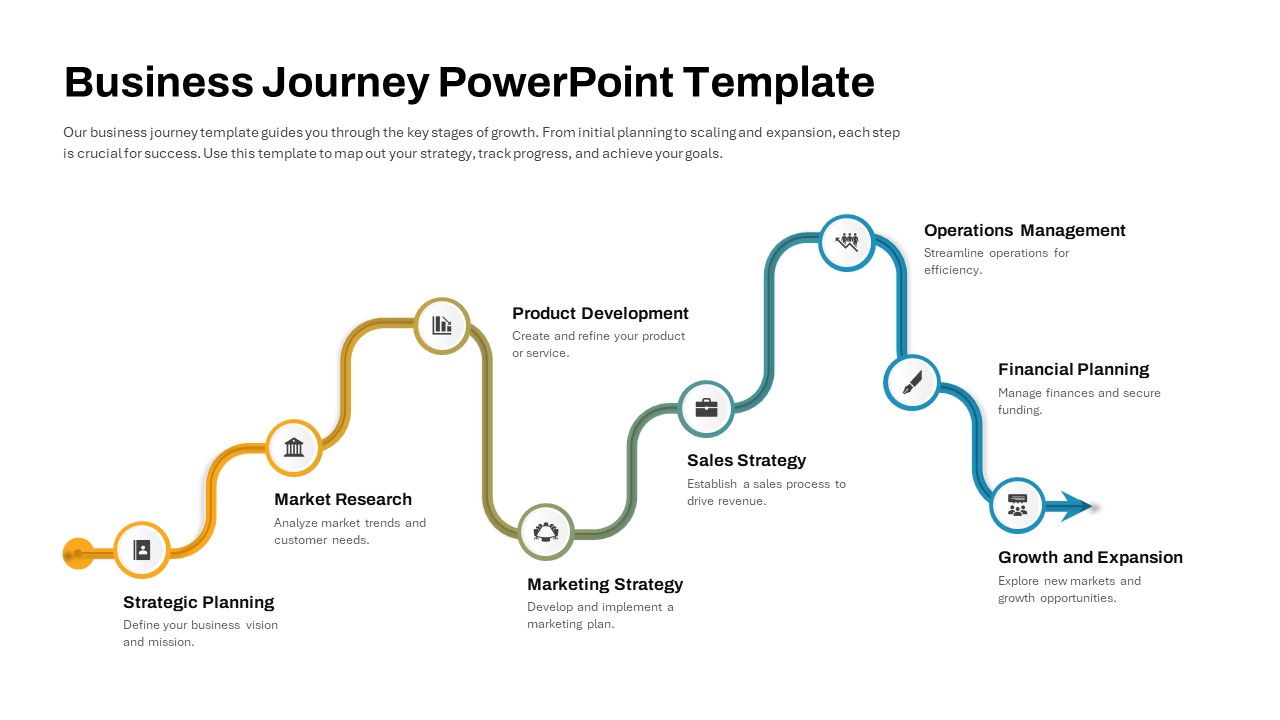
Modern Business Journey Roadmap Template for PowerPoint & Google Slides
Roadmap
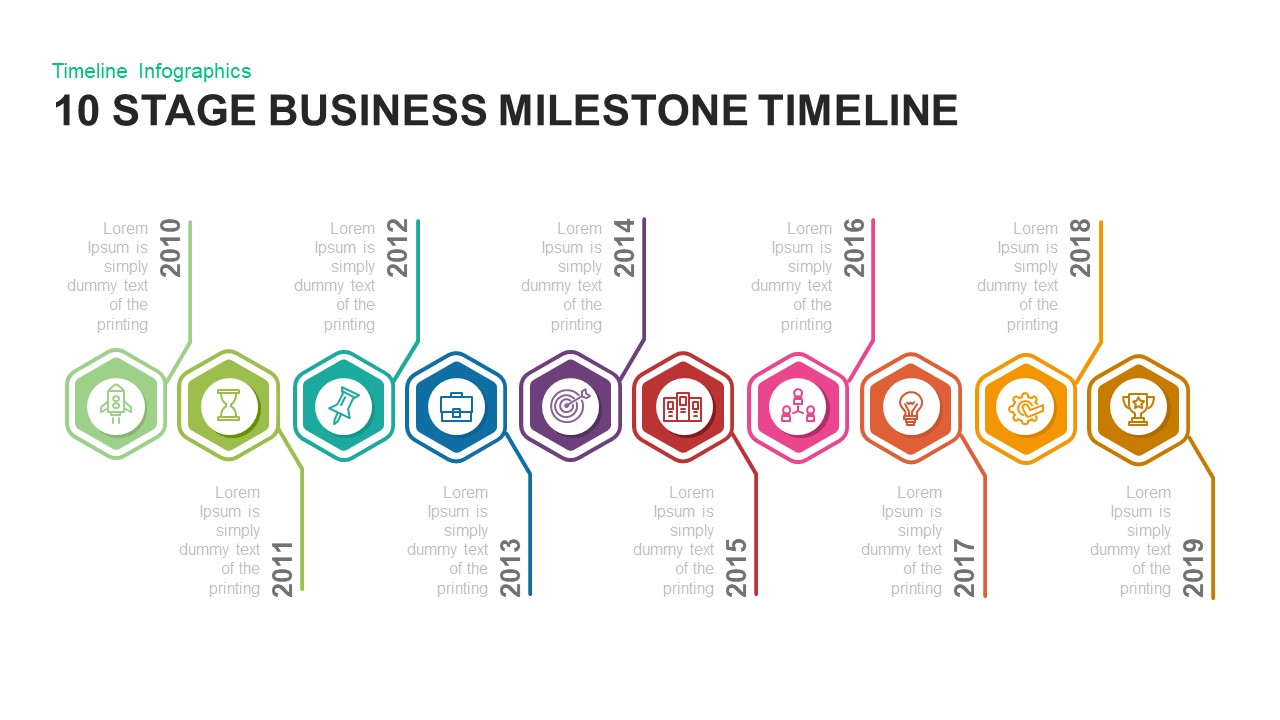
10 Stage Business Milestone Timeline PowerPoint Template for PowerPoint & Google Slides
Timeline
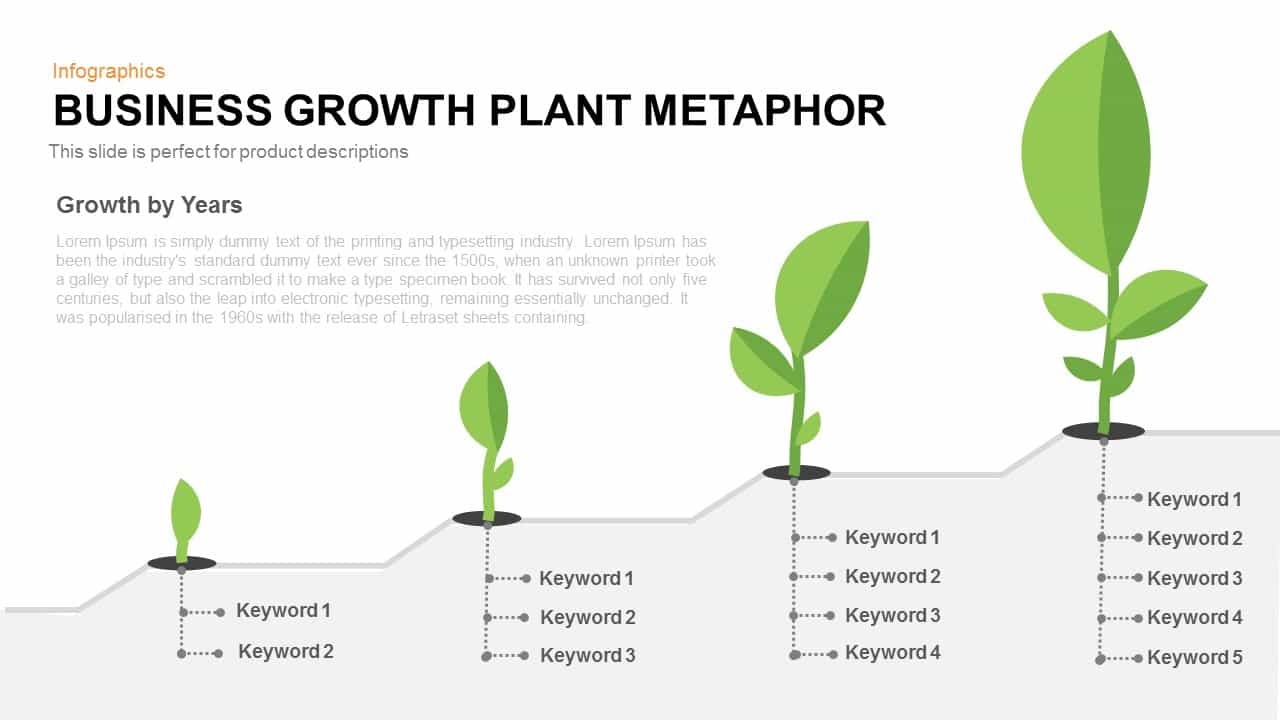
Business Growth Plant Metaphor Timeline Template for PowerPoint & Google Slides
Business Strategy
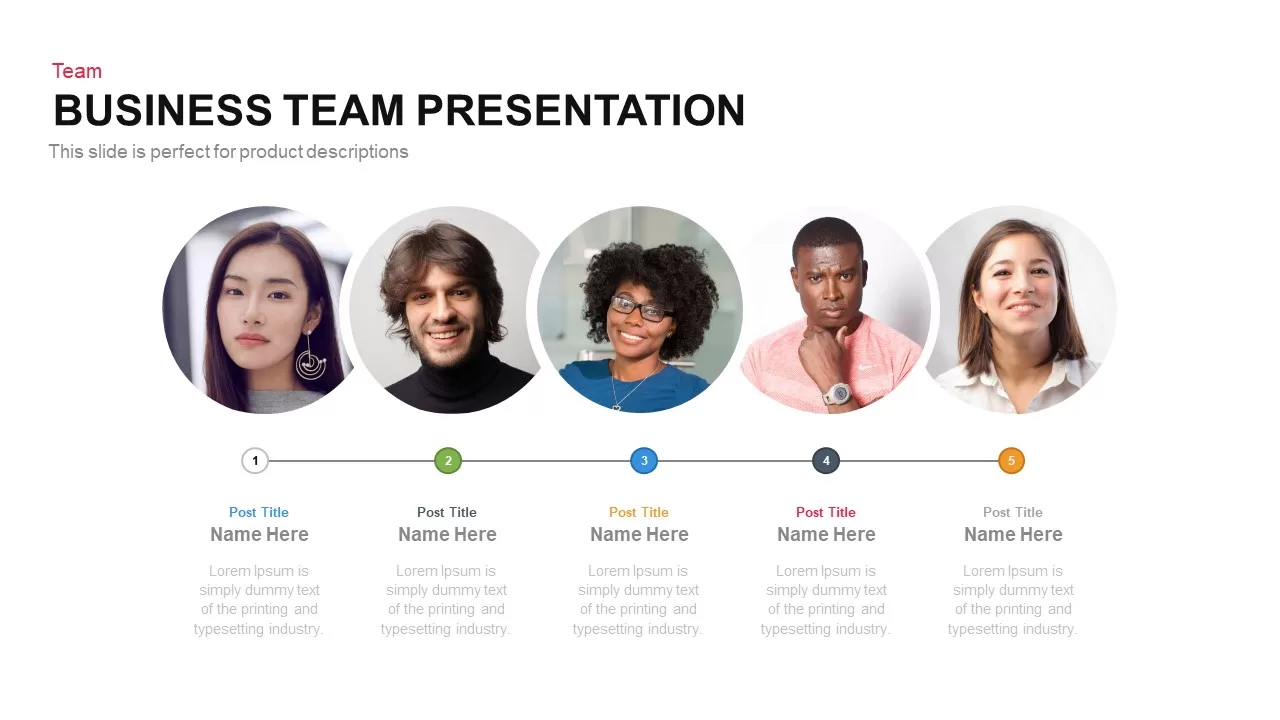
Business Team Timeline Presentation Template for PowerPoint & Google Slides
Our Team

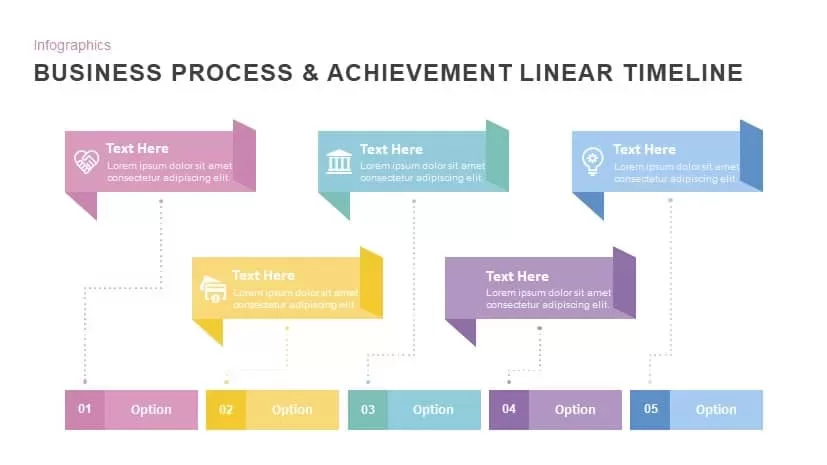
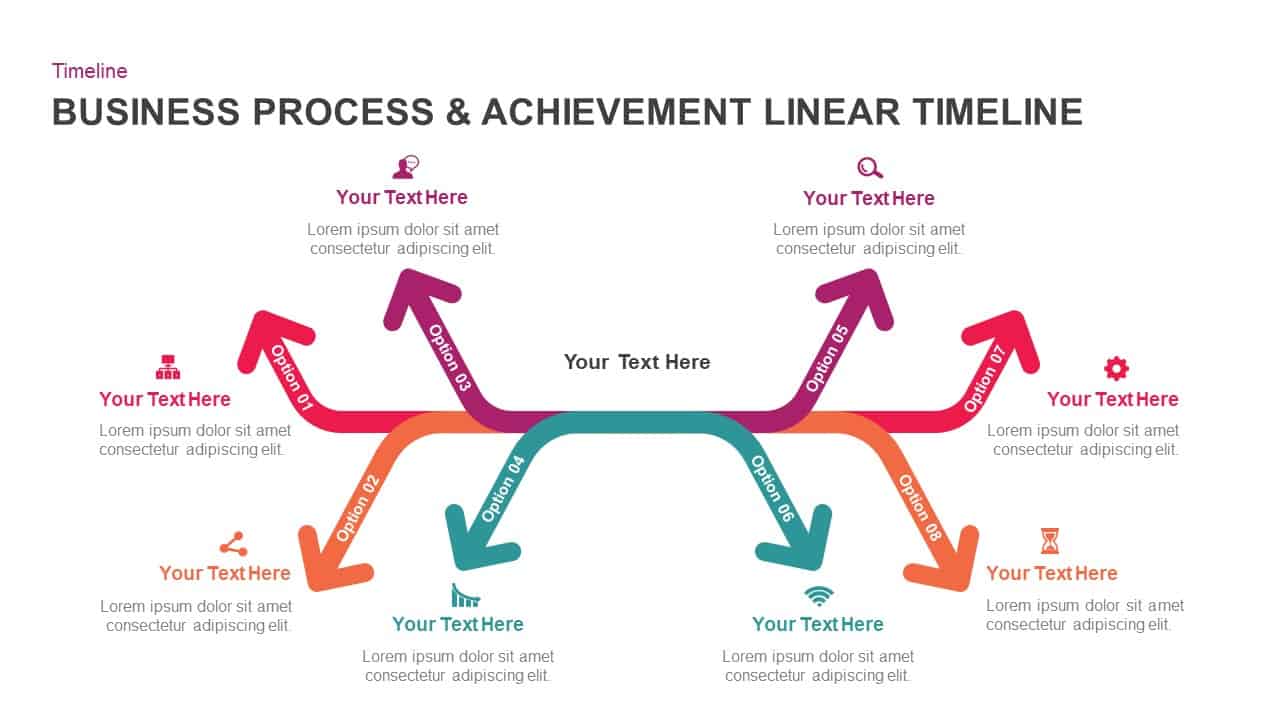
Business Process & Achievement Linear Timeline template for PowerPoint & Google Slides
Timeline
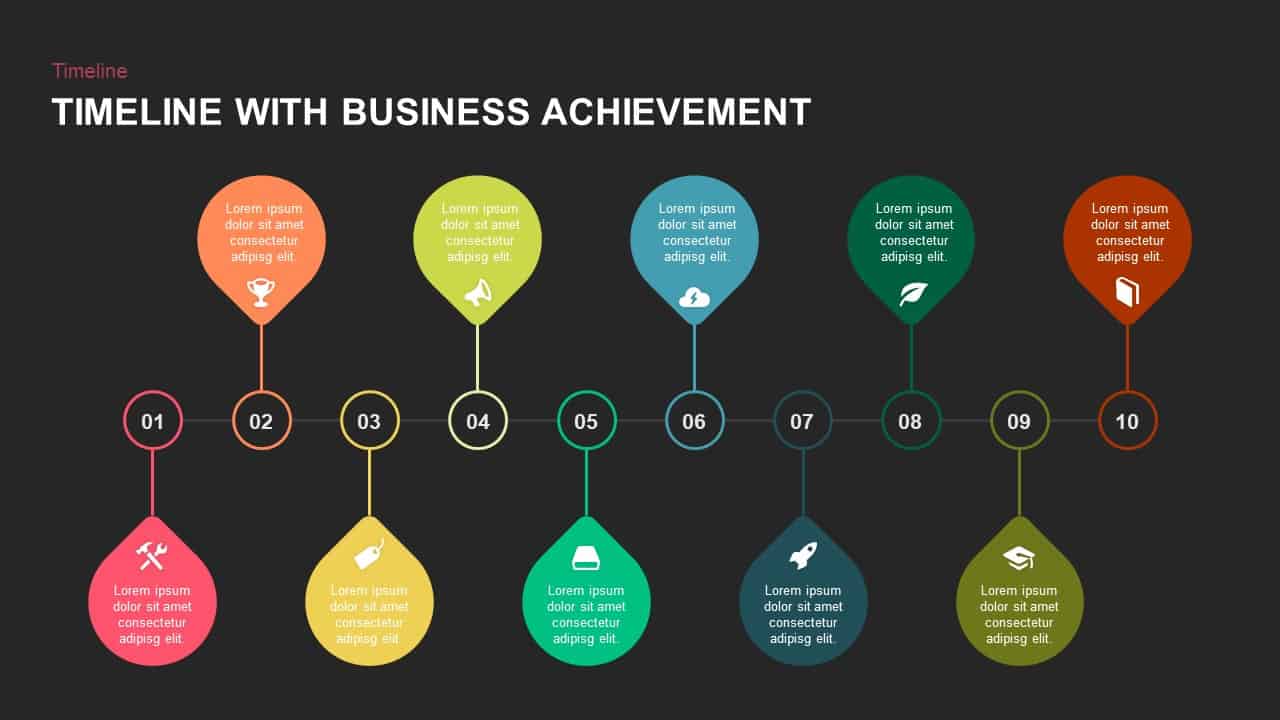
10-Stage Timeline with Business Achievements Template for PowerPoint & Google Slides
Timeline
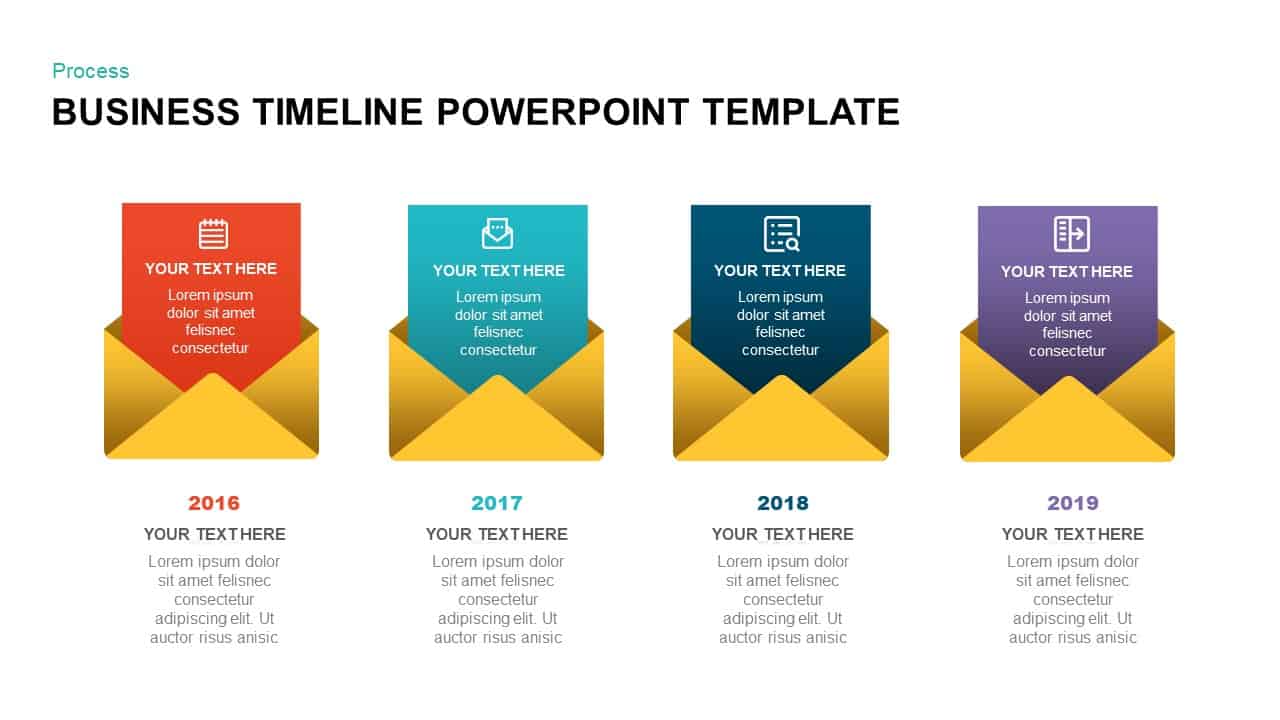
Business Timeline Envelope Infographic Template for PowerPoint & Google Slides
Timeline
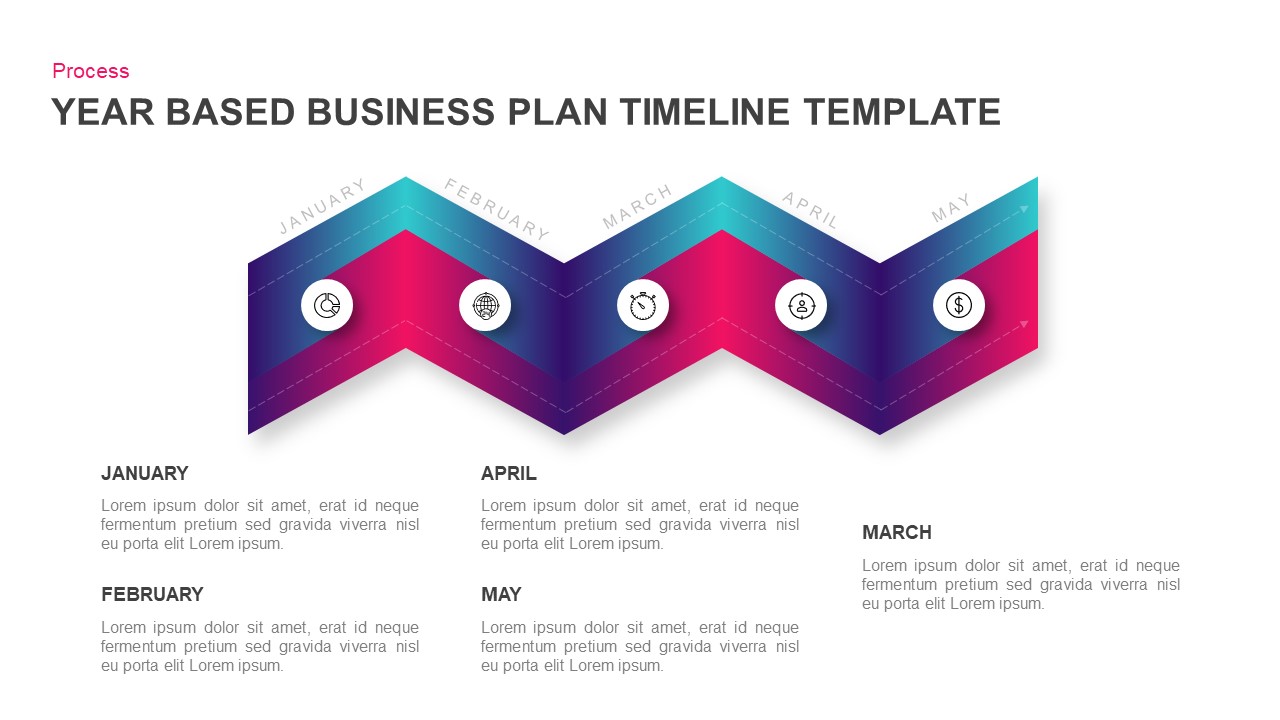
Year-Based Business Plan Zigzag Timeline Template for PowerPoint & Google Slides
Business Plan
Business Process Achievement Timeline Template for PowerPoint & Google Slides
Timeline
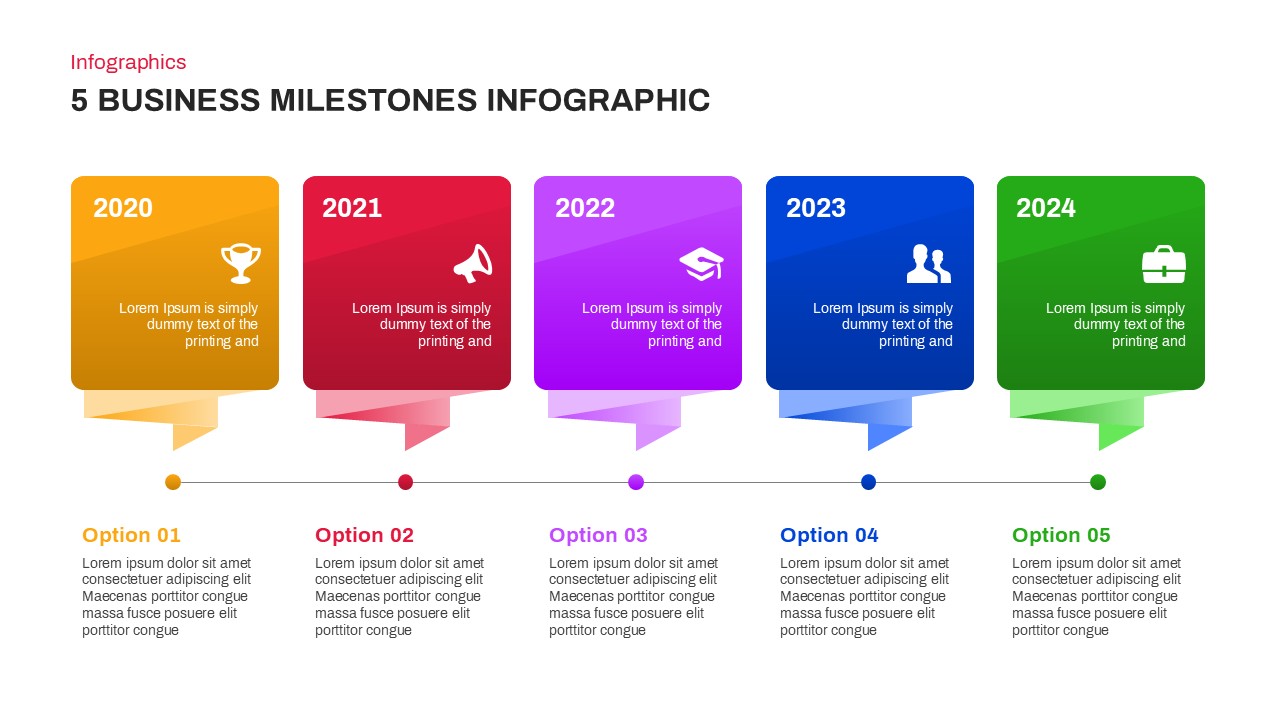
5 Business Milestones Timeline Template for PowerPoint & Google Slides
Timeline
Business Timeline Comparison Bar Chart Template for PowerPoint & Google Slides
Comparison Chart
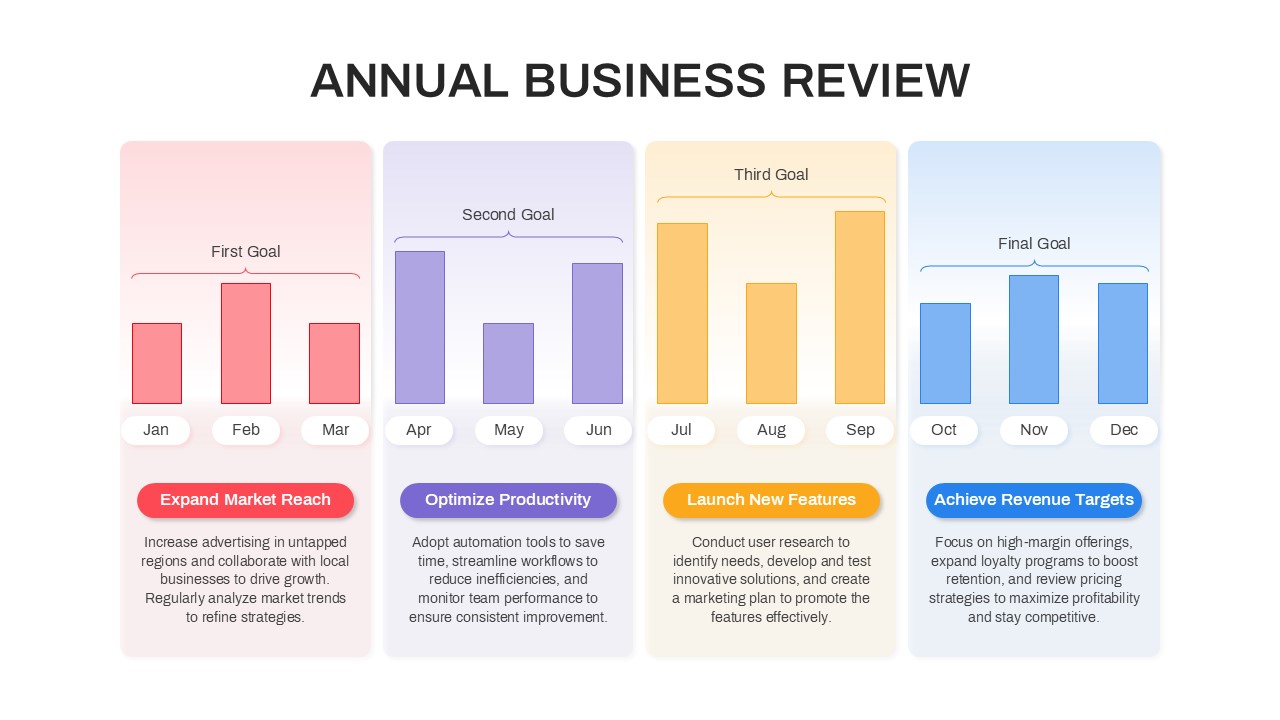
Annual Business Review Timeline Template for PowerPoint & Google Slides
Timeline
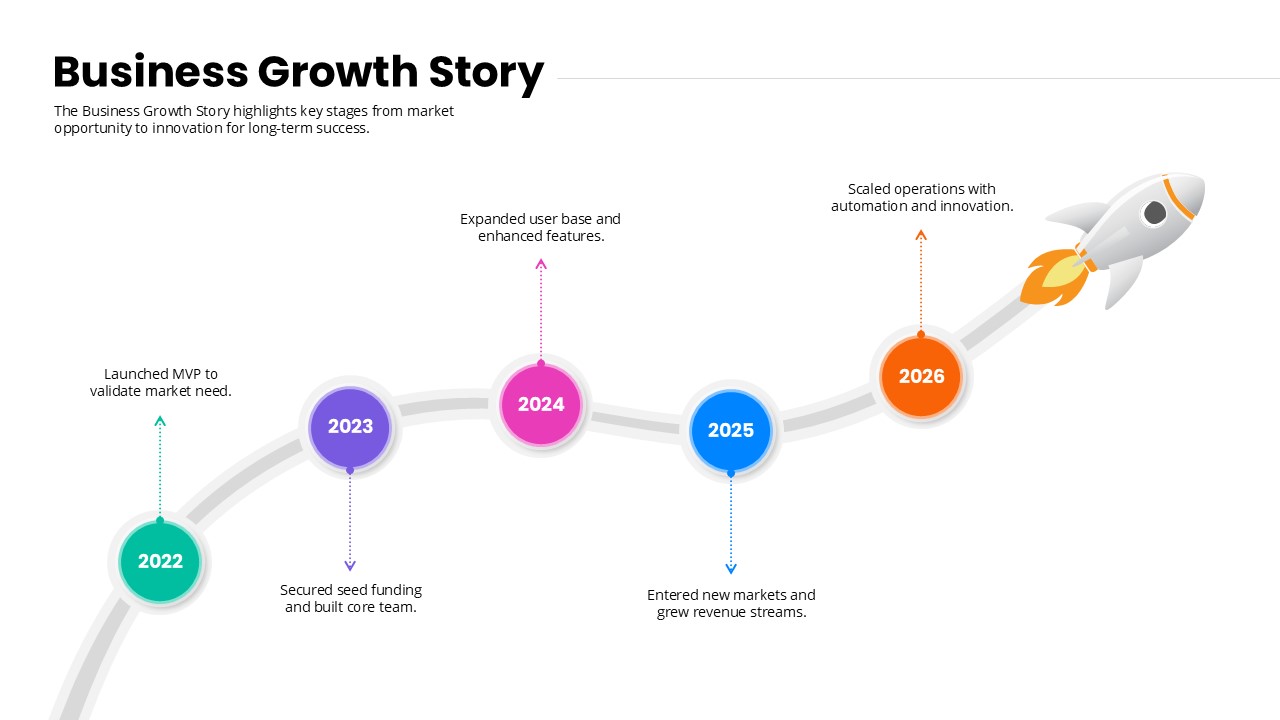
Business Growth Story timeline template for PowerPoint & Google Slides
Timeline
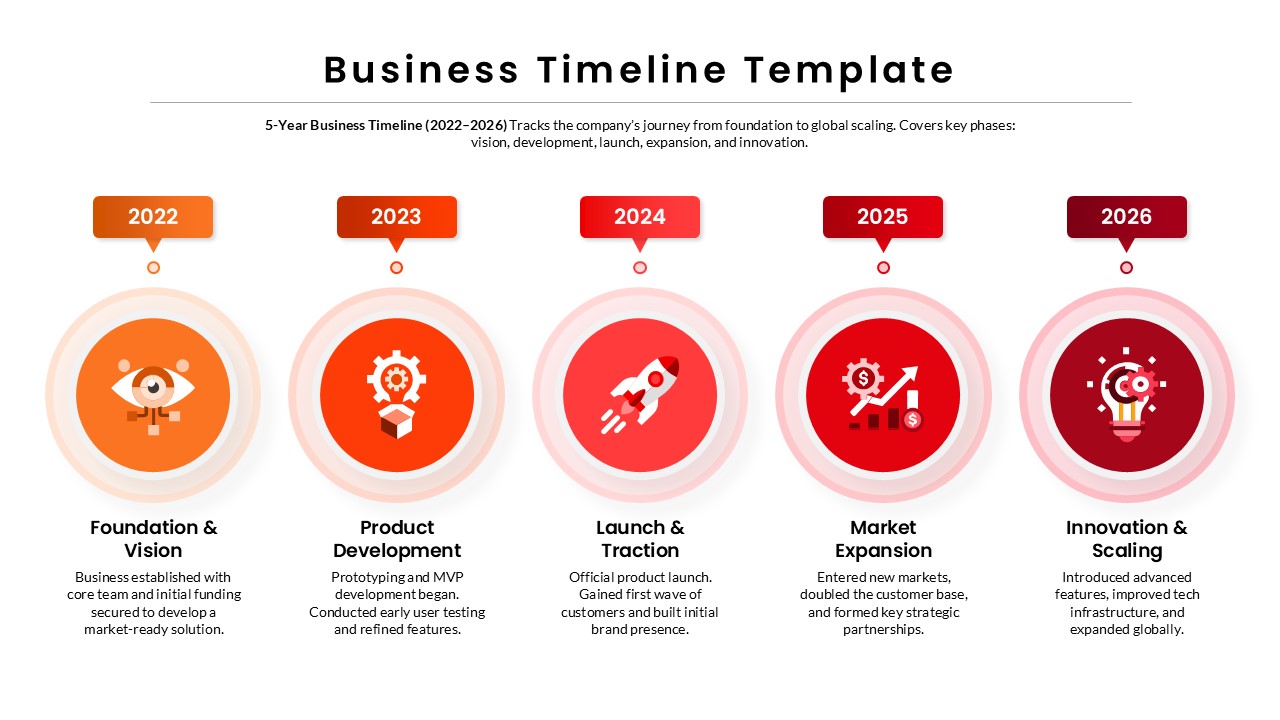
5-Year Business Timeline Template for PowerPoint & Google Slides
Timeline
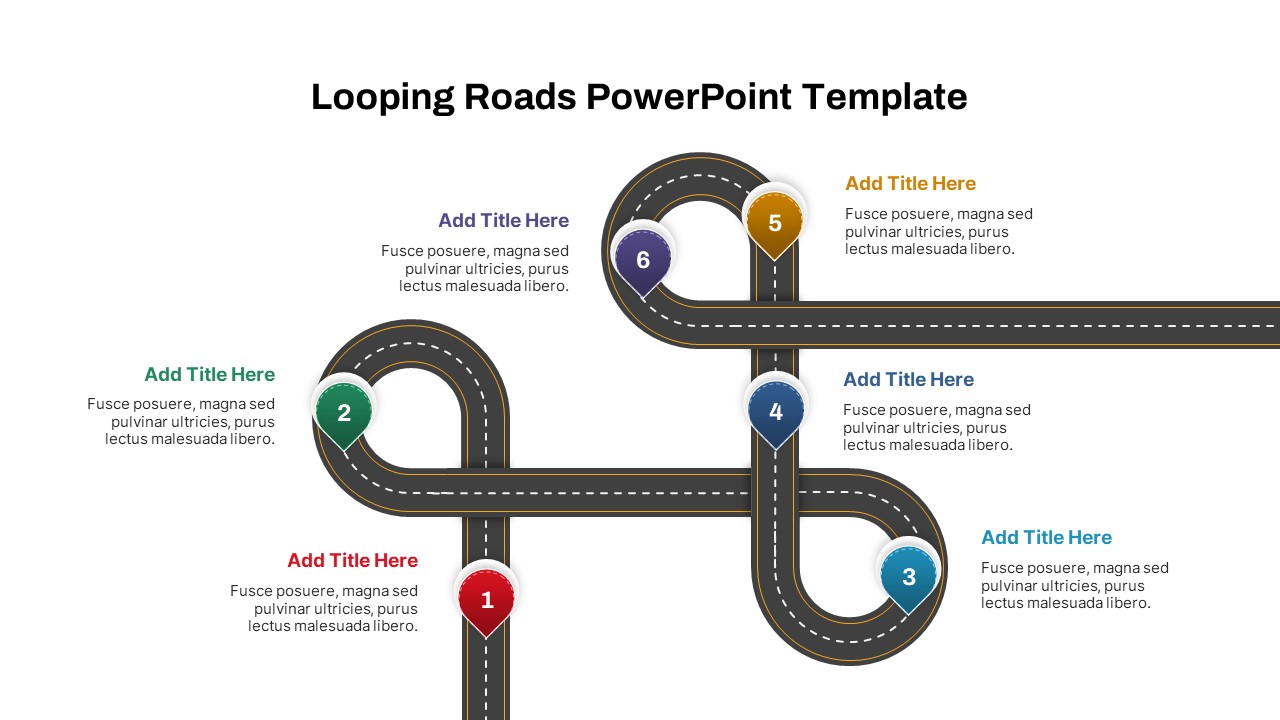
Looping Roadmap Milestone Slides Template for PowerPoint & Google Slides
Roadmap
Digital Marketing Roadmap PowerPoint Template for PowerPoint & Google Slides
Digital Marketing
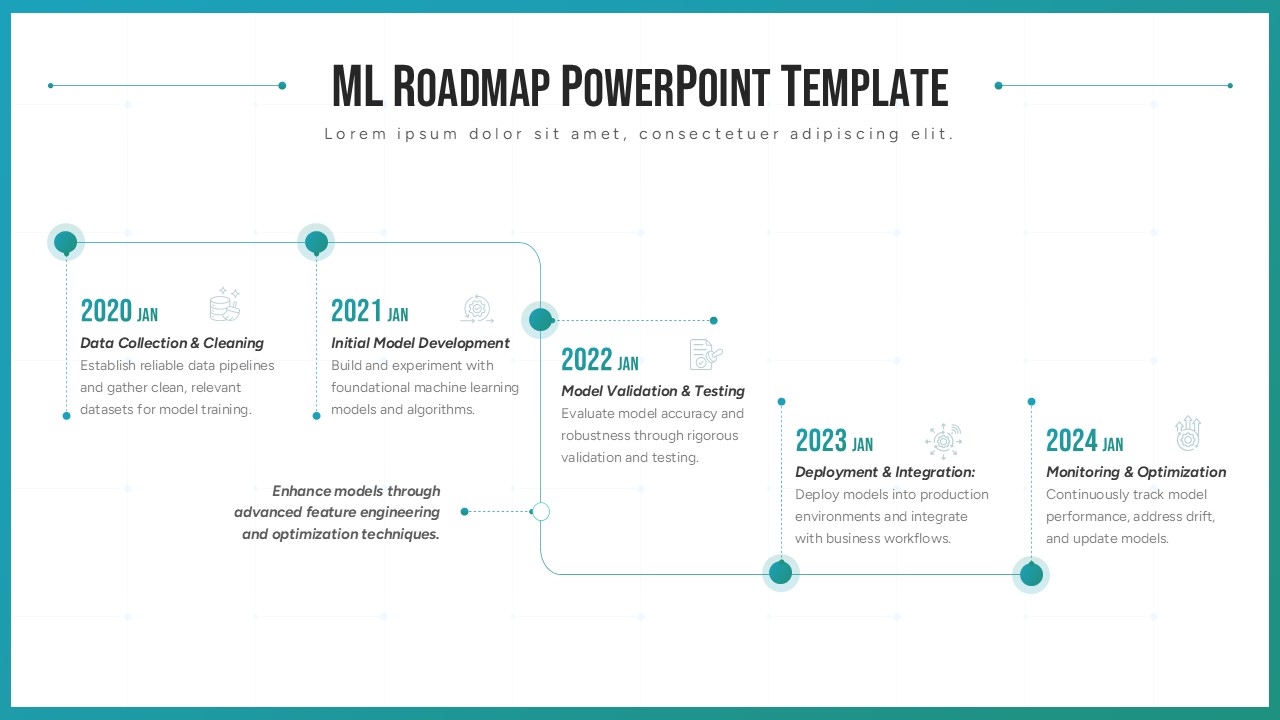
ML Roadmap PowerPoint template for PowerPoint & Google Slides
Technology
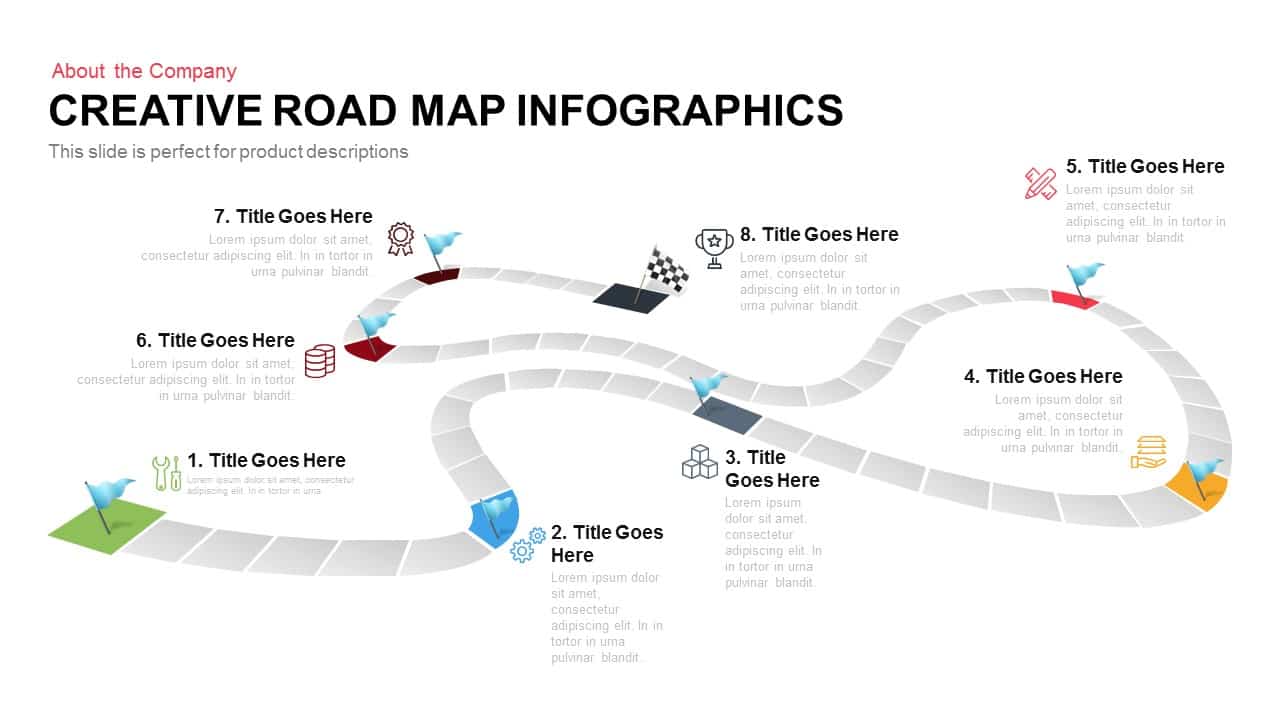
Creative Roadmap template for PowerPoint & Google Slides
Infographics
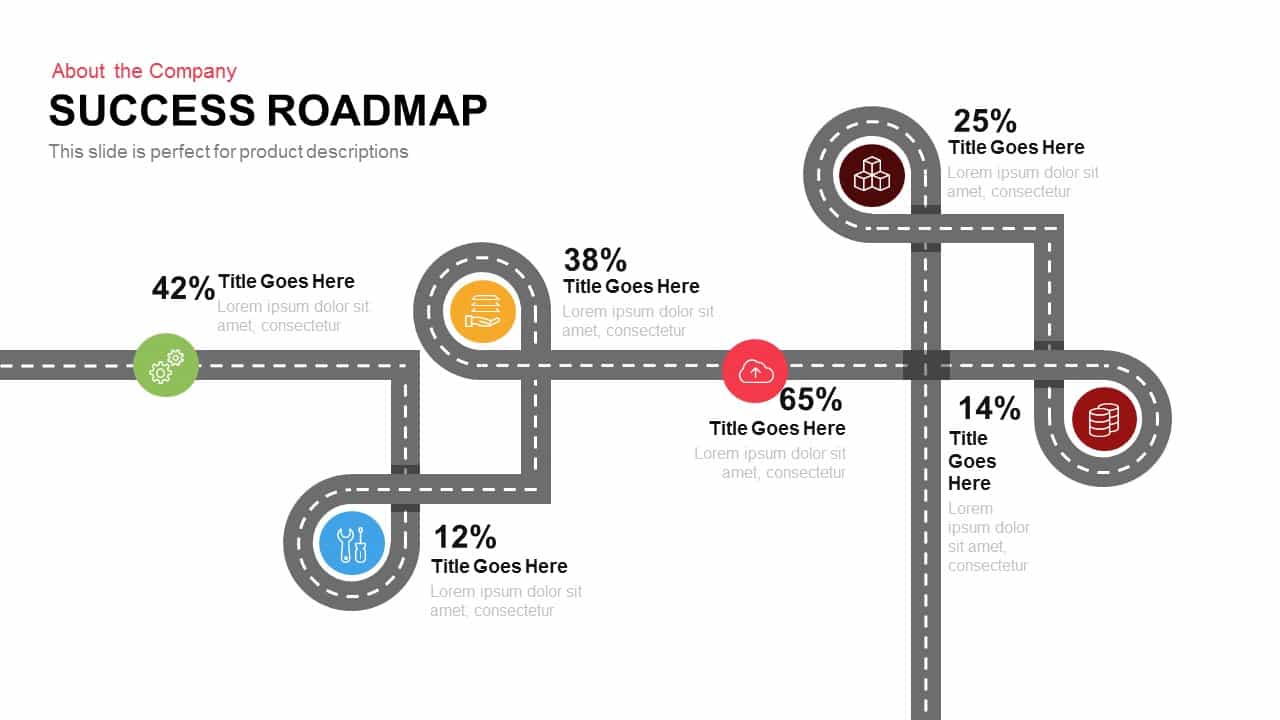
Success Roadmap template for PowerPoint & Google Slides
Roadmap
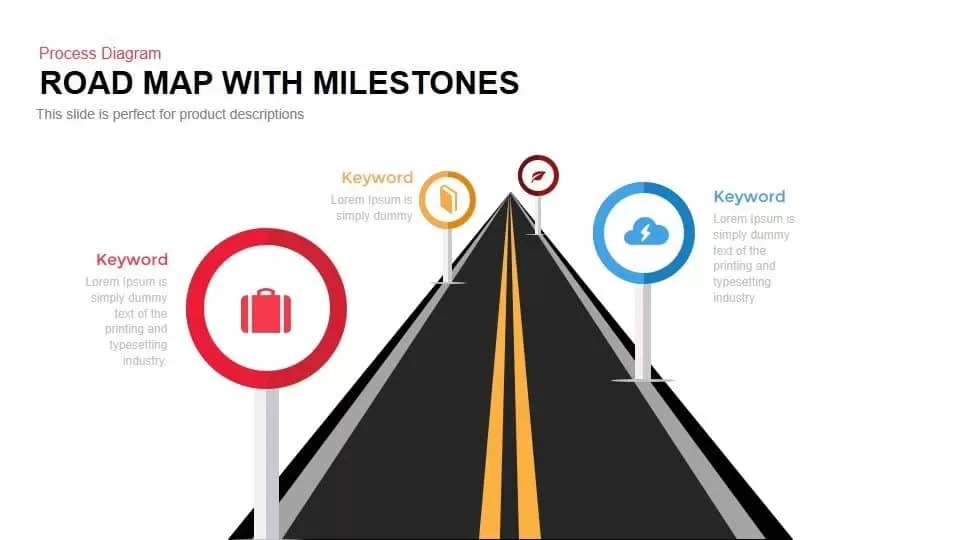
Roadmap with Milestones Process Diagram Template for PowerPoint & Google Slides
Roadmap

Destination Roadmap Pin Metaphor Template for PowerPoint & Google Slides
Roadmap
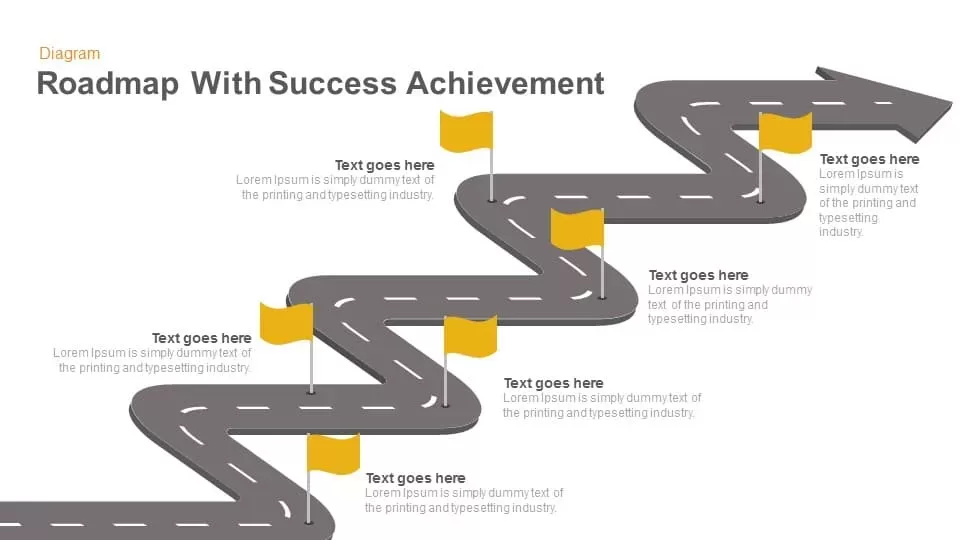
Roadmap with Success Achievement template for PowerPoint & Google Slides
Roadmap
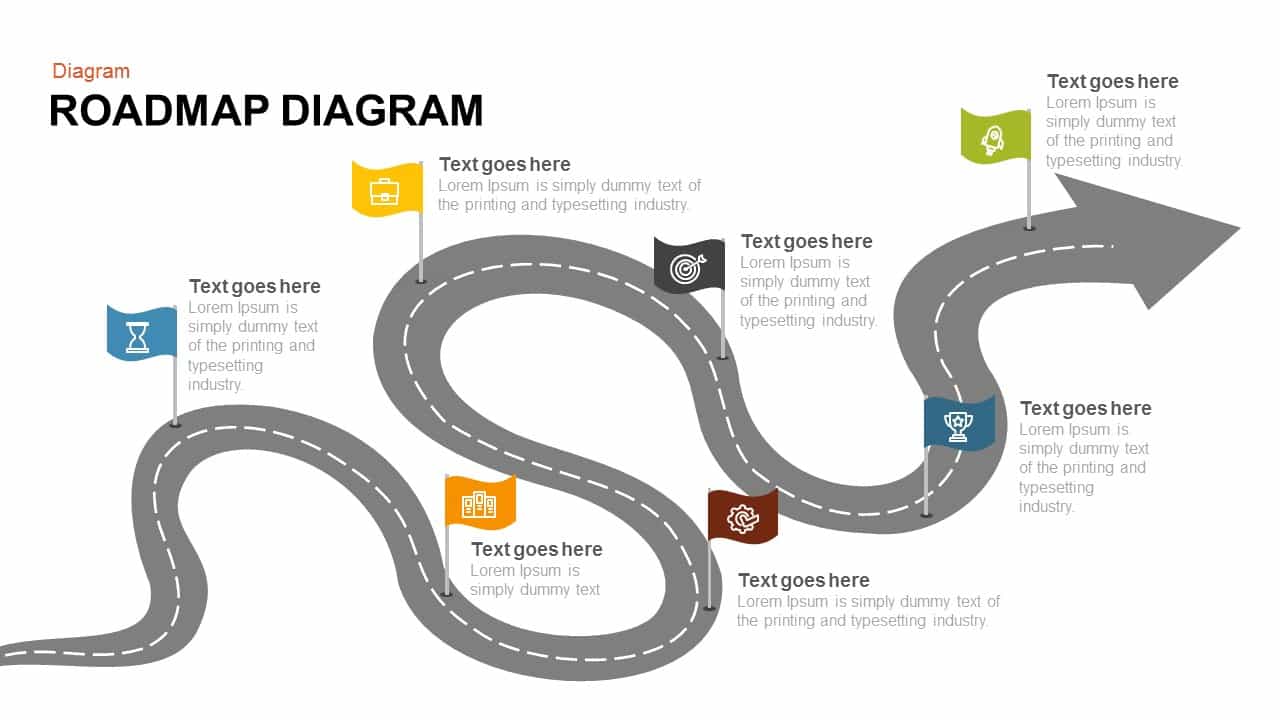
Roadmap Diagram template for PowerPoint & Google Slides
Roadmap
Dynamic Winding Roadmap Infographic Template for PowerPoint & Google Slides
Roadmap
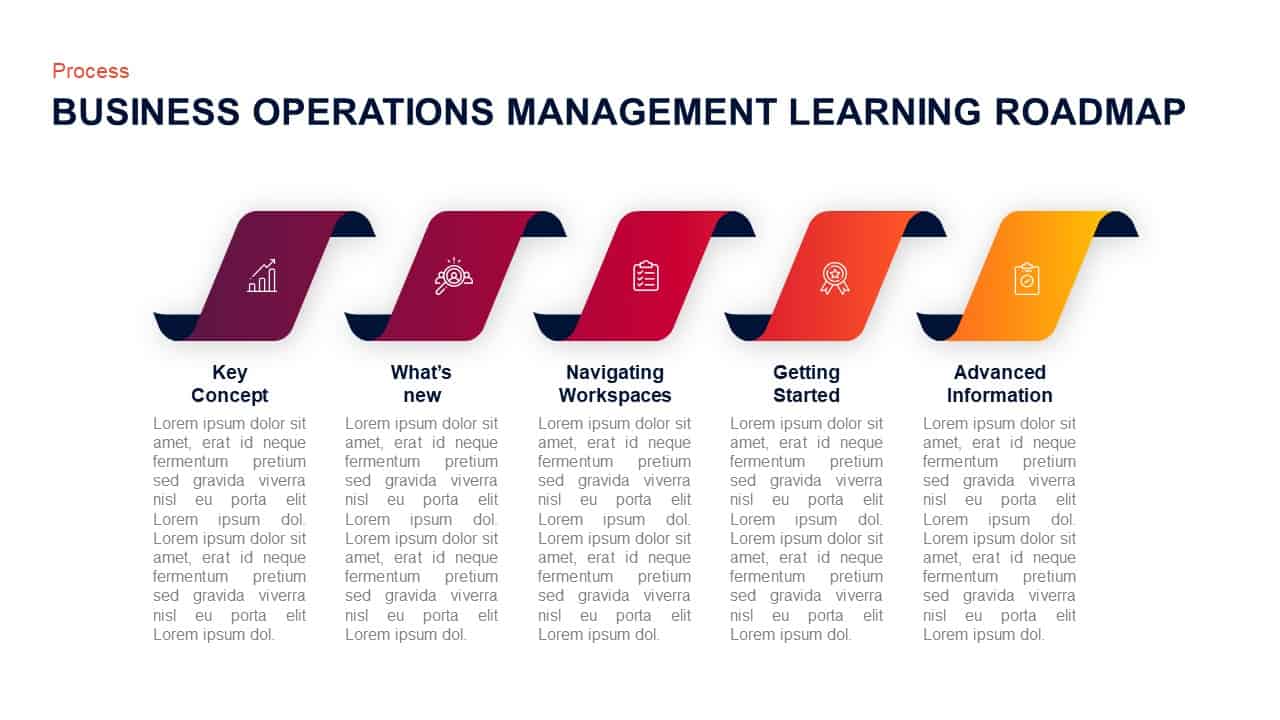
Operations Management Learning Roadmap Template for PowerPoint & Google Slides
Roadmap
3D Milestone Roadmap Staircase Diagram Template for PowerPoint & Google Slides
Timeline
Roadmap with Achievements Infographic Template for PowerPoint & Google Slides
Roadmap
Roadmap Process Infographic Template for PowerPoint & Google Slides
Roadmap
Proof of Concept Roadmap Presentation Template for PowerPoint & Google Slides
Timeline
Serpentine Roadmap Infographic Template for PowerPoint & Google Slides
Roadmap
Curved Roadmap with Iconic Signposts Template for PowerPoint & Google Slides
Roadmap
Colorful Five-Step Roadmap Diagram Template for PowerPoint & Google Slides
Roadmap
Gradient Four-Step Roadmap Diagram Template for PowerPoint & Google Slides
Roadmap
Gradient Five-Step Roadmap Diagram Template for PowerPoint & Google Slides
Roadmap
Free Multi-Level Roadmap Infographic Template for PowerPoint & Google Slides
Roadmap
Free
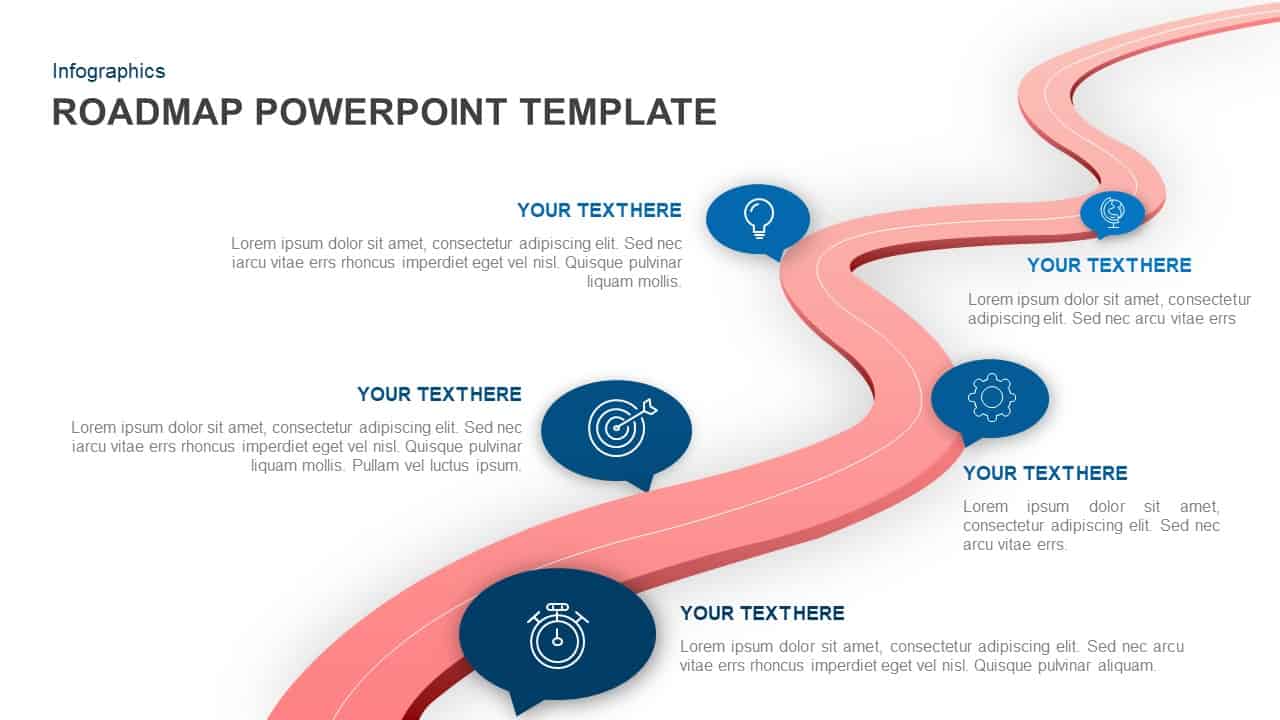
Roadmap Template for PowerPoint & Google Slides
Infographics
Roadmap Infographic template for PowerPoint & Google Slides
Roadmap
Digital Transformation Roadmap Slide Template for PowerPoint & Google Slides
Roadmap
Curved Arrow Roadmap template for PowerPoint & Google Slides
Roadmap
Transformation Roadmap Infographic Pack Template for PowerPoint & Google Slides
Timeline
Process improvement roadmap template for PowerPoint & Google Slides
Process
3 Months New Leader Onboarding Roadmap Template for PowerPoint & Google Slides
HR
Six-Month Strategic SEO Roadmap Template for PowerPoint & Google Slides
Roadmap
Multi-Phase Research Roadmap Infographic Template for PowerPoint & Google Slides
Roadmap
Professional Winding Road Sales Roadmap Template for PowerPoint & Google Slides
Roadmap
Colorful Change Management Roadmap Template for PowerPoint & Google Slides
Roadmap
Free Roadmap Infographics Pack Template for PowerPoint & Google Slides
Pitch Deck
Free
Multi-Color Technology Roadmap Template Pack for PowerPoint & Google Slides
Roadmap
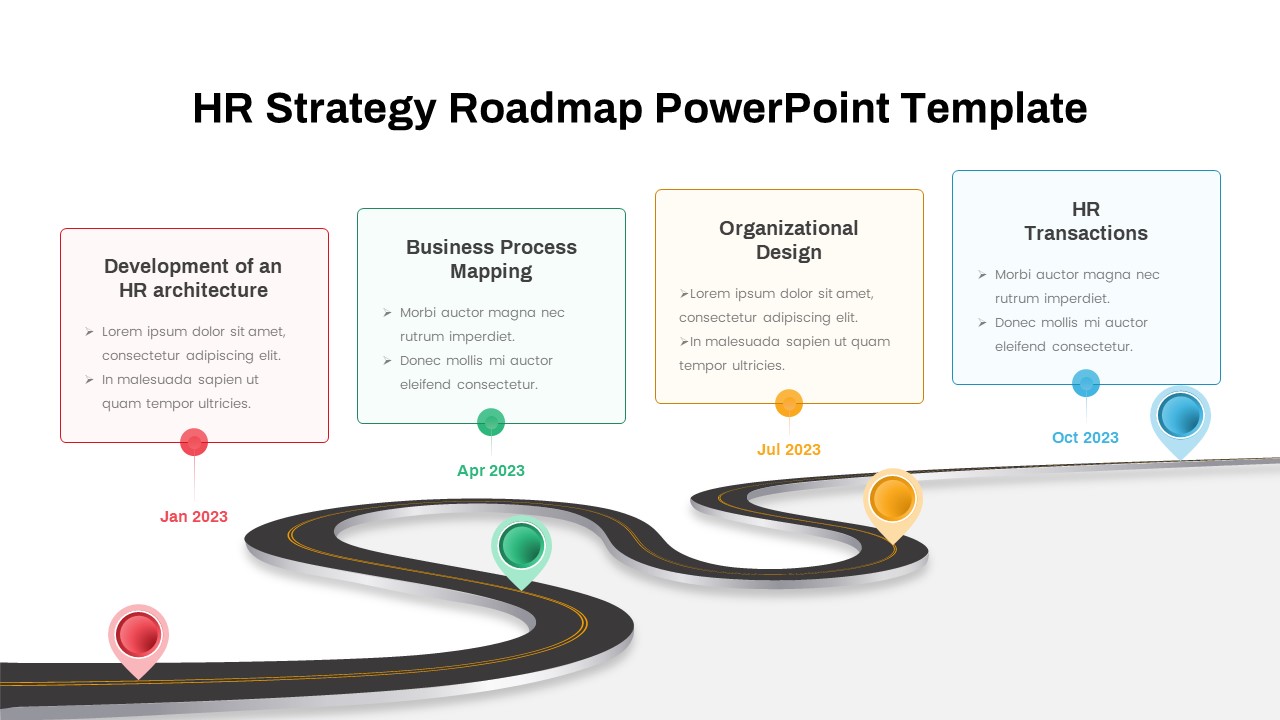
HR Strategy and Transformation Roadmap Template for PowerPoint & Google Slides
Roadmap
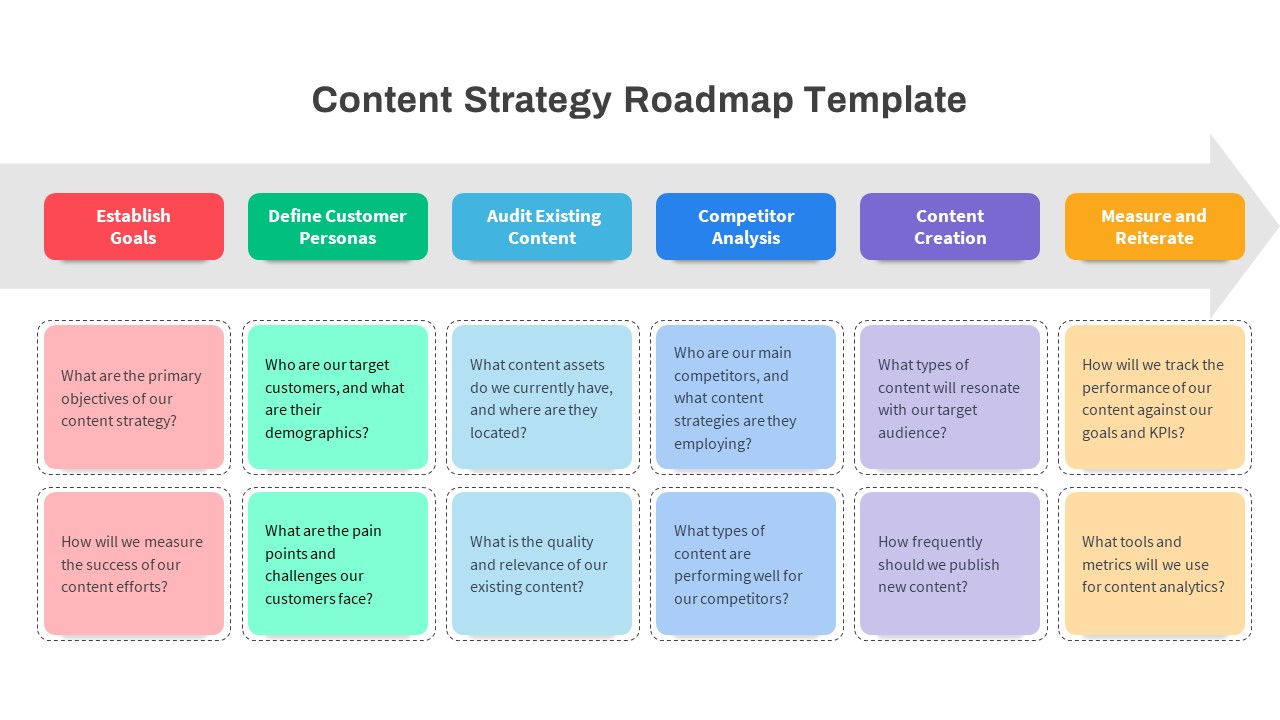
Content Strategy Roadmap Arrow Template for PowerPoint & Google Slides
Roadmap
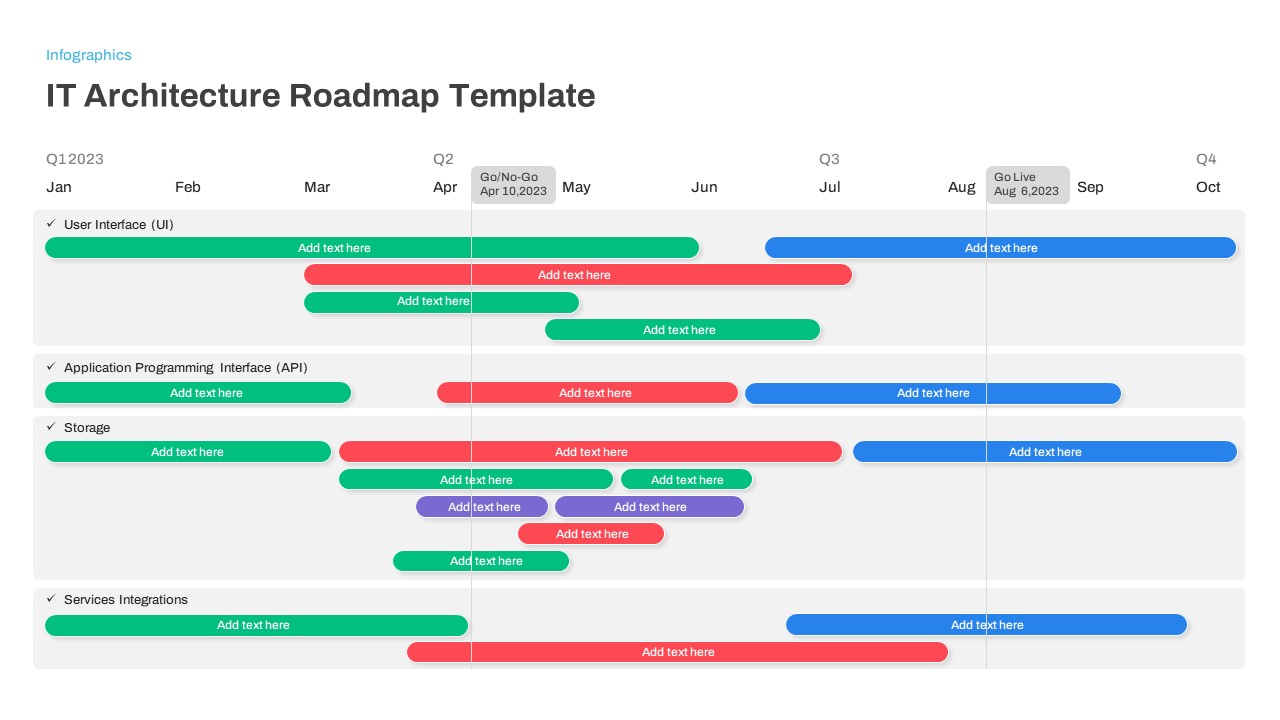
Modern IT Architecture Roadmap Template for PowerPoint & Google Slides
Roadmap
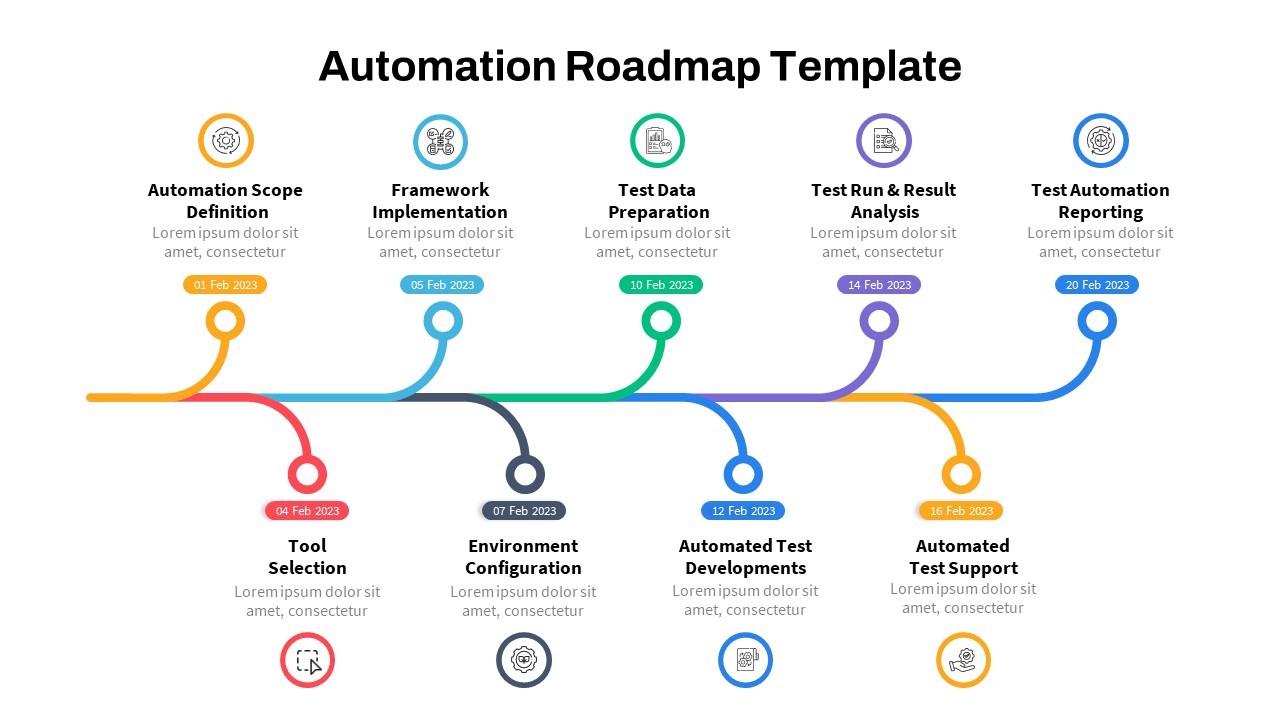
Automation Process Roadmap Infographic Template for PowerPoint & Google Slides
Roadmap
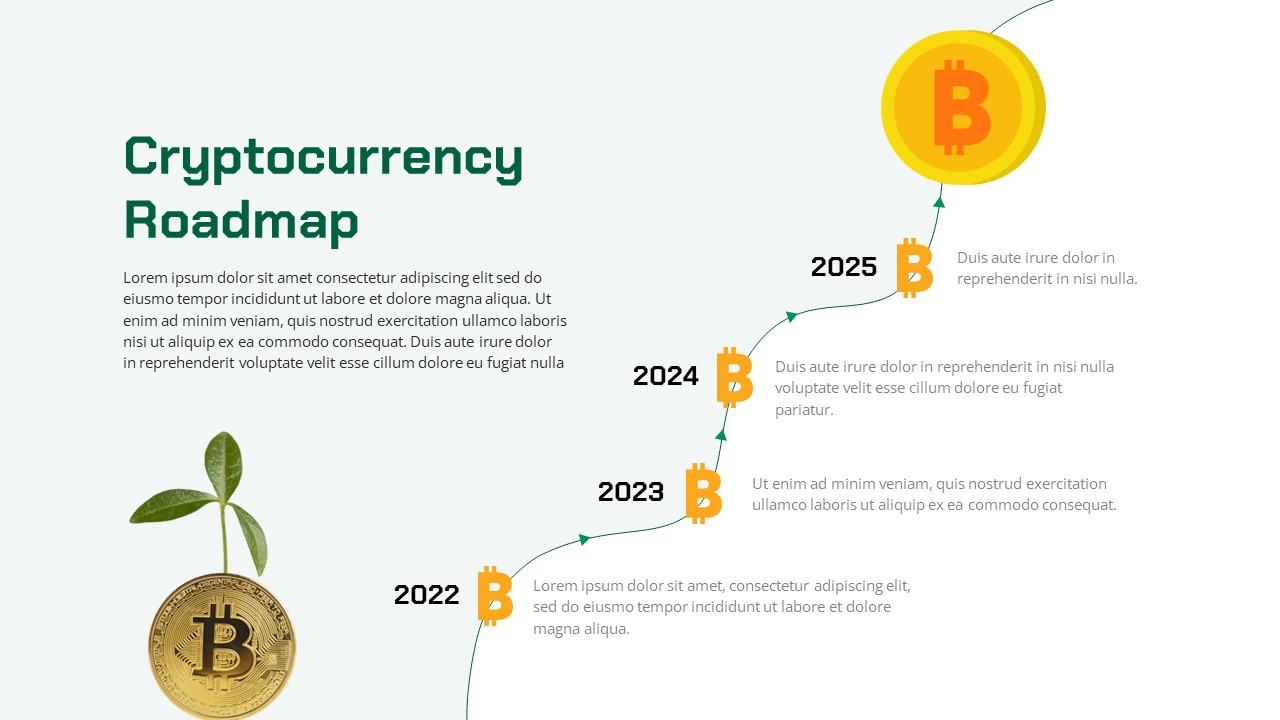
Cryptocurrency Roadmap Infographic Template for PowerPoint & Google Slides
Timeline
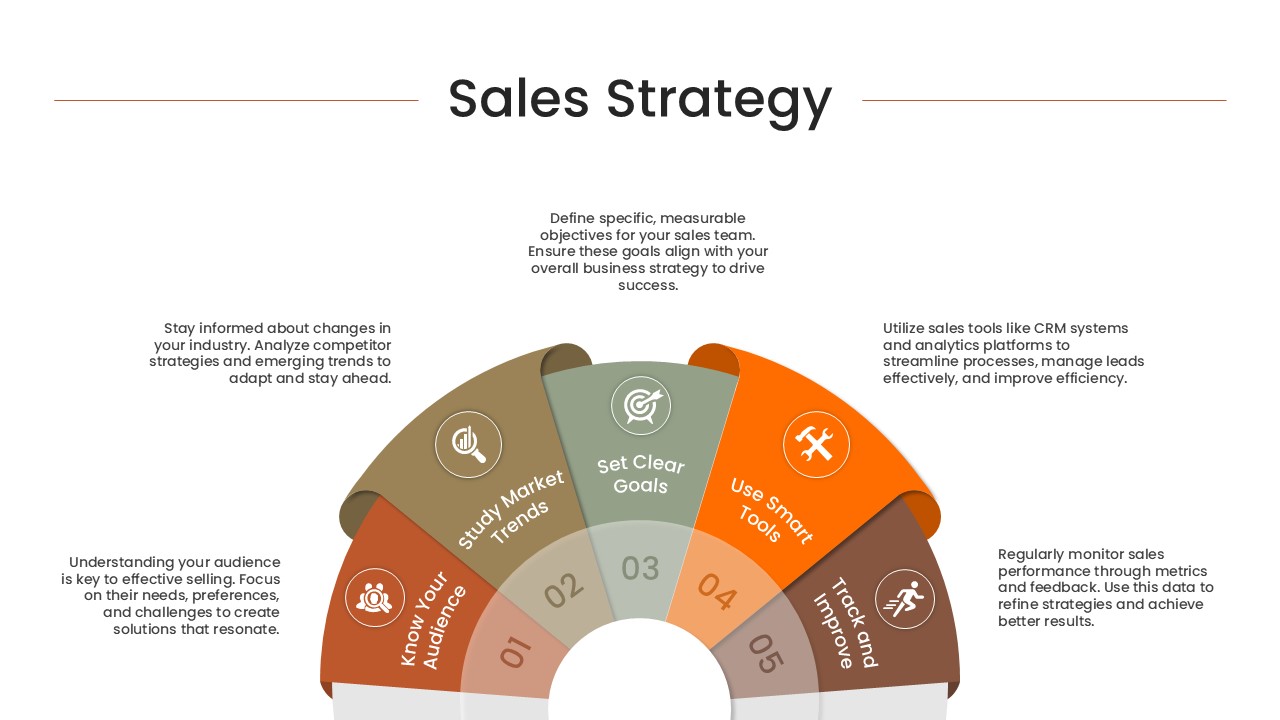
Semi-Circular Sales Strategy Roadmap Template for PowerPoint & Google Slides
Circular
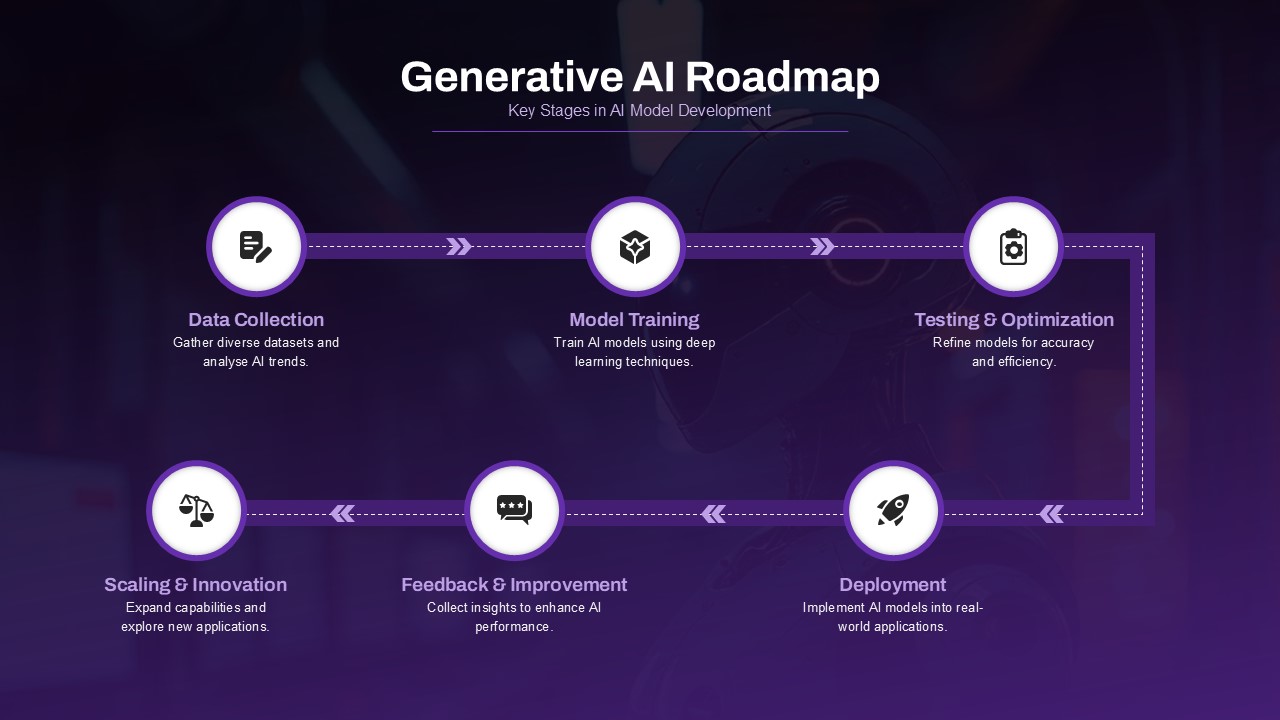
Generative AI Roadmap Key Stages Template for PowerPoint & Google Slides
Roadmap
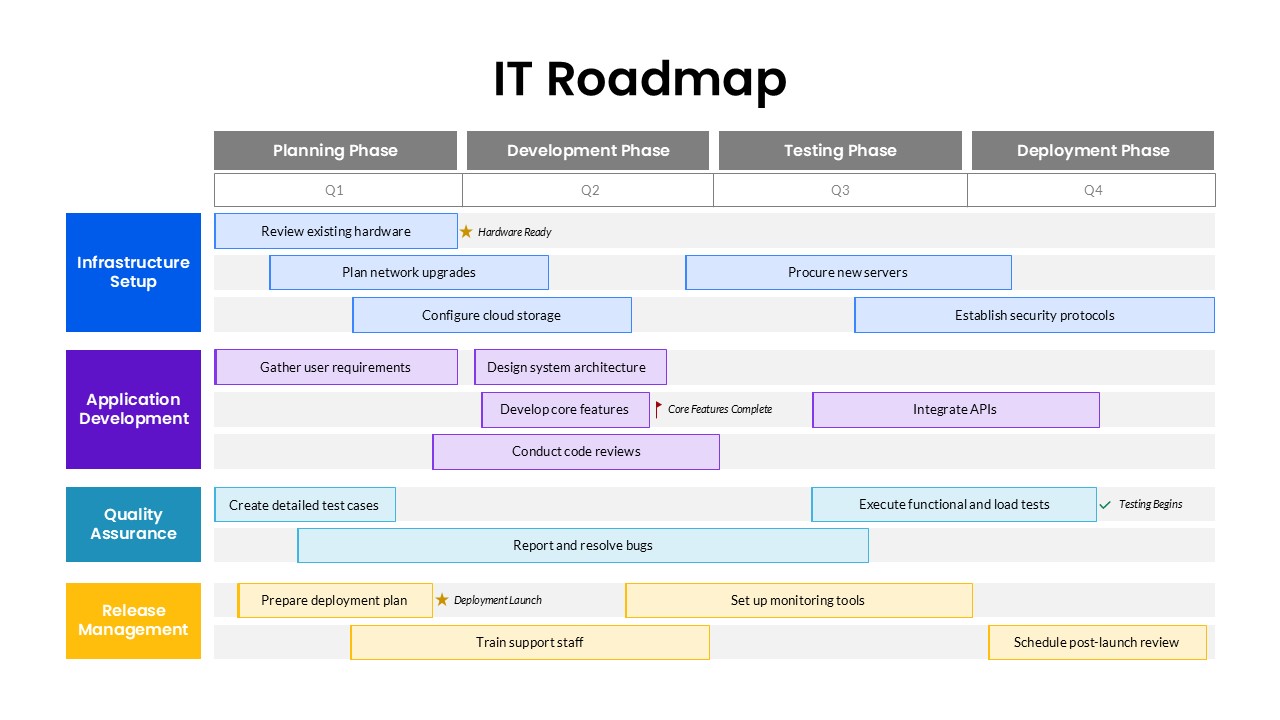
IT Roadmap Phases template for PowerPoint & Google Slides
Software Development
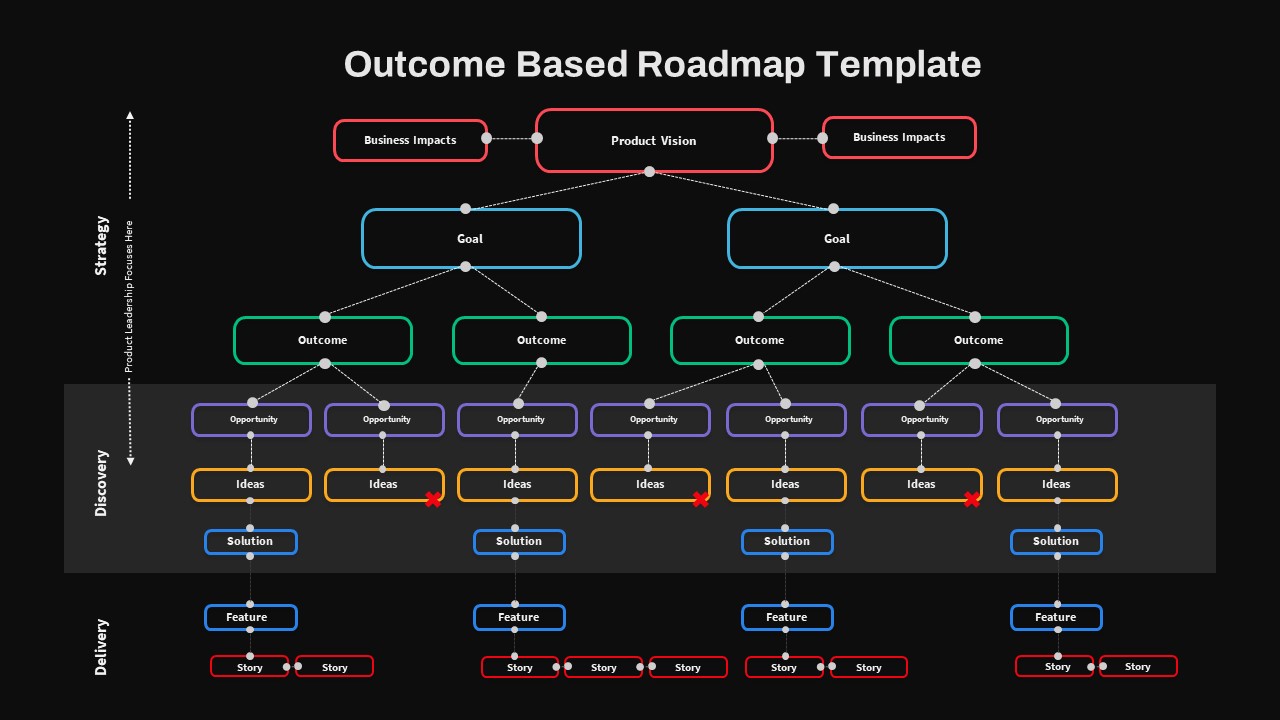
Outcome-Based Roadmap Hierarchy Template for PowerPoint & Google Slides
Roadmap
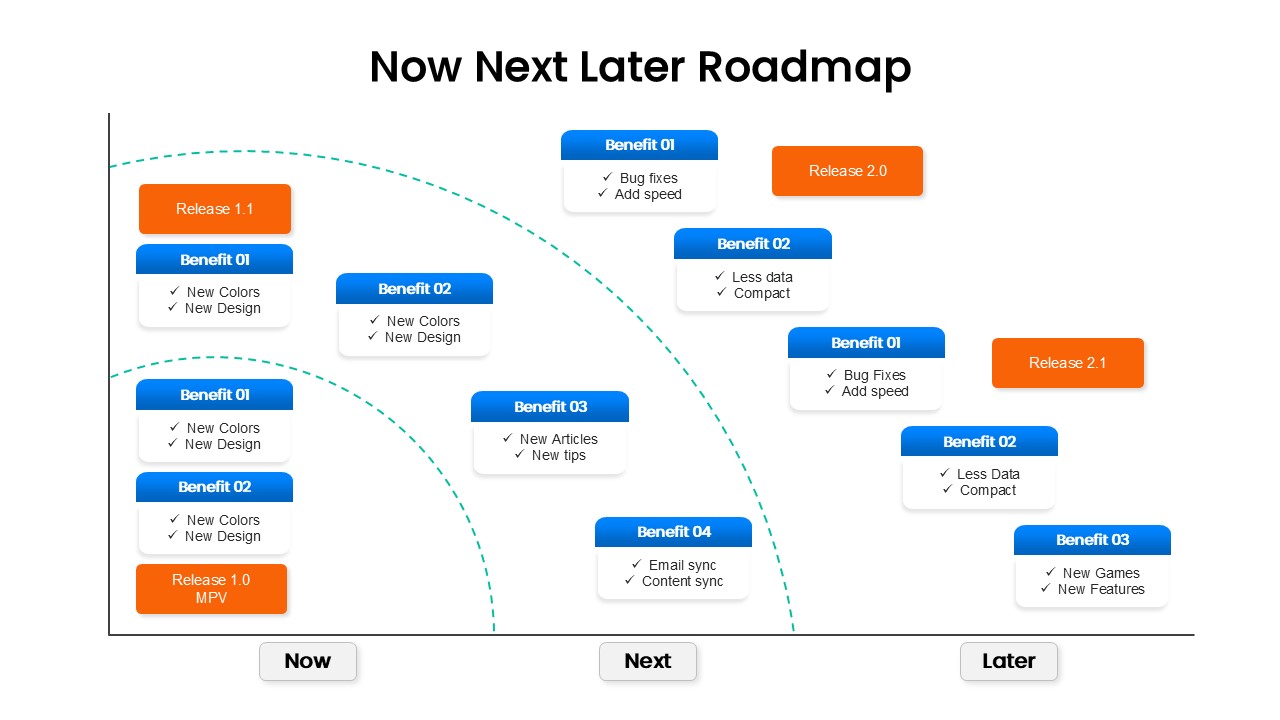
Now Next Later Product Roadmap with Releases Template for PowerPoint & Google Slides
Roadmap
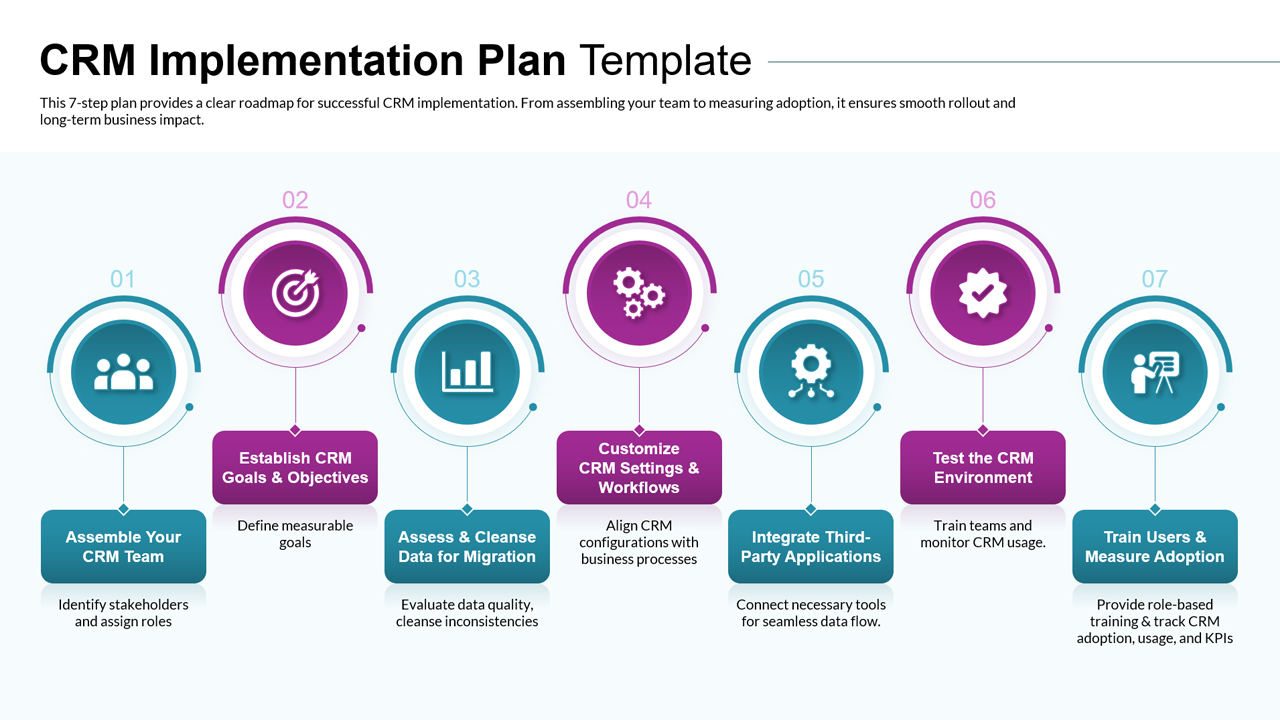
CRM Implementation Plan Roadmap Template for PowerPoint & Google Slides
Marketing