Budget Infographic & Expense Tracker Template for PowerPoint & Google Slides


Description
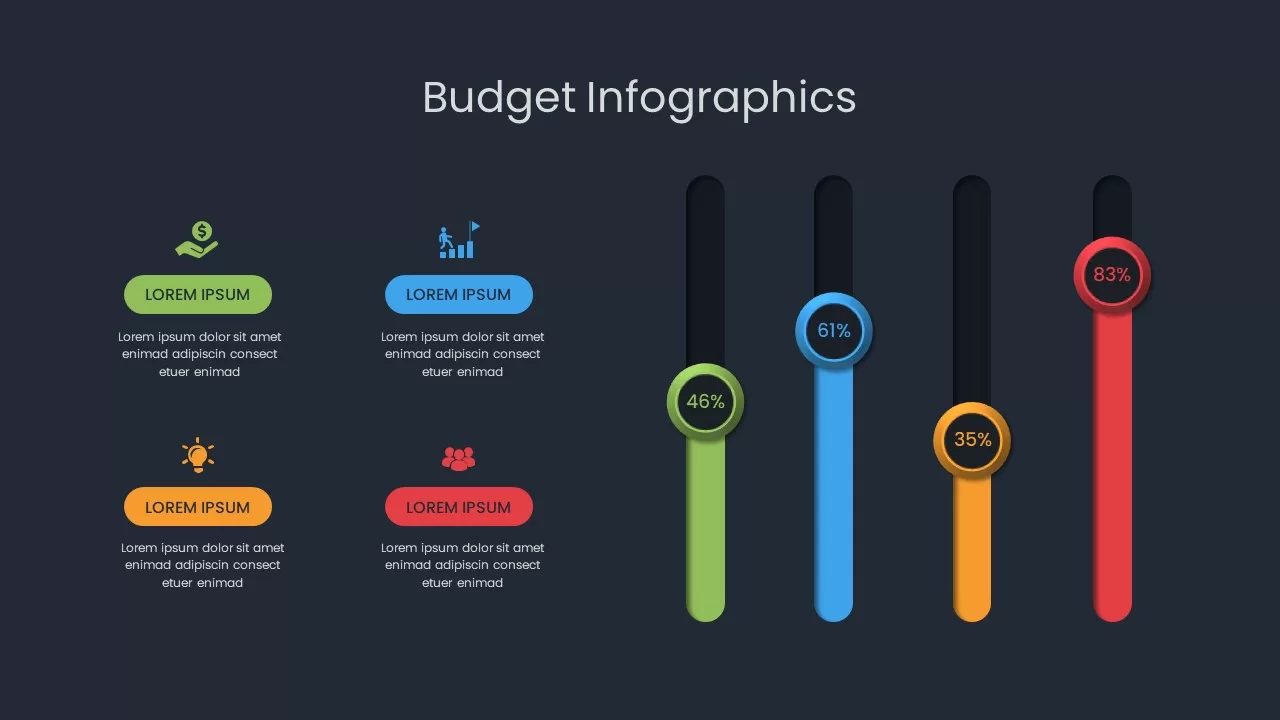
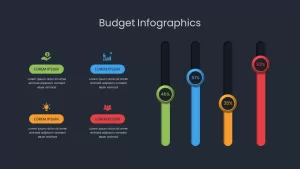
Download this budget infographic and expense tracker slide to visualize spending, savings, and allocations with clarity. The first layout presents four icon-led callouts—savings, goals, ideas, and team—paired with vertical slider bars that highlight key percentages. The second slide features four radial progress charts against a light or dark background, each accompanied by matching icons and descriptions for quick dashboard-style reporting. The third design transforms data into test-tube–style bars topped with circular icons, perfect for labelling budget categories and fill levels. Finally, the “Budget & Expenses” slide delivers a concise summary: total budget, remaining funds, percent used in a segmented circular gauge, and a timeline of expense items with icons and values.
Built on master slides for both PowerPoint and Google Slides, every element is fully editable and vector-based—swap icons, adjust colors, or change percentages without losing alignment. Rounded corners, subtle shadows, and modern typography ensure a polished, professional look in any presentation setting. Whether you’re reporting to finance teams, steering committees, or stakeholders, this four-slide pack streamlines your slide creation and drives insights with minimal effort.
Who is it for
Finance managers, project leads, and accountants will leverage these infographics for budget reviews, expense tracking, and financial reporting. Marketing managers, operations directors, and executives benefit from the clear, visual dashboard layouts.
Other Uses
Beyond budgets, repurpose these designs for KPI dashboards, project progress reports, resource utilization charts, or fundraising updates. Simply relabel icons, tweak scales, and update figures to suit any data-driven narrative.
Login to download this file

Item ID
SB02268
Related Templates

Project Tracker Timeline Gantt Chart Template for PowerPoint & Google Slides
Project Status
Comprehensive Action Tracker Table Template for PowerPoint & Google Slides
Business
Team Goals Tracker Template for PowerPoint & Google Slides
Employee Performance
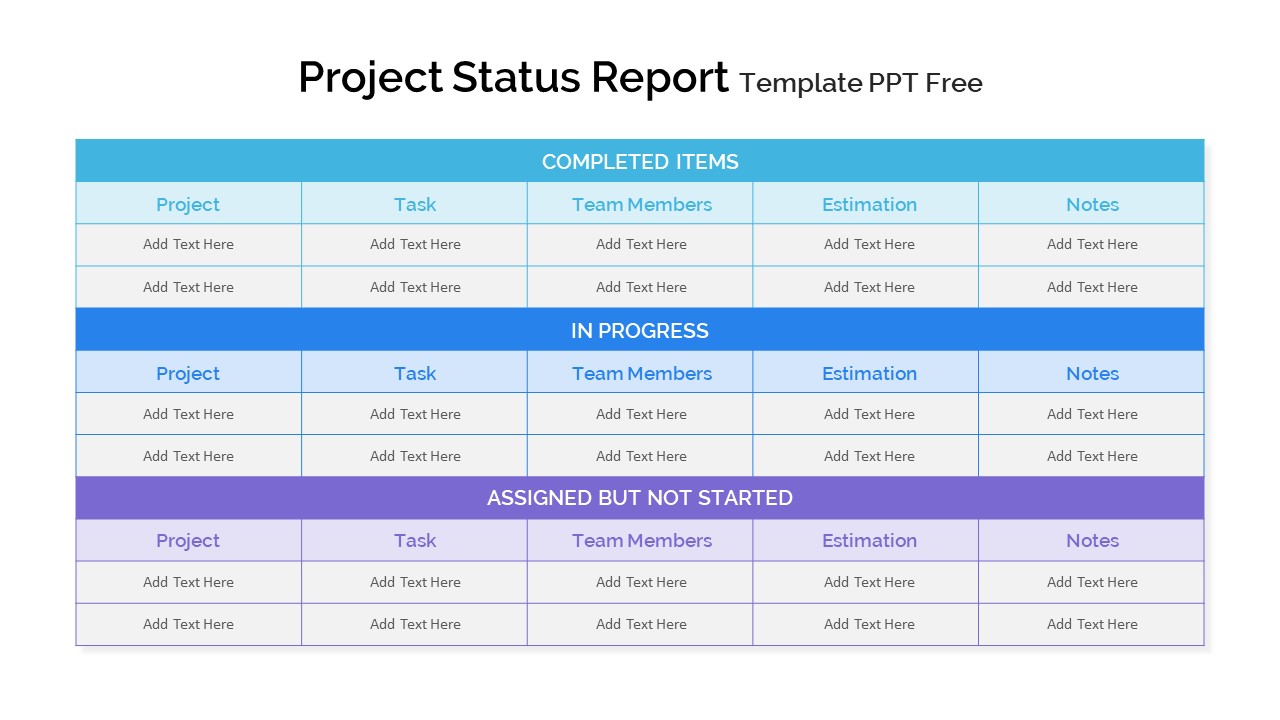
Project Status Report Tracker Slide for PowerPoint & Google Slides
Project Status
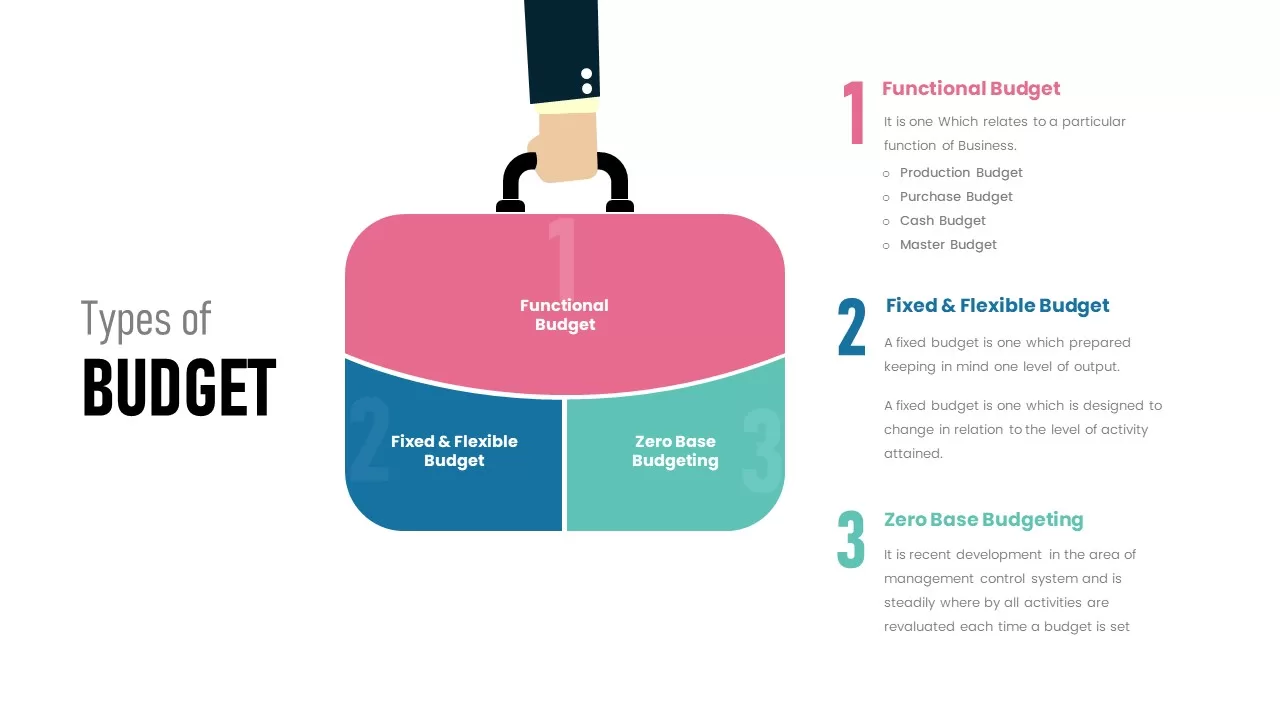
Types of Budget Infographic Pack Template for PowerPoint & Google Slides
Comparison
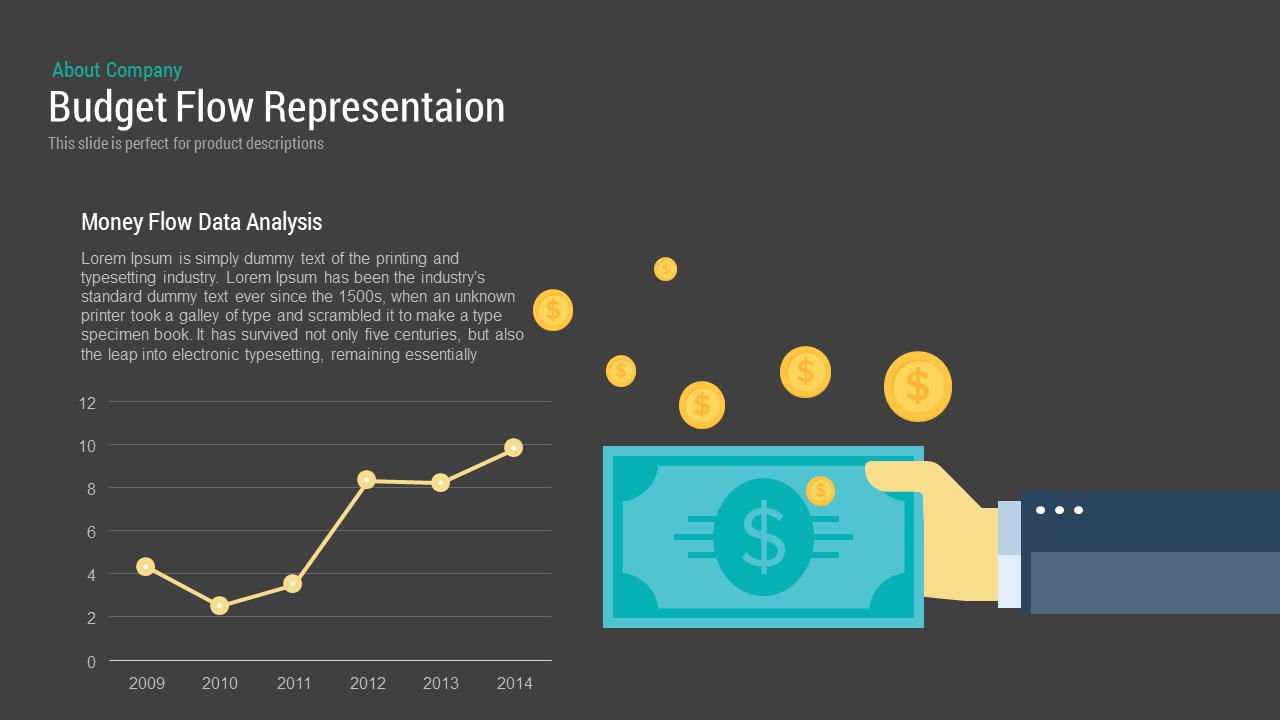
Budget Flow Representation template for PowerPoint & Google Slides
Process
Sales vs Budget Performance Chart Template for PowerPoint & Google Slides
Bar/Column
Budget Forecast Dashboard & Donut Charts Template for PowerPoint & Google Slides
Pie/Donut
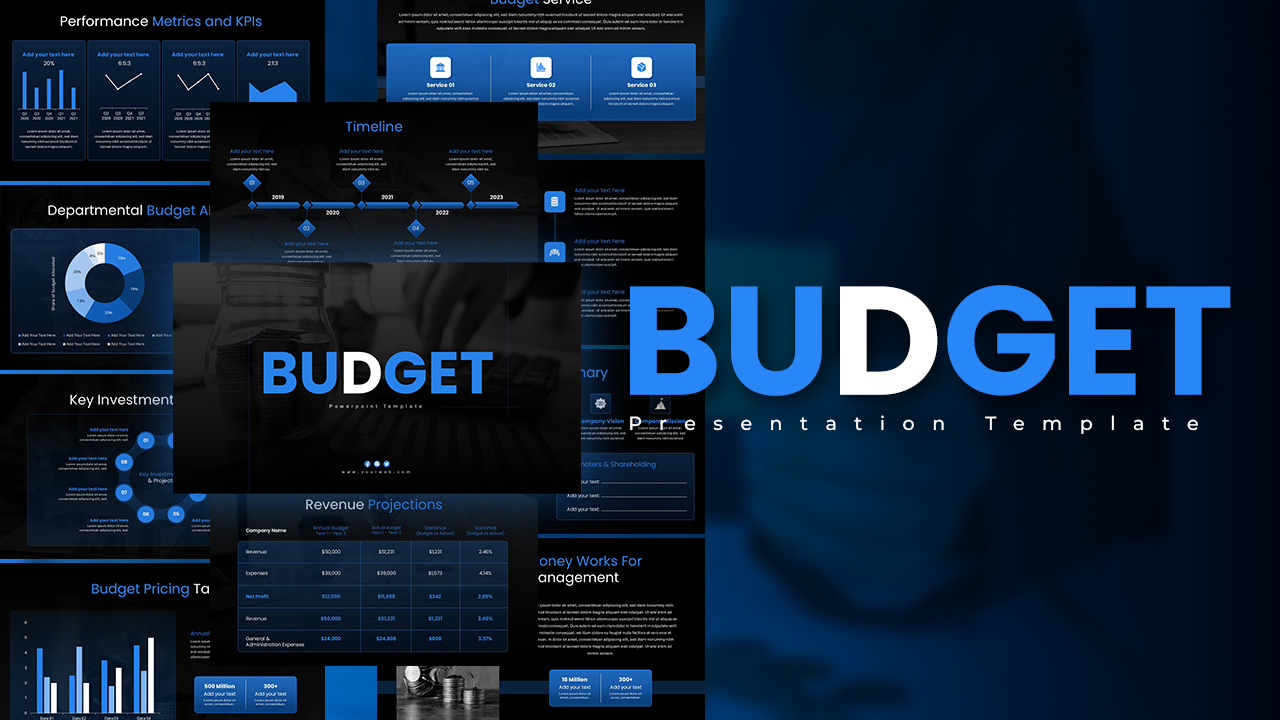
Engaging Dark Blue Budget Presentation Template for PowerPoint & Google Slides
Pitch Deck
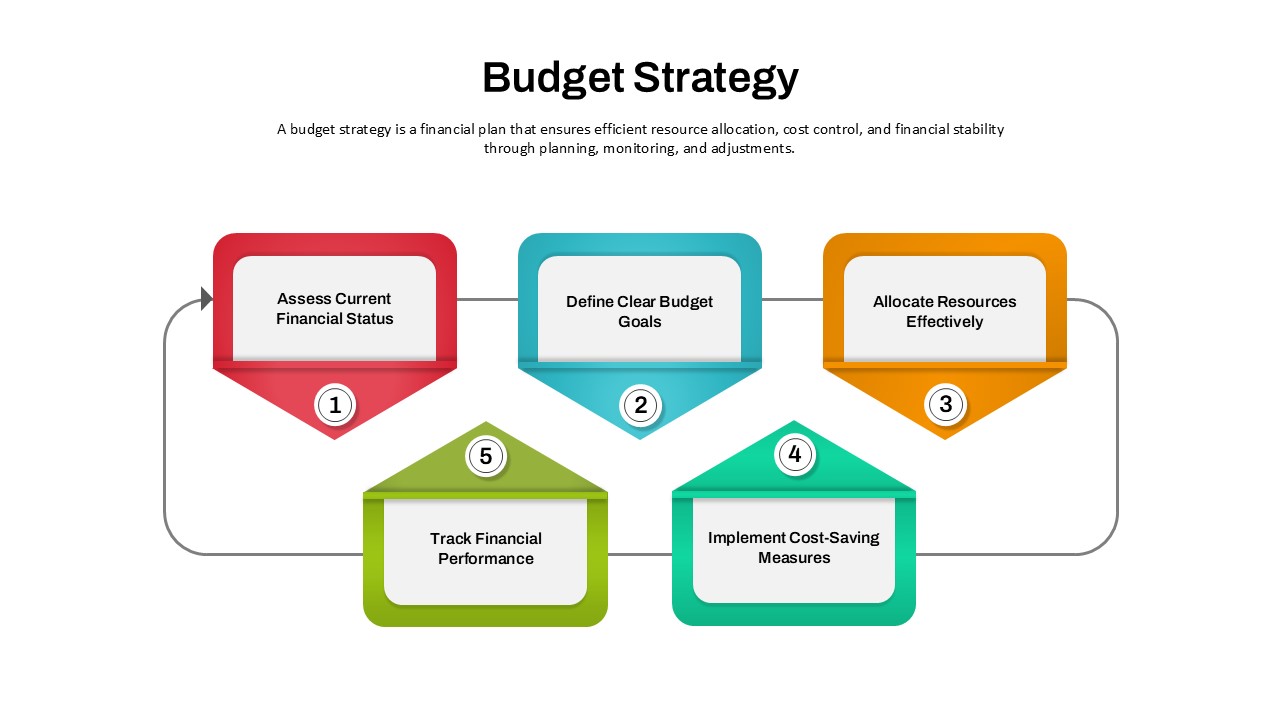
Budget Strategy Five-Step Process Template for PowerPoint & Google Slides
Finance
Marketing Budget Allocation Donut Chart Template for PowerPoint & Google Slides
Marketing
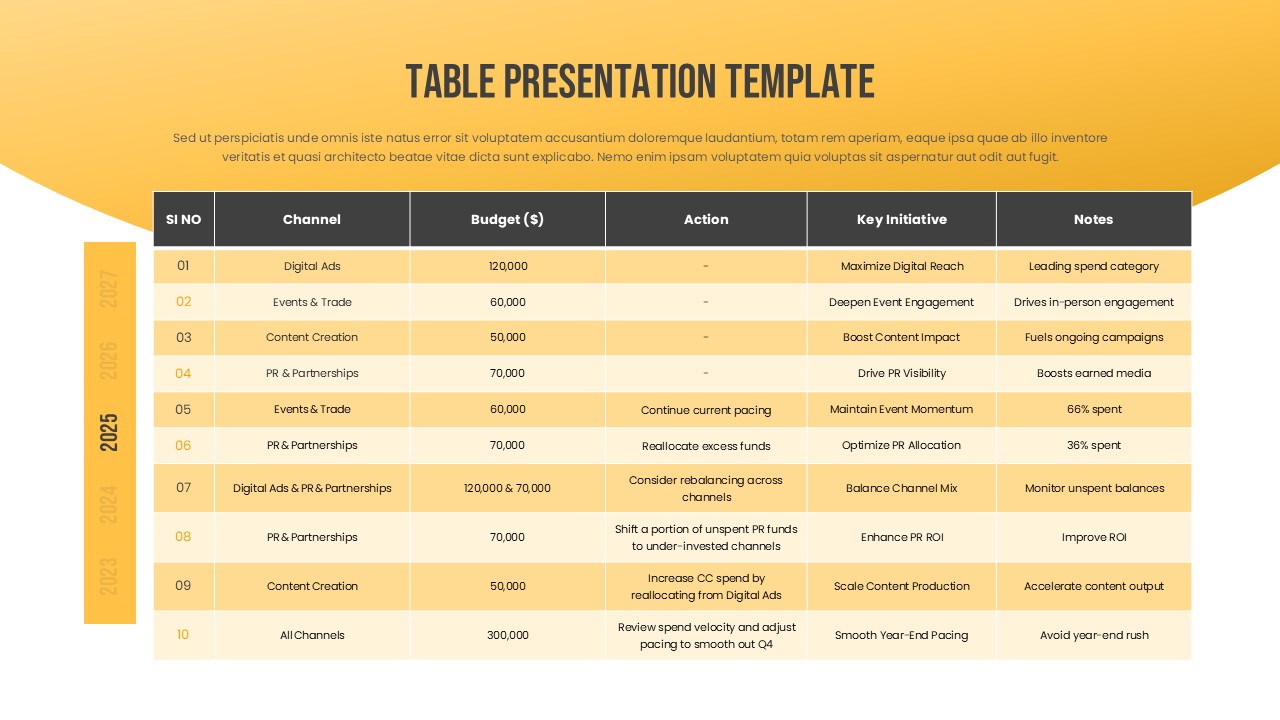
Marketing Budget Table Template for PowerPoint & Google Slides
Business
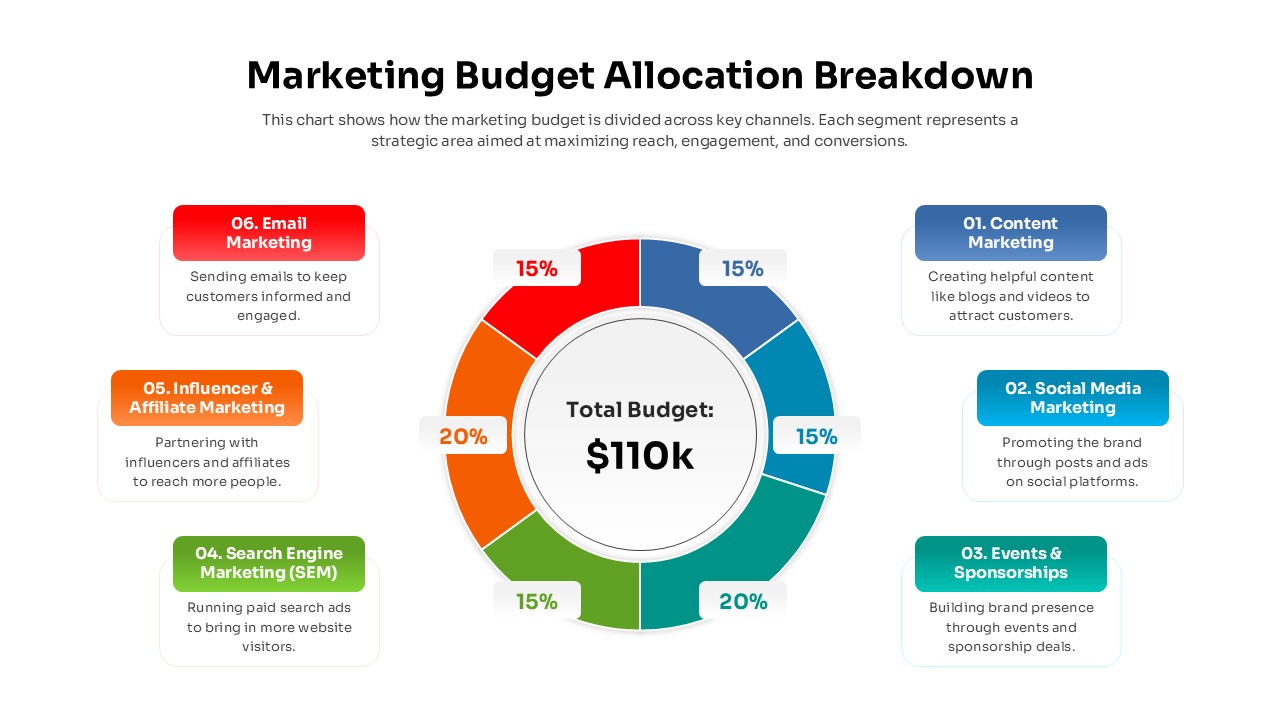
Marketing Budget Allocation Breakdown Template for PowerPoint & Google Slides
Finance
Google Ads Optimization & Performance Infographic Template for PowerPoint & Google Slides
Digital Marketing
SQ3R Study Strategy Infographic Slides Template for PowerPoint & Google Slides
Business Strategy
Six Double Diamond Infographic Slides Template for PowerPoint & Google Slides
Process

Sales Process Infographic Slides Pack Template for PowerPoint & Google Slides
Process
Casino/Poker Chips Infographic Slides template for PowerPoint & Google Slides
Business Strategy
Agenda Infographic Pack of 2 Slides Template for PowerPoint & Google Slides
Agenda
Quad Chart Infographic Pack of 8 Slides Template for PowerPoint & Google Slides
Comparison Chart
Four Options Infographic Slides Template for PowerPoint & Google Slides
Comparison
Game Plan Infographic Slides Pack Template for PowerPoint & Google Slides
Infographics
Teamwork PowerPoint Infographic Template for PowerPoint & Google Slides
Leadership
Kite Infographic PowerPoint Template for PowerPoint & Google Slides
Process
Cladogram Infographic Di Template for PowerPoint & Google Slides Template
Decision Tree
Workflow PowerPoint Process infographic for PowerPoint & Google Slides
Process
Free Infographic Deck PowerPoint Pack for PowerPoint & Google Slides
Infographics
Free
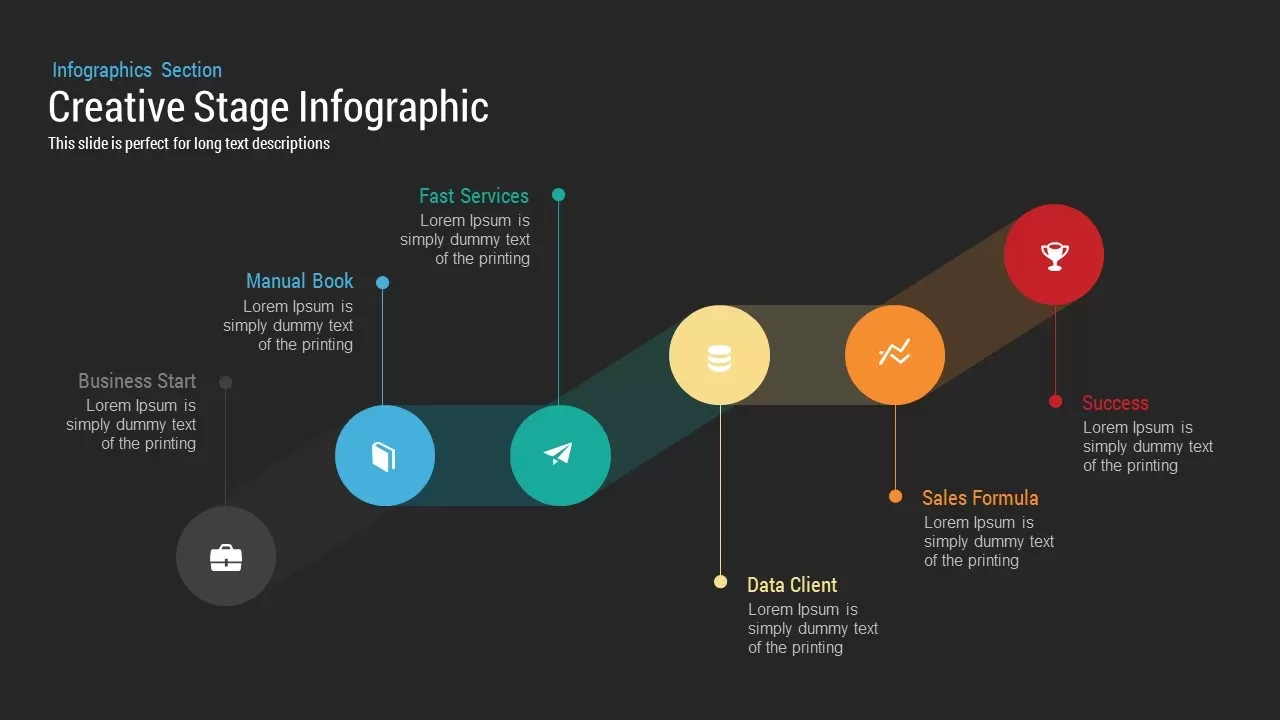
Stage Infographic template for PowerPoint & Google Slides
Process
Africa Country Map Infographic Template for PowerPoint & Google Slides
World Maps
7-Level 3D Pyramid Infographic Diagram Template for PowerPoint & Google Slides
Pyramid
Business Stages Progression Infographic template for PowerPoint & Google Slides
Process
Bridging the Gap Infographic Process template for PowerPoint & Google Slides
Process

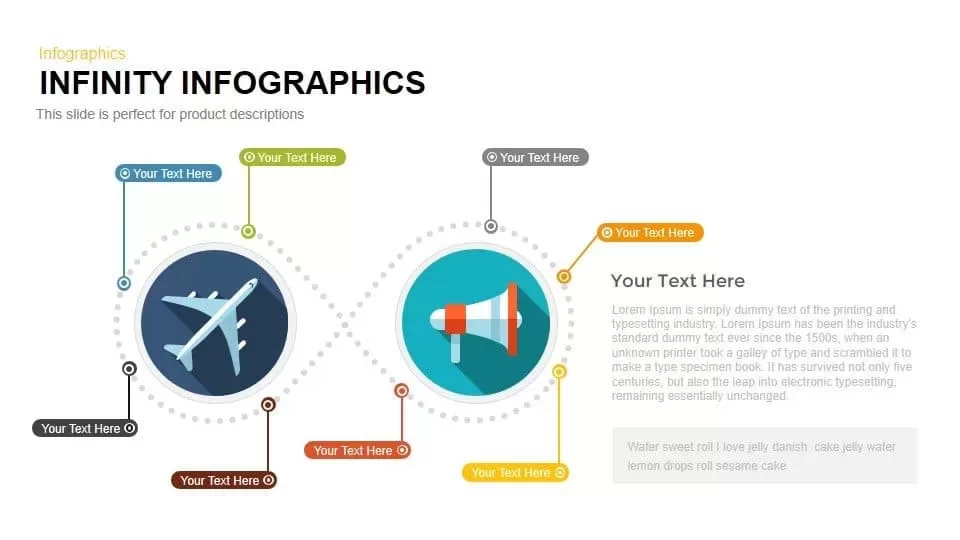
Looped Infinity Infographic Slide Template for PowerPoint & Google Slides
Process
Colorful Photo Capture Infographic Template for PowerPoint & Google Slides
Advertising
Four-Stage Linear Infographic Diagram Template for PowerPoint & Google Slides
Process
Three-Circle Diagram Infographic Template for PowerPoint & Google Slides
Circular
Gender Comparison People Infographic Template for PowerPoint & Google Slides
Comparison
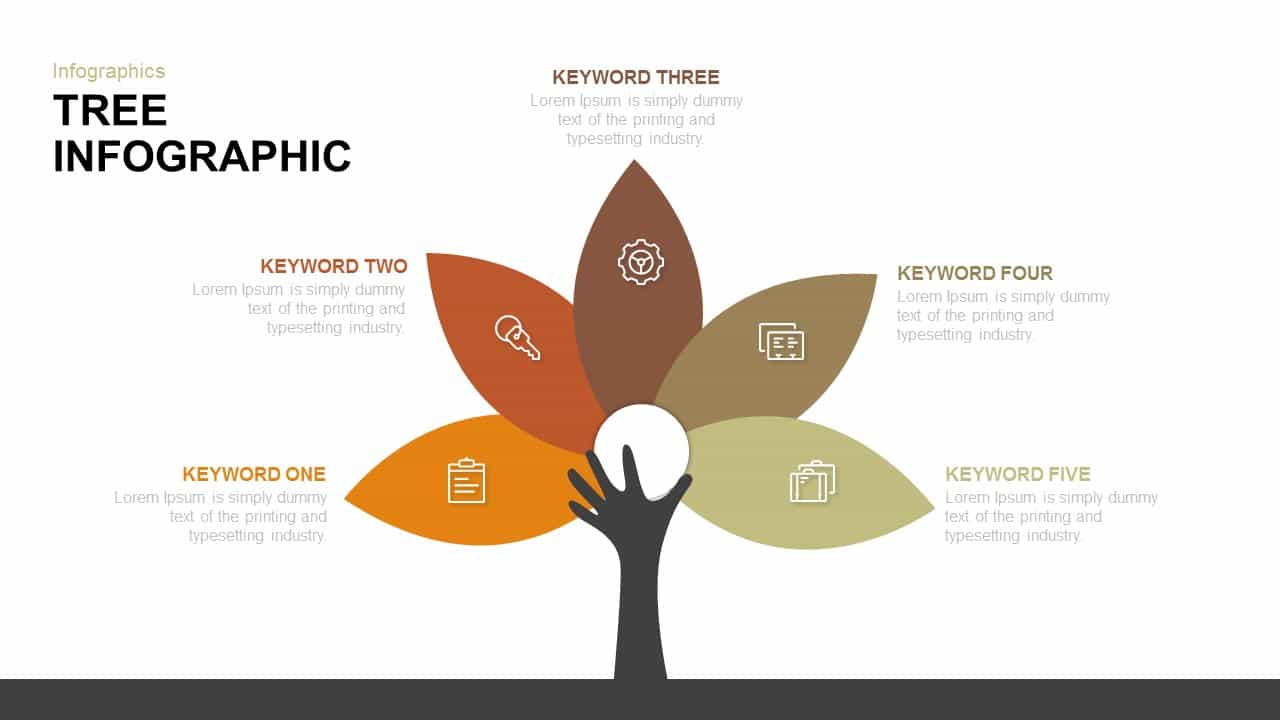
Tree Keyword Petals Infographic Template for PowerPoint & Google Slides
Process
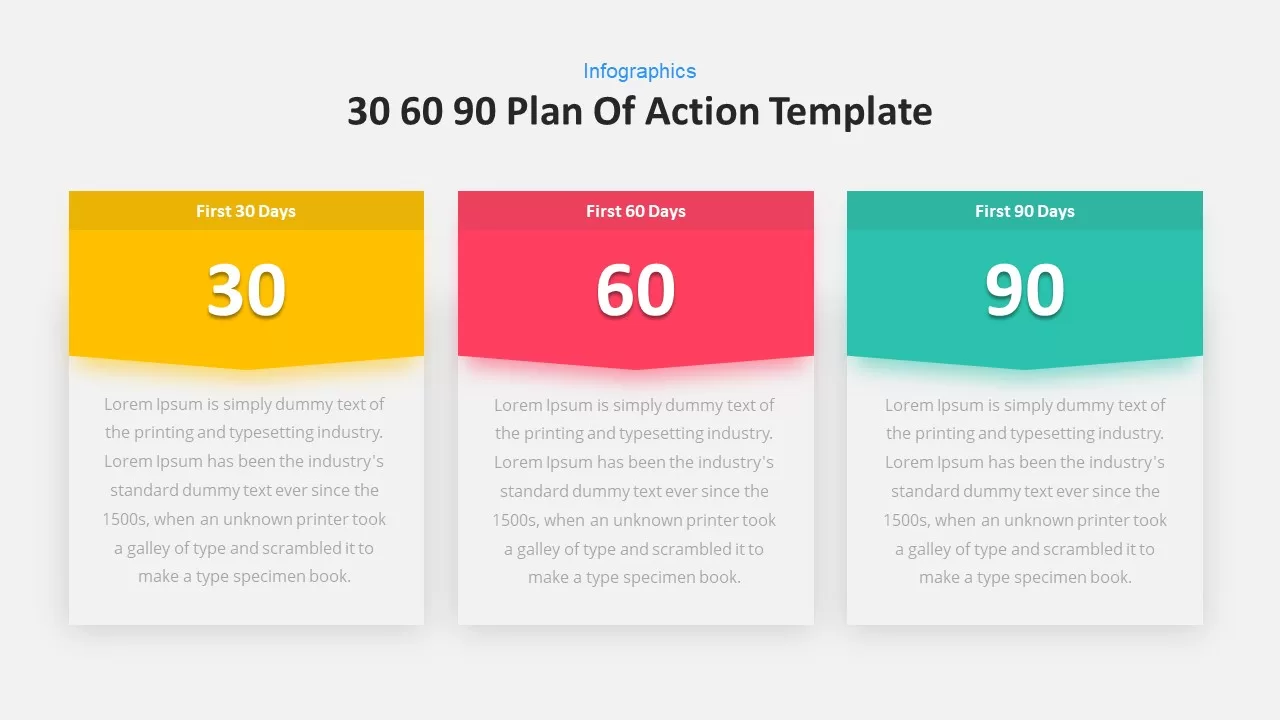
30 60 90-Day Plan Infographic Slide Template for PowerPoint & Google Slides
Business

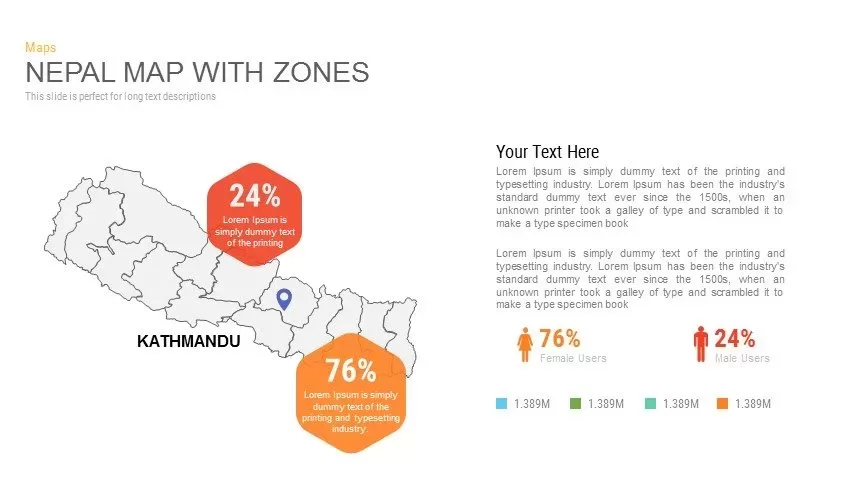
Nepal Map with Zones Infographic Template for PowerPoint & Google Slides
Maps
Vietnam Provinces Map Infographic Pack Template for PowerPoint & Google Slides
Maps
Four-Section Arrow Infographic Diagram Template for PowerPoint & Google Slides
Arrow

Eight Post-It Note Arrow Infographic Template for PowerPoint & Google Slides
Arrow
Rounded Numbers List Infographic Template for PowerPoint & Google Slides
Comparison
Five-Step Puzzle Head Infographic Template for PowerPoint & Google Slides
Process
Social Network Infographic Diagram Template for PowerPoint & Google Slides
Digital Marketing
Animated 5-Stage Puzzle Timeline Infographic Template for PowerPoint & Google Slides
Timeline
Five-Year Gradient Timeline Infographic Template for PowerPoint & Google Slides
Timeline
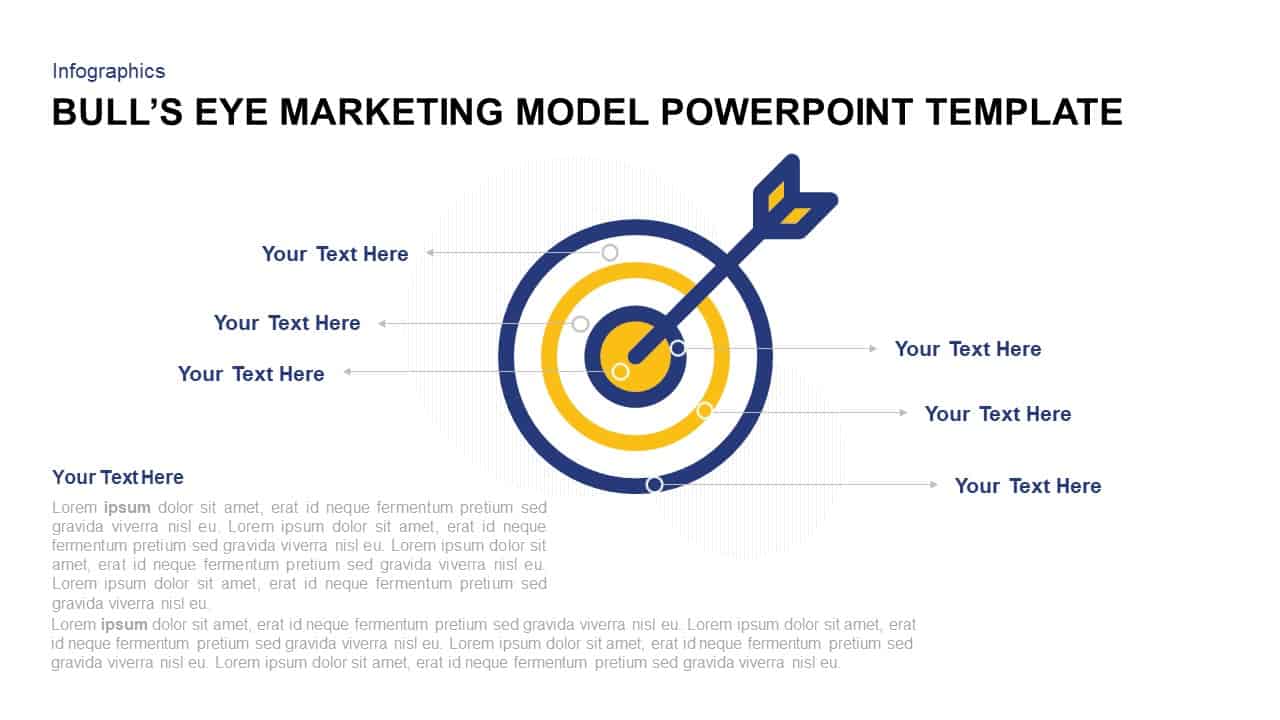
Bull’s Eye Marketing Model Infographic Template for PowerPoint & Google Slides
Circular
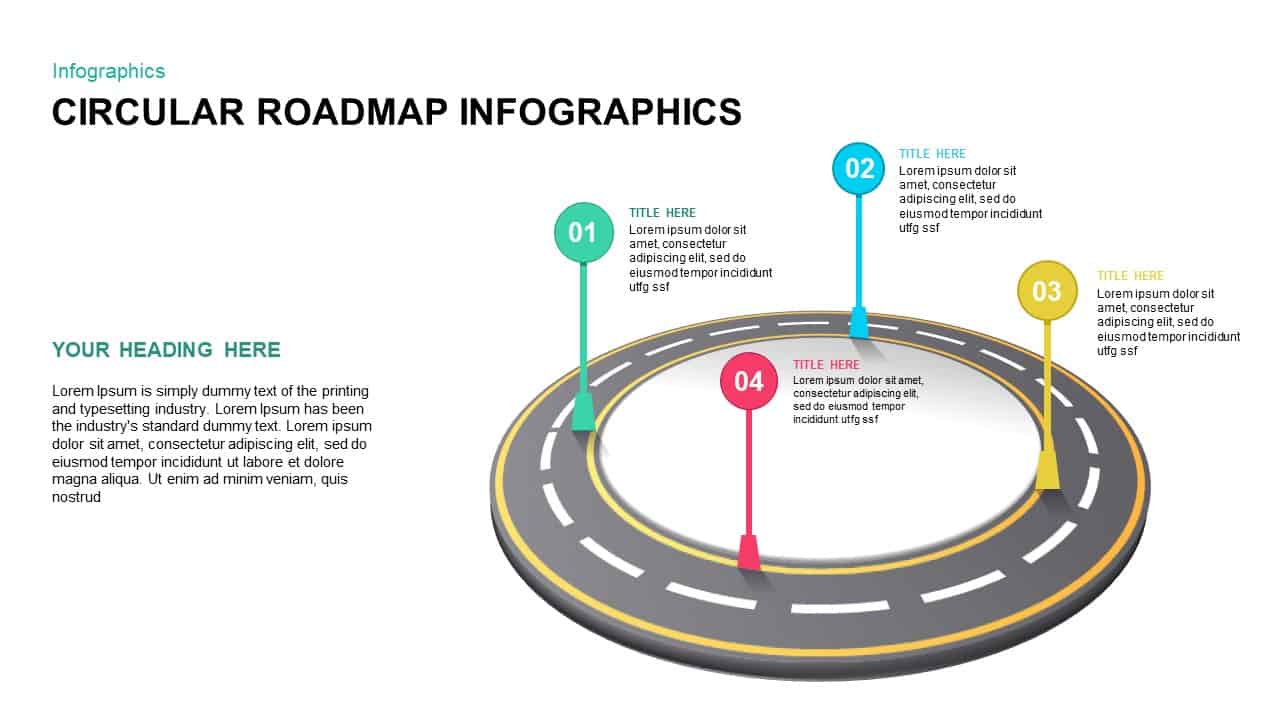
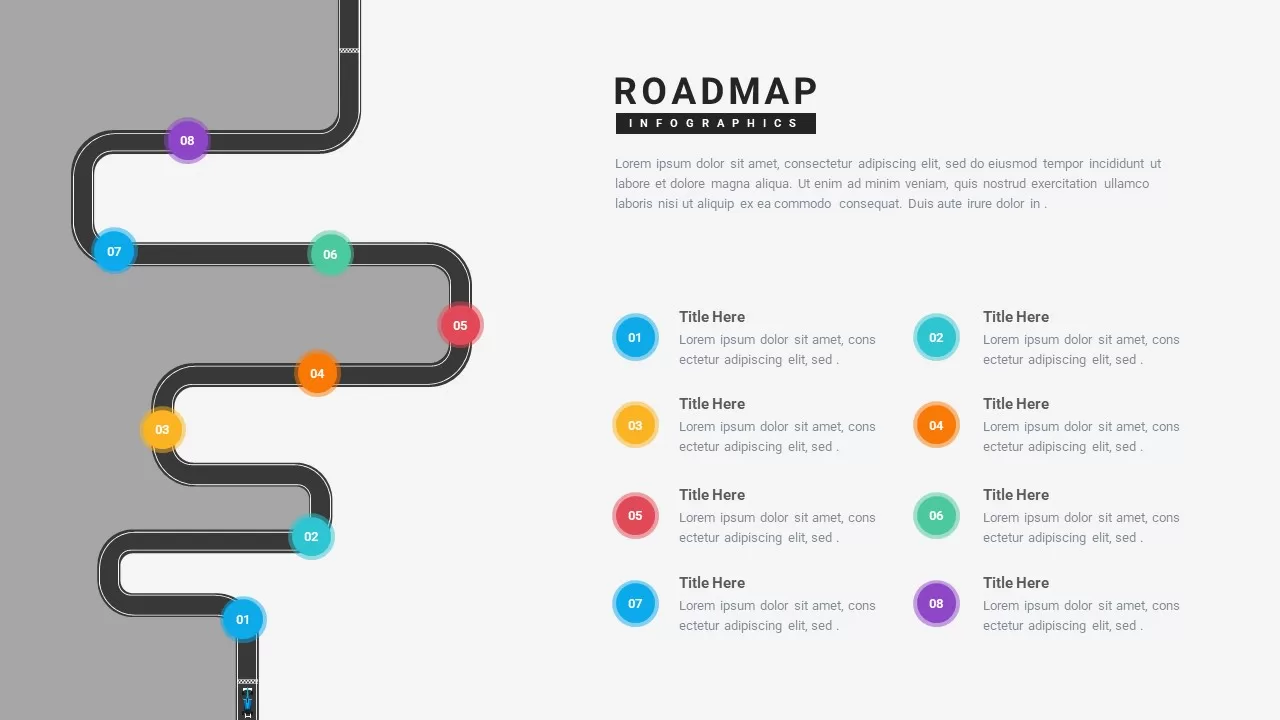
4-Step Circular Roadmap Infographic Template for PowerPoint & Google Slides
Roadmap
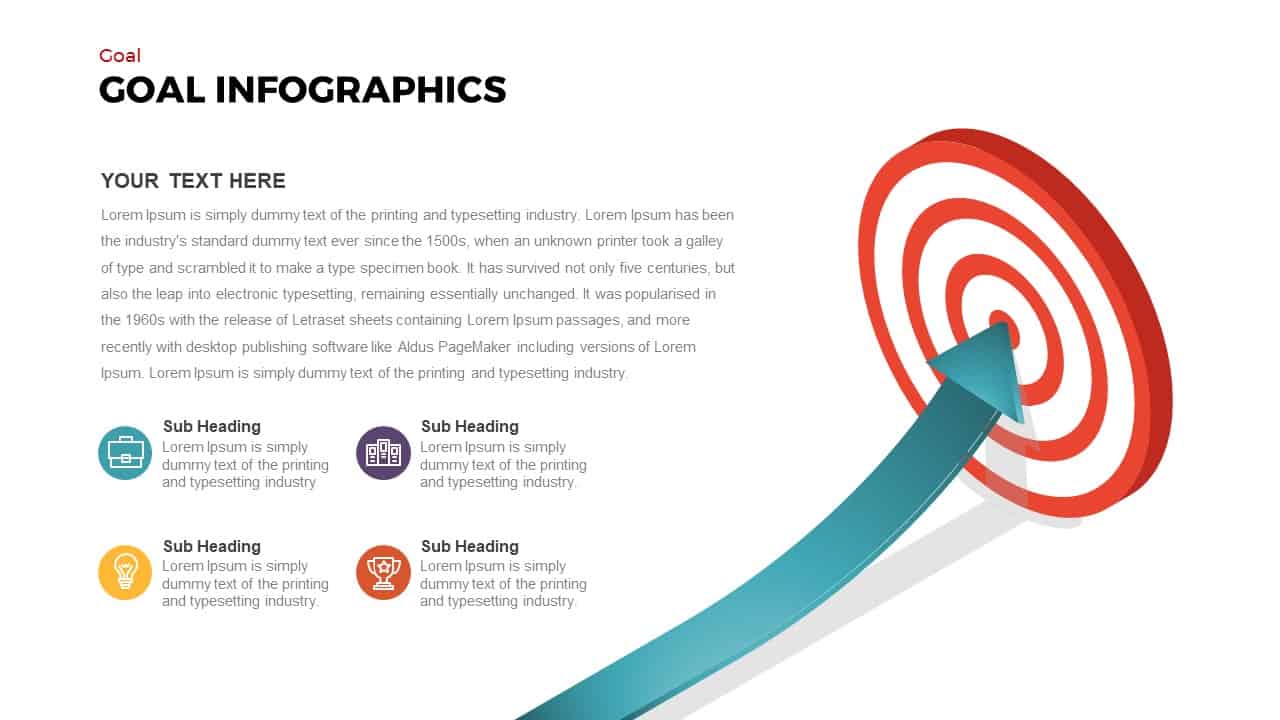
Goal Arrow and Target Infographic Template for PowerPoint & Google Slides
Goals
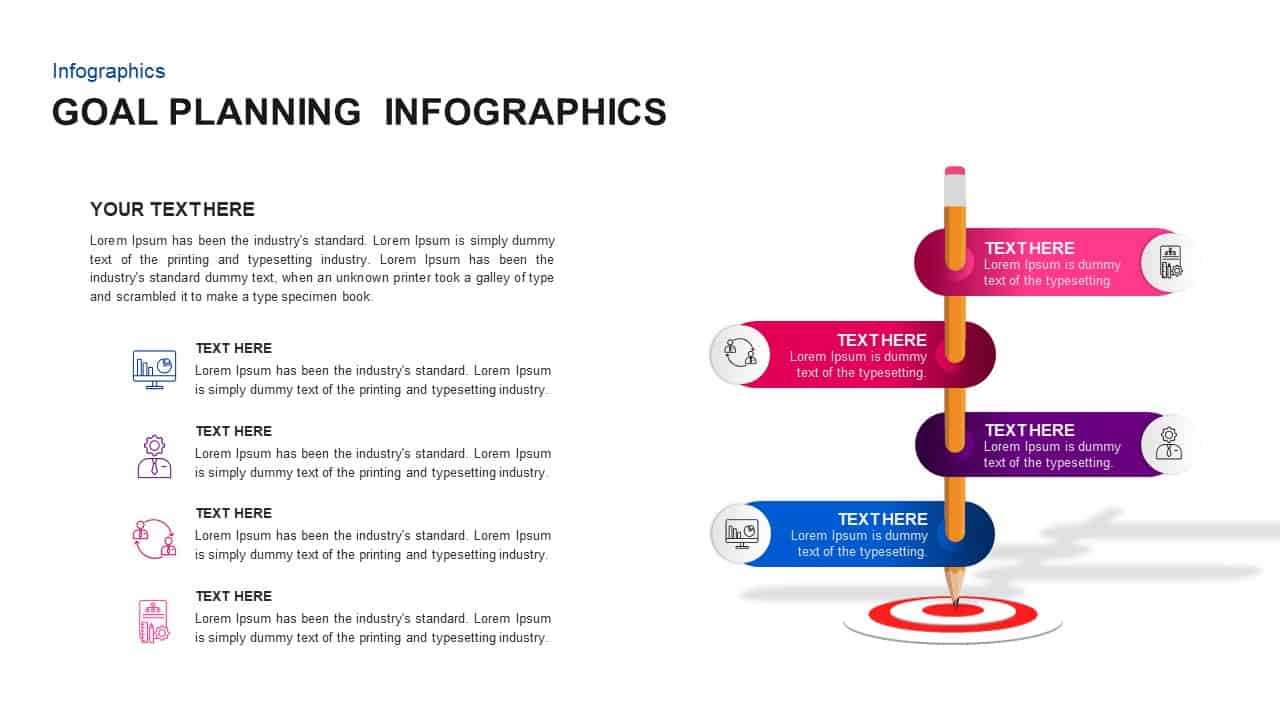
Goal Planning Ribbon Process Infographic Template for PowerPoint & Google Slides
Goals
6 Stage Service Process Infographic Template for PowerPoint & Google Slides
Process
VUCA World Infographic Presentation Template for PowerPoint & Google Slides
Pitch Deck

DMAIC Process Improvement Infographic Template for PowerPoint & Google Slides
Process
Plan Do Check Act PDCA Cycle Infographic Template for PowerPoint & Google Slides
Process
Mintzberg 5P Strategy Infographic Template for PowerPoint & Google Slides
Circular
3, 4, 5 Step Infographic Template for PowerPoint & Google Slides
Business Proposal
Effective Business Plan Infographic Template for PowerPoint & Google Slides
Pitch Deck
Modern 6 Step Infographic Diagram template for PowerPoint & Google Slides
Process
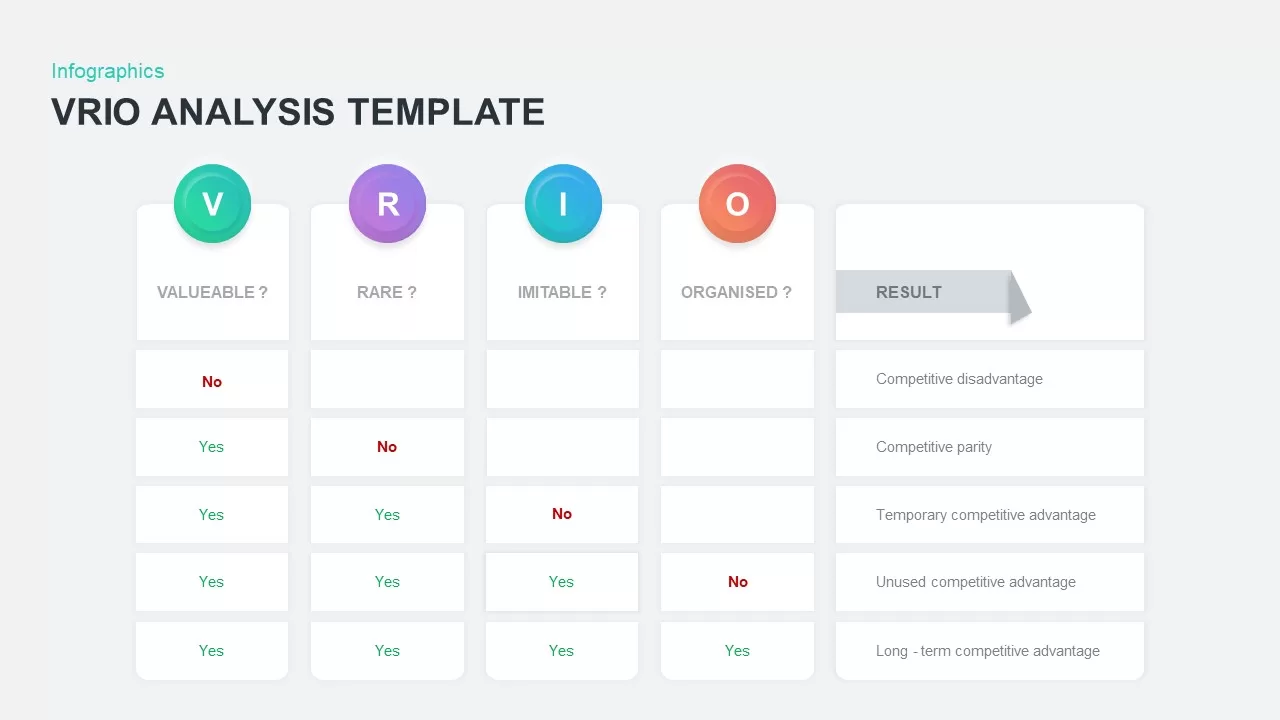
VRIO Analysis Infographic Template for PowerPoint & Google Slides
Business Strategy
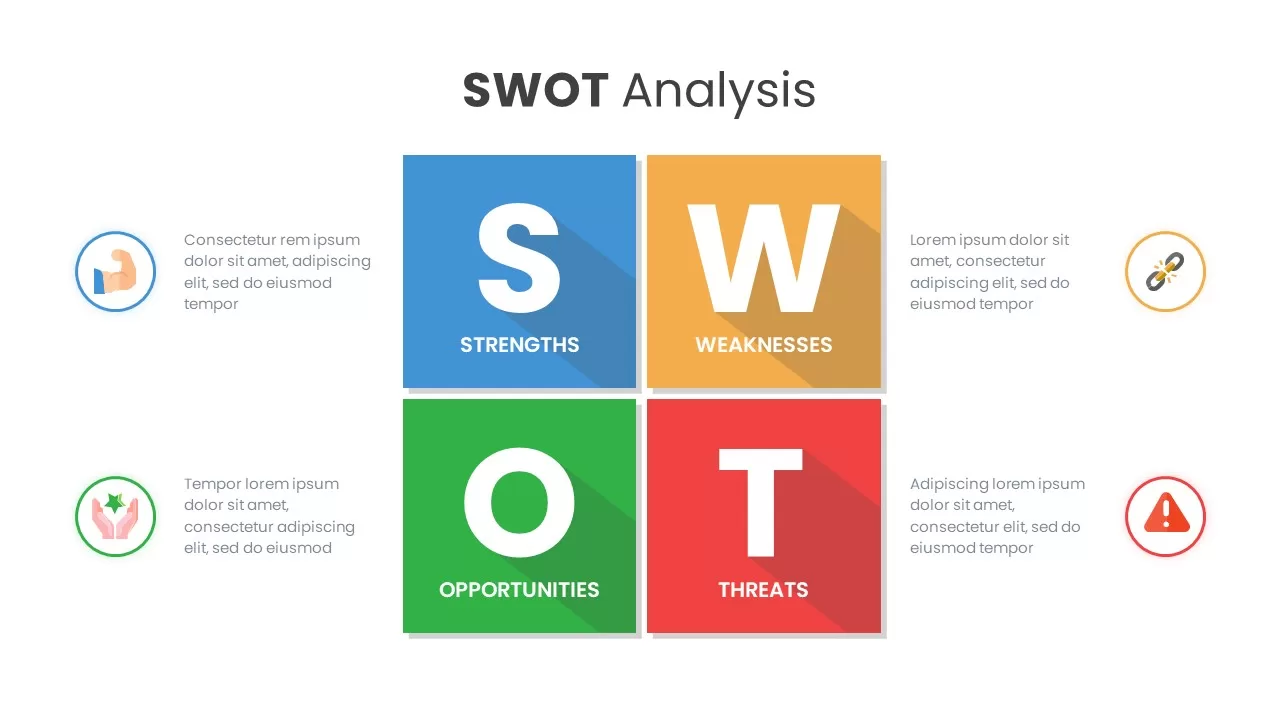
SWOT Analysis Grid Infographic Template for PowerPoint & Google Slides
SWOT
Editable World Map Callout Infographic Template for PowerPoint & Google Slides
World Maps
Eight-Step Winding Roadmap Infographic Template for PowerPoint & Google Slides
Roadmap
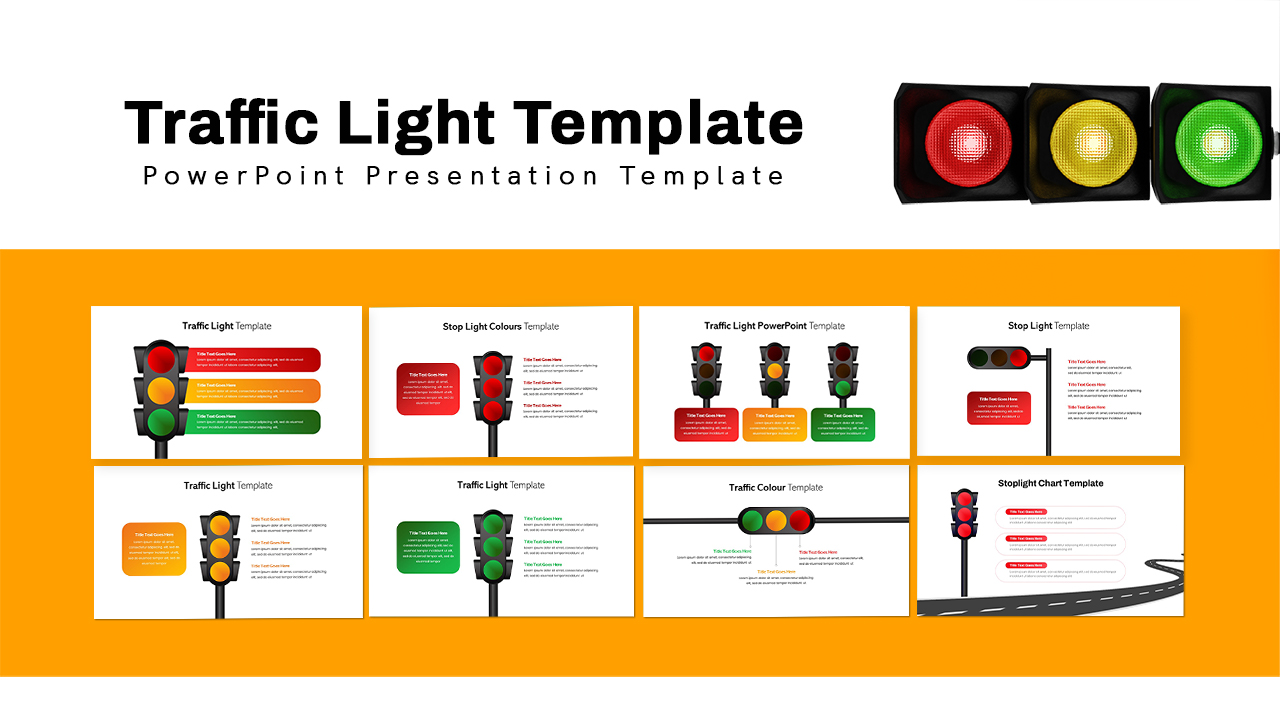
Traffic Light Infographic Pack Template for PowerPoint & Google Slides
Pitch Deck
Timeline Infographic Steps template for PowerPoint & Google Slides
Business Plan
Six-Step Table of Contents Infographic Template for PowerPoint & Google Slides
Agenda
Multi-Style Flow Infographic Slide template for PowerPoint & Google Slides
Process
Accomplishment Circular Infographic Template for PowerPoint & Google Slides
Accomplishment
Six-Part Hexagon Infographic Layout Template for PowerPoint & Google Slides
Infographics
Chain Link Process Infographic Diagram Template for PowerPoint & Google Slides
Process
Smartphone Infographic Diagram Template for PowerPoint & Google Slides
Comparison
4 Step Methodology Infographic Template for PowerPoint & Google Slides
Process
Statistics Infographic Template for PowerPoint & Google Slides
Bar/Column
Statistics & Global Metrics Infographic Template for PowerPoint & Google Slides
Bar/Column
Dynamic Circular Hub-and-Spoke Infographic Template for PowerPoint & Google Slides
Circular
Professional Drone Infographic Slide Template for PowerPoint & Google Slides
Infographics
Key Takeaway Infographic Slide Deck Template for PowerPoint & Google Slides
Process
Editable Monthly Timeline Infographic Template for PowerPoint & Google Slides
Timeline
8 Circle Venn Diagram Infographic Design Template for PowerPoint & Google Slides
Circular
Quarterly Roadmap Timeline Infographic Template for PowerPoint & Google Slides
Timeline
Four-Step Content Audit Infographic Template for PowerPoint & Google Slides
Process
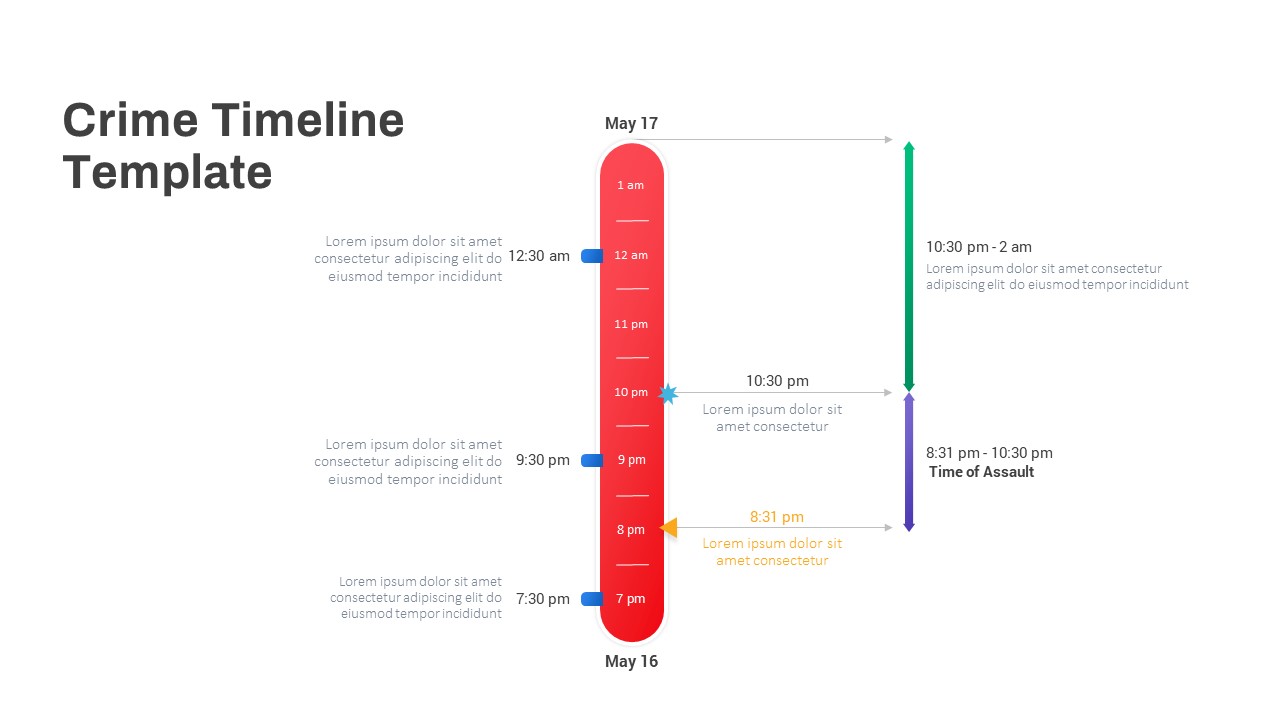
Vertical Crime Timeline Infographic Template for PowerPoint & Google Slides
Timeline
Animated Water Drop Ripple Infographic Template for PowerPoint & Google Slides
Graphics
Six Colorful Gear Shapes Infographic Template for PowerPoint & Google Slides
Process
Free
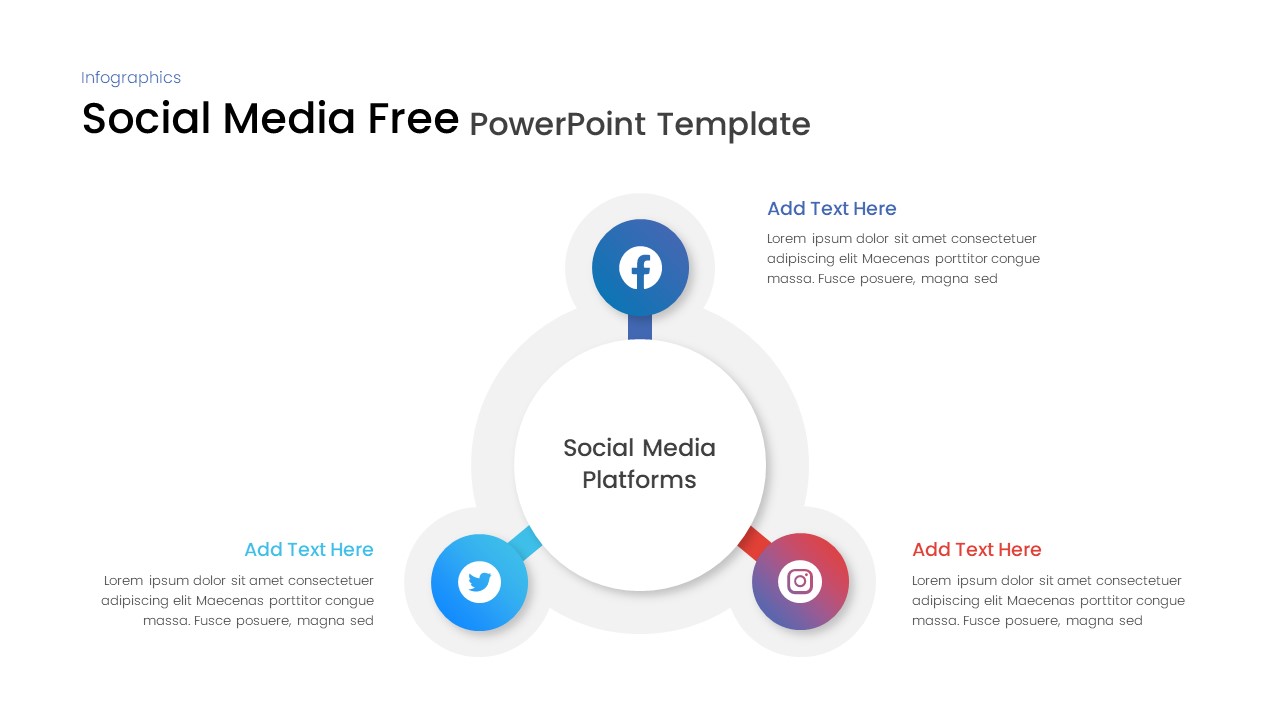
Free Social Media Hub-and-Spoke Infographic Template for PowerPoint & Google Slides
Circular
Free
Types of AI Comparison Infographic Template for PowerPoint & Google Slides
AI
Syria Regional Data Map Infographic Template for PowerPoint & Google Slides
World Maps
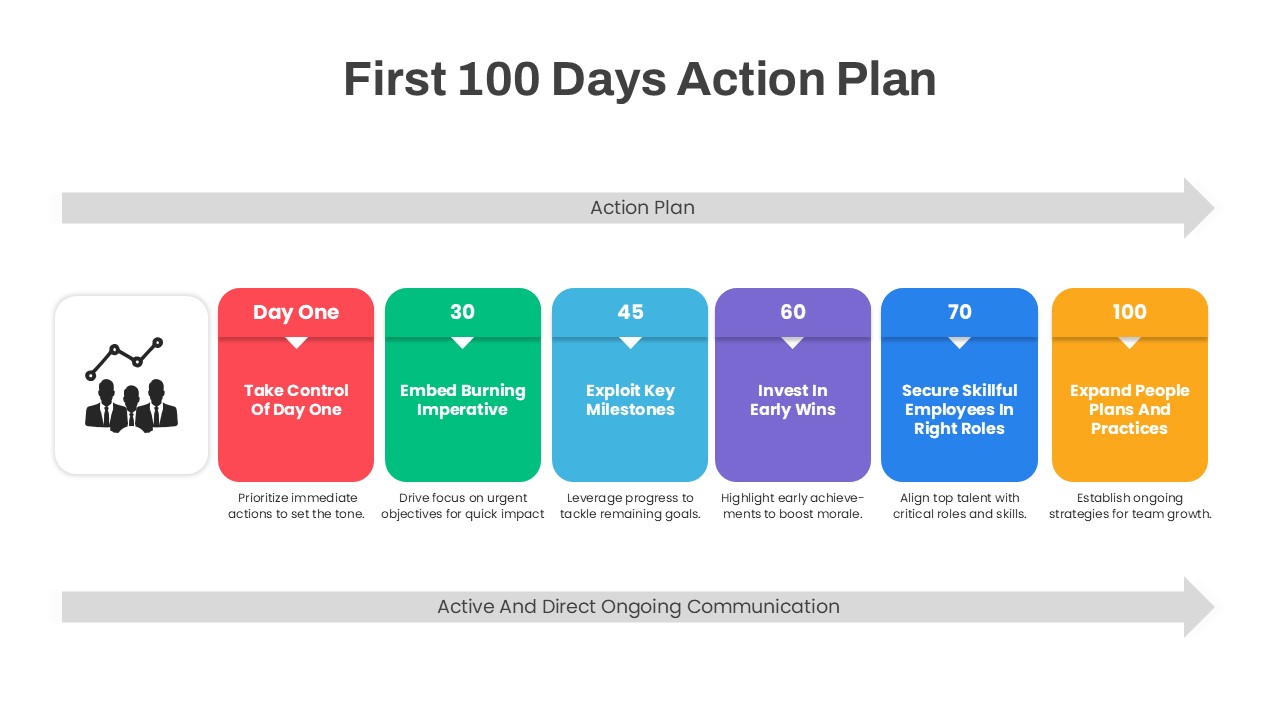
First 100 Days Action Plan Infographic Template for PowerPoint & Google Slides
Timeline
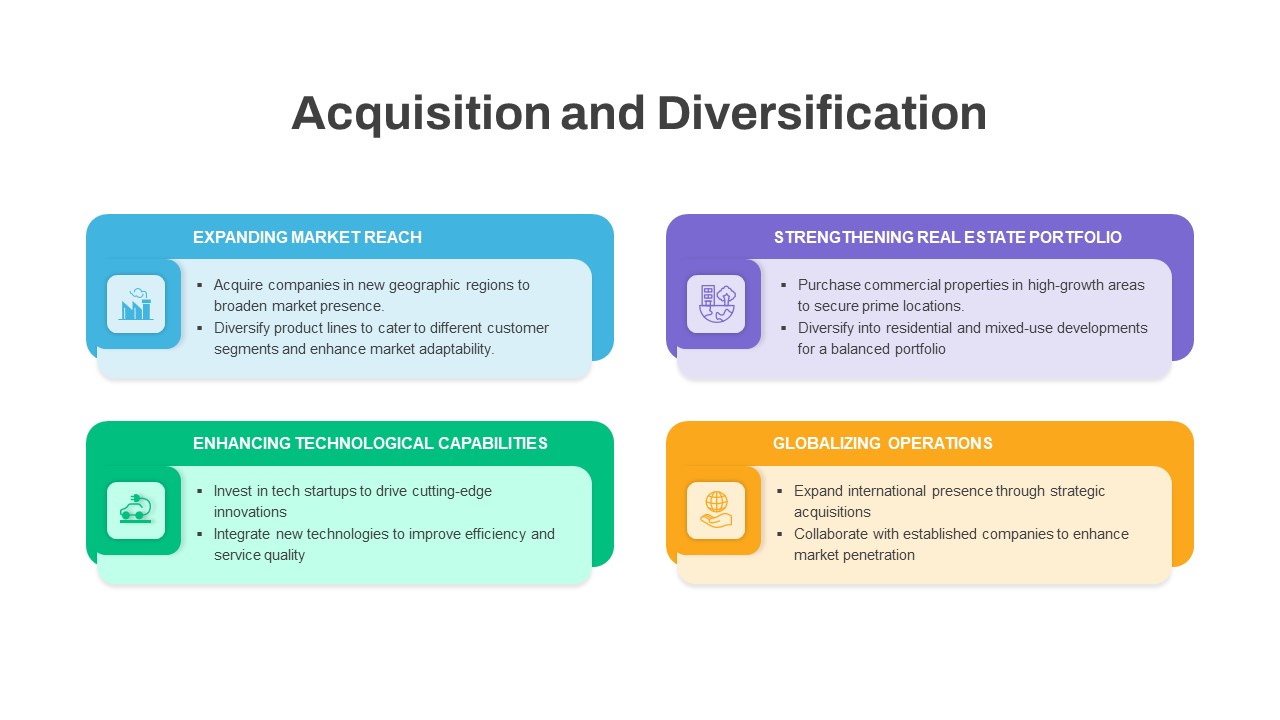
Acquisition & Diversification Infographic Template for PowerPoint & Google Slides
Business Plan
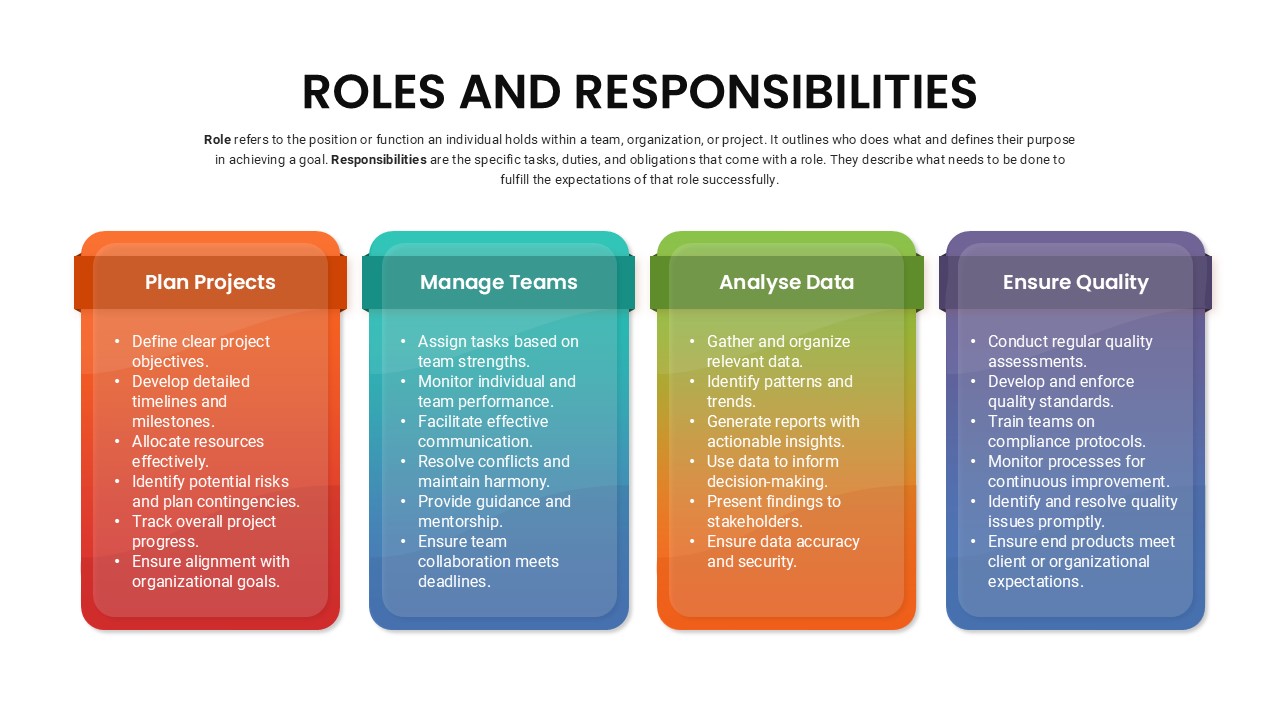
Roles and Responsibilities Infographic Template for PowerPoint & Google Slides
Our Team
Data-Driven AI in Insurance Infographic Template for PowerPoint & Google Slides
Circular
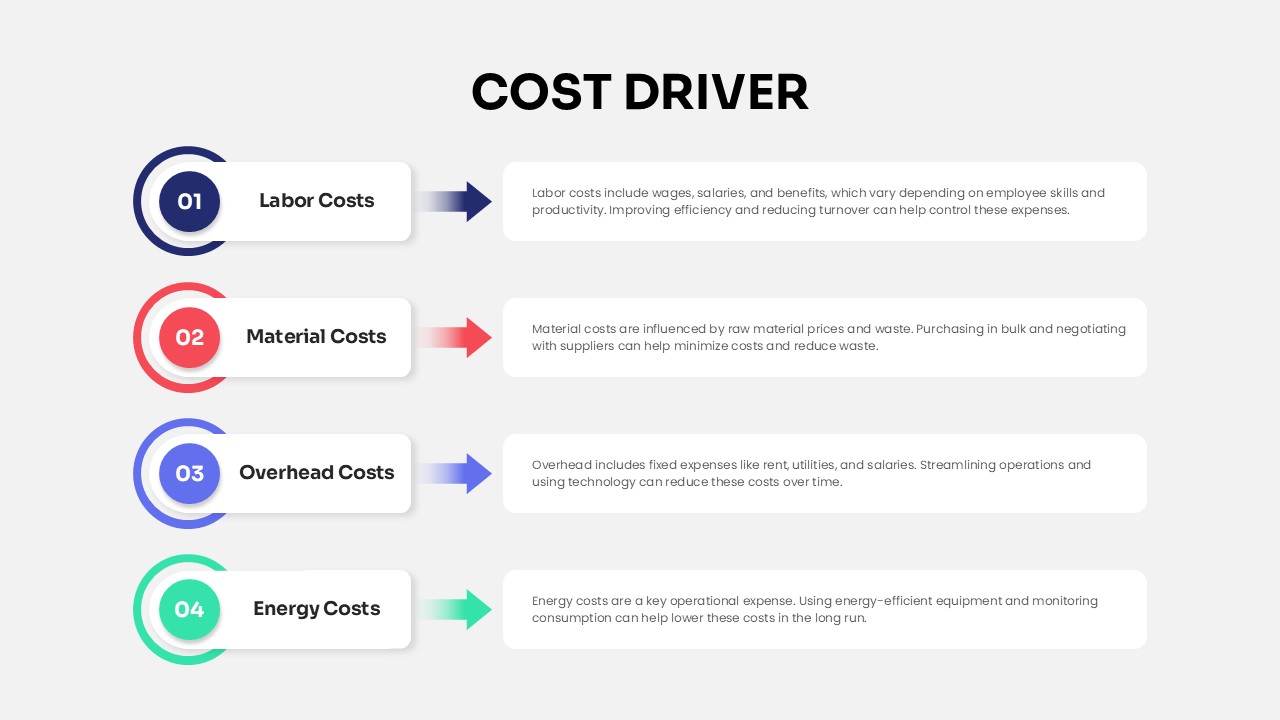
Cost Driver Infographic Slide Pack Template for PowerPoint & Google Slides
Process
Pros and Cons Infographic Slide Pack Template for PowerPoint & Google Slides
Comparison
Multimodal AI Modalities Infographic Template for PowerPoint & Google Slides
AI
Hierarchical Org Chart Infographic Template for PowerPoint & Google Slides
Org Chart
SWOT Analysis Infographic with Circular Icons Template for PowerPoint & Google Slides
SWOT
Four Level Pyramid Infographic Template for PowerPoint & Google Slides
Pyramid
Three Segment Donut Chart KPI Infographic Template for PowerPoint & Google Slides
Pie/Donut
Sales Pitch Roadmap Infographic Template for PowerPoint & Google Slides
Marketing