Box SWOT Analysis Infographic Template for PowerPoint & Google Slides
Description
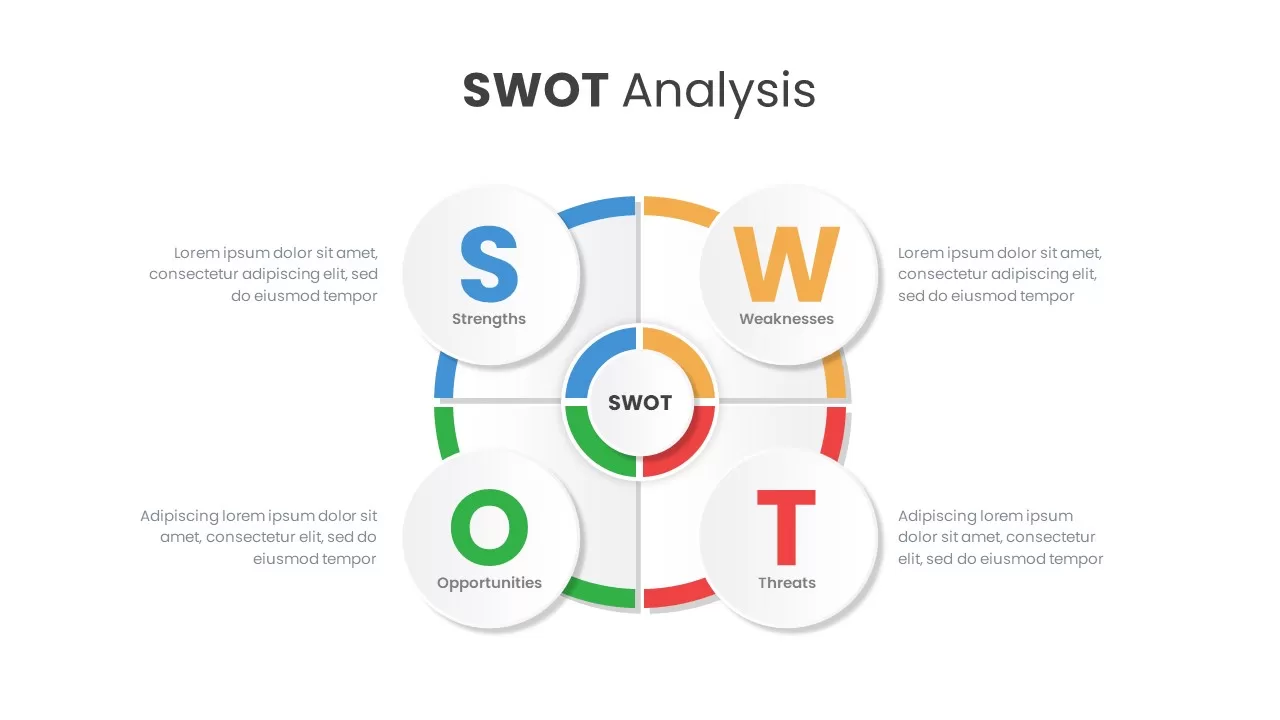
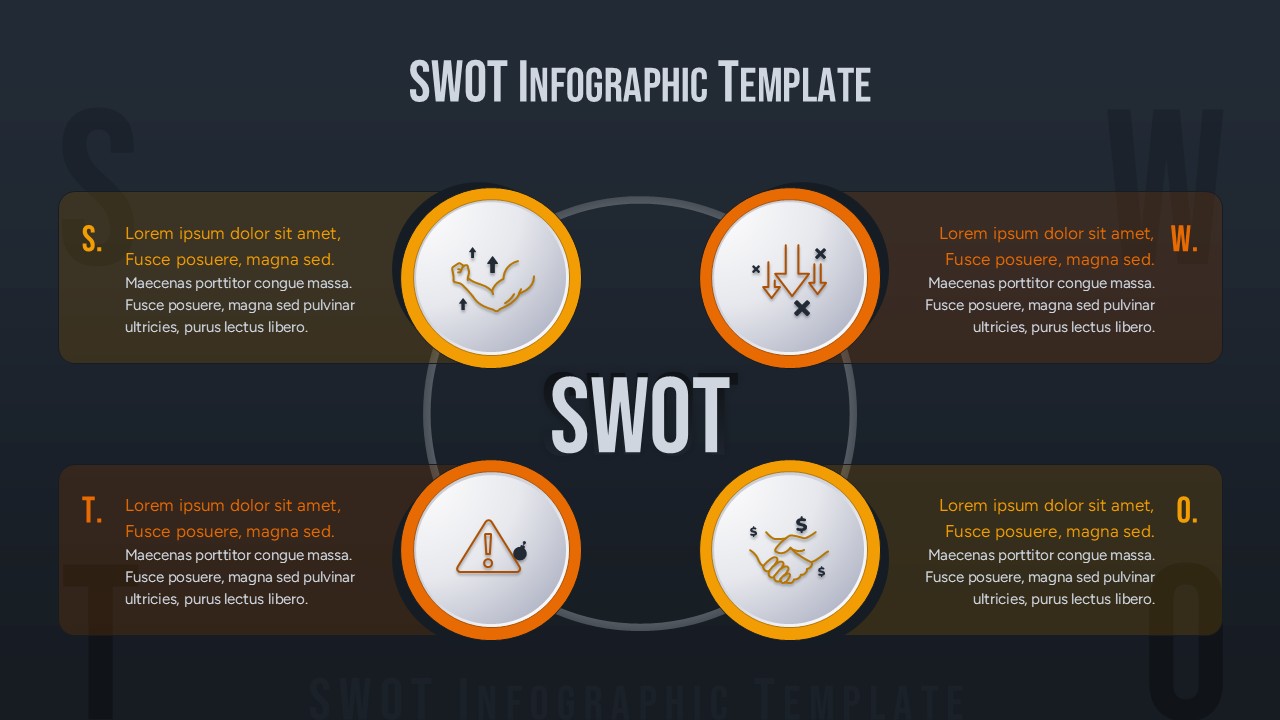
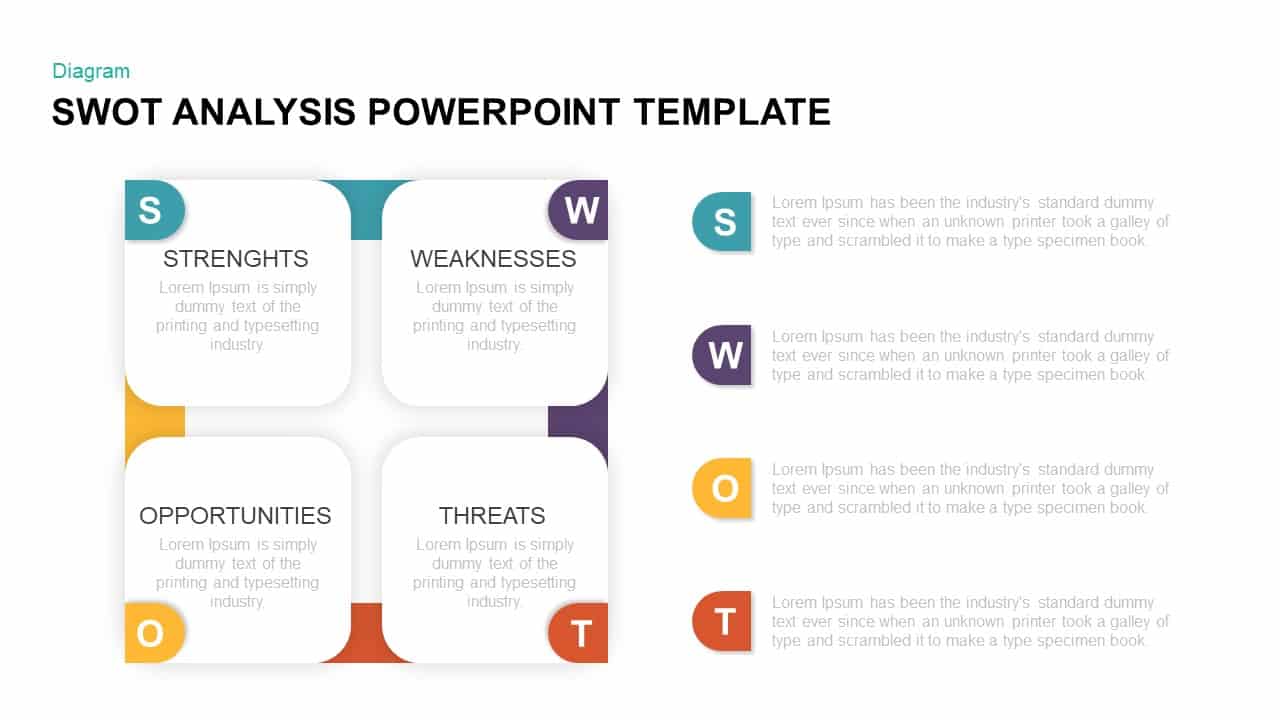
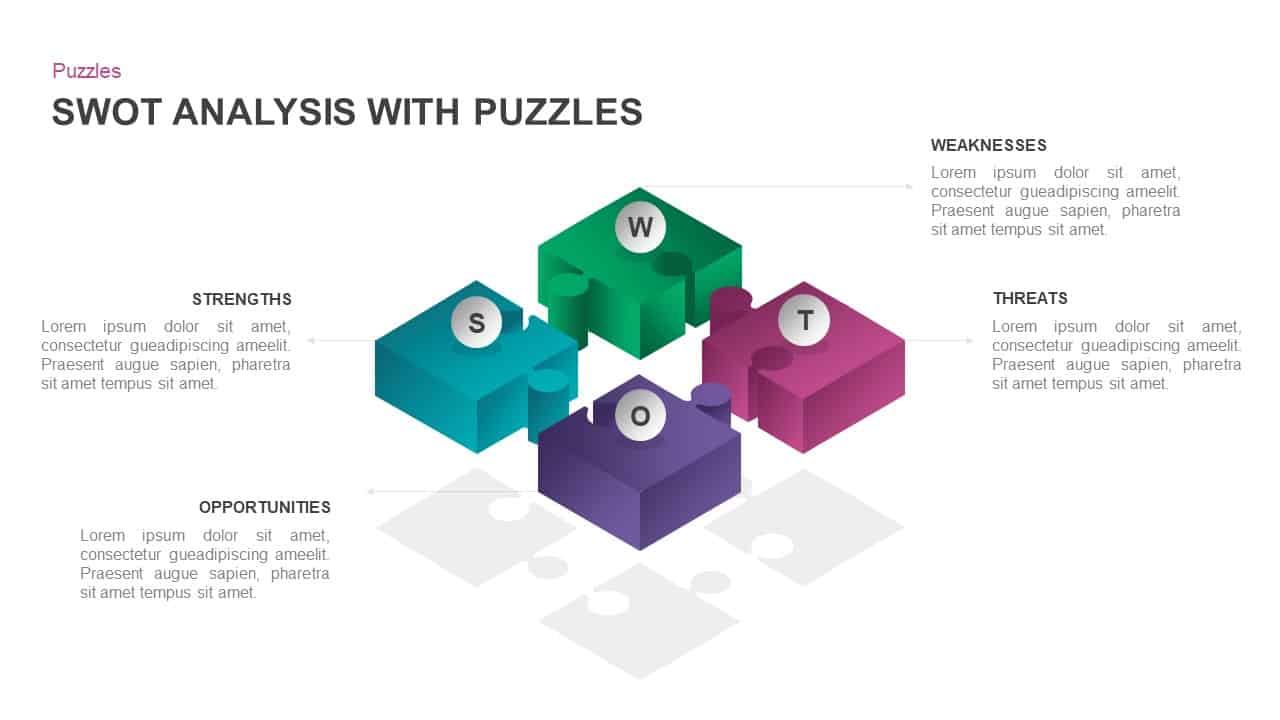
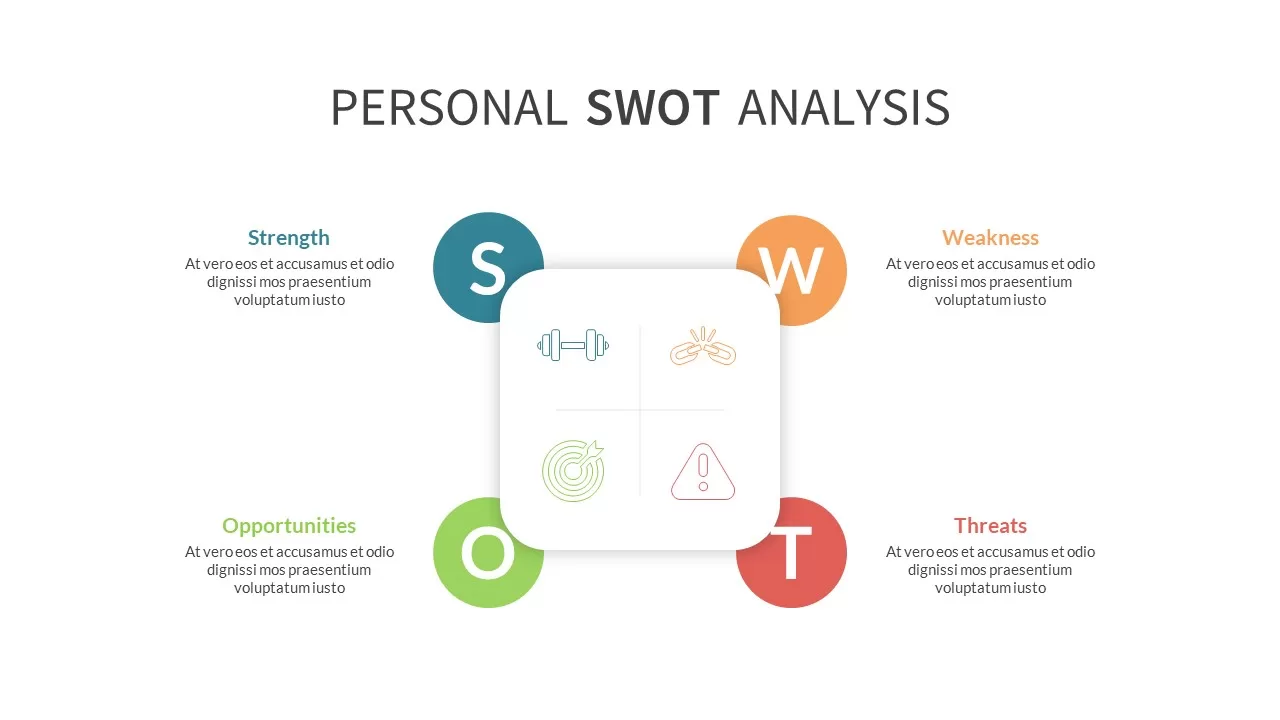
Leverage this dark-themed box SWOT analysis slide to present strengths, weaknesses, opportunities, and threats with clarity and impact. A clean black background sets a dramatic tone, while four editable vector boxes—outlined in green for strengths, blue for weaknesses, orange for opportunities, and red for threats—provide structured containers for bulleted insights. Large initial letters (S, W, O, T) behind each box reinforce quadrant labels, and crisp white text ensures readability against the dark backdrop. Subtle semi-transparent gradient arrows on the slide margins suggest interactive carousel navigation or sequential storytelling, guiding audiences through each SWOT element in turn.
Built on fully editable master layouts, the slide enables rapid customization: modify box border colors to match your brand palette, adjust text placeholders to reflect specific analysis points, or resize container shapes without quality loss. Vector assets scale seamlessly across devices, ensuring pixel-perfect clarity on both PowerPoint and Google Slides. Consistent alignment and balanced white space maintain focus on core content, while minimalist typography and accent colors deliver a professional, modern aesthetic.
Ideal for strategic planning sessions, competitive analysis reports, or stakeholder presentations, this box SWOT template streamlines the communication of critical business insights. Use the structured quadrants to lead discussions on market opportunities, project risks, or organizational strengths, and adapt the layout to accommodate additional data points or visual icons. Duplicate the slide or engage team members in collaborative editing to refine your analysis in real time. With master slide support, you can maintain cohesive branding, enforce style guidelines, and minimize formatting issues across your entire deck.
Who is it for
Business strategists, consultants, marketing managers, and project leaders will leverage this slide to facilitate SWOT exercises, competitive reviews, or risk assessments during board meetings, workshops, or investor pitches.
Other Uses
Repurpose this infographic for gap analyses, risk-reward comparisons, resource allocation discussions, or quarterly performance reviews. Swap icons and adjust colors to illustrate departmental assessments, project health checks, or training needs.
Login to download this file


