Bow-Tie Risk Assessment Diagram Template for PowerPoint & Google Slides
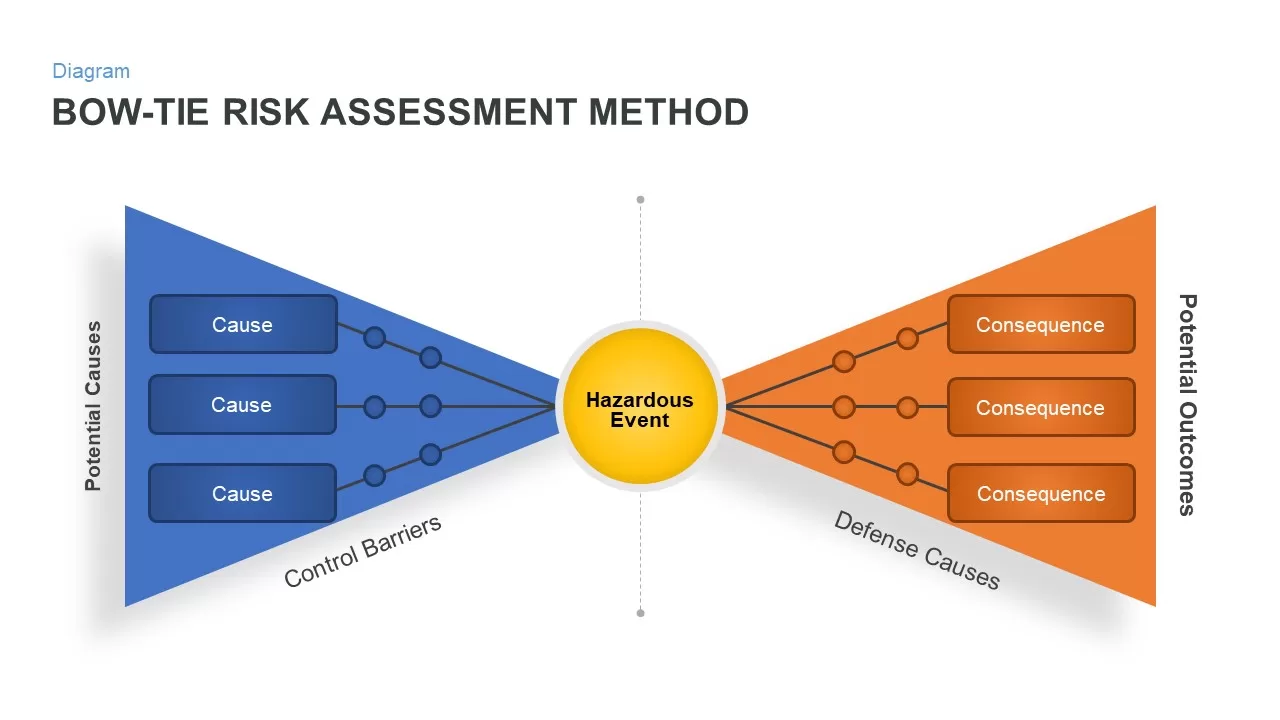


Description
Use this Bow-Tie Risk Assessment diagram to clearly visualize the relationship between potential causes, control barriers, a central hazardous event, defense measures, and resulting consequences. The slide features a left-hand blue funnel that identifies key causes leading to the hazard, a central highlighted yellow circle representing the hazardous event itself, and a right-hand orange funnel that maps out potential outcomes. Diagonal labels mark control and defense barriers, guiding audiences through the dual-funnel flow. Each cause and consequence is positioned within editable shapes connected by intuitive lines and dots, facilitating rapid customization and scenario analysis.
Designed with simplicity and clarity in mind, this fully editable asset uses master slides, placeholder text, and vector shapes to let you adjust colors, icons, and labels without altering the overall layout. Whether in PowerPoint or Google Slides, the high-resolution design ensures consistent rendering across devices and platforms. The balanced composition and minimalistic styling optimize focus on critical information, making it easier to convey risk management strategies and safety protocols.
Integrate this diagram into safety briefings, compliance workshops, or executive risk reviews to illustrate root cause analysis, barrier effectiveness testing, and incident prevention plans. Use the bow-tie structure to foster collaborative discussions, highlight control weaknesses, and align stakeholders around mitigation tactics. With intuitive graphics and clear visual hierarchy, this slide empowers you to present complex risk data in a digestible, professional format. Leverage built-in icons to annotate each cause and consequence, adjust barrier labels to reflect organizational protocols, and apply brand colors for seamless integration with your corporate identity. The slide supports layered editing, allowing you to isolate and animate individual elements for dynamic presentations and scenario walkthroughs.
Who is it for
Risk managers, safety engineers, compliance officers, HSE professionals, and project managers will benefit from this diagram when identifying hazards, evaluating barrier effectiveness, and planning mitigation strategies.
Other Uses
Beyond risk assessments, repurpose this slide for incident investigations, safety audits, barrier analysis, compliance training sessions, scenario planning workshops, process mapping, and root cause analysis exercises.
Login to download this file

Item ID
SB01877
Related Templates

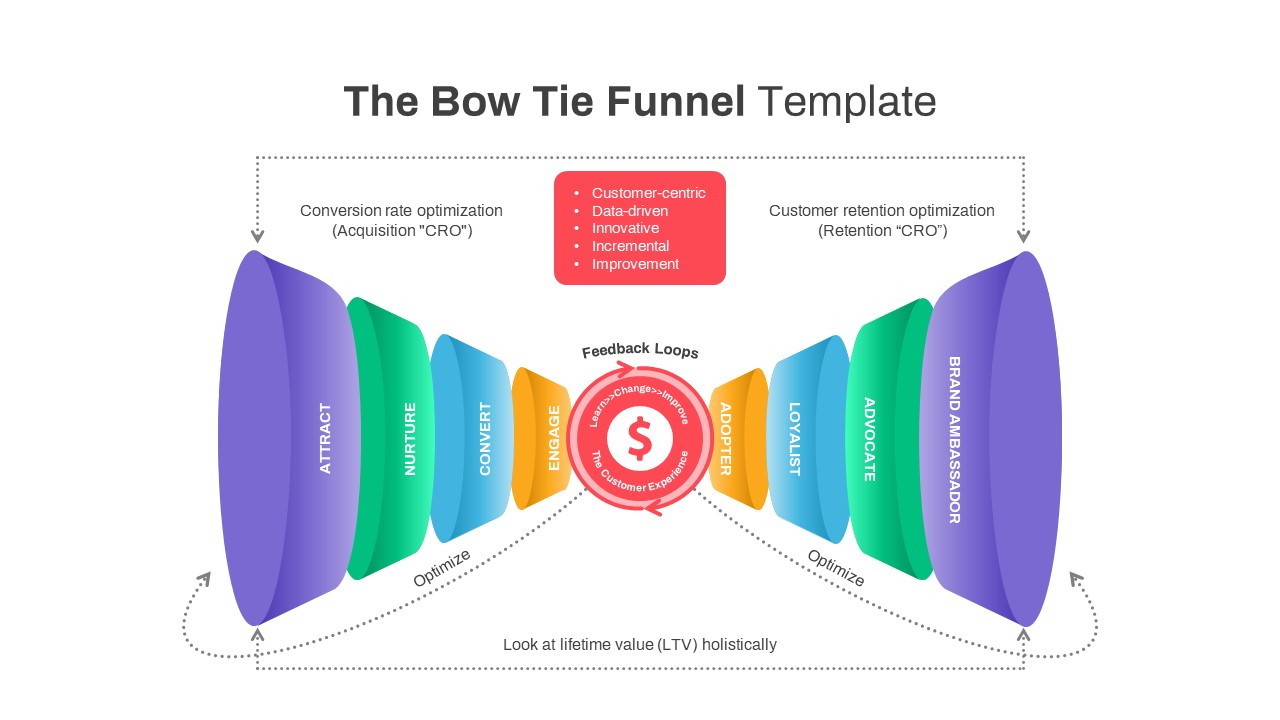
Bow Tie Customer Funnel Presentation Template for PowerPoint & Google Slides
Funnel
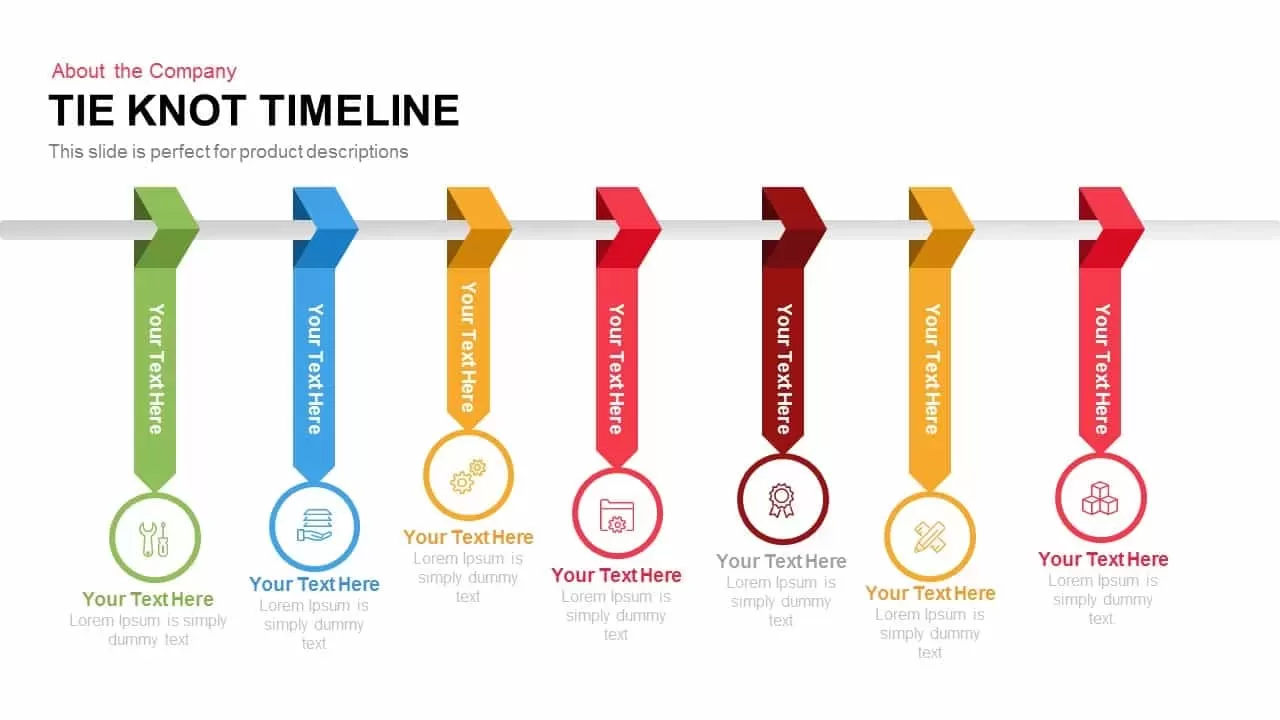
Tie Knot Timeline template for PowerPoint & Google Slides
Timeline
Bow and Arrow Goal Infographic Slide Template for PowerPoint & Google Slides
Goals
Heat Map Risk Assessment Presentation Template for PowerPoint & Google Slides
Risk Management
Risk Assessment Heatmap Matrix Slide Template for PowerPoint & Google Slides
Comparison Chart
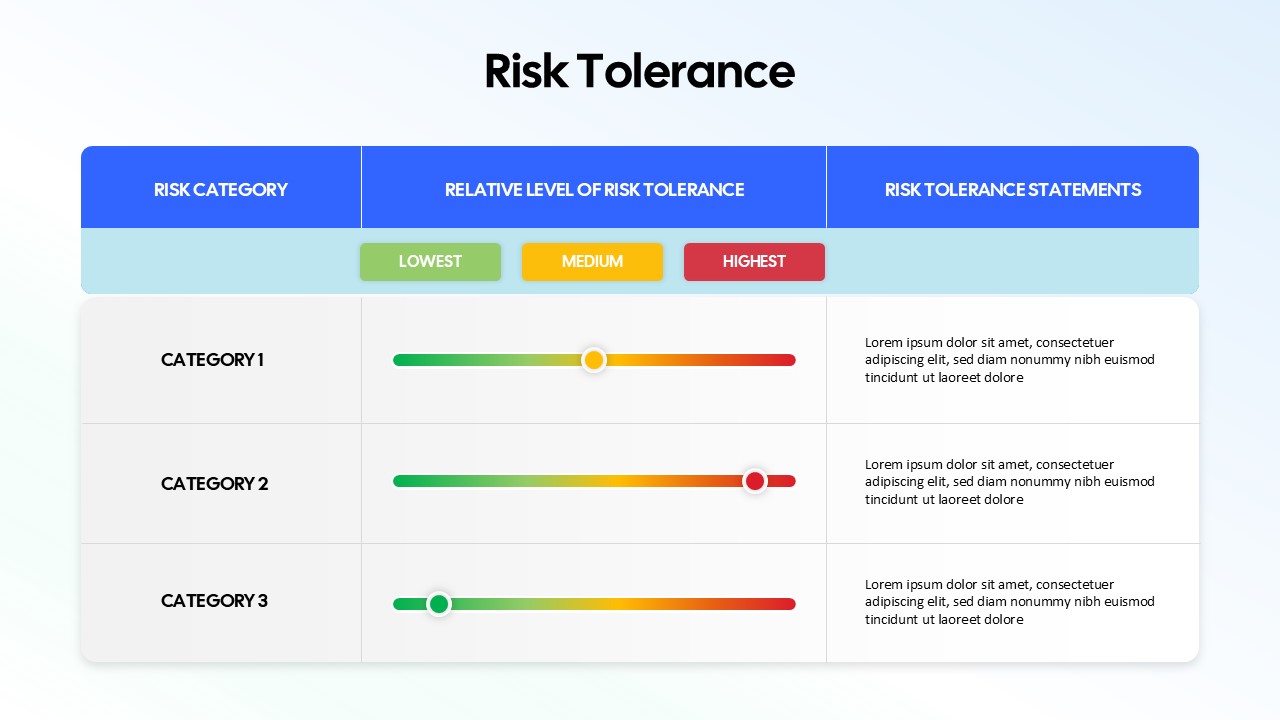
Risk Tolerance Assessment Sliders Template for PowerPoint & Google Slides
Finance
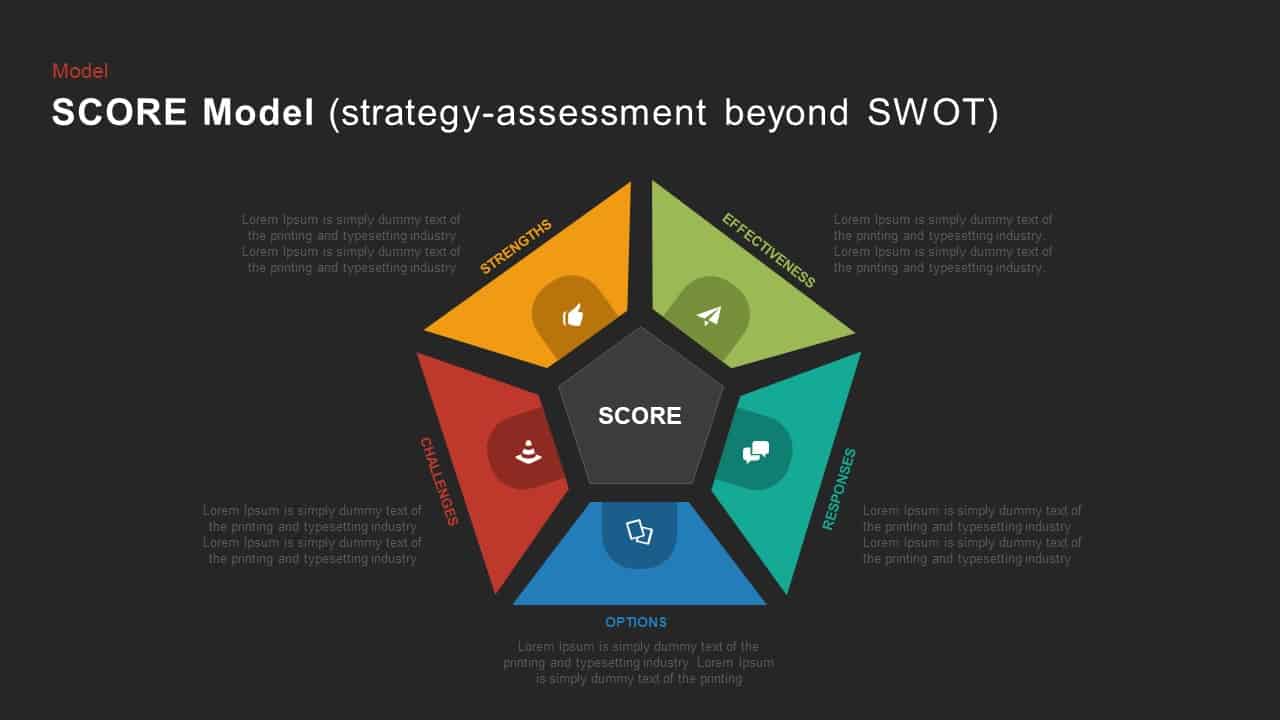
SCORE Model Pentagon Assessment Diagram Template for PowerPoint & Google Slides
Circular
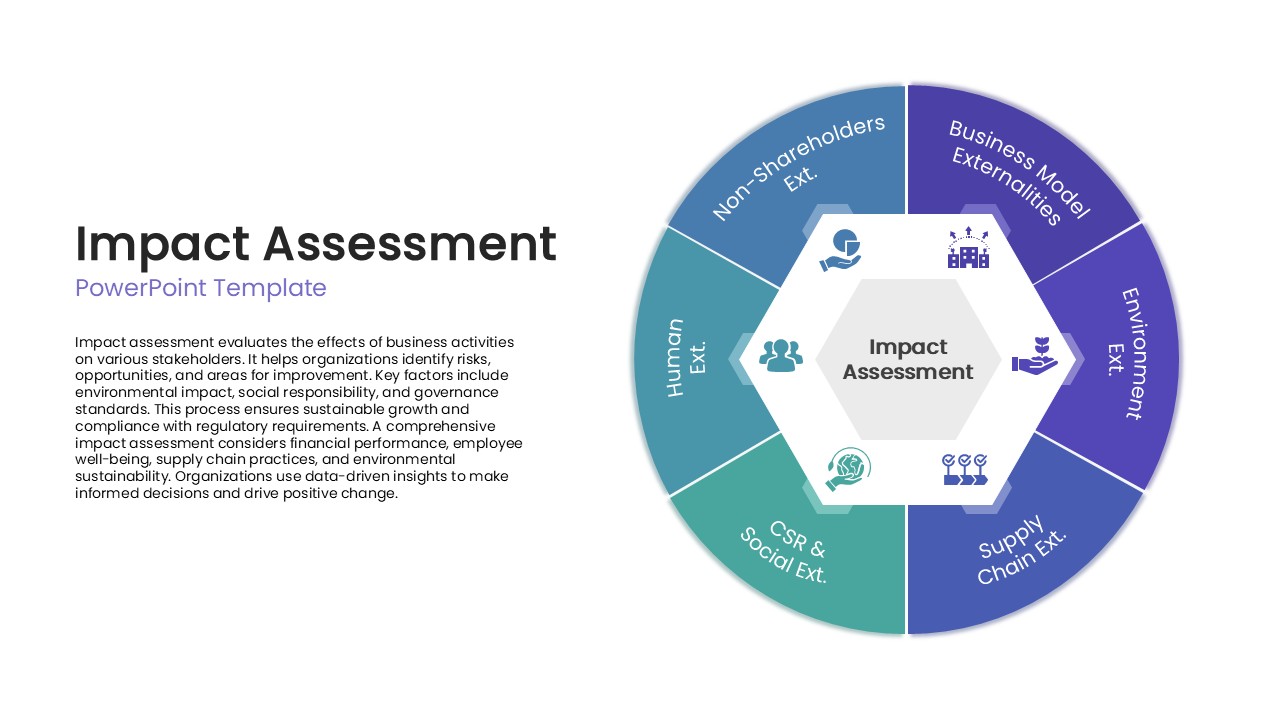
Impact Assessment Circular Diagram Template for PowerPoint & Google Slides
Circular
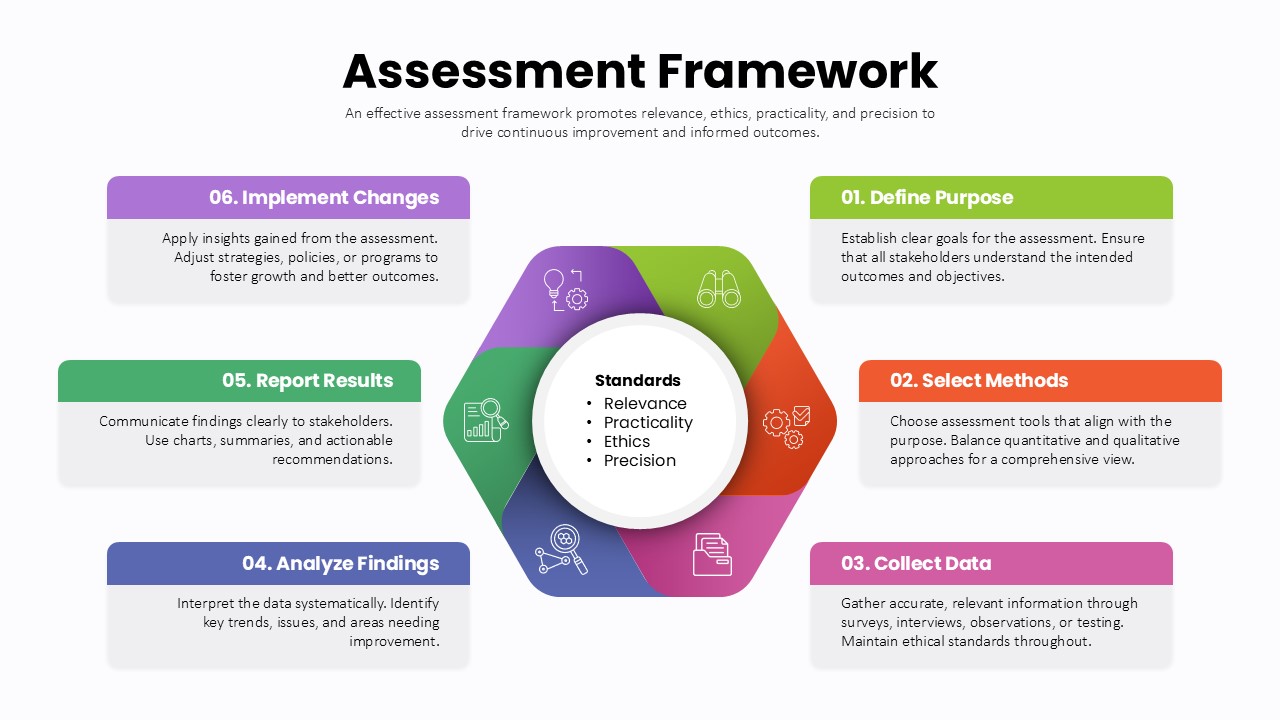
Assessment Framework Circular Diagram Template for PowerPoint & Google Slides
Circular
Materiality Assessment Matrix Diagram Template for PowerPoint & Google Slides
Risk Management
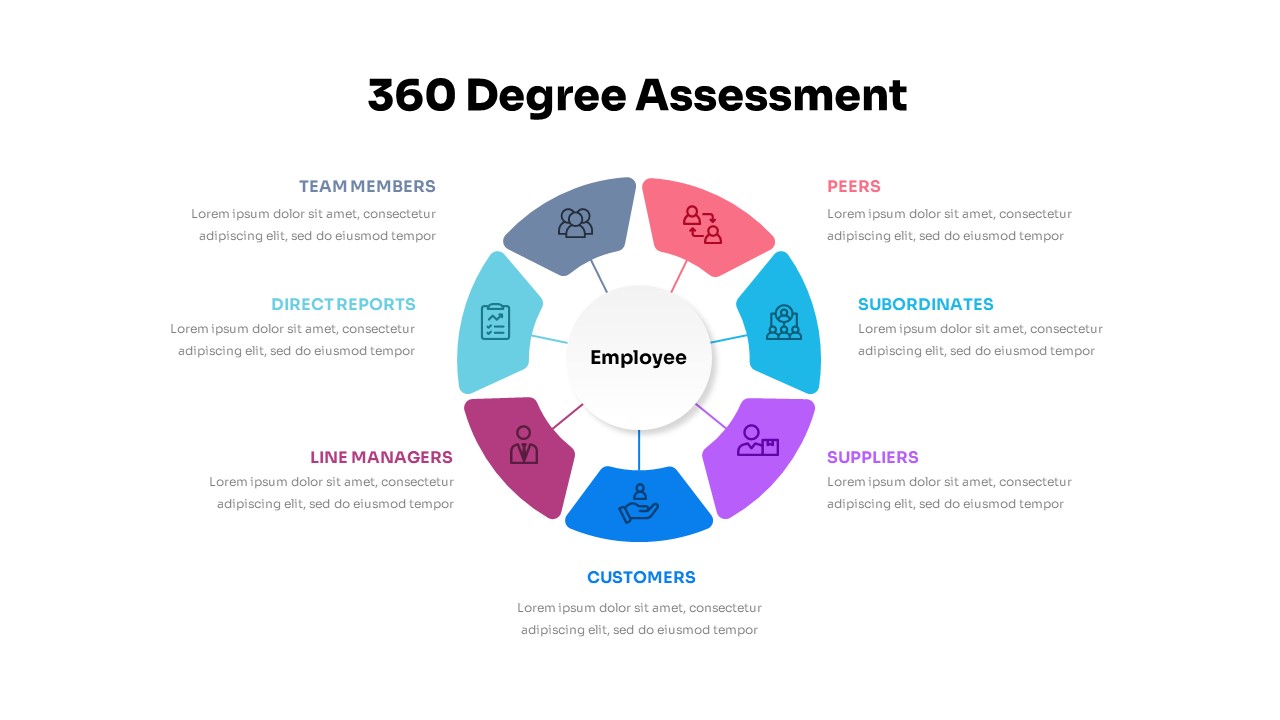
360 Degree Assessment Template for PowerPoint & Google Slides
Employee Performance
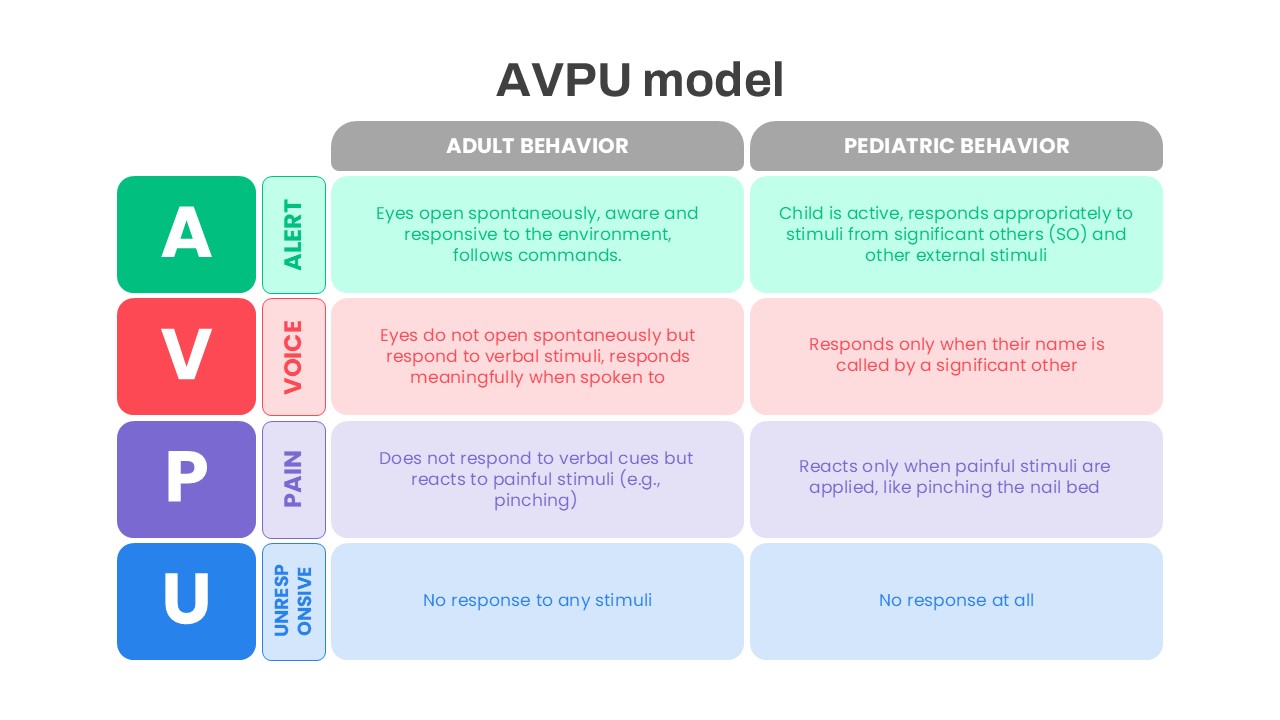
AVPU Model Behavior Assessment Template for PowerPoint & Google Slides
Health
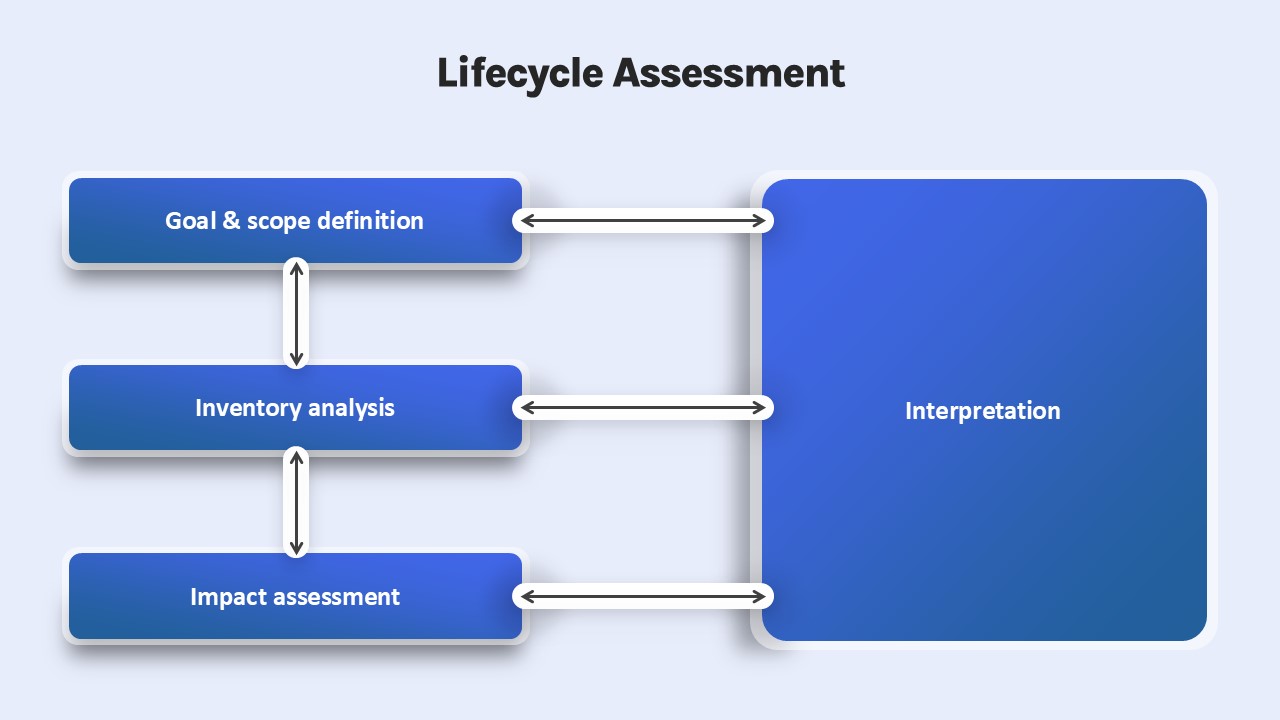
Lifecycle Assessment template for PowerPoint & Google Slides
Process
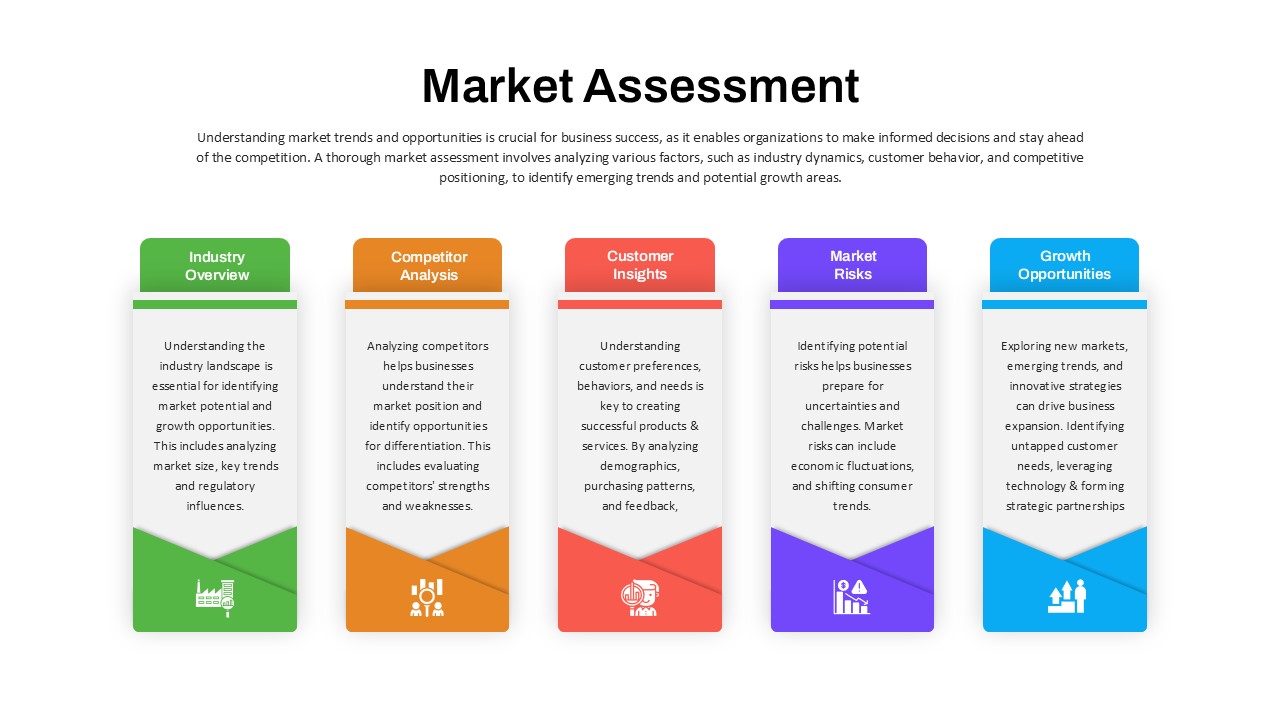
Market Assessment Infographic Slide Template for PowerPoint & Google Slides
Process
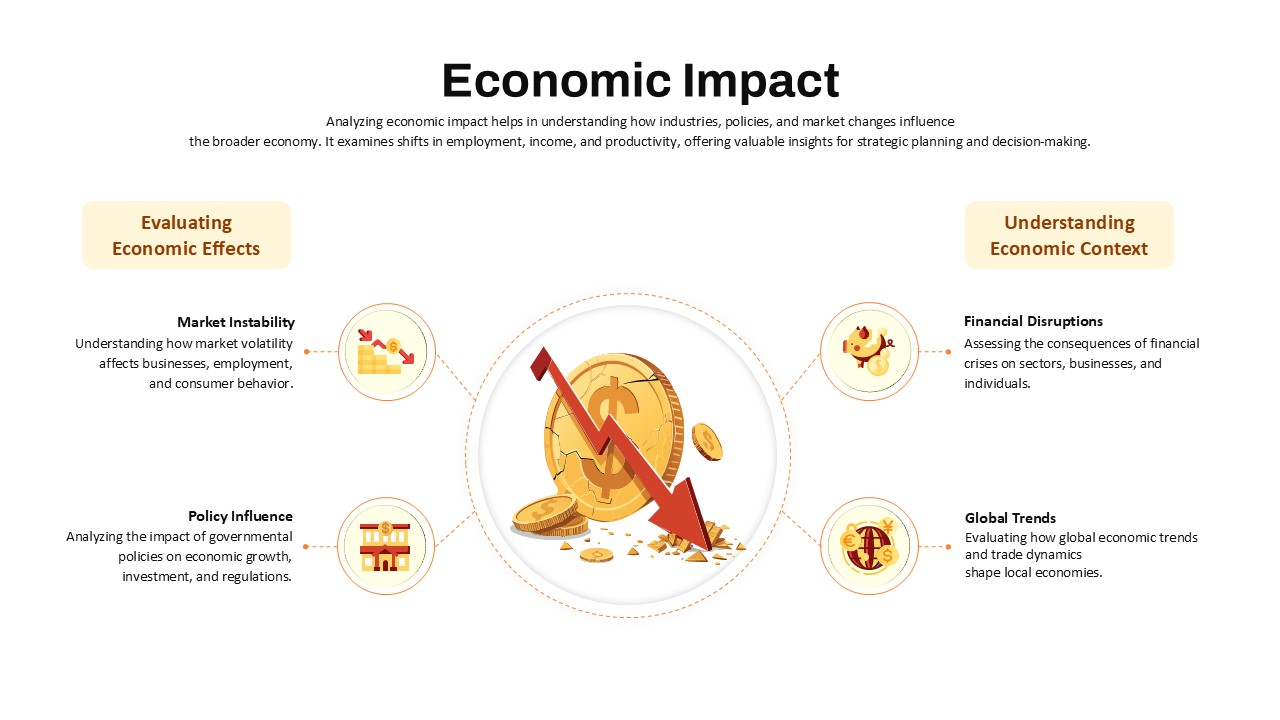
Economic Impact Assessment template for PowerPoint & Google Slides
Business Report
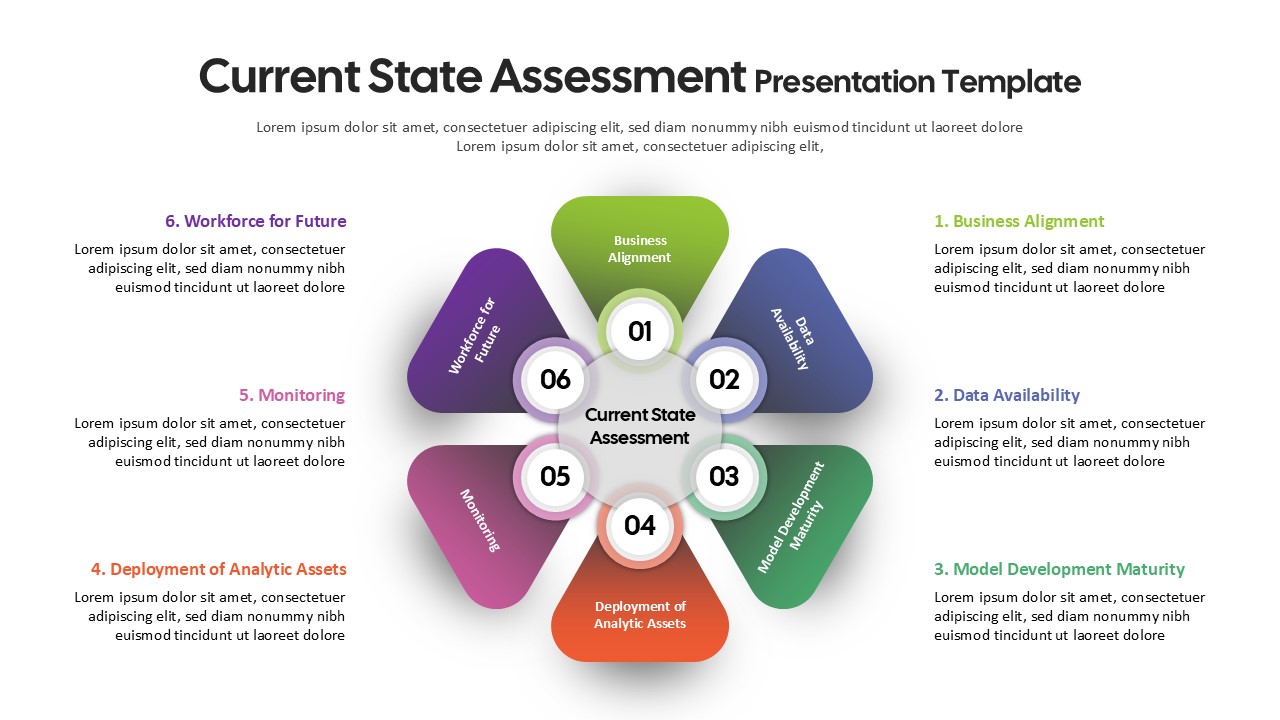
Current State Assessment Template for PowerPoint & Google Slides
Gap
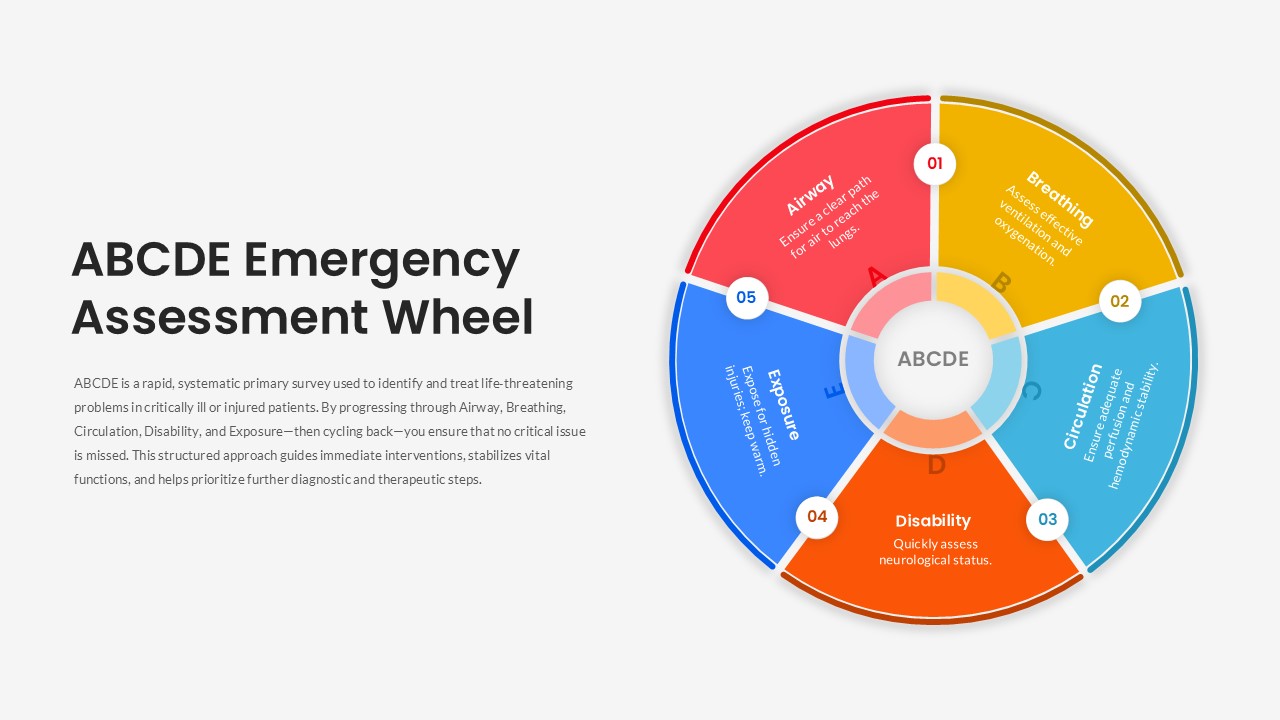
ABCDE Emergency Assessment Wheel Template for PowerPoint & Google Slides
Circular
IT Gap Analysis Assessment Matrix Template for PowerPoint & Google Slides
Information Technology
Risk Management Mind Map Radial Diagram template for PowerPoint & Google Slides
Mind Maps
Marketing Risk Management Gear Diagram Template for PowerPoint & Google Slides
Risk Management
Risk Management Heat Map Diagram Template for PowerPoint & Google Slides
Comparison Chart

Enterprise Risk Management Cycle Diagram Template for PowerPoint & Google Slides
Process
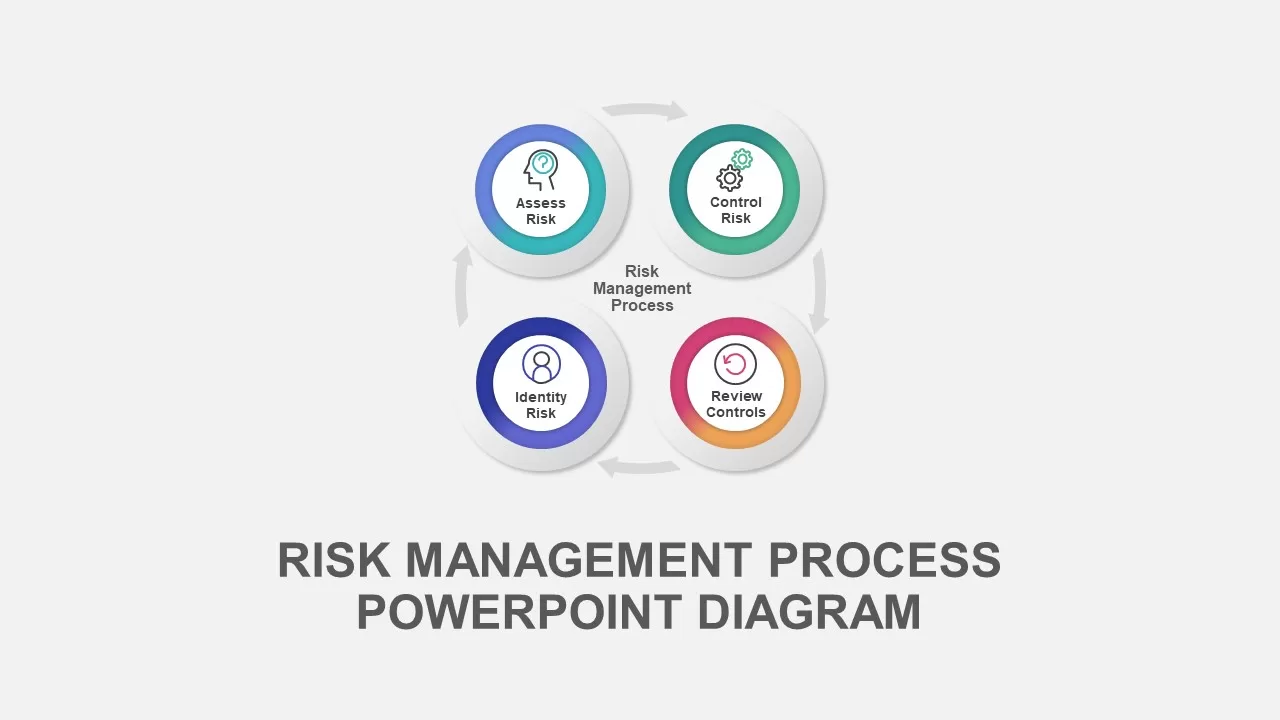
Risk Management Process Diagram Template for PowerPoint & Google Slides
Risk Management
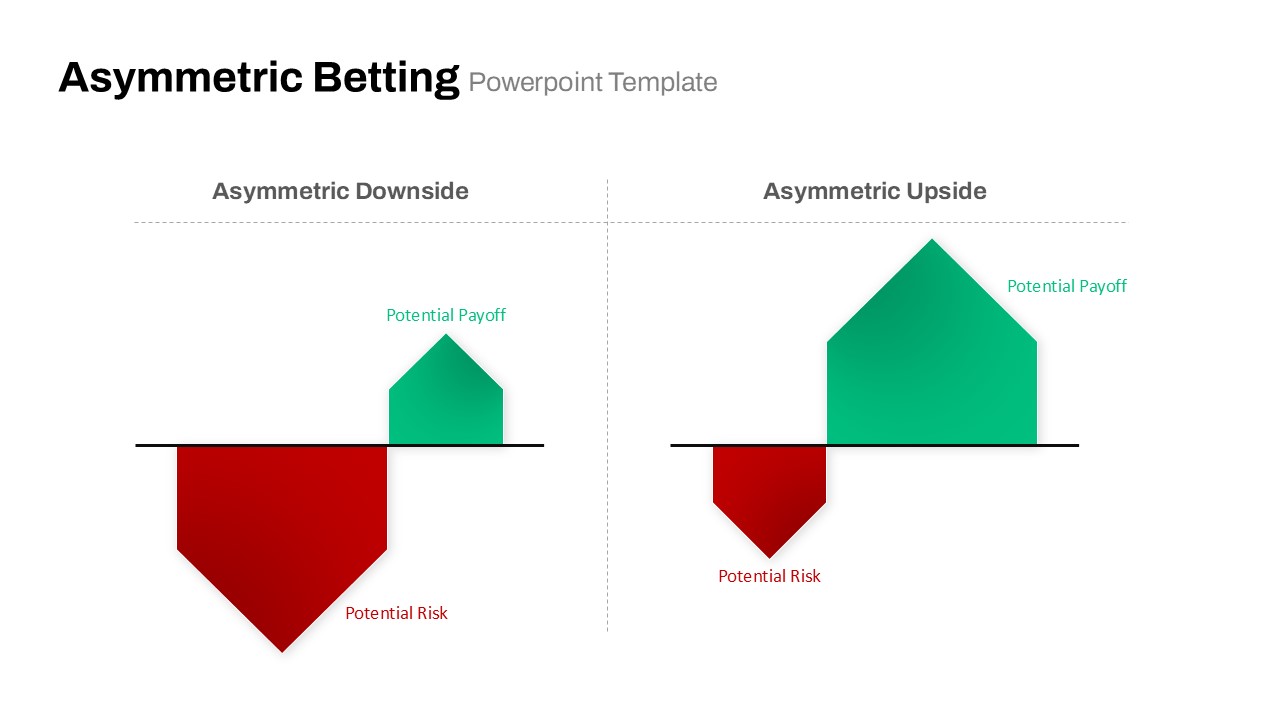
Asymmetric Betting Payoff Risk Diagram Template for PowerPoint & Google Slides
Comparison
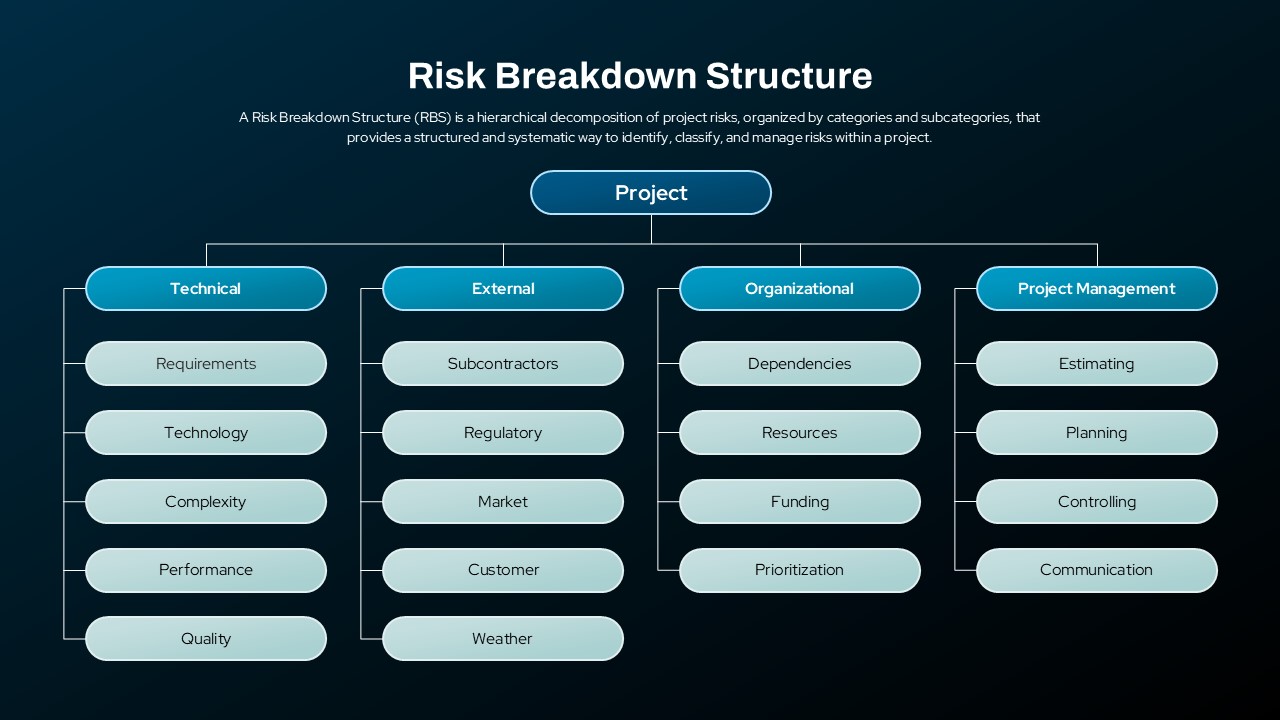
Risk Breakdown Structure Diagram Template for PowerPoint & Google Slides
Org Chart

Bold Diamond Risk Alert Visualization Template for PowerPoint & Google Slides
Risk Management
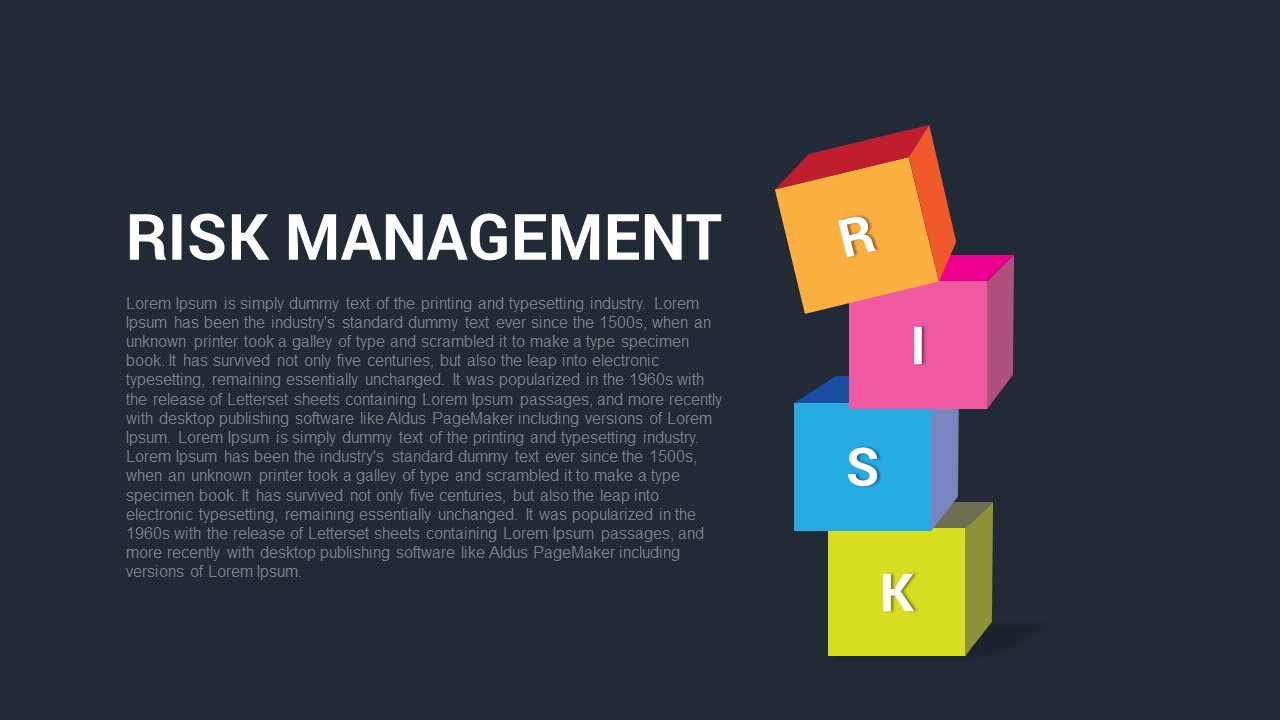
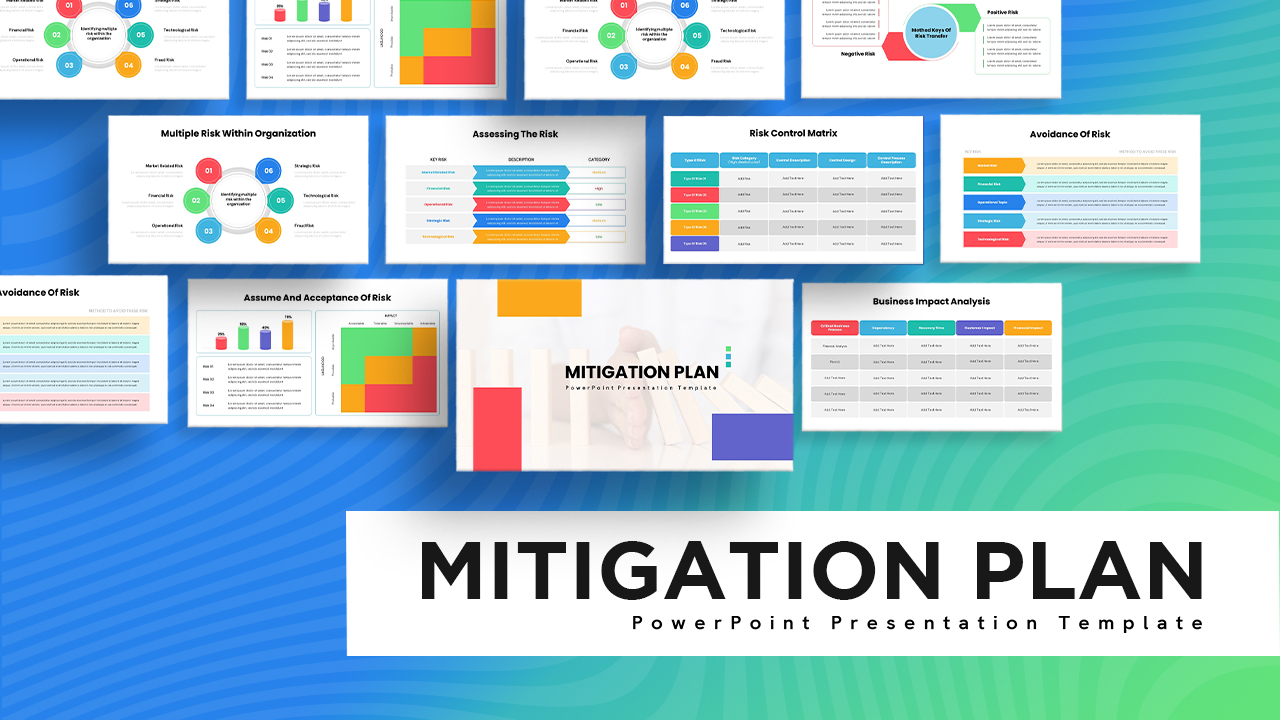
Risk Management Presentation Template for PowerPoint and Google Slides
Decks
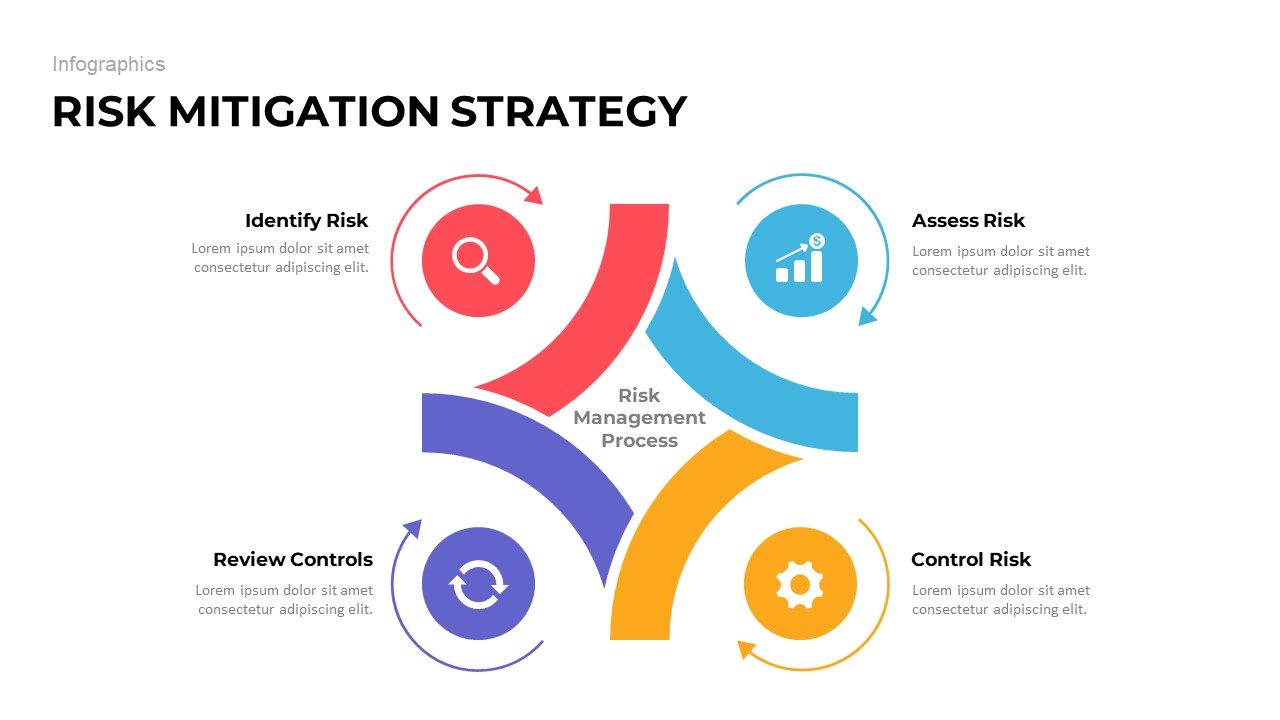
Risk Mitigation Strategy template for PowerPoint & Google Slides
Risk Management
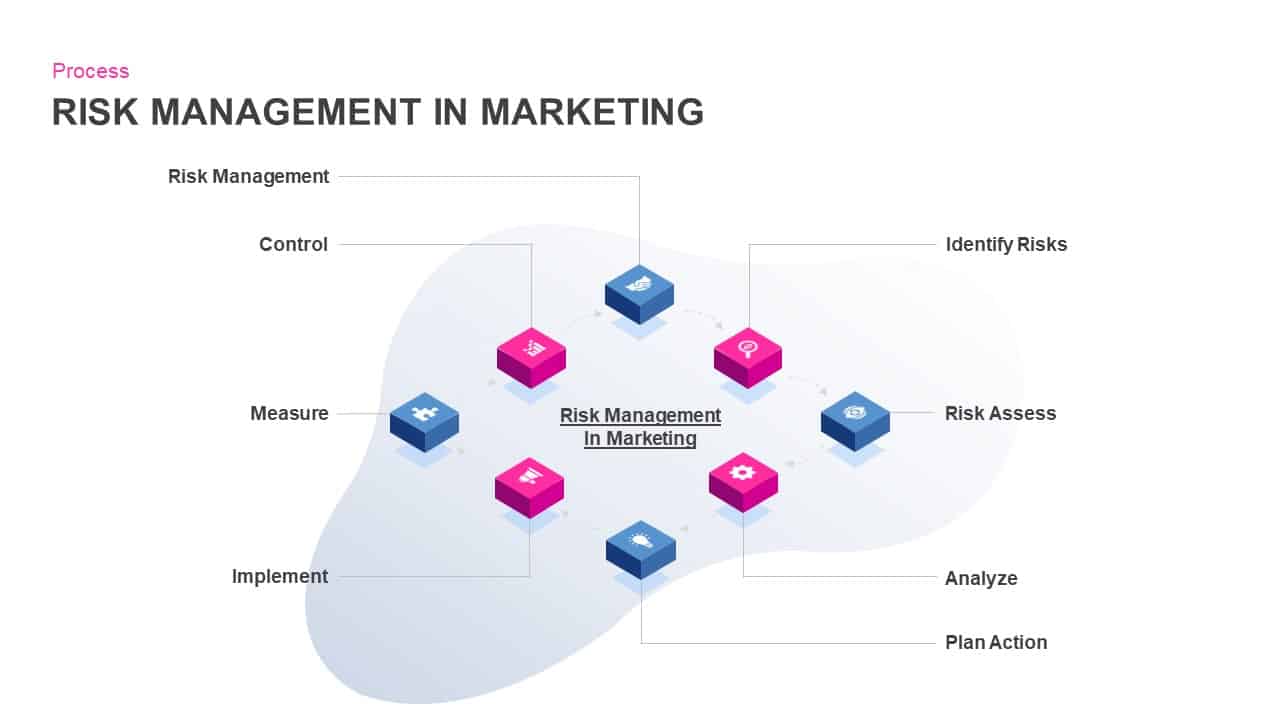
Risk Management in Marketing Process Template for PowerPoint & Google Slides
Risk Management
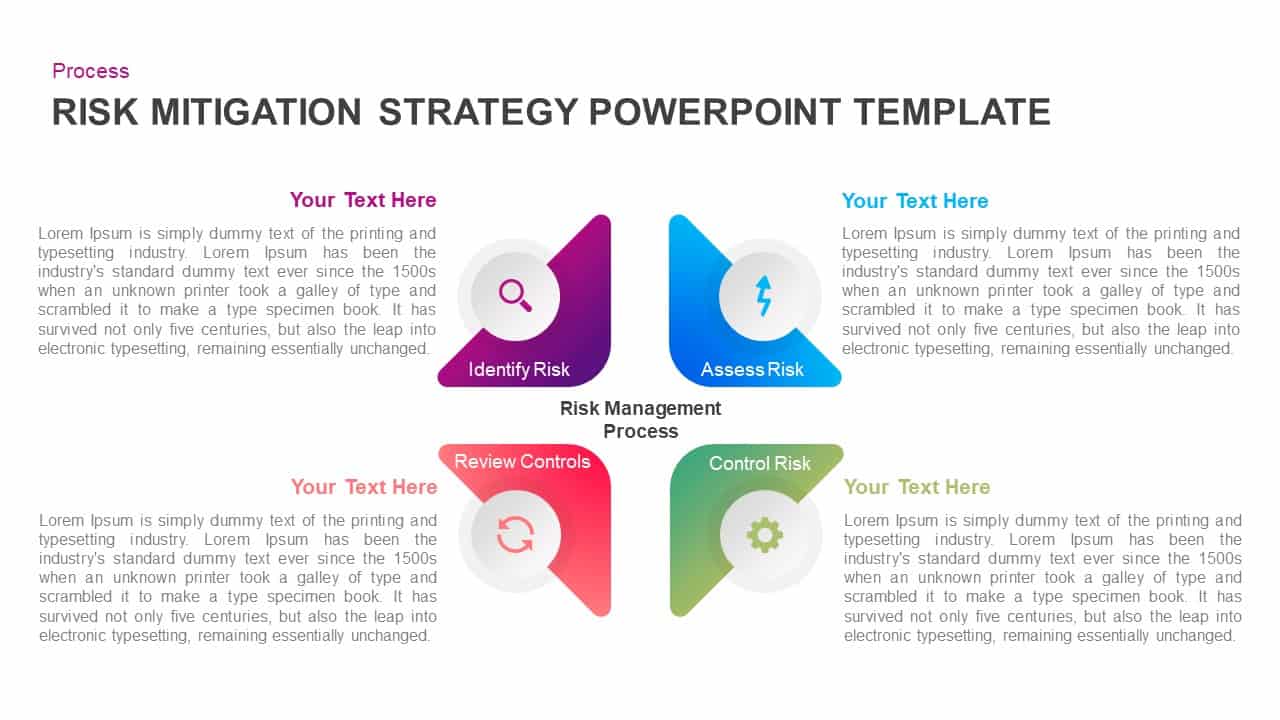
Four-Step Risk Mitigation Strategy Template for PowerPoint & Google Slides
Process
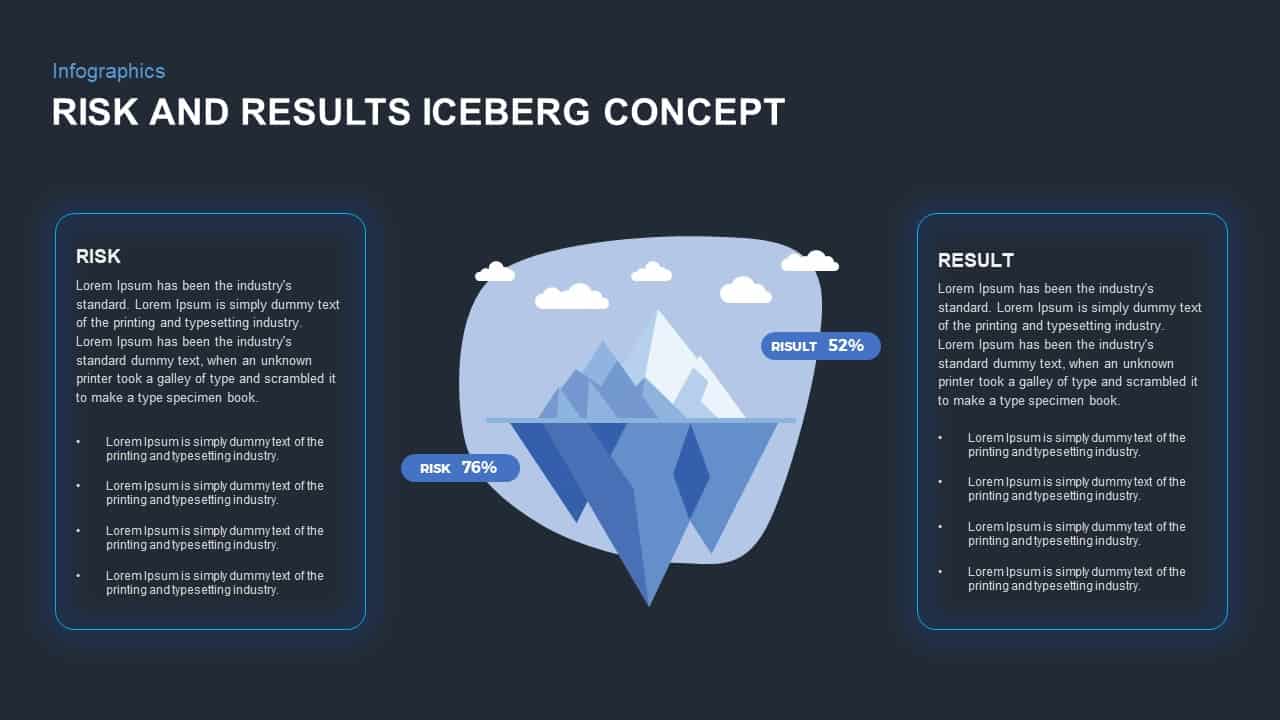
Risk and Results Iceberg Infographic Template for PowerPoint & Google Slides
Comparison
Comprehensive Risk Impact Analysis Template for PowerPoint & Google Slides
Risk Management
Professional Risk Heat Map Visualization Template for PowerPoint & Google Slides
Risk Management
Heat Map Risk Matrix Dashboard Template for PowerPoint & Google Slides
Comparison Chart
Risk Heatmap Comparison Template for PowerPoint & Google Slides
Maps
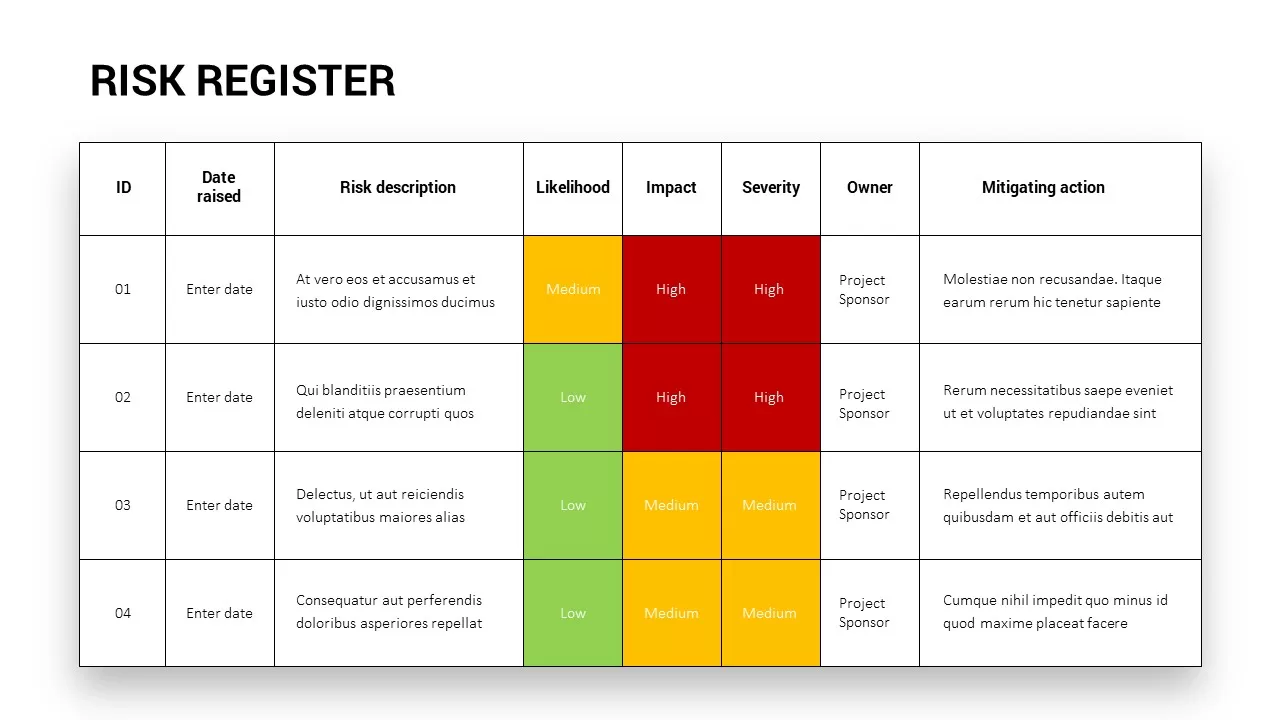
Comprehensive Risk Register Table Template for PowerPoint & Google Slides
Risk Management
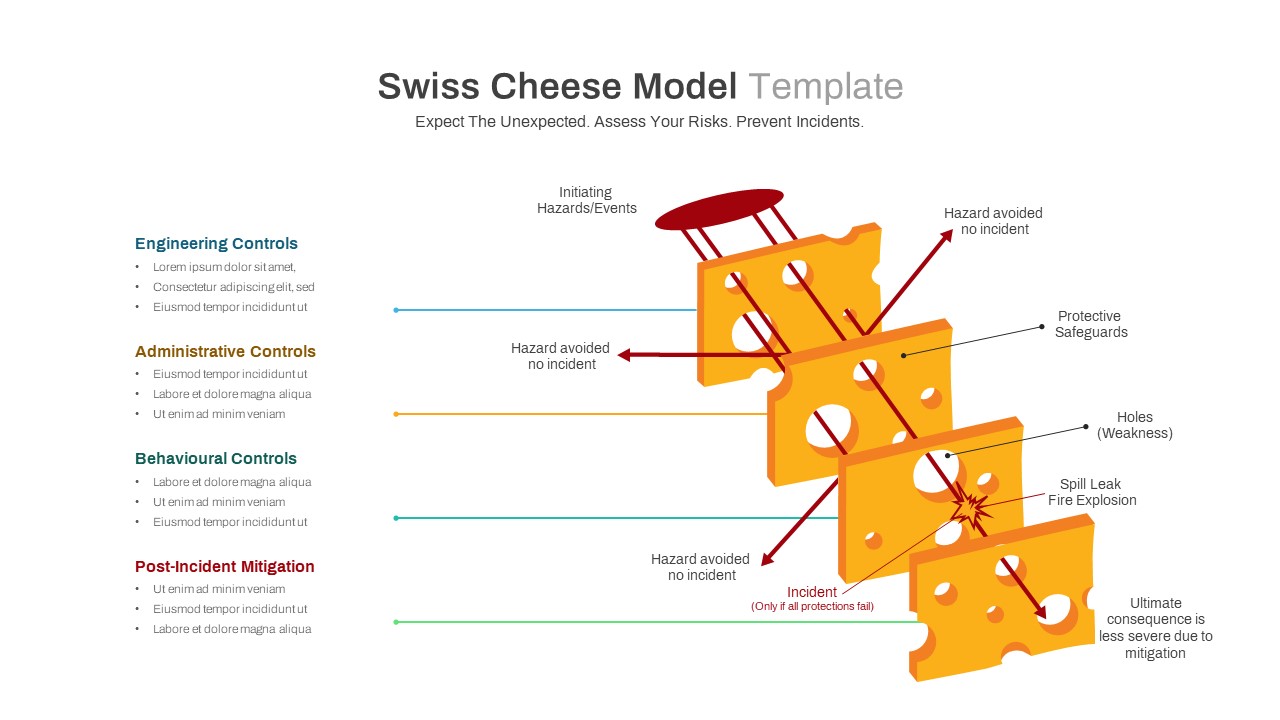
Swiss Cheese Risk Management Model Template for PowerPoint & Google Slides
Risk Management
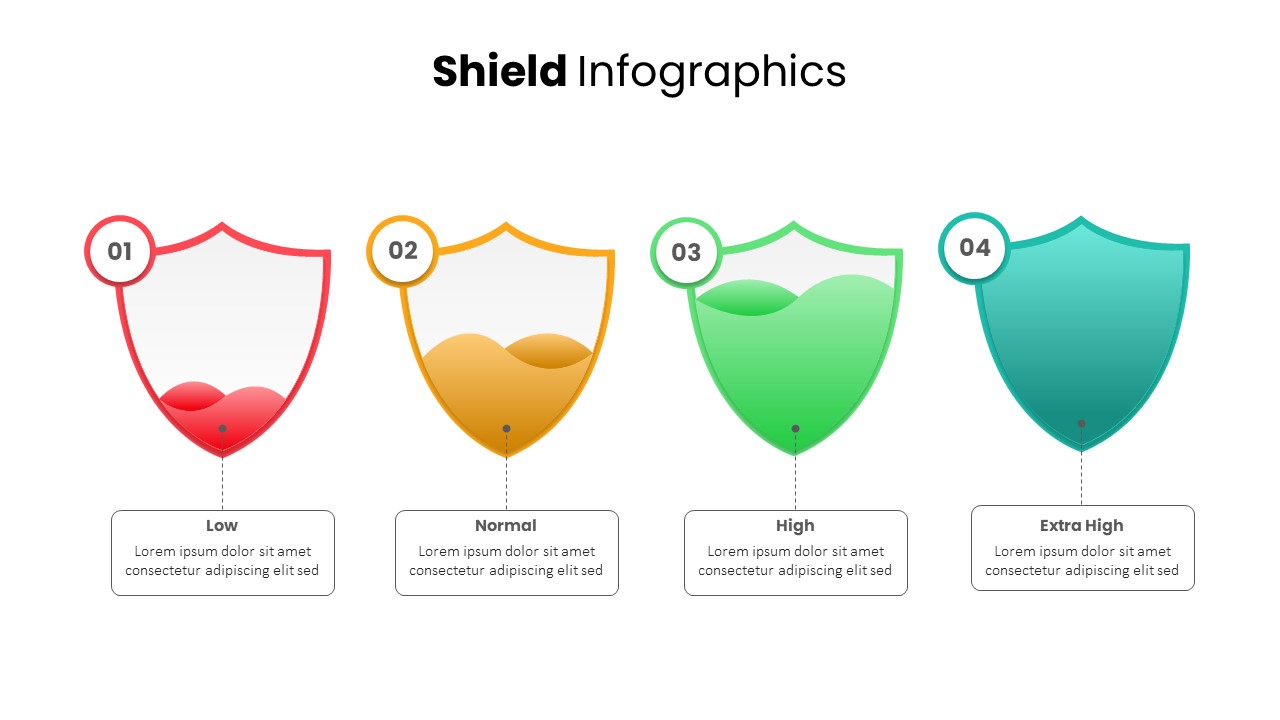
Shield Infographics Risk Indicators Template for PowerPoint & Google Slides
Infographics
Risk Pyramid Hierarchy Analysis Template for PowerPoint & Google Slides
Pyramid
Risk Mitigation Plan Deck Template for PowerPoint & Google Slides
Risk Management
Work Safety Training & Risk Management Template for PowerPoint & Google Slides
Risk Management
Risk Management Consulting Deck Template for PowerPoint & Google Slides
Risk Management
Risk Level Gauge Comparison Dashboard Template for PowerPoint & Google Slides
Comparison
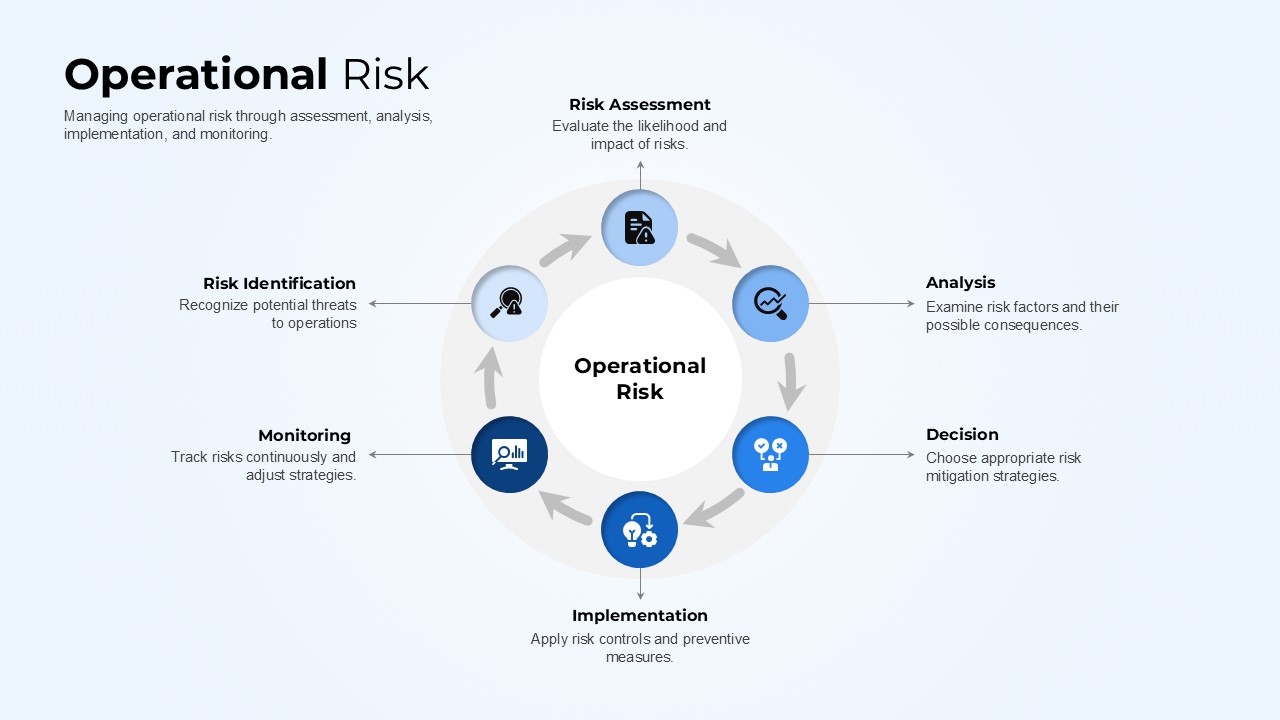
Operational Risk Template for PowerPoint & Google Slides
Risk Management
Risk Scoring & Ranking Heatmap Matrix Template for PowerPoint & Google Slides
Risk Management
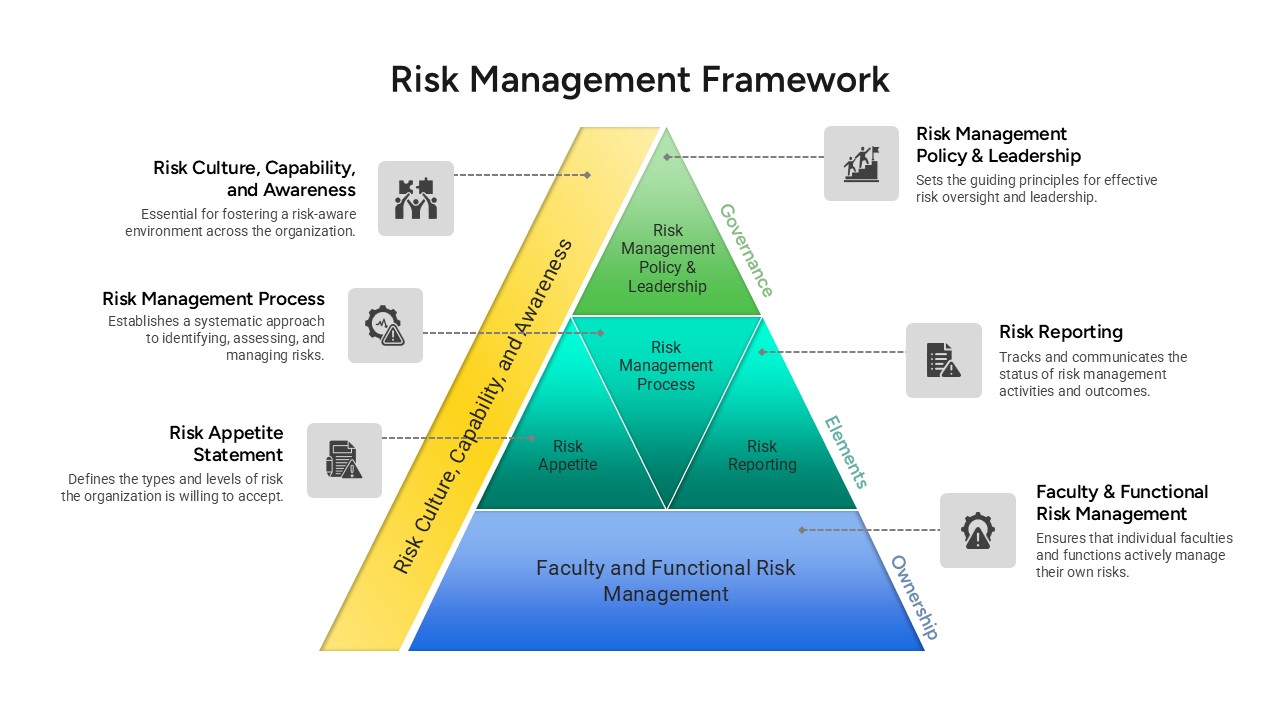
Risk Management Framework Pyramid Template for PowerPoint & Google Slides
Risk Management
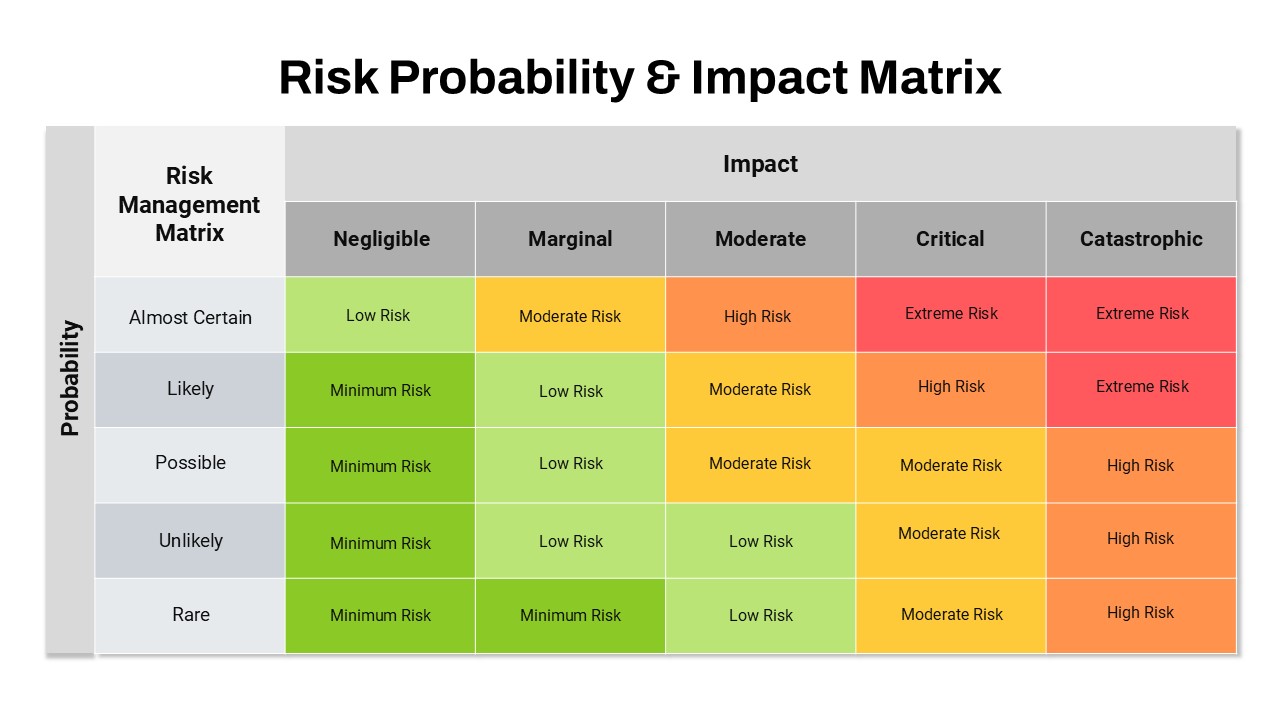
Risk Probability and Impact Matrix Template for PowerPoint & Google Slides
Risk Management
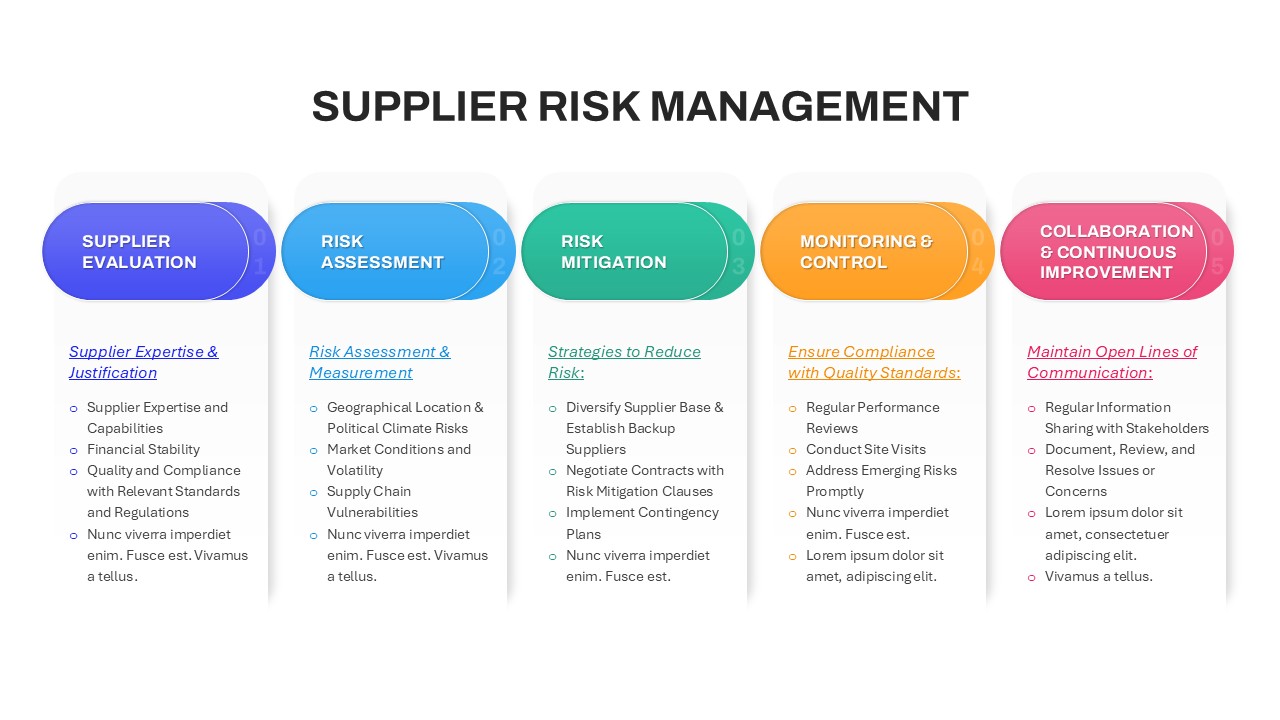
Supplier Risk Management template for PowerPoint & Google Slides
Opportunities Challenges
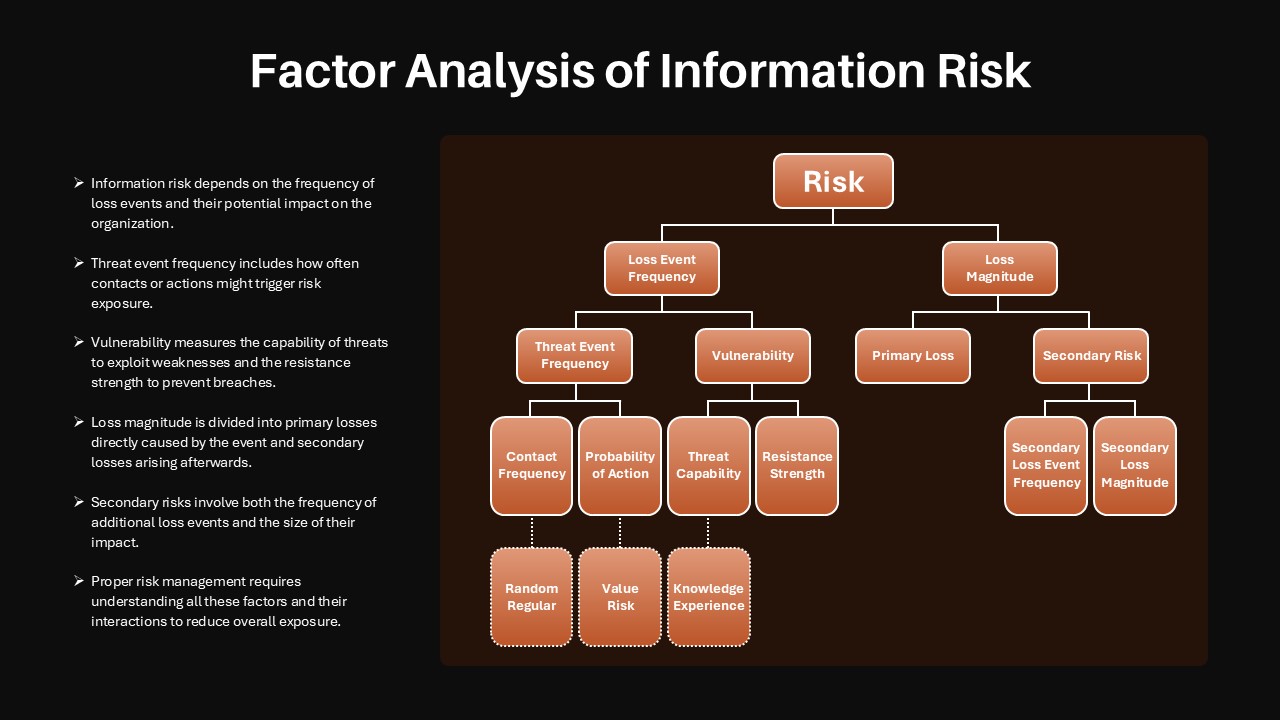
Factor Analysis of Information Risk Template for PowerPoint & Google Slides
Risk Management
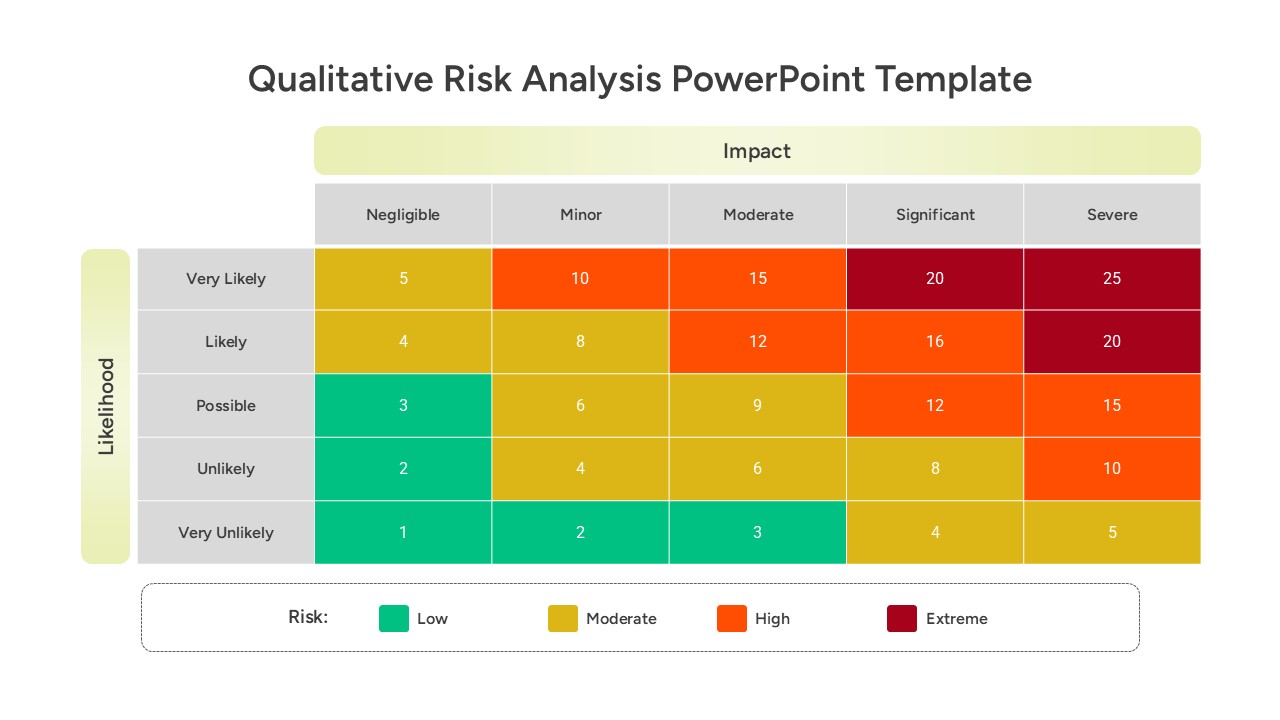
Qualitative Risk Analysis template for PowerPoint & Google Slides
Business
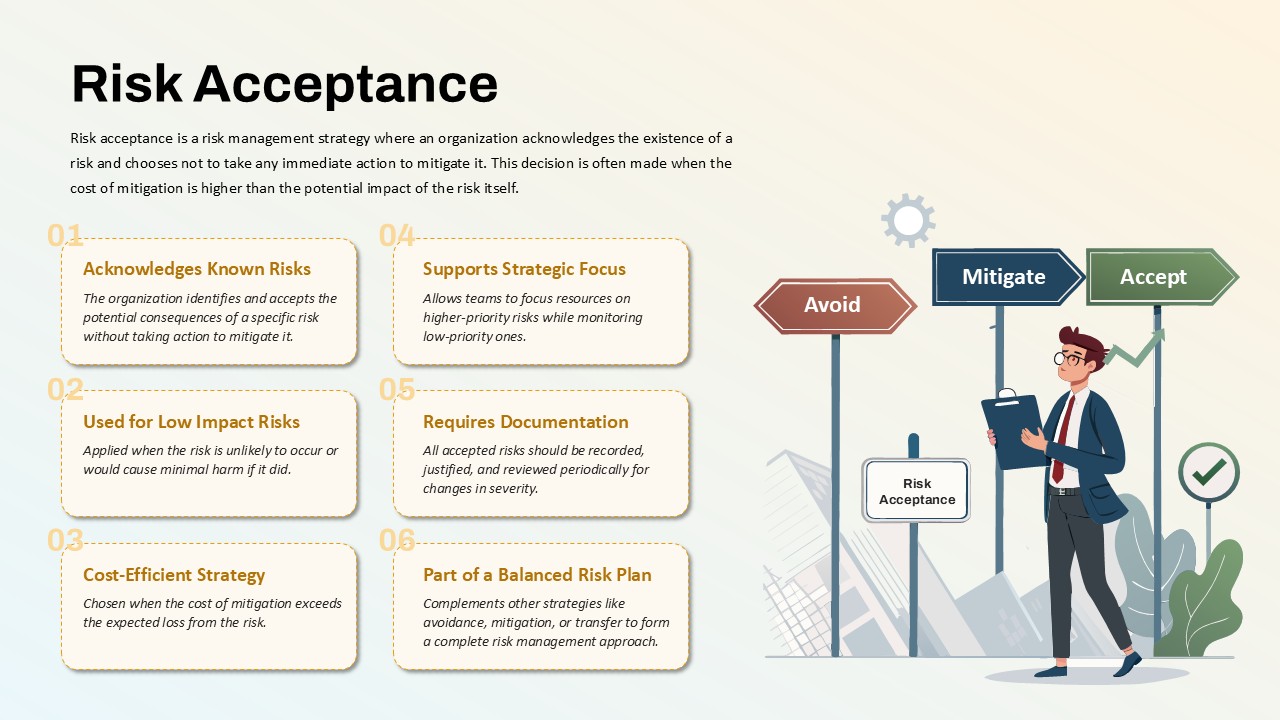
Risk Acceptance Workflow Template for PowerPoint & Google Slides
Risk Management
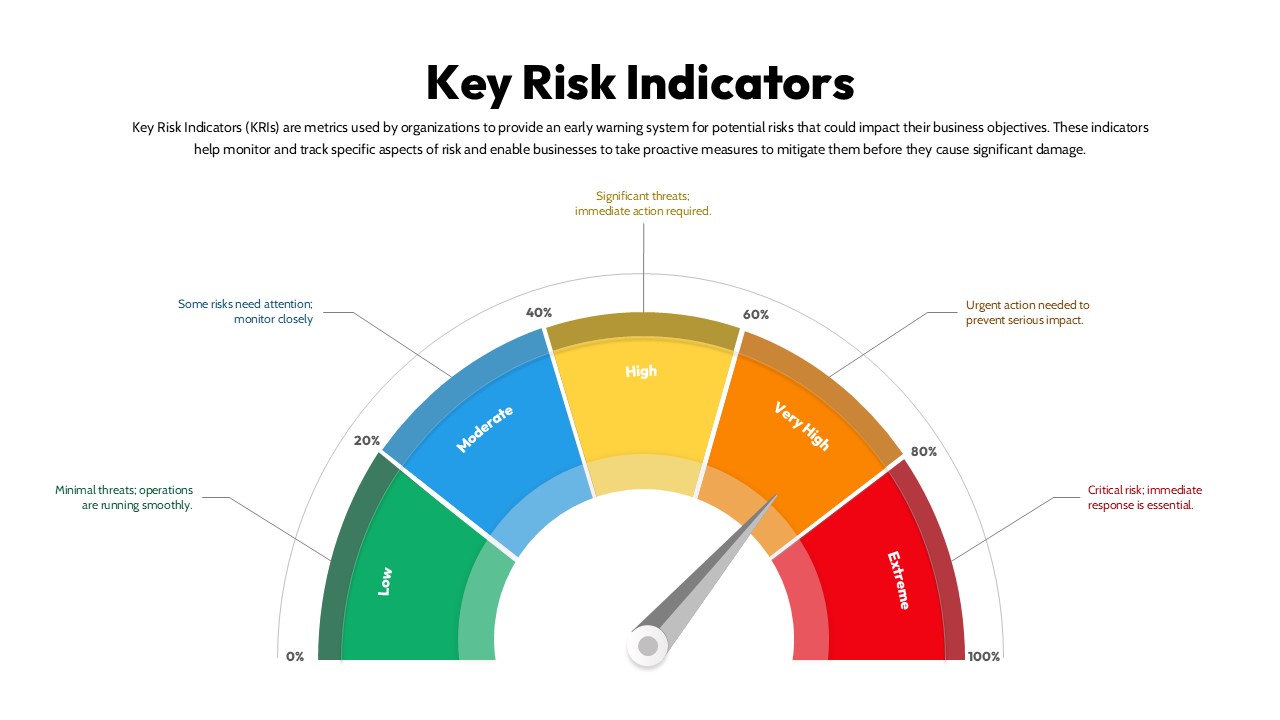
Key Risk Indicators (KRI) Gauge Template for PowerPoint & Google Slides
Risk Management
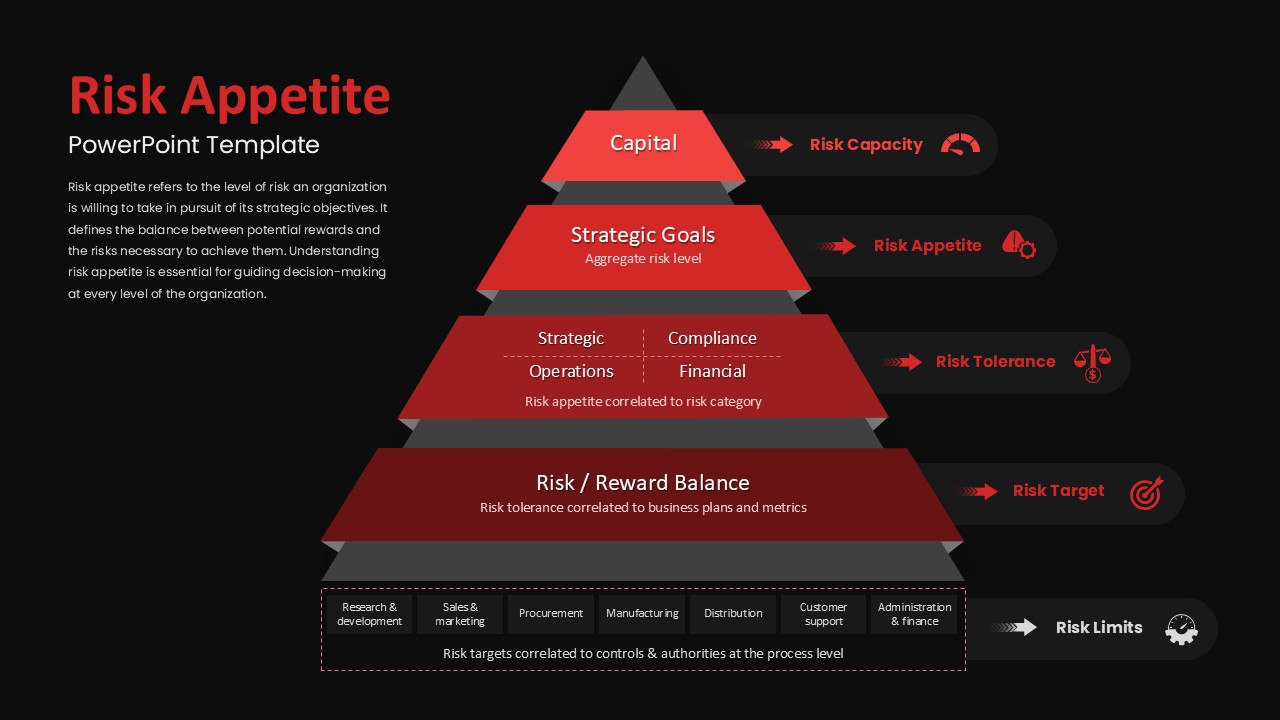
Risk Appetite Pyramid Framework Template for PowerPoint & Google Slides
Pyramid
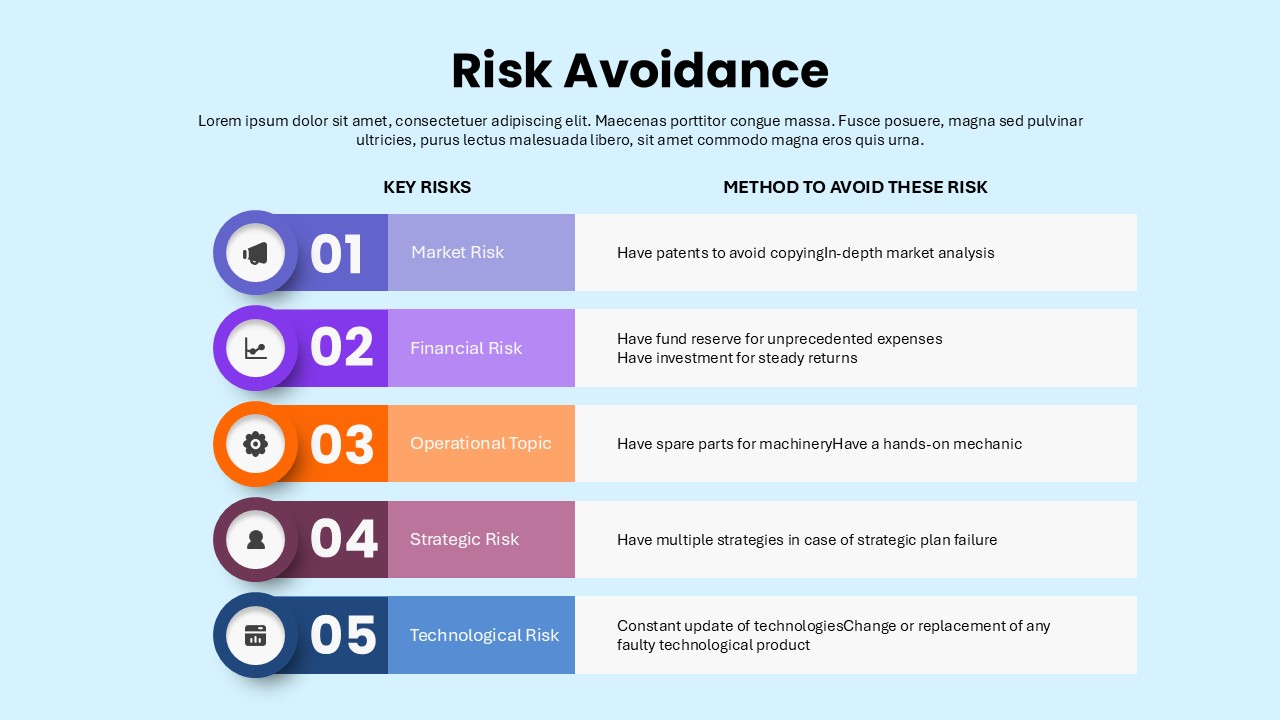
Risk Avoidance: Five Risks & Mitigation Template for PowerPoint & Google Slides
Risk Management
Quantitative Risk Analysis Matrix template for PowerPoint & Google Slides
Risk Management
Risk vs Reward Comparison Template for PowerPoint & Google Slides
Opportunities Challenges
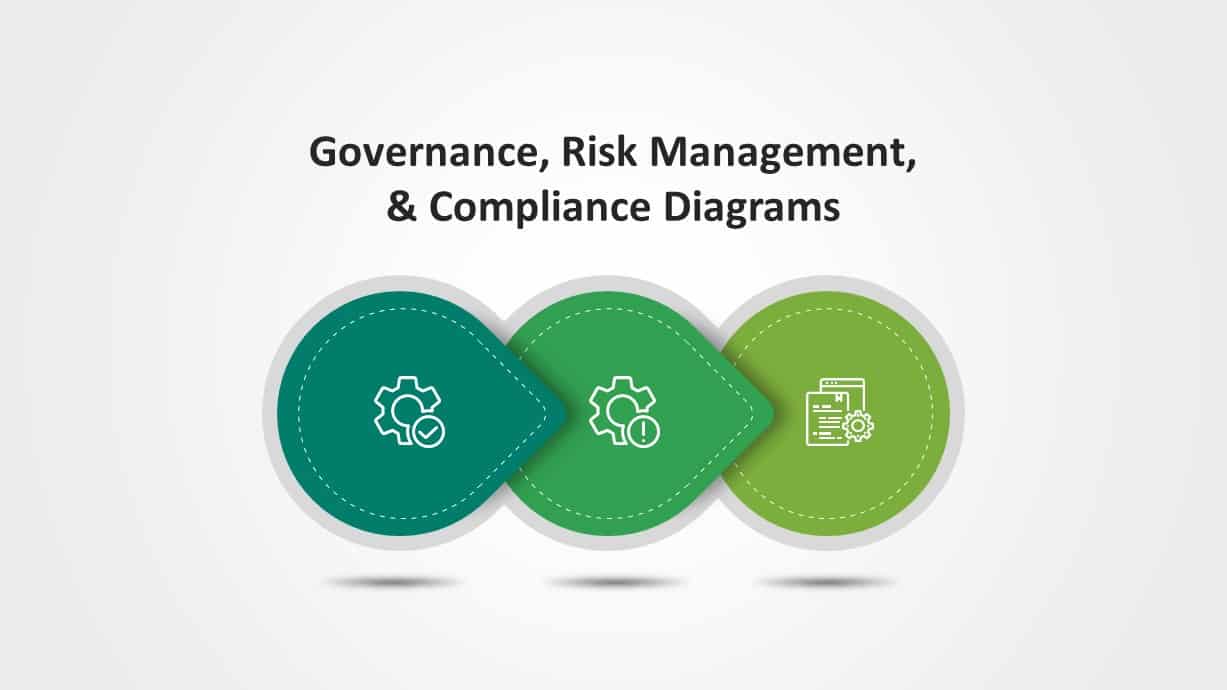
Governance, Risk & Compliance Overview Diagrams for PowerPoint & Google Slides
Risk Management
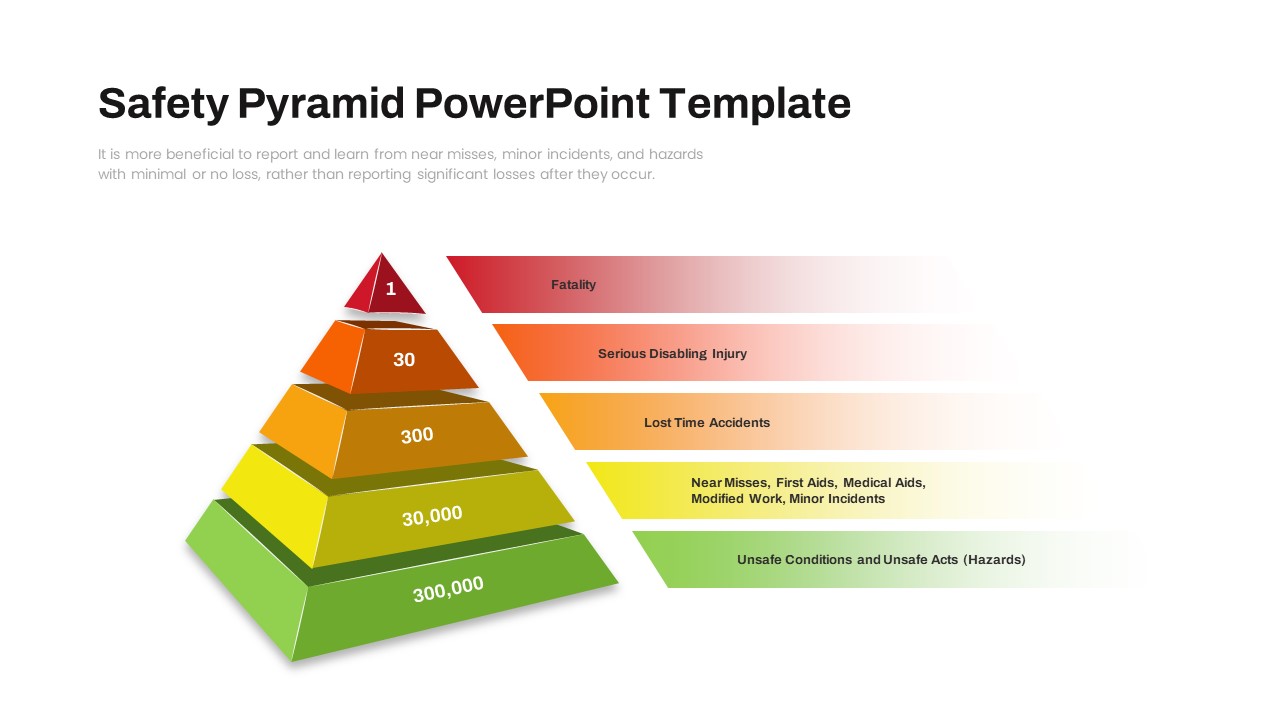
Safety Incident Pyramid Risk Hierarchy Slide for PowerPoint & Google Slides
Risk Management
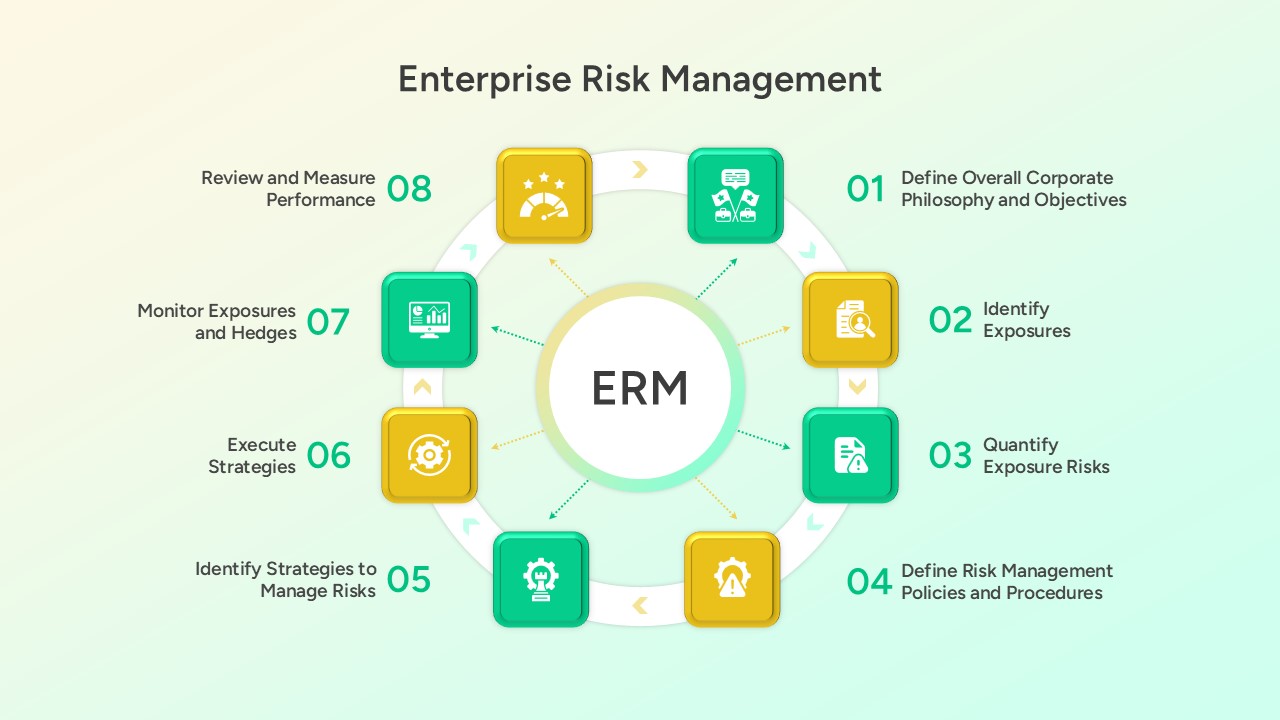
Enterprise Risk Management (ERM) Framework for PowerPoint & Google Slides
Business Plan
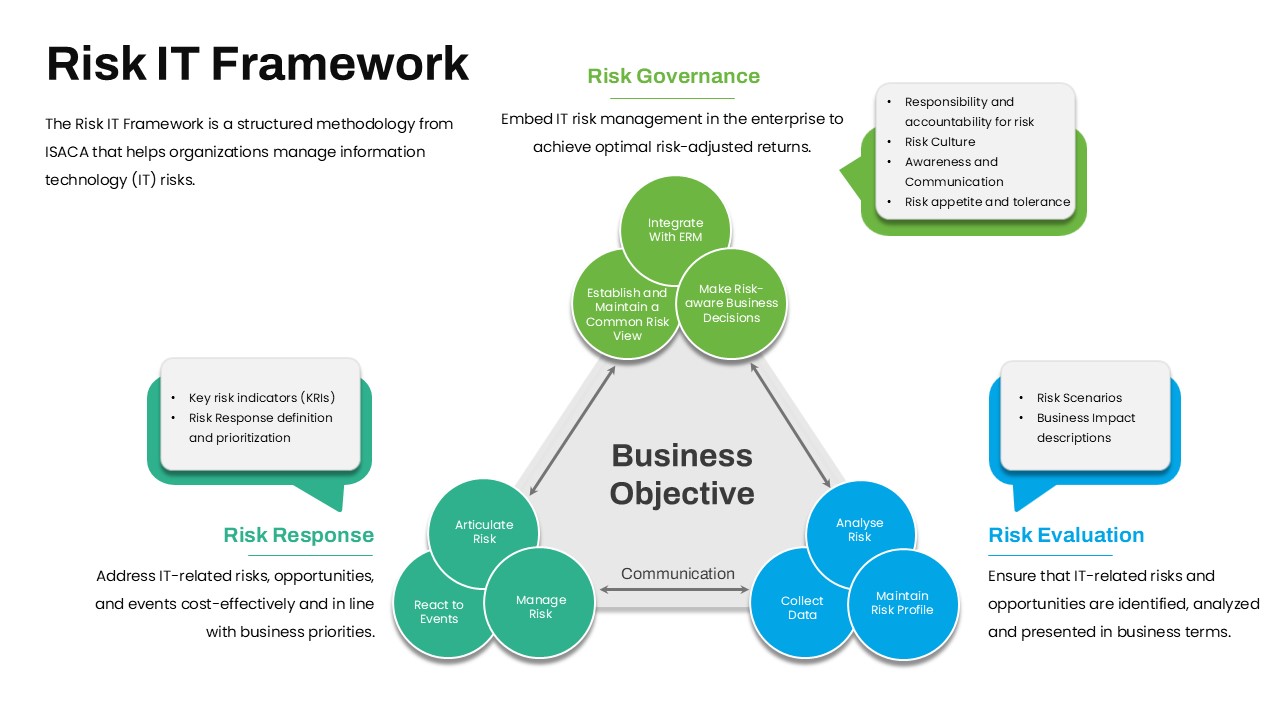
Risk IT Framework Overview for PowerPoint & Google Slides
Business Strategy
Snake Diagram Pack of 8 Slides template for PowerPoint & Google Slides
Process
Gear Process Diagram PowerPoint Template for PowerPoint & Google Slides
Process
Sales Process Workflow Funnel Diagram PowerPoint Template for PowerPoint & Google Slides
Funnel
Puzzle Diagram PowerPoint Template for PowerPoint & Google Slides
Process
Transportation Logistics PowerPoint Diagram template for PowerPoint & Google Slides
Process
Emoji Scale PowerPoint Diagram for PowerPoint & Google Slides
Infographics
4 Step Problem Solving PowerPoint Diagram for PowerPoint & Google Slides
Process
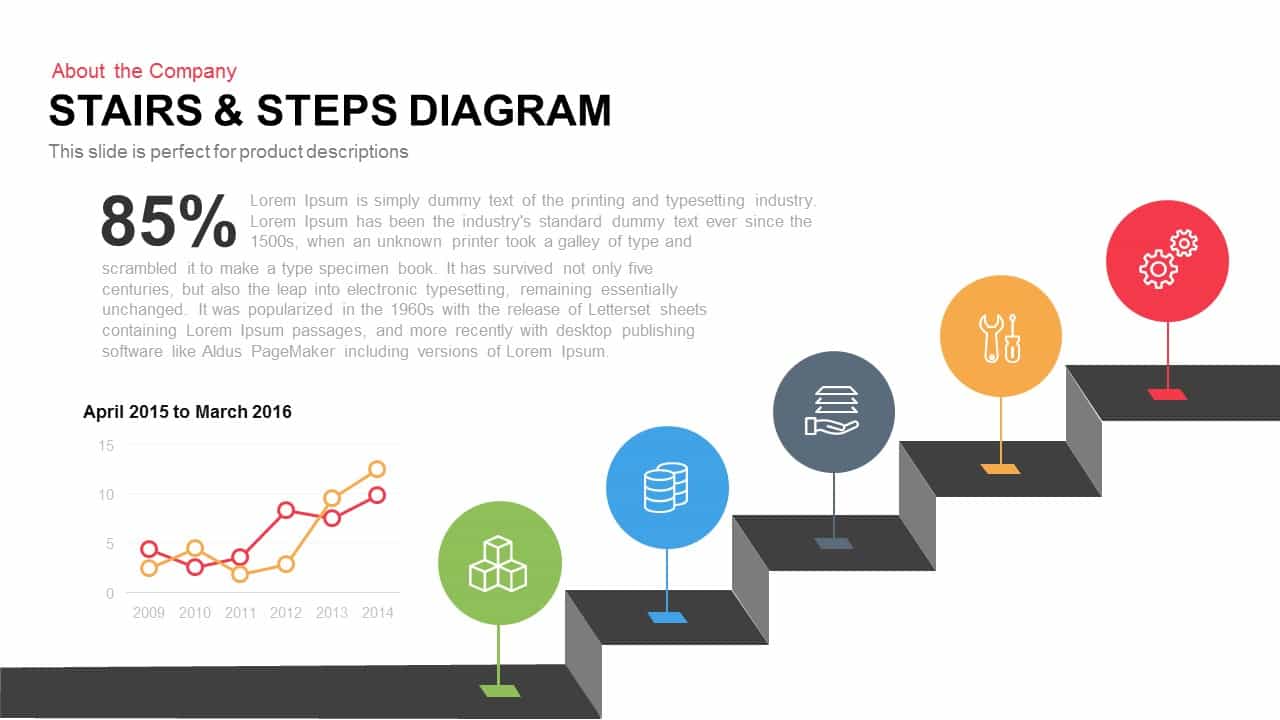
Stairs & Steps Process Diagram template for PowerPoint & Google Slides
Process
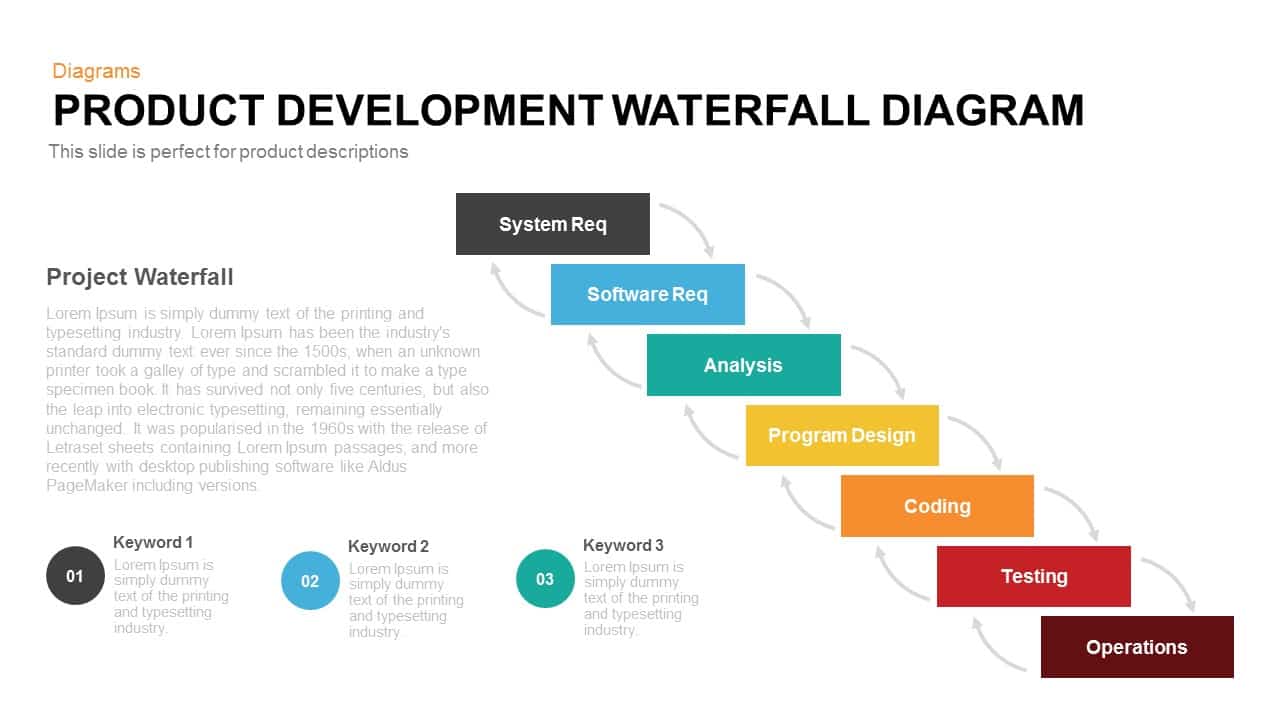
Product Development Waterfall Diagram Template for PowerPoint & Google Slides
Process
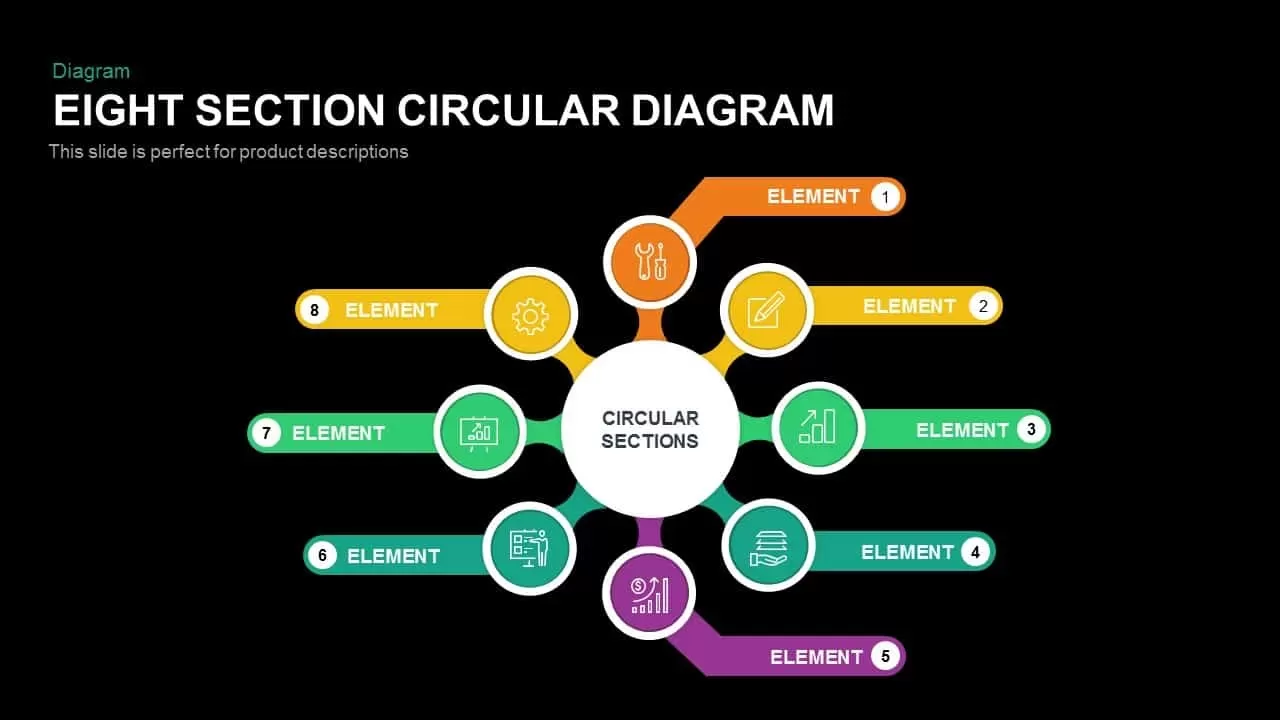
Eight Section Circular Diagram Template for PowerPoint & Google Slides
Circular
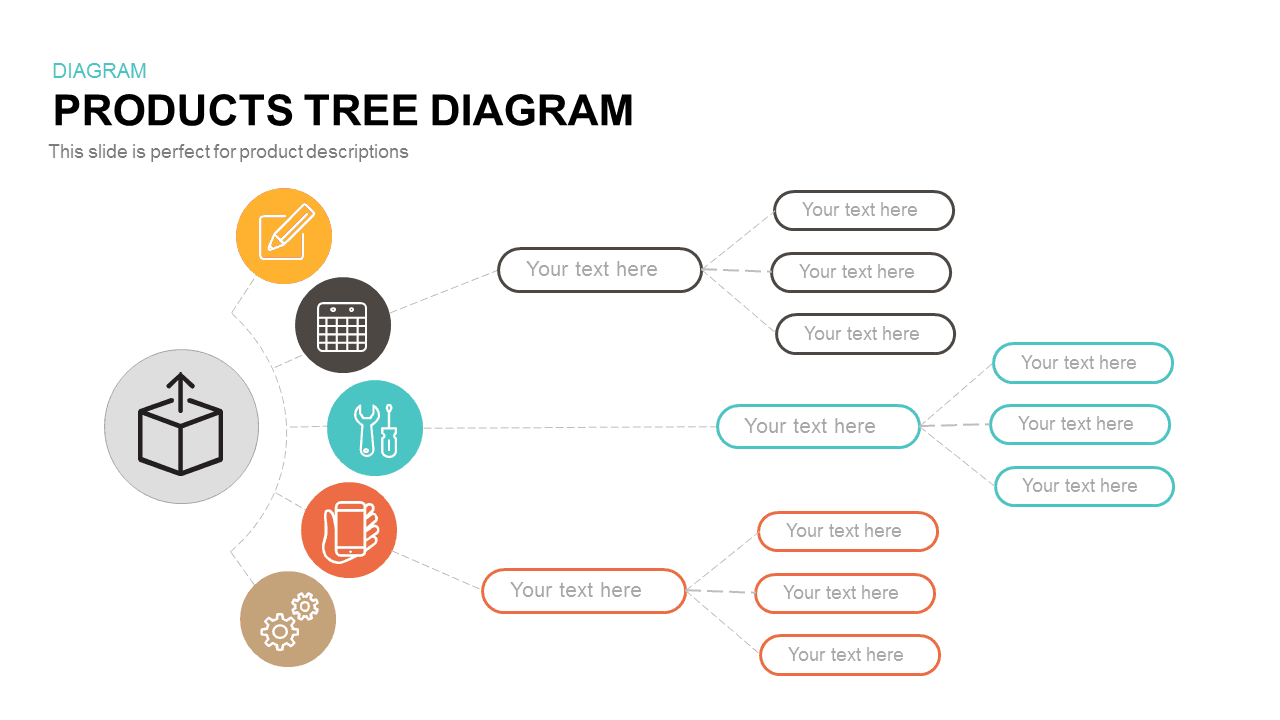
Interactive Products Tree Diagram template for PowerPoint & Google Slides
Org Chart
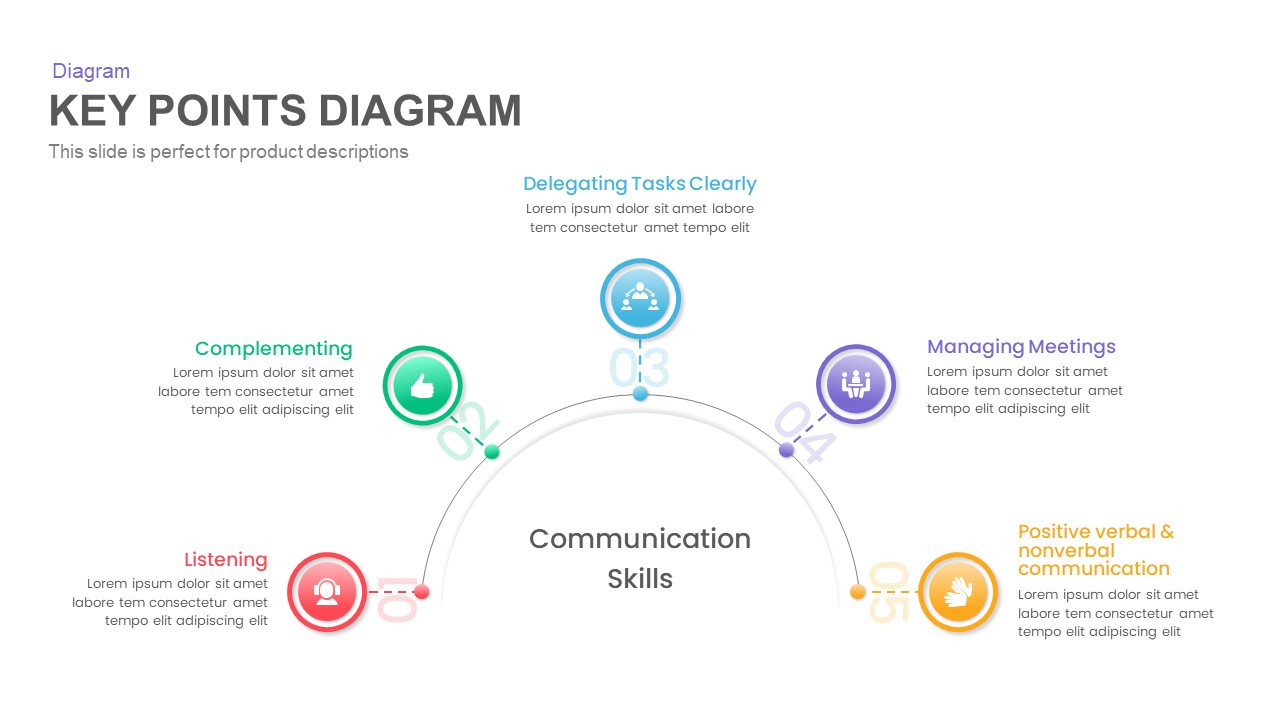
Dynamic Key Points Diagram Template for PowerPoint & Google Slides
Process

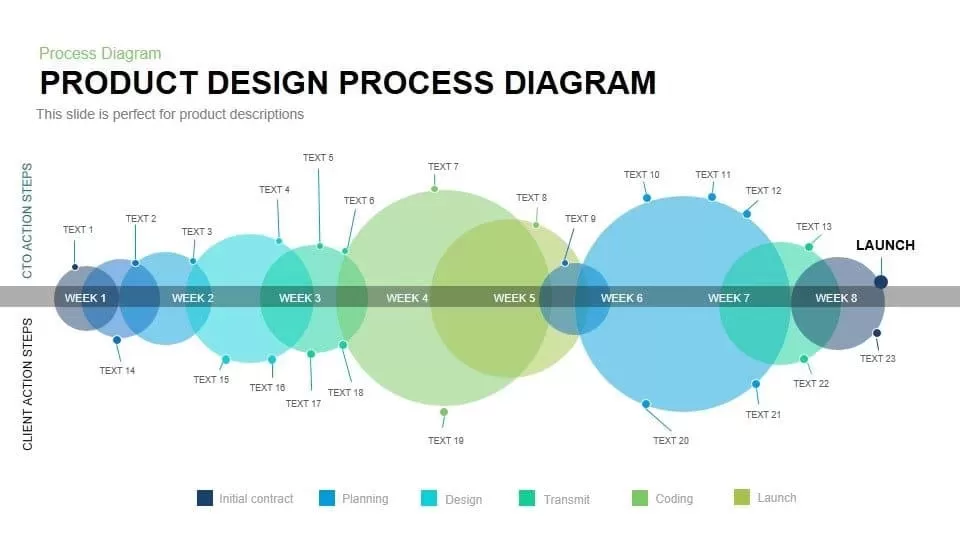
Product Design Process Diagram Template for PowerPoint & Google Slides
Timeline
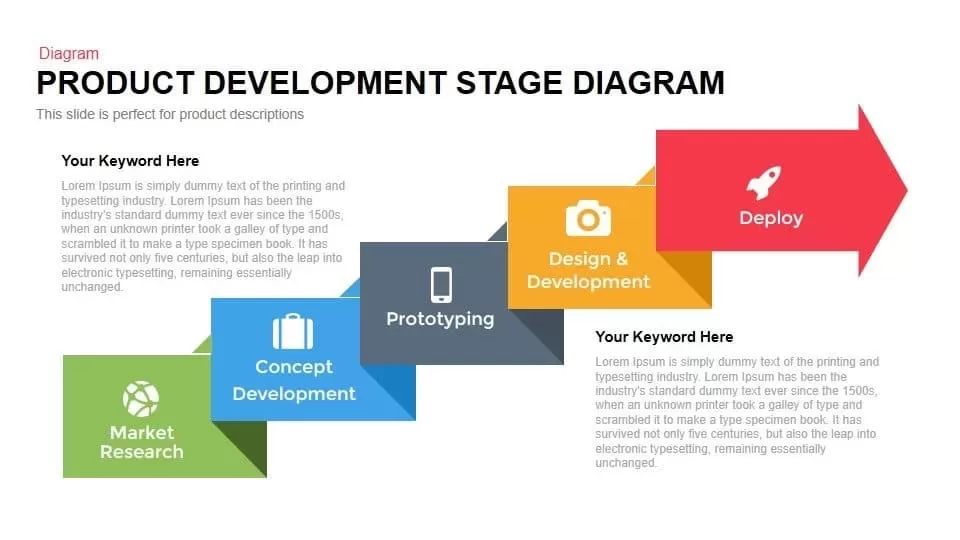
Product Development Stage Diagram Template for PowerPoint & Google Slides
Process
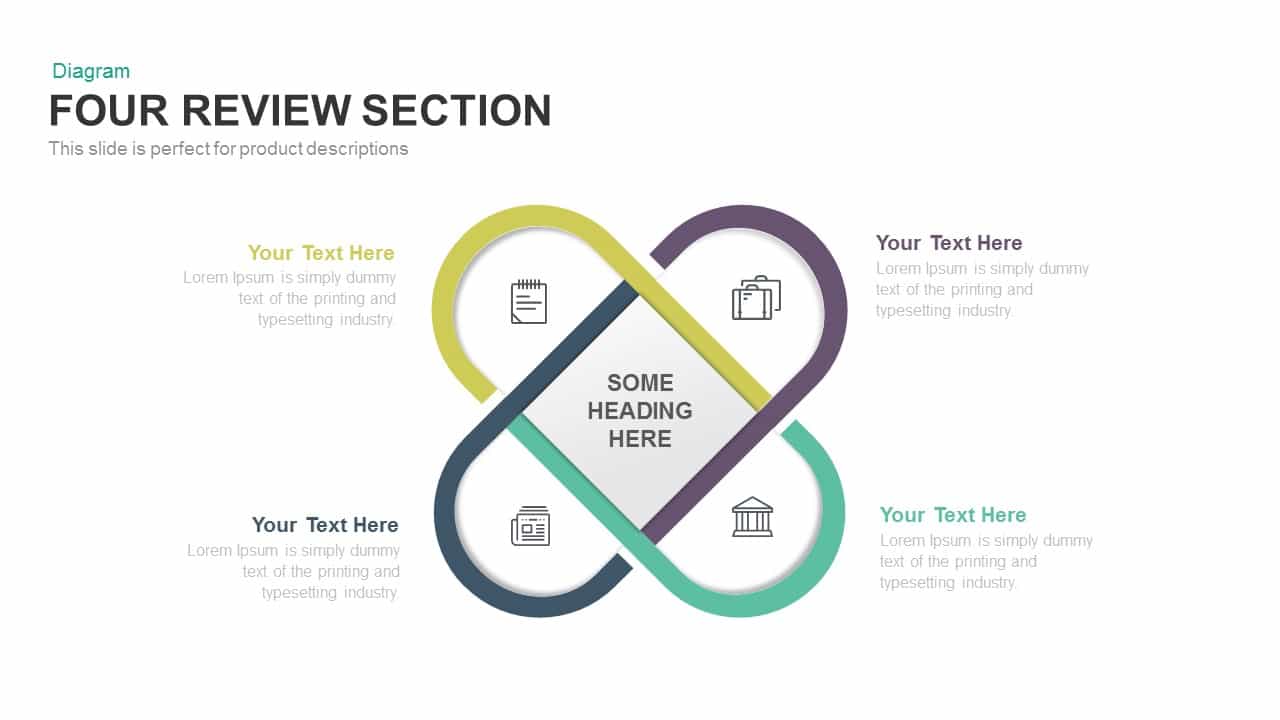
Clean Four-Section Review Diagram Template for PowerPoint & Google Slides
Agenda
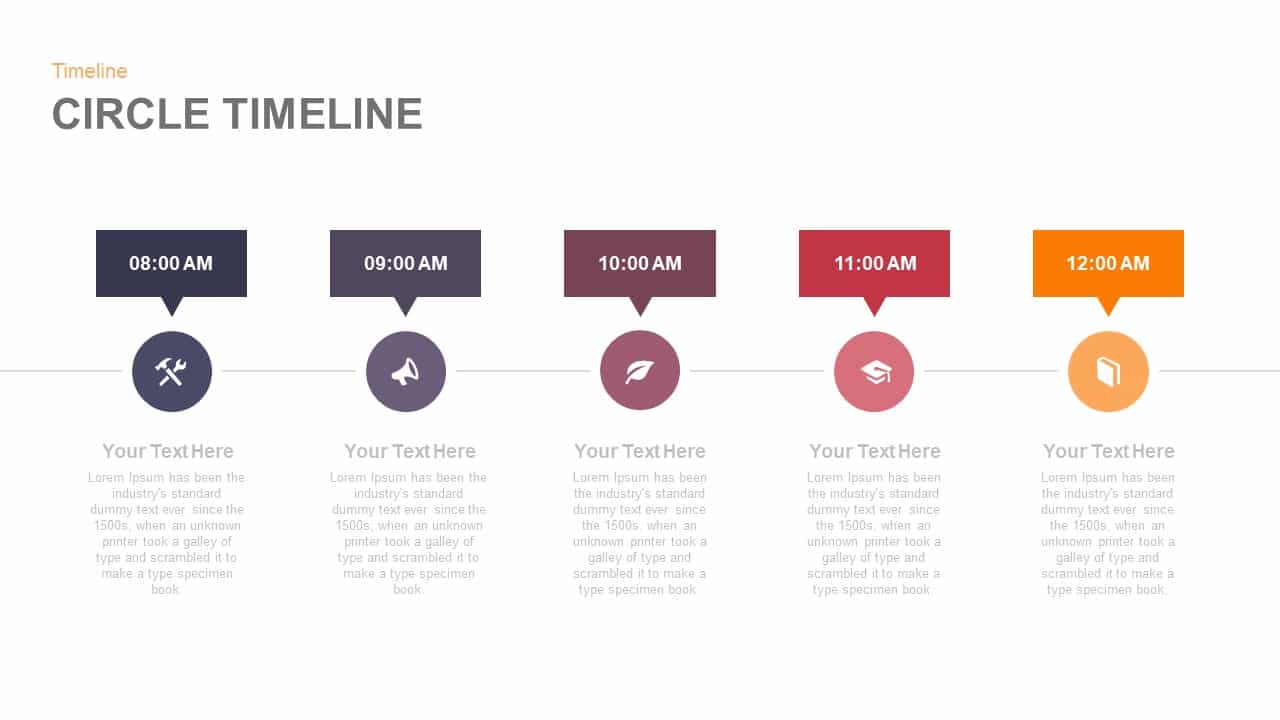
Five-Point Circle Timeline Diagram Template for PowerPoint & Google Slides
Timeline
12-Stage Zig Zag Process Diagram Template for PowerPoint & Google Slides
Process
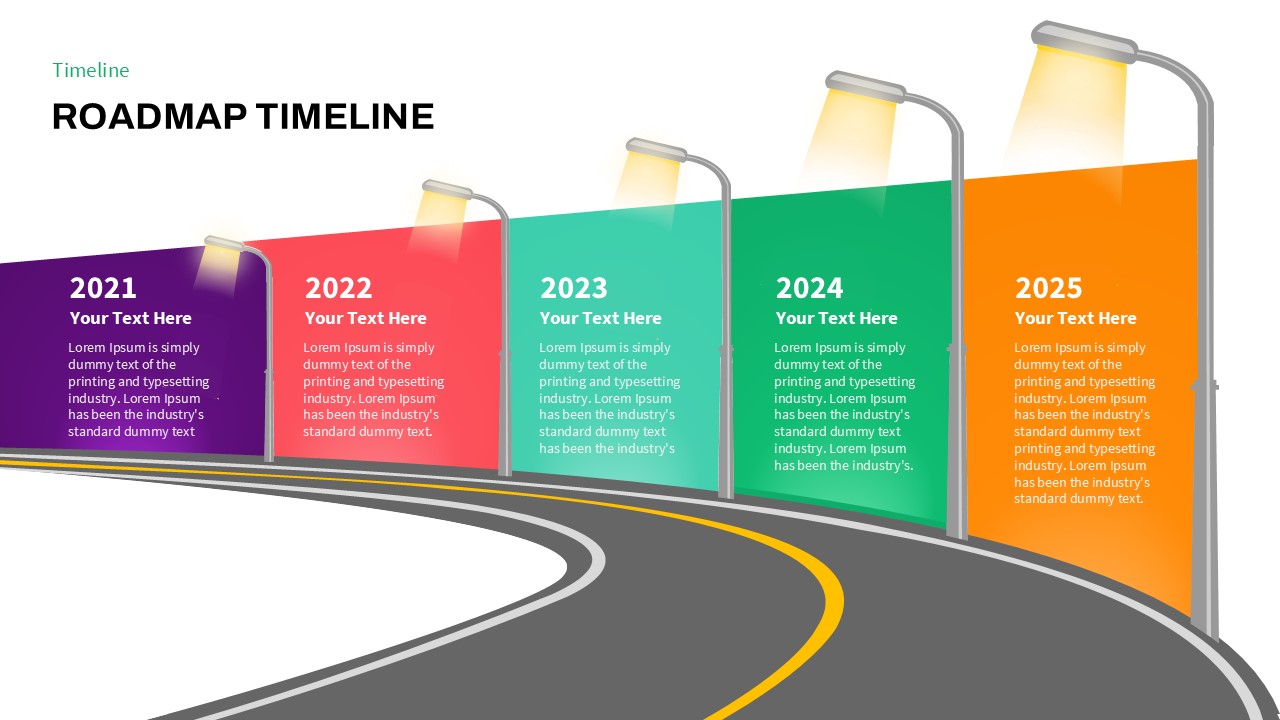
Curved Road Roadmap Timeline Diagram Template for PowerPoint & Google Slides
Roadmap
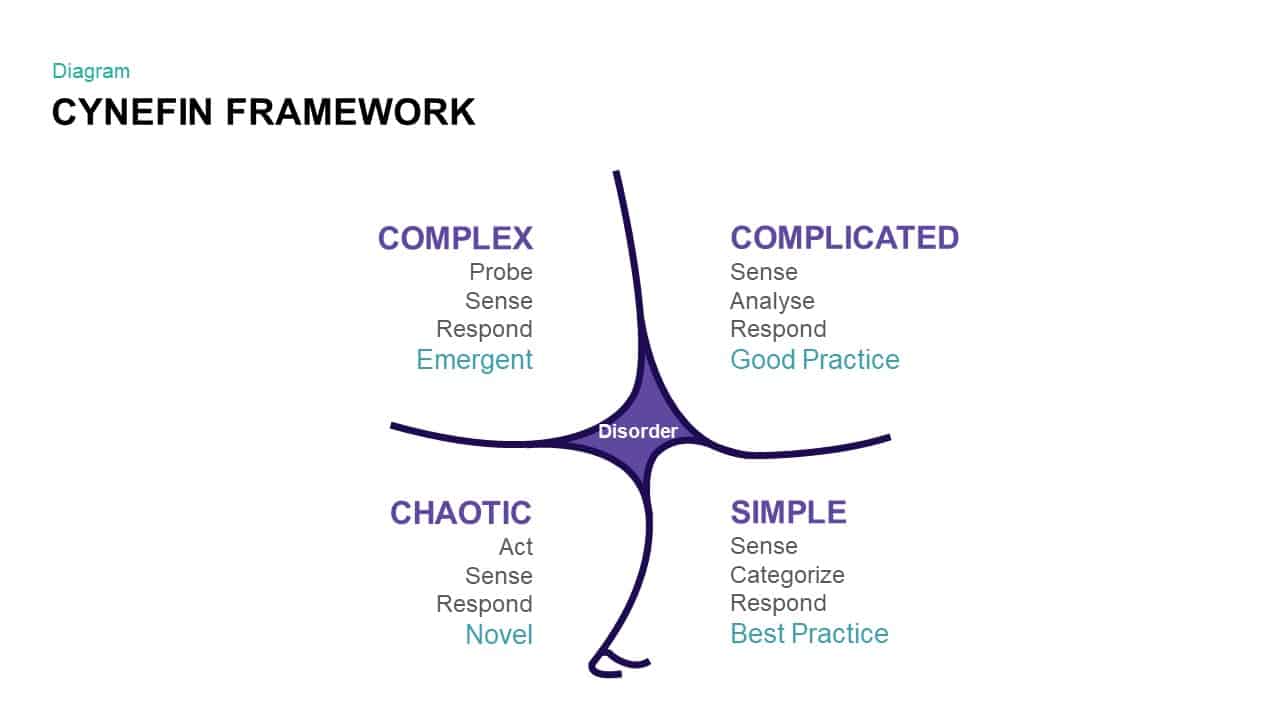
Comprehensive Cynefin Framework Diagram Template for PowerPoint & Google Slides
Opportunities Challenges
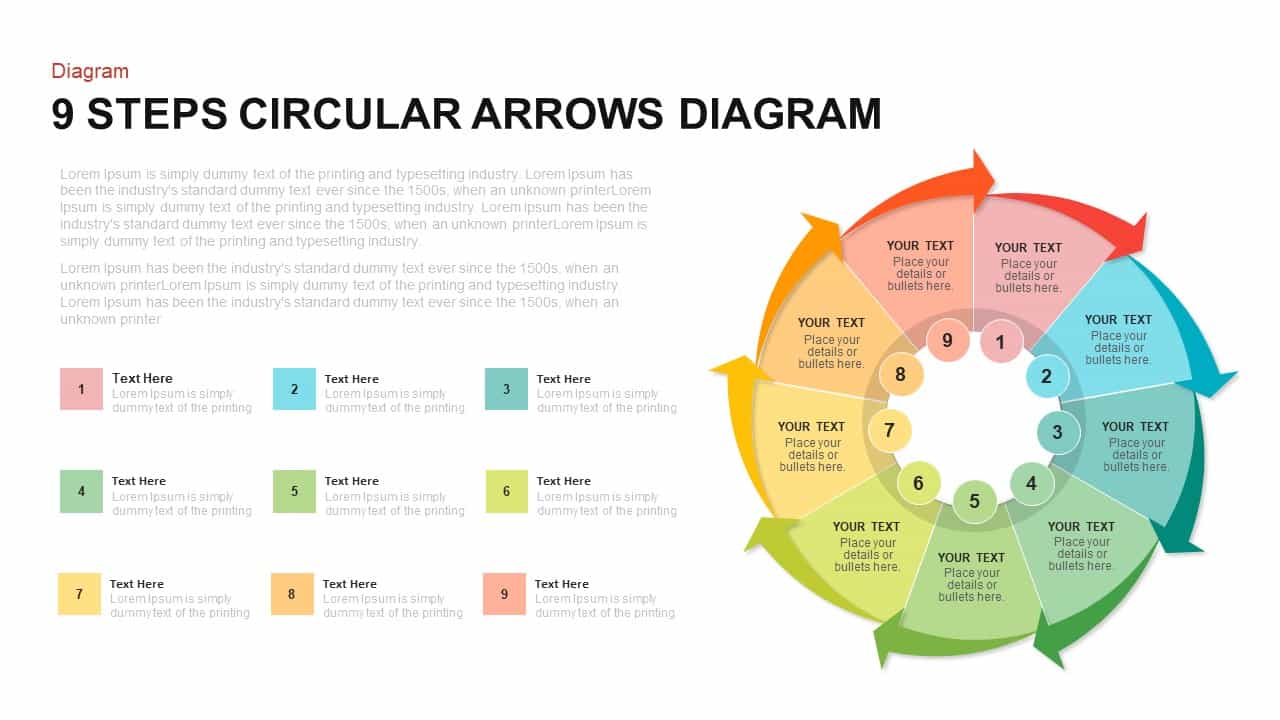
9-Step Circular Arrows Process Diagram Template for PowerPoint & Google Slides
Process
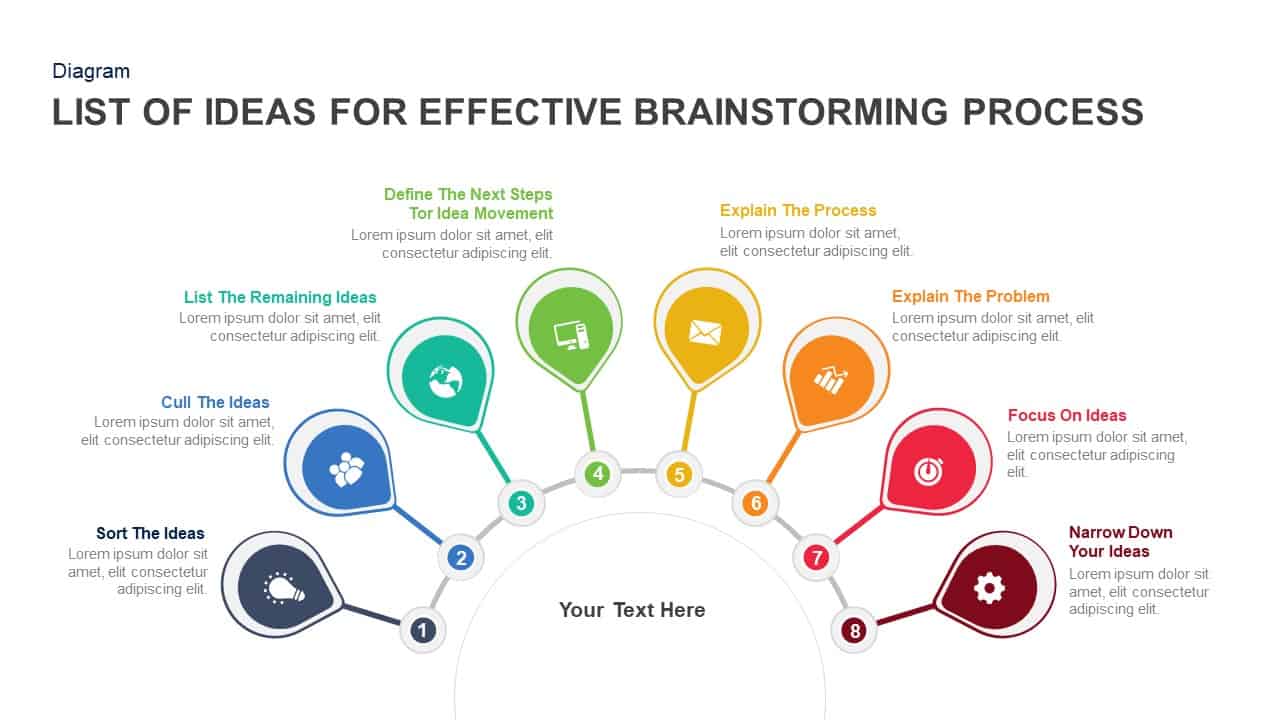
Eight-Step Brainstorming Process Diagram Template for PowerPoint & Google Slides
Process
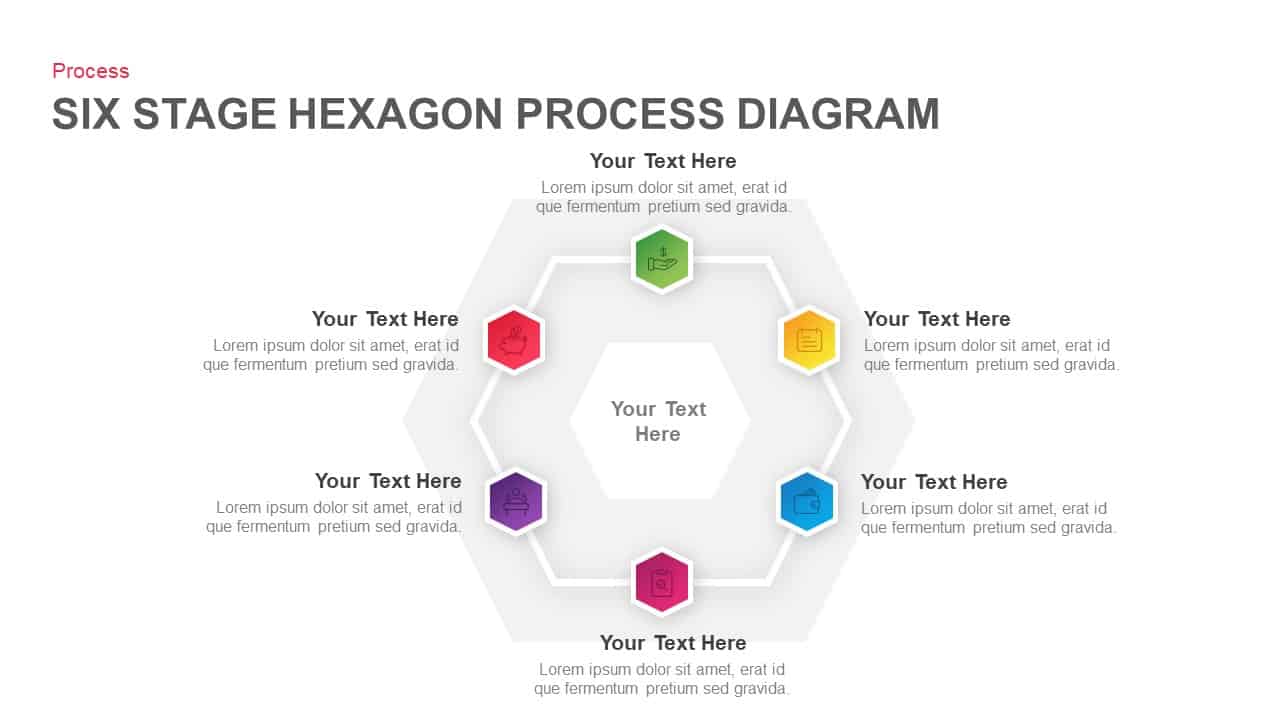
Six Stage Hexagon Process Diagram Template for PowerPoint & Google Slides
Process
Four-Stage Linear Process Flow Diagram Template for PowerPoint & Google Slides
Process
Creative Three-Circle Venn Diagram Template for PowerPoint & Google Slides
Comparison
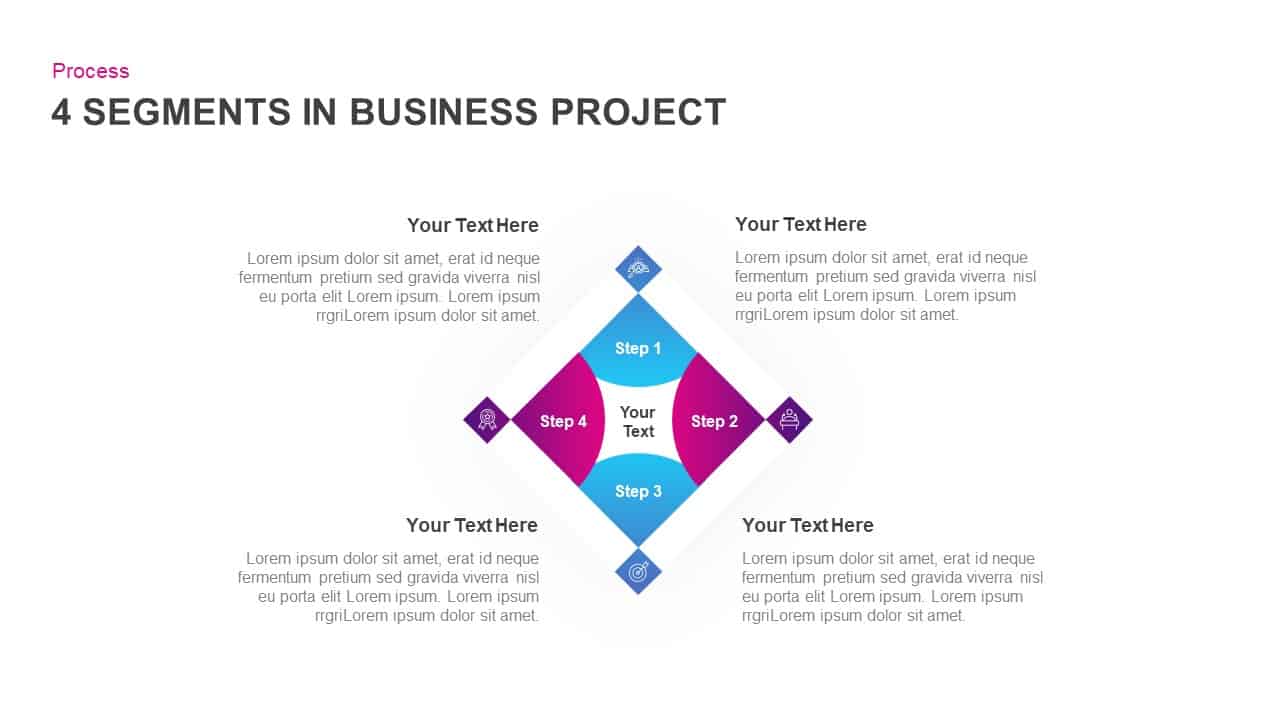
4-Segment Business Project Diamond Diagram Template for PowerPoint & Google Slides
Process
Creative Tree Diagram Infographic Template for PowerPoint & Google Slides
Decision Tree
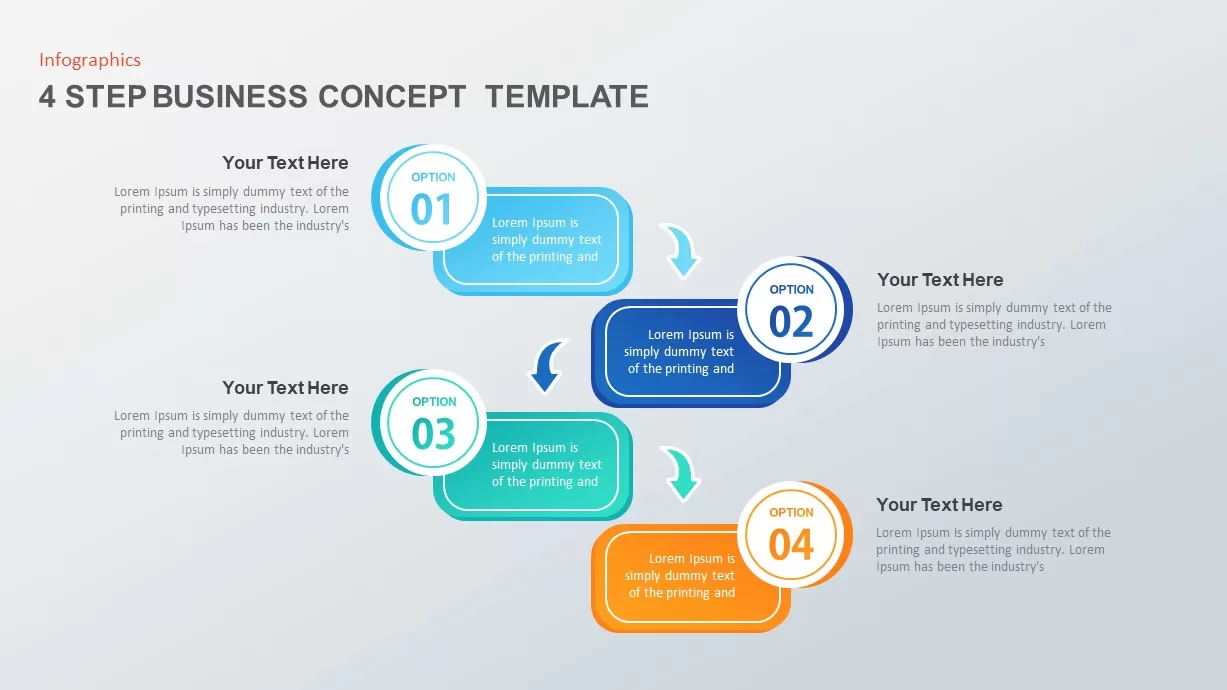
4 Step Business Concept Diagram Template for PowerPoint & Google Slides
Business
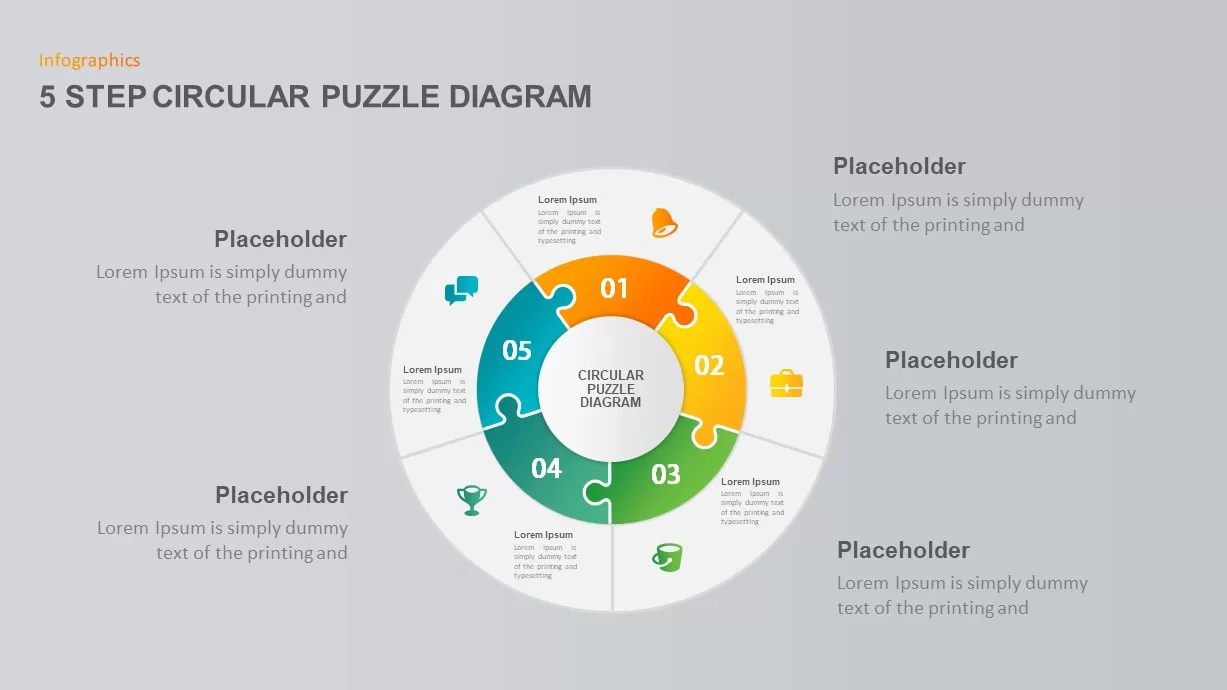
5-Step Circular Puzzle Diagram Template for PowerPoint & Google Slides
Circular
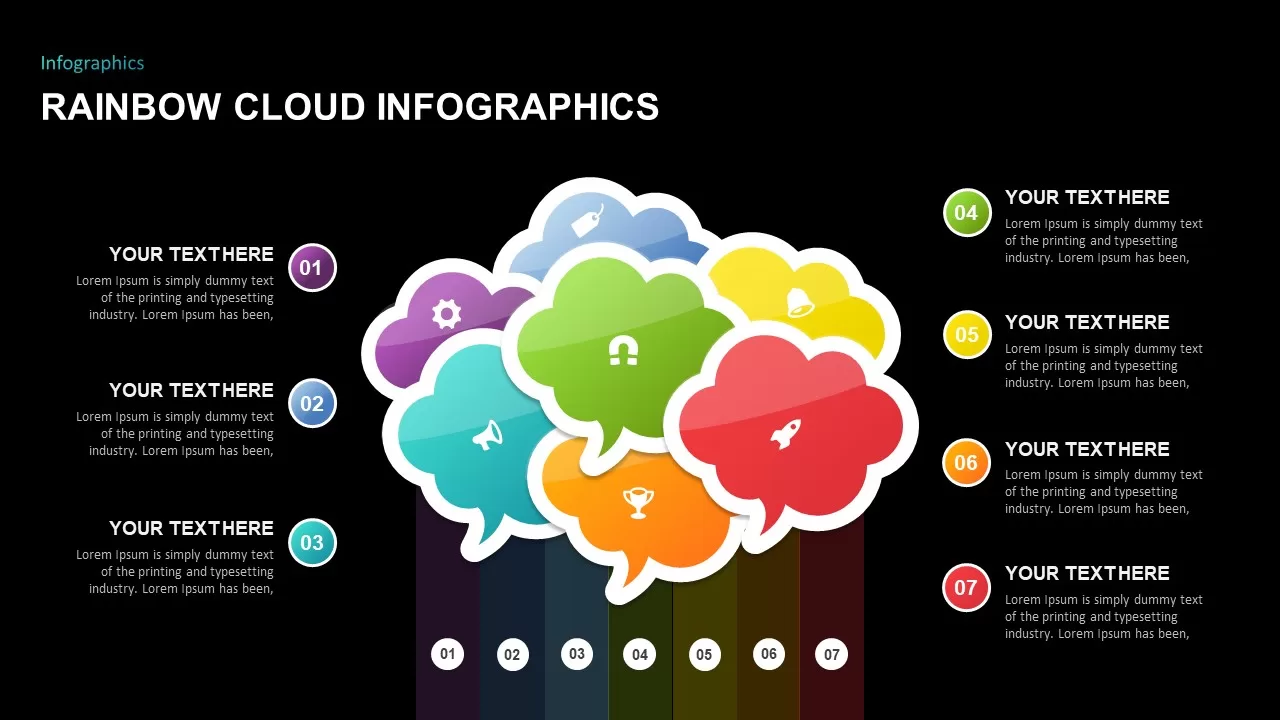
Rainbow Cloud Infographics Diagram Template for PowerPoint & Google Slides
Process
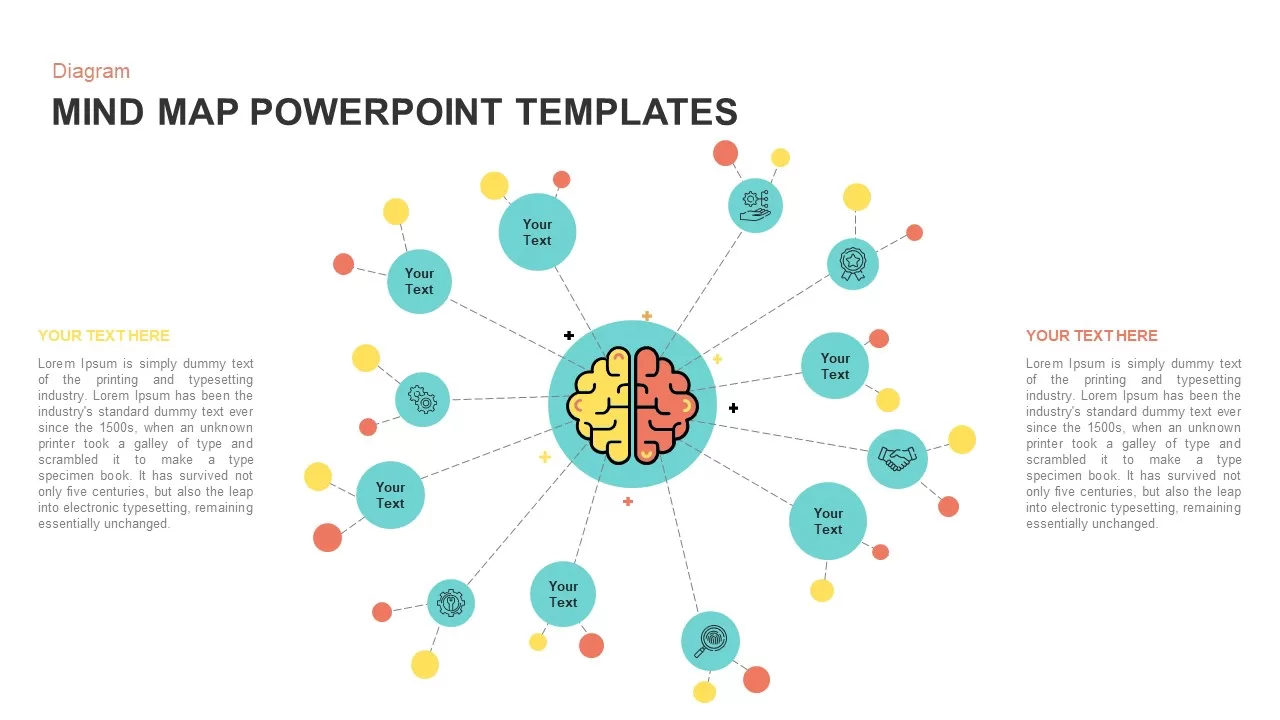
Mind Map Diagram Template for PowerPoint & Google Slides
Mind Maps
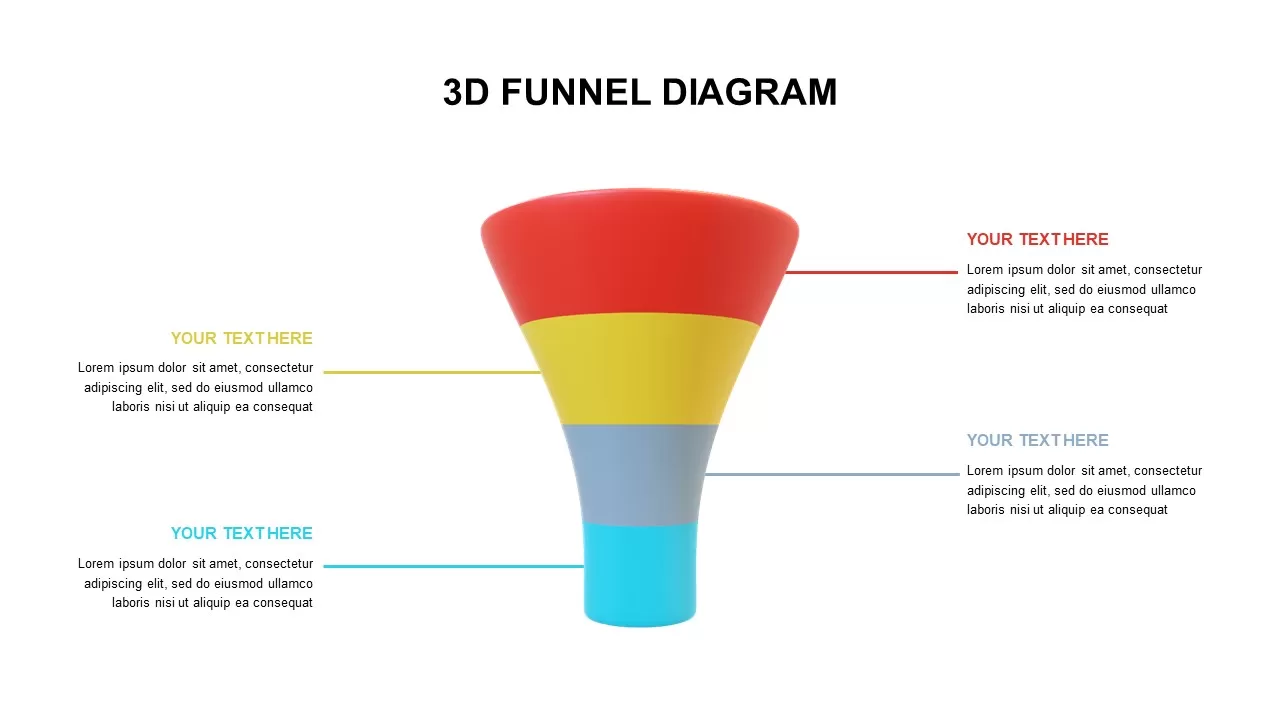
Free 4-Step 3D Funnel Diagram Template for PowerPoint & Google Slides
Funnel
Free
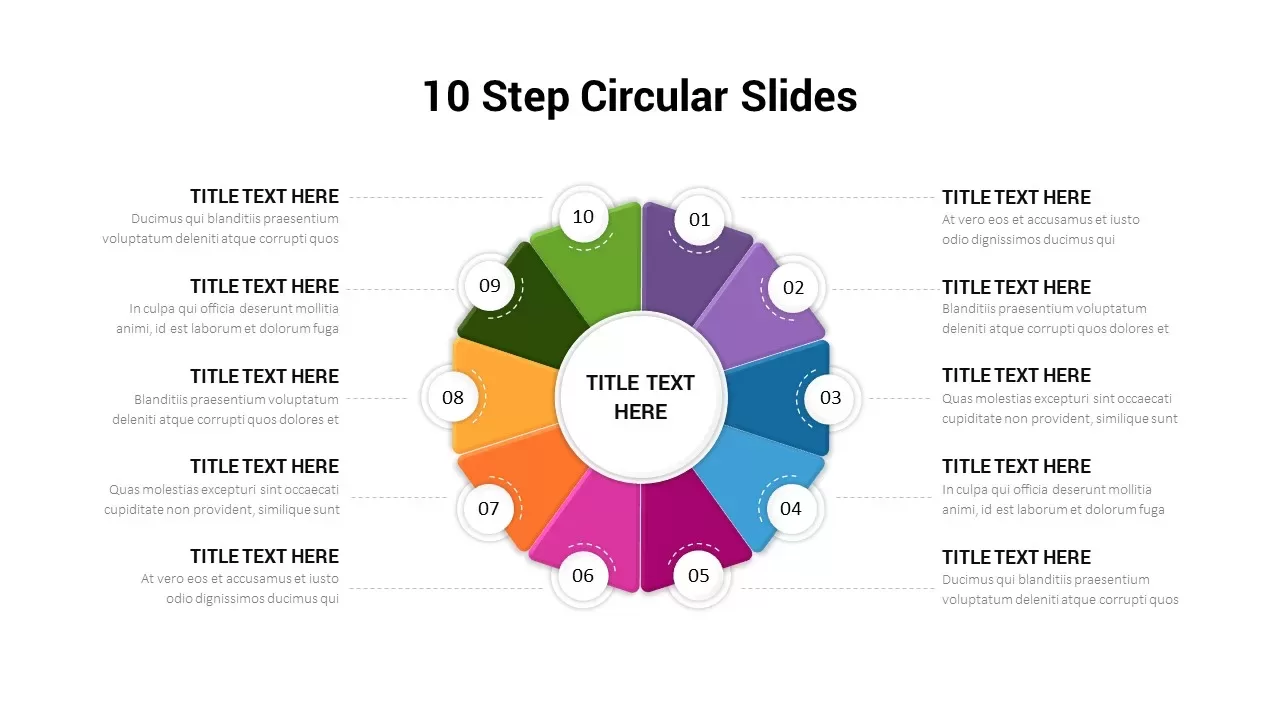
10-Step Circular Process Diagram Template for PowerPoint & Google Slides
Process
Business Strategy House Model Diagram Template for PowerPoint & Google Slides
Business Strategy
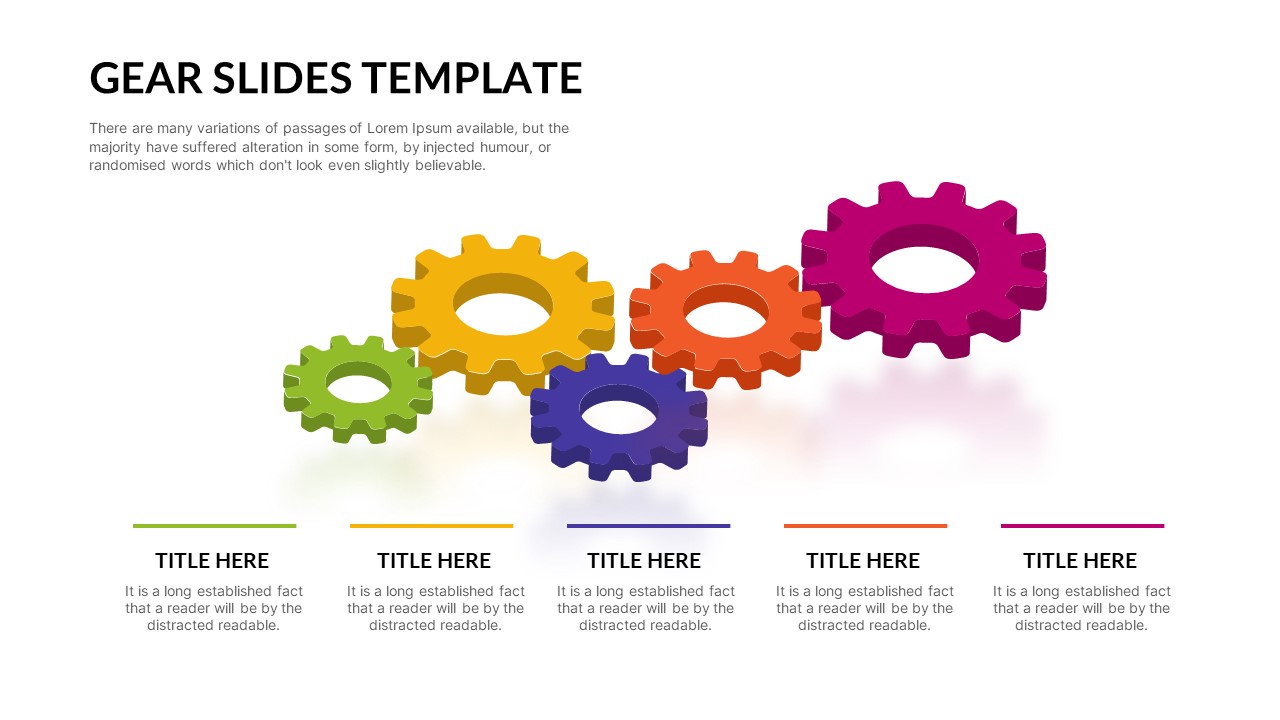
Five-Step Interlocking Gears Diagram Template for PowerPoint & Google Slides
Process
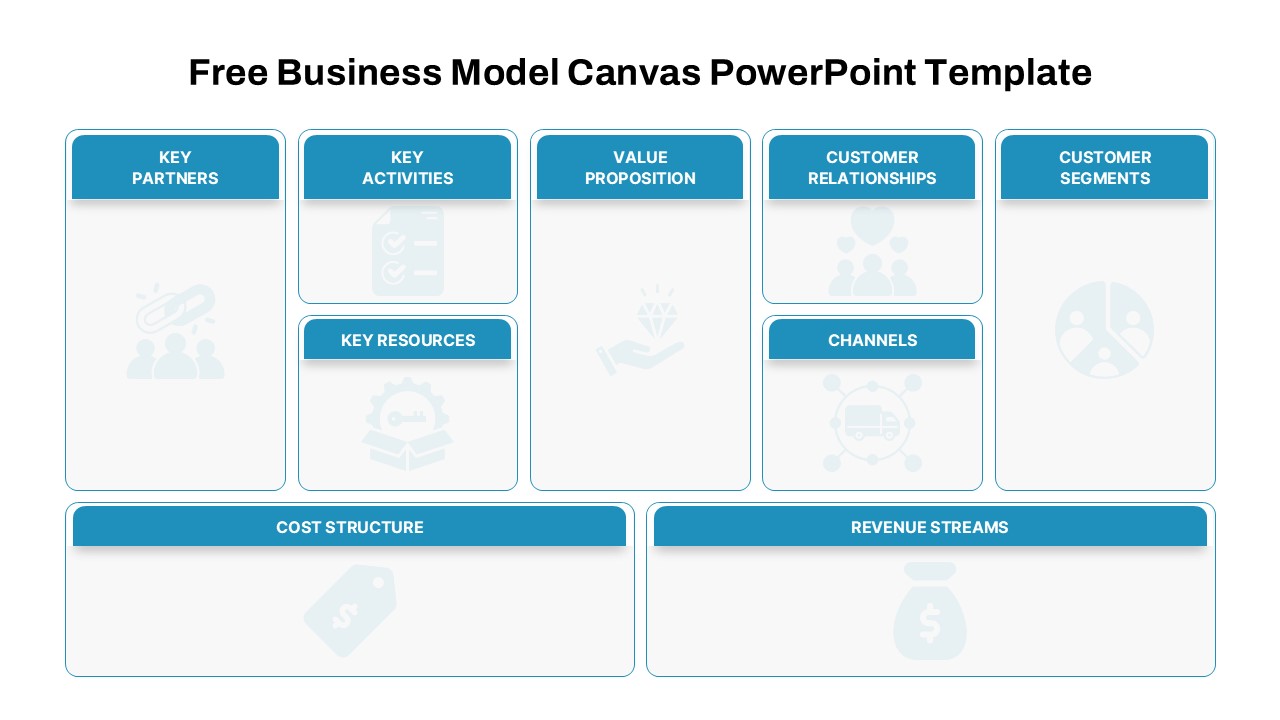
Free Business Model Canvas Diagram Slide Template for PowerPoint & Google Slides
Business Models
Free
Capital Investments Process Flow Diagram Template for PowerPoint & Google Slides
Process
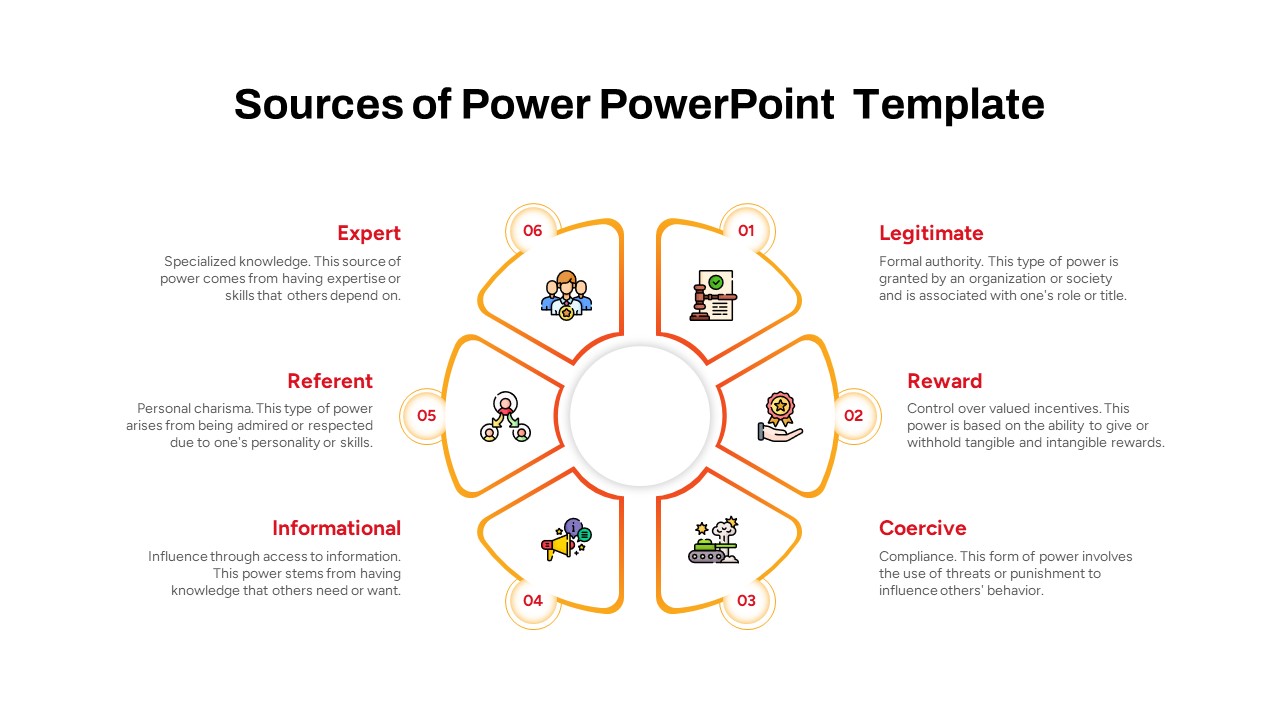
Sources of Power Circular Diagram Template for PowerPoint & Google Slides
Circular
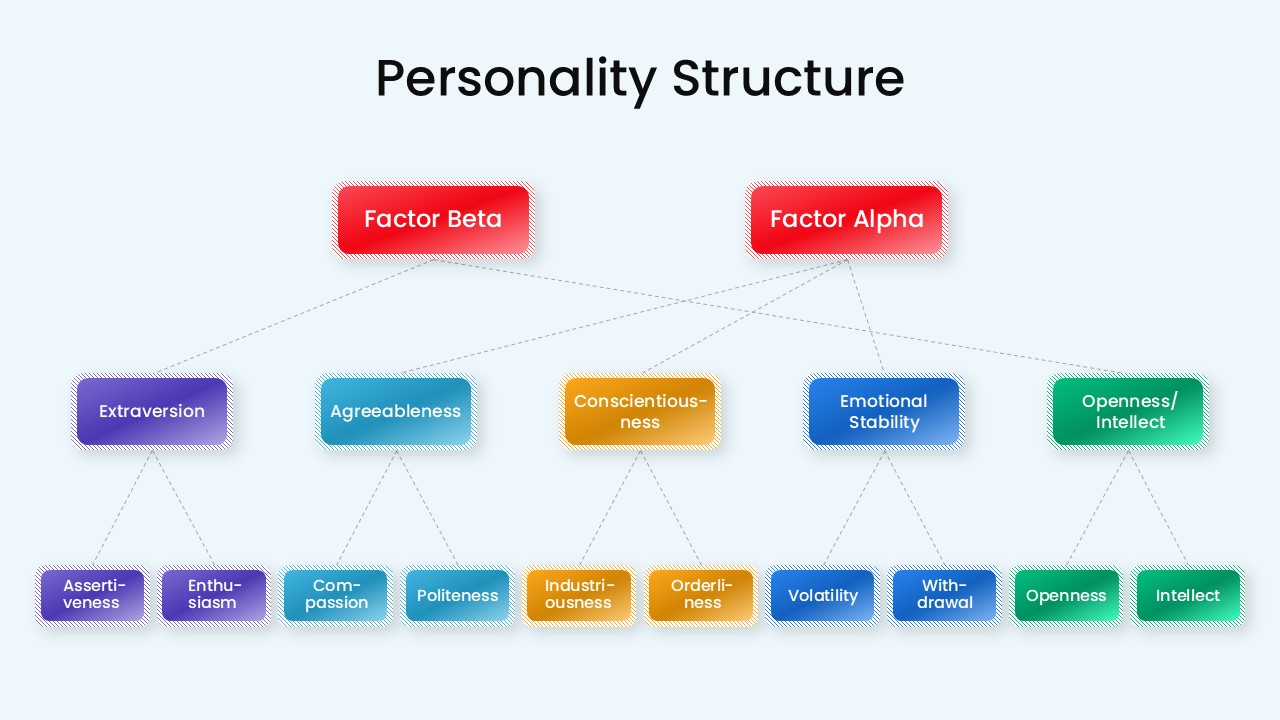
Personality Structure Hierarchy Diagram Template for PowerPoint & Google Slides
Org Chart
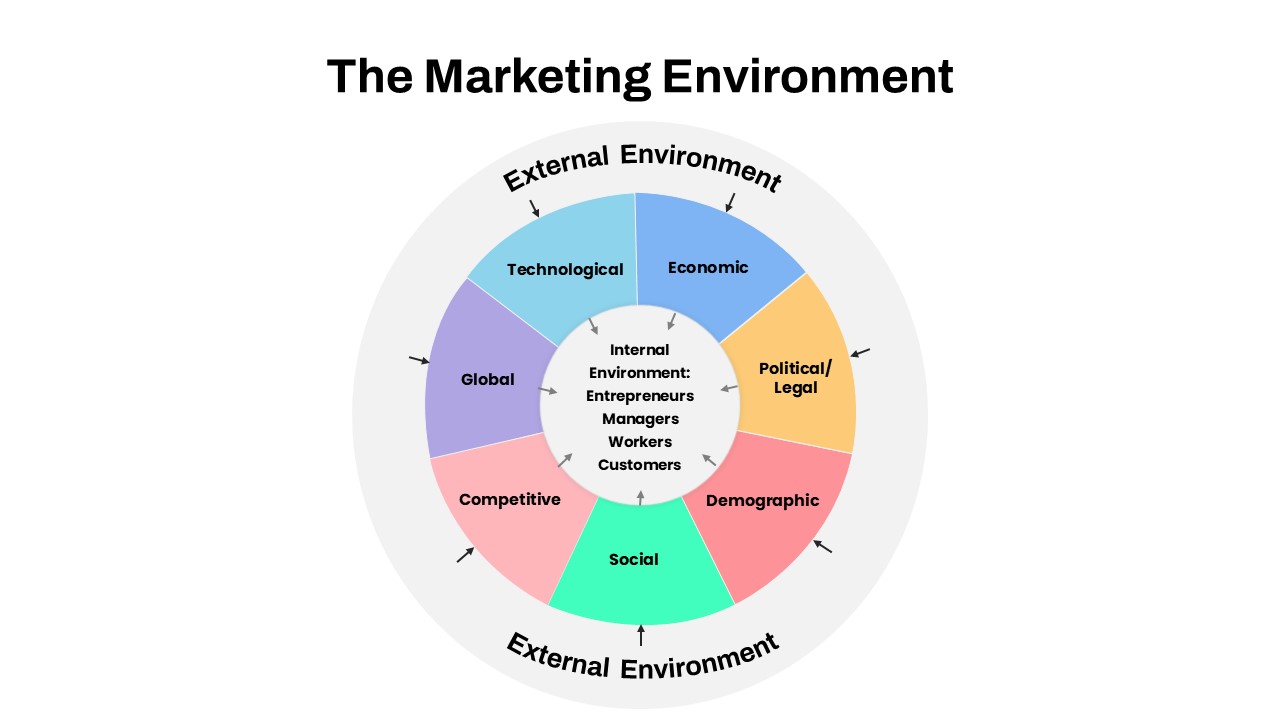
Marketing Environment Circular Diagram template for PowerPoint & Google Slides
Marketing
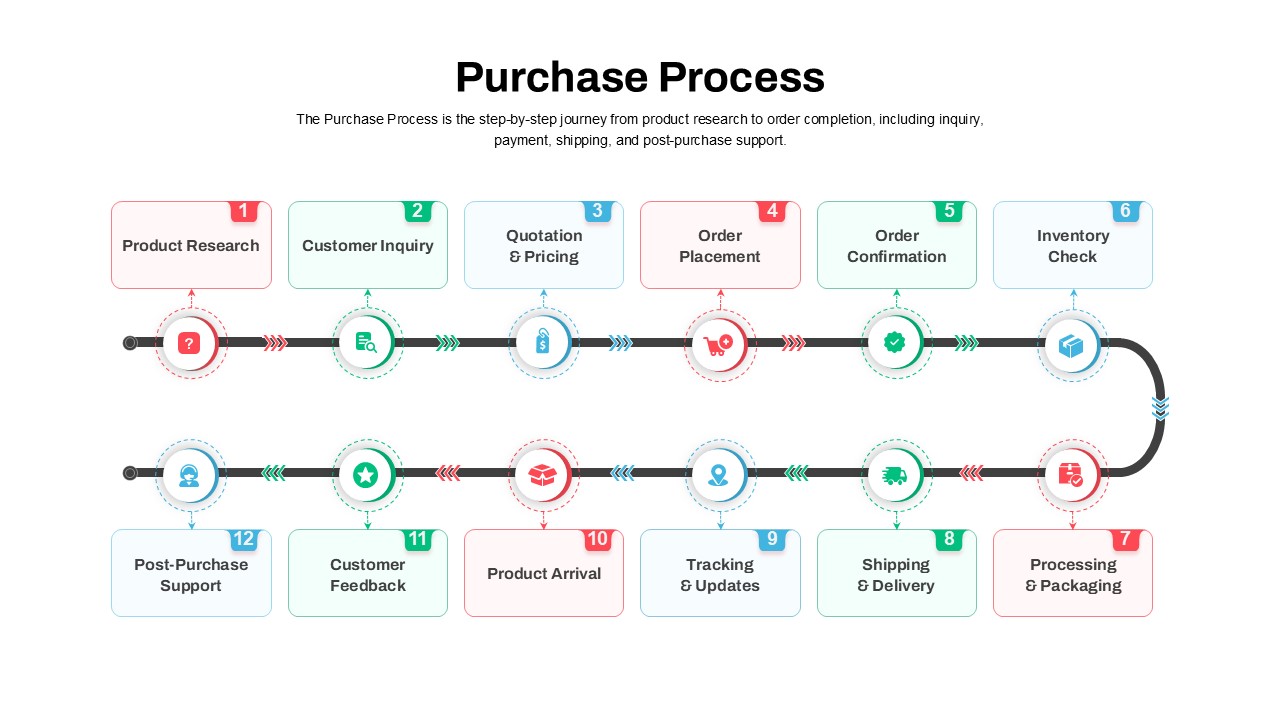
Streamlined Purchase Process Diagram Template for PowerPoint & Google Slides
Timeline