Balanced Gender Equality Scale Infographic Template for PowerPoint & Google Slides


Description
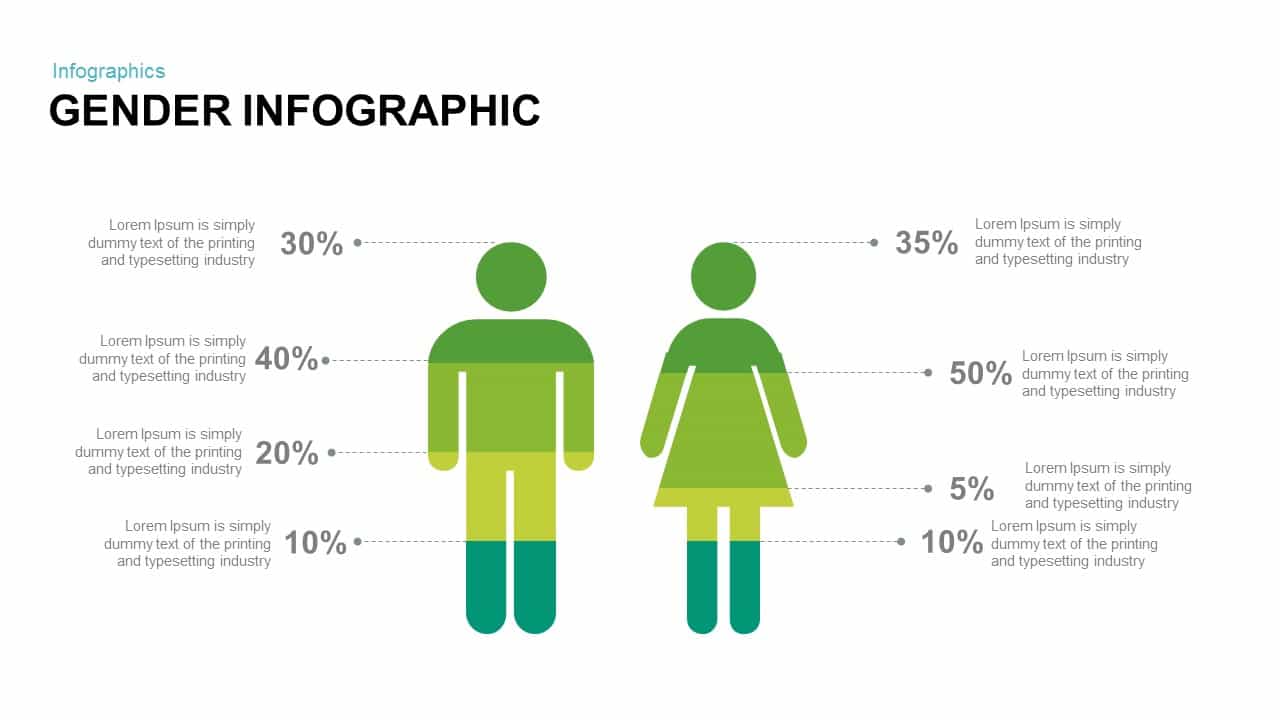
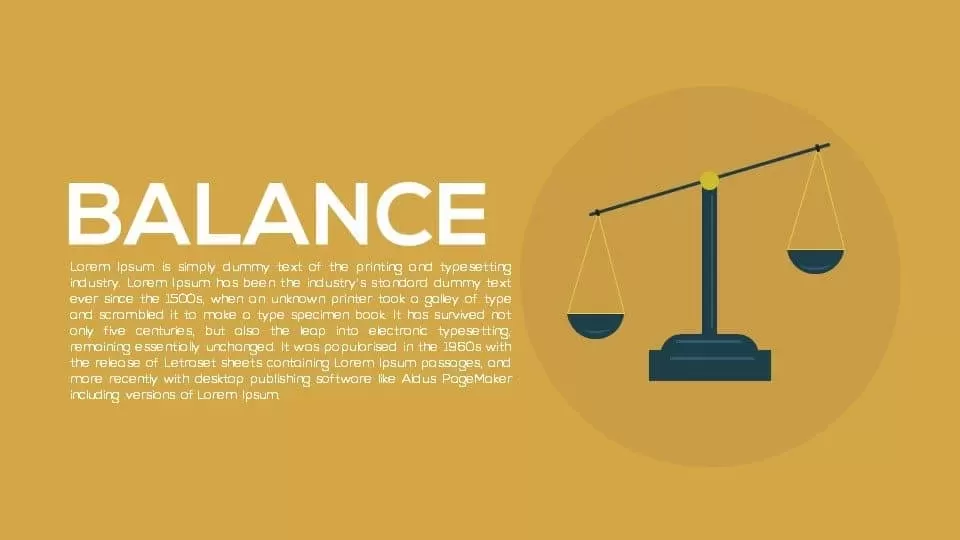
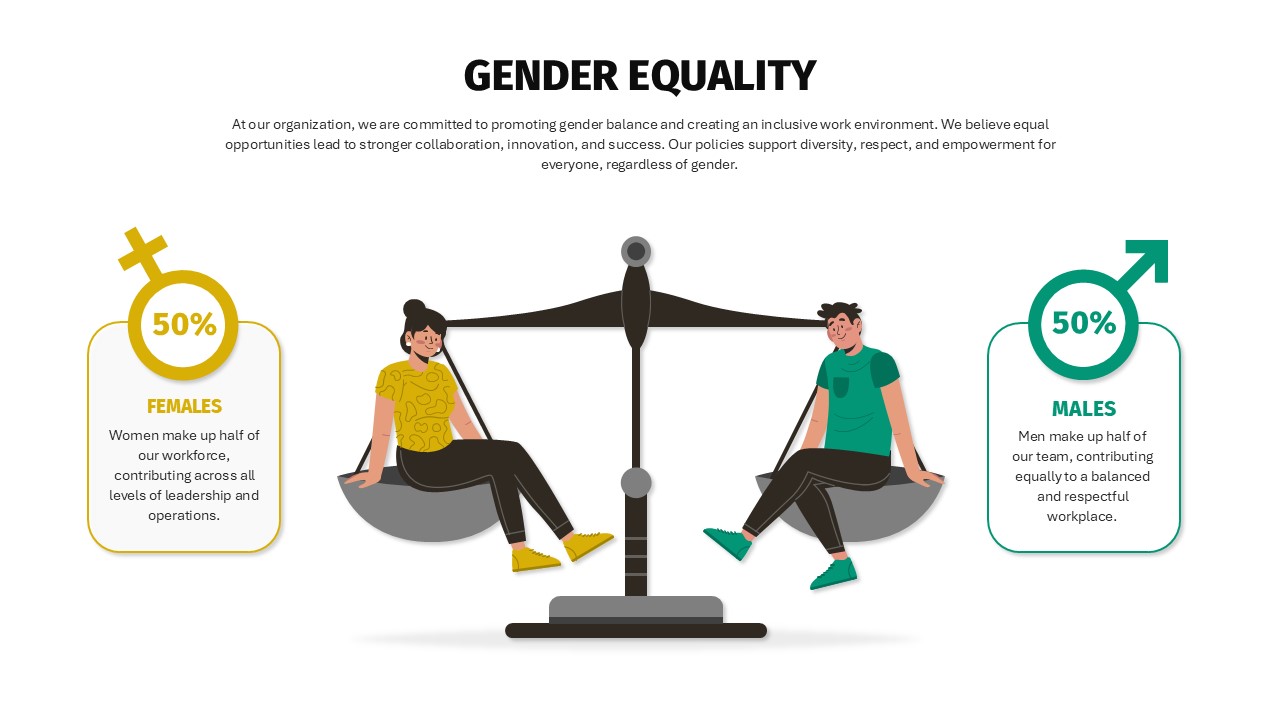
This gender equality infographic slide uses a balanced scale illustration to depict equal representation of females and males. A central scale graphic features two vector characters—one female wearing yellow accents and one male in green—perched on each pan to symbolize parity. Two matching callout boxes connect to the scale with thin accent lines, highlighting “50%” metrics inside gender symbols and customizable text below. Crisp ring accents around the symbols, minimal background whitespace, and high-contrast typography ensure clarity and modern professionalism.
Built on fully editable master slides for both PowerPoint and Google Slides, every element of this template is customizable. Swap out vector icons or replace the central scale icon with your own logo. Use the theme color settings to implement custom palettes instantly across callouts, ring accents, and text. Vector shapes maintain perfect sharpness at any zoom level, and locked aspect ratios preserve alignment when resizing or exporting to PDF or high-resolution images.
Preconfigured entrance animations guide audience focus—each callout and character panel can fade or fly in sequentially, enhancing narrative flow (PowerPoint only). Animations can be disabled for static displays or print materials. Alternative slide variants let you reposition callouts on opposite sides or change the number of segments to adapt the layout for additional categories, such as age or role comparisons. The neutral white background pairs seamlessly with light or dark theme variations.
This infographic integrates seamlessly into larger corporate or HR decks, preserving master layouts for global edits. Copy and paste directly between presentations without losing formatting. Real-time collaboration is supported via shareable Google Slides links, and exports include .pptx, .pdf, or image formats. Spacing and margin settings ensure consistent appearance when printing handouts or embedding in reports. Customize fonts, sizes, and labels to align with brand guidelines and stakeholder requirements.
Who is it for
HR managers, diversity & inclusion officers, and corporate communications teams will leverage this infographic to report gender parity metrics during board meetings, annual diversity reviews, or training sessions. Recruiters, consultants, and policy advocates can also use the balanced scale visualization to support hiring initiatives and workplace equity discussions.
Other Uses
Beyond gender equality, repurpose this slide to illustrate parity in age distribution, role allocation, or department staffing levels. Adapt the balanced scale diagram for benchmarking diversity metrics across ethnicity, tenure, or performance categories. Use it as a comparison tool in training workshops, survey presentations, or investor briefings.
Login to download this file

Item ID
SB04874
Related Templates

Gender Comparison People Infographic Template for PowerPoint & Google Slides
Comparison
Gender Infographic for PowerPoint & Google Slides
Infographics
Year-over-Year Stacked Gender Bar Chart Template for PowerPoint & Google Slides
Bar/Column
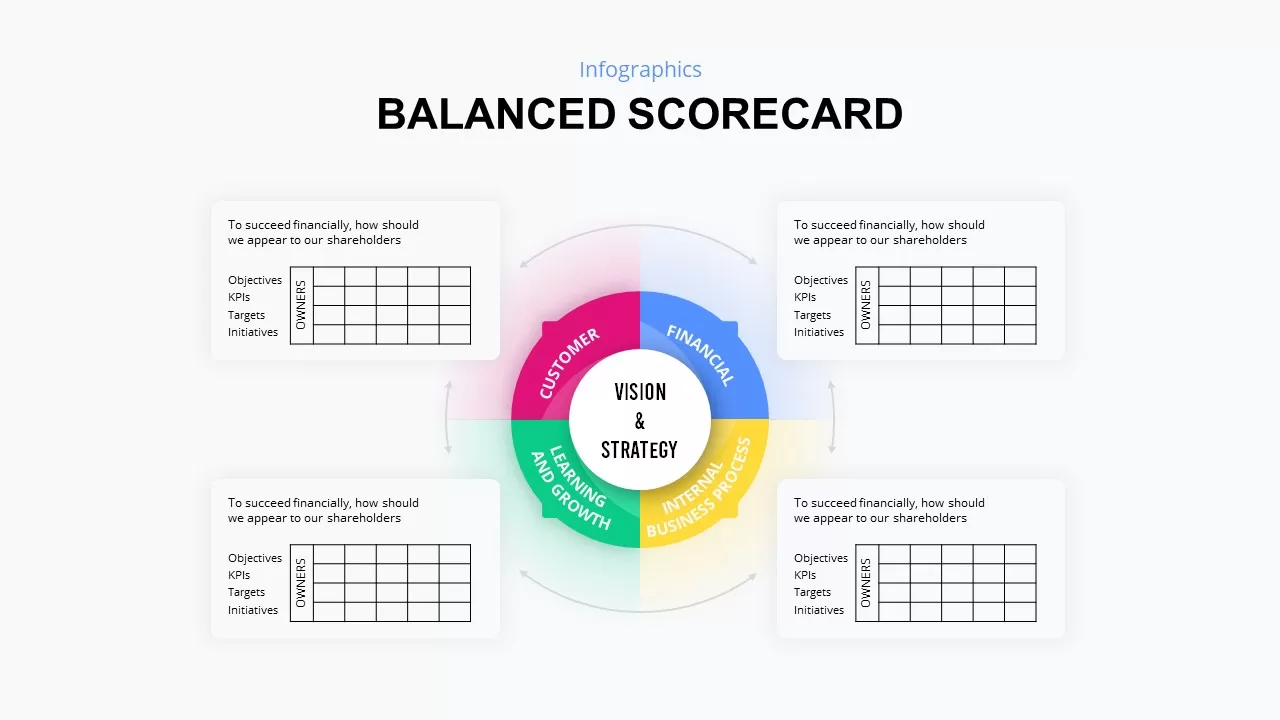
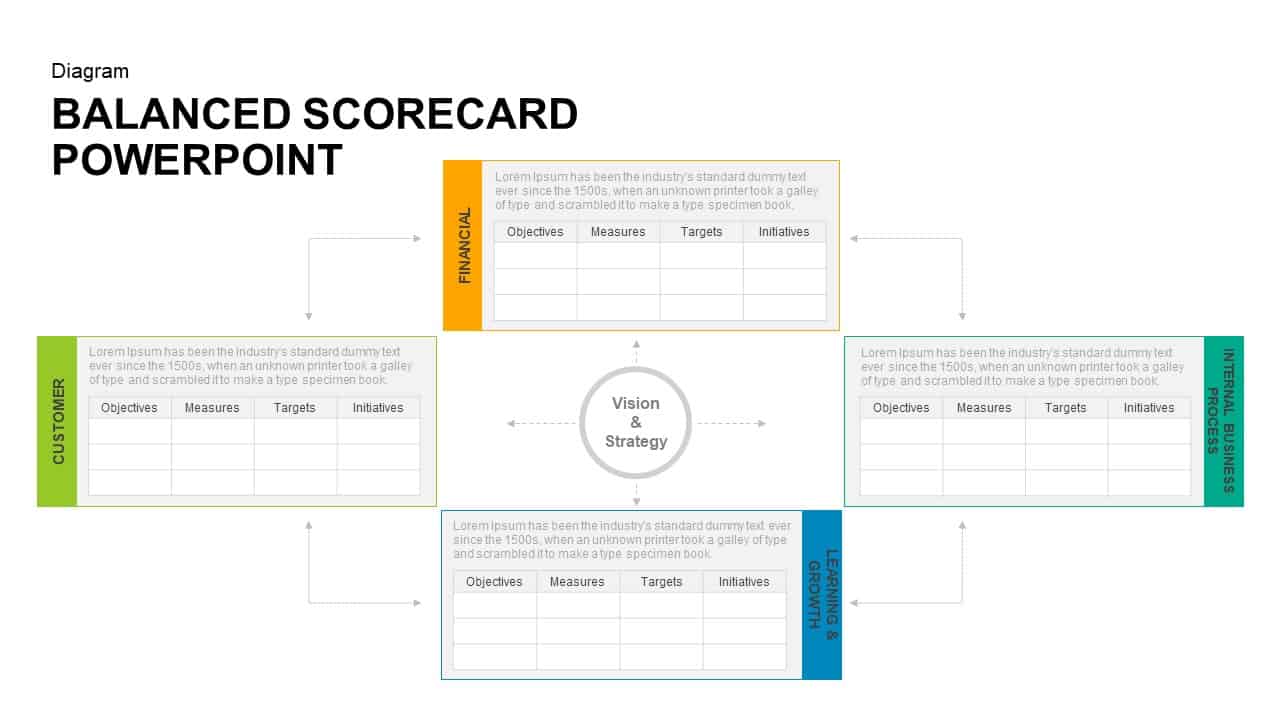
Circular Balanced Scorecard Infographic Template for PowerPoint & Google Slides
Business Strategy
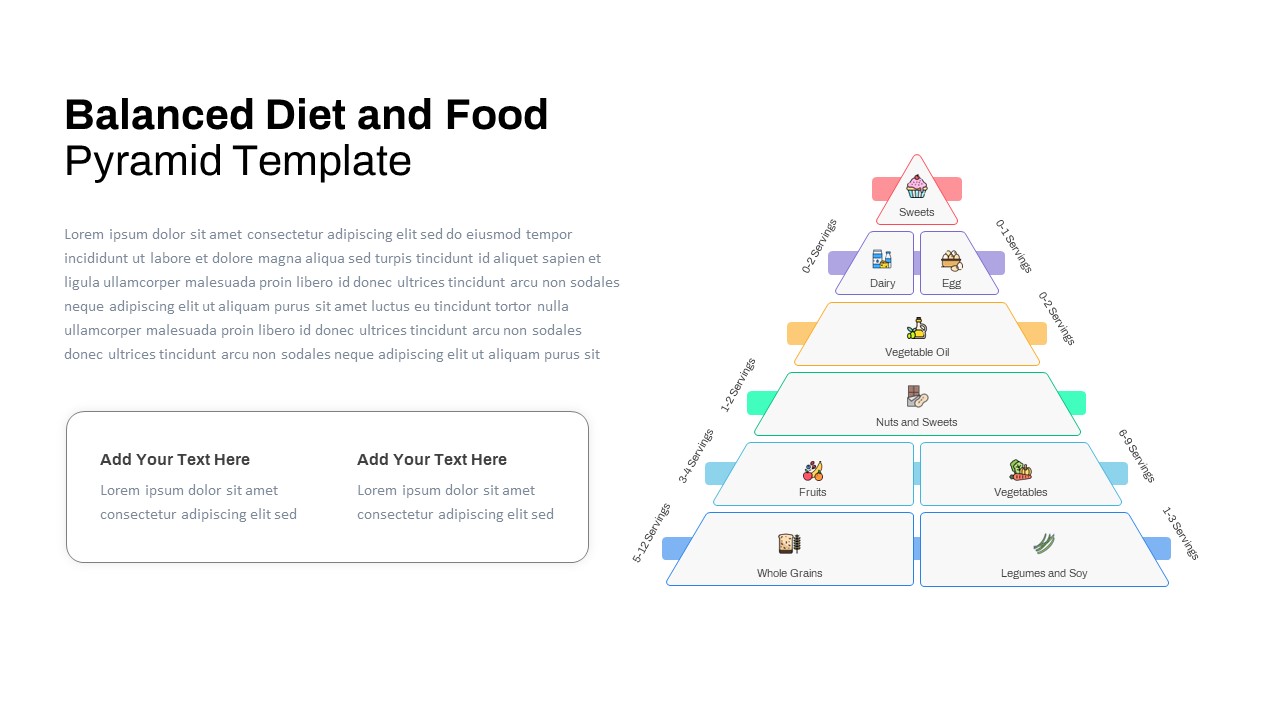
Free Balanced Diet and Food Pyramid Template for PowerPoint & Google Slides
Pyramid
Free
Free Balanced Scorecard Quadrant KPI Layout Template for PowerPoint & Google Slides
Employee Performance
Free
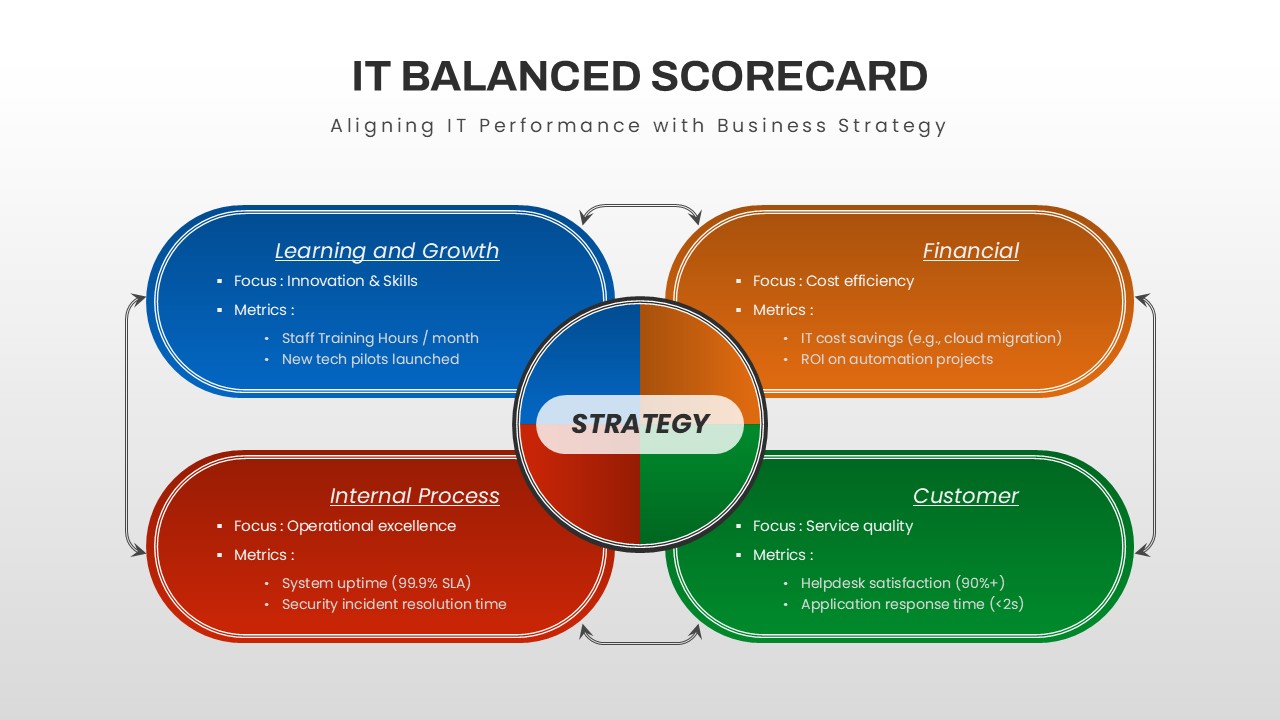
IT Balanced Scorecard Strategy Framework Template for PowerPoint & Google Slides
Business Strategy
Balanced Scorecard Diagram for PowerPoint & Google Slides
Goals
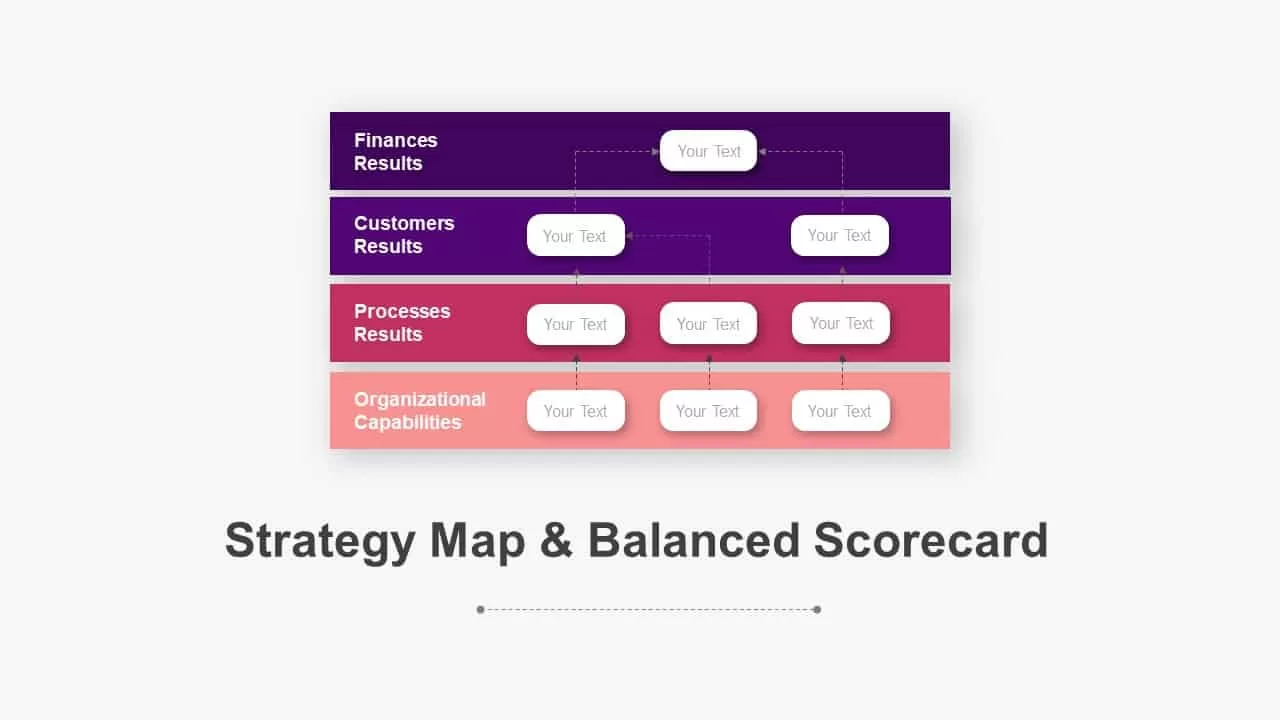
Balanced Scorecard Strategy Map Diagram Pack for PowerPoint & Google Slides
Business Strategy
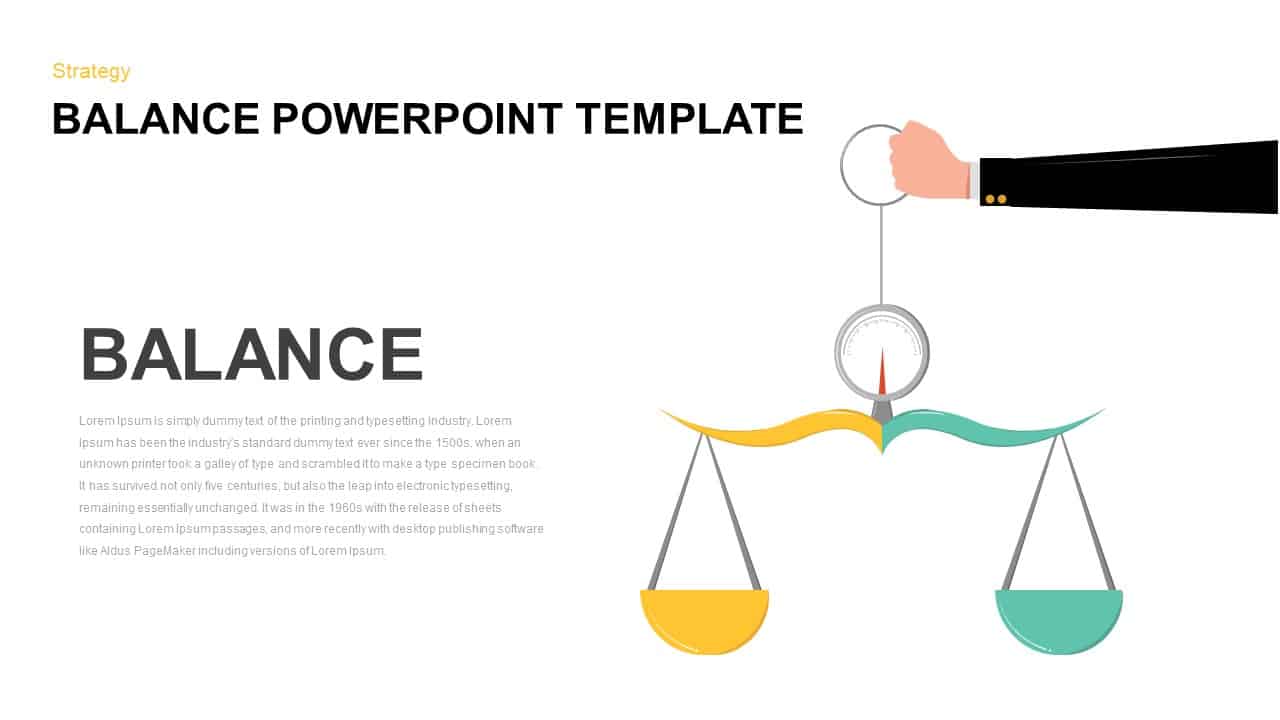
Balance Scale Visualization Infographic Template for PowerPoint & Google Slides
Comparison
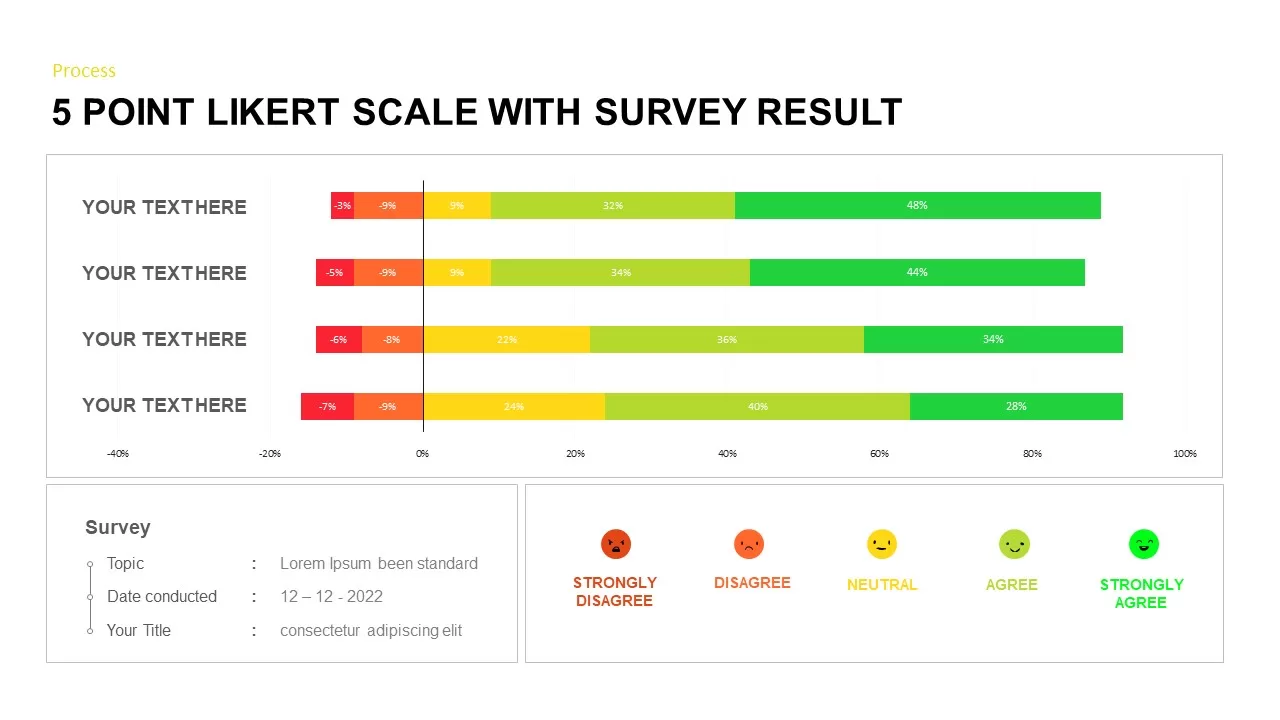
Likert Scale Survey Results infographic pack for PowerPoint & Google Slides
Business
Emoji Scale PowerPoint Diagram for PowerPoint & Google Slides
Infographics

Scale Metaphor Metrics Comparison Template for PowerPoint & Google Slides
Charts
Mustard and Navy Balance Scale Metaphor Template for PowerPoint & Google Slides
Comparison
IQ Scale Analysis Diagram template for PowerPoint & Google Slides
Employee Performance
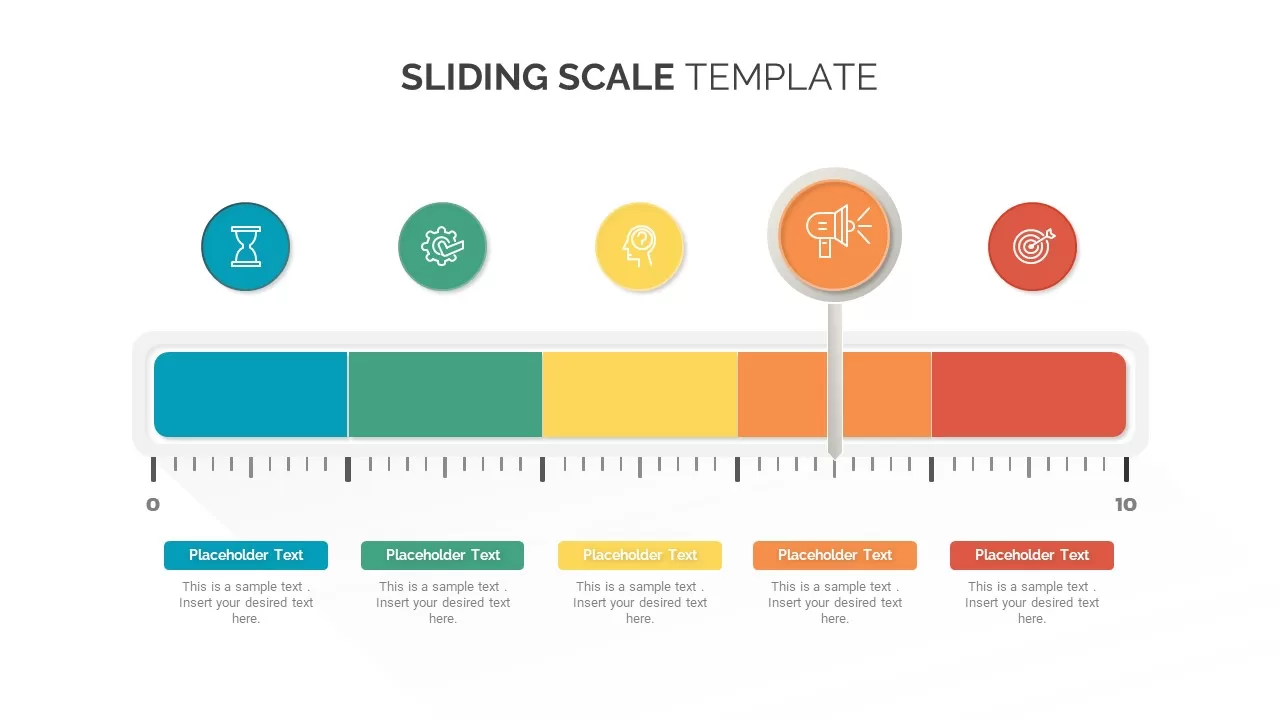
Sliding Scale template for PowerPoint & Google Slides
Business
Adam’s Equity Theory Scale Comparison Template for PowerPoint & Google Slides
Comparison
Economies of Scale Cost Curve Comparison Template for PowerPoint & Google Slides
Comparison Chart
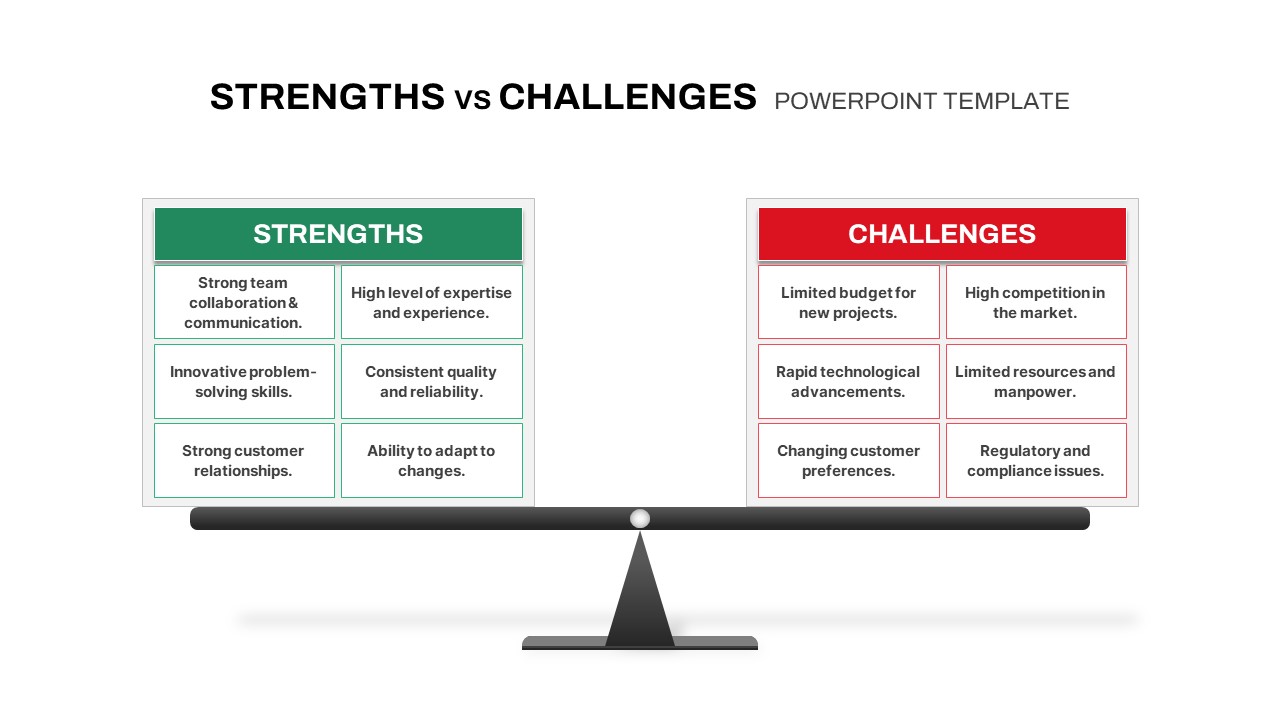
Strengths vs Challenges Weighing Scale Template for PowerPoint & Google Slides
Opportunities Challenges
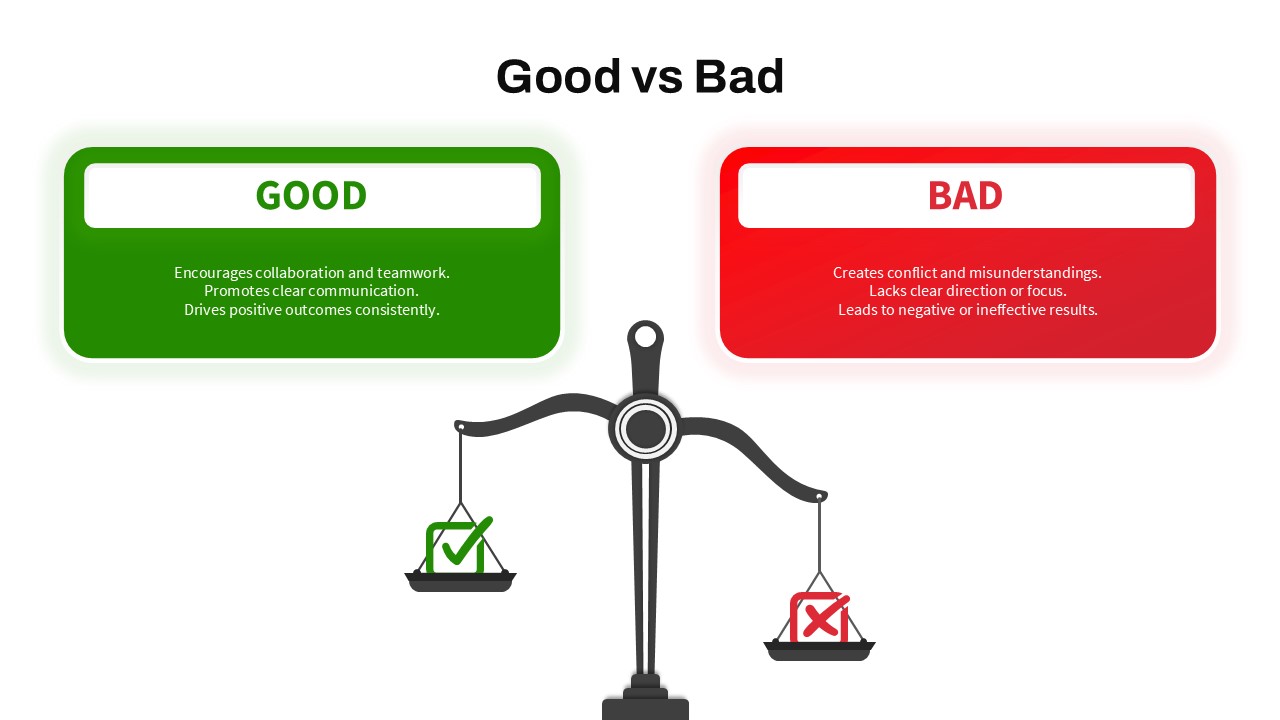
Good vs Bad Comparison with Scale Template for PowerPoint & Google Slides
Comparison
Five-Point Rating Scale Feedback Template for PowerPoint & Google Slides
Employee Performance
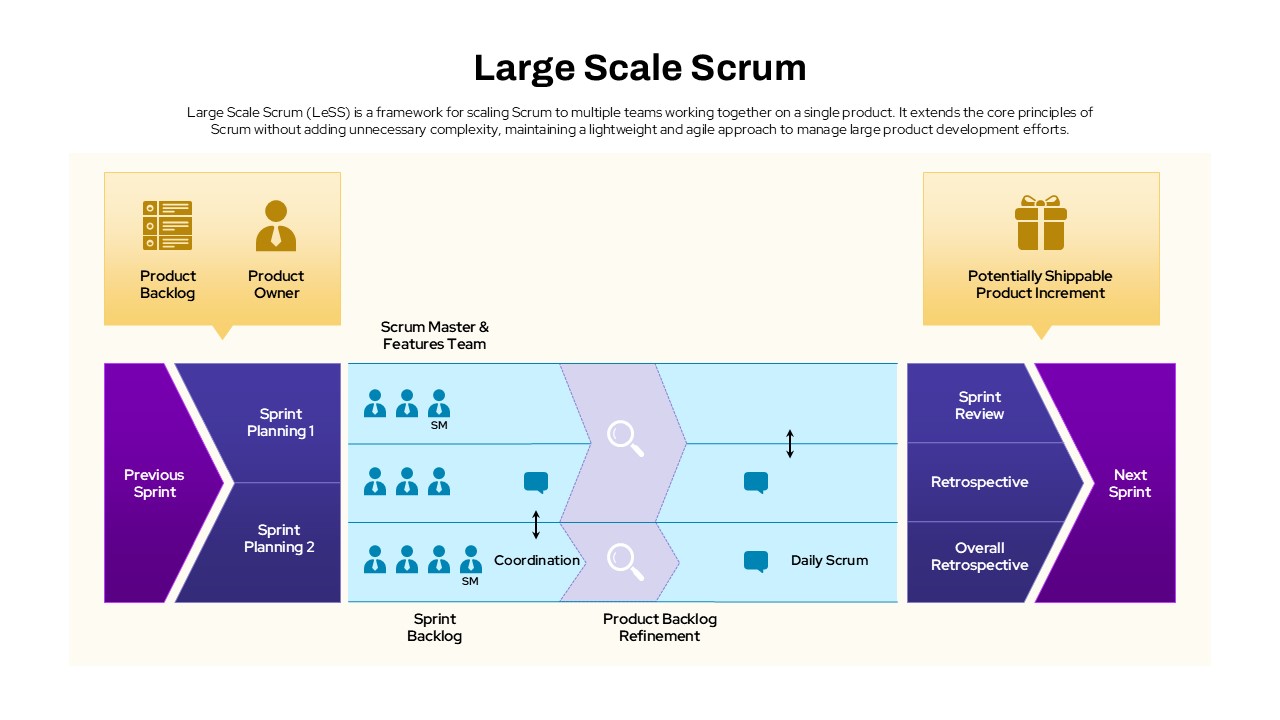
Large Scale Scrum Framework Process Template for PowerPoint & Google Slides
Scrum
Google Ads Optimization & Performance Infographic Template for PowerPoint & Google Slides
Digital Marketing
SQ3R Study Strategy Infographic Slides Template for PowerPoint & Google Slides
Business Strategy
Six Double Diamond Infographic Slides Template for PowerPoint & Google Slides
Process

Sales Process Infographic Slides Pack Template for PowerPoint & Google Slides
Process
Casino/Poker Chips Infographic Slides template for PowerPoint & Google Slides
Business Strategy
Agenda Infographic Pack of 2 Slides Template for PowerPoint & Google Slides
Agenda
Quad Chart Infographic Pack of 8 Slides Template for PowerPoint & Google Slides
Comparison Chart
Four Options Infographic Slides Template for PowerPoint & Google Slides
Comparison
Game Plan Infographic Slides Pack Template for PowerPoint & Google Slides
Infographics
Teamwork PowerPoint Infographic Template for PowerPoint & Google Slides
Leadership
Kite Infographic PowerPoint Template for PowerPoint & Google Slides
Process
Cladogram Infographic Di Template for PowerPoint & Google Slides Template
Decision Tree
Workflow PowerPoint Process infographic for PowerPoint & Google Slides
Process
Free Infographic Deck PowerPoint Pack for PowerPoint & Google Slides
Infographics
Free
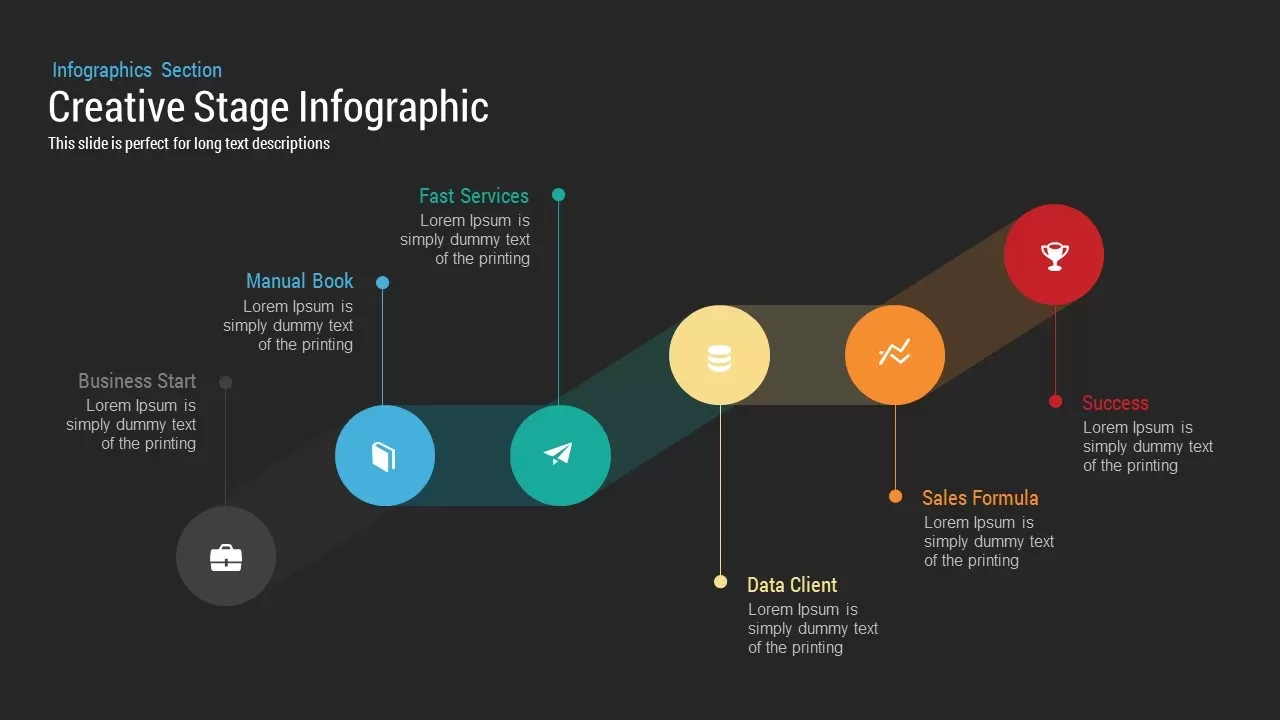
Stage Infographic template for PowerPoint & Google Slides
Process
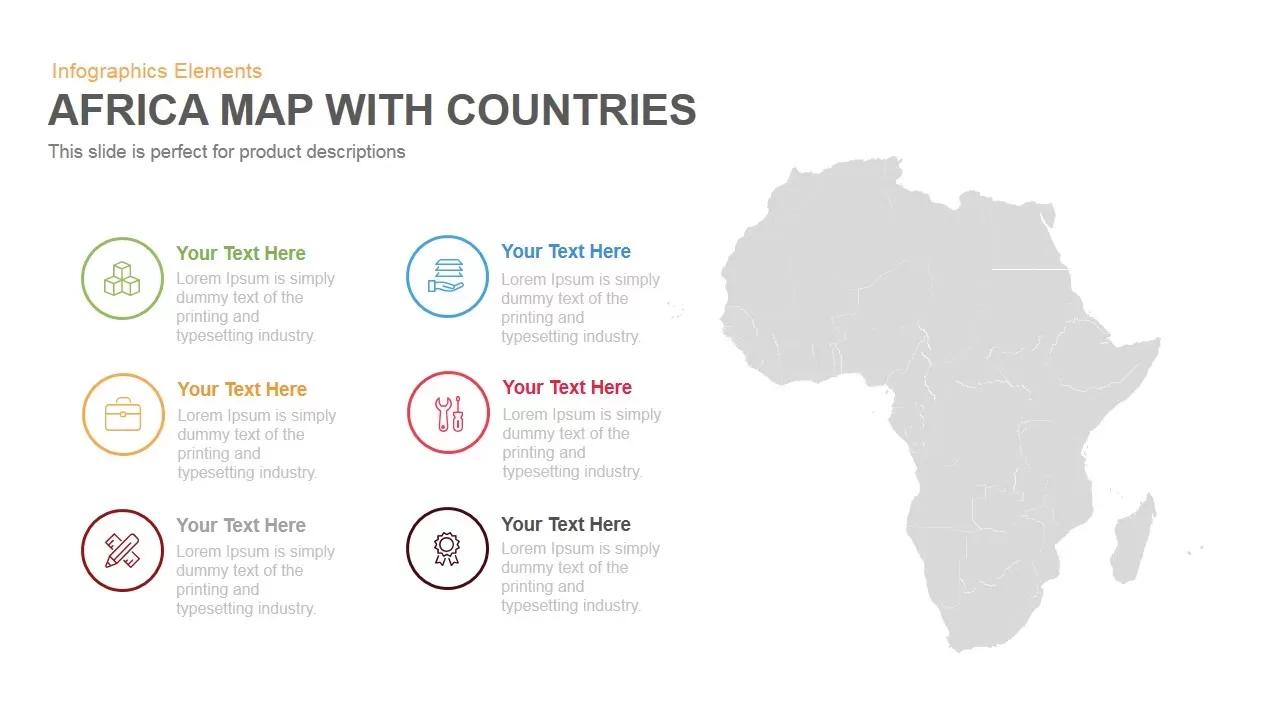
Africa Country Map Infographic Template for PowerPoint & Google Slides
World Maps
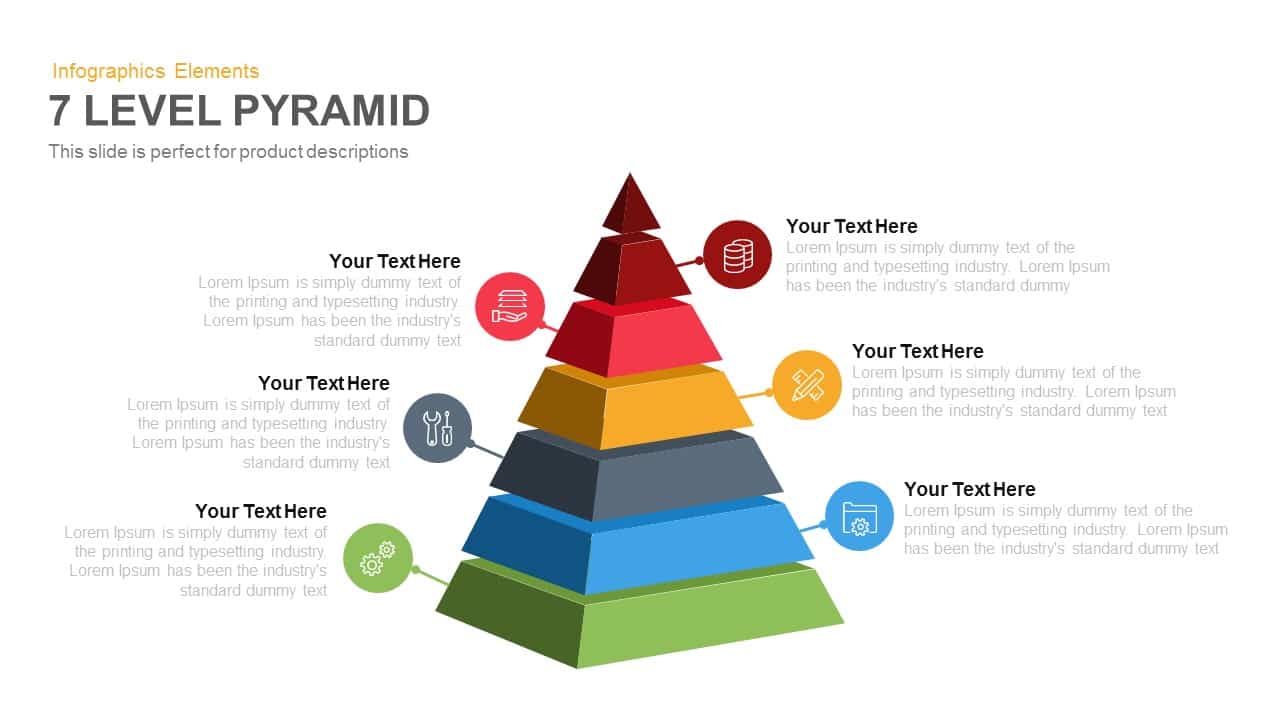
7-Level 3D Pyramid Infographic Diagram Template for PowerPoint & Google Slides
Pyramid
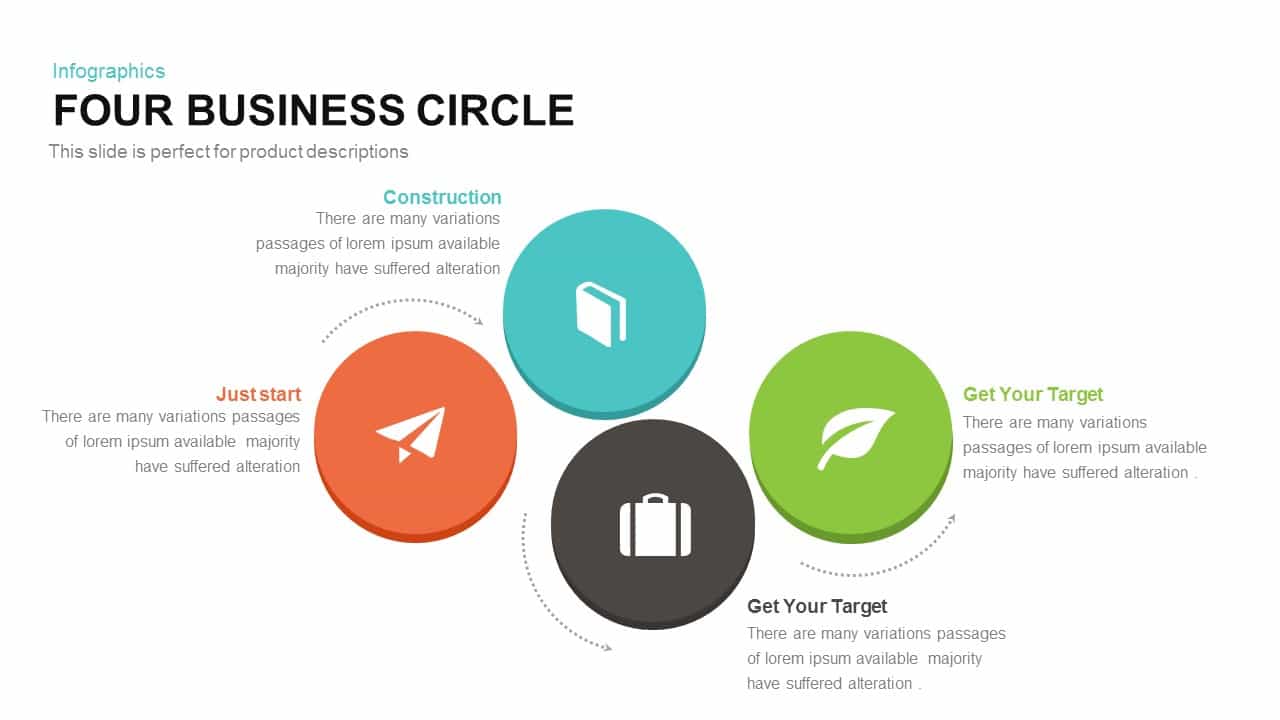
Four-Circle Business Process Infographic Template for PowerPoint & Google Slides
Circular

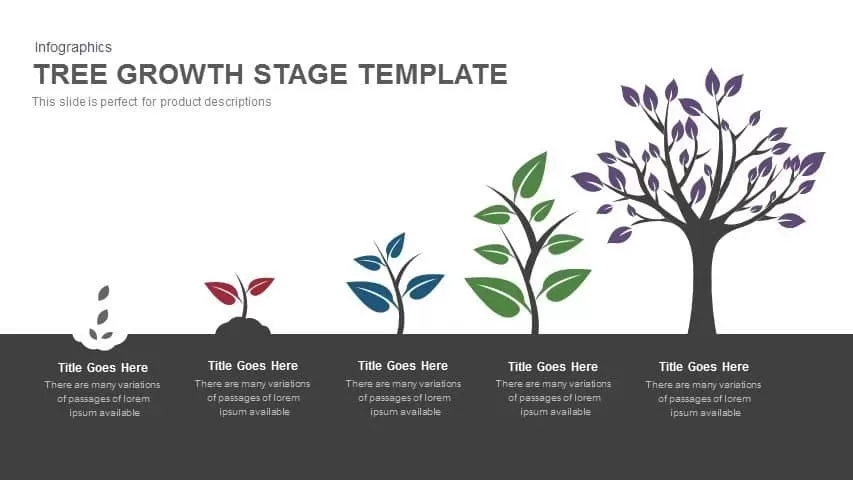
Tree Growth Stage Infographic Template for PowerPoint & Google Slides
Timeline
Three-Circle Diagram Infographic Template for PowerPoint & Google Slides
Circular
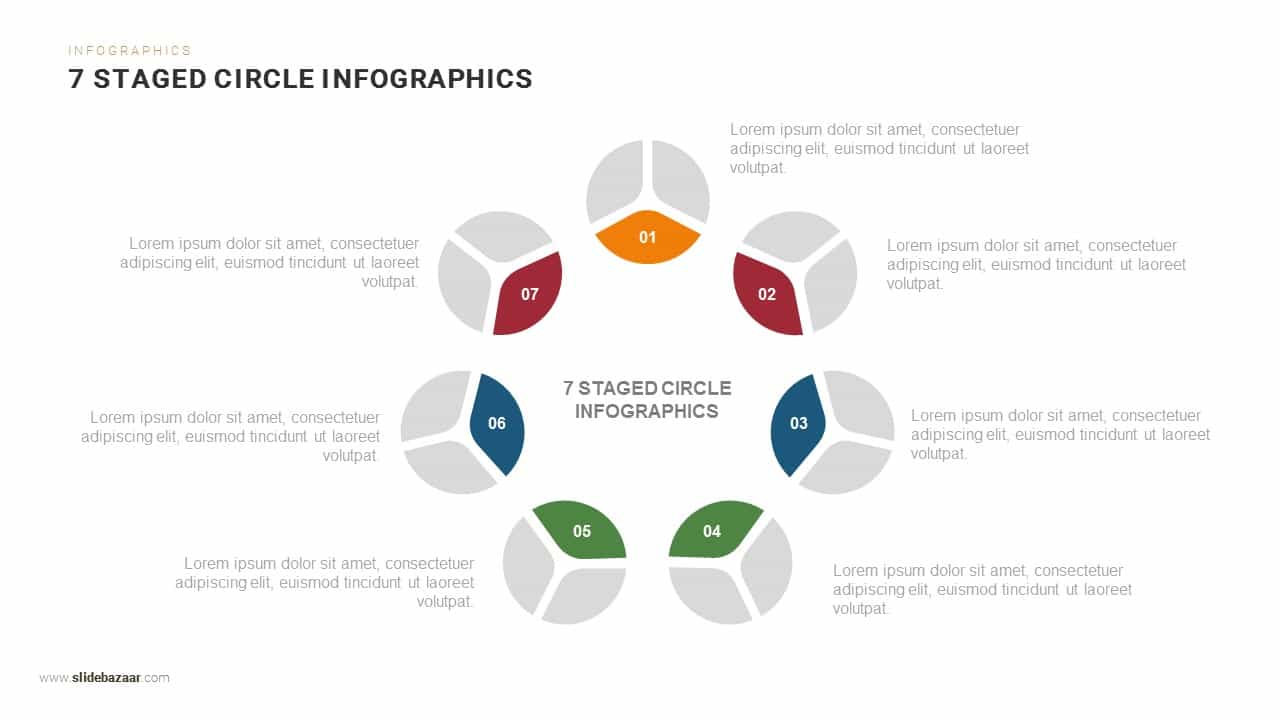
Seven-Stage Circular Infographic Template for PowerPoint & Google Slides
Circular
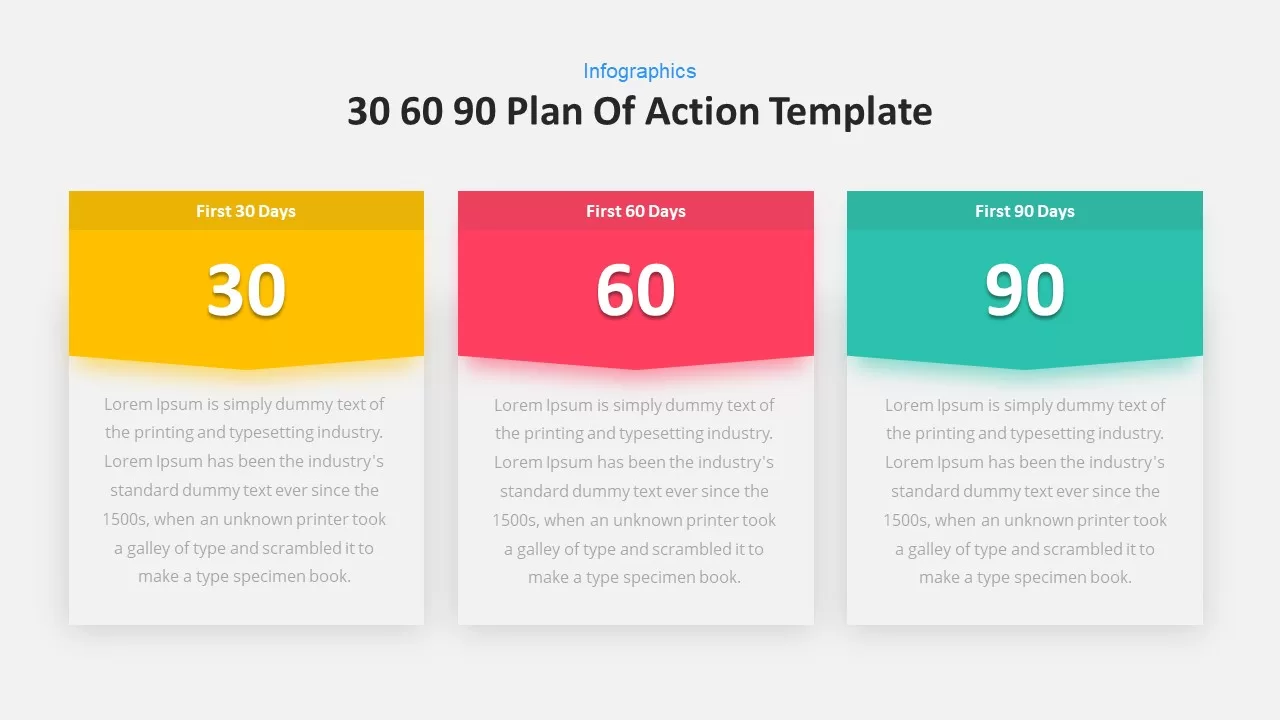
30 60 90-Day Plan Infographic Slide Template for PowerPoint & Google Slides
Business
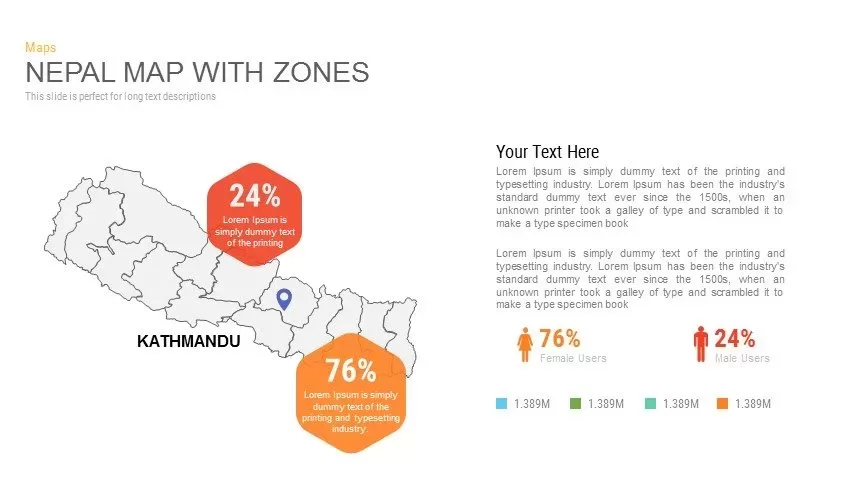
Nepal Map with Zones Infographic Template for PowerPoint & Google Slides
Maps
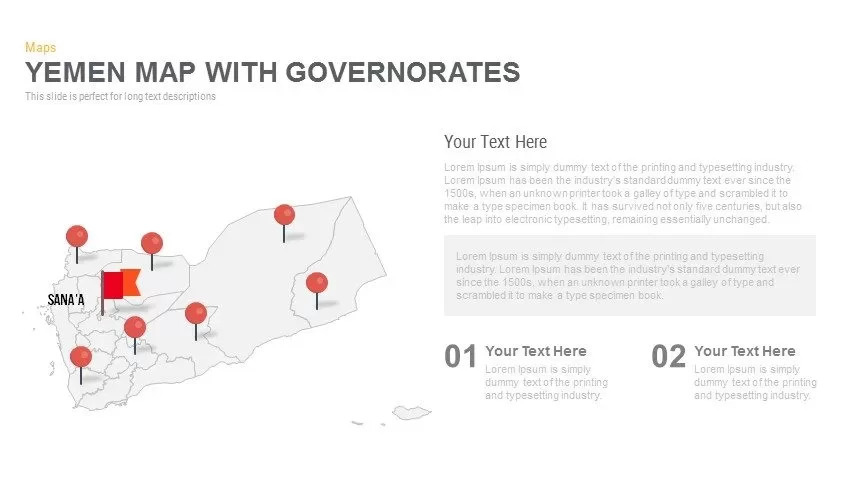
Yemen Governorates Infographic Map Template for PowerPoint & Google Slides
Maps
Five-Stage Growth Arrow Infographic Template for PowerPoint & Google Slides
Arrow
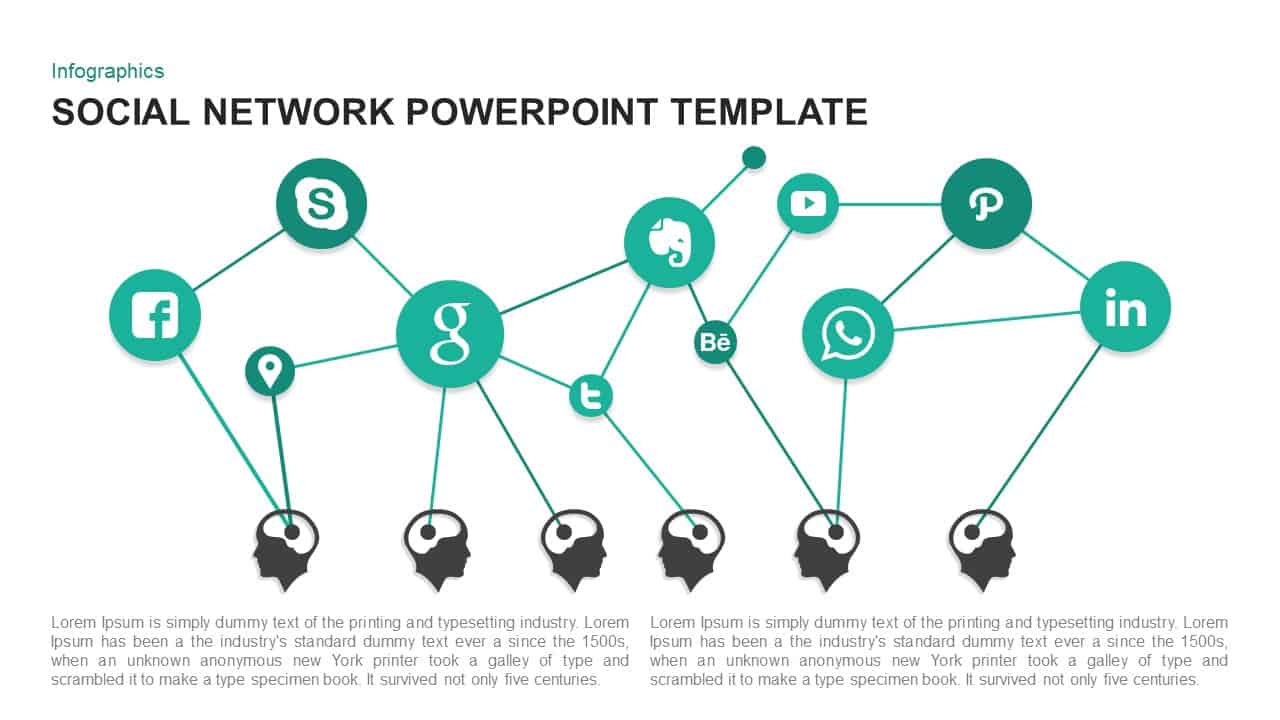
Social Network Infographic Diagram Template for PowerPoint & Google Slides
Digital Marketing
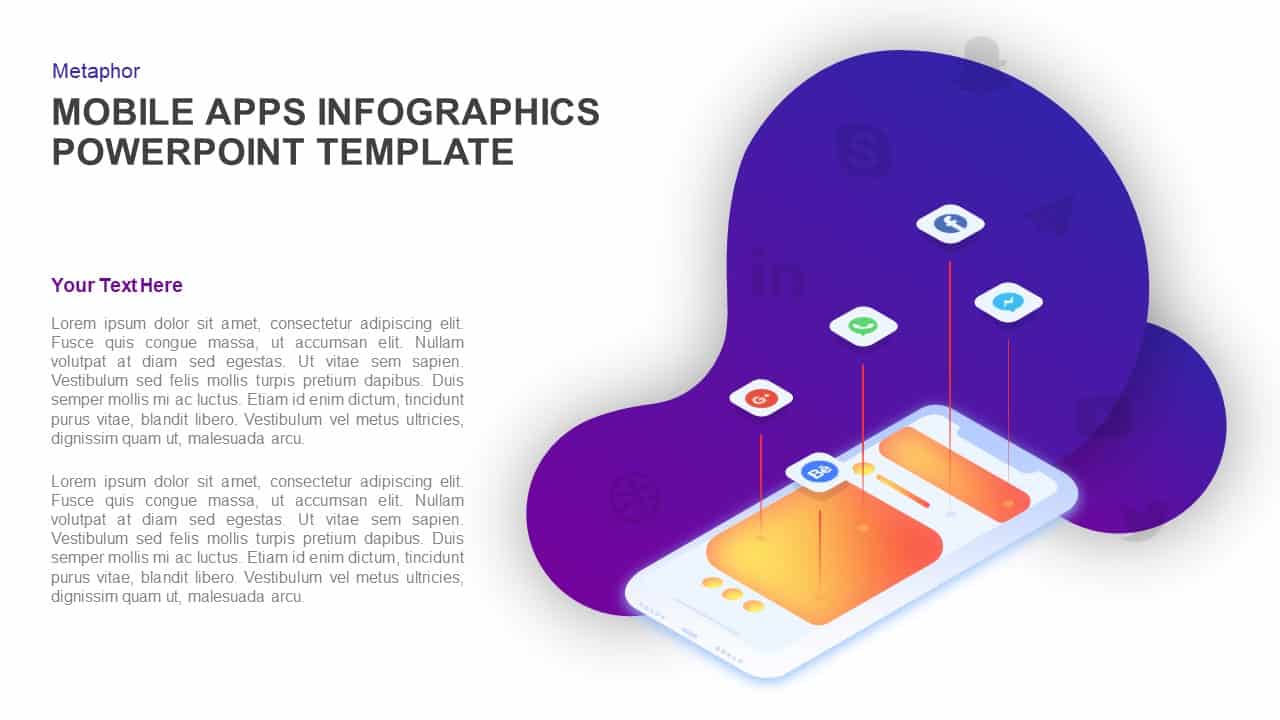
Mobile Apps Infographic Interface Template for PowerPoint & Google Slides
Software Development
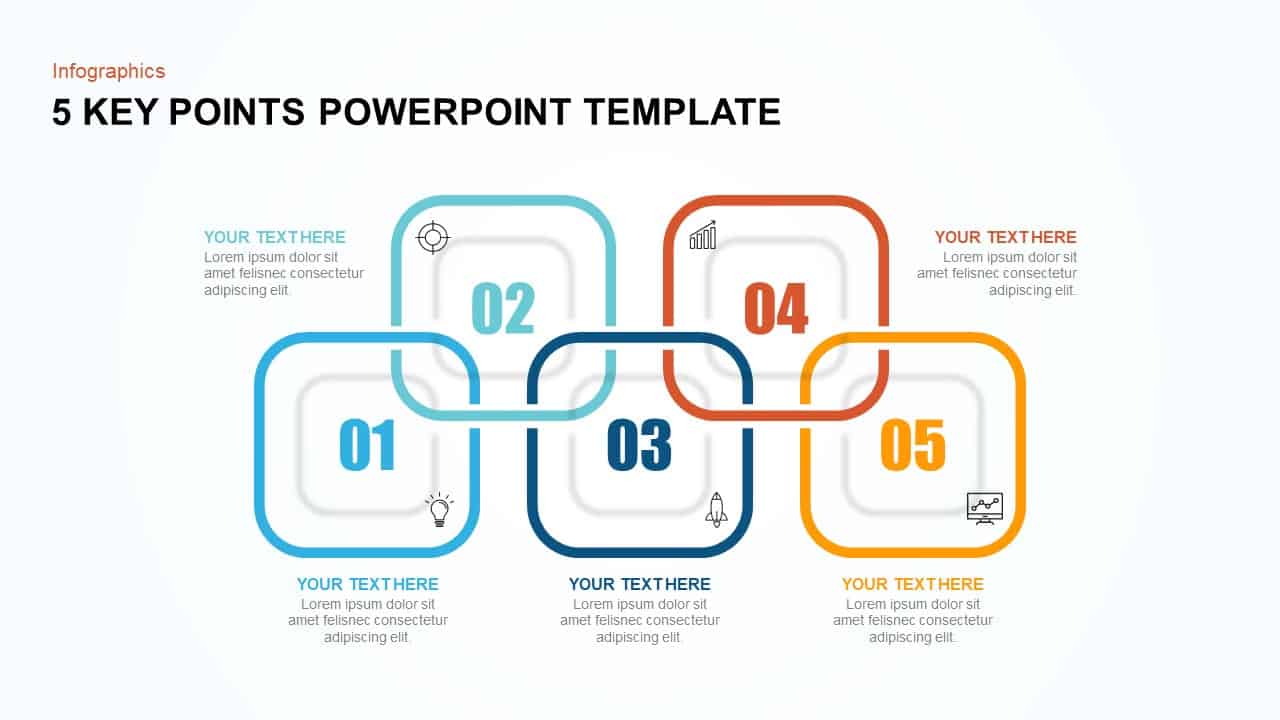
5 Key Points Infographic Diagram Template for PowerPoint & Google Slides
Process
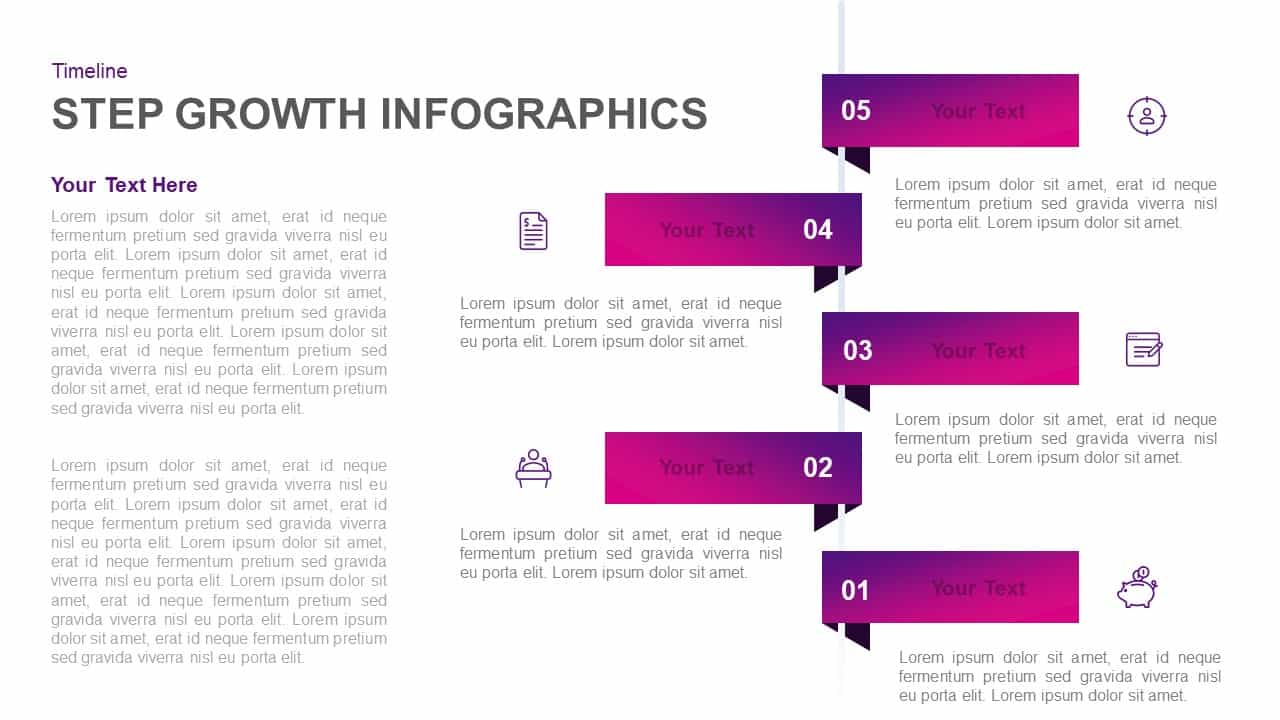
Five-Step Growth Timeline Infographic Template for PowerPoint & Google Slides
Timeline
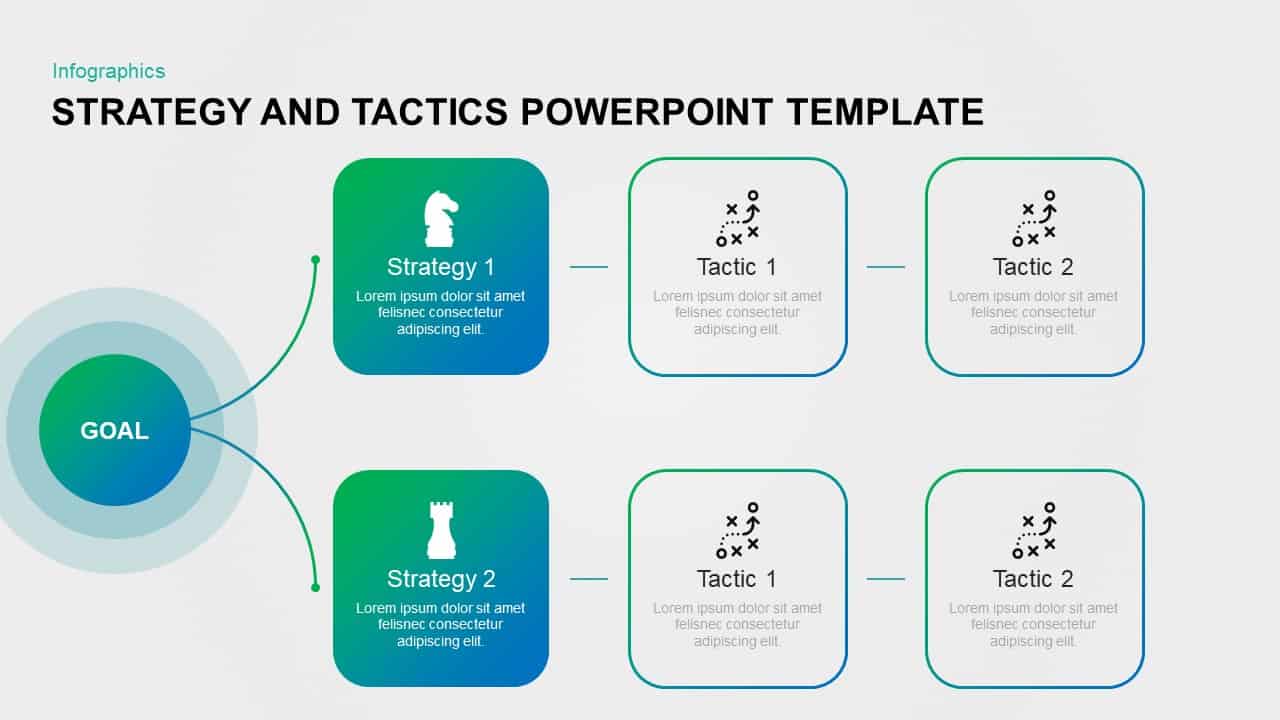
Strategy and Tactics Infographic Template for PowerPoint & Google Slides
Process
Two-Column Comparison Infographic Slide Template for PowerPoint & Google Slides
Comparison
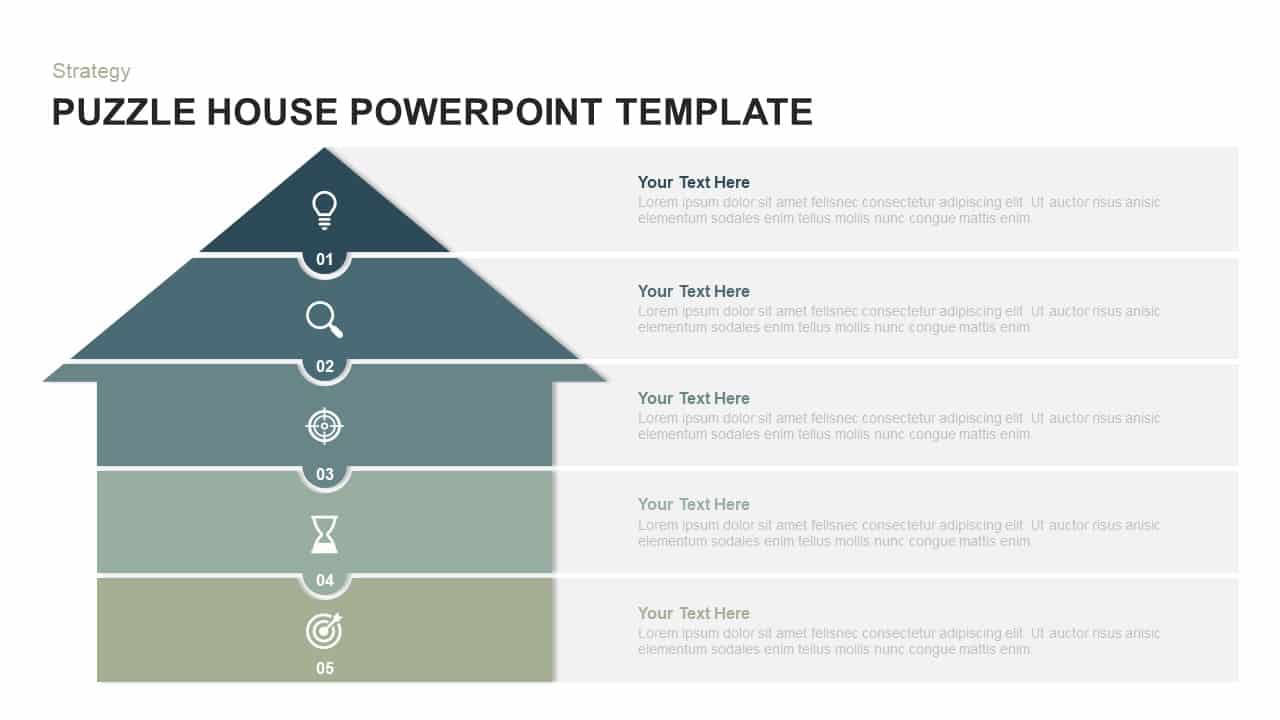
Five-Level Puzzle House Infographic Template for PowerPoint & Google Slides
Pyramid
Four-Stage Funnel Diagram Infographic Template for PowerPoint & Google Slides
Funnel
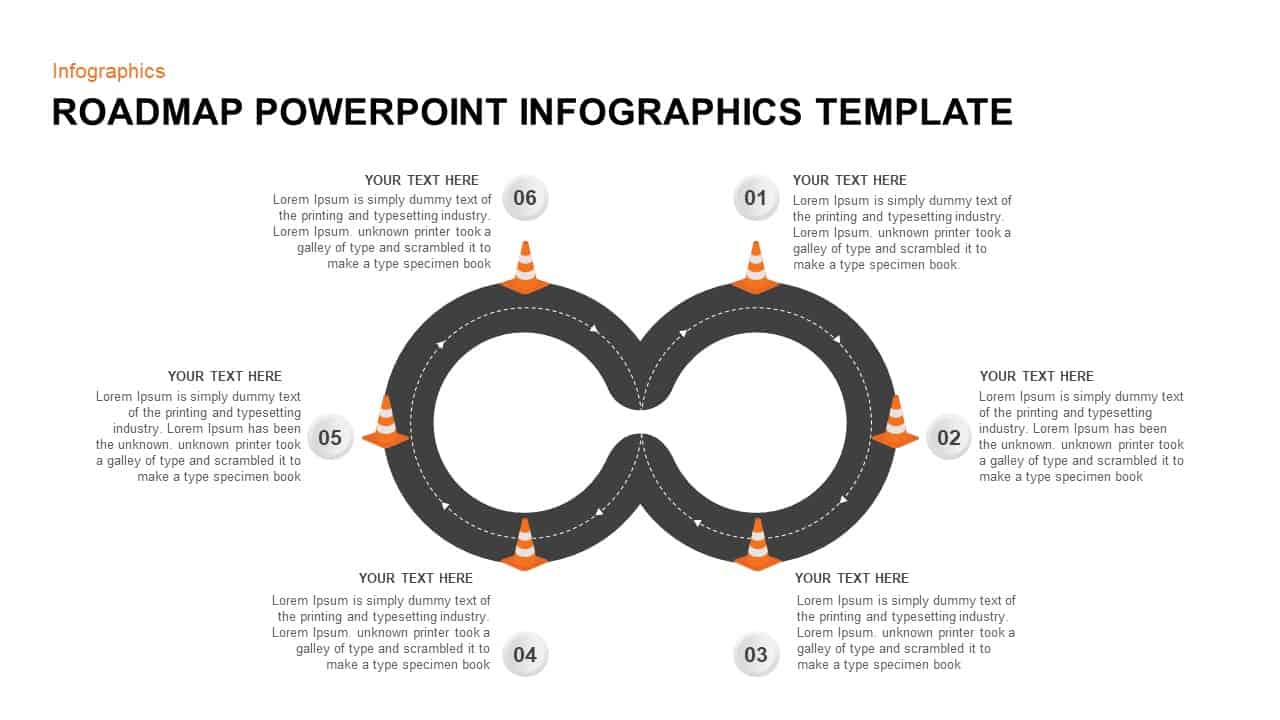
Six-Step Roadmap Infographic Template for PowerPoint & Google Slides
Roadmap
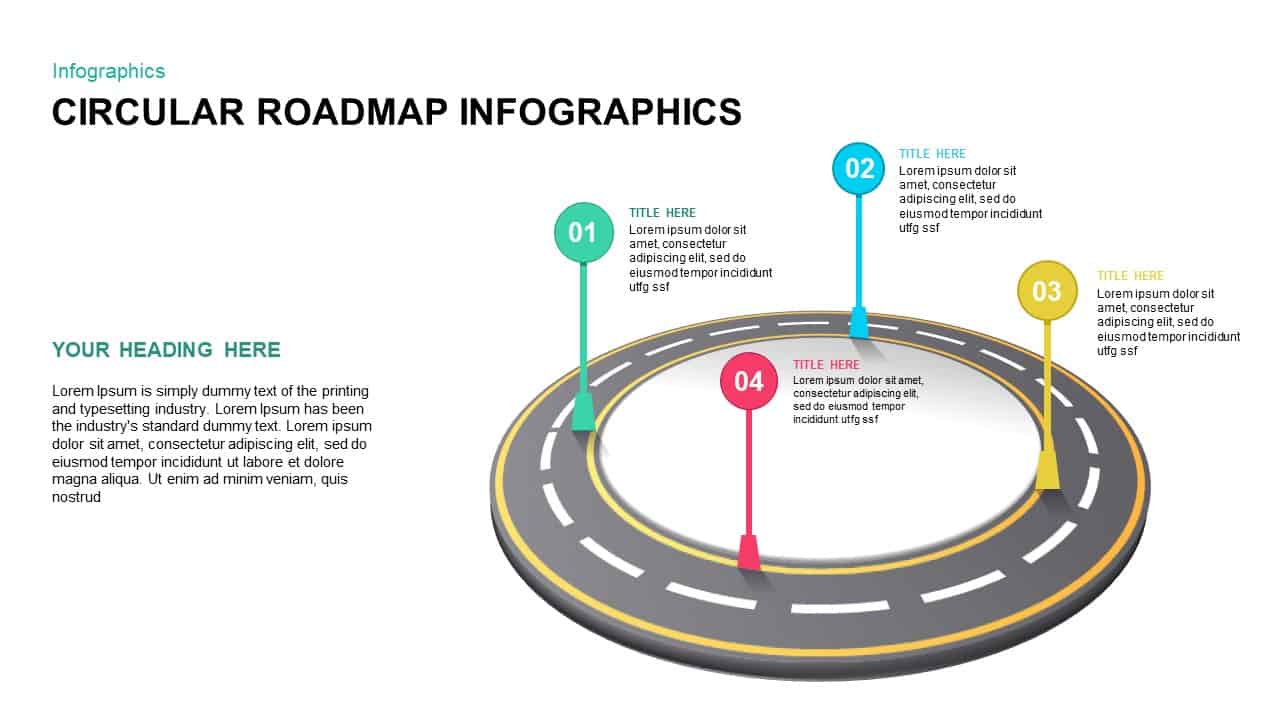
4-Step Circular Roadmap Infographic Template for PowerPoint & Google Slides
Roadmap
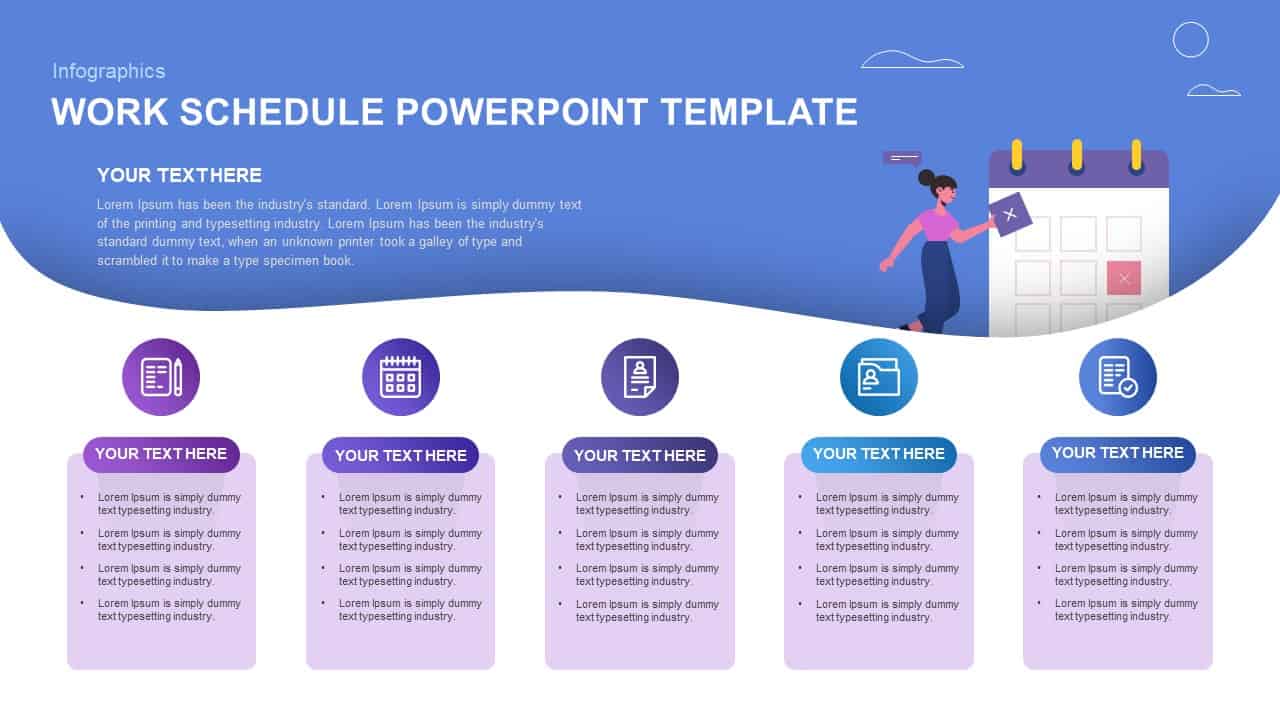
Work Schedule Agenda Infographic Template for PowerPoint & Google Slides
Agenda
Four-Stage Funnel Diagram Infographic Template for PowerPoint & Google Slides
Funnel
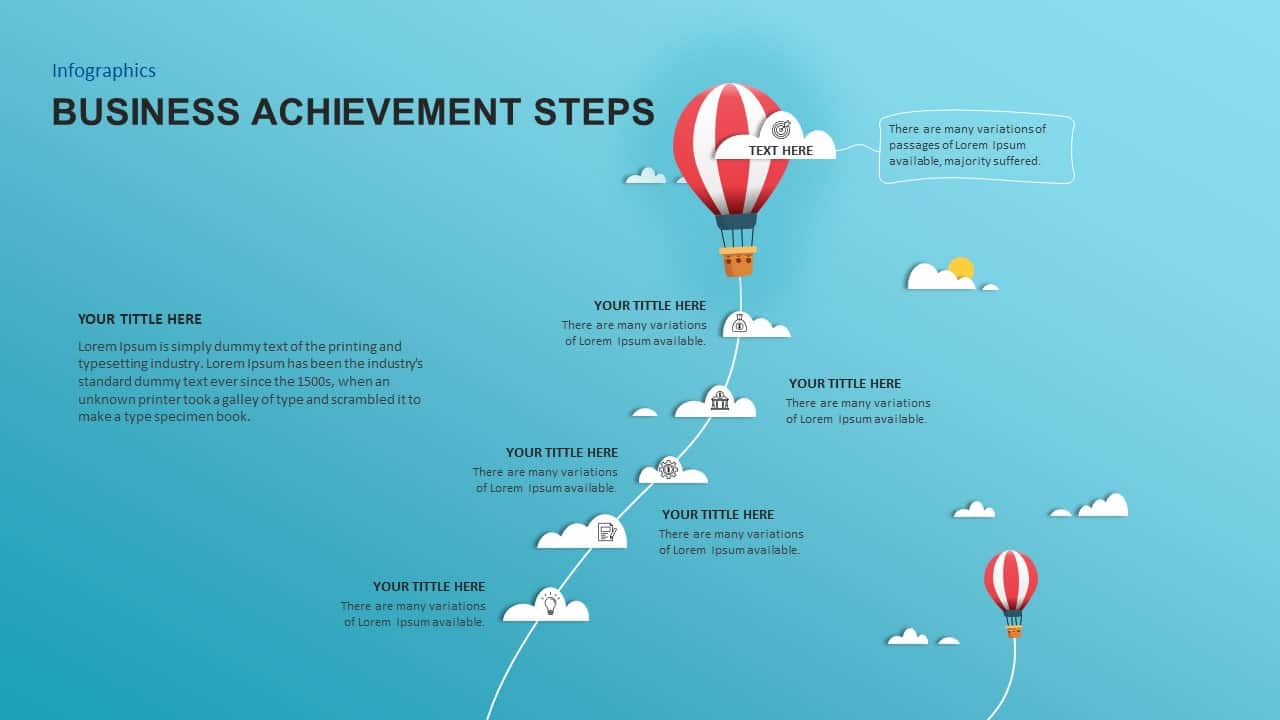
Business Achievement Steps Infographic template for PowerPoint & Google Slides
Process
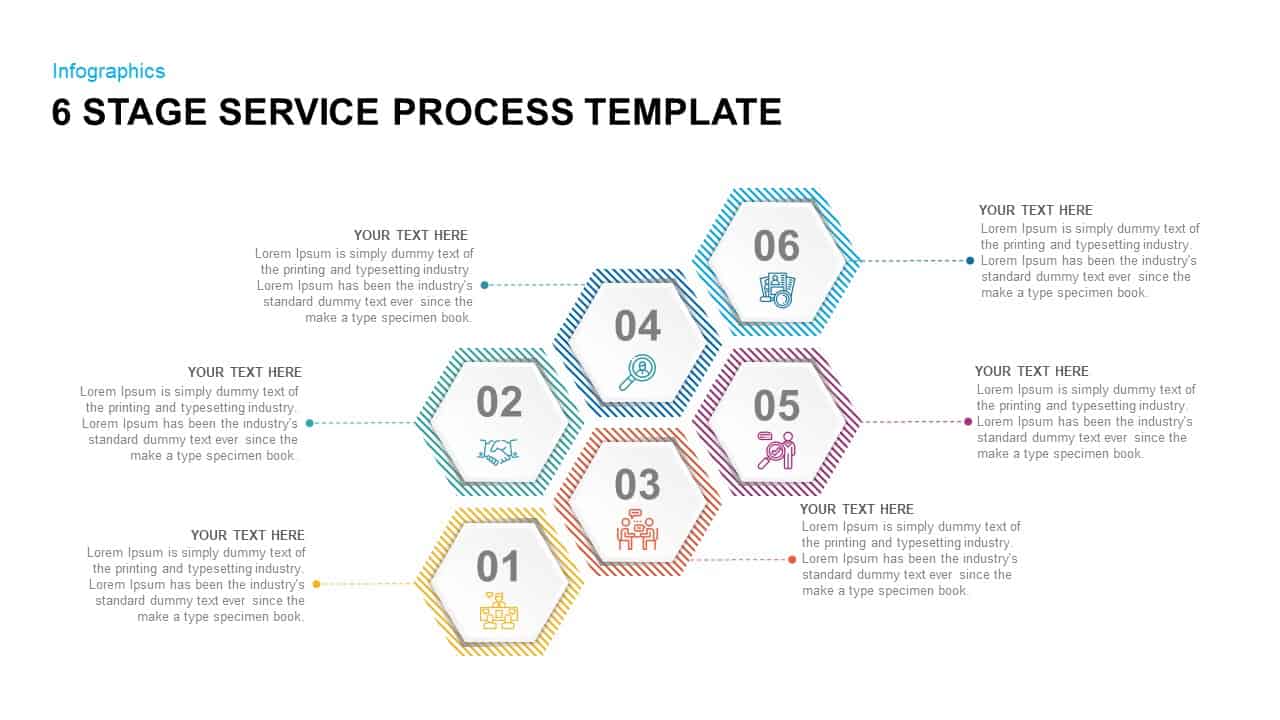
6 Stage Service Process Infographic Template for PowerPoint & Google Slides
Process
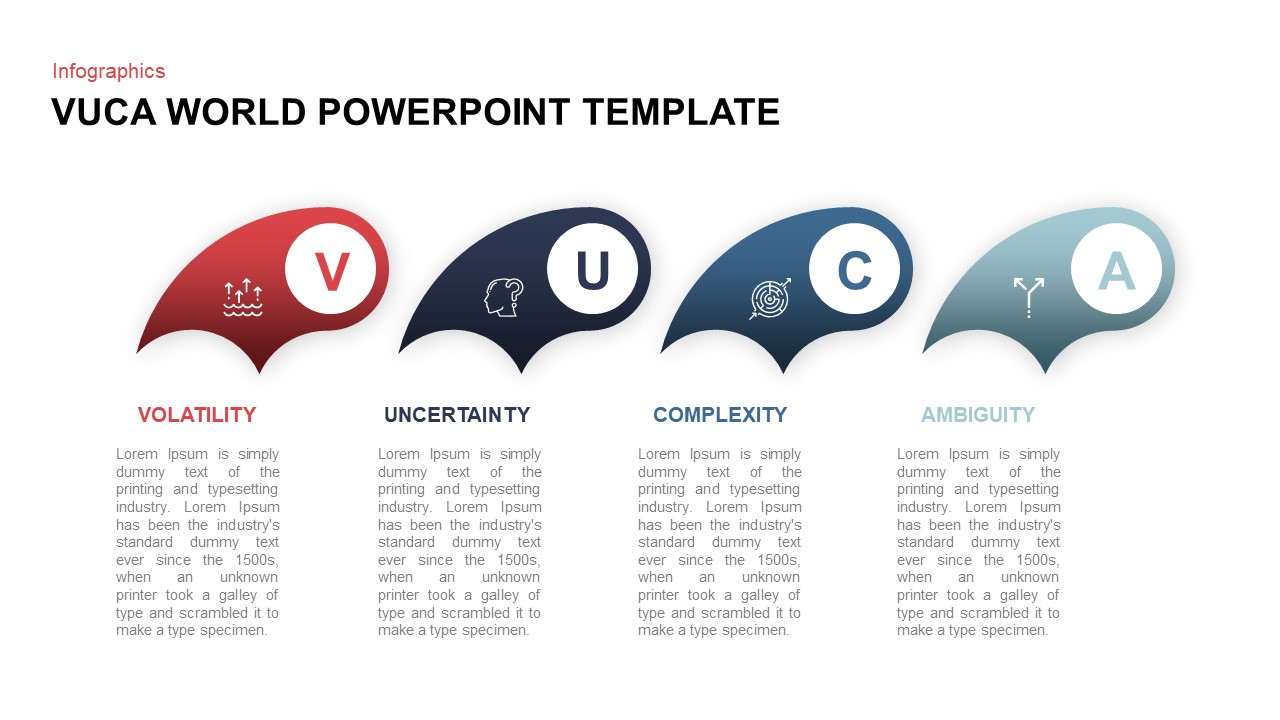
VUCA World Infographic Presentation Template for PowerPoint & Google Slides
Pitch Deck

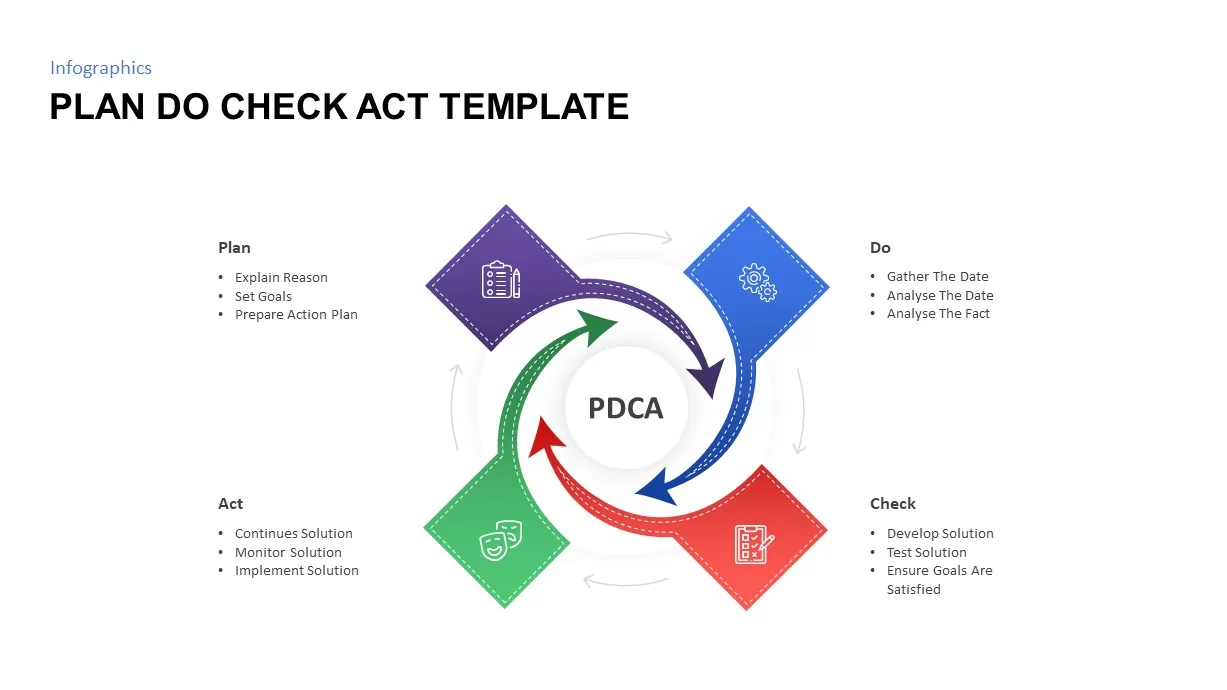
Plan Do Check Act PDCA Cycle Infographic Template for PowerPoint & Google Slides
Process
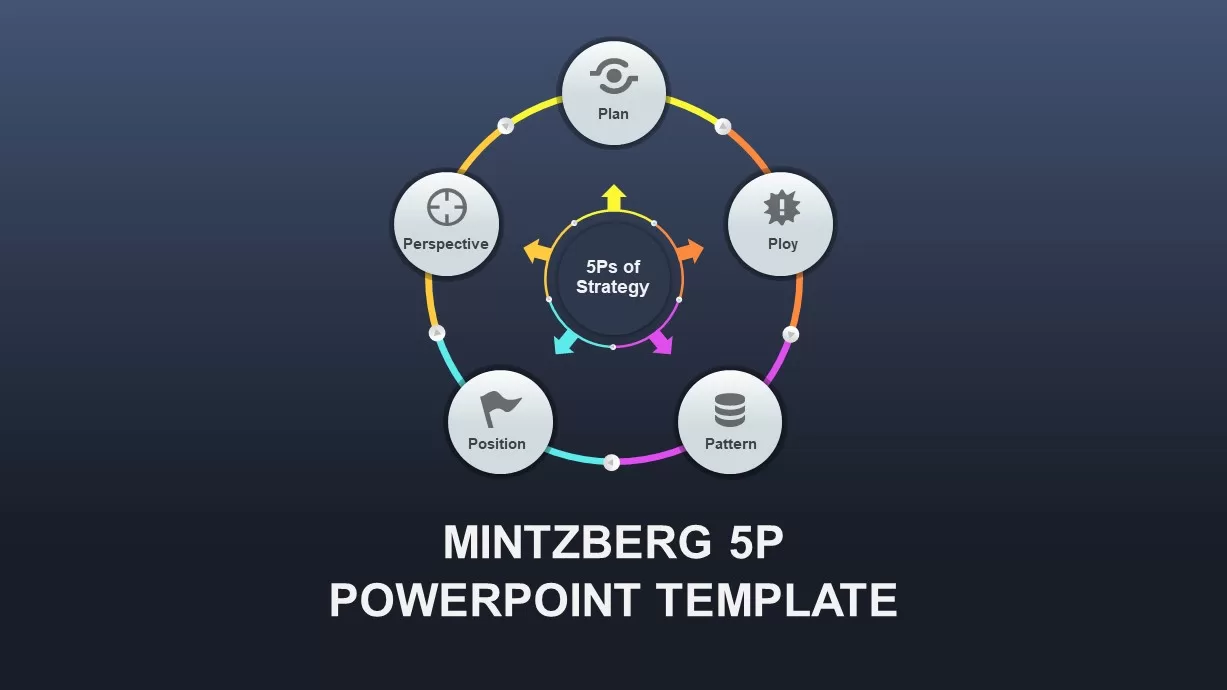
Mintzberg 5P Strategy Infographic Template for PowerPoint & Google Slides
Circular
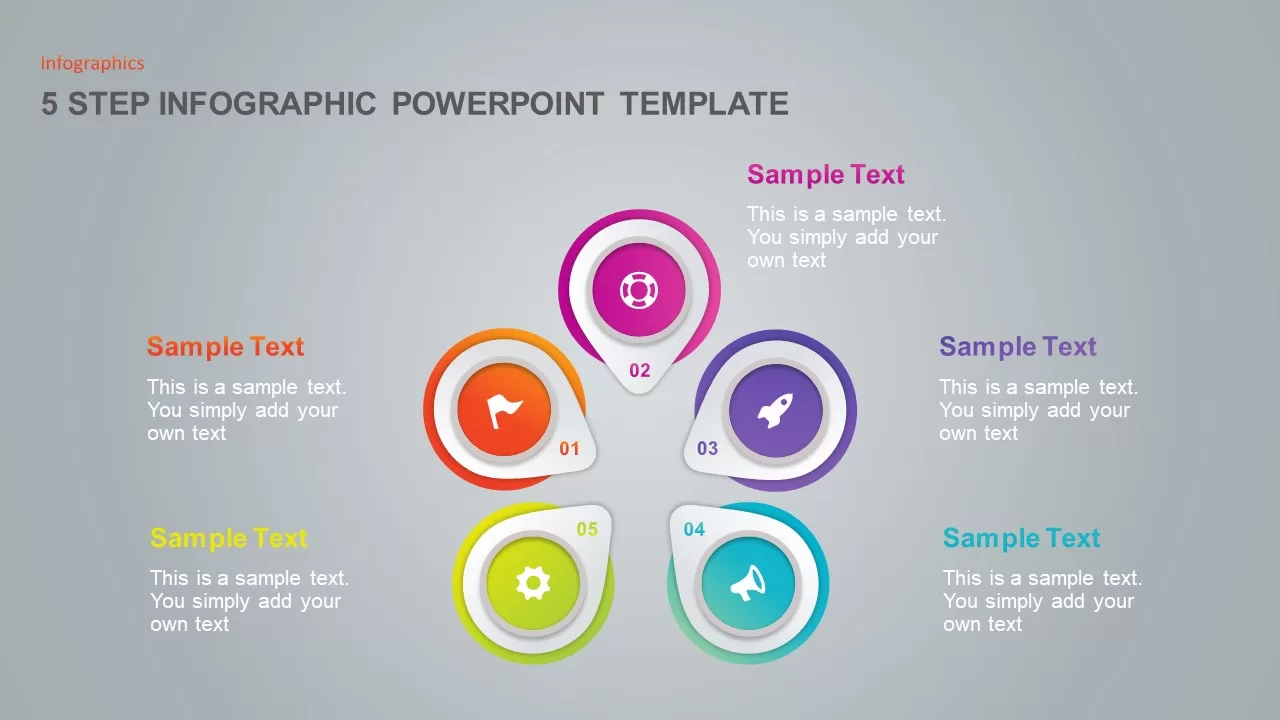
3, 4, 5 Step Infographic Template for PowerPoint & Google Slides
Business Proposal
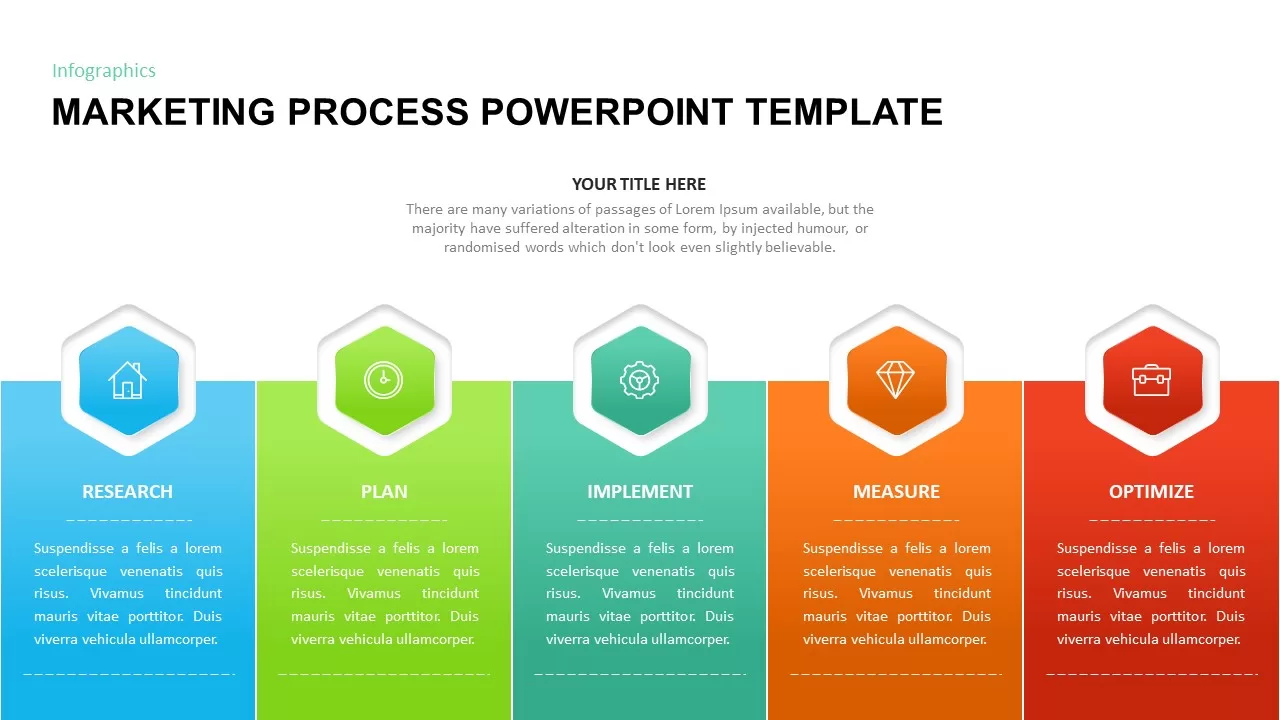
Five-Step Marketing Process Infographic Template for PowerPoint & Google Slides
Process
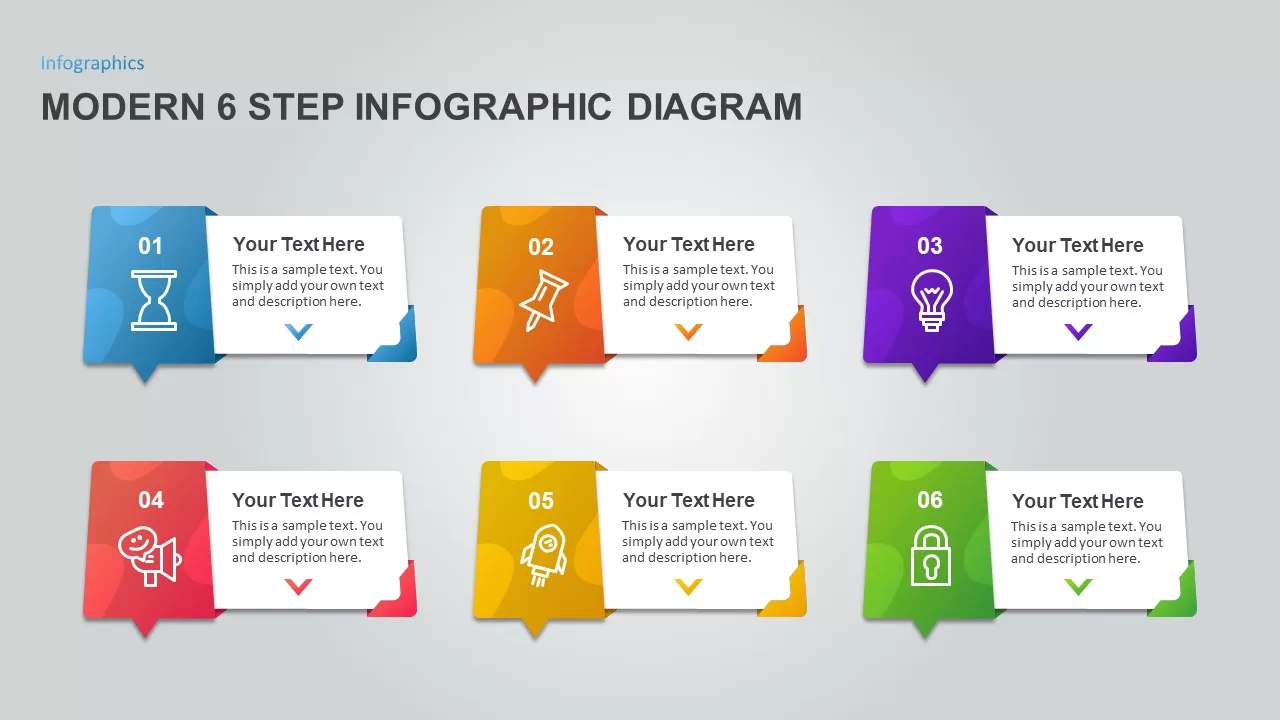
Modern 6 Step Infographic Diagram template for PowerPoint & Google Slides
Process
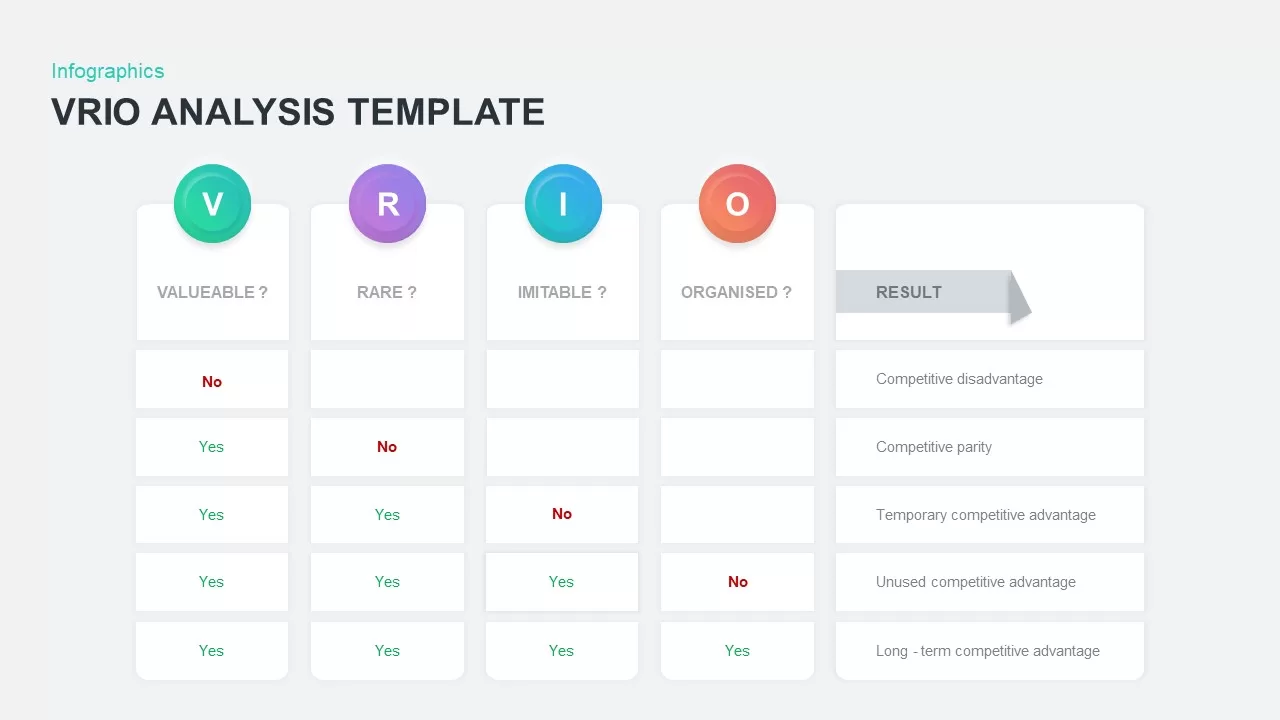
VRIO Analysis Infographic Template for PowerPoint & Google Slides
Business Strategy
Versatile Mind Map Infographic Template for PowerPoint & Google Slides
Mind Maps
Dual Topic Mind Map Infographic Template for PowerPoint & Google Slides
Mind Maps
Editable World Map Callout Infographic Template for PowerPoint & Google Slides
World Maps
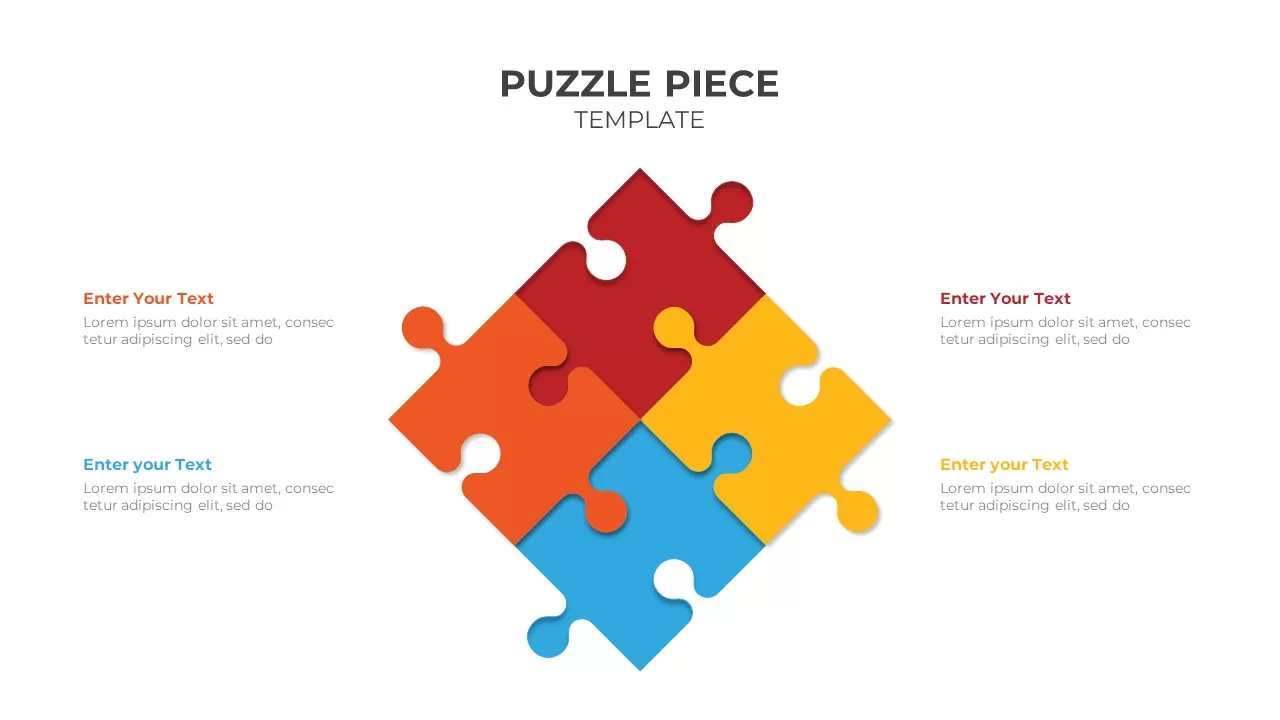
Four-Part Puzzle Piece Infographic Template for PowerPoint & Google Slides
Infographics
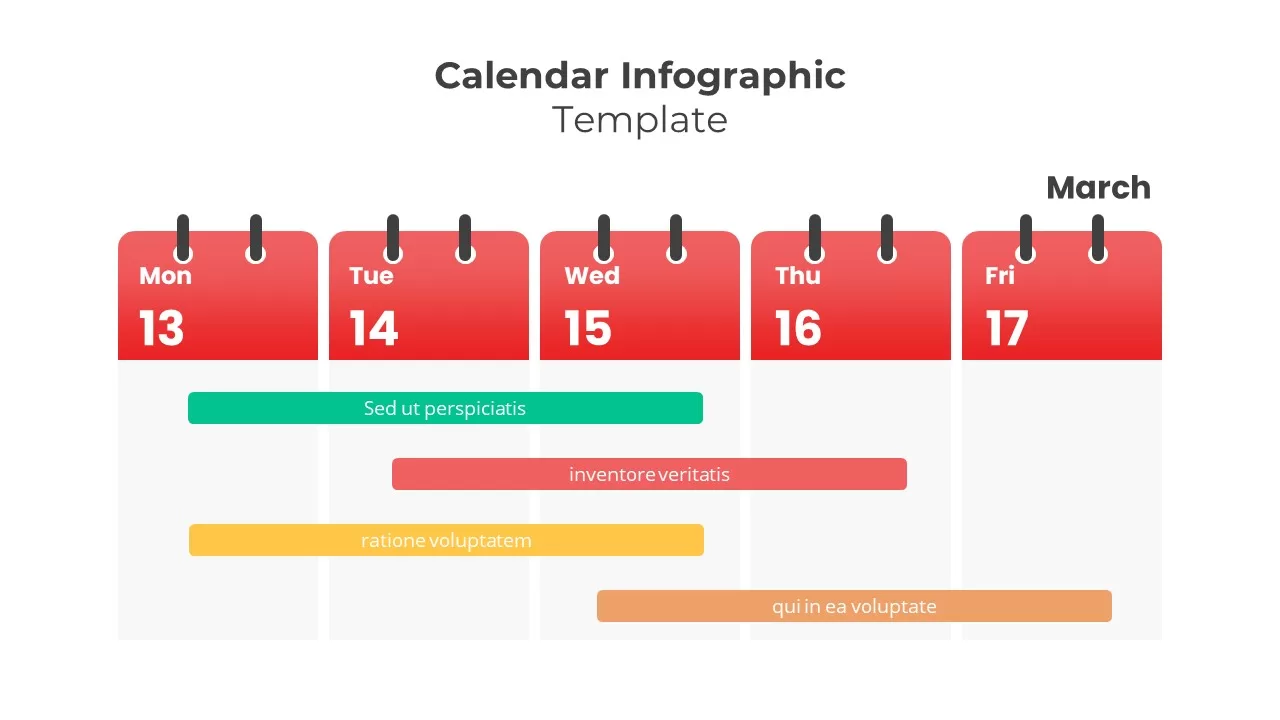
Weekly Five-Day Calendar Infographic Template for PowerPoint & Google Slides
Timeline
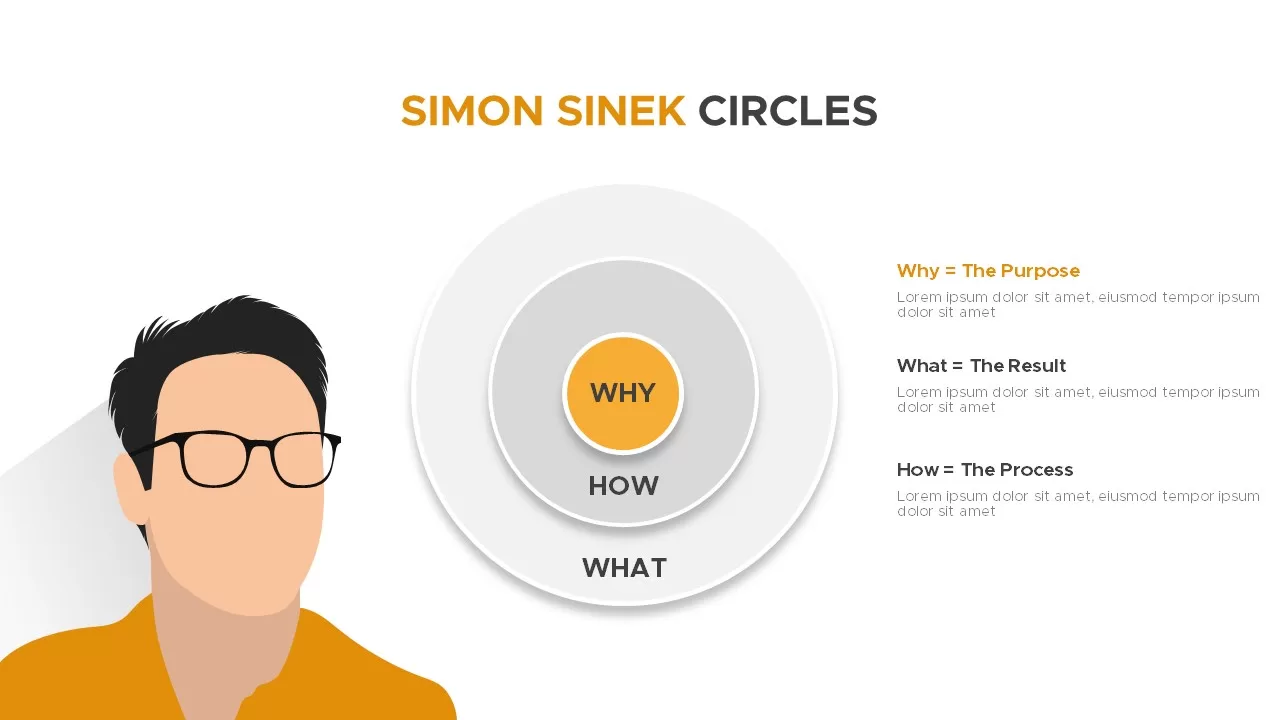
Simon Sinek Circles Model Infographic template for PowerPoint & Google Slides
Business Strategy
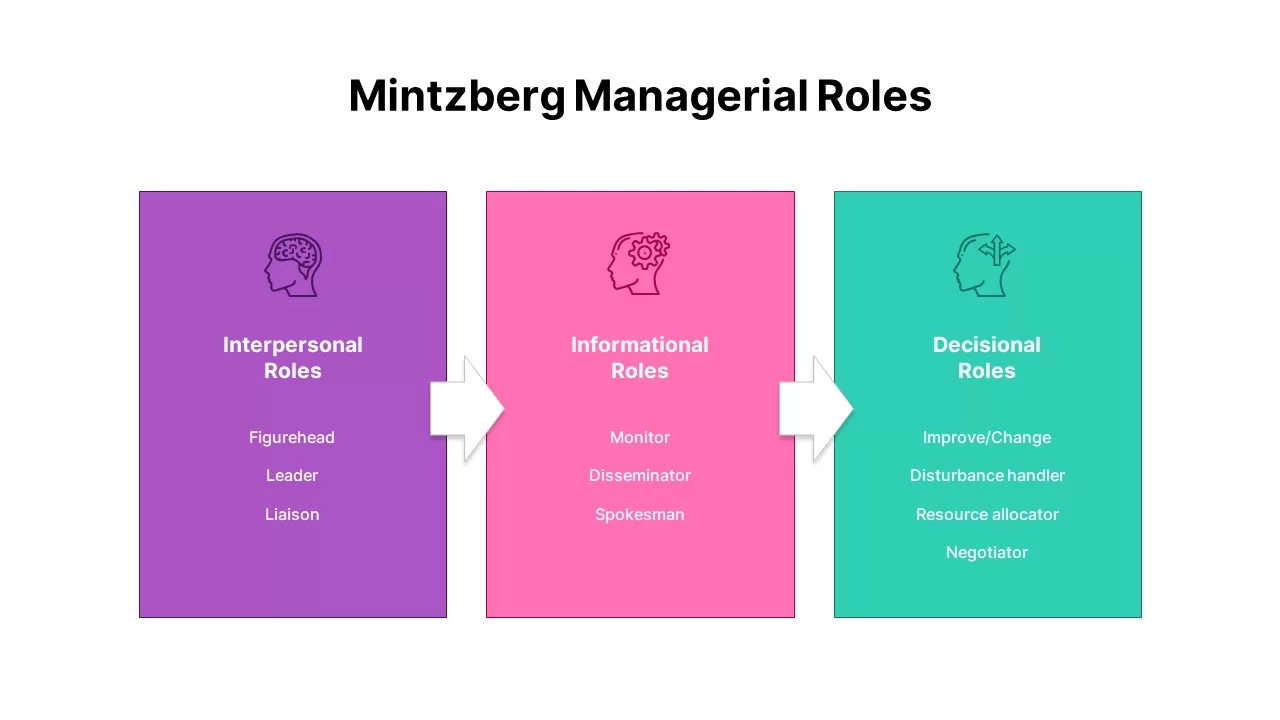
Mintzberg Managerial Roles Infographic Template for PowerPoint & Google Slides
Comparison Chart
Table of Contents Infographic Slide template for PowerPoint & Google Slides
Agenda
North America Map Infographic Slide Template for PowerPoint & Google Slides
World Maps
Before and After Comparison Infographic Template for PowerPoint & Google Slides
Comparison
Free
Modular Block Infographic Slide Template for PowerPoint & Google Slides
Infographics
Development Pipeline Process Infographic Template for PowerPoint & Google Slides
Process
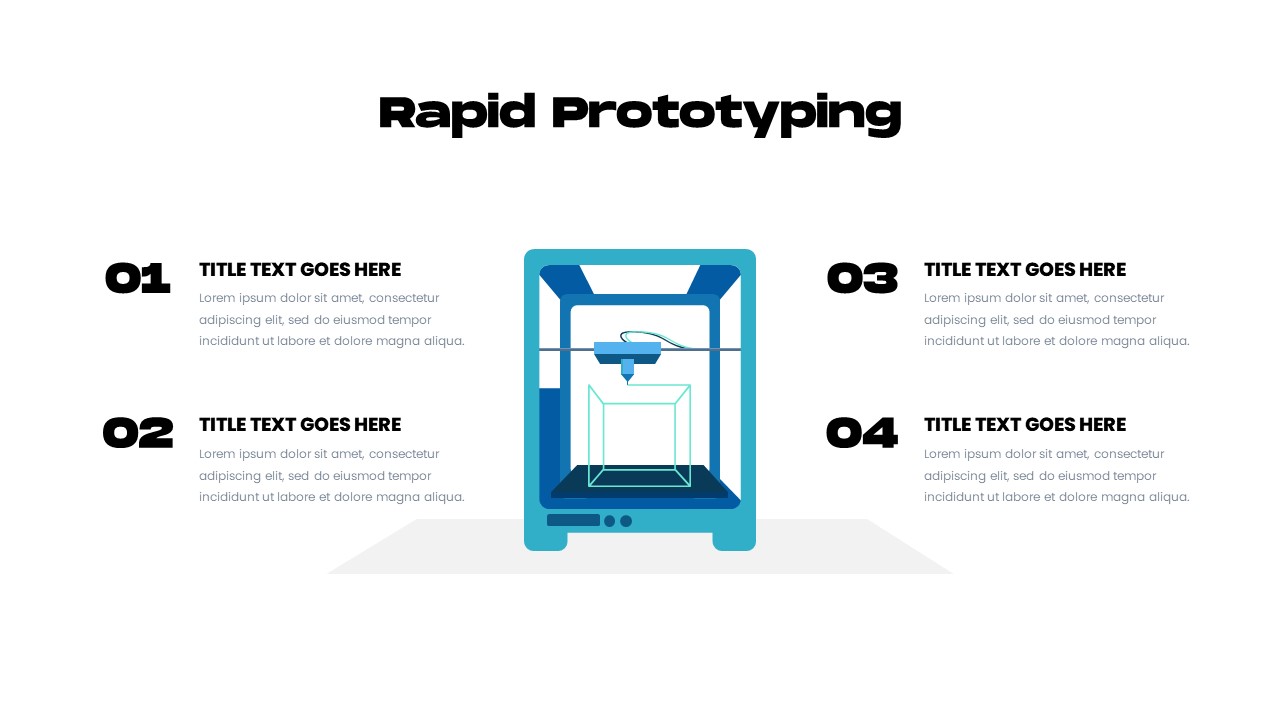
3D Printing Infographic Template for PowerPoint & Google Slides
Infographics
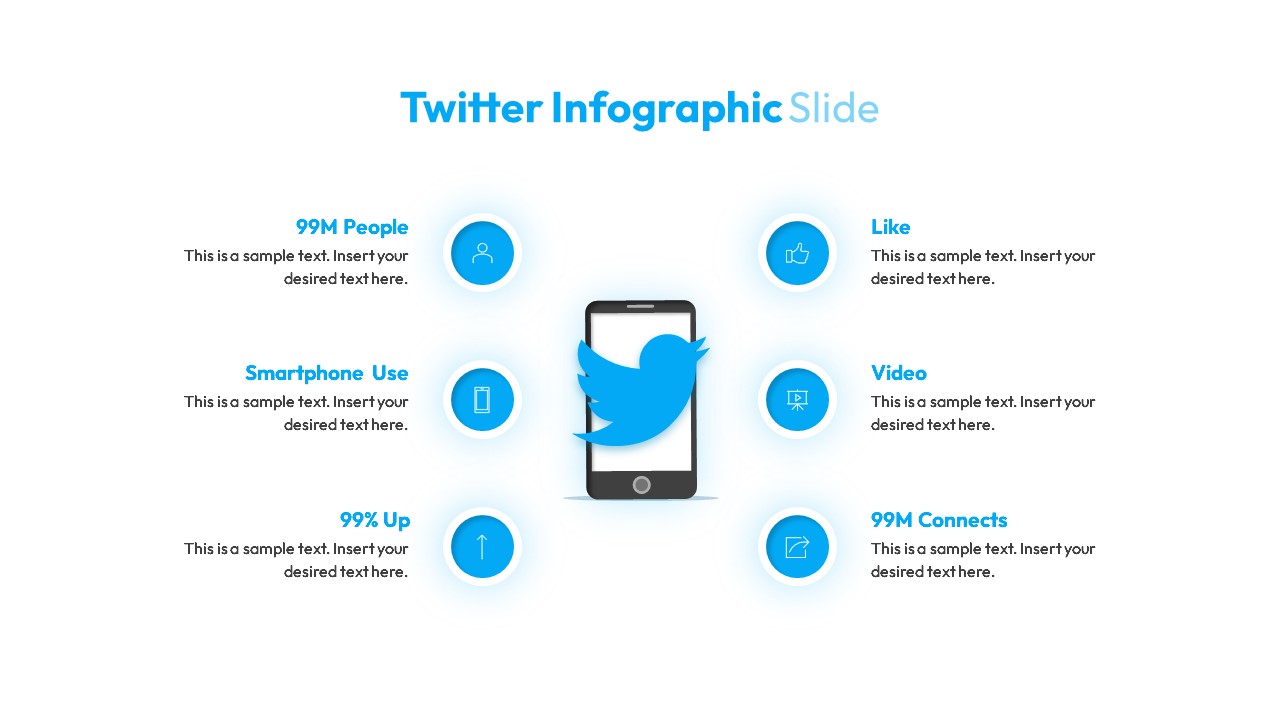
Twitter Social Media Infographic Template for PowerPoint & Google Slides
Circular
Instagram Infographic Metrics Slide Template for PowerPoint & Google Slides
Marketing
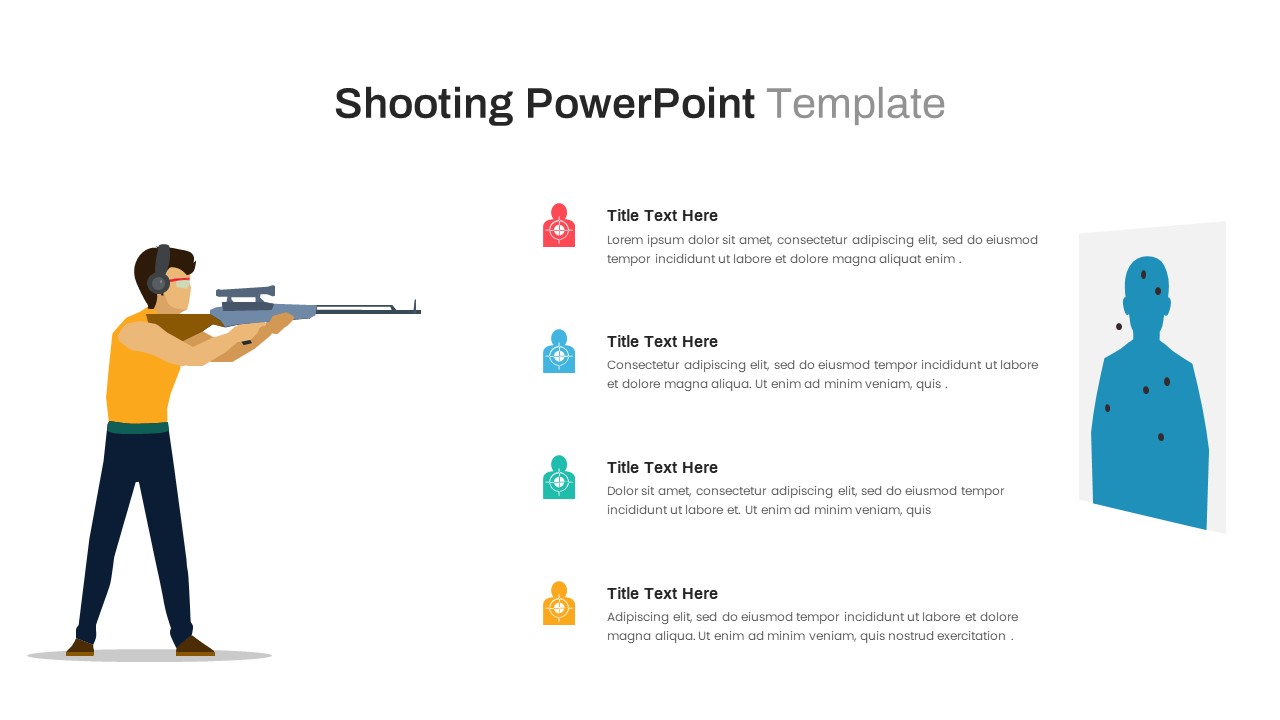
Shooting Target Process Infographic Template for PowerPoint & Google Slides
Process
Dynamic Chevron Timeline Infographic Template for PowerPoint & Google Slides
Timeline
Business Intelligence Infographic & Flow Template for PowerPoint & Google Slides
Business Report
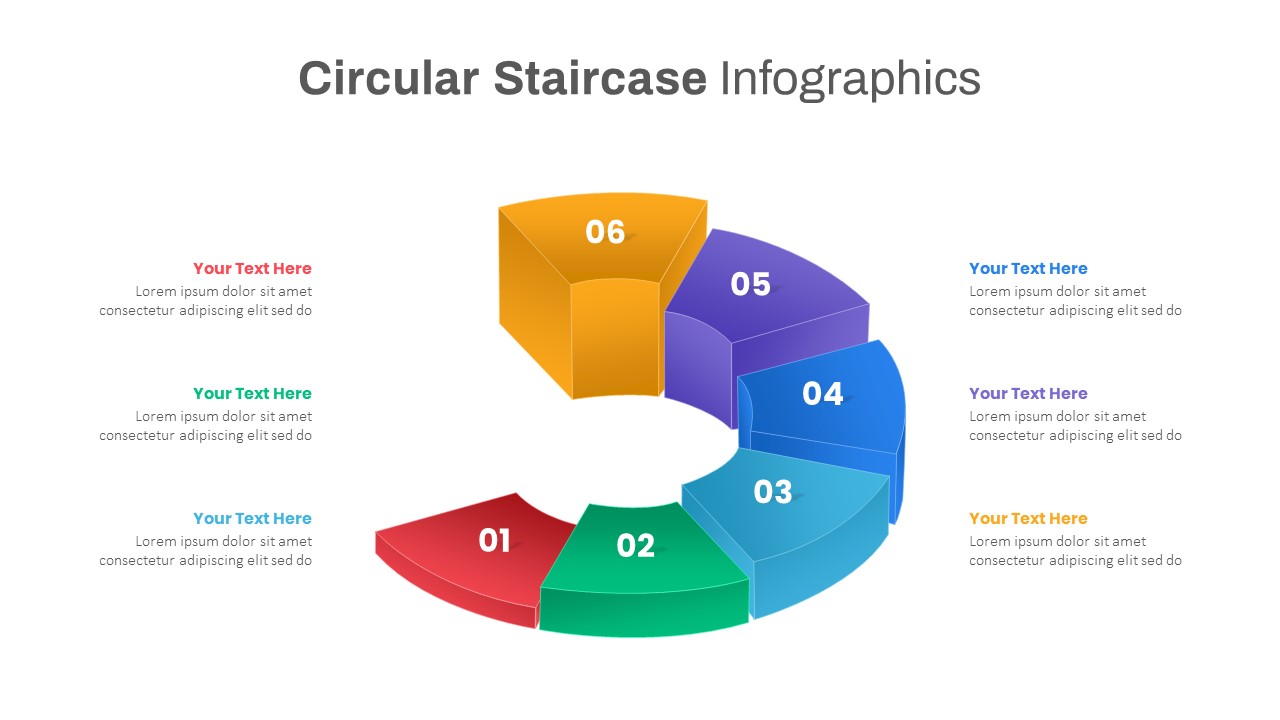
Six-Step Staircase Infographic Template for PowerPoint & Google Slides
Circular
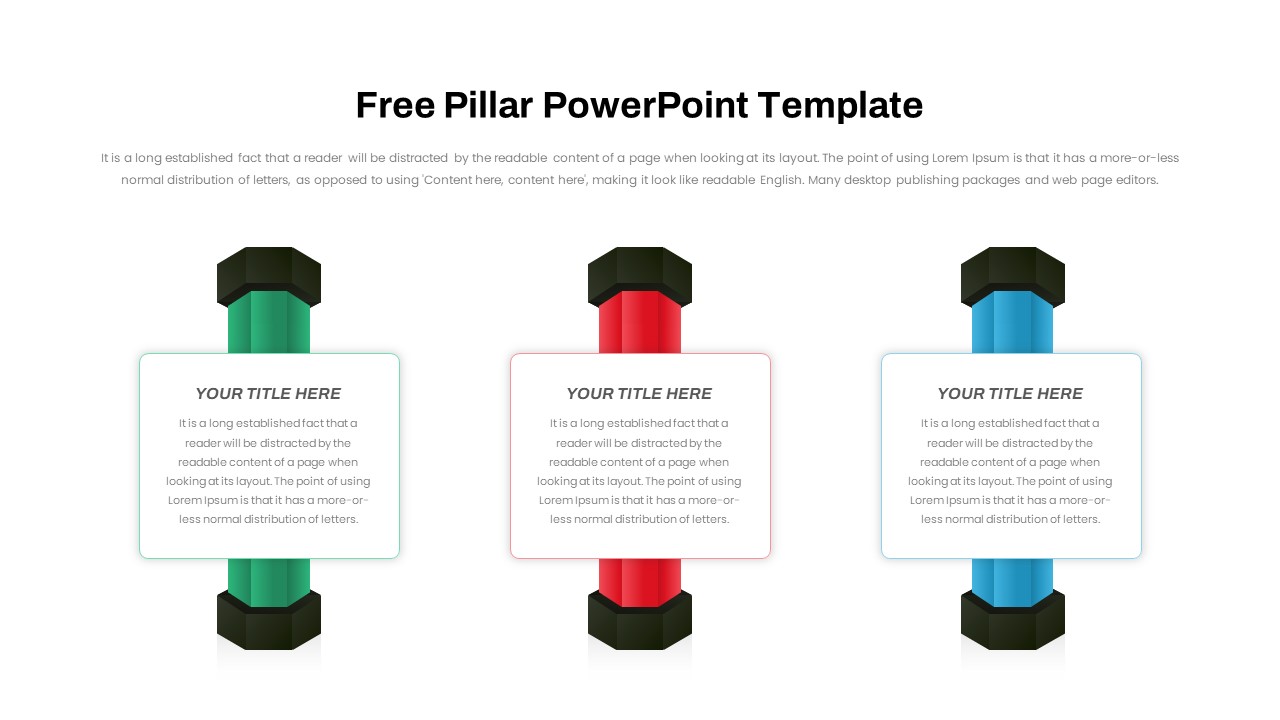
Free Three and Four Pillar Infographic Pack Template for PowerPoint & Google Slides
Process
Free
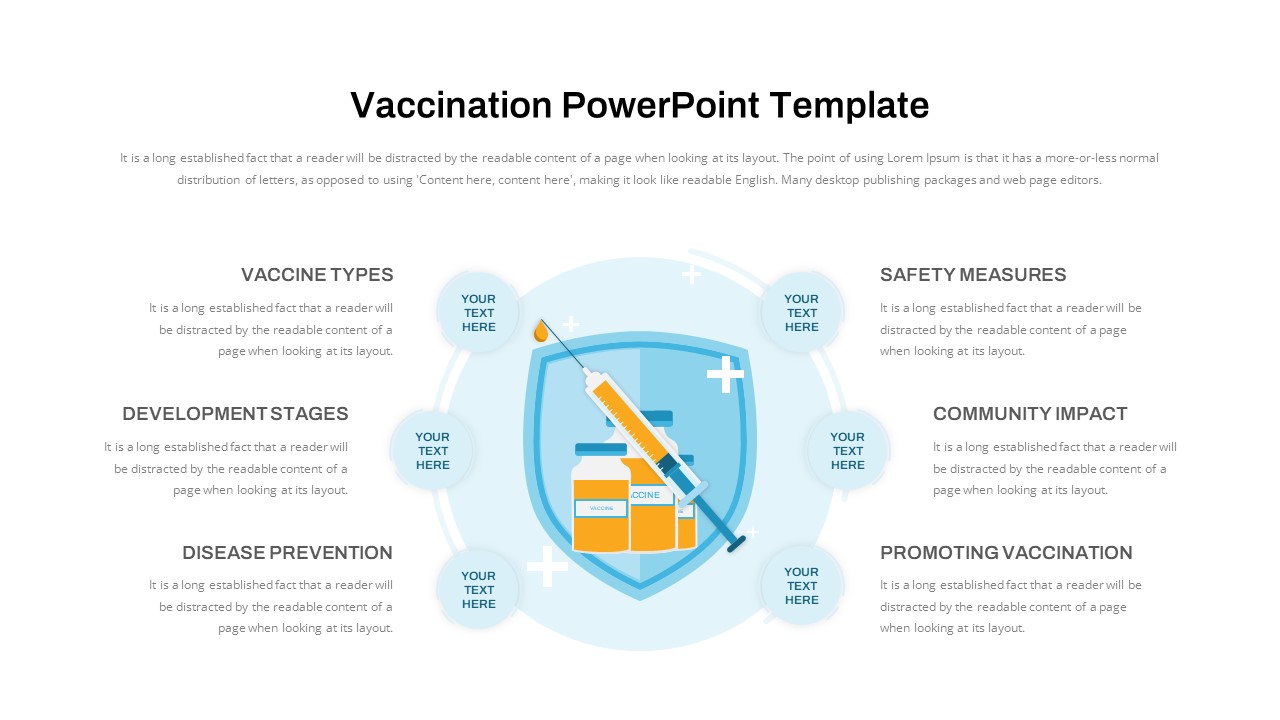
Vaccination Hub-and-Spoke Infographic Template for PowerPoint & Google Slides
Circular
Free Global Warming Infographic Comparison Template for PowerPoint & Google Slides
Comparison Chart
Free
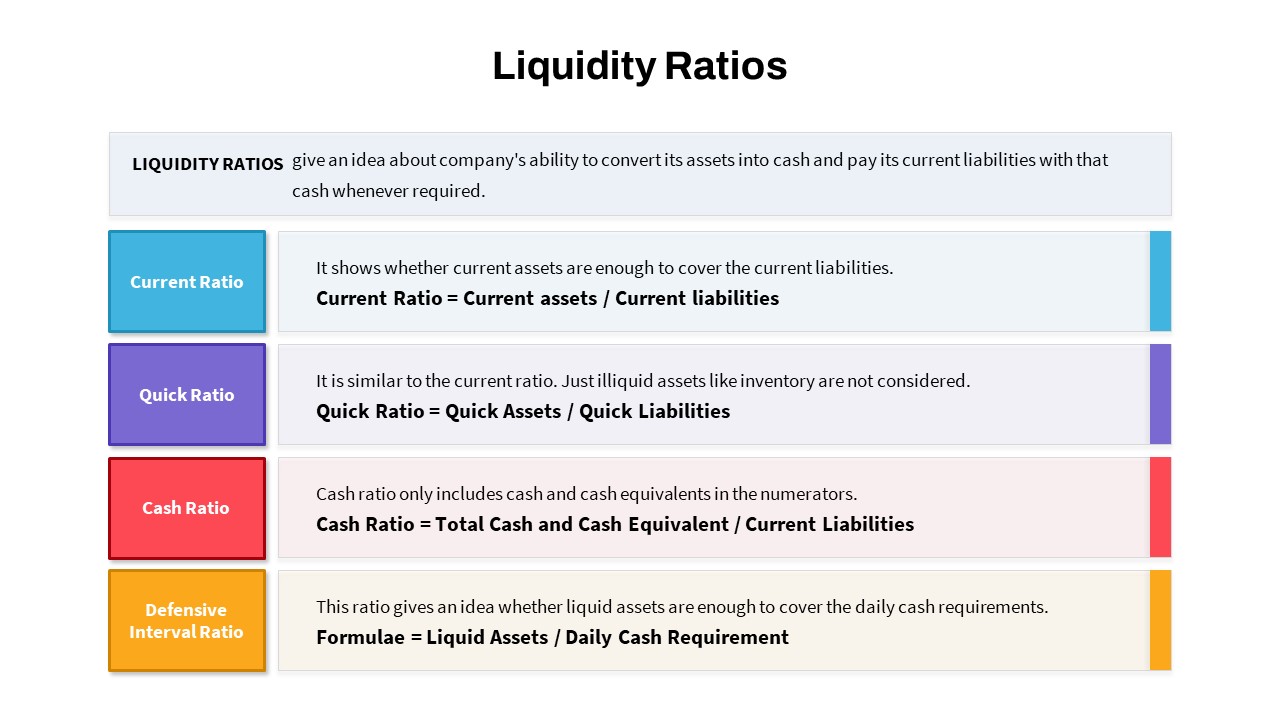
Liquidity Ratios Infographic Slide Template for PowerPoint & Google Slides
Finance
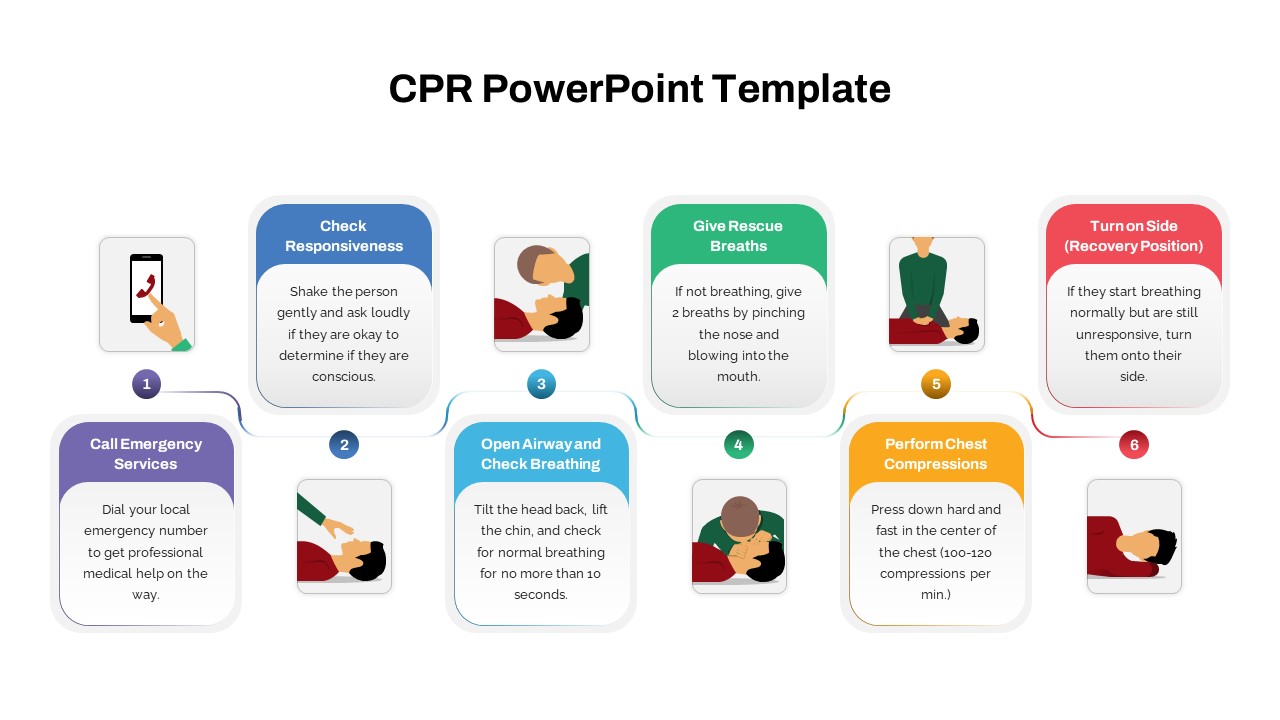
CPR Training Process Infographic Template for PowerPoint & Google Slides
Process
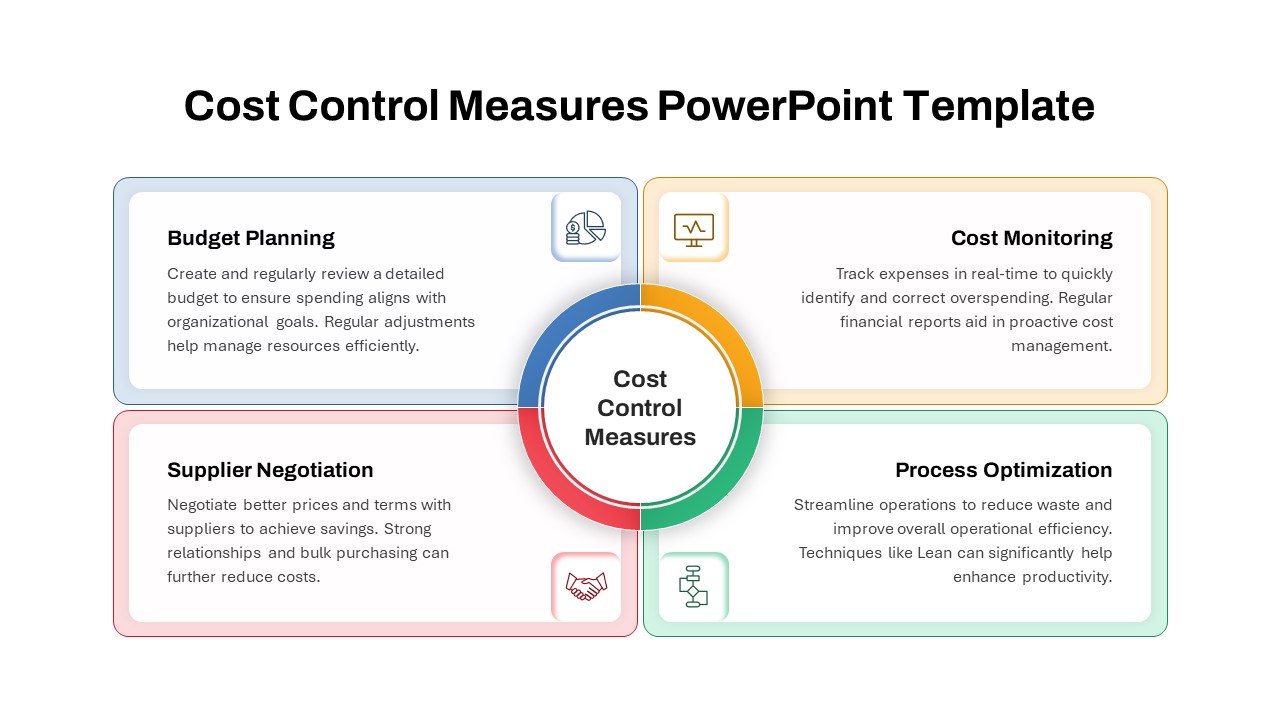
Cost Control Measures Infographic Template for PowerPoint & Google Slides
Circular
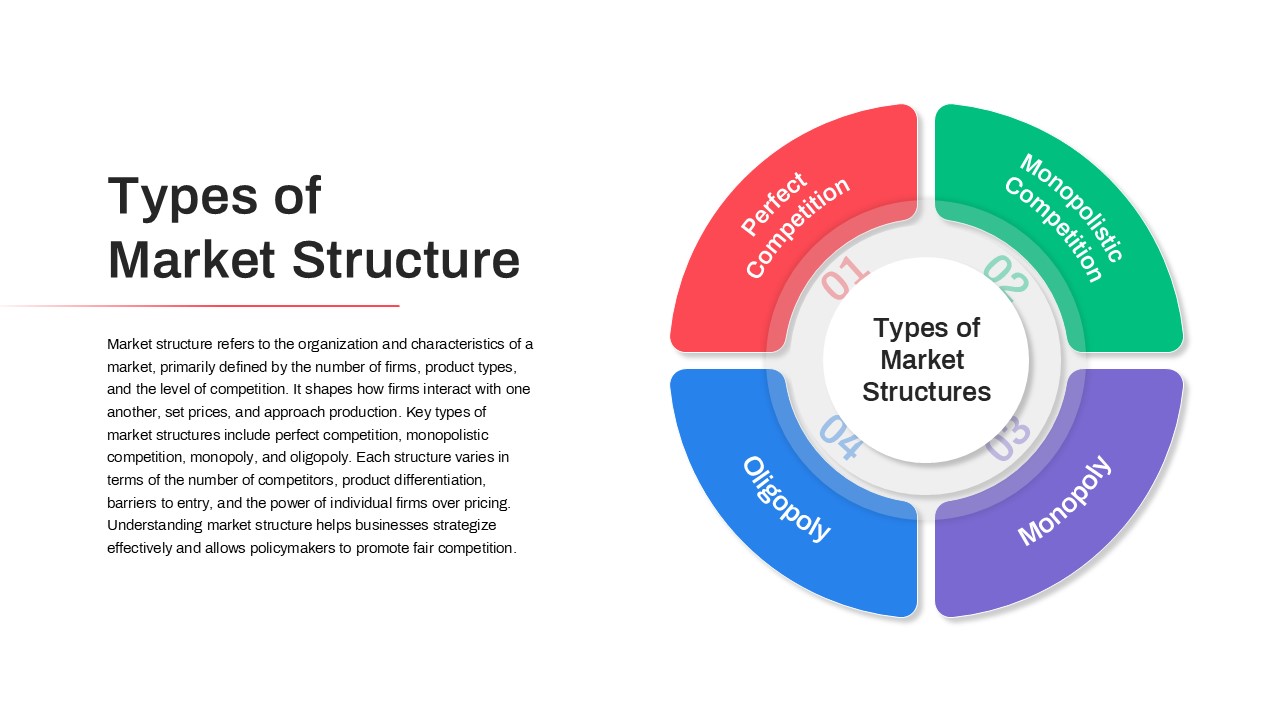
Types of Market Structure Infographic Template for PowerPoint & Google Slides
Comparison
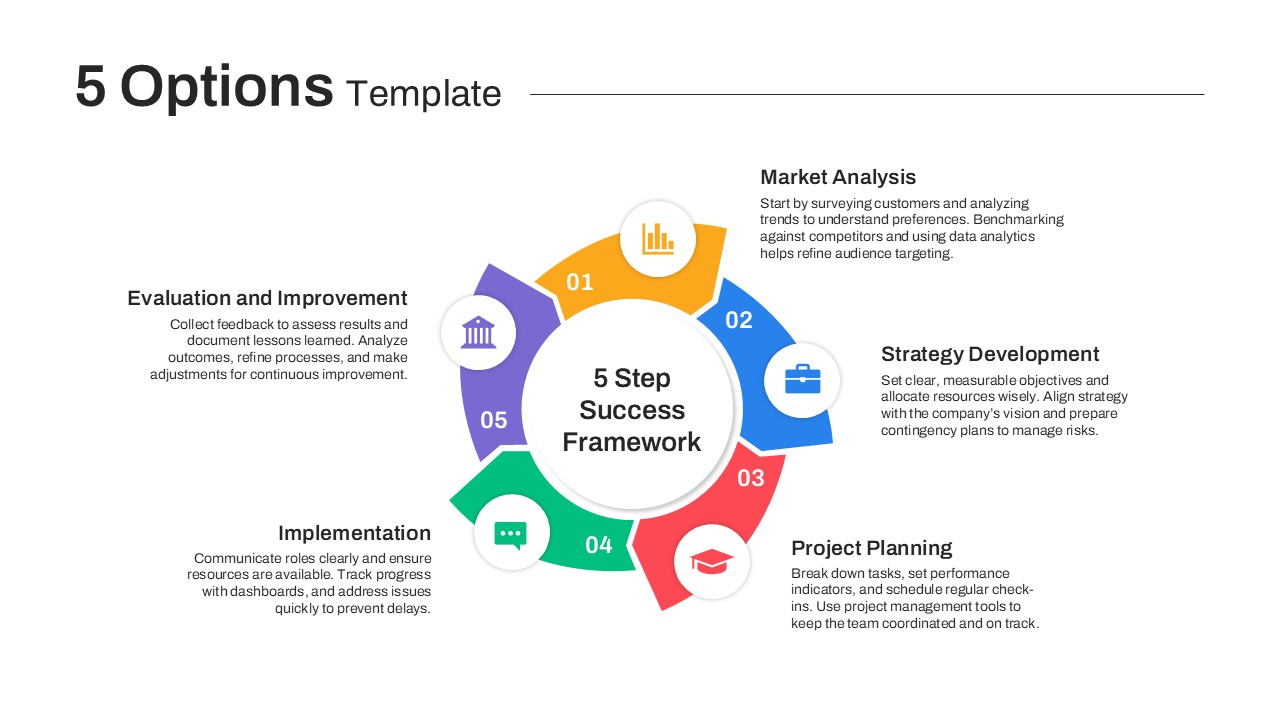
Colorful Five-Option Ribbon Infographic Template for PowerPoint & Google Slides
Process
Free Online Shopping 3-Slide Infographic Template for PowerPoint & Google Slides
Digital Marketing
Free
Data-Driven AI in Insurance Infographic Template for PowerPoint & Google Slides
Circular
Multimodal AI Modalities Infographic Template for PowerPoint & Google Slides
AI
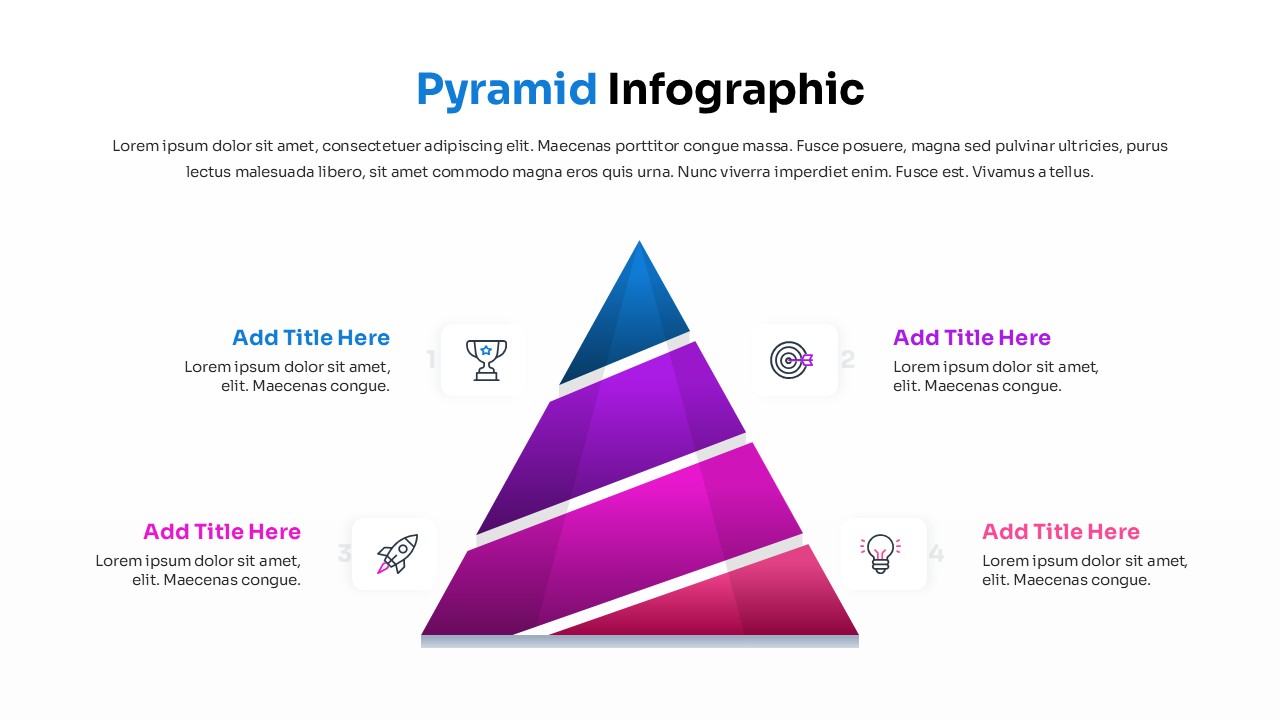
Four Level Pyramid Infographic Template for PowerPoint & Google Slides
Pyramid
Three Segment Donut Chart KPI Infographic Template for PowerPoint & Google Slides
Pie/Donut