Annual Project Gantt Chart Timeline Template for PowerPoint & Google Slides
Description
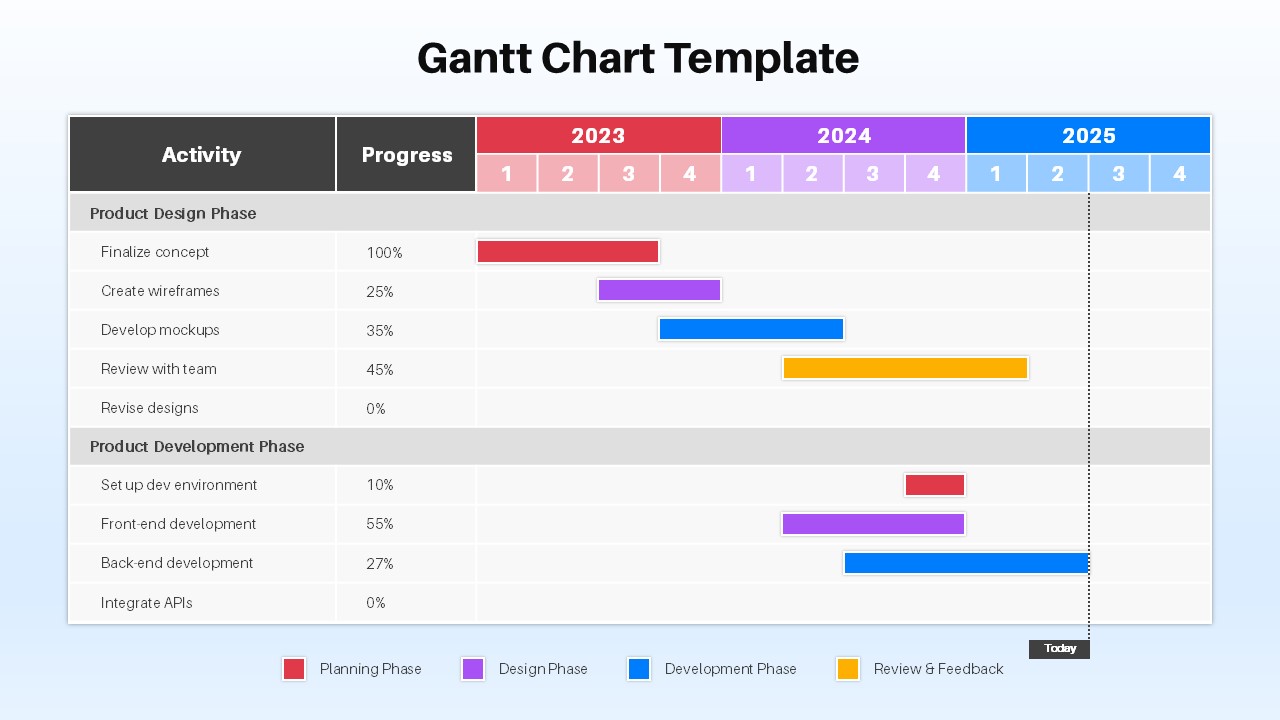
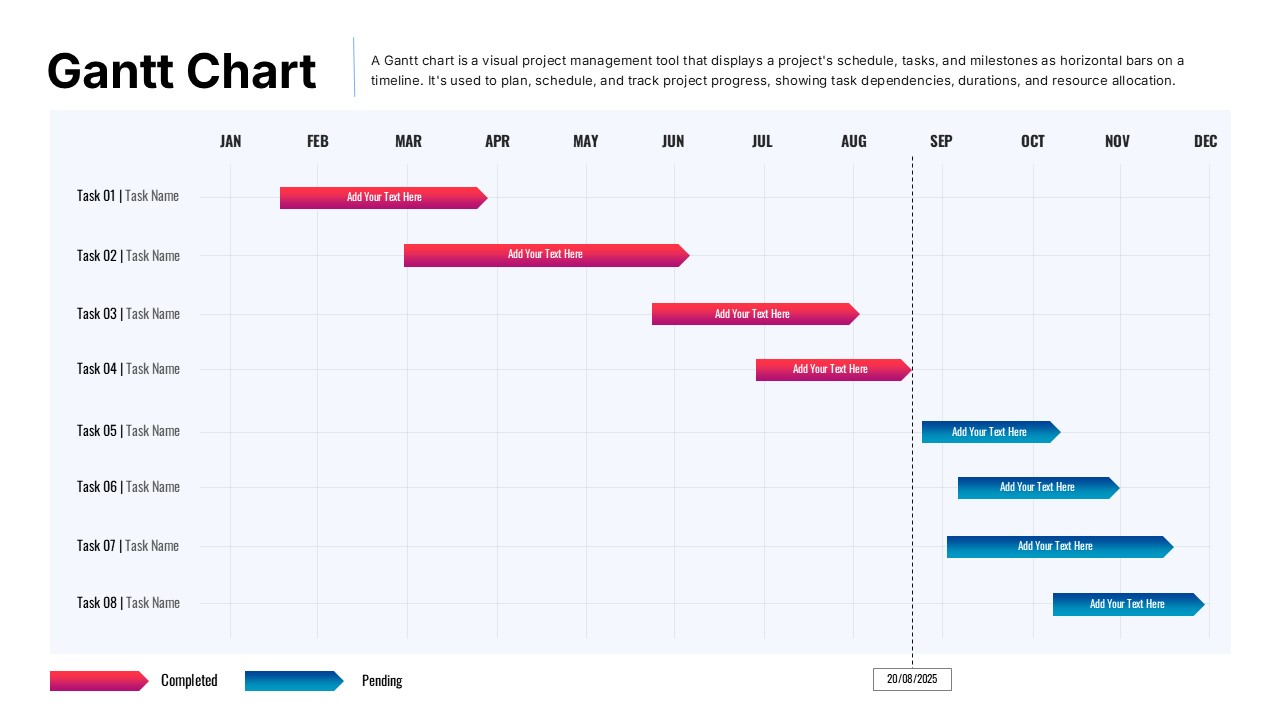
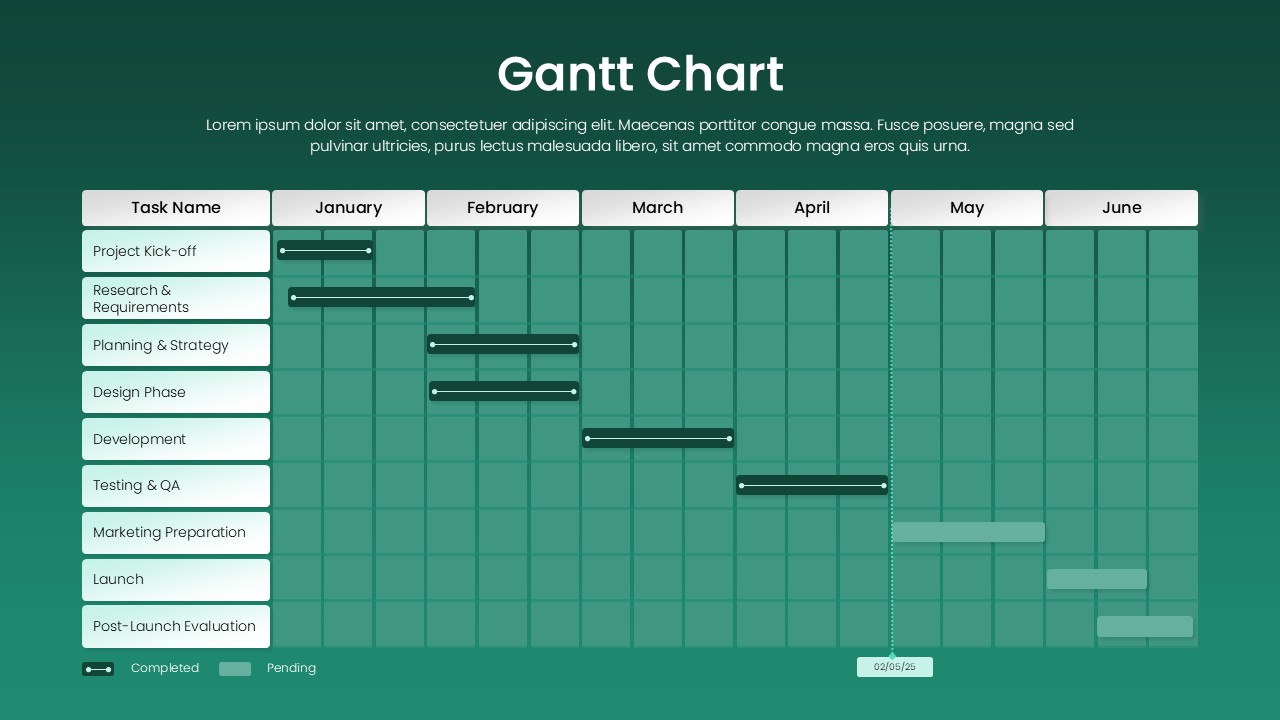
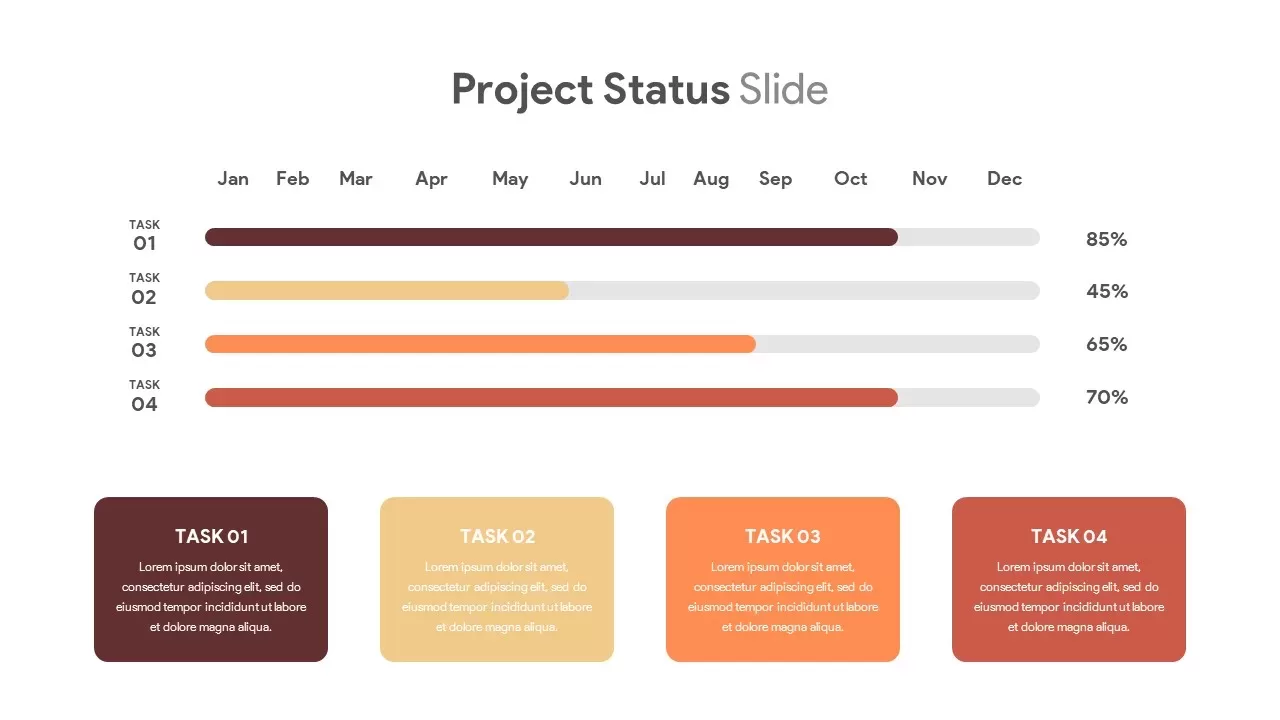
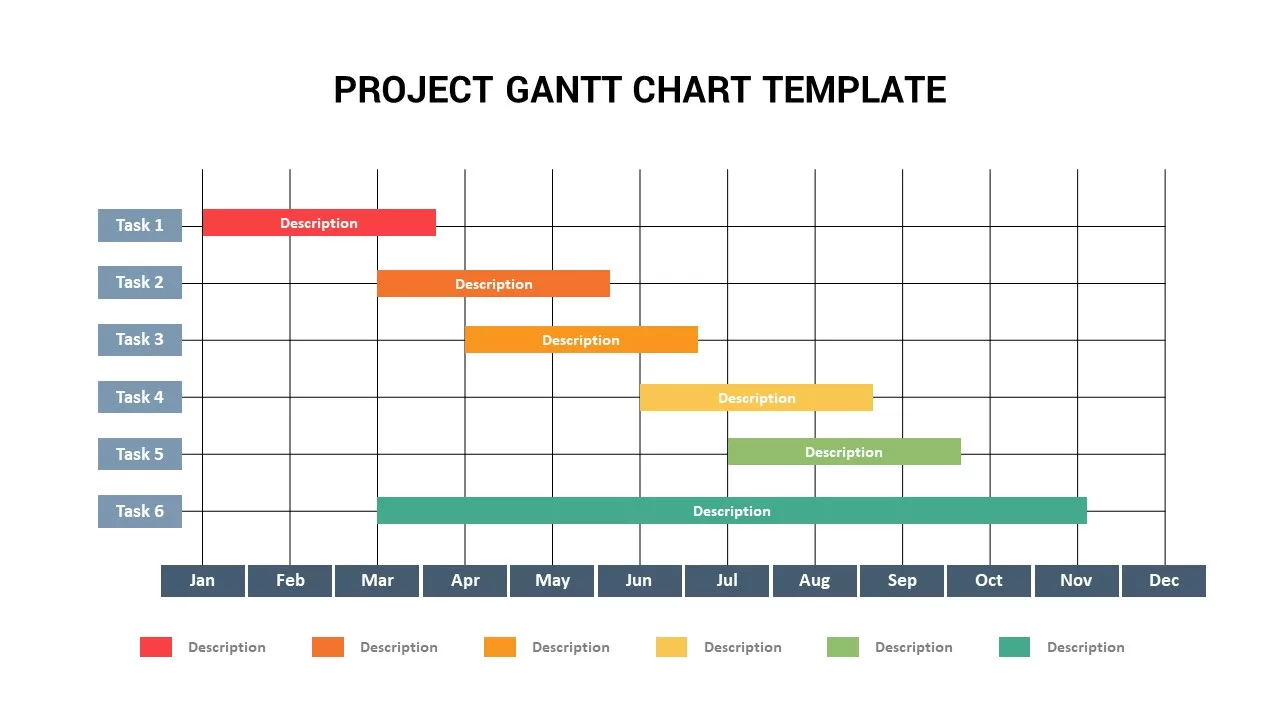
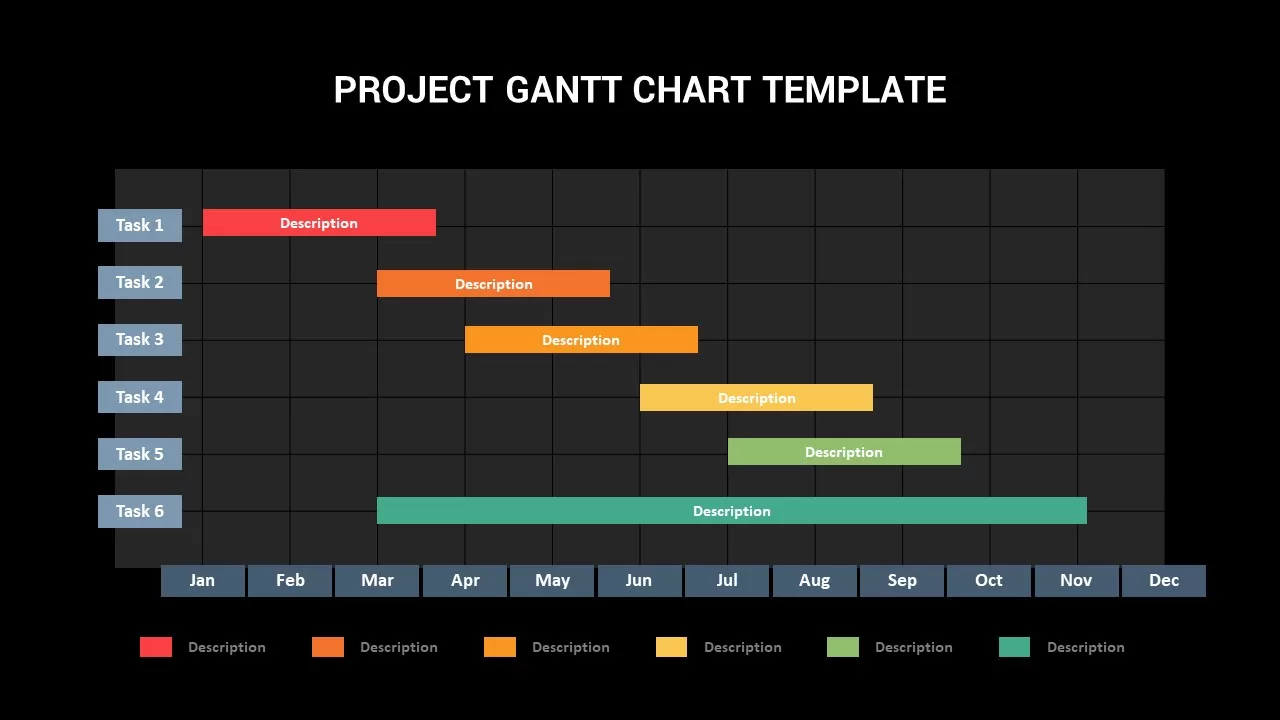
Use this fully editable annual Gantt chart slide to map project tasks and schedules in PowerPoint & Google Slides. Task rows list “Task 1” through “Task 6” alongside monthly gridlines from January to December, while vibrant colored bars denote activity durations and milestones. A customizable legend beneath the timeline clarifies activity types, priority levels, or resource assignments. Subtle gridlines, rounded–corner bars, and clean typography ensure high readability, even for complex, multi-phase initiatives.
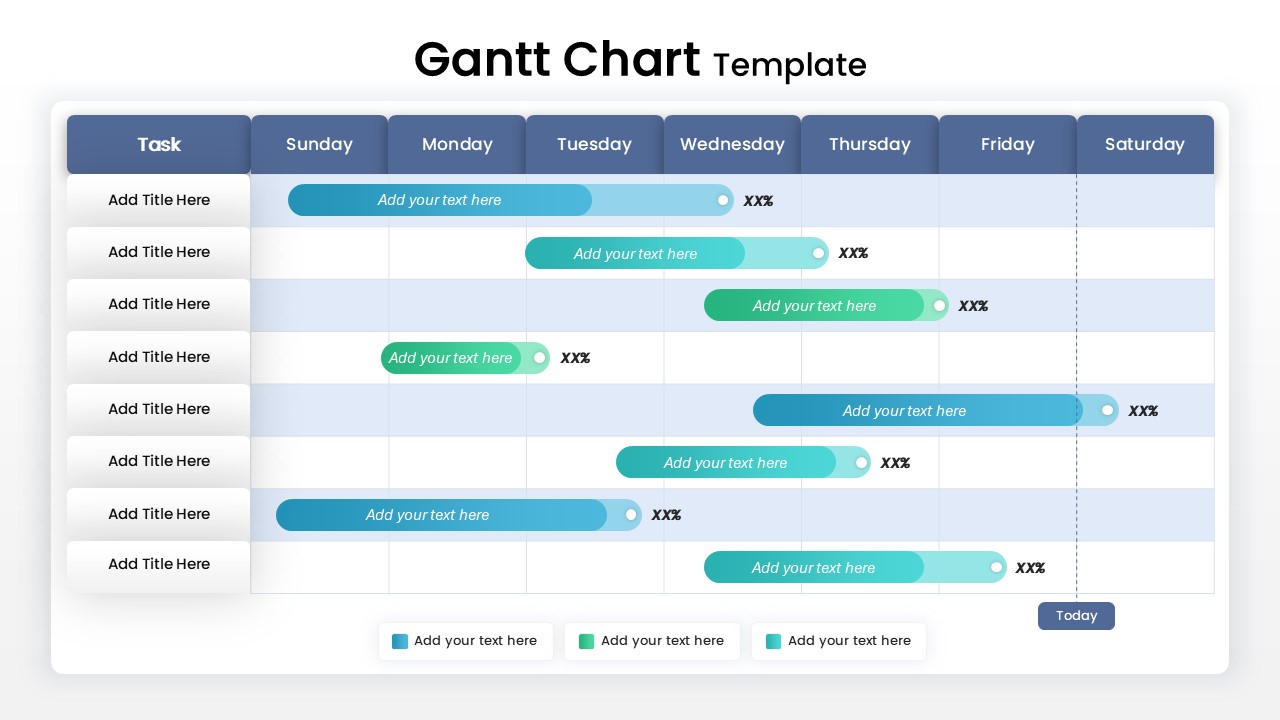
Built on slide masters with vector shapes, you can adjust the date range, add or remove tasks, swap colors, and relabel bars in seconds—maintaining pixel-perfect quality on any display. Optional label placeholders above each bar support percentage-complete indicators or milestone markers. Use the legend to denote departments, sprints, or risk statuses, and leverage shape animations to reveal phases sequentially in stakeholder briefings.
The design’s balanced white space and minimalistic aesthetic reduce visual noise and keep focus on critical path tasks. Fully compatible with desktop and web-based editors, this template supports real-time collaboration without version-control headaches. Master-slide integration lets you apply brand fonts and color palettes globally, ensuring cohesive decks across all presentations.
Who is it for
Project Managers, Program Leads, PMO Teams, and Scrum Masters will benefit from this chart when planning deliverables, tracking progress, and coordinating cross-functional workflows. Marketing Managers, Event Planners, and Operations Directors can also use it to align stakeholders around timelines and milestones.
Other Uses
Beyond annual roadmaps, repurpose this timeline for product launch plans, editorial calendars, training schedules, event itineraries, or resource allocation charts. Duplicate or resize the slide to compare parallel projects, illustrate quarterly roadmaps, or visualize multi-year portfolio plans.
Login to download this file

Item ID
SB02839
Related Templates

Colorful Annual Gantt Chart Project Planner Template for PowerPoint & Google Slides
Gantt Chart
Colorful Annual Gantt Chart Timeline Template for PowerPoint & Google Slides
Gantt Chart
Interactive Project Gantt Chart Timeline Template for PowerPoint & Google Slides
Gantt Chart
Project Tracker Timeline Gantt Chart Template for PowerPoint & Google Slides
Project Status
Weekly Gantt Chart Project Timeline Template for PowerPoint & Google Slides
Gantt Chart
Project Timeline Gantt Chart Template for PowerPoint & Google Slides
Gantt Chart
Project Execution Gantt Timeline Template for PowerPoint & Google Slides
Gantt Chart
Project Gantt Chart template for PowerPoint & Google Slides
Gantt Chart
Project Gantt Chart Template for PowerPoint & Google Slides
Gantt Chart
Project Gantt Chart Template for PowerPoint & Google Slides
Gantt Chart
Creative Dynamic Gantt Chart Timeline Template for PowerPoint & Google Slides
Timeline

Fully Editable Gantt Chart Timeline template for PowerPoint & Google Slides
Gantt Chart

Product Roadmap Gantt Chart Timeline template for PowerPoint & Google Slides
Gantt Chart
Overlapping Timeline Gantt Chart Diagram Template for PowerPoint & Google Slides
Timeline
Stacked Gantt Chart Timeline Slide Template for PowerPoint & Google Slides
Gantt Chart
7 Step 6 Month Gantt Chart Timeline Template for PowerPoint & Google Slides
Gantt Chart
Free Professional Gantt Chart Pack – 4 Slides Template for PowerPoint & Google Slides
Gantt Chart
Free
Annual Creative Hexagon Timeline Diagram Template for PowerPoint & Google Slides
Timeline
Annual Business Review Timeline Template for PowerPoint & Google Slides
Timeline
Annual Growth Trend Analysis Chart template for PowerPoint & Google Slides
Business Report
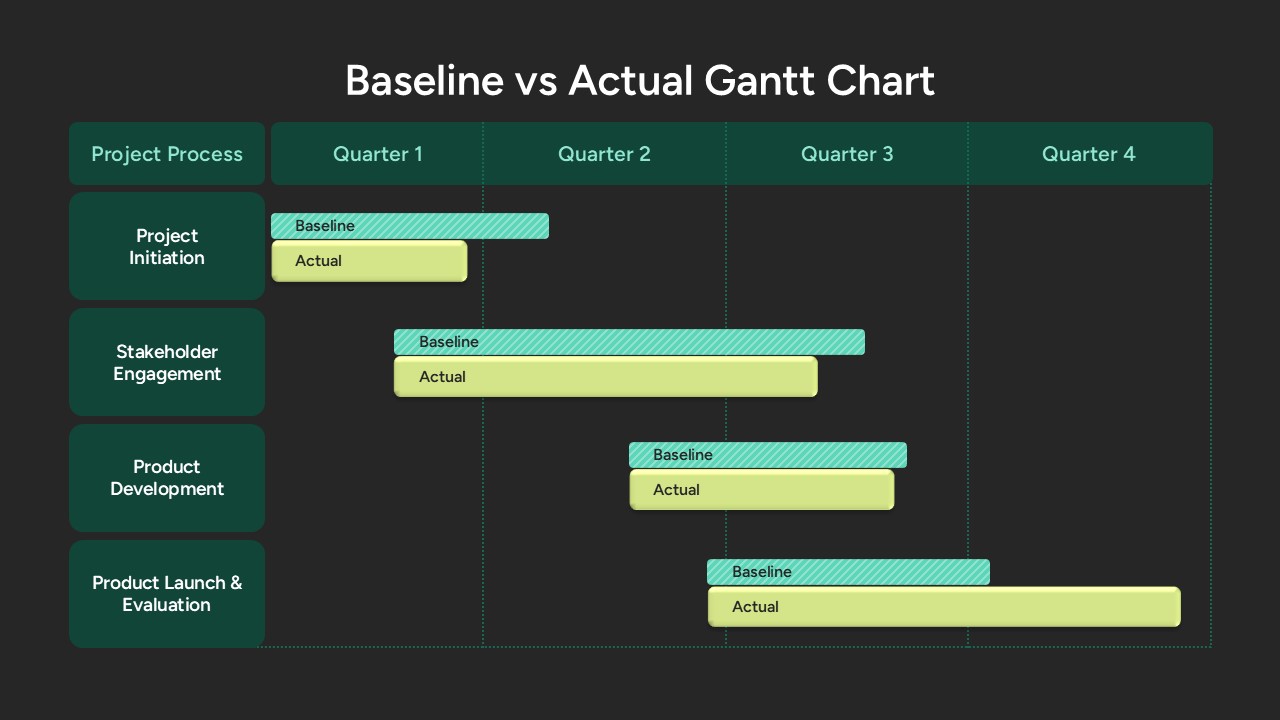
Baseline vs Actual Gantt Chart Template for PowerPoint & Google Slides
Gantt Chart
Event Planning Gantt Chart template for PowerPoint & Google Slides
Business
Color-Coded Gantt Chart template for PowerPoint & Google Slides
Business
Team Gantt Chart Overview template for PowerPoint & Google Slides
Project Status
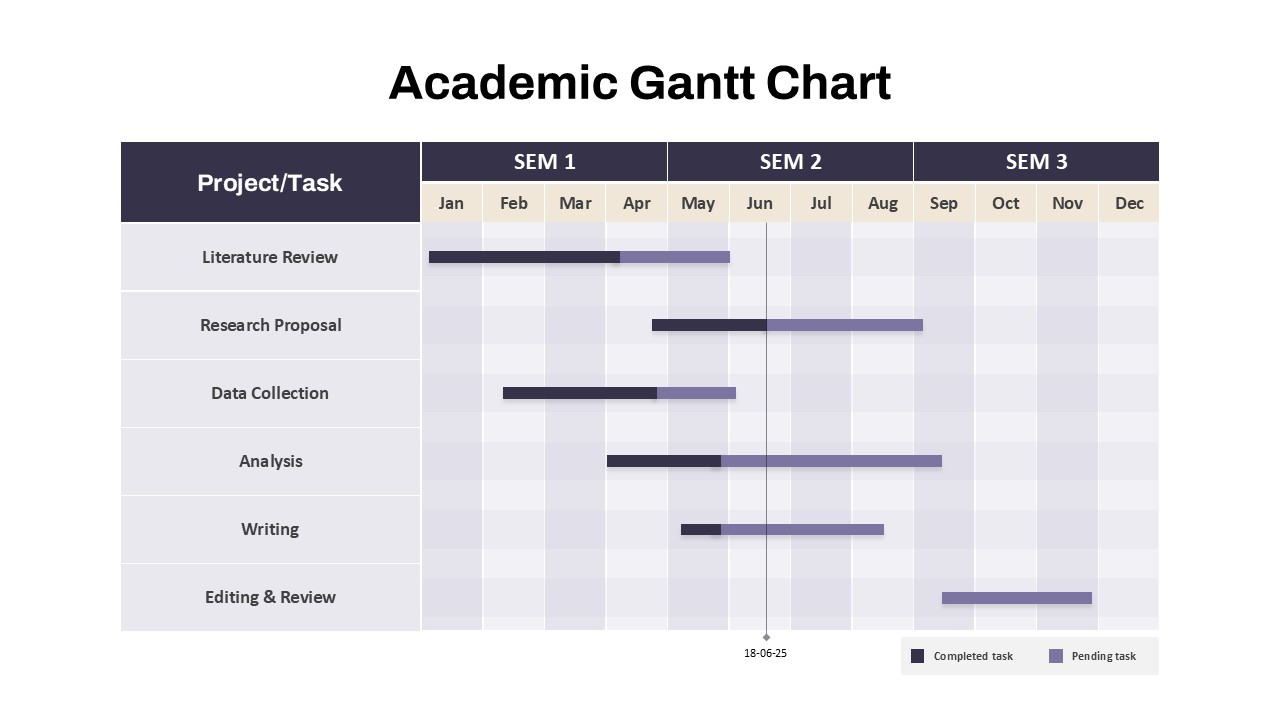
Academic Gantt Chart template for PowerPoint & Google Slides
Business
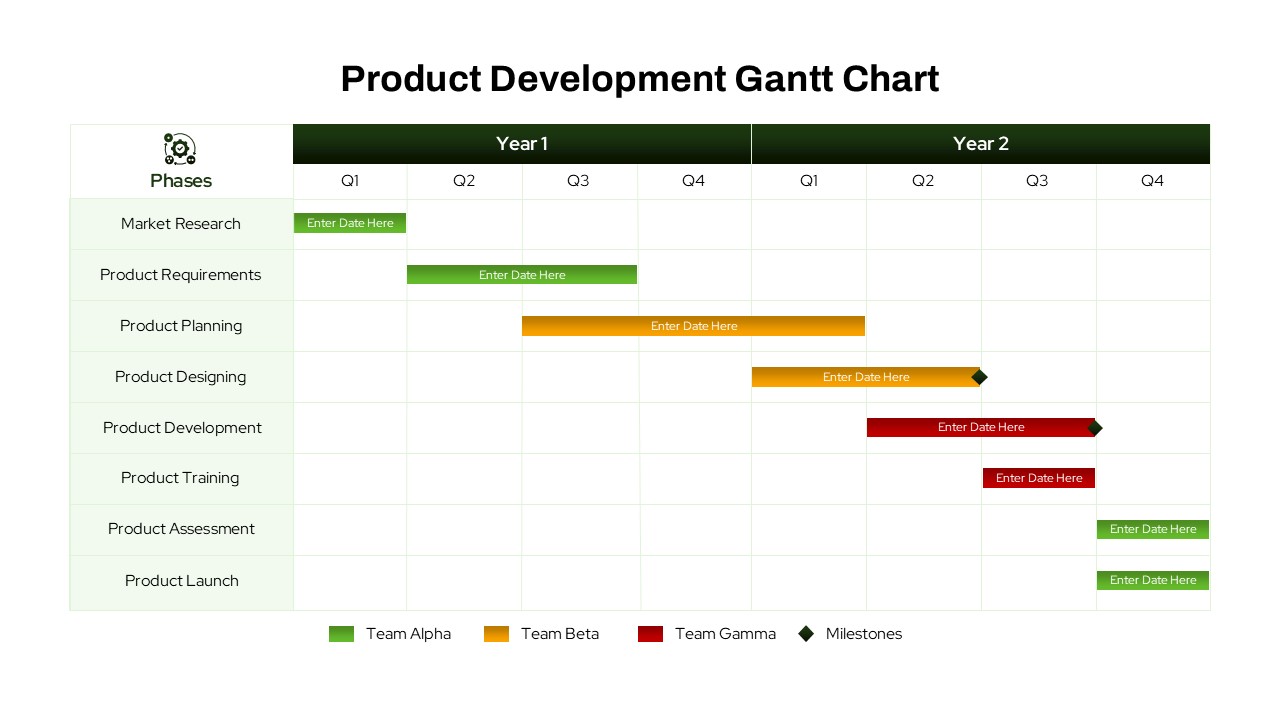
Product Development Gantt Chart template for PowerPoint & Google Slides
Gantt Chart
Static Gantt Chart Overview template for PowerPoint & Google Slides
Project Status
Bar Gantt Chart Template for PowerPoint & Google Slides
Gantt Chart
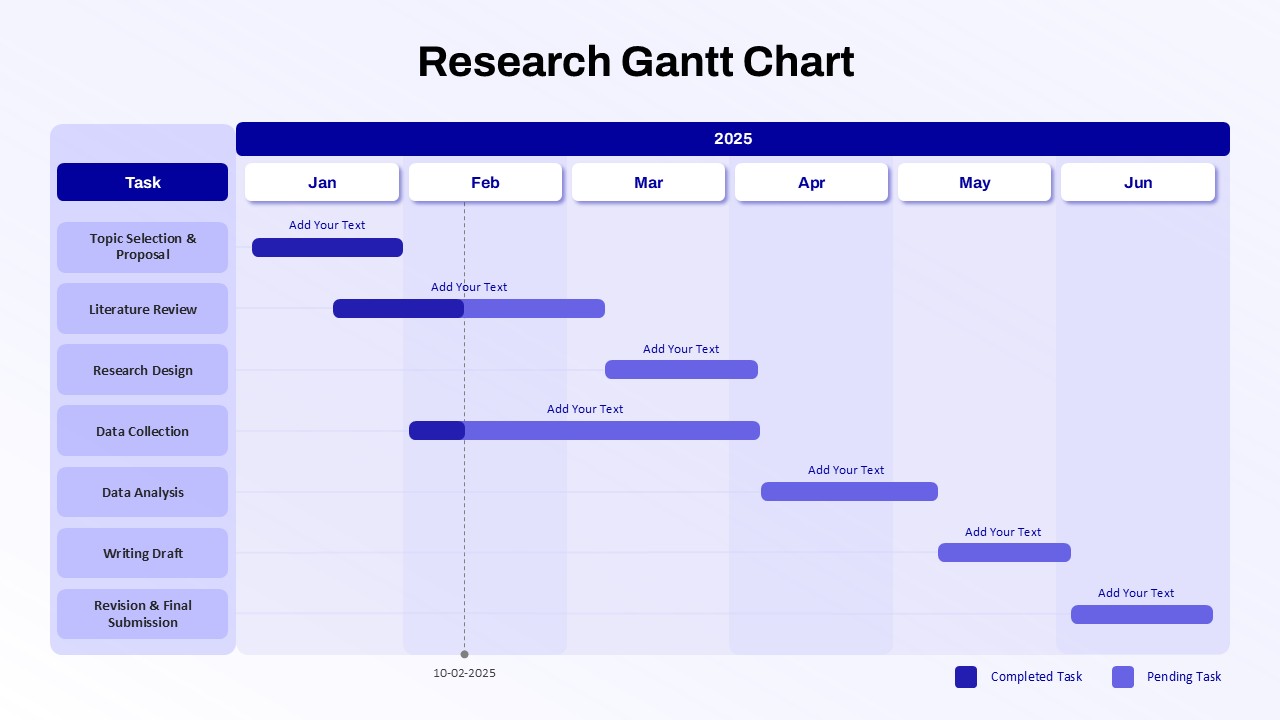
Research Gantt Chart template for PowerPoint & Google Slides
Project
Green Gantt Chart Template for PowerPoint & Google Slides
Gantt Chart
Weekly Gantt Chart with Milestones Template for PowerPoint & Google Slides
Gantt Chart
Yearly Gantt Chart with Presentation Template for PowerPoint & Google Slides
Gantt Chart
Quarterly Gantt Chart with Today Marker Template for PowerPoint & Google Slides
Gantt Chart
Half Year Gantt Chart Templat for PowerPoint & Google Slides
Gantt Chart
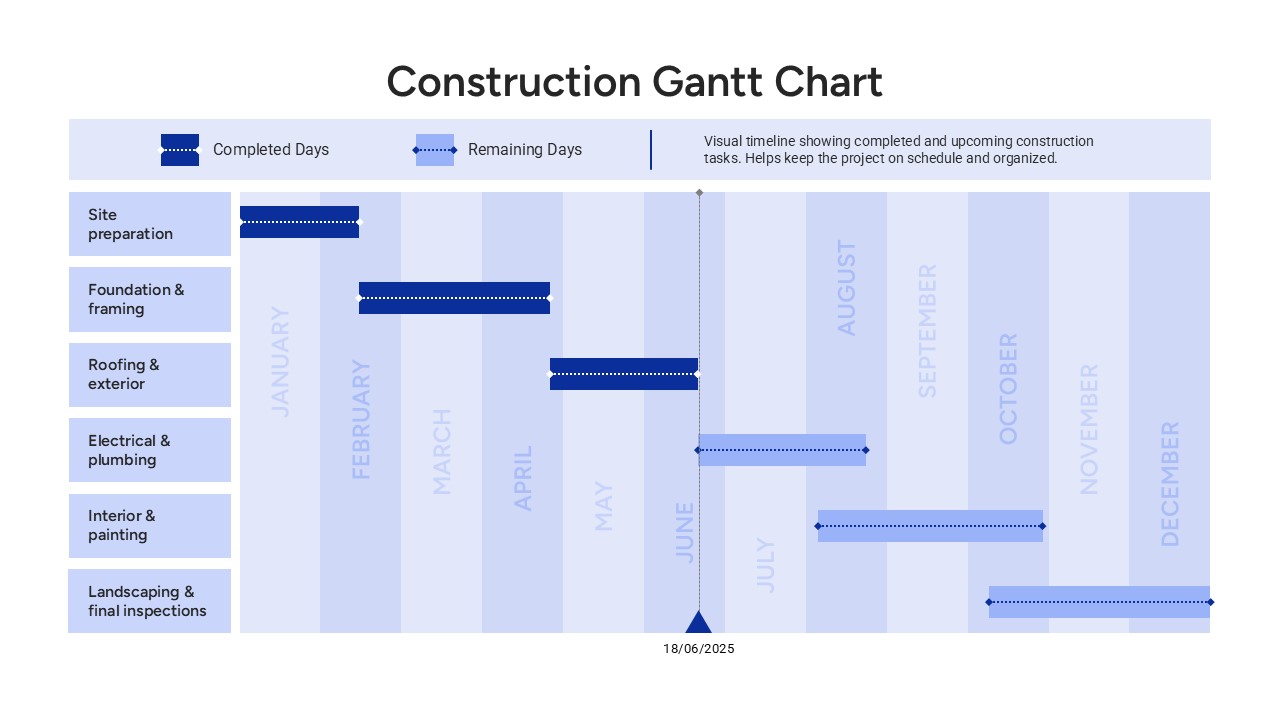
Construction Gantt Chart Template
Gantt Chart
Annual Report Template for PowerPoint & Google Slides
Company Profile
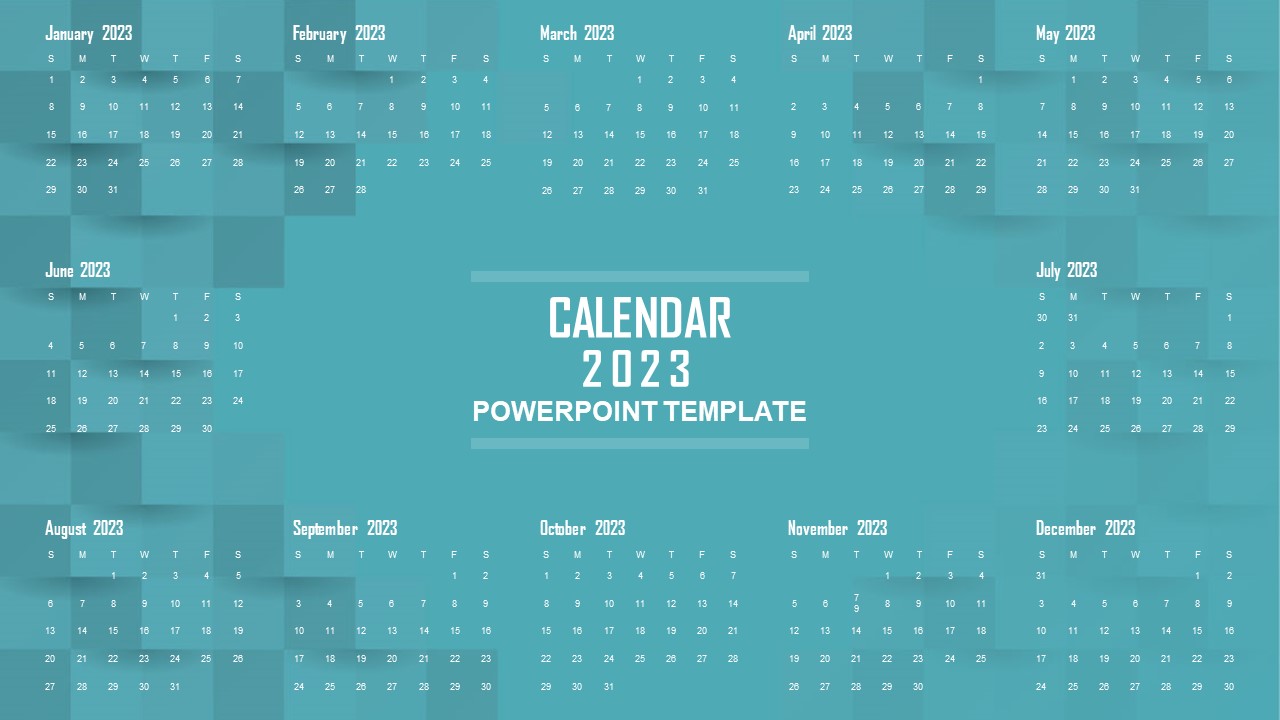
Elegant 2023 Annual Calendar Overview Template for PowerPoint & Google Slides
Timeline
Gradient Annual Plan & Strategy Deck Template for PowerPoint & Google Slides
Decks
Annual Report Overview Template for PowerPoint & Google Slides
Decks
One Pager Annual Report Dashboard Template for PowerPoint & Google Slides
Business Report
Annual Recurring Revenue Metrics Template for PowerPoint & Google Slides
Bar/Column
Annual Financial Results Slide Deck Template for PowerPoint & Google Slides
Finance
Free Annual Business Report Slide for PowerPoint & Google Slides
Finance
Free
Annual Financial Results Snapshot Template for PowerPoint & Google Slide
Finance
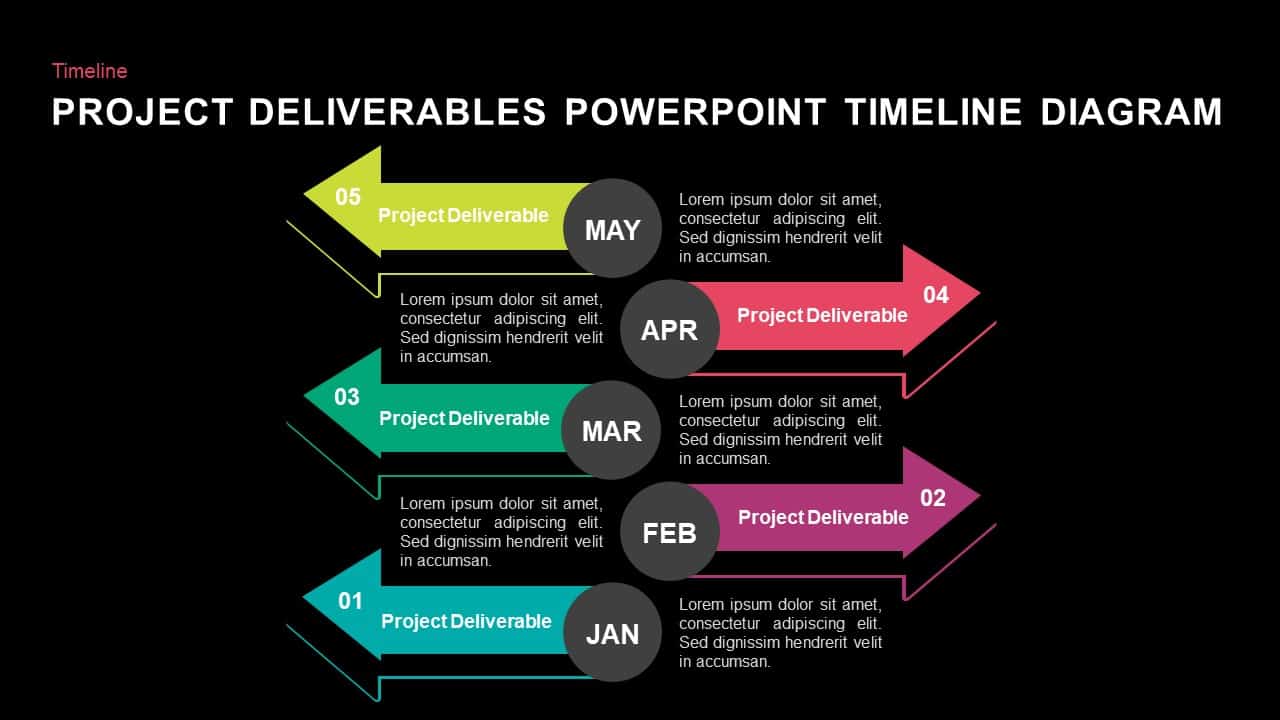
Project Deliverables Timeline Template for PowerPoint & Google Slides
Timeline
Project Timeline Management template for PowerPoint & Google Slides
Infographics
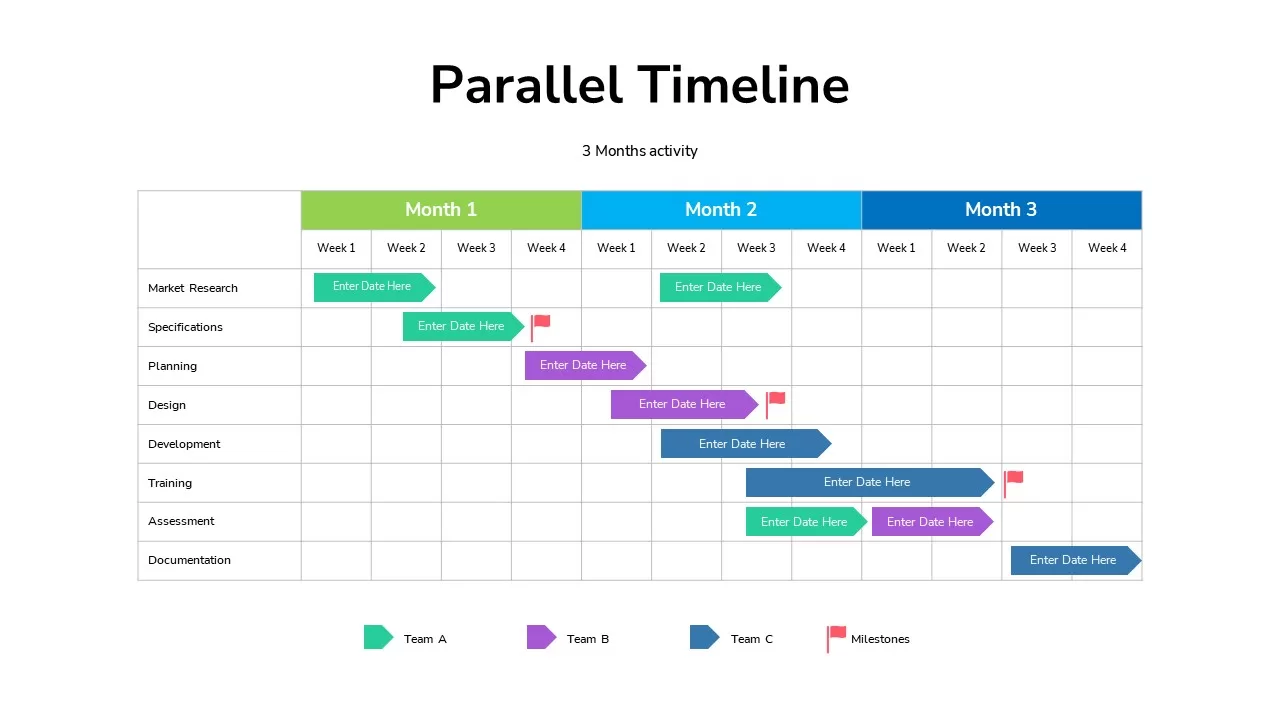
Animated Parallel Timeline Project template for PowerPoint & Google Slides
Infographics
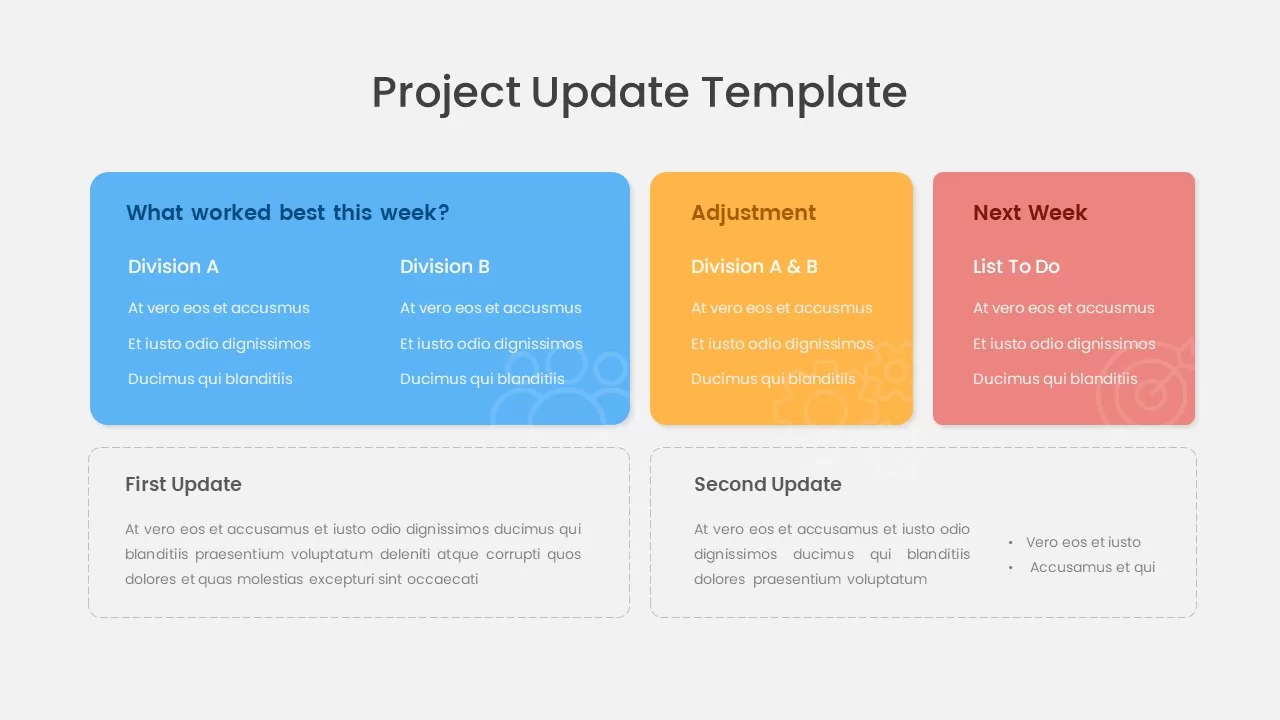
Project Update & Timeline Infographic Template for PowerPoint & Google Slides
Business
Horizontal Timeline Project Status Template for PowerPoint & Google Slides
Project Status
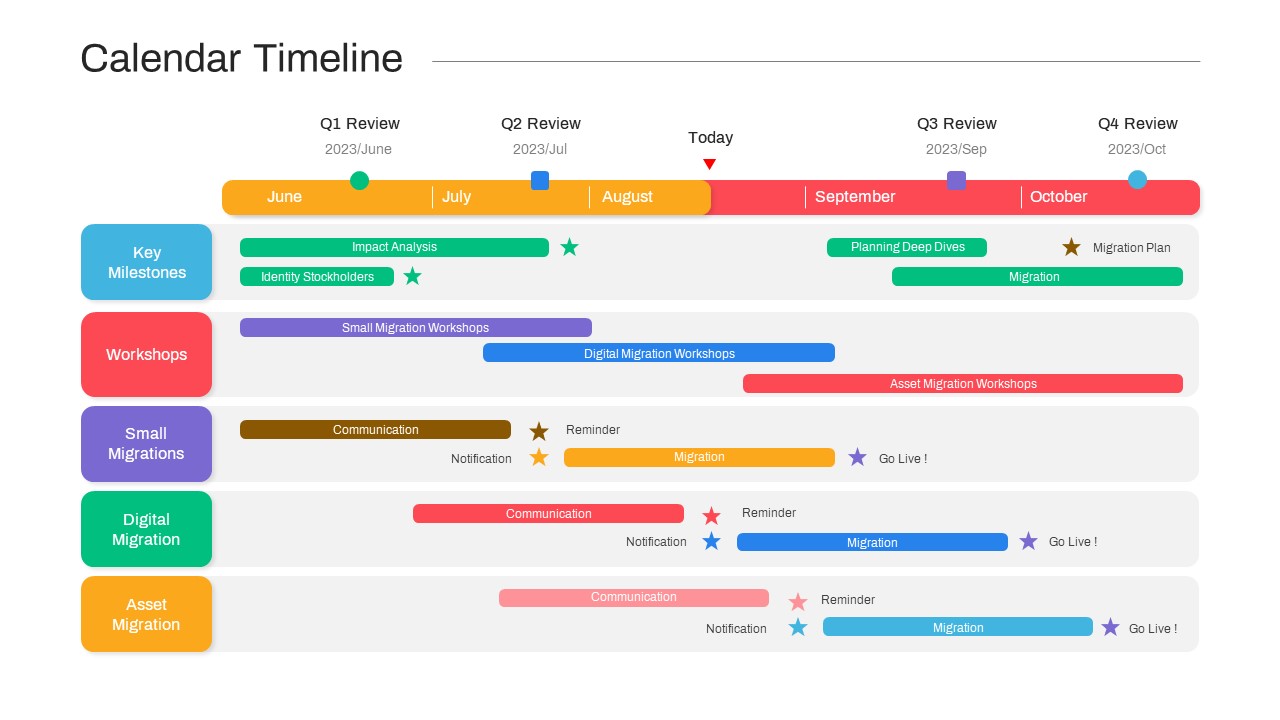
Calendar Migration Project Timeline Template for PowerPoint & Google Slides
Timeline
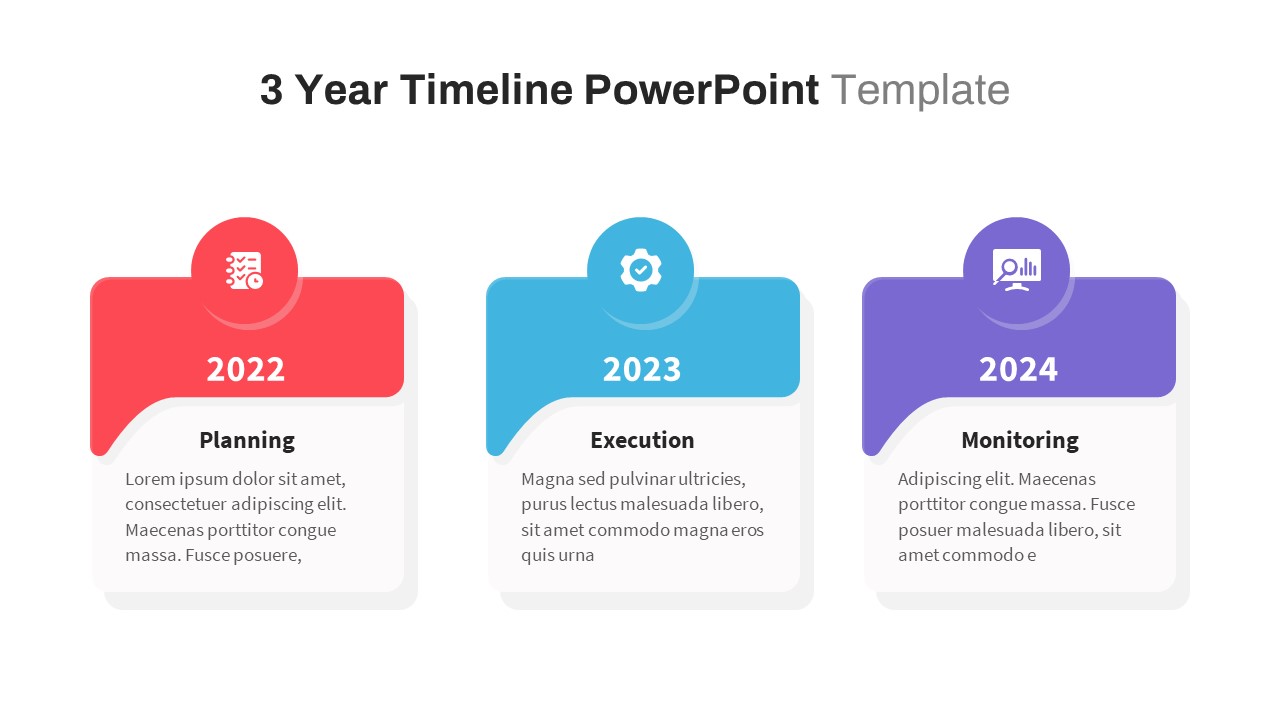
Three-Year Project Roadmap Timeline Template for PowerPoint & Google Slides
Timeline
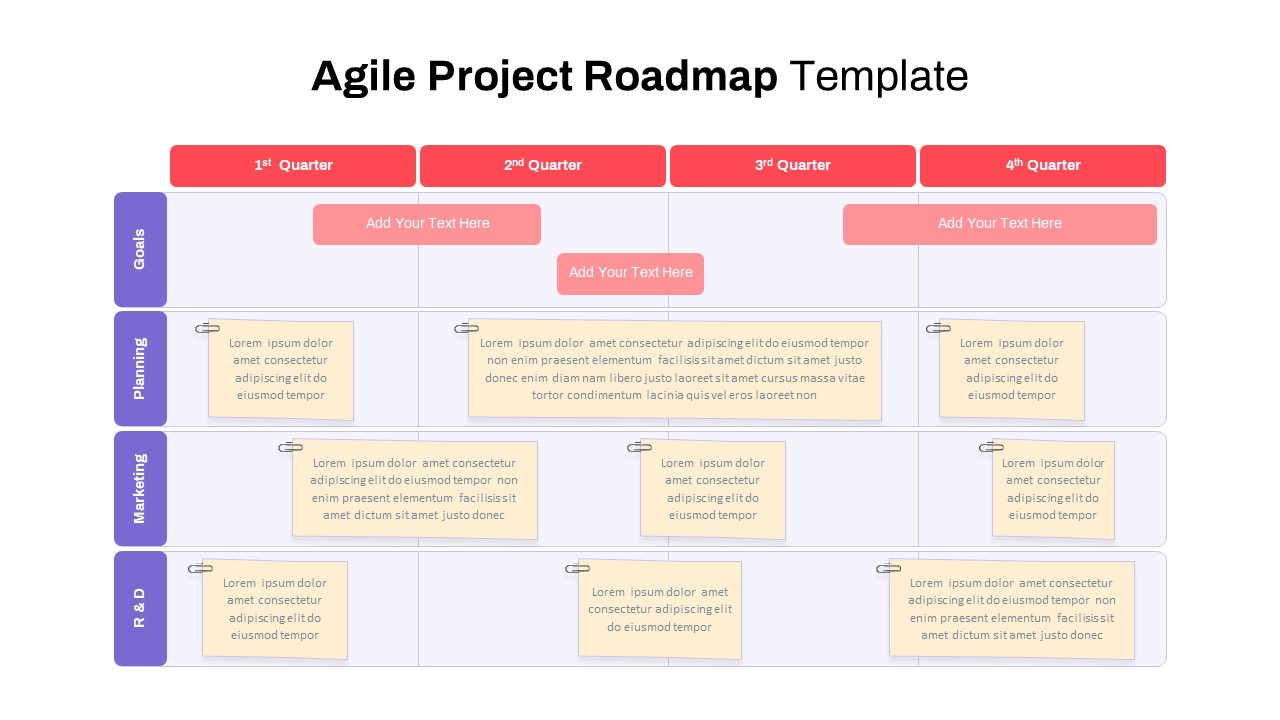
Agile Project Roadmap Timeline Template Pack for PowerPoint & Google Slides
Scrum
Project Comparison Timeline Roadmap Template for PowerPoint & Google Slides
Comparison
Project Milestone Timeline Infographic Template for PowerPoint & Google Slides
Timeline
Creative Project Timeline Roadmap Template for PowerPoint & Google Slides
Timeline
Wavy Timeline Project Roadmap Slide for PowerPoint & Google Slides
Project Status
Project Plan Timeline for PowerPoint & Google Slides
Business Plan
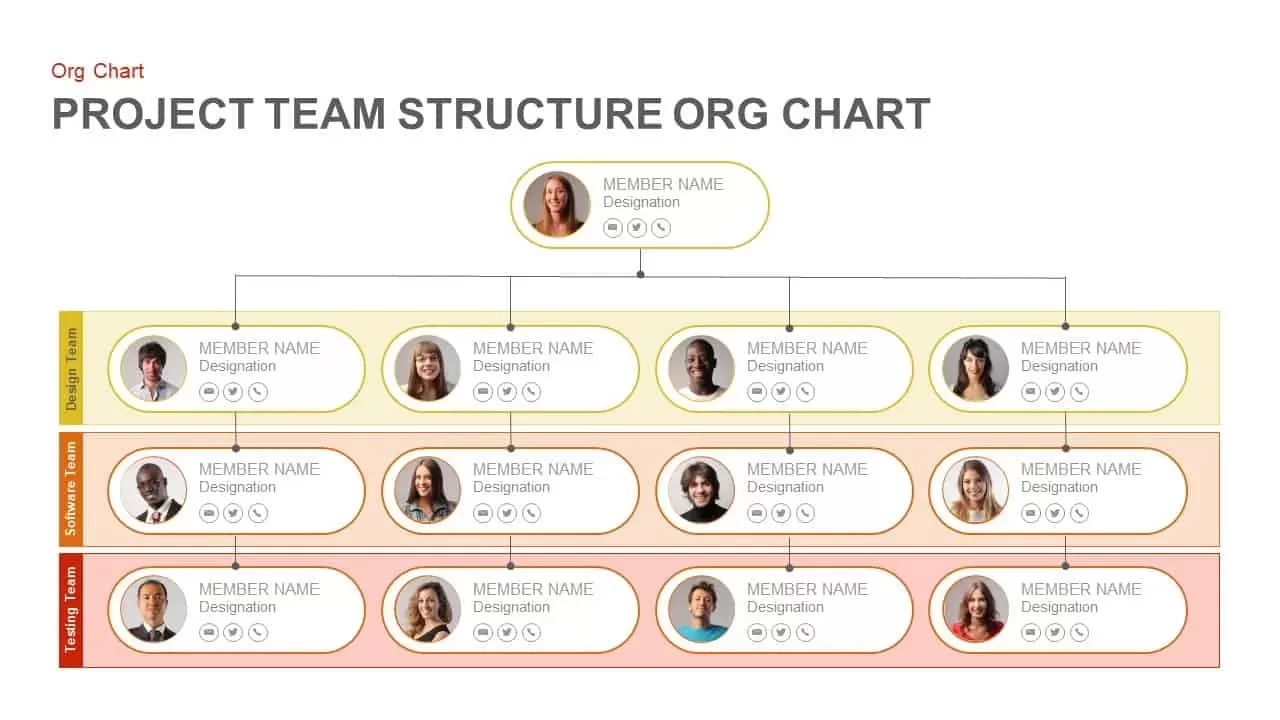
Project Team Structure Org Chart Template for PowerPoint & Google Slides
Org Chart
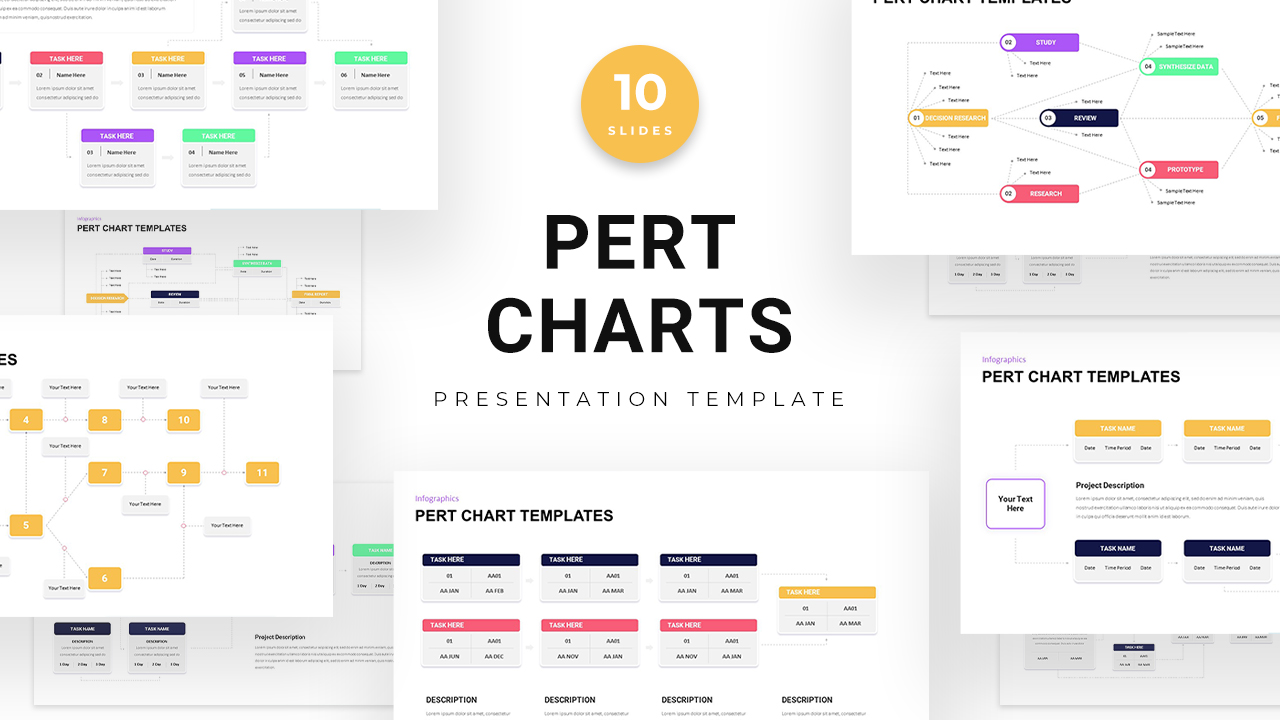
PERT Chart Project Management template for PowerPoint & Google Slides
Project Status
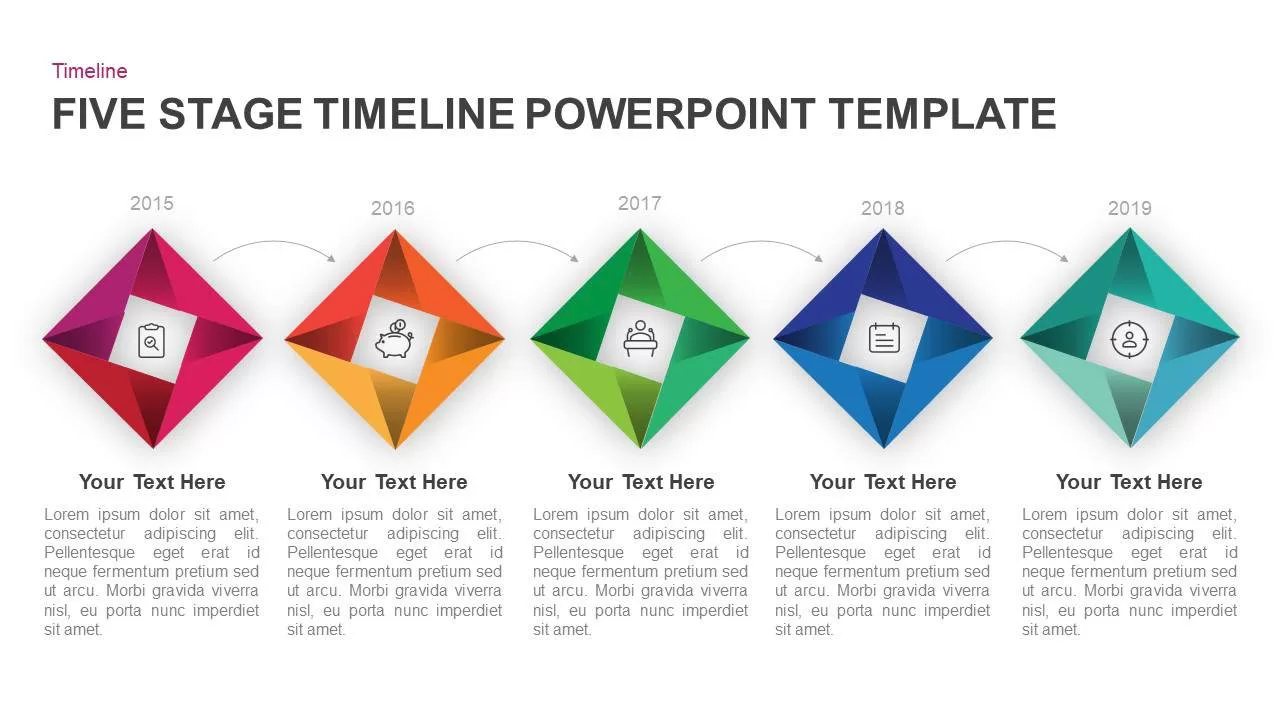
Five-Stage Diamond Timeline Chart Template for PowerPoint & Google Slides
Timeline
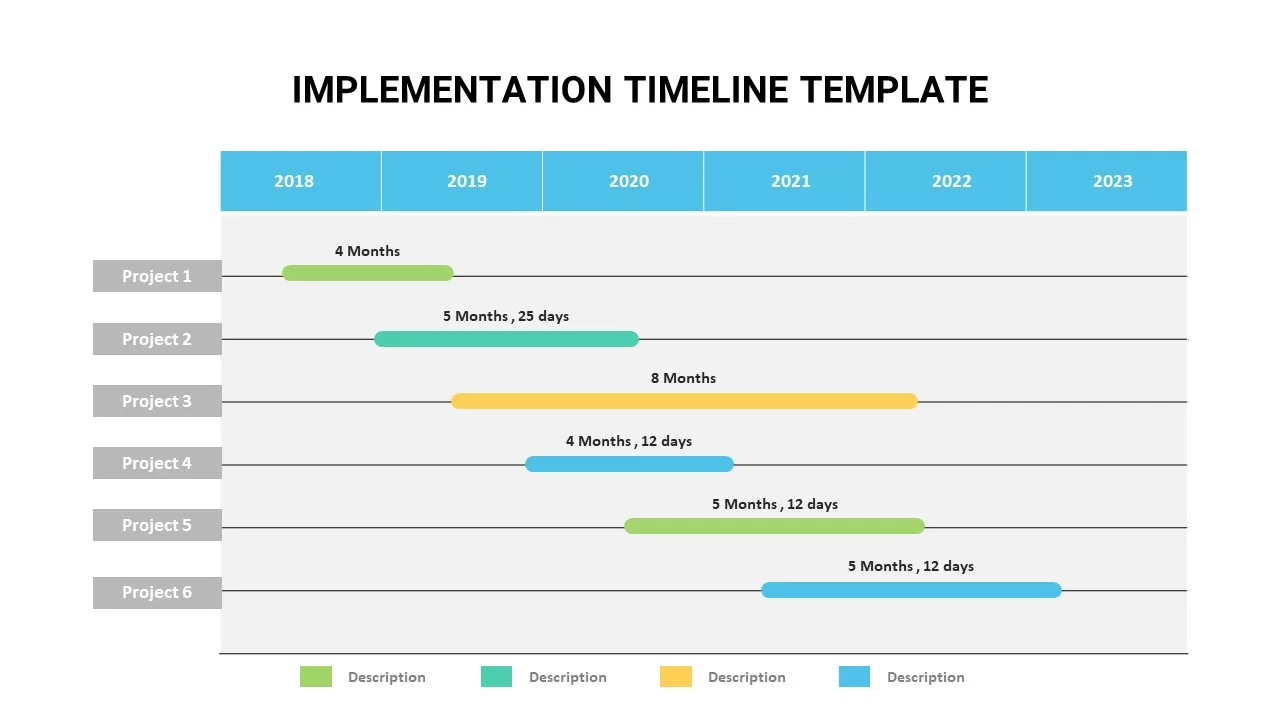
Animated Implementation Timeline Chart Template for PowerPoint & Google Slides
Timeline
Business Timeline Comparison Bar Chart Template for PowerPoint & Google Slides
Comparison Chart
Excel-Driven Gradient Timeline Chart Template for PowerPoint & Google Slides
Five-Phase Horizontal Timeline Chart Template for PowerPoint & Google Slides
Timeline
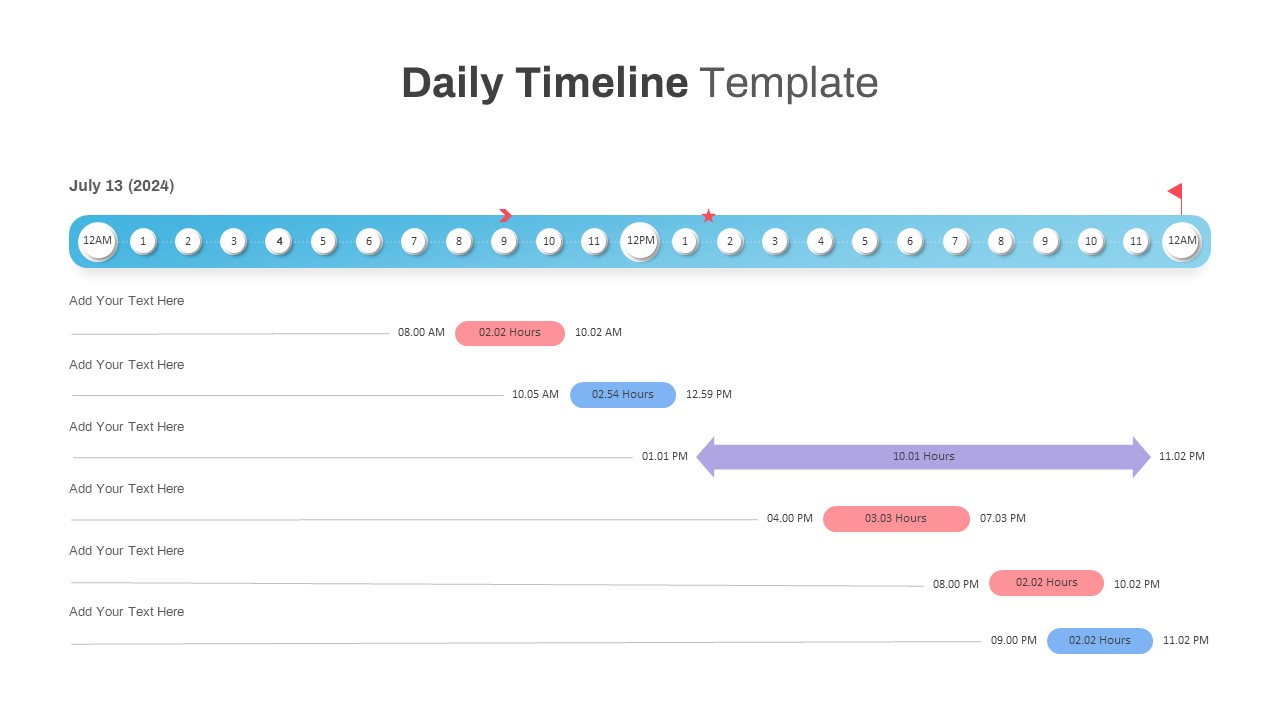
Interactive Daily Timeline Schedule Chart Template for PowerPoint & Google Slides
Timeline
Professional Milestone Timeline Chart Template for PowerPoint & Google Slides
Timeline
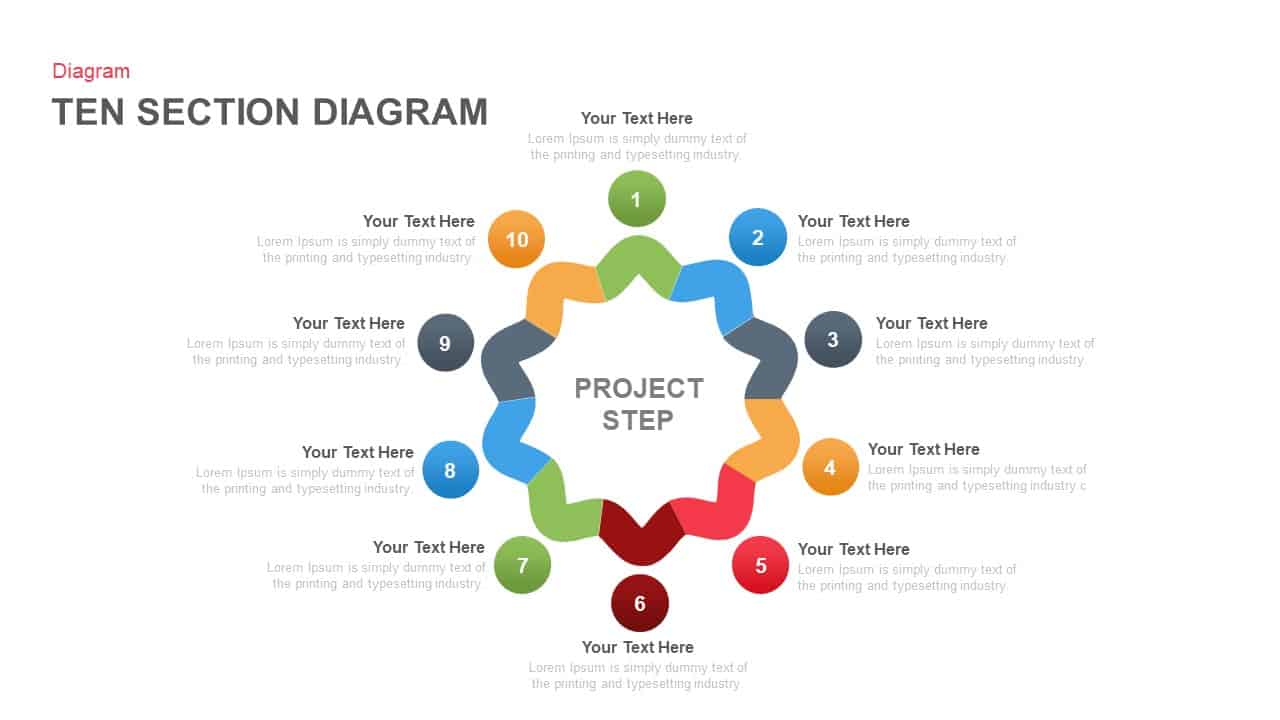
Ten-Section Project Steps Diagram Template for PowerPoint & Google Slides
Process
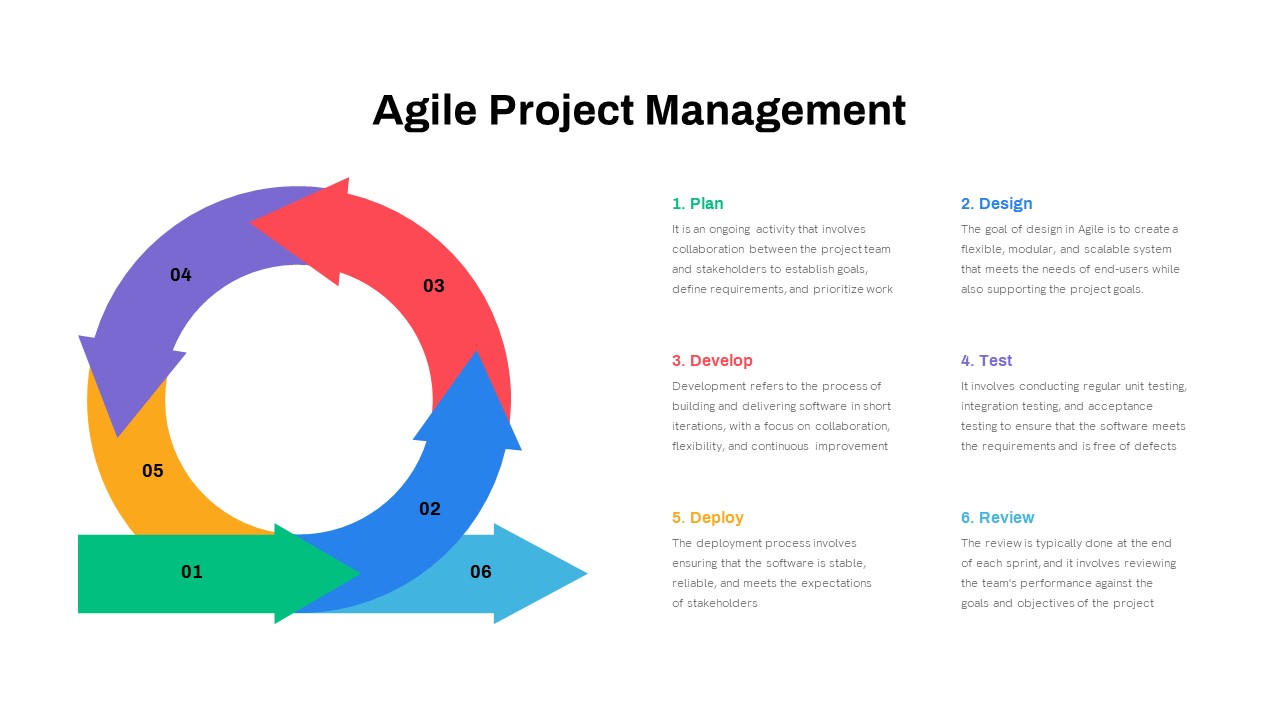
Comprehensive Agile Project Management Template for PowerPoint & Google Slides
Scrum
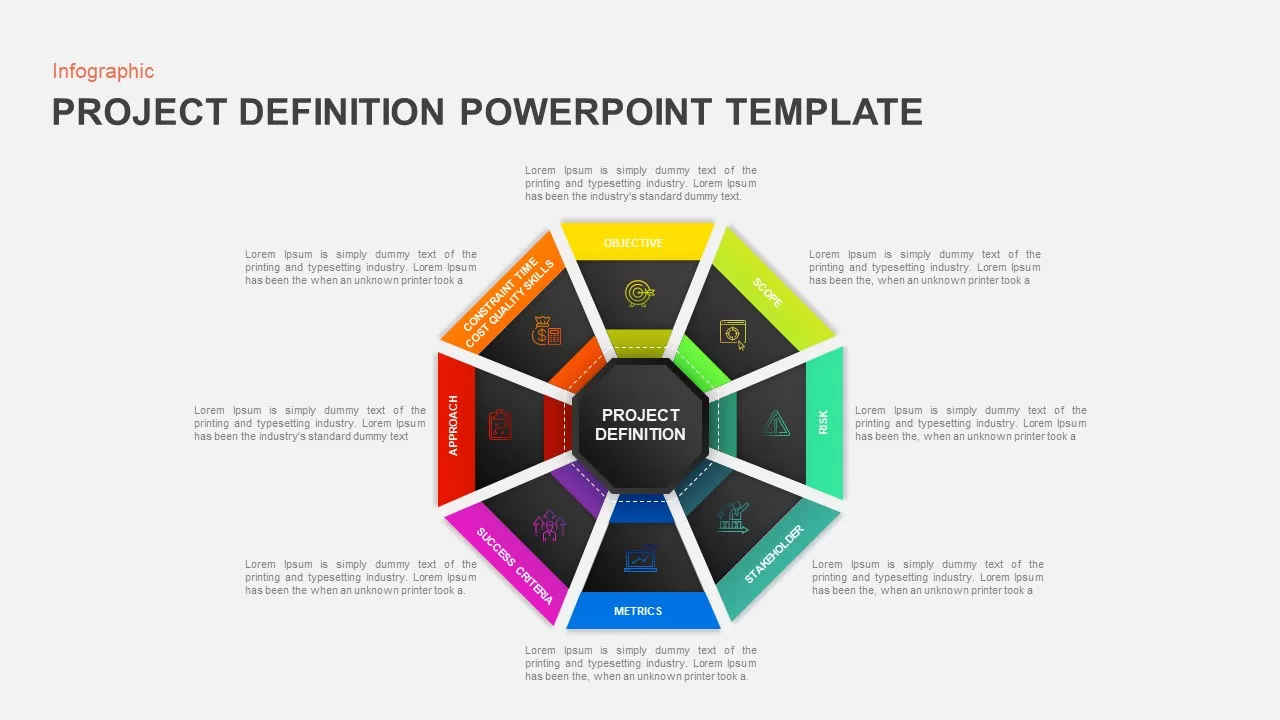
Octagonal Project Definition Infographic Template for PowerPoint & Google Slides
Process
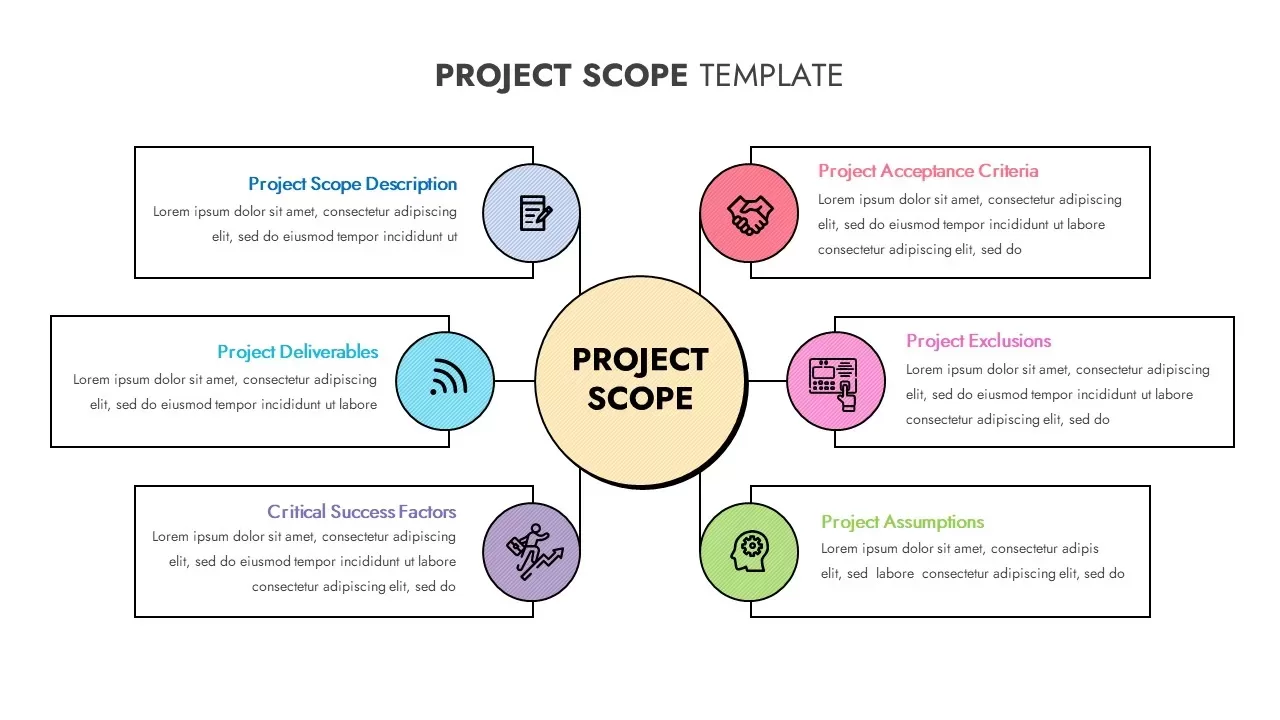
Project Scope Hub & Spoke Layout Template for PowerPoint & Google Slides
Process
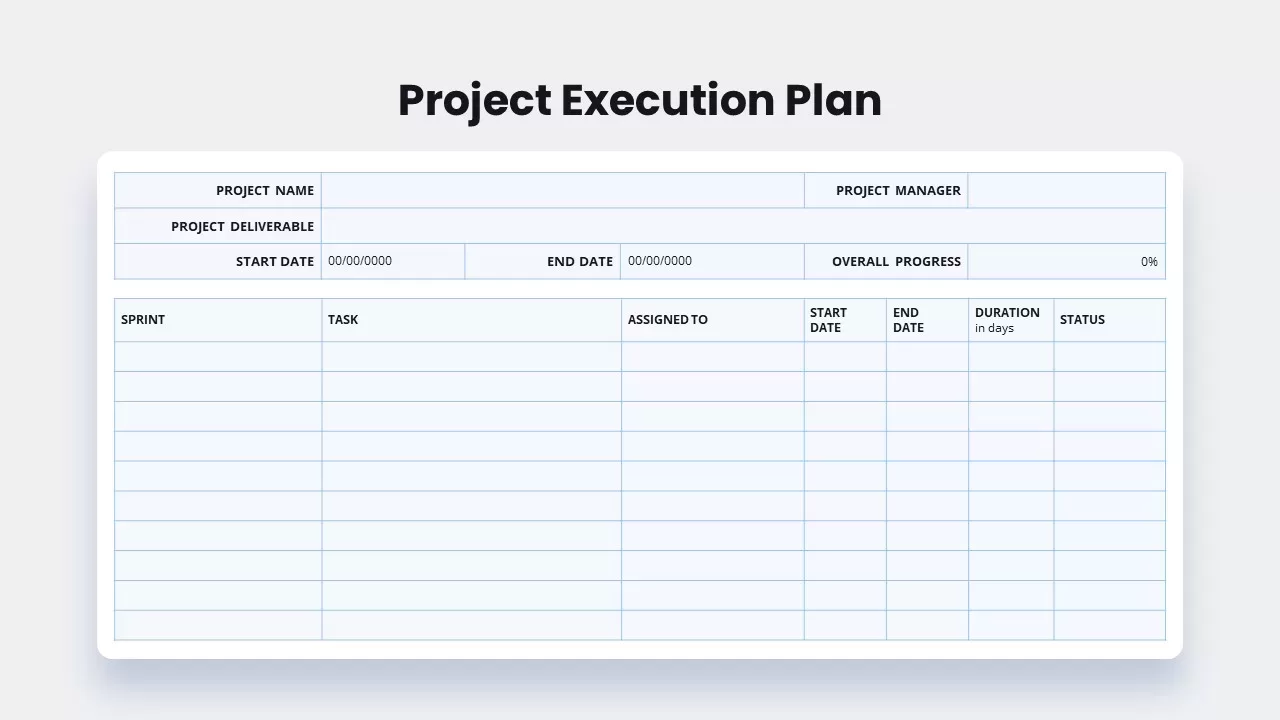
Comprehensive Project Execution Plan template for PowerPoint & Google Slides
Project Status
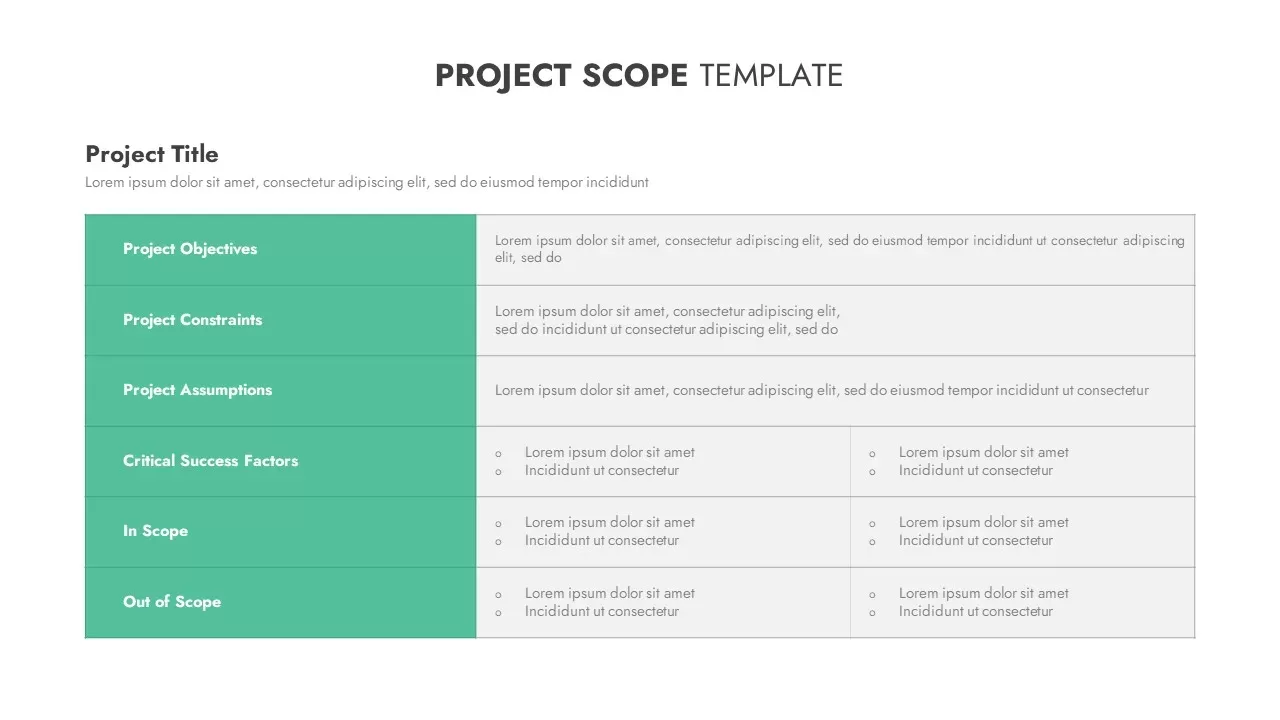
Modern Project Scope Template for PowerPoint & Google Slides
Project
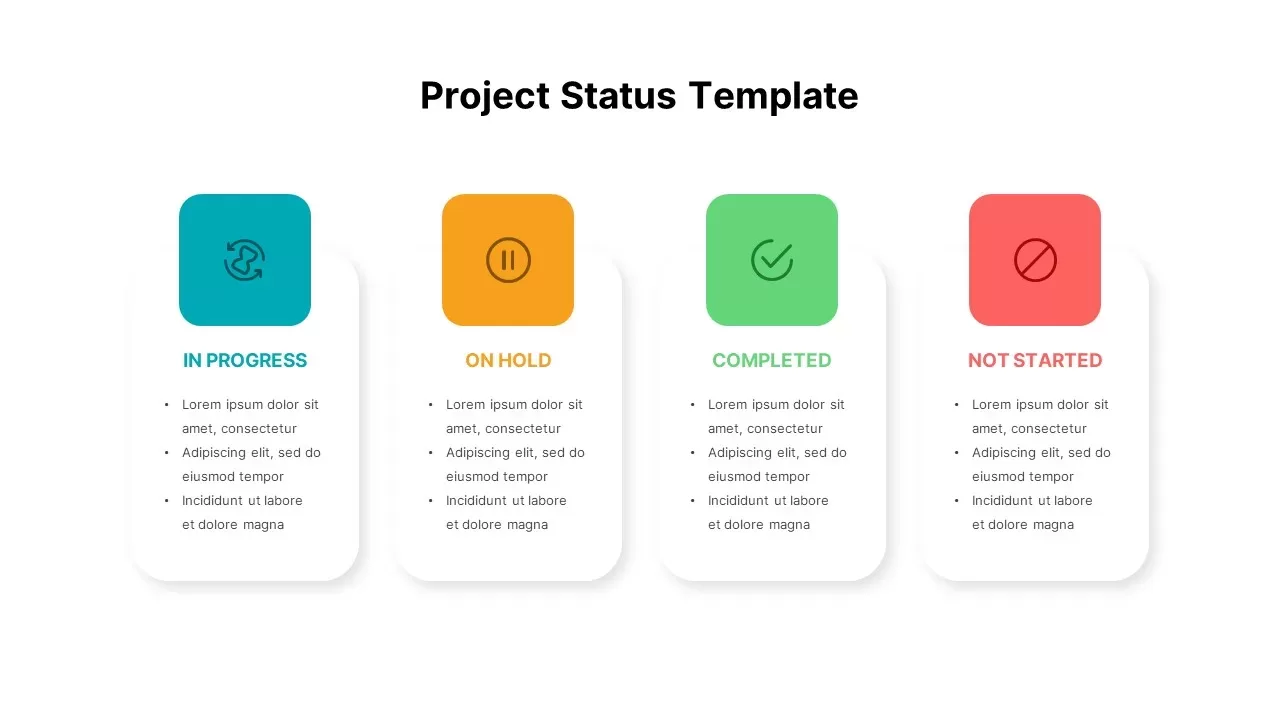
Clean Minimal Project Status Update Template for PowerPoint & Google Slides
Project
Colorful Project Status Dashboard Template for PowerPoint & Google Slides
Project Status
Color-Coded Project Status Template for PowerPoint & Google Slides
Project Status
Color-Coded Project Status Slide Template for PowerPoint & Google Slides
Project Status
Circular Project Status Template for PowerPoint & Google Slides
Project Status
Project Status Dashboard Template for PowerPoint & Google Slides
Project Status
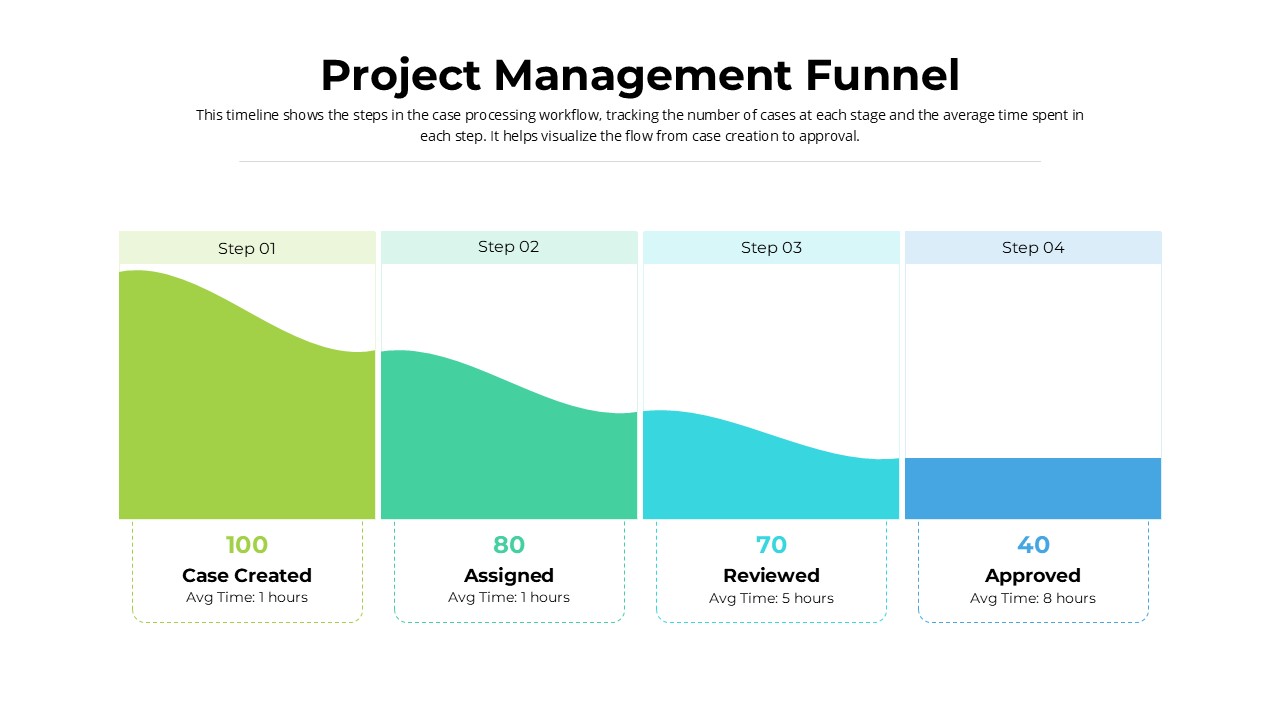
Project Management Funnel template for PowerPoint & Google Slides
Project
Project Requirements Matrix Template for PowerPoint & Google Slides
Project
Weekly Project Status Dashboard Template for PowerPoint & Google Slides
Project Status
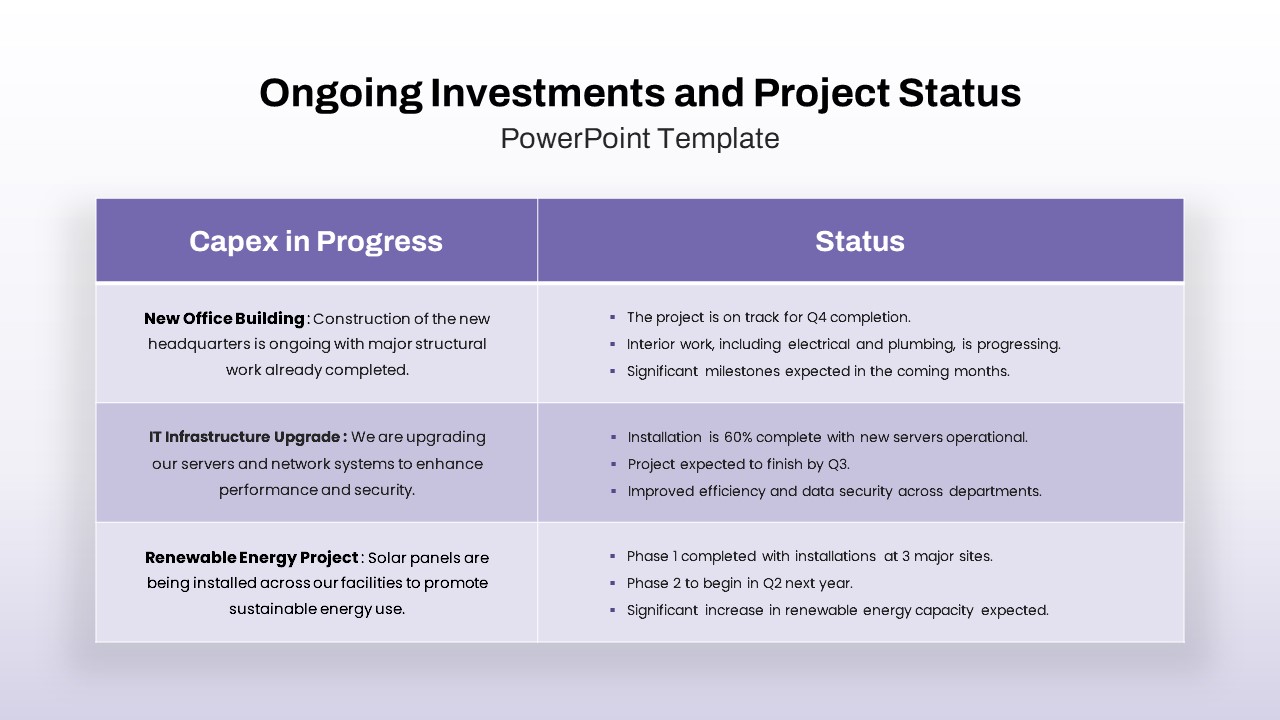
Ongoing Investments and Project Status Template for PowerPoint & Google Slides
Project Status
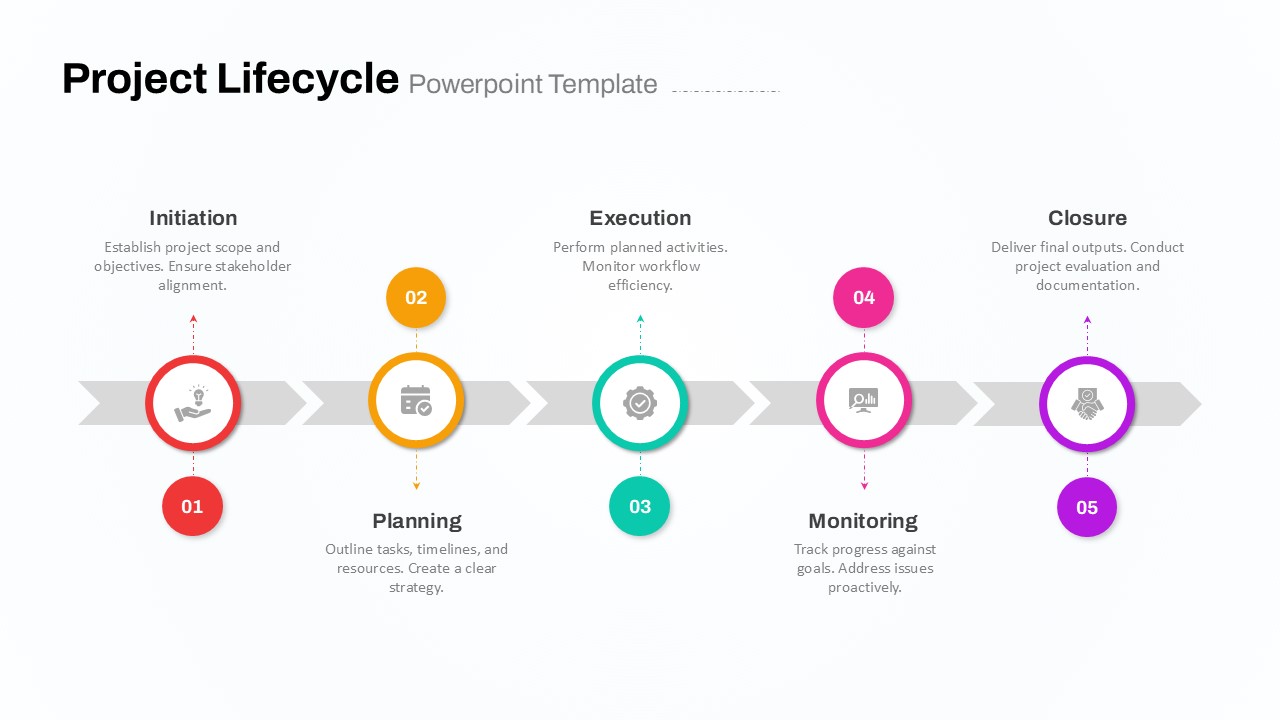
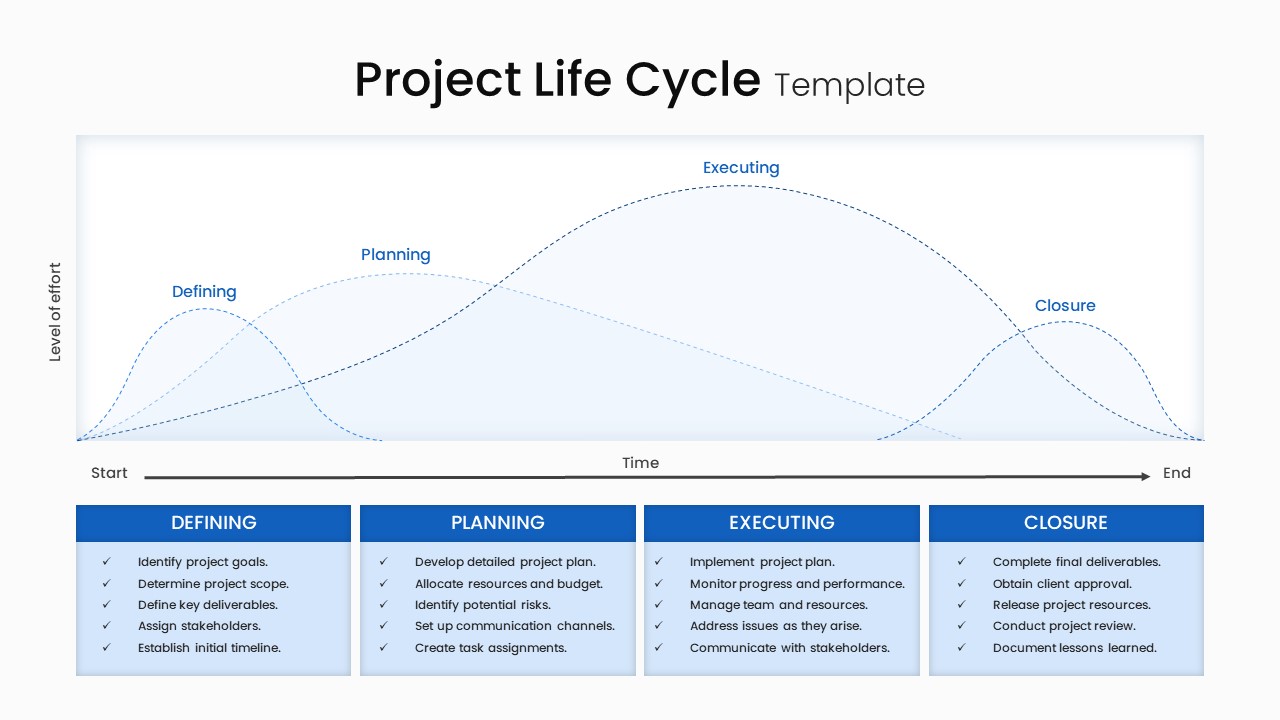
Five-Phase Project Lifecycle Diagram Template for PowerPoint & Google Slides
Infographics
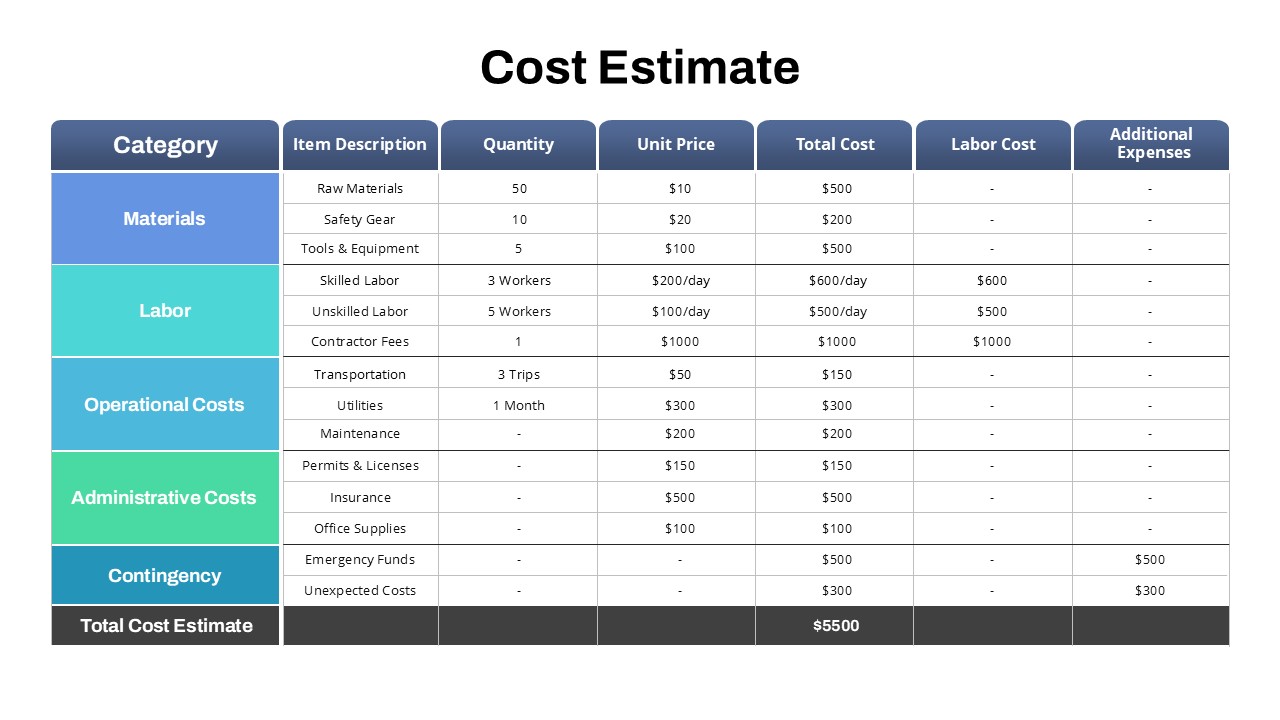
Project Detailed Cost Estimate Table Template for PowerPoint & Google Slides
Project
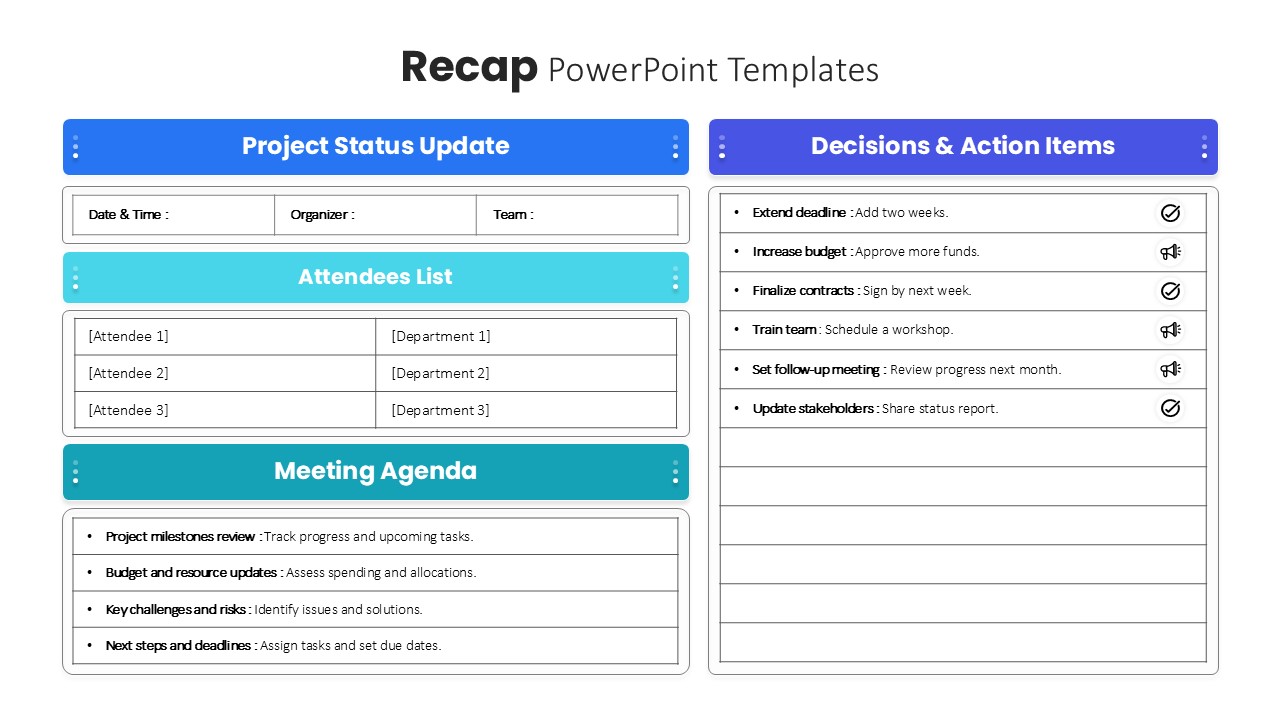
Project Meeting Recap & Action Items Template for PowerPoint & Google Slides
Project Status
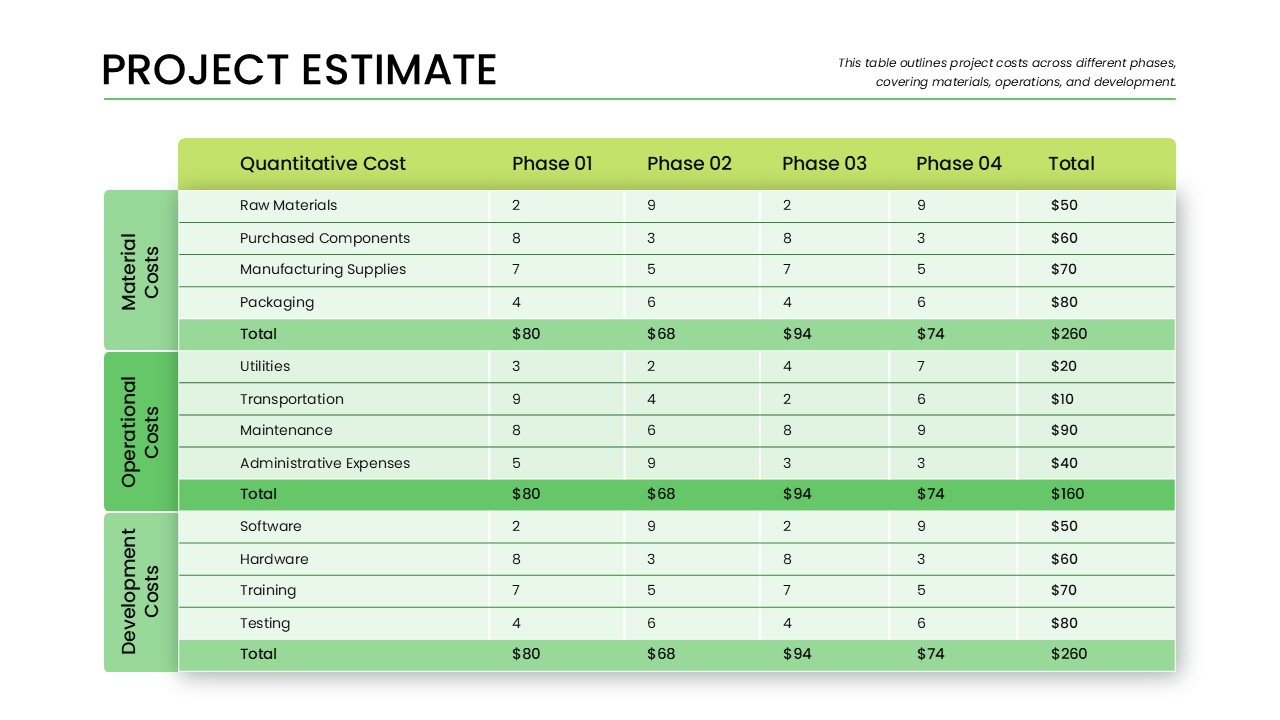
Phase-Wise Project Estimate Table Template for PowerPoint & Google Slides
Business Report
Project Life Cycle Workflow Diagram Template for PowerPoint & Google Slides
Process
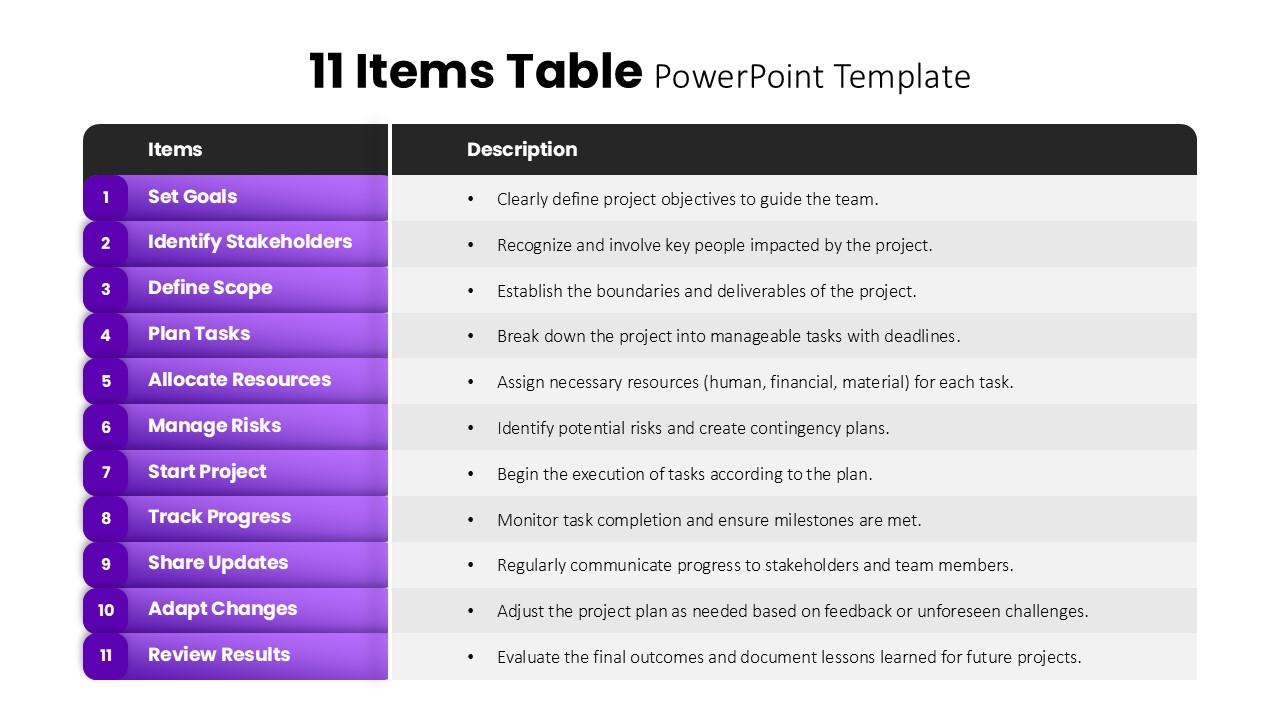
11 Items Table Project Planning Steps template for PowerPoint & Google Slides
Business
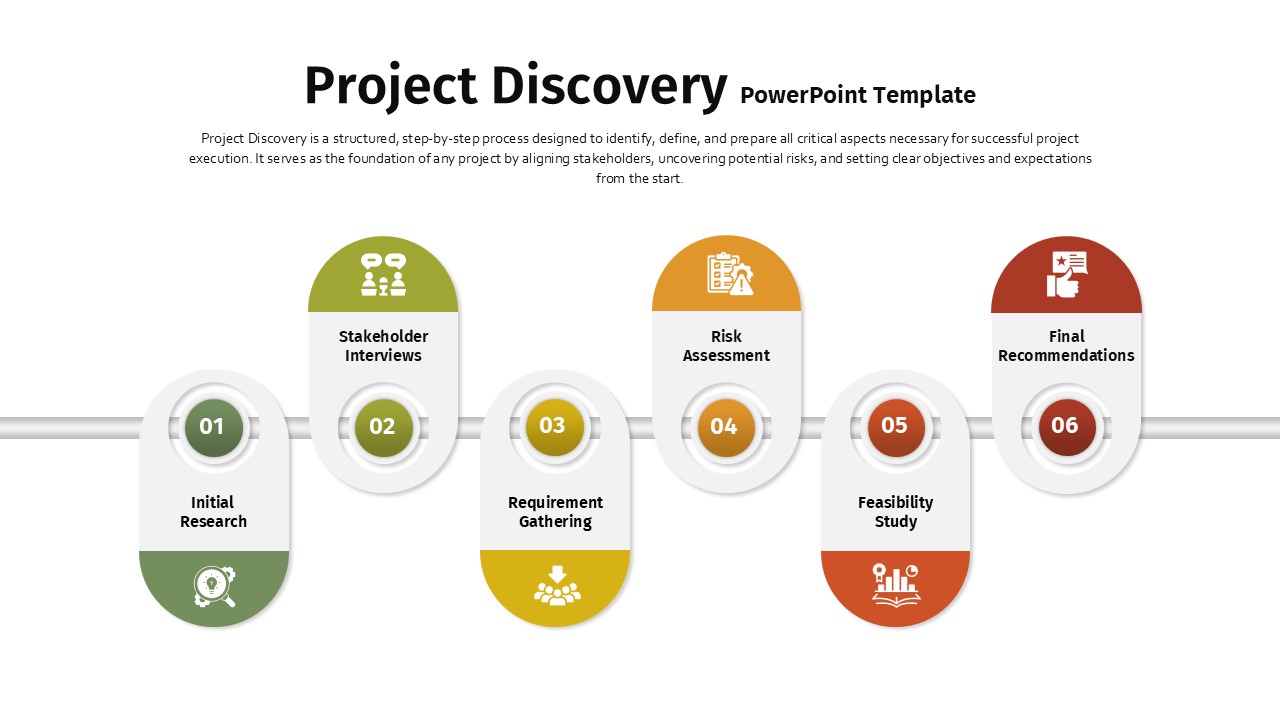
Project Discovery Infographic Pack Template for PowerPoint & Google Slides
Timeline
Project Management Funnel Template for PowerPoint & Google Slides
Funnel
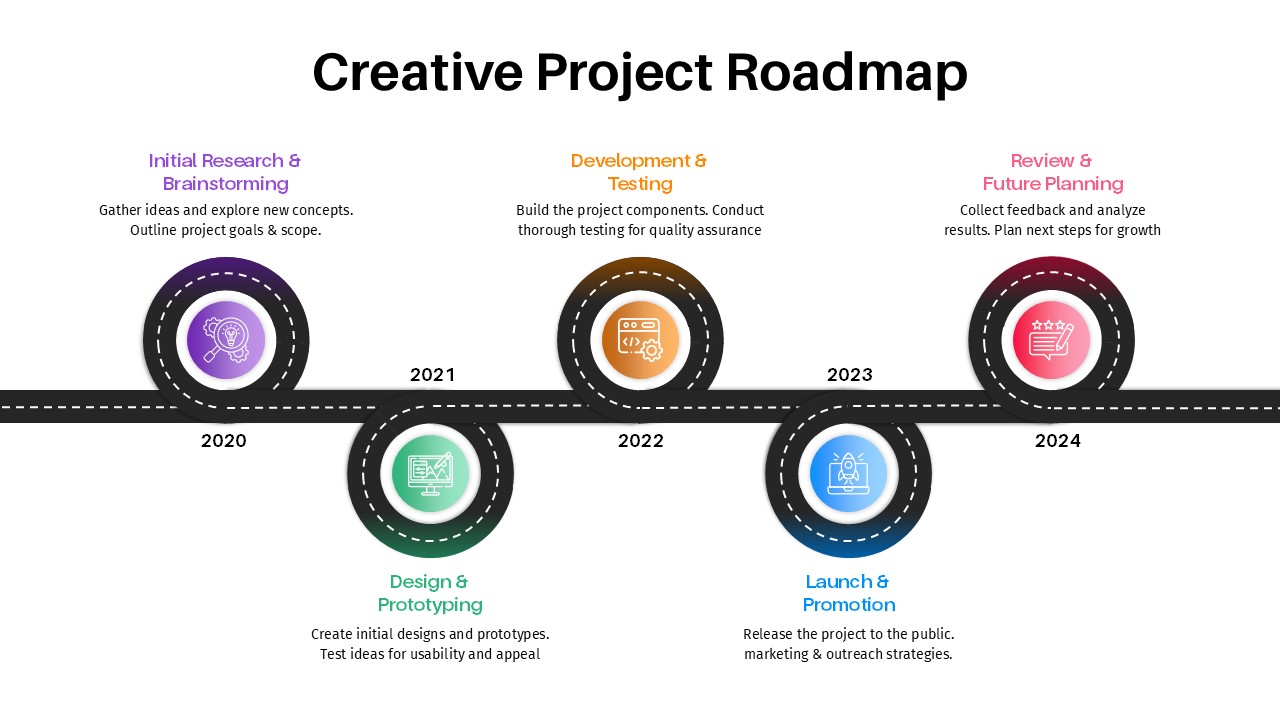
Creative Project Roadmap template for PowerPoint & Google Slides
Business
Project Status Update Dashboard Table Template for PowerPoint & Google Slides
Project Status
Project Status Dashboard Template for PowerPoint & Google Slides
Project Status
Dashboard Project Status Template for PowerPoint & Google Slides
Project Status
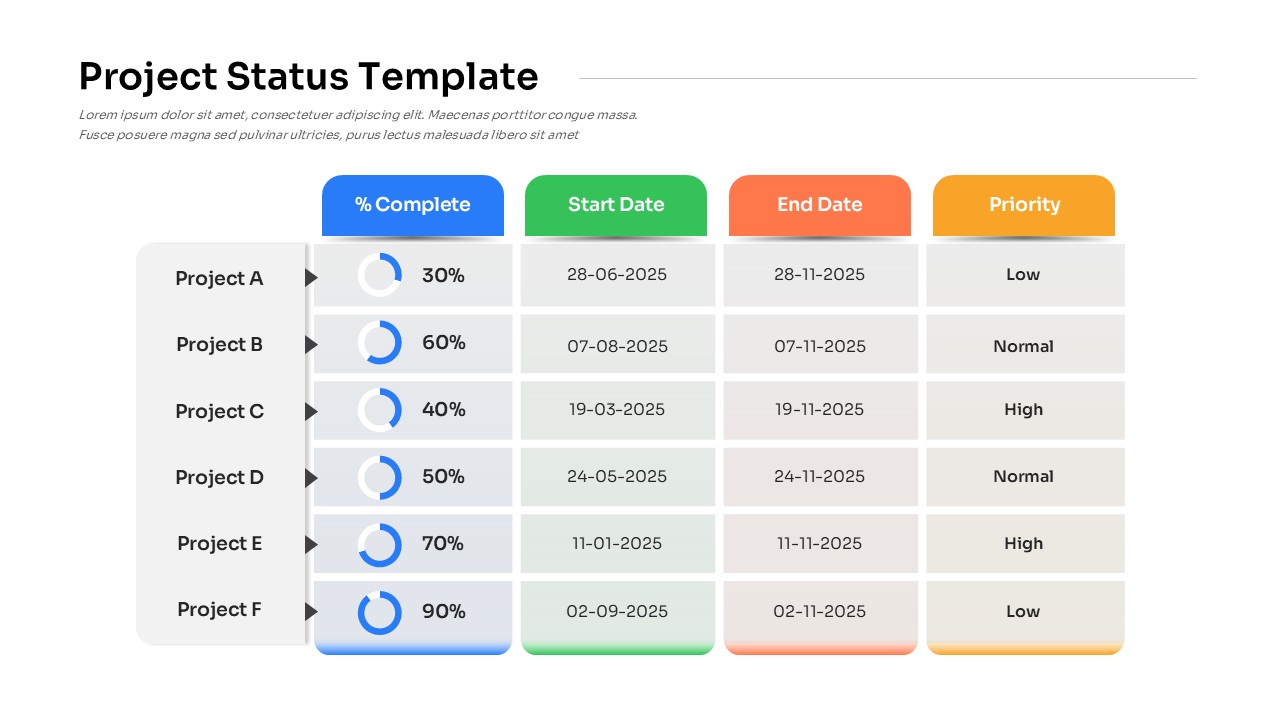
Project Status with Progress & Priority Template for PowerPoint & Google Slides
Table
Project Status Dashboard with RAG Legend Template for PowerPoint & Google Slides
Project Status
Civil Engineering Project Overview Deck Template for PowerPoint & Google Slides
Decks
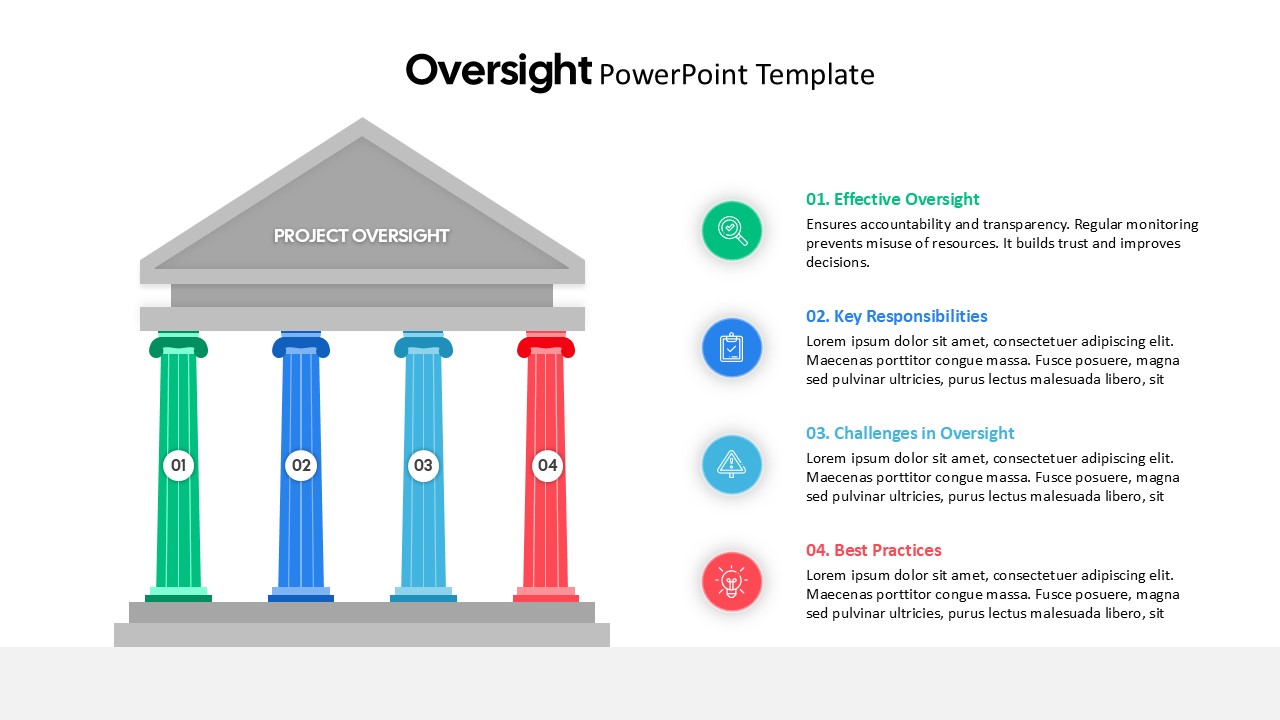
Project Oversight Pillars Infographic Template for PowerPoint & Google Slides
Process
Six Step Project Workflow Template for PowerPoint & Google Slides
Project
Construction Project Dashboard Template for PowerPoint & Google Slides
Project