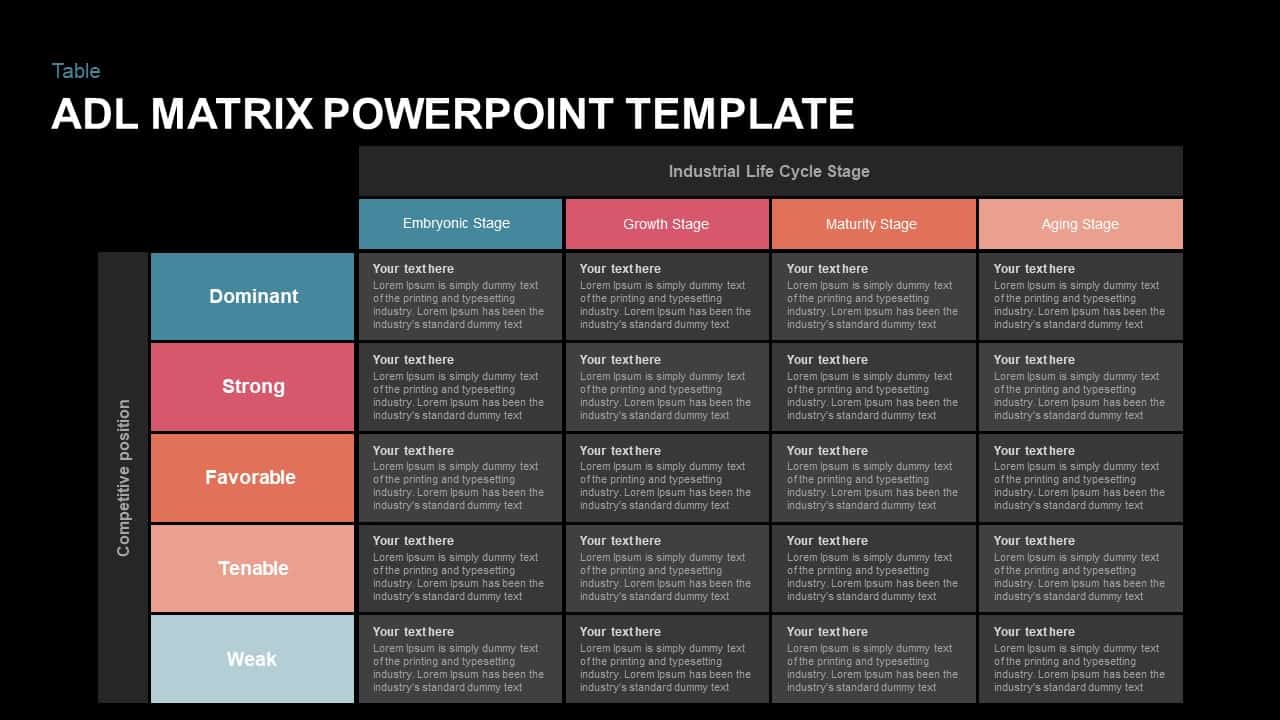
Strategic ADL Matrix by Industry Life Cycle & Position Template for PowerPoint & Google Slides


Description
This ADL Matrix slide visually captures the relationship between a business unit’s competitive position and the stage of its industry life cycle. The matrix structure is organized into a 5×4 grid, where rows represent varying levels of competitive position (from Dominant to Weak), and columns represent industry stages (Embryonic, Growth, Maturity, and Aging). The color-coded headers and rows make it easy to distinguish strategic zones and interpret positioning at a glance.
Ideal for strategy formulation and portfolio analysis, this template offers editable placeholders in each cell to summarize strategic implications, investment decisions, or risk assessments. The clean, table-based format promotes analytical clarity, while the use of subtle background shading and well-contrasted typography ensures legibility across formats.
Built for ease of customization in both PowerPoint and Google Slides, this matrix allows you to input business unit data, adjust life cycle assumptions, and align competitive strategy with industry dynamics. Whether used in board presentations, consulting engagements, or academic lectures, this slide helps convey structured insights with professional impact.
Who is it for
Best suited for strategy consultants, business analysts, corporate planners, and MBA students engaged in competitive analysis, business unit evaluation, or market entry decisions.
Other Uses
Can also be adapted for risk analysis, capability benchmarking, investment prioritization, or innovation portfolio reviews. With editable labels and data zones, it serves as a flexible strategic tool for various industries and organizational contexts.
Login to download this file

Item ID
SB01617
Related Templates

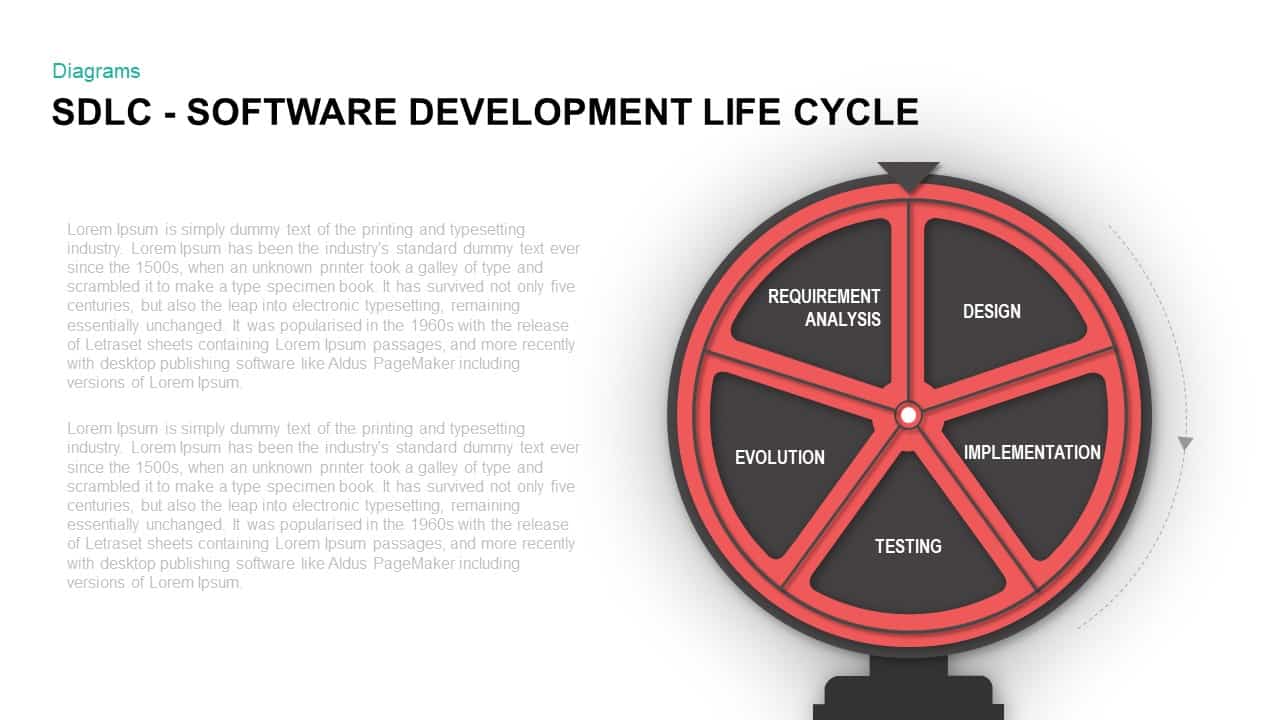
Software Development Life Cycle Diagram Template for PowerPoint & Google Slides
Circular
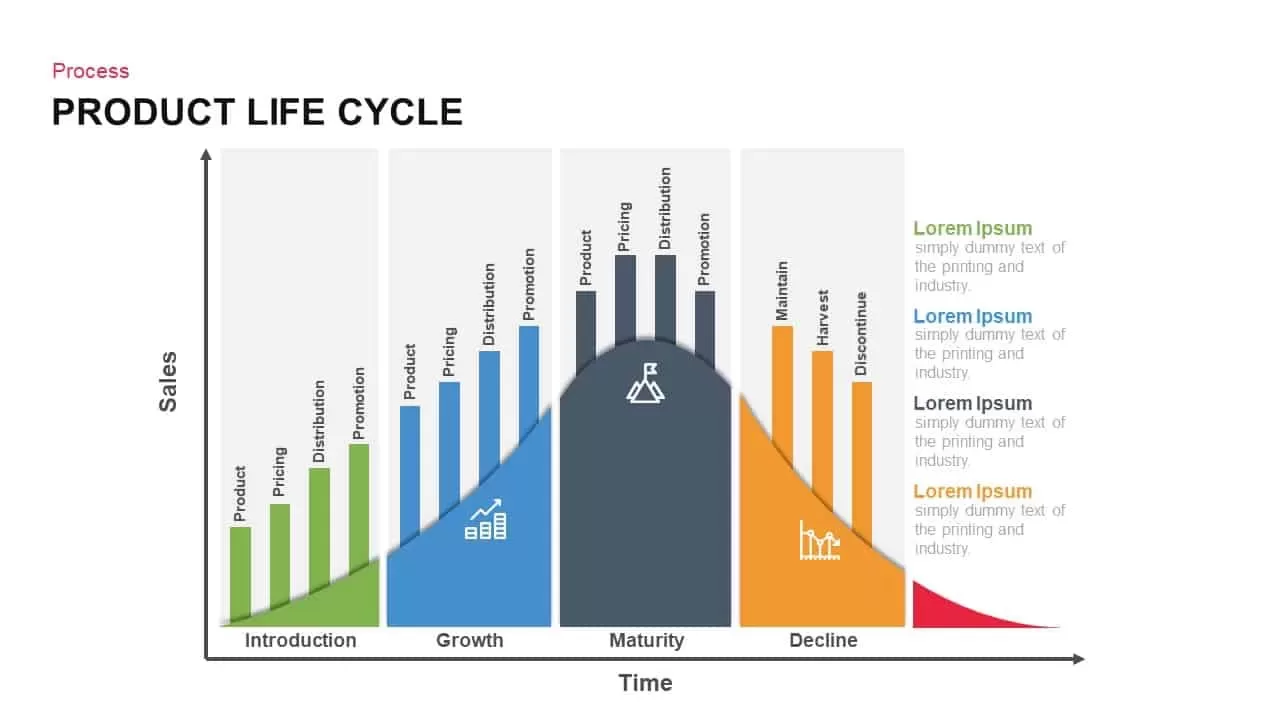
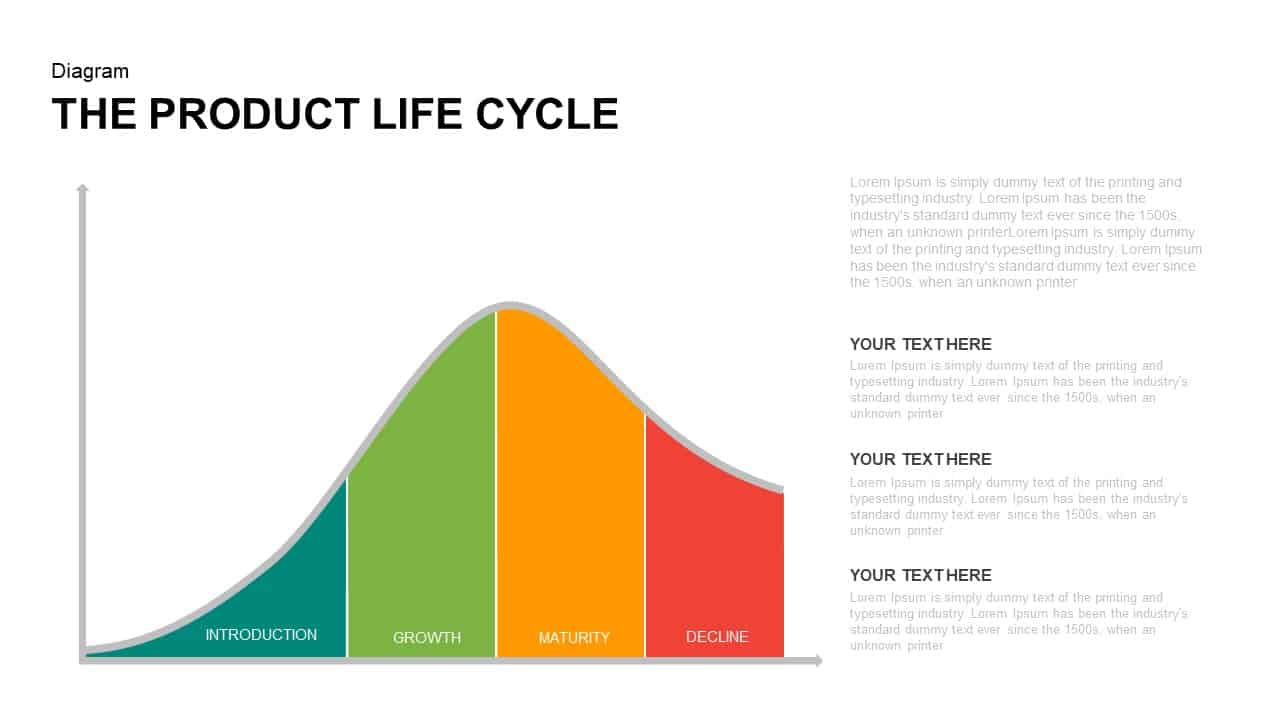
Product Life Cycle Infographics template for PowerPoint & Google Slides
Business
Data Migration Life Cycle Curved Diagram Template for PowerPoint & Google Slides
Process
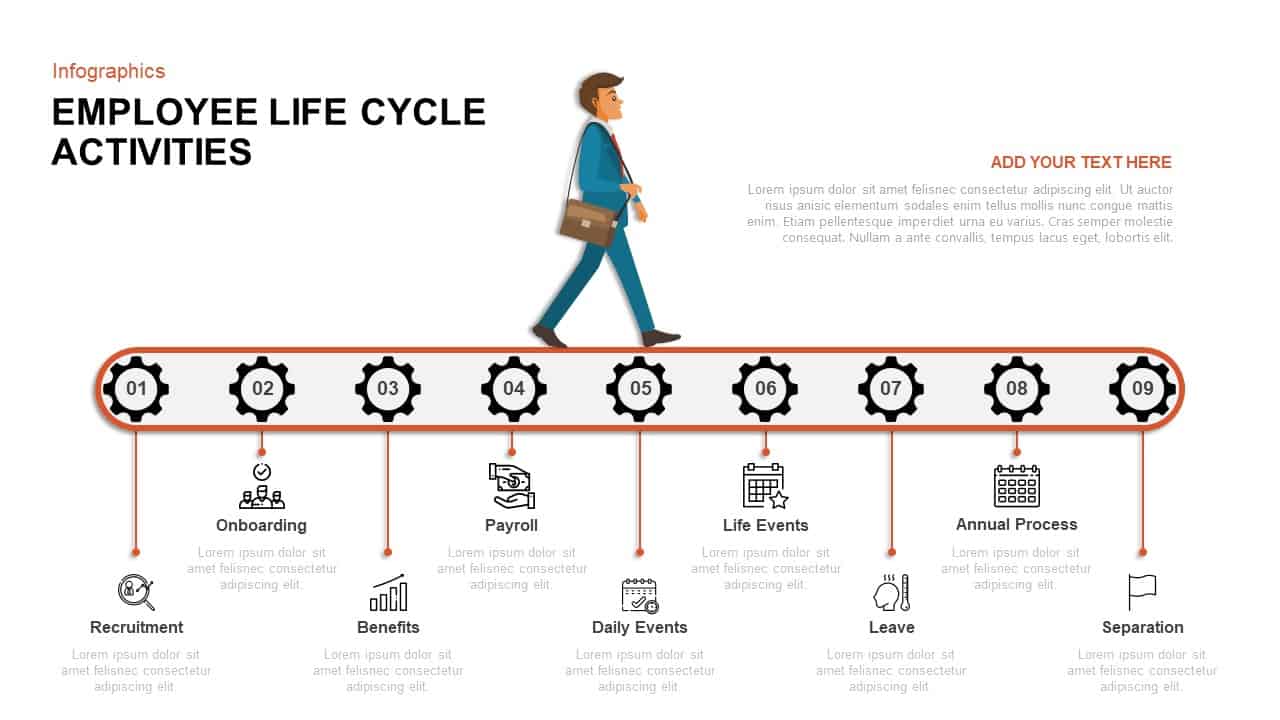
Employee Life Cycle Activities Template for PowerPoint & Google Slides
Timeline
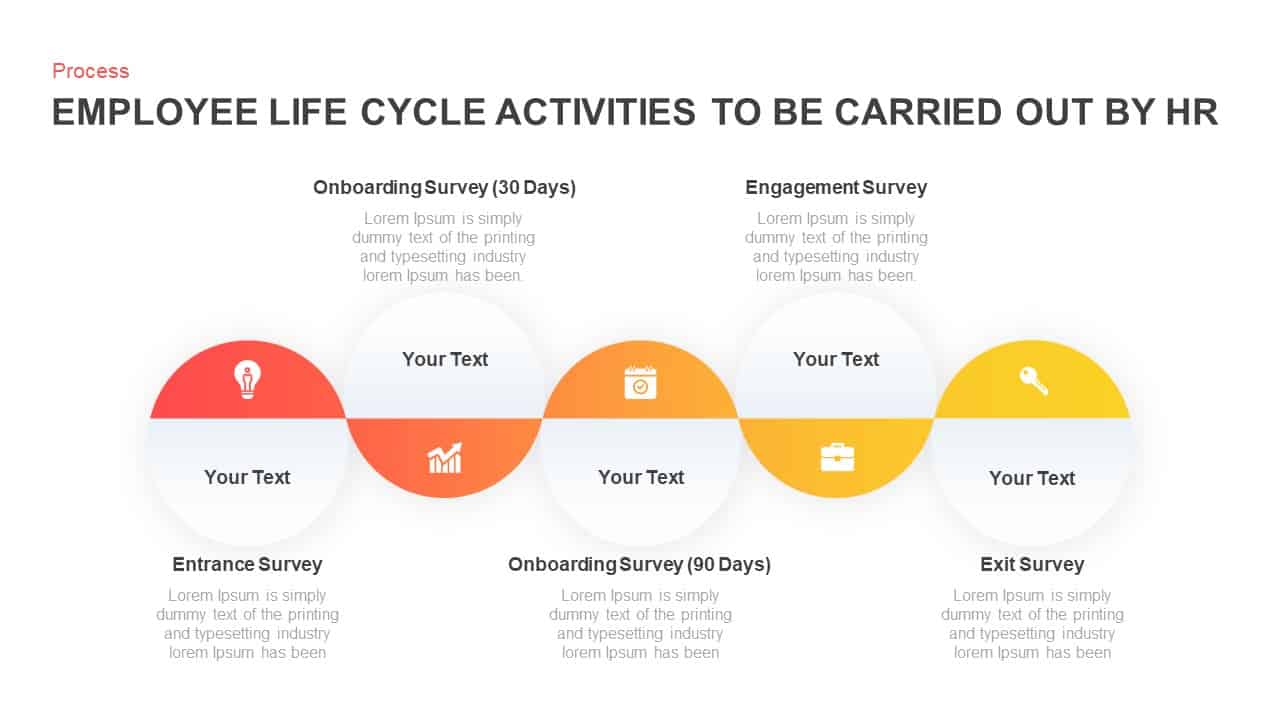
Employee Life Cycle Activities Process Template for PowerPoint & Google Slides
Employee Performance
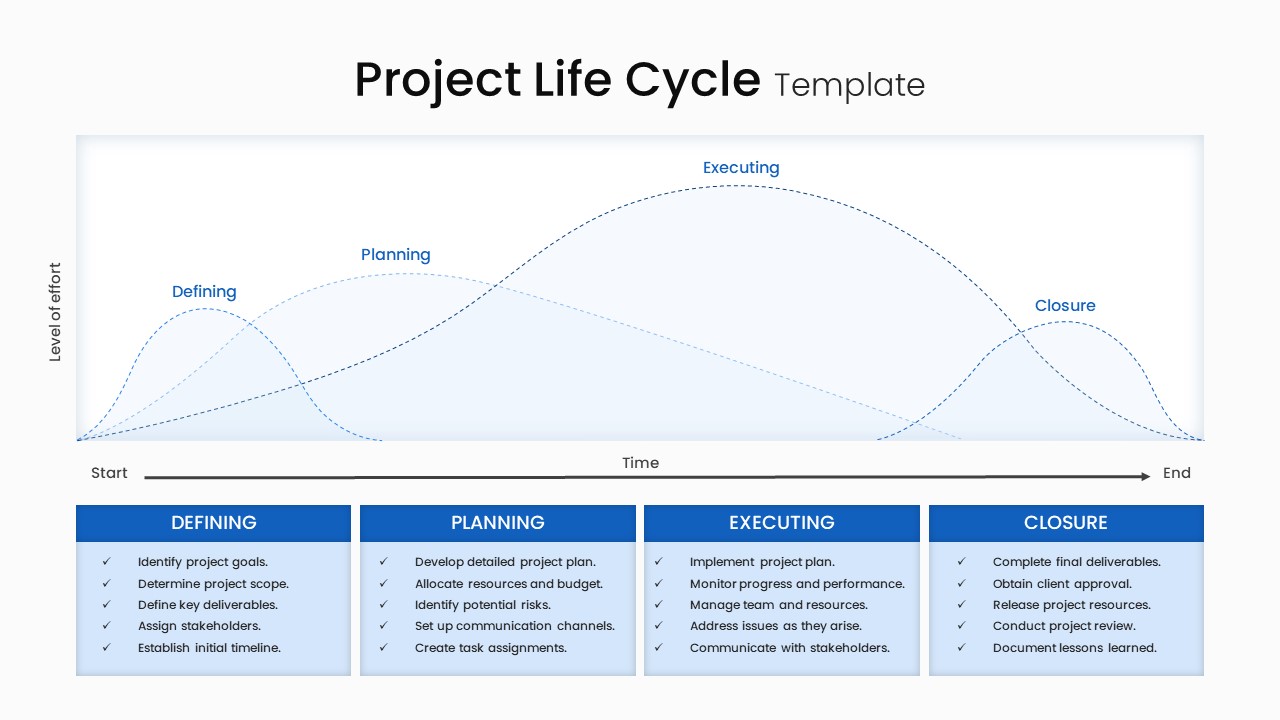
Multi-Style Project Life Cycle Diagram Template for PowerPoint & Google Slides
Process
Corporate Product Life Cycle Diagram Template for PowerPoint & Google Slides
Process
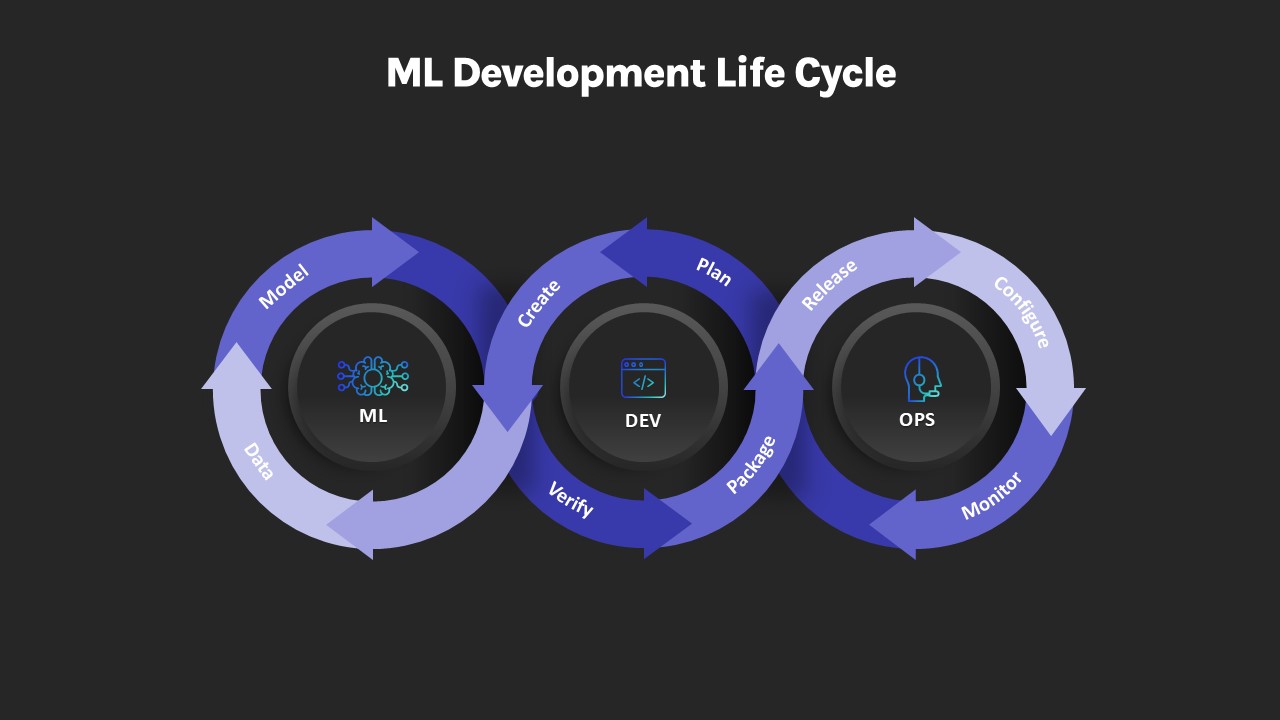
ML Development Life Cycle Diagram Template for PowerPoint & Google Slides
Machine Learning
Project Life Cycle Workflow Diagram Template for PowerPoint & Google Slides
Process
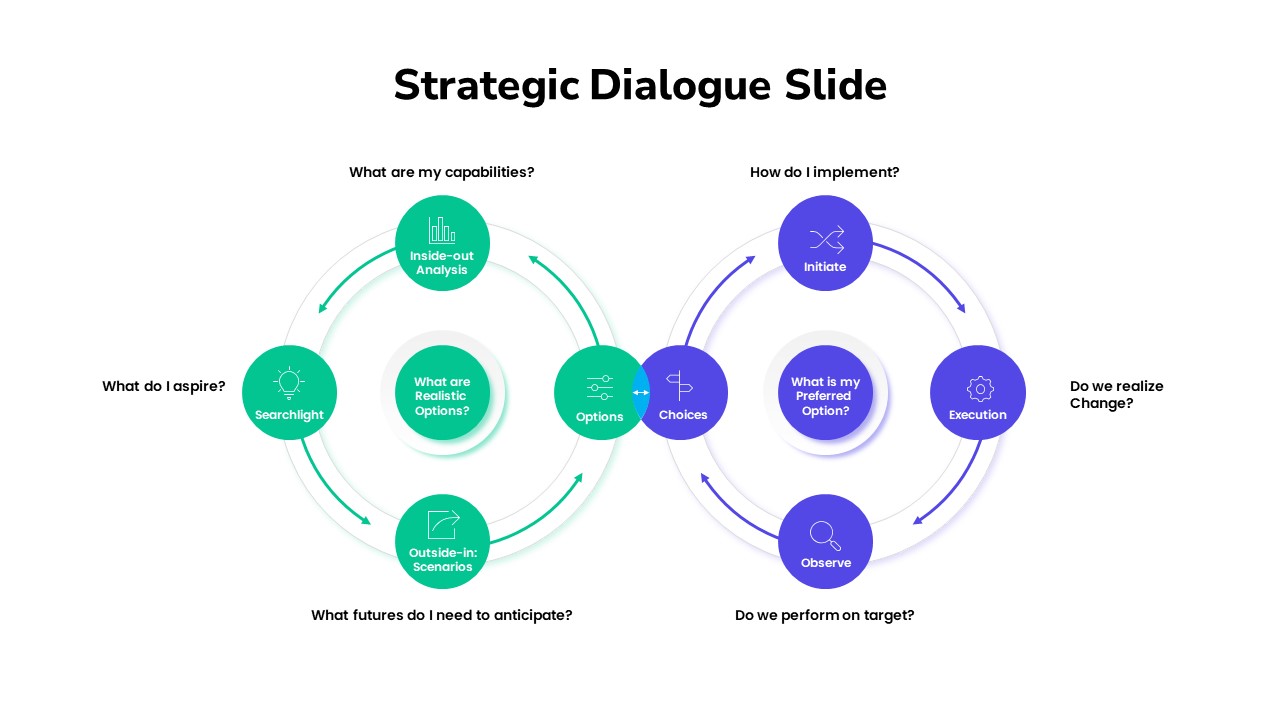
Strategic Dialogue Model Cycle Template for PowerPoint & Google Slides
Circular
Iterative Strategic Planning Cycle Template for PowerPoint & Google Slides
Business Strategy
Three-Year Strategic Plan Matrix Template for PowerPoint & Google Slides
Timeline
Strategic Alignment Matrix Model Template for PowerPoint & Google Slides
Project
Hoshin Kanri Strategic Planning Matrix Template for PowerPoint & Google Slides
Business Strategy
Strategic Opportunity Matrix Diagram for PowerPoint & Google Slides
Business Strategy
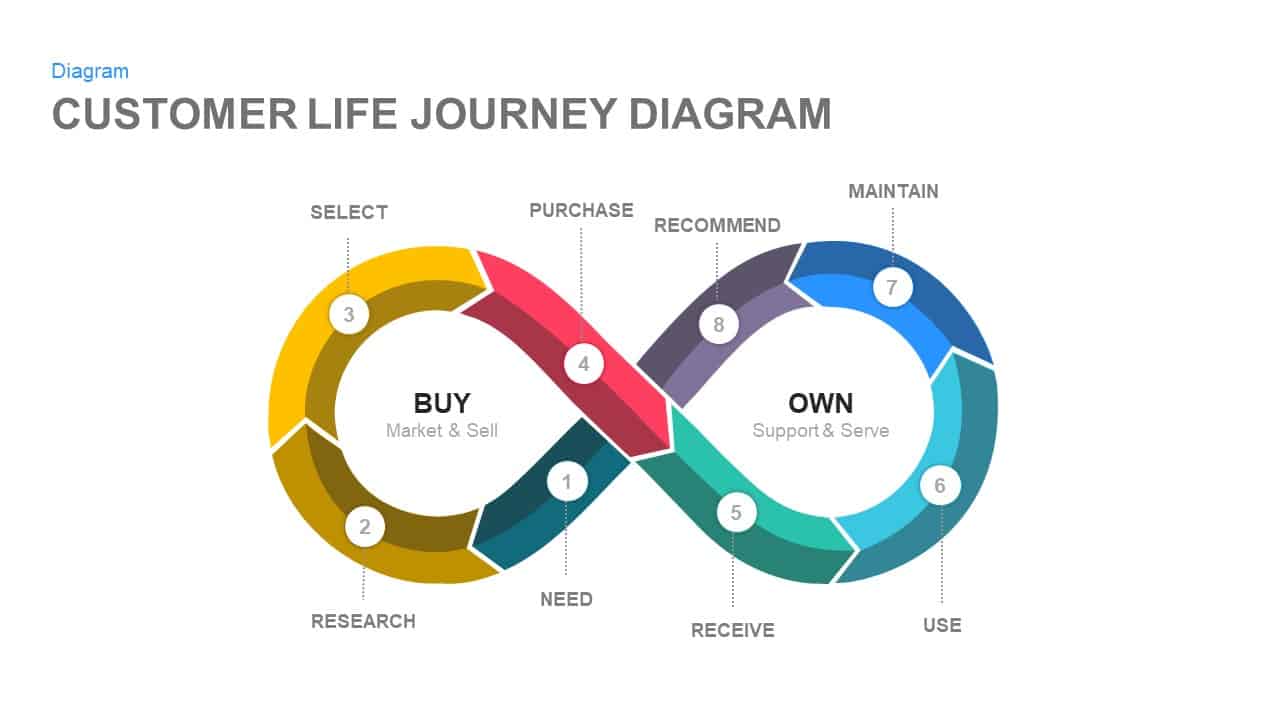
Customer Life Journey Infinity Diagram Template for PowerPoint & Google Slides
Customer Journey
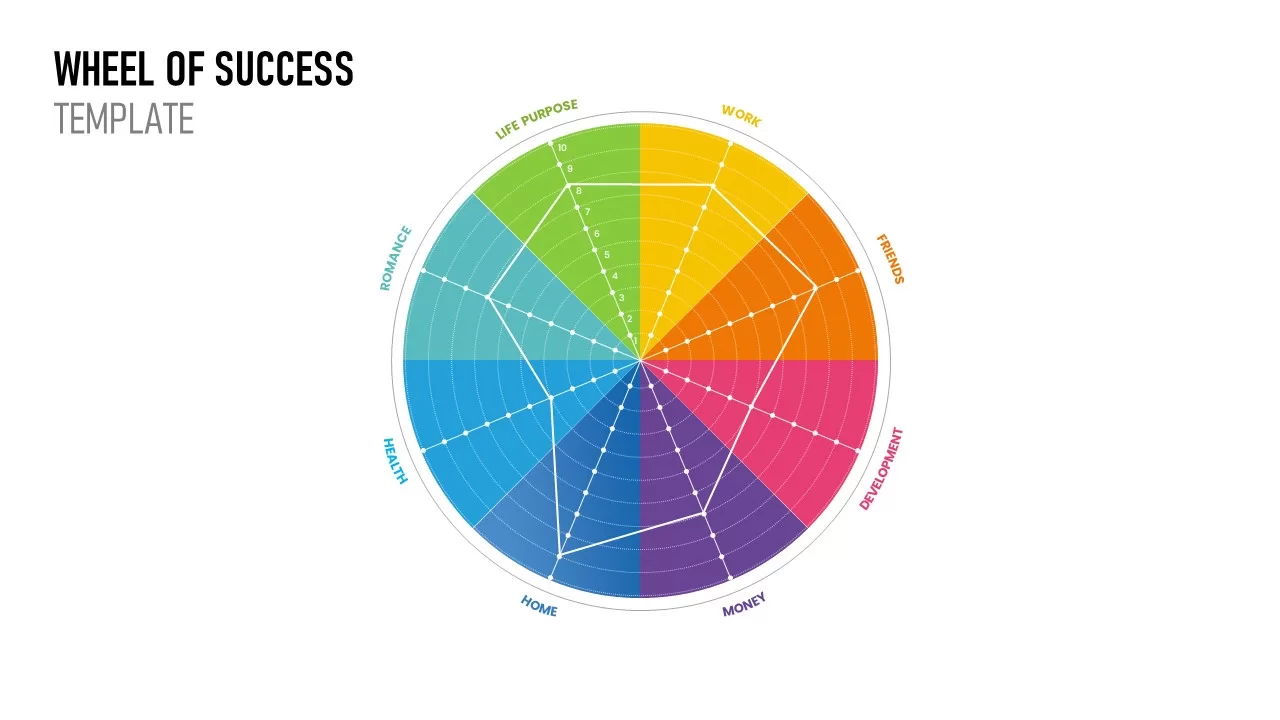
Wheel of Life template for PowerPoint & Google Slides
Business
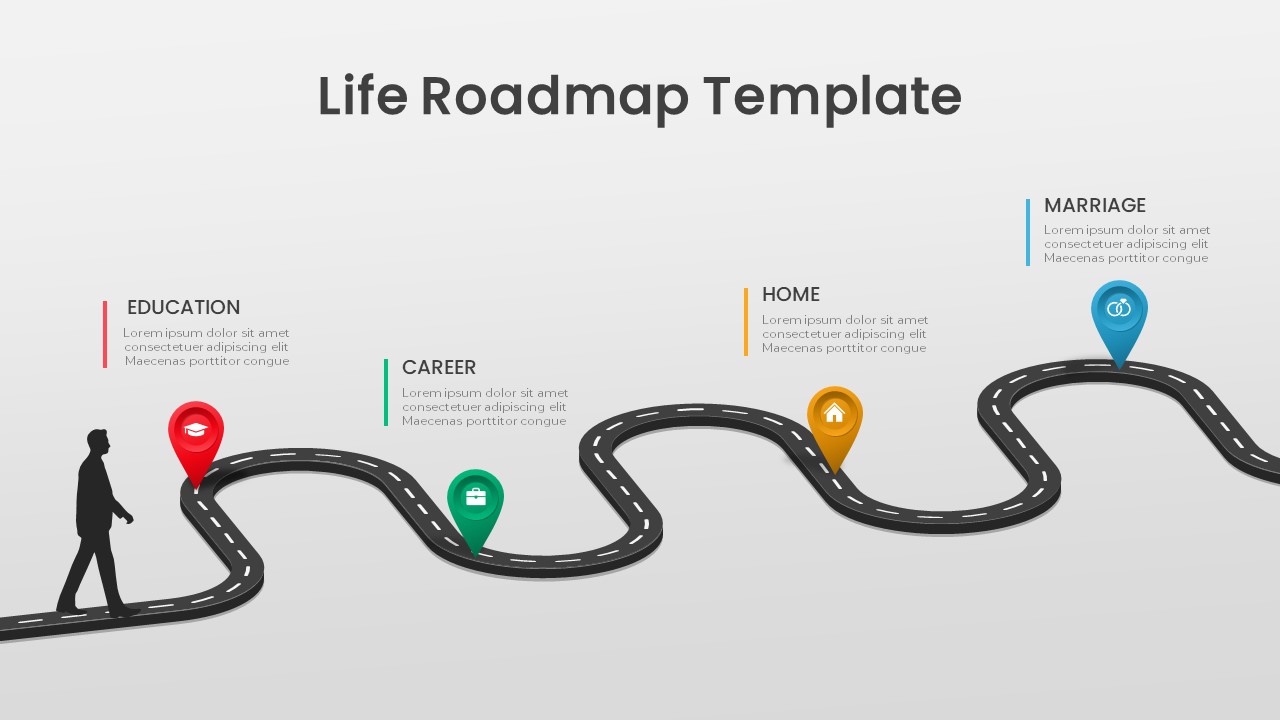
Life Roadmap for PowerPoint & Google Slides
Infographics
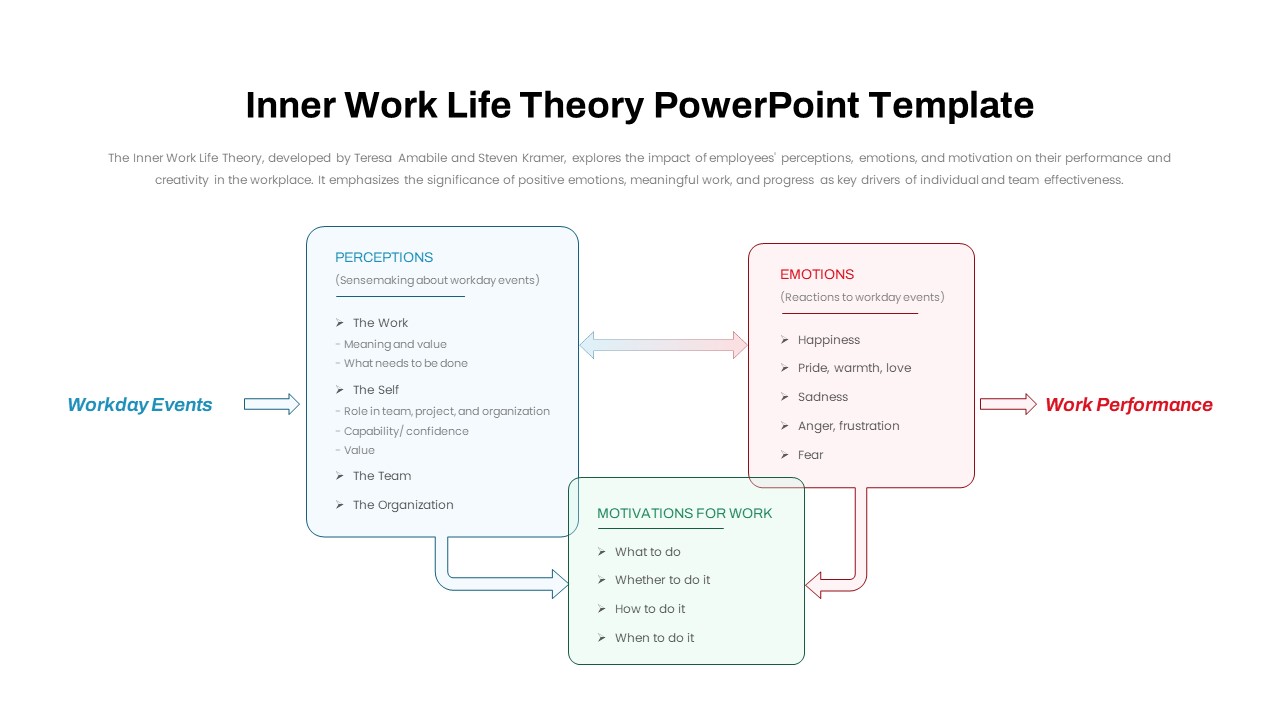
Inner Work Life Theory Diagram Slide for PowerPoint & Google Slides
Employee Performance
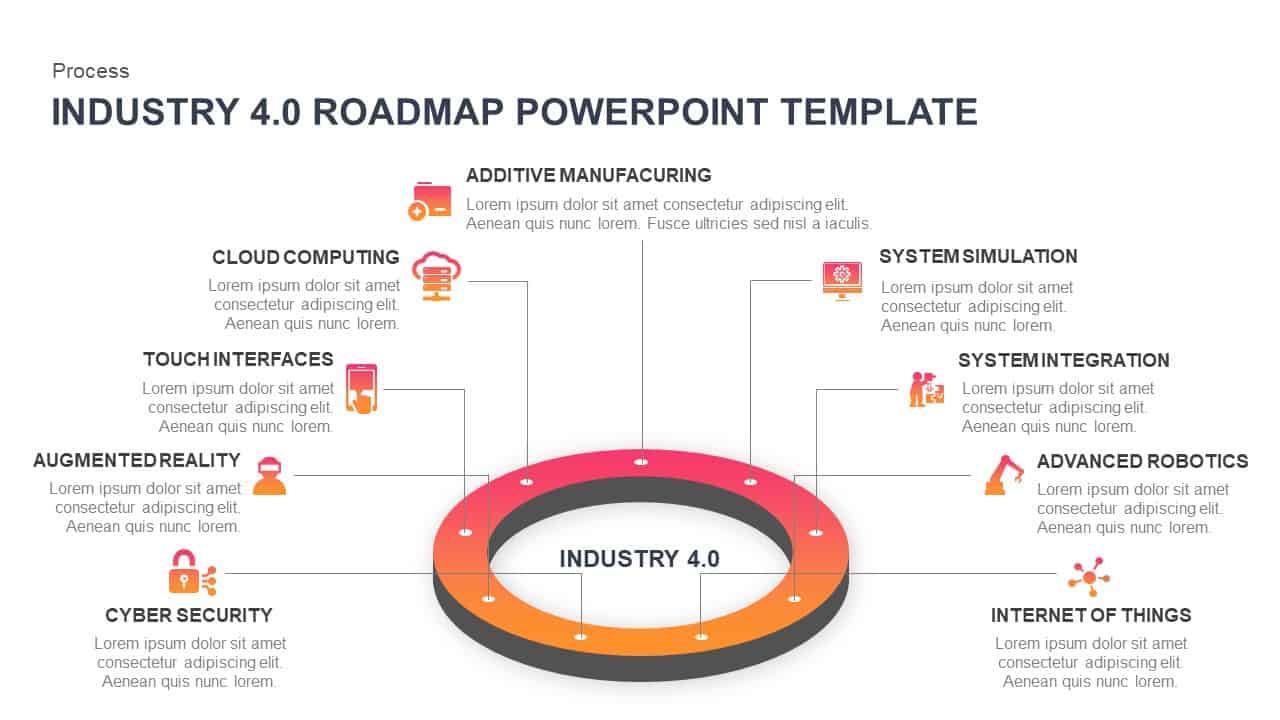
Industry 4.0 Roadmap Circular Ring Template for PowerPoint & Google Slides
Roadmap
Entertainment Industry Revenue Bar Chart Template for PowerPoint & Google Slides
Bar/Column
FinTech Industry Gradient Cover Template for PowerPoint & Google Slides
Pitch Deck

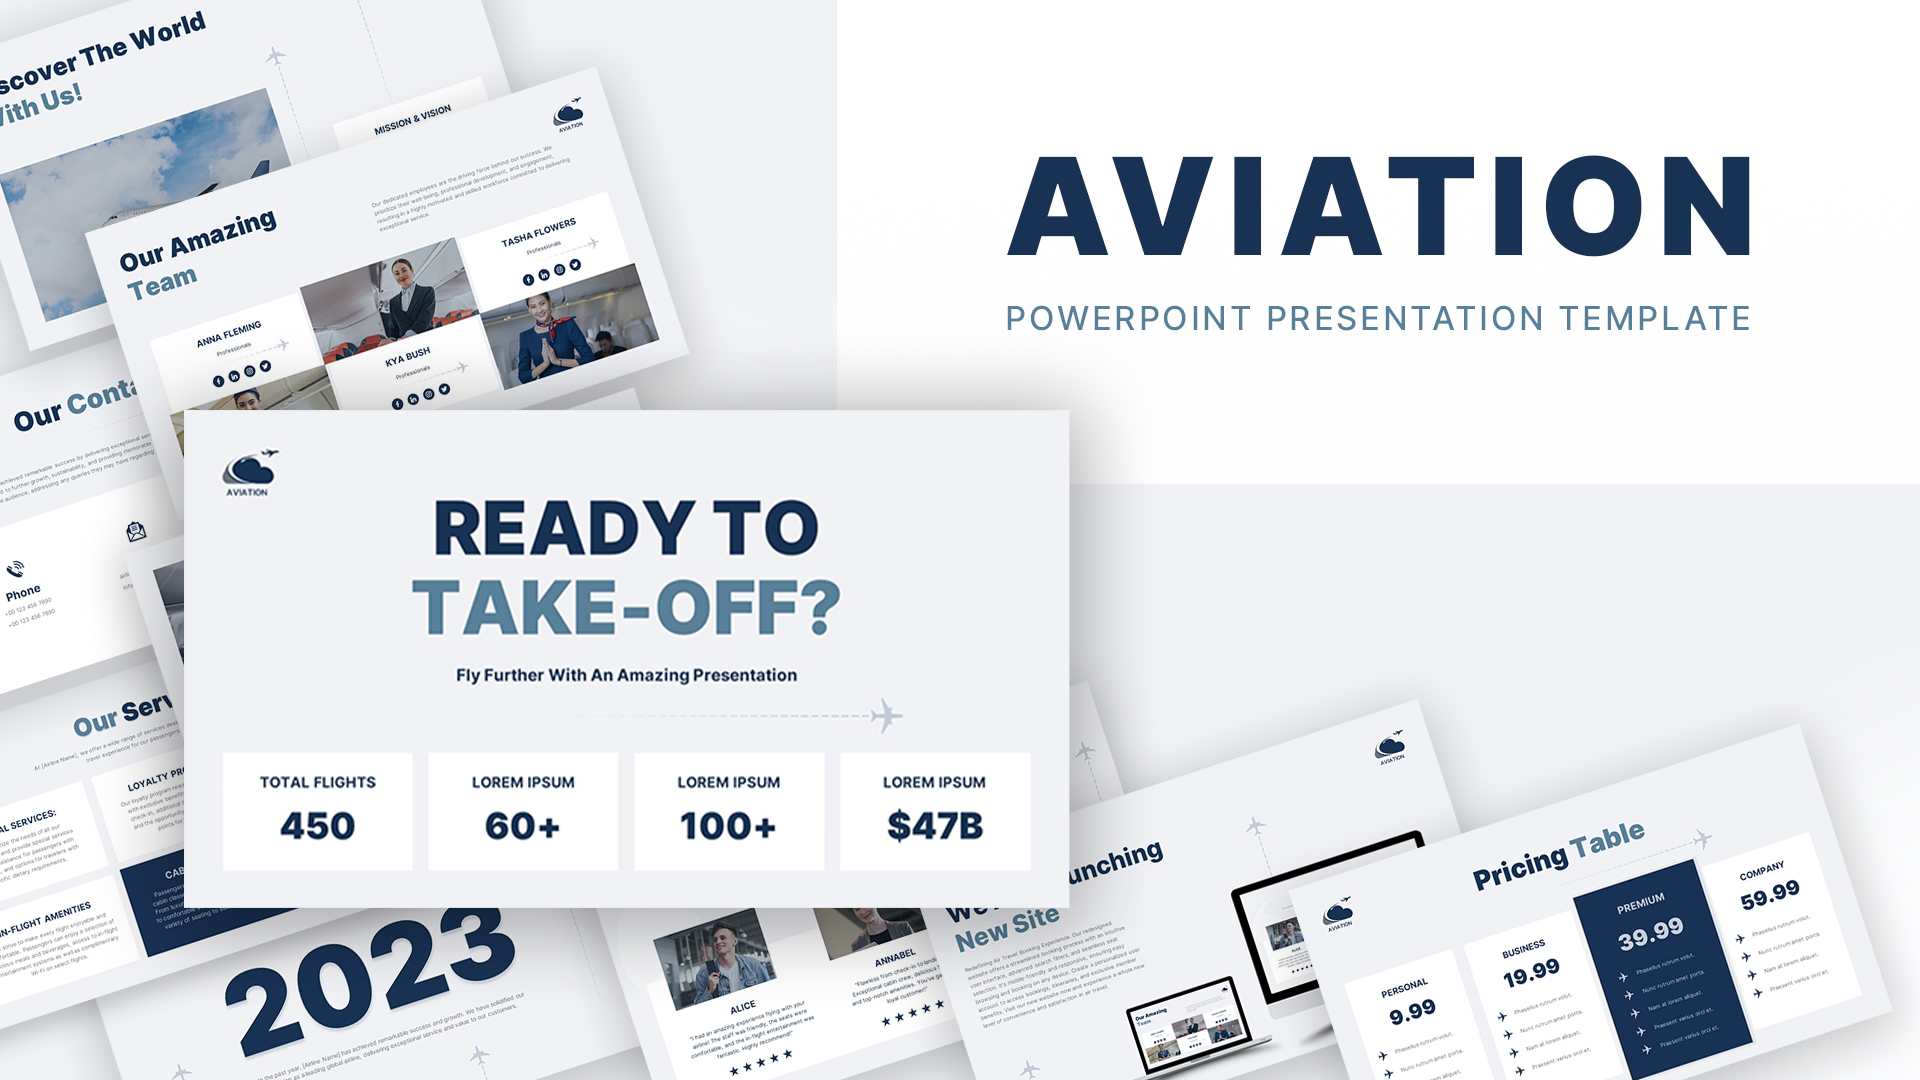
Aviation Airline Industry Overview template for PowerPoint & Google Slides
Business
Airline Industry Presentation Deck Template for PowerPoint & Google Slides
Company Profile
Aviation Industry Company Profile Deck Template for PowerPoint & Google Slides
Company Profile
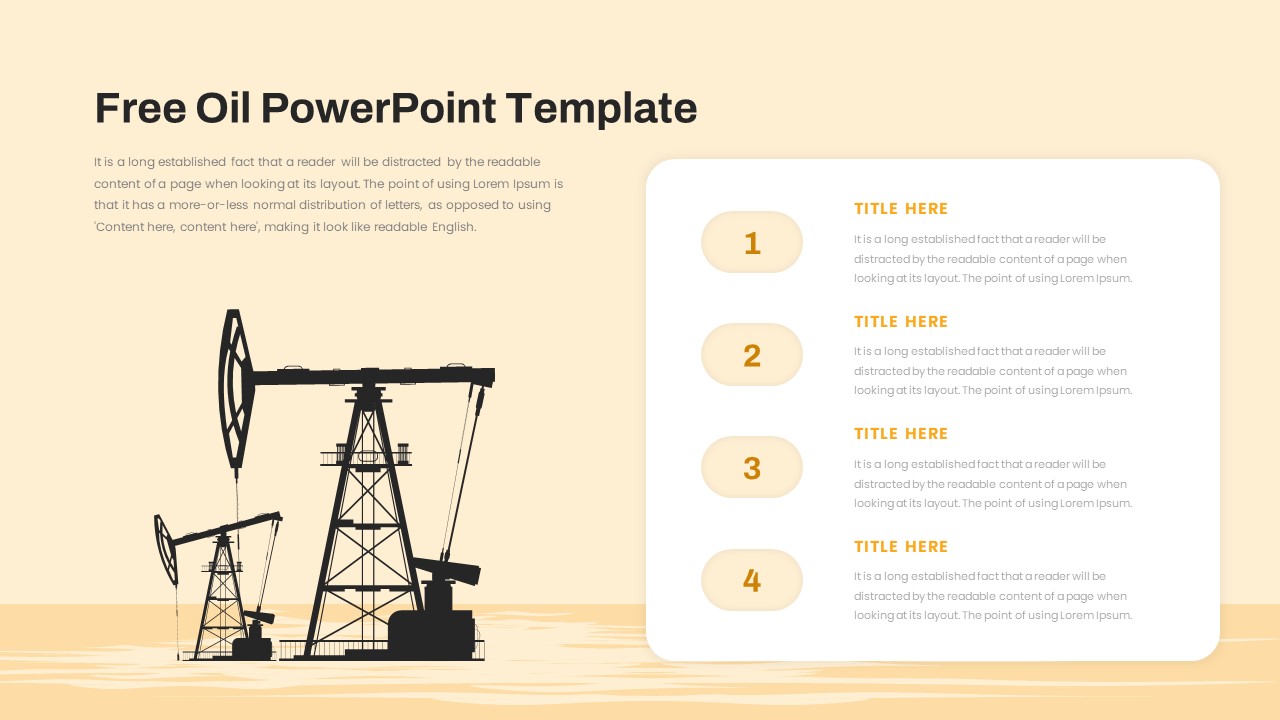
Free Oil Industry Four-Step Presentation Template for PowerPoint & Google Slides
Process
Free
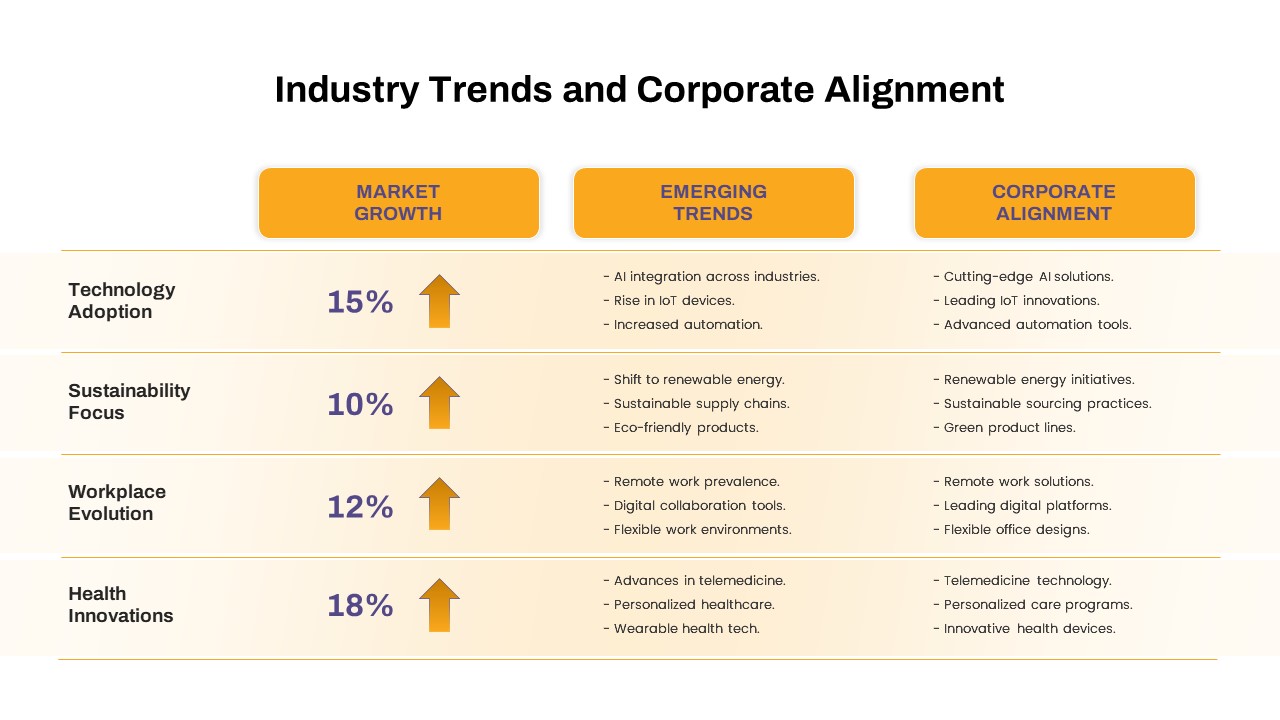
Industry Trends & Corporate Alignment Template for PowerPoint & Google Slides
Business Strategy
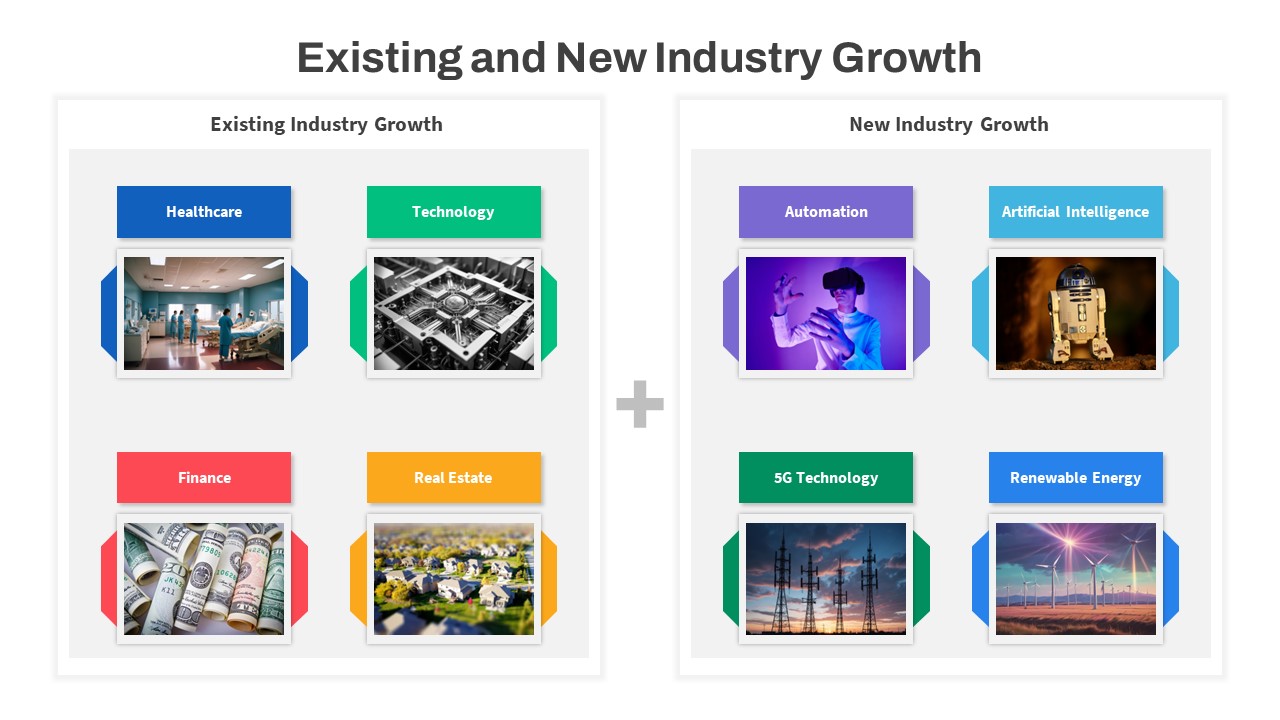
Current and Future Industry Innovations Template for PowerPoint & Google Slides
Comparison
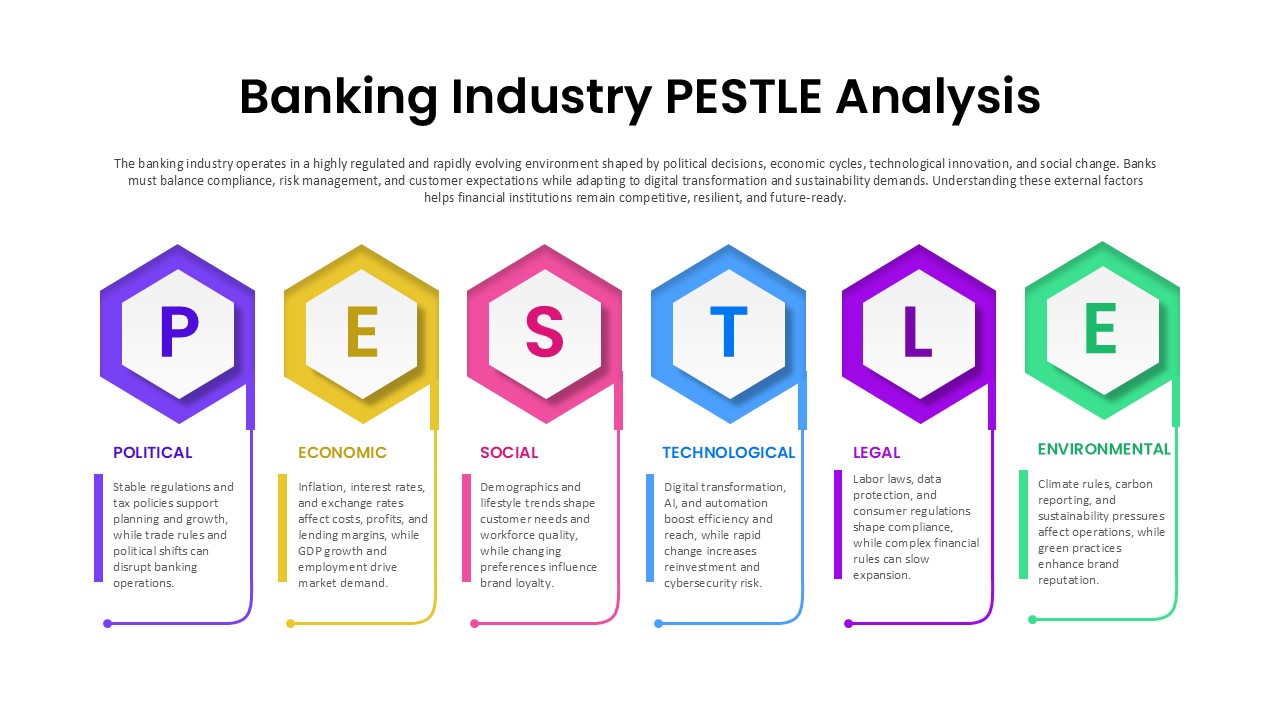
Banking Industry PESTLE Analysis Diagram Template for PowerPoint & Google Slides
PEST
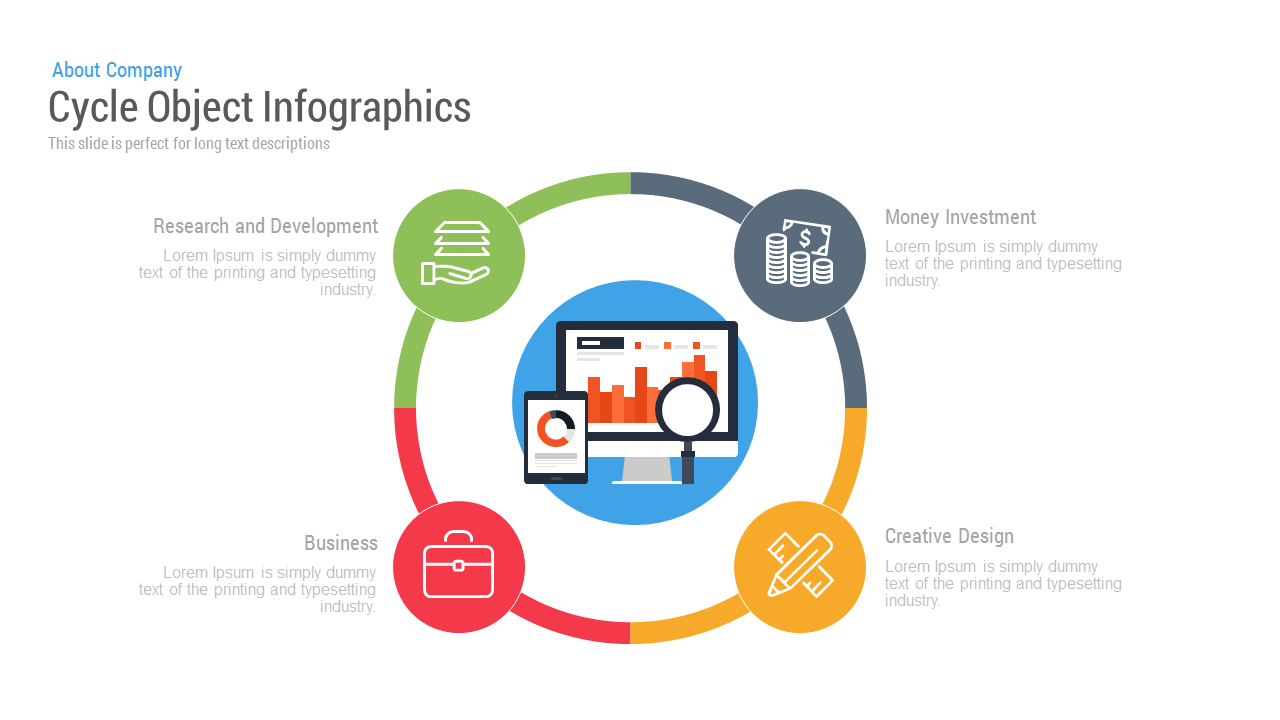
Free Cycle Object Infographics template for PowerPoint & Google Slides
Process
Free
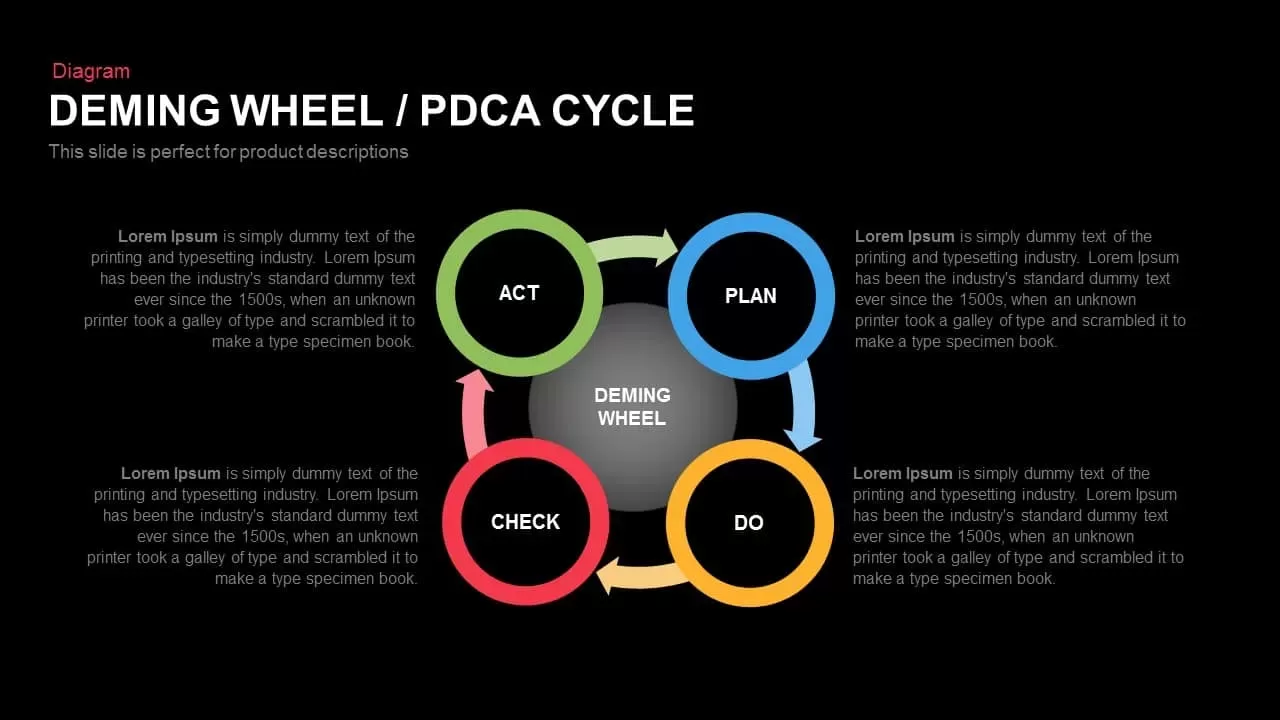
Deming Wheel PDCA Cycle Diagram Template for PowerPoint & Google Slides
Business Plan
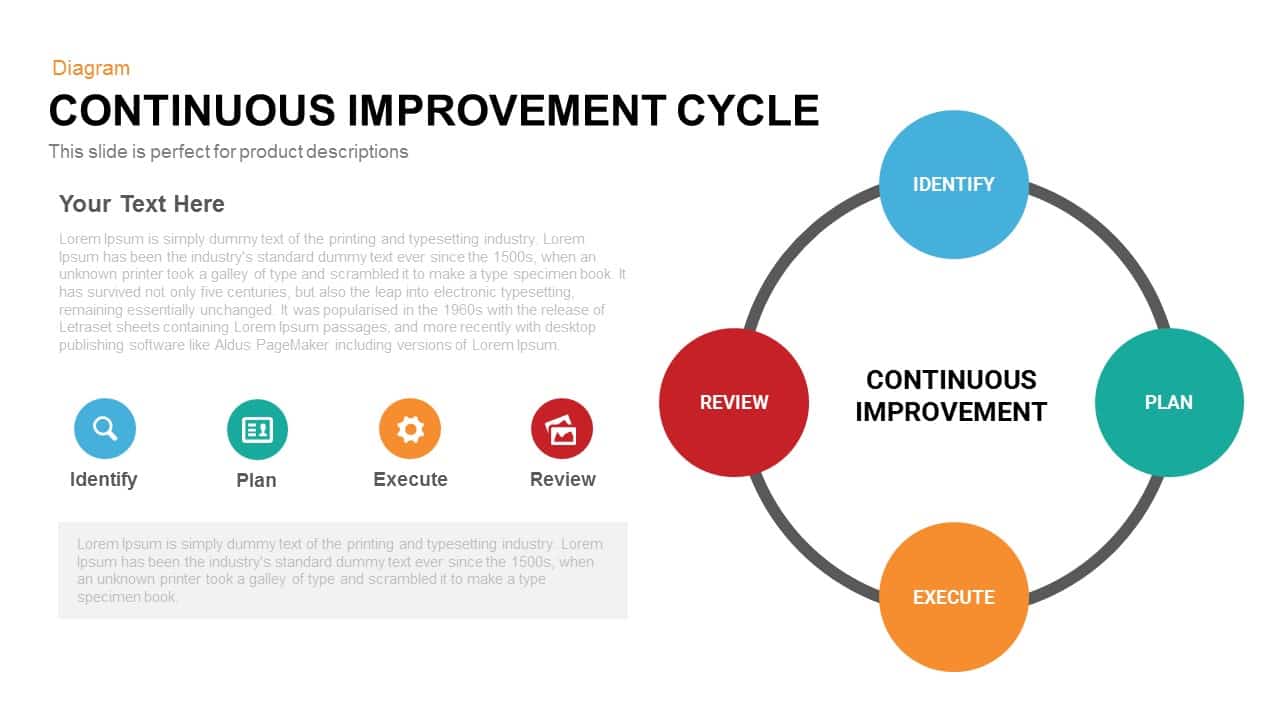
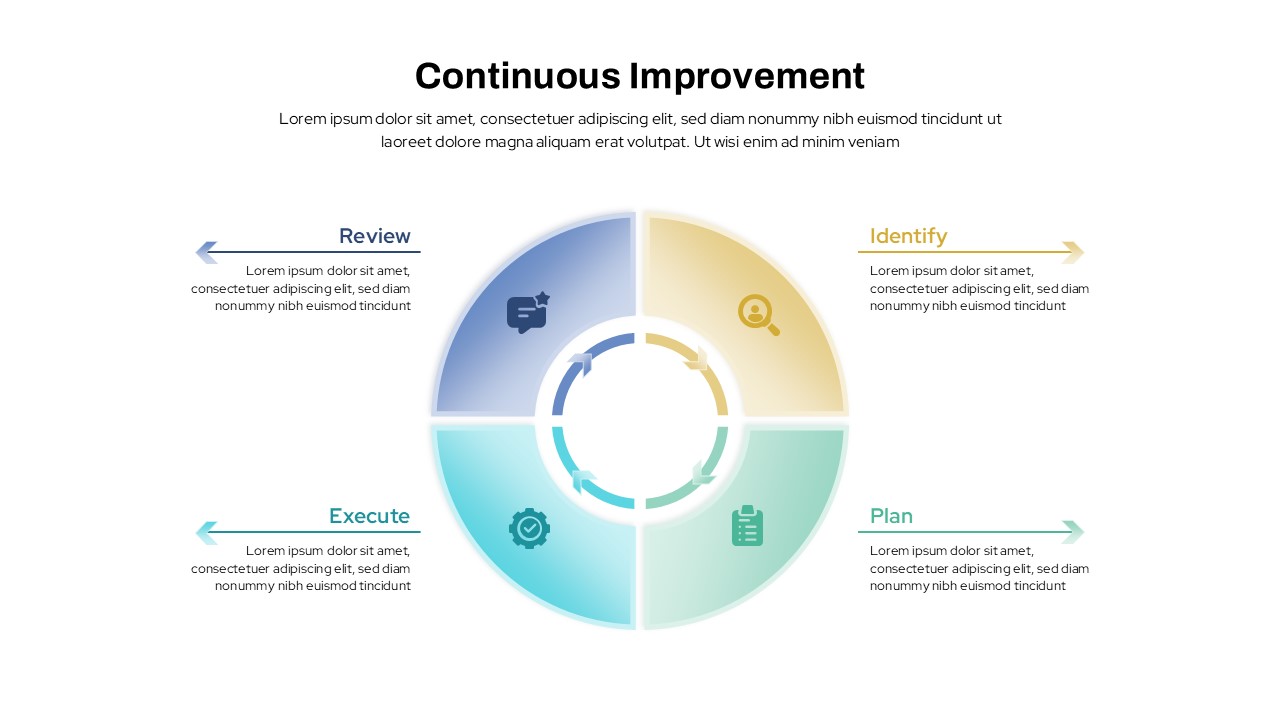
Continuous Improvement Cycle Diagram Template for PowerPoint & Google Slides
Circular
Modern Five-Stage Cycle Process Diagram Template for PowerPoint & Google Slides
Process
Six-Stage Circular Cycle Diagram Template for PowerPoint & Google Slides
Process
Four-Point Arrow Cycle Diagram Template for PowerPoint & Google Slides
Arrow

Data-Driven Marketing Cycle Diagram Template for PowerPoint & Google Slides
Customer Journey
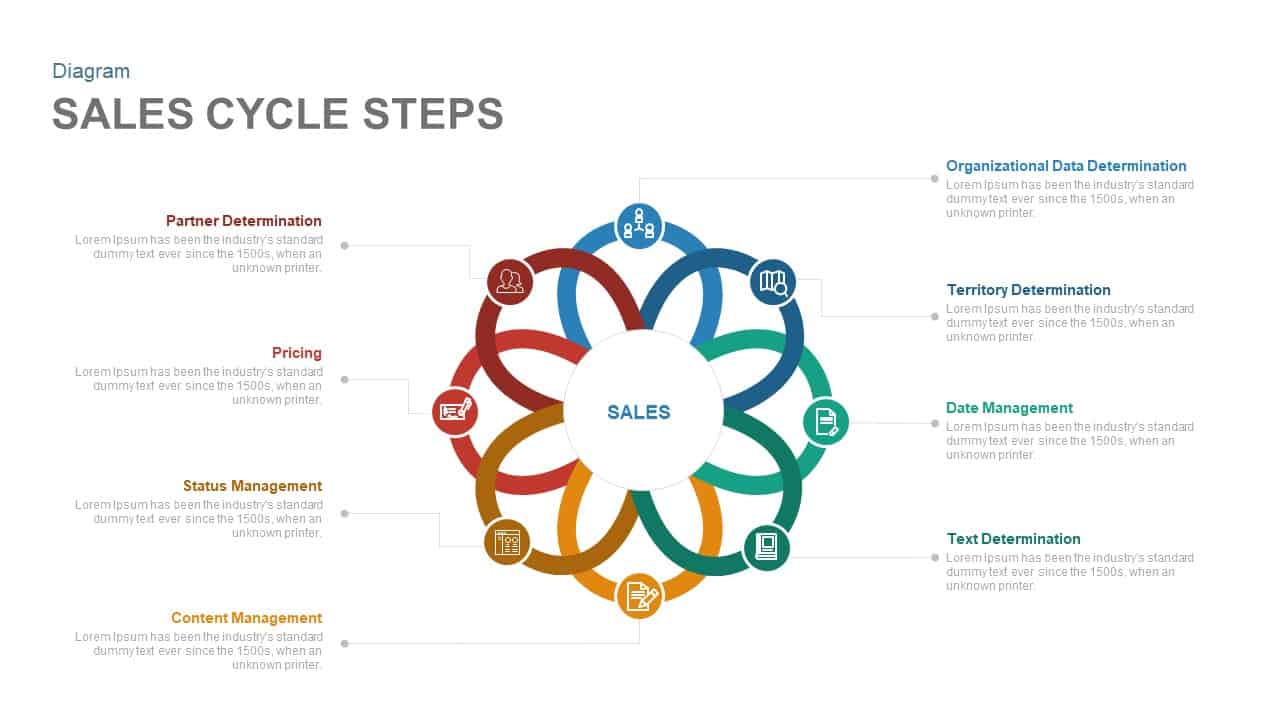
Eight-Step Sales Cycle Diagram Template for PowerPoint & Google Slides
Process
Performance Review Process Management Cycle template for PowerPoint & Google Slides
Employee Performance
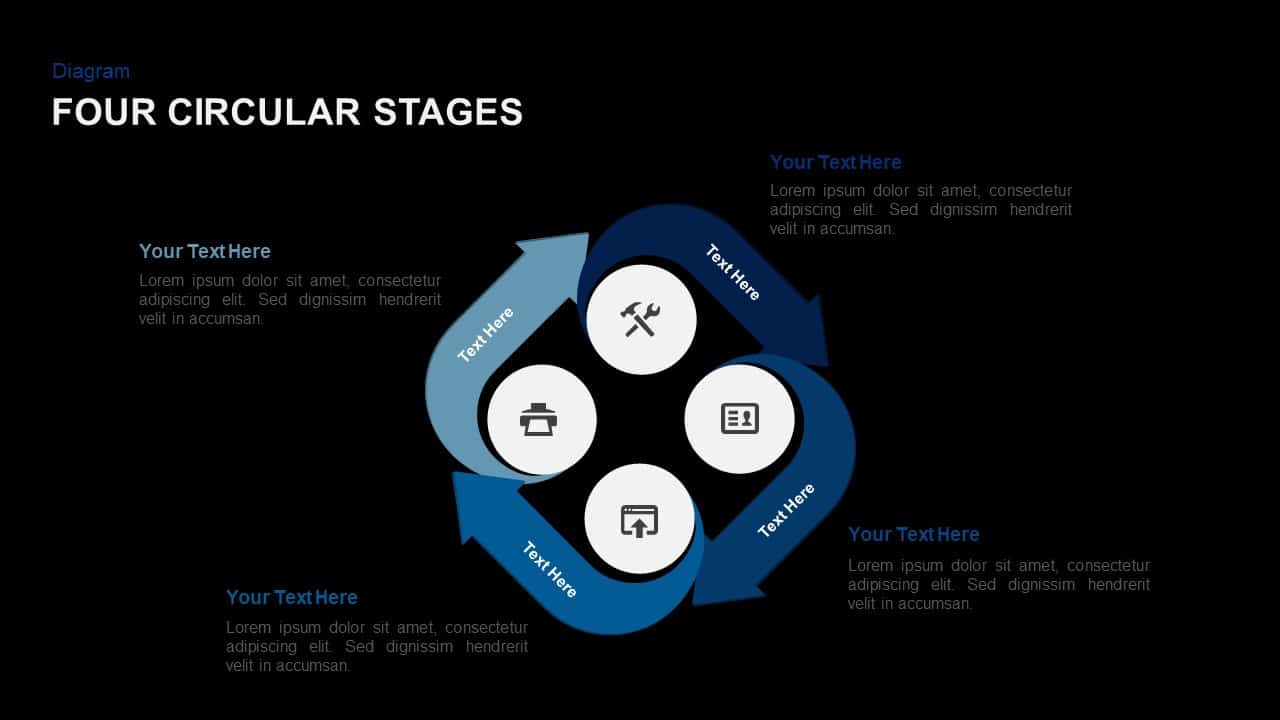
3, 4 & 5 Circular Stages Cycle Diagram Deck Template for PowerPoint & Google Slides
Circular
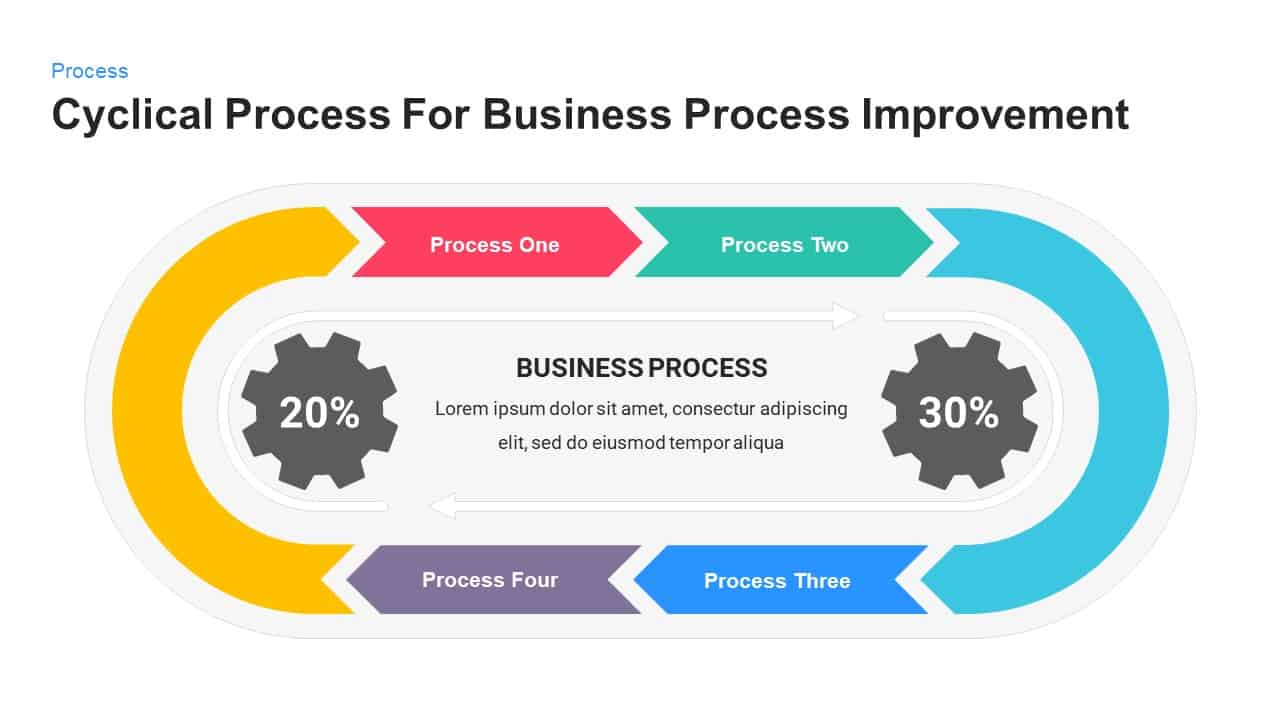
Business Process Improvement Cycle Template for PowerPoint & Google Slides
Process
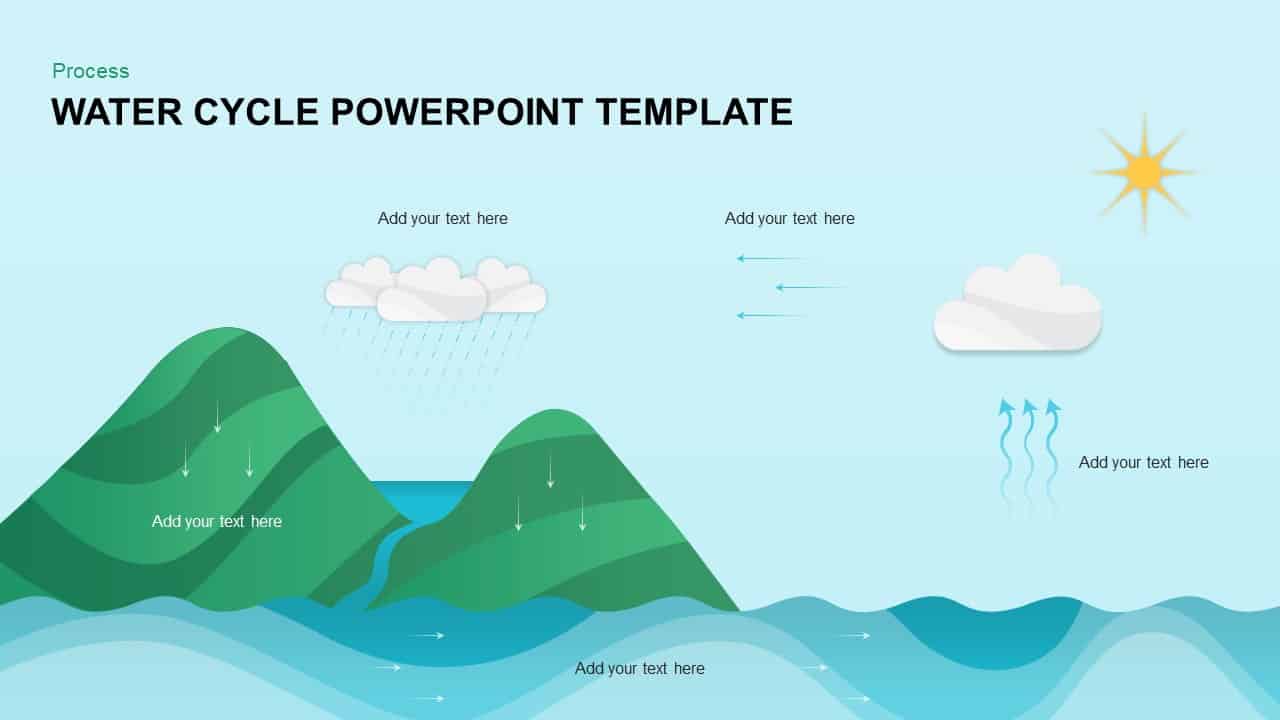
Water Cycle Process Infographic Template for PowerPoint & Google Slides
Process
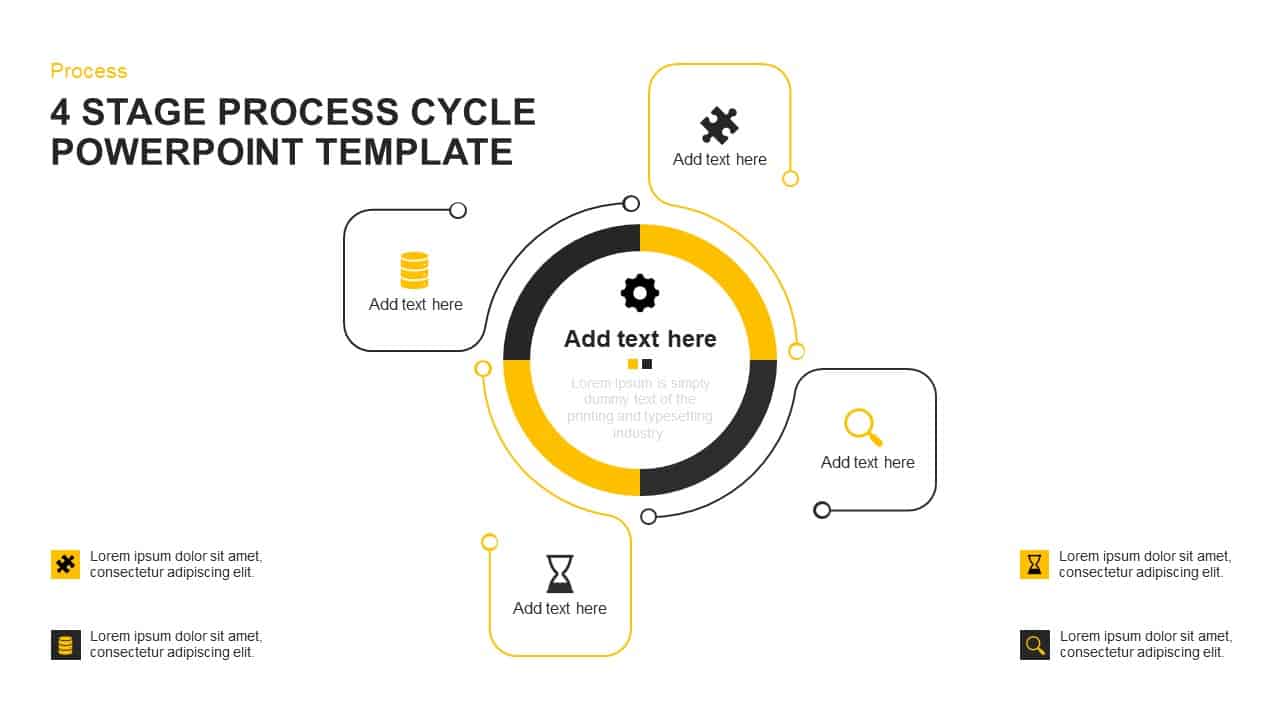
Four-Stage Cycle Process Diagram Template for PowerPoint & Google Slides
Process
Four-Stage Process Cycle Variations Pack Template for PowerPoint & Google Slides
Process
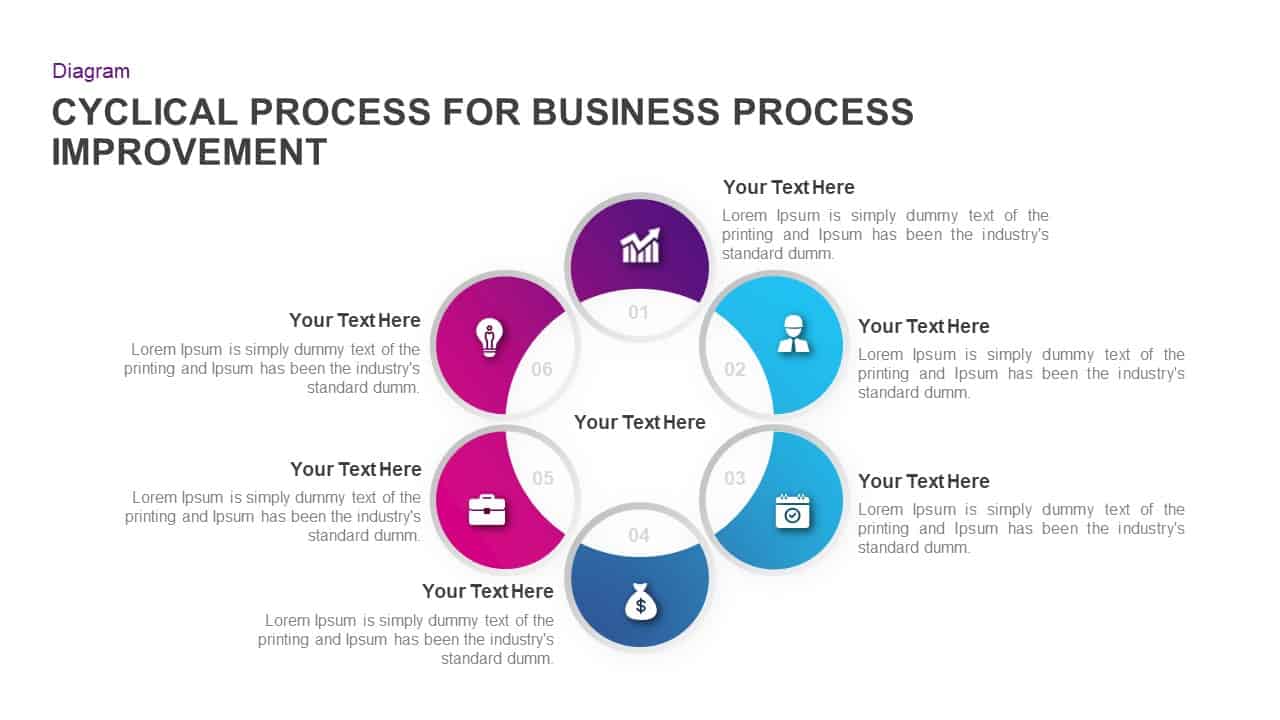
Business Process Improvement Cycle Template for PowerPoint & Google Slides
Circular
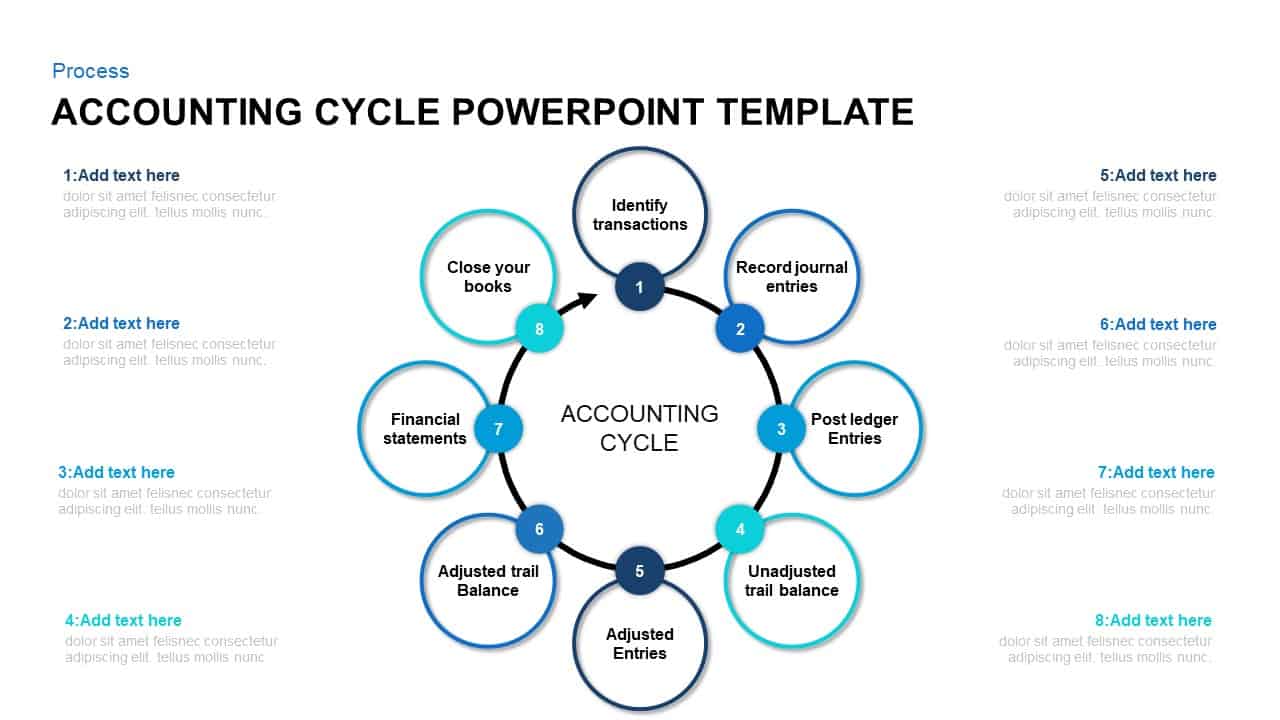
8-Step Circular Accounting Cycle Diagram Template for PowerPoint & Google Slides
Accounting
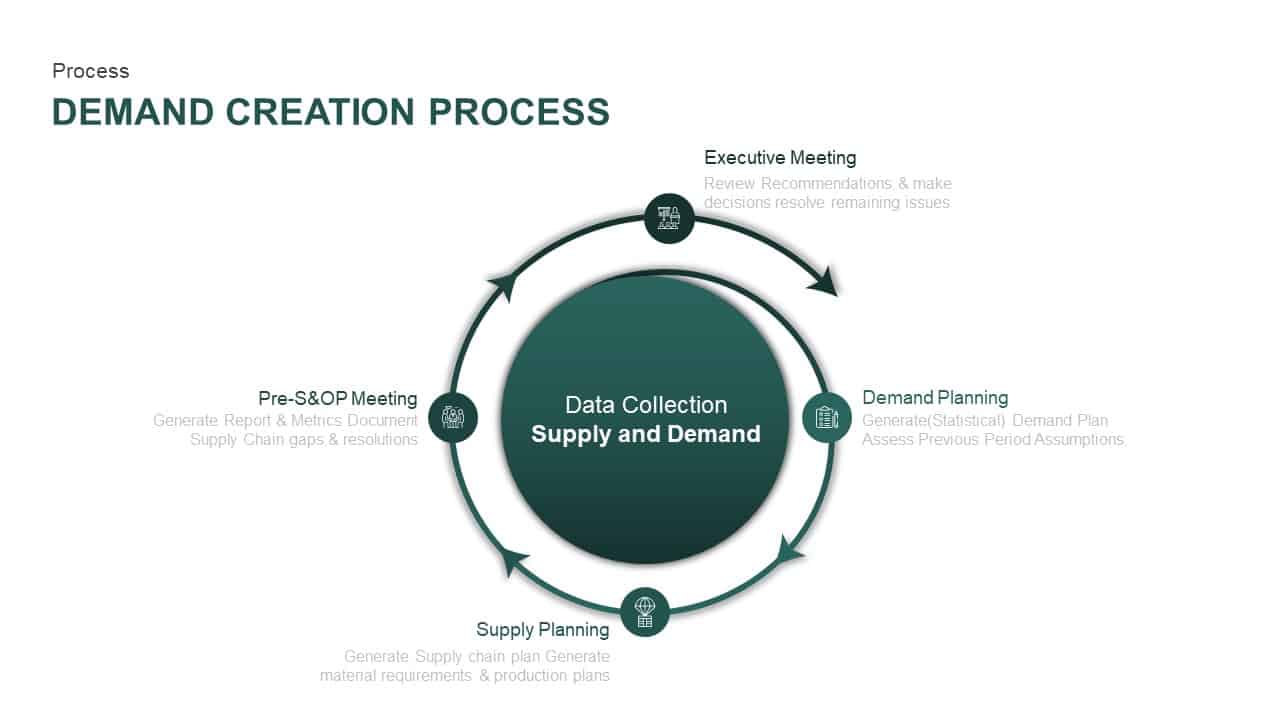
Supply and Demand Creation Cycle Diagram Template for PowerPoint & Google Slides
Process

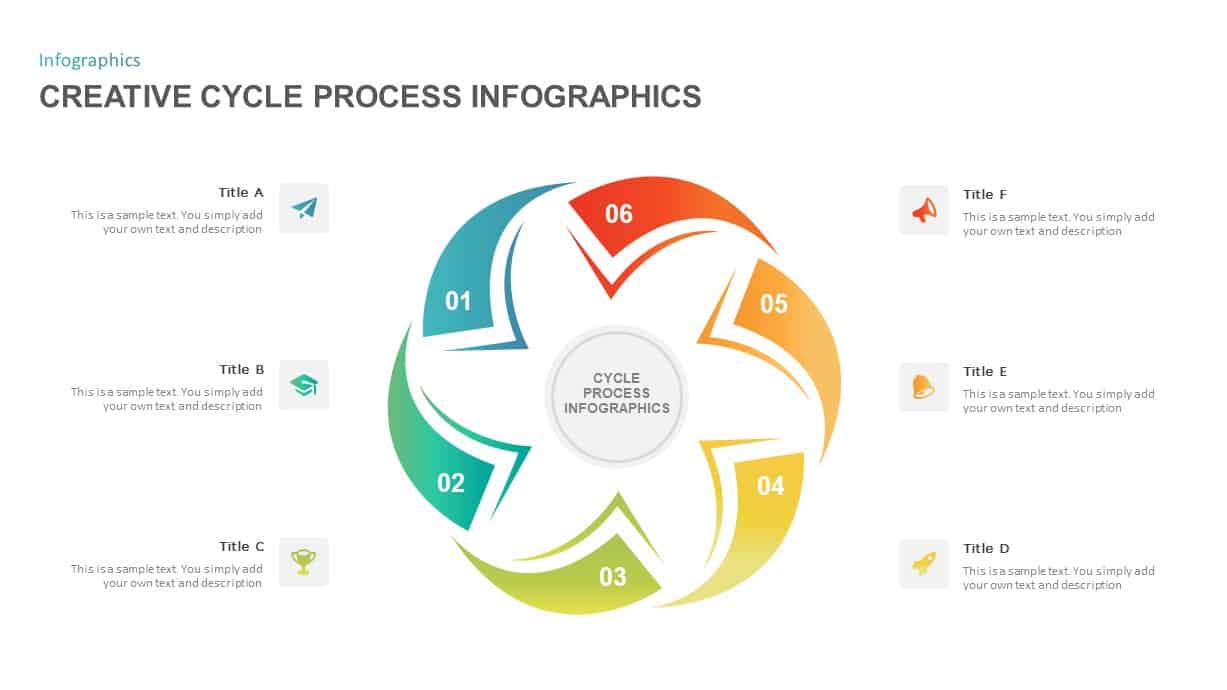
Modern 6-Step Cycle Diagram Slide Deck Template for PowerPoint & Google Slides
Process
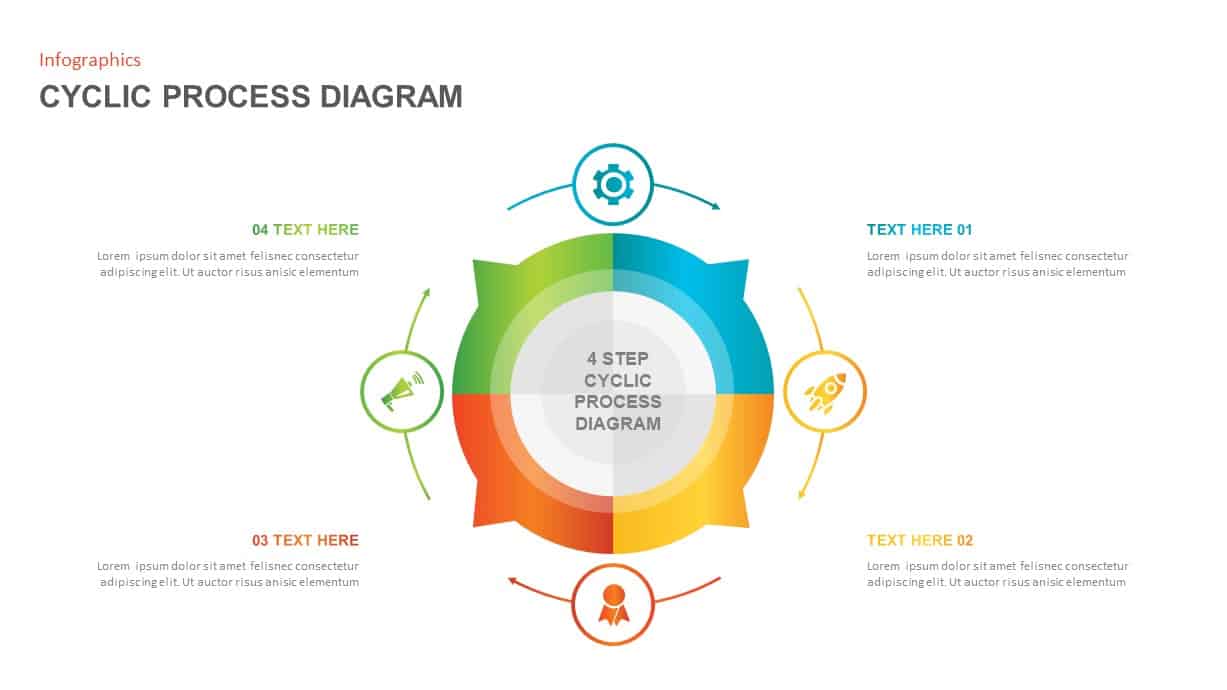
Creative Cycle Process Infographics Template for PowerPoint & Google Slides
Process
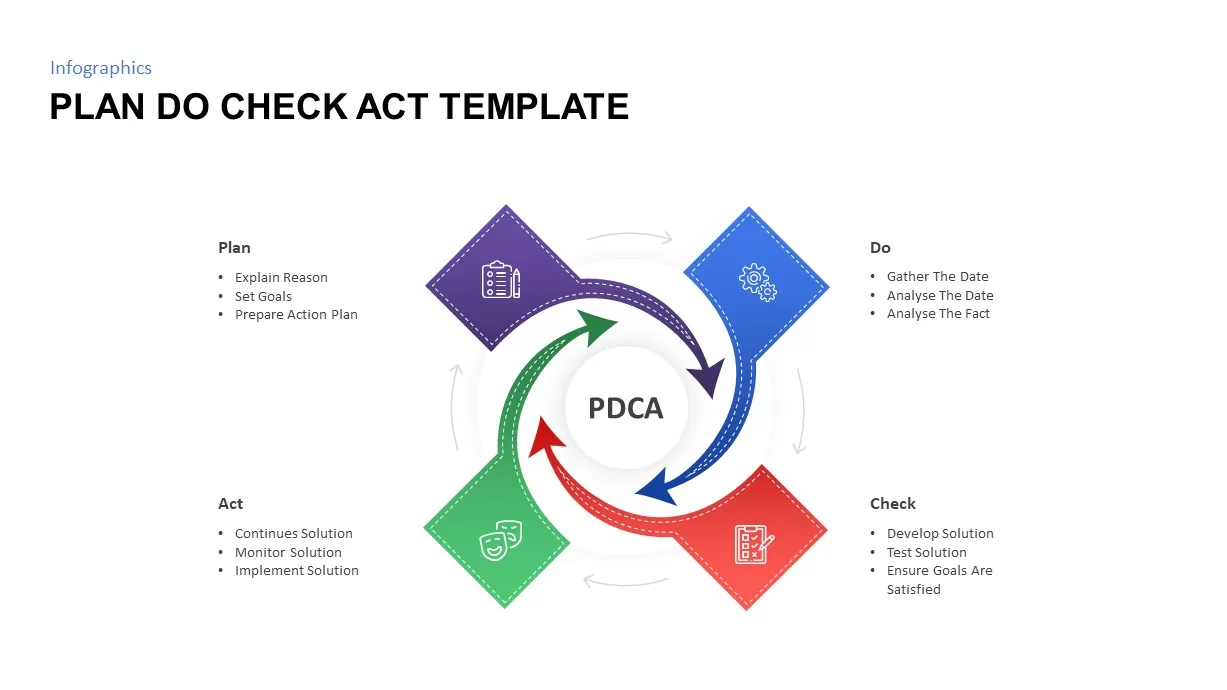
Plan Do Check Act PDCA Cycle Infographic Template for PowerPoint & Google Slides
Process
Enterprise Risk Management Cycle Diagram Template for PowerPoint & Google Slides
Process
4MAT Learning Cycle Circular Diagram Template for PowerPoint & Google Slides
Circular
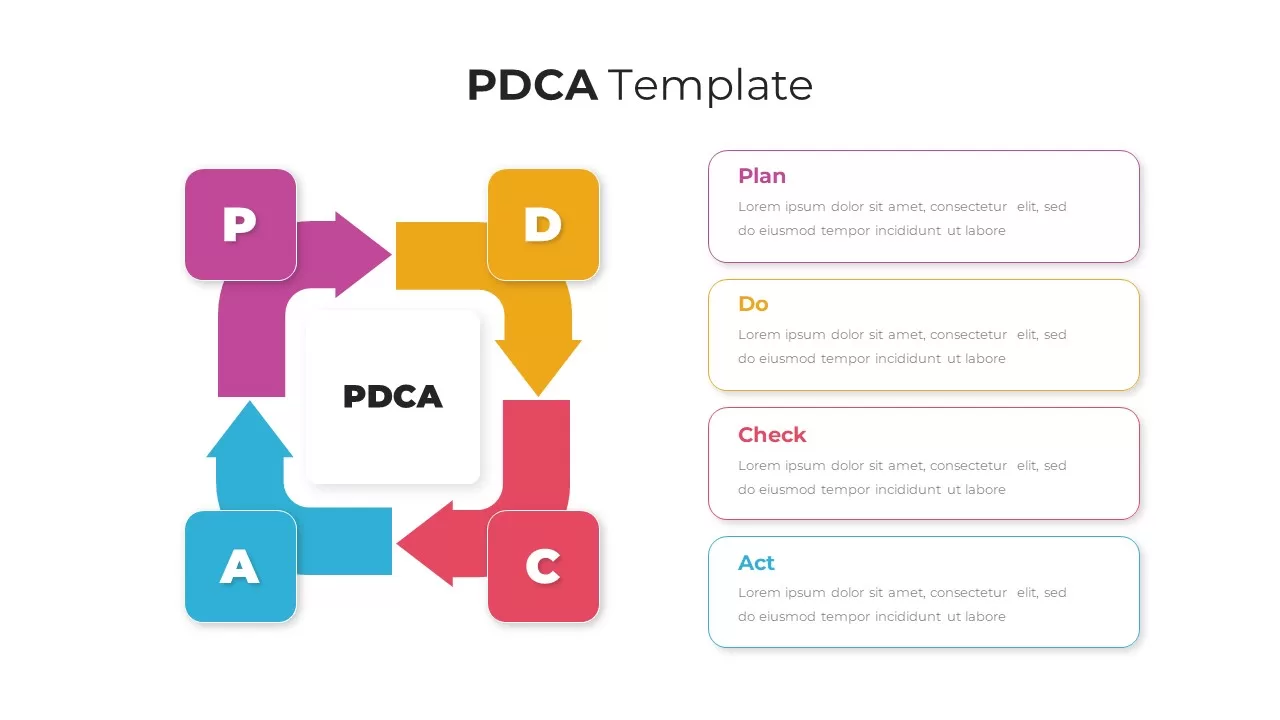
4-Step Circular PDCA Cycle Diagram Template for PowerPoint & Google Slides
Process
Continuous Improvement Cycle Diagram Template for PowerPoint & Google Slides
Process
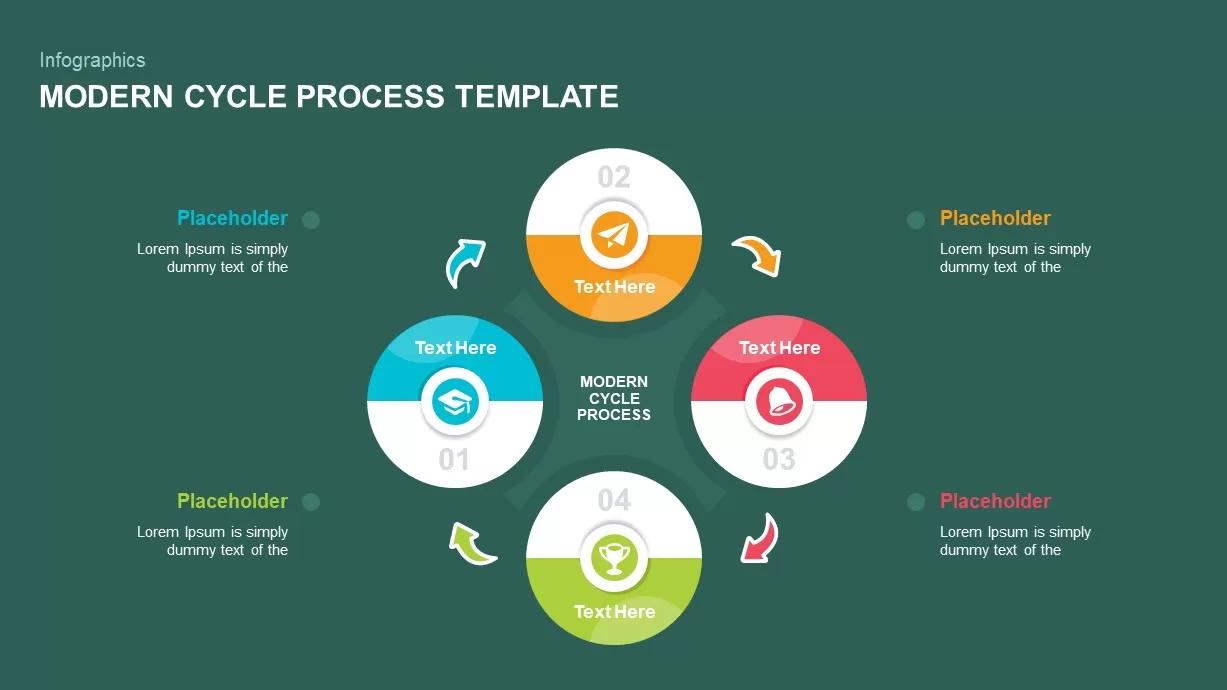
Modern Cycle Process Template for PowerPoint & Google Slides
Business Proposal
7-Step Virtuous Economy Cycle Diagram Template for PowerPoint & Google Slides
Process
Communication Cycle Process Diagram template for PowerPoint & Google Slides
Business
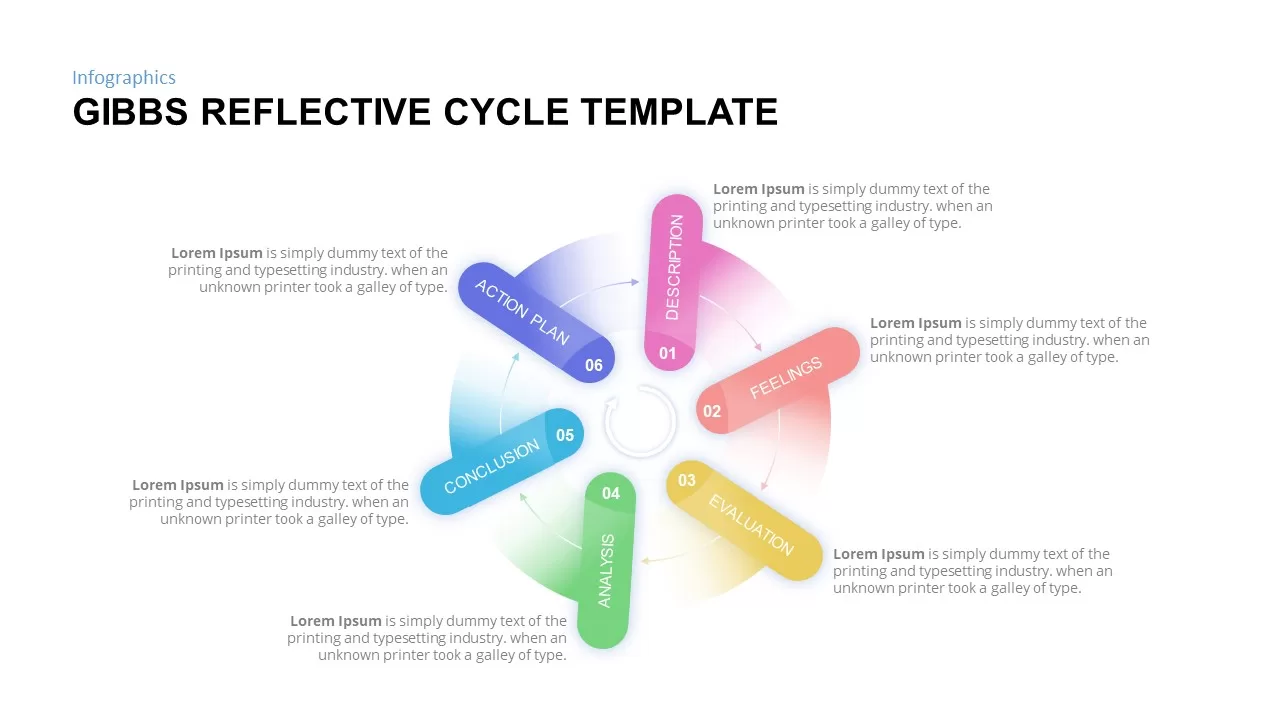
Gibbs Reflective Cycle Overview Template for PowerPoint & Google Slides
Process
Concentric Circular Arrow Cycle Diagram Template for PowerPoint & Google Slides
Process
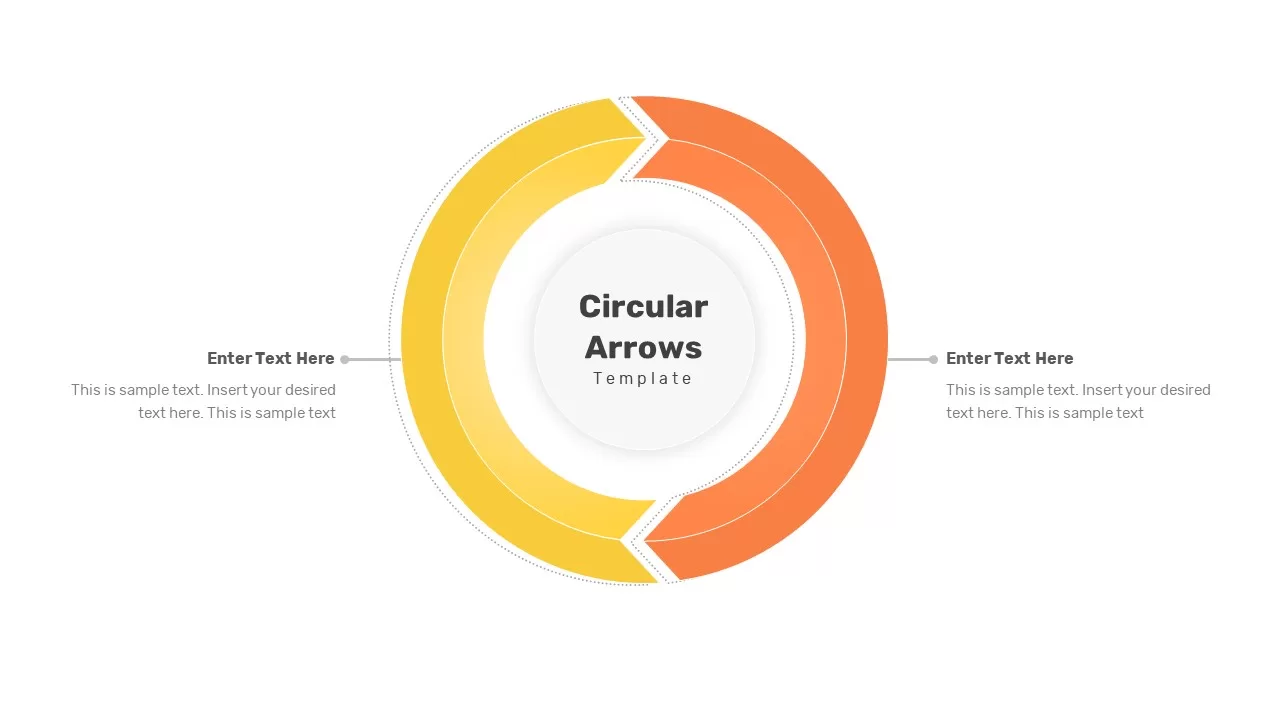
Dual-Stage Circular Arrow Cycle Template for PowerPoint & Google Slides
Process
Three-Segment Circular Arrow Cycle Template for PowerPoint & Google Slides
Circular
Four-Segment Circular Arrow Cycle Template for PowerPoint & Google Slides
Circular
Six-Segment Circular Arrow Cycle Template for PowerPoint & Google Slides
Circular
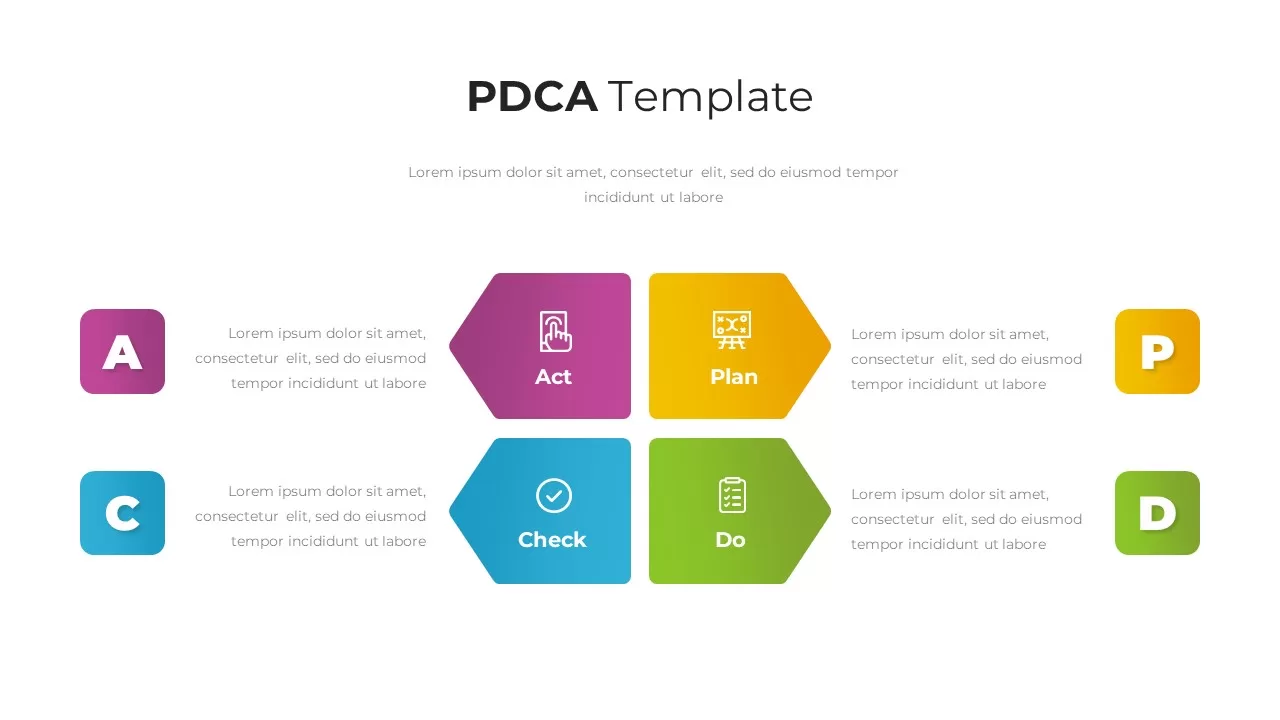
PDCA Cycle Infographic with Four Stages Template for PowerPoint & Google Slides
Process
PDCA Plan Do Check Act Cycle Infographic Template for PowerPoint & Google Slides
Process
PDCA Four-Stage Cycle Infographic Template for PowerPoint & Google Slides
Process
Robotics Process Cycle Infographic Template for PowerPoint & Google Slides
Process
Design Thinking Process Cycle Slide Template for PowerPoint & Google Slides
Process
Hexagonal Design Thinking Cycle Template for PowerPoint & Google Slides
Process
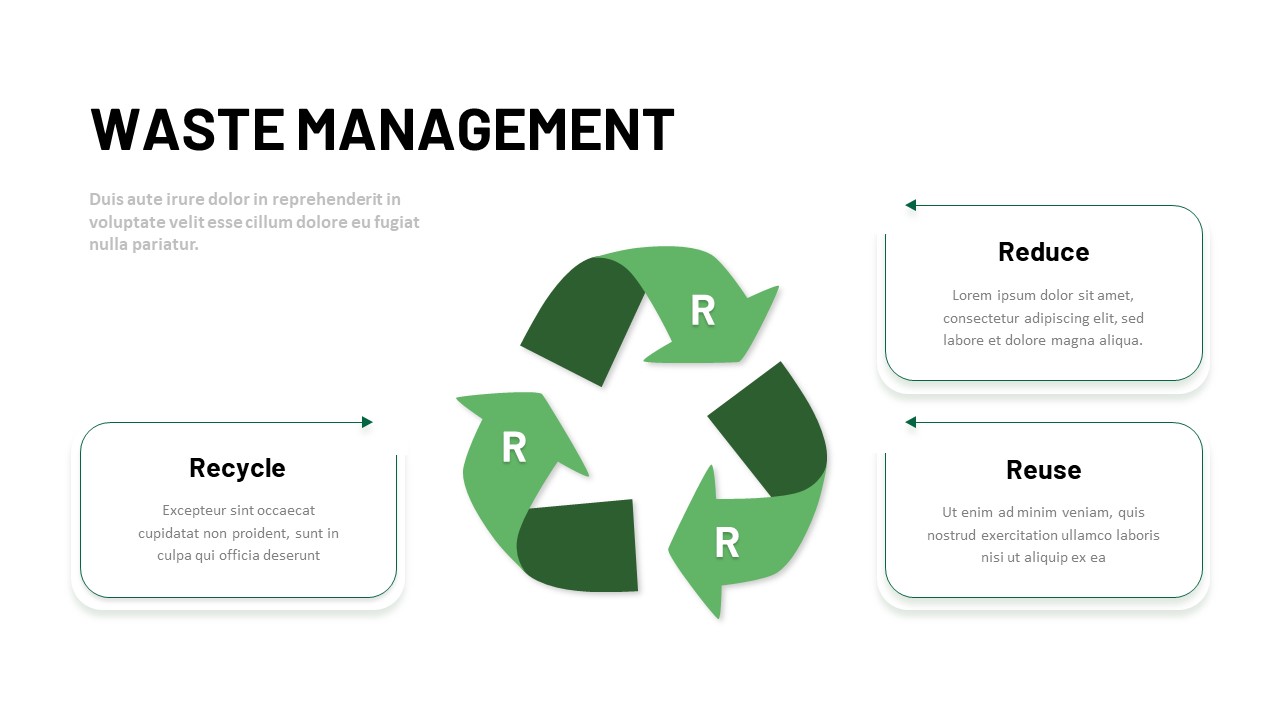
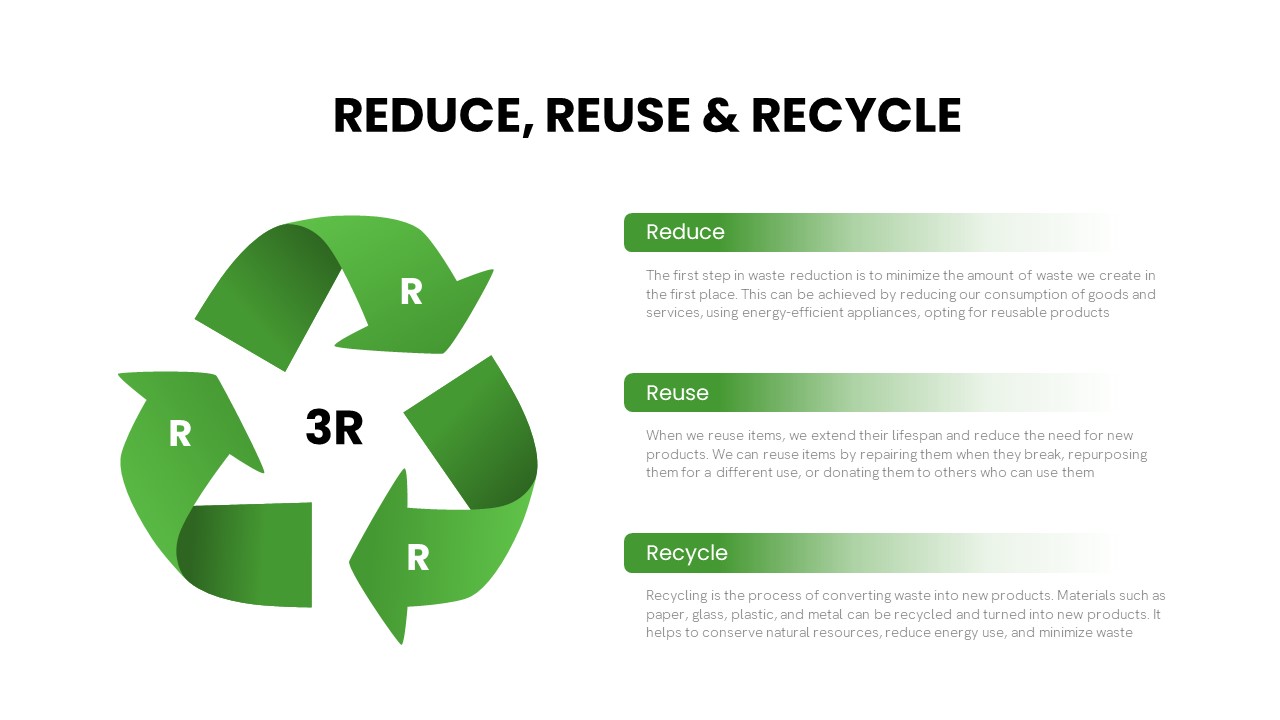
3R Waste Management Cycle Diagram Template for PowerPoint & Google Slides
Circular
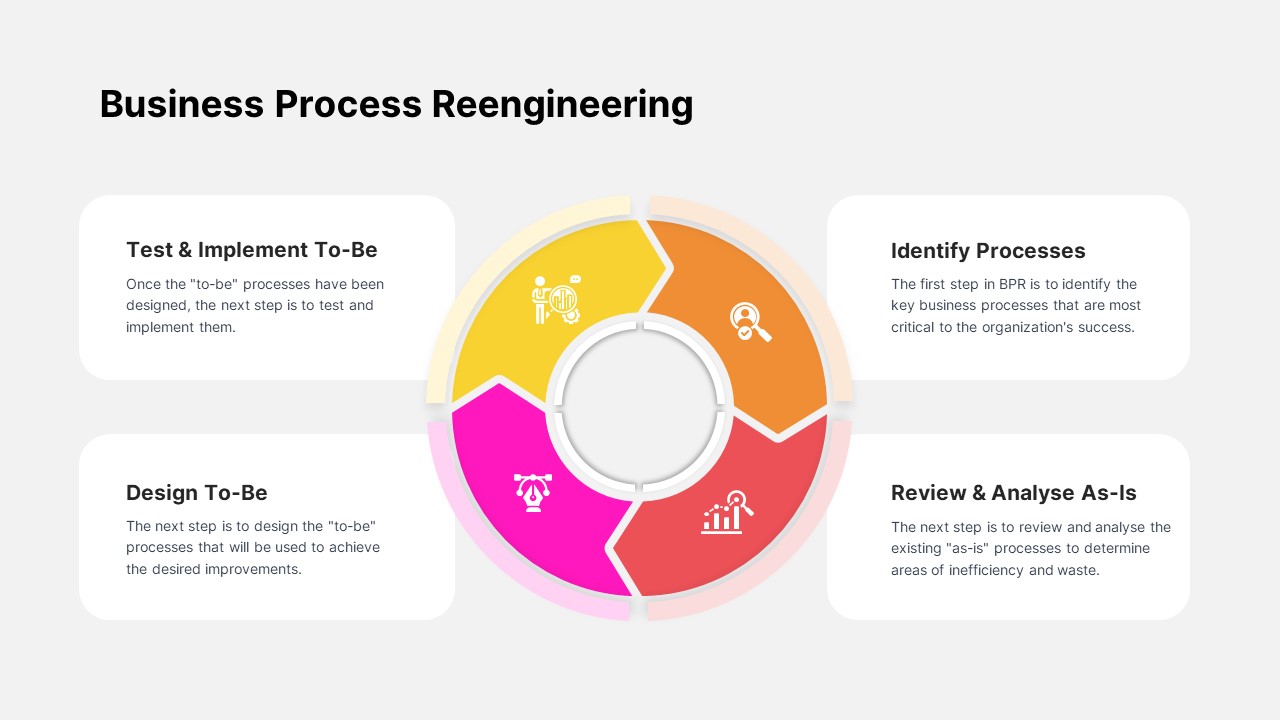
Business Process Reengineering Cycle Template for PowerPoint & Google Slides
Circular
3R Waste Management Cycle Overview template for PowerPoint & Google Slides
Process
Release Management Cycle Circular Diagram Template for PowerPoint & Google Slides
Software Development
Business Process Analysis Cycle Diagram Template for PowerPoint & Google Slides
Business Strategy
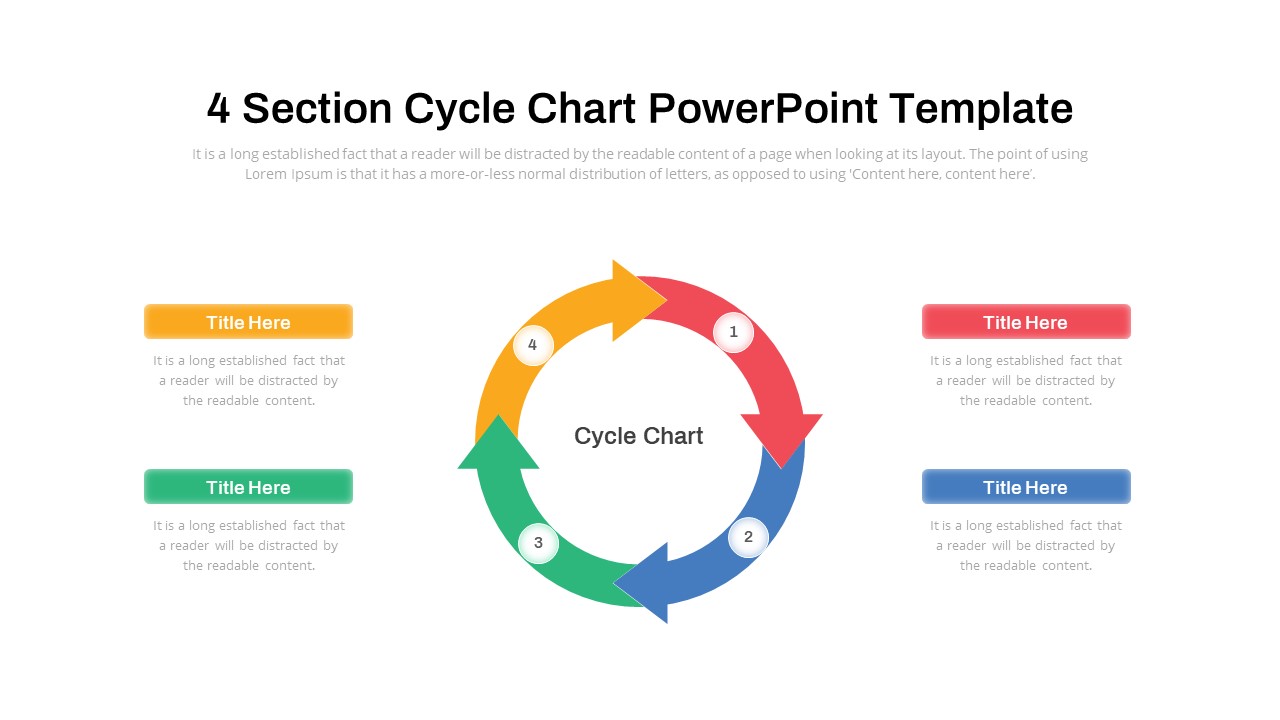
Cycle Chart Template for PowerPoint & Google Slides
Circular
Free Time Management Clock Cycle Diagram Template for PowerPoint & Google Slides
Process
Free
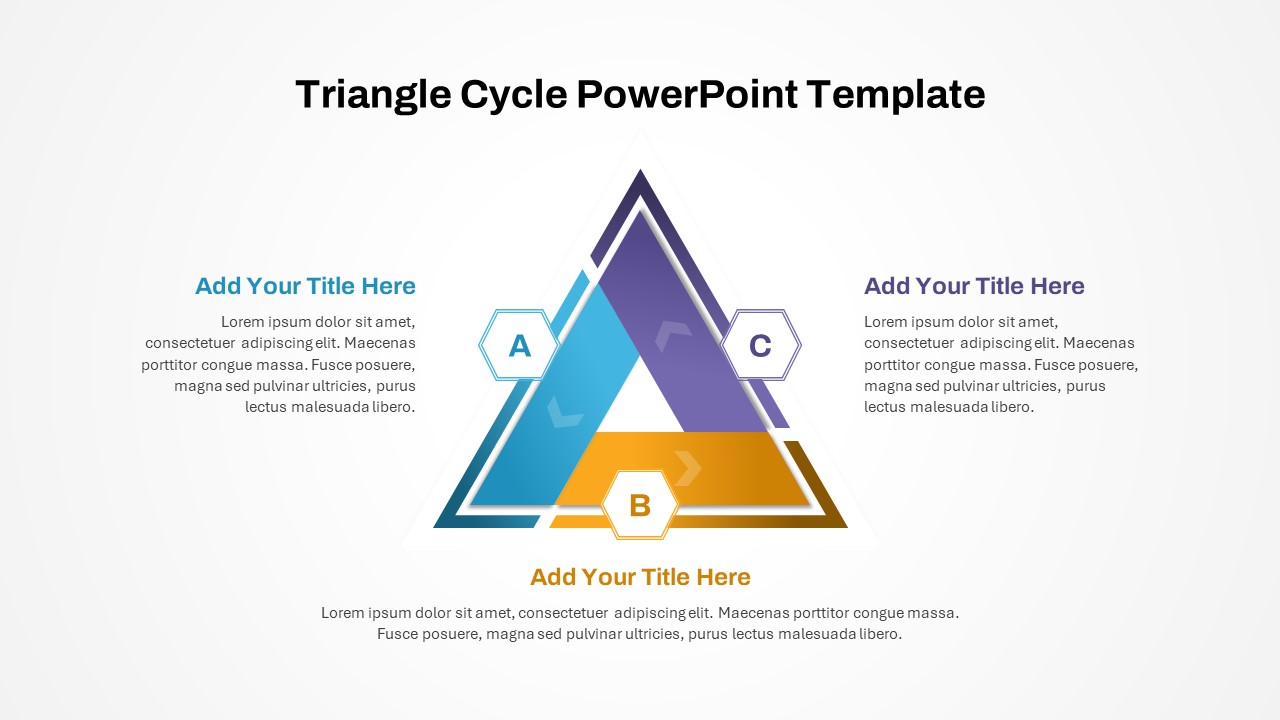
Three-Phase Triangle Cycle Diagram Template for PowerPoint & Google Slides
Infographics
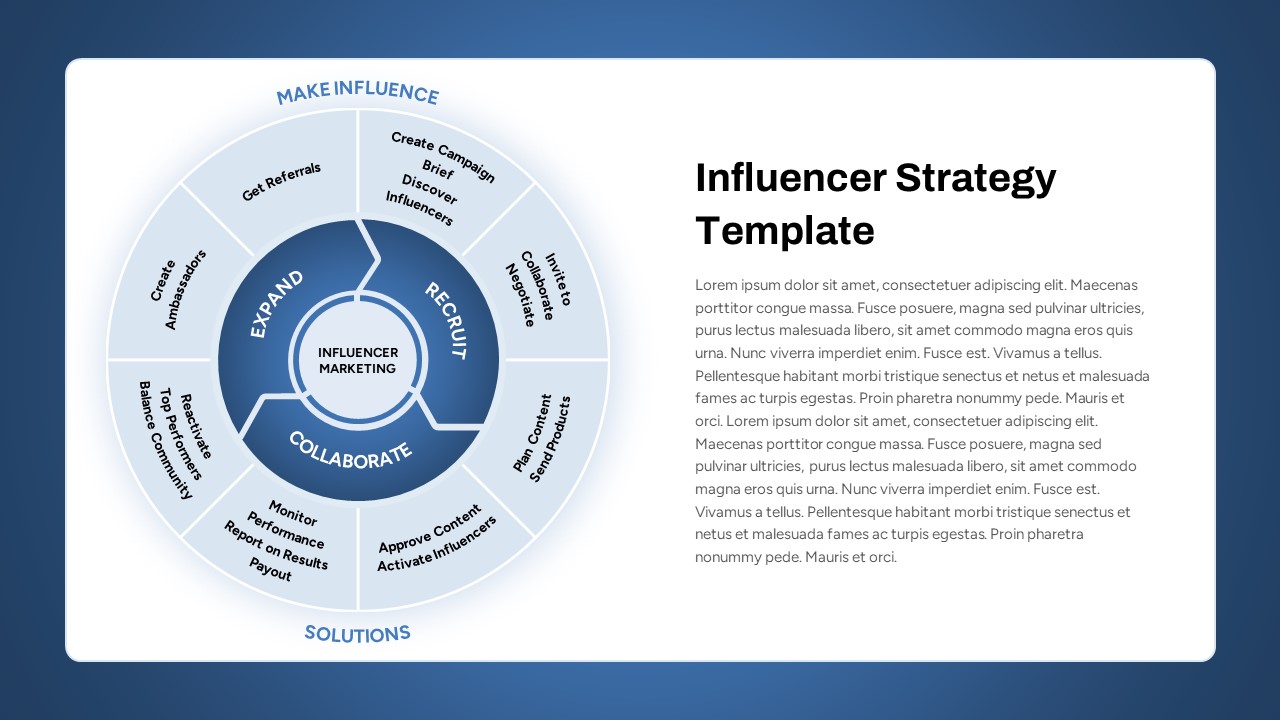
Influencer Marketing Cycle Strategy Template for PowerPoint & Google Slides
Circular
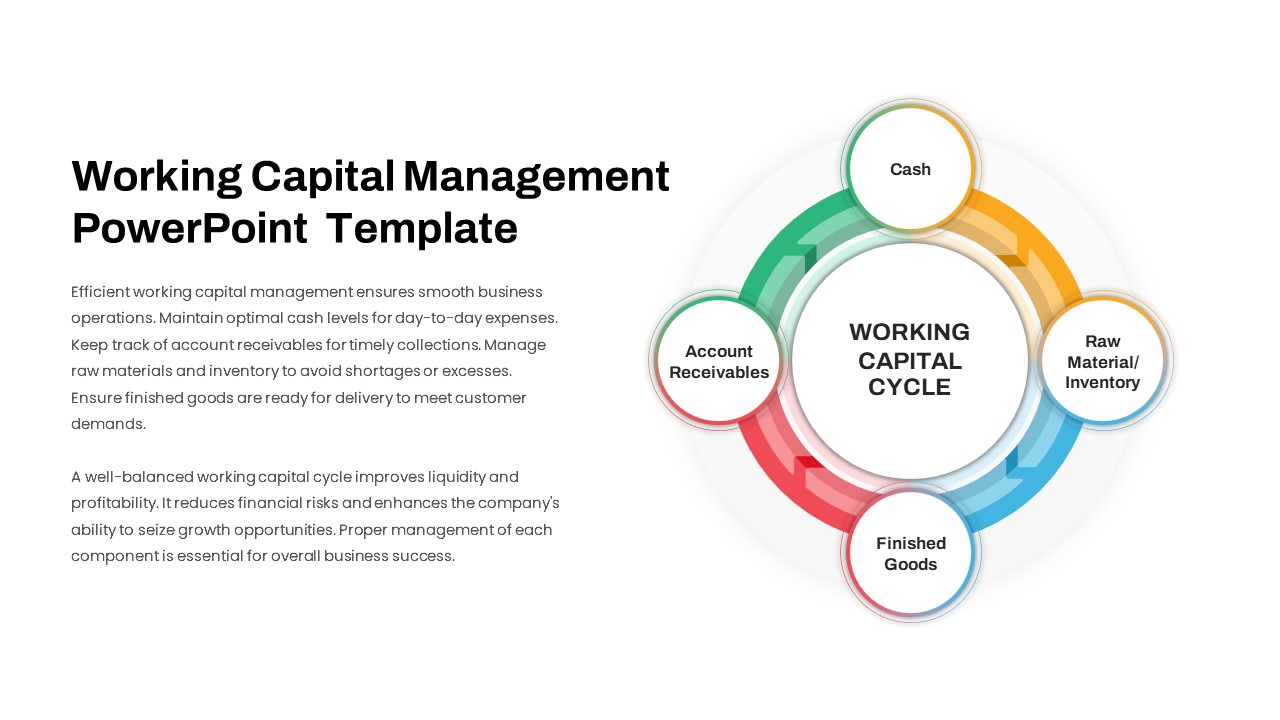
Working Capital Cycle Diagram Template for PowerPoint & Google Slides
Circular
Gartner Hype Cycle Adoption Curve Diagram Template for PowerPoint & Google Slides
Infographics
Colorful Startup Financing Cycle Diagram Template for PowerPoint & Google Slides
Finance
Seeds Growth Cycle Business Model Template for PowerPoint & Google Slides
Process
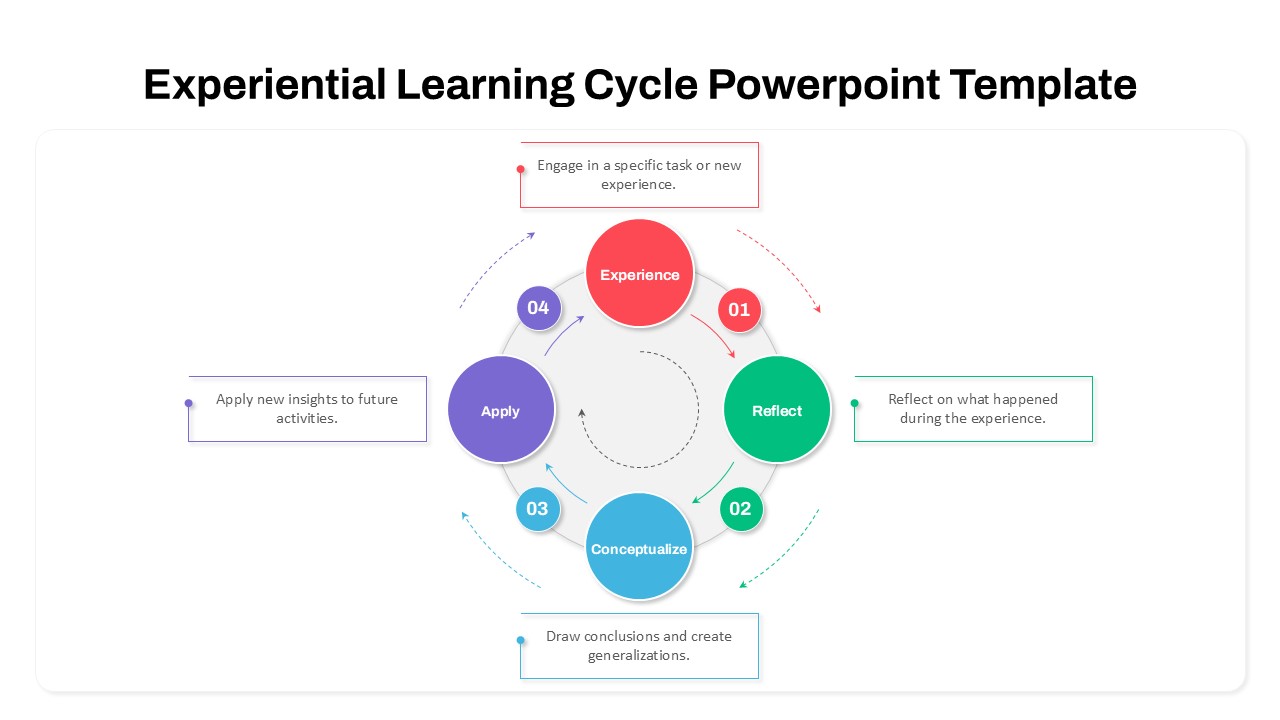
Experiential Learning Cycle Diagram Template for PowerPoint & Google Slides
Circular
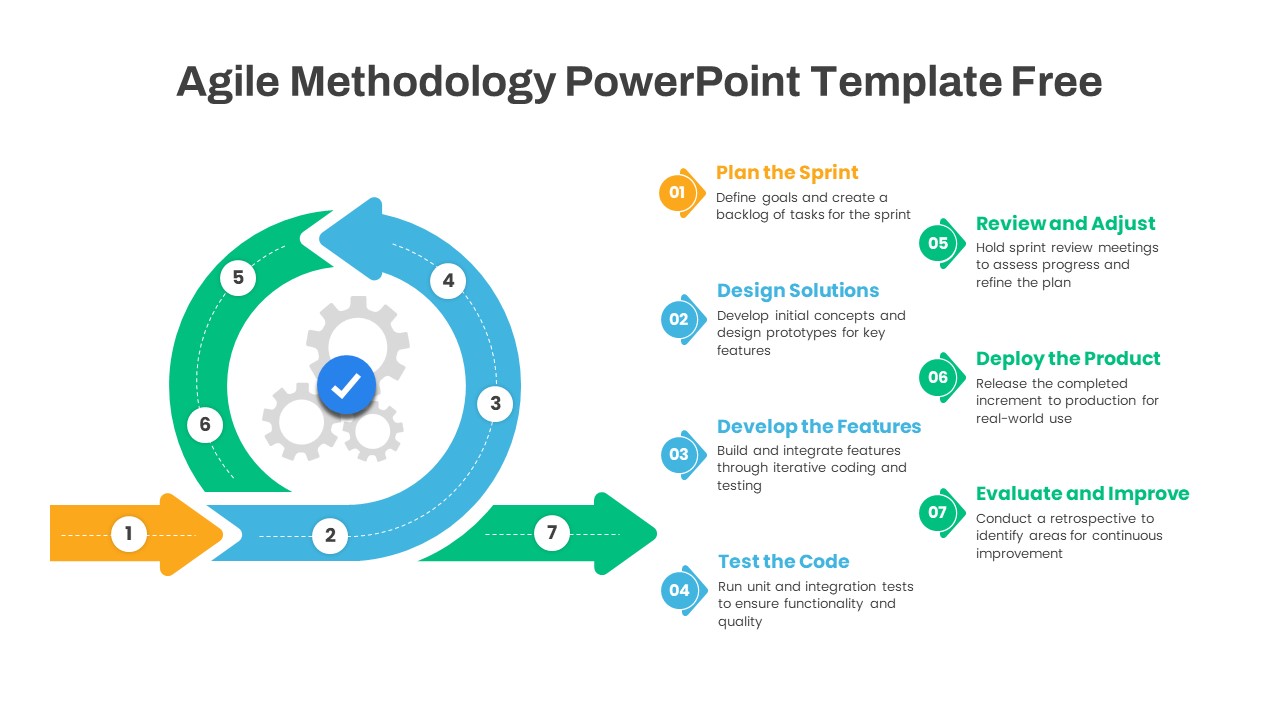
Agile Methodology Cycle Diagram Template for PowerPoint & Google Slides
Project
Free
Change Management Process Cycle Diagram Template for PowerPoint & Google Slides
Process
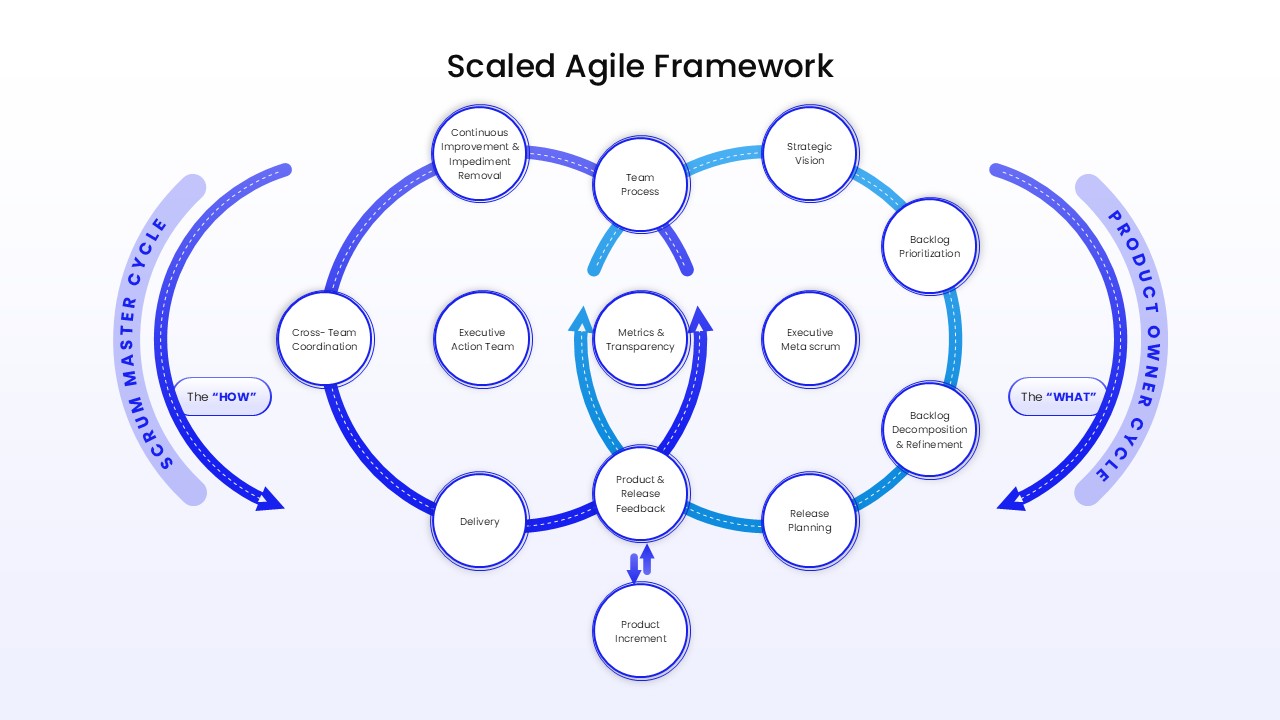
Two-Cycle Scaled Agile Framework Template for PowerPoint & Google Slides
Scrum
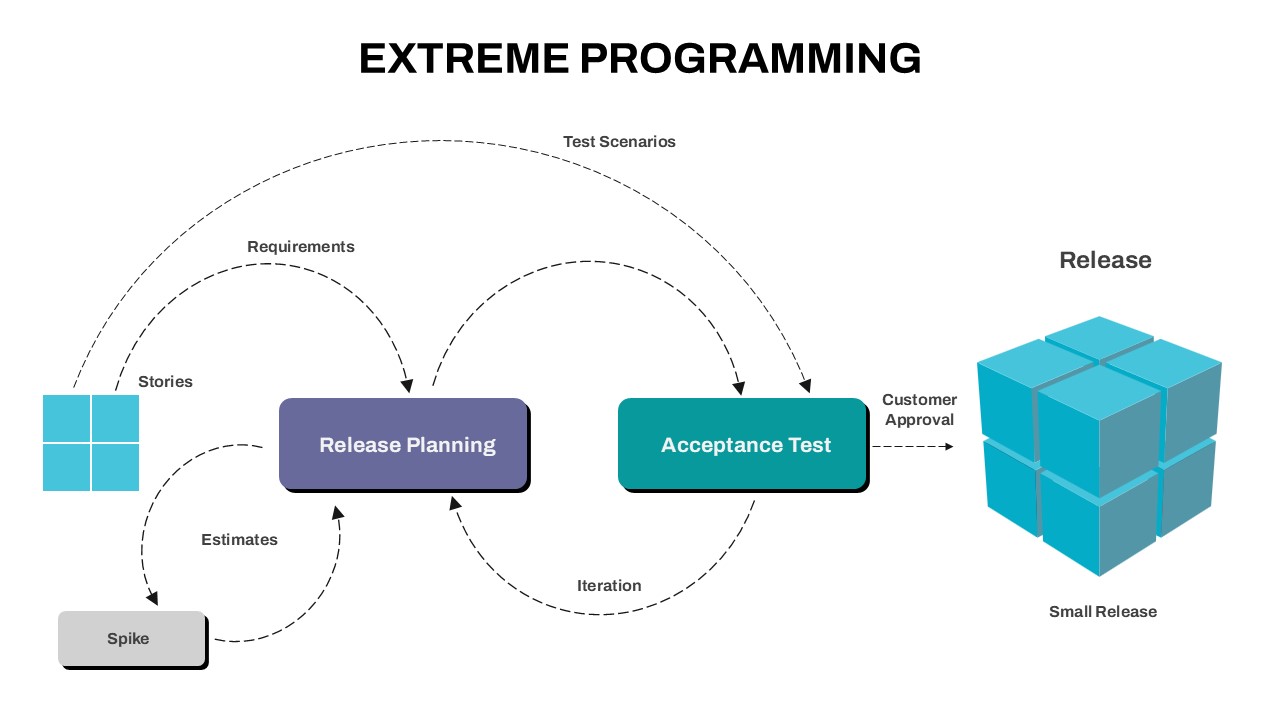
Extreme Programming Process Cycle Template for PowerPoint & Google Slides
Software Development
Flywheel Growth Cycle Diagram Template for PowerPoint & Google Slides
Circular
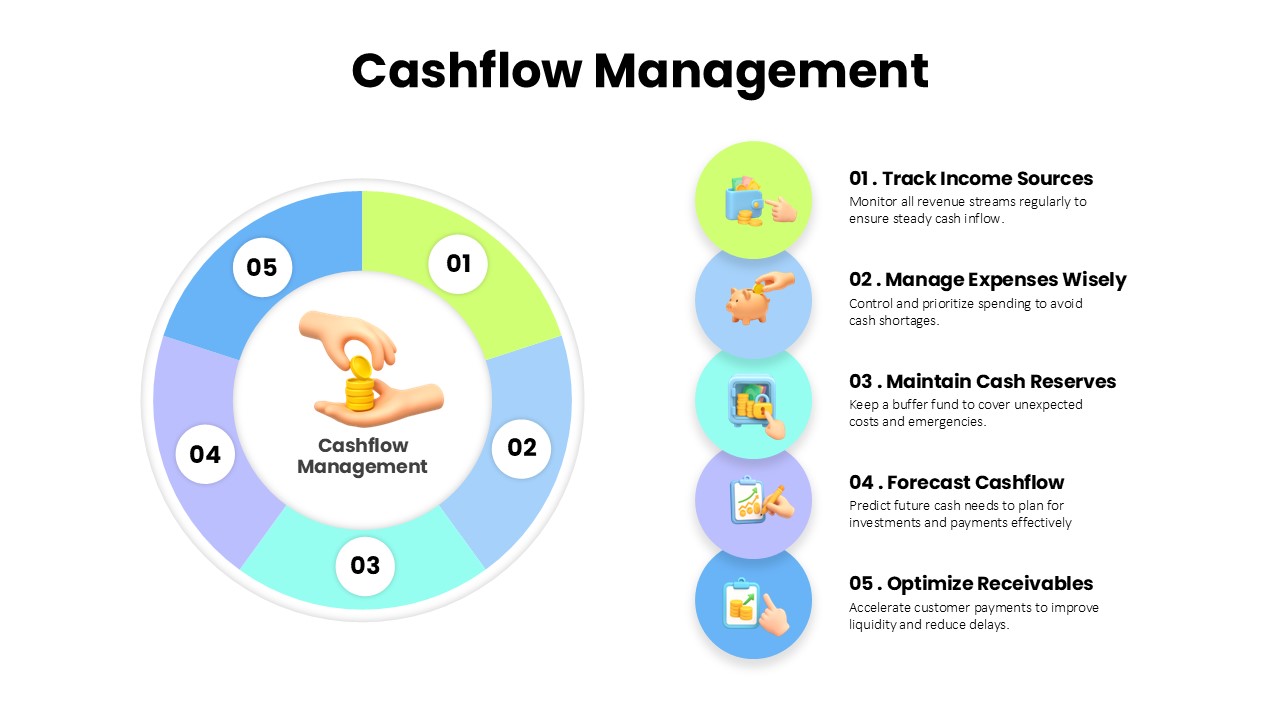
Cashflow Management Cycle Diagram Template for PowerPoint & Google Slides
Finance
Continuous Improvement Cycle Diagram Template for PowerPoint & Google Slides
Process
Modern Cycle Process for PowerPoint & Google Slides
Infographics
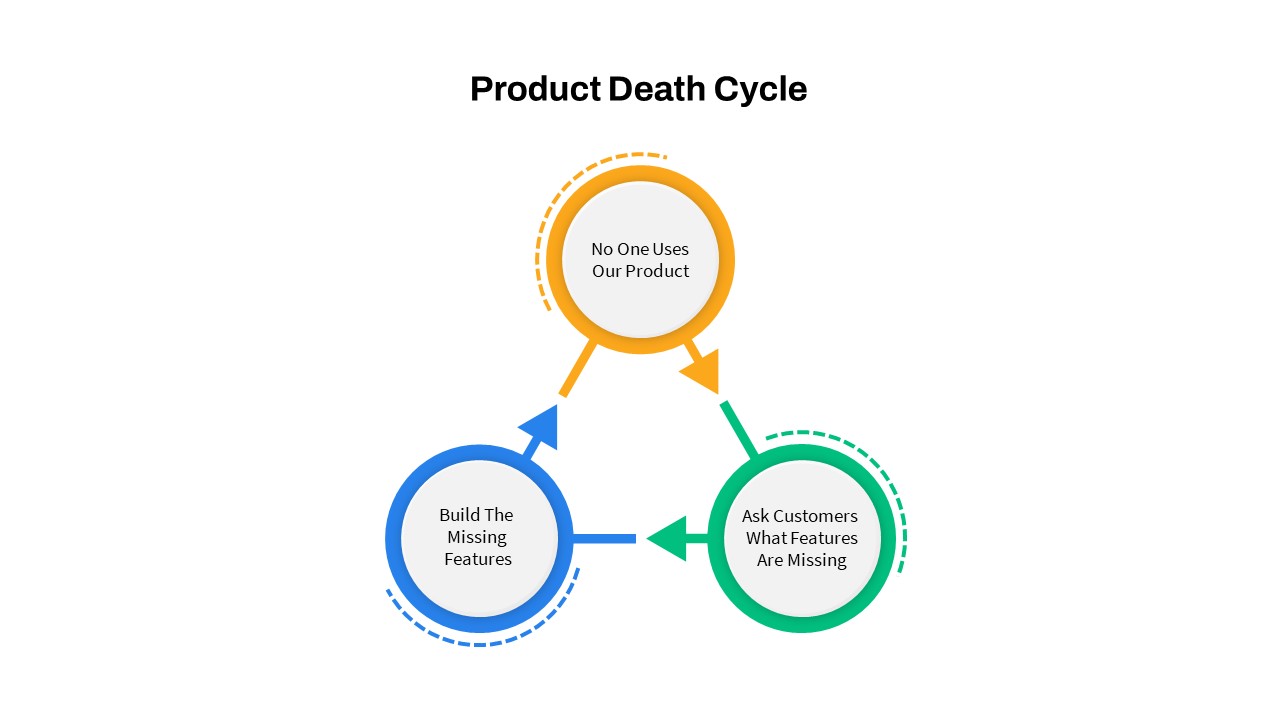
Product Death Cycle Diagram Slide for PowerPoint & Google Slides
Circular

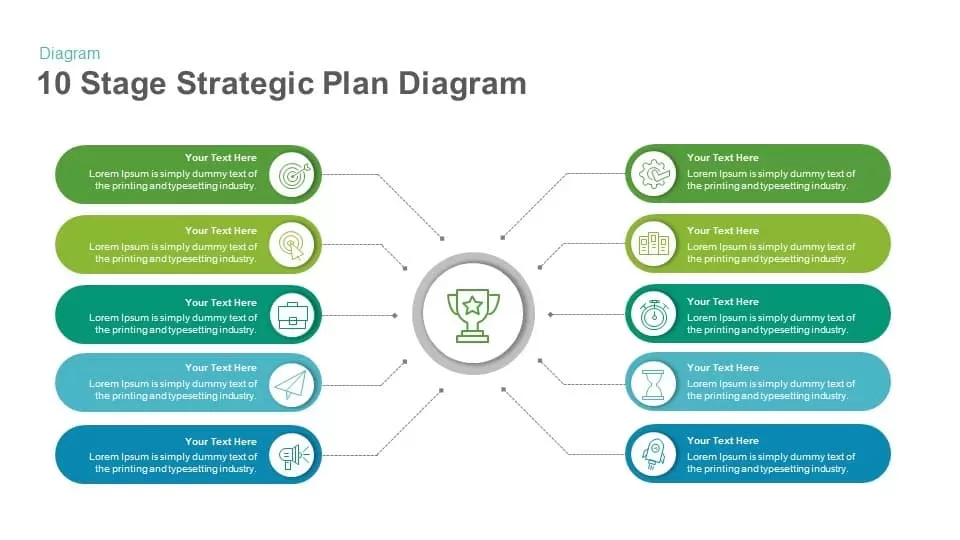
10 Stage Strategic Plan Diagram template for PowerPoint & Google Slides
Process
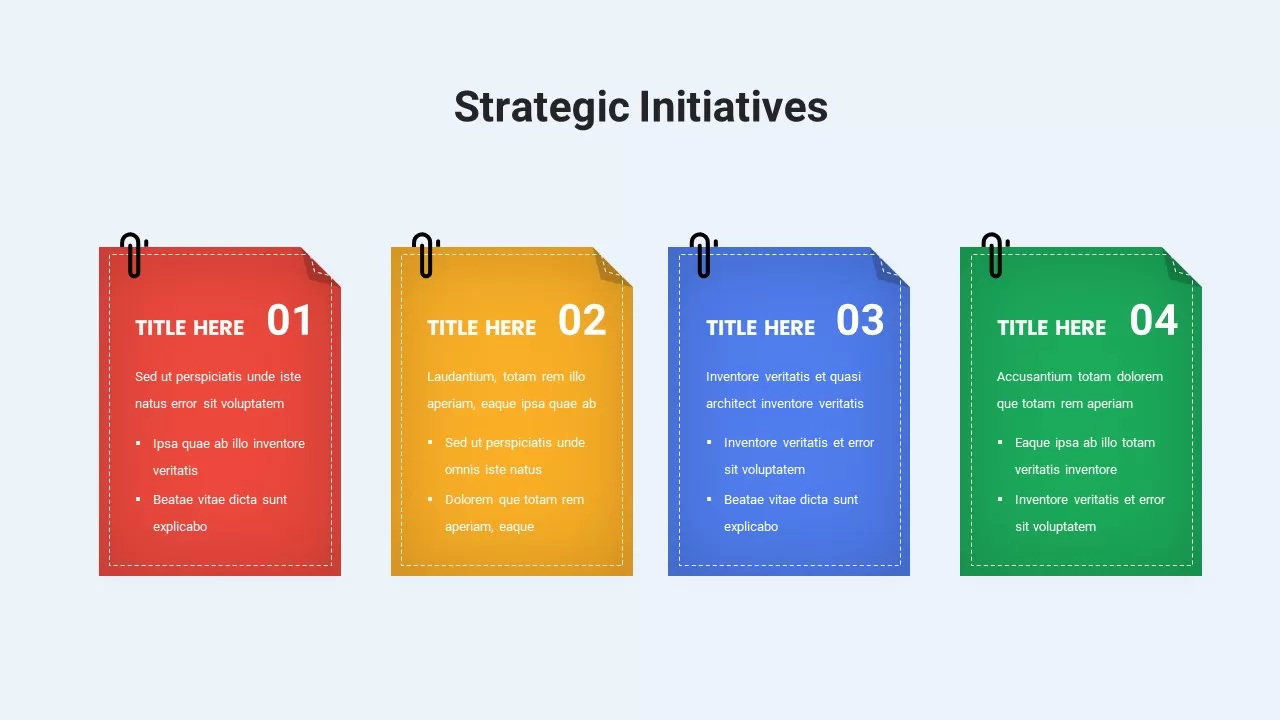
4-Item Strategic Initiatives Slide Template for PowerPoint & Google Slides
Process
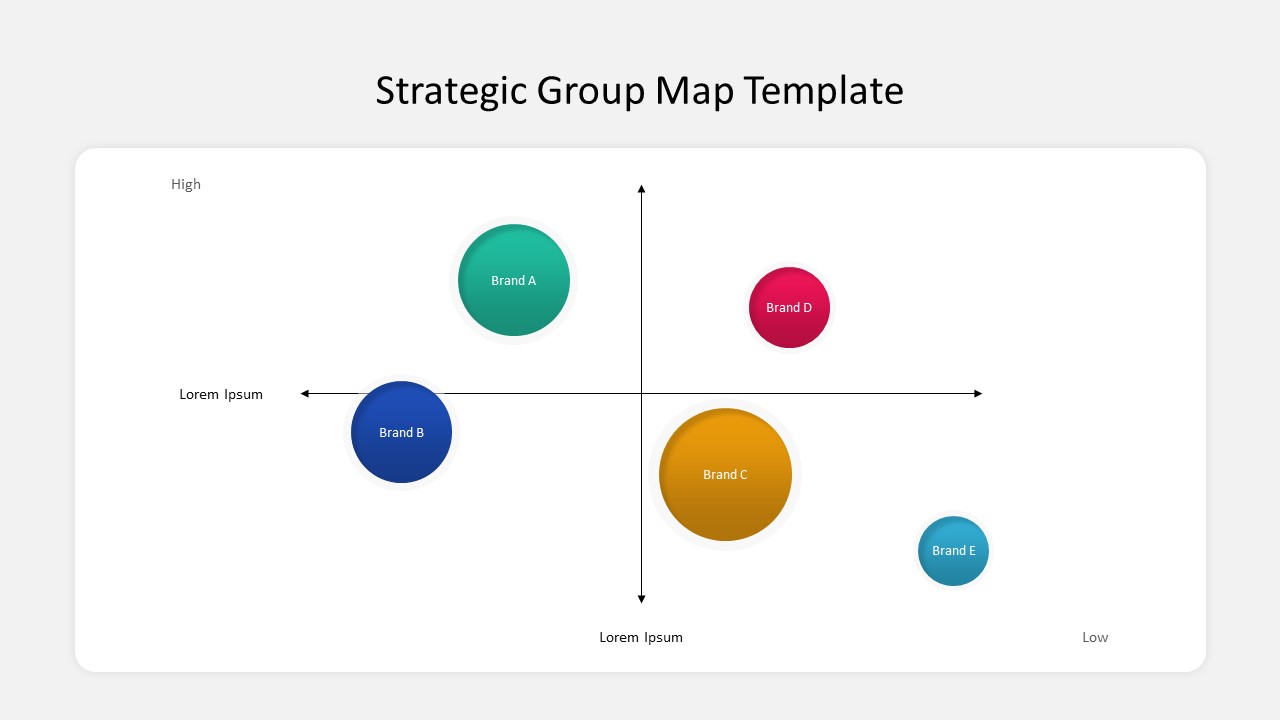
Business Strategic Group Map Analysis Template for PowerPoint & Google Slides
Competitor Analysis
Free
Six-Month Strategic SEO Roadmap Template for PowerPoint & Google Slides
Roadmap
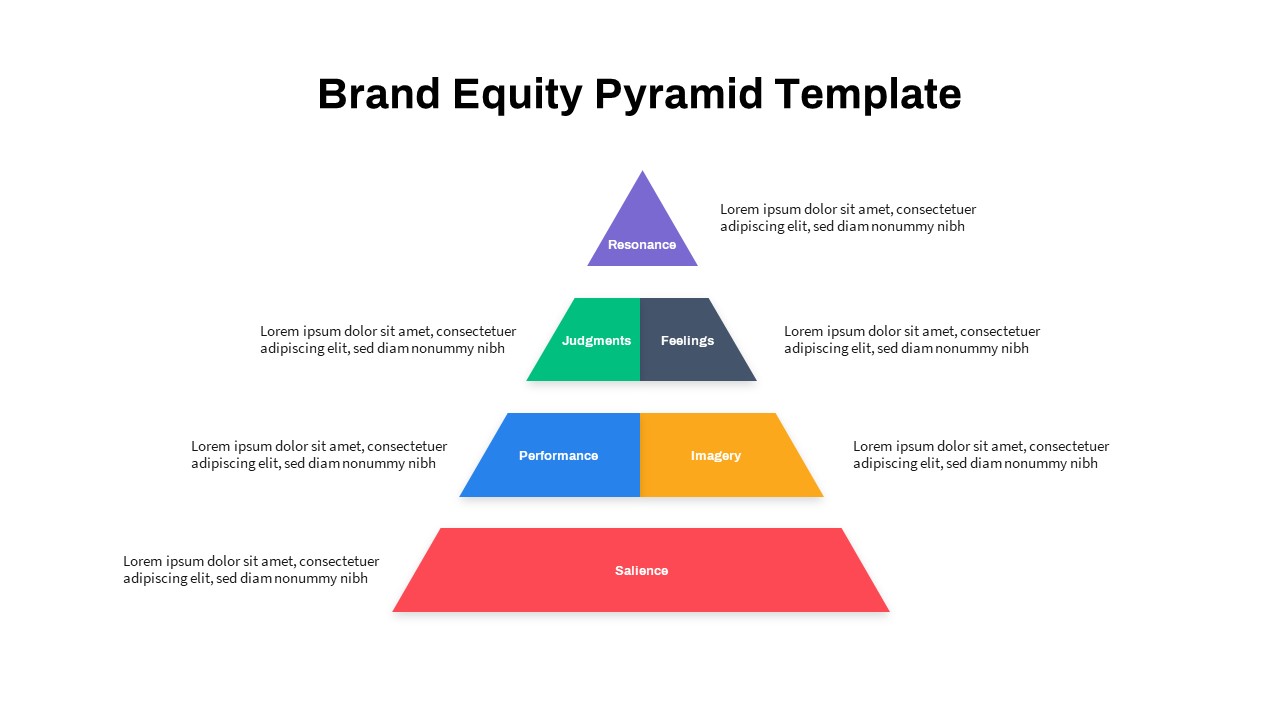
Strategic Brand Equity Pyramid Diagram Template for PowerPoint & Google Slides
Pyramid
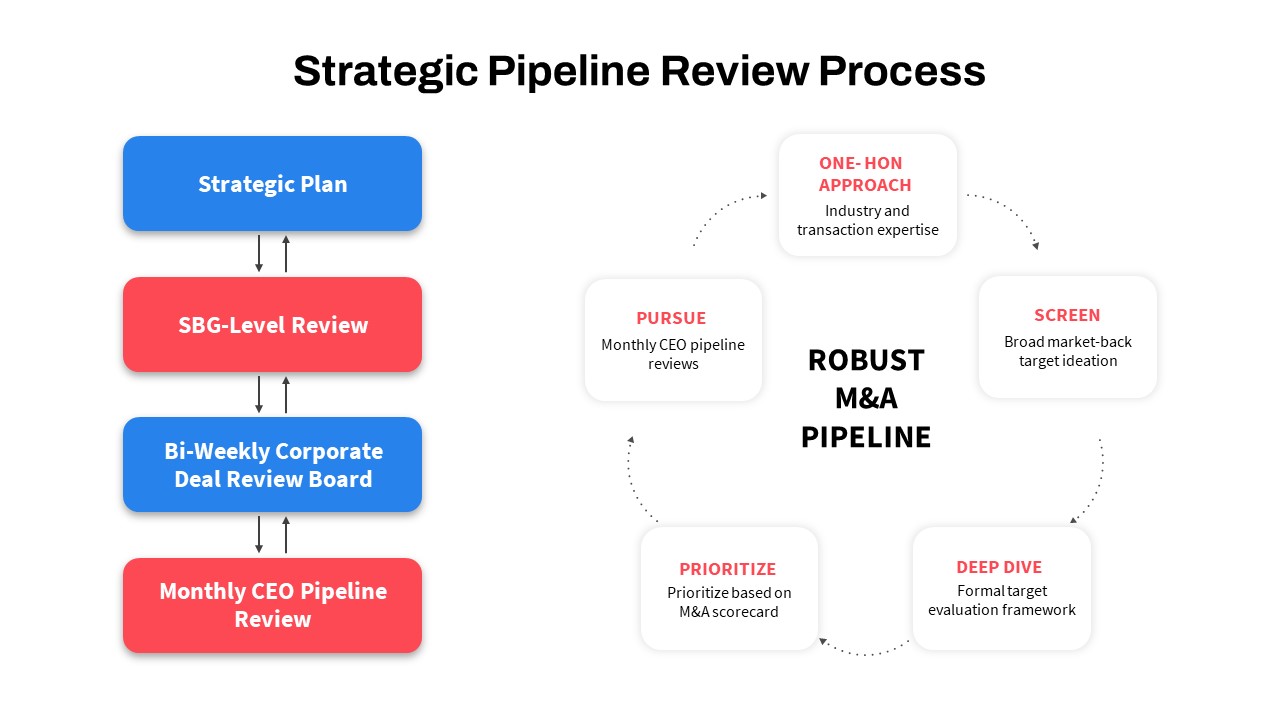
Strategic Pipeline Review Diagram Template for PowerPoint & Google Slides
Business Strategy
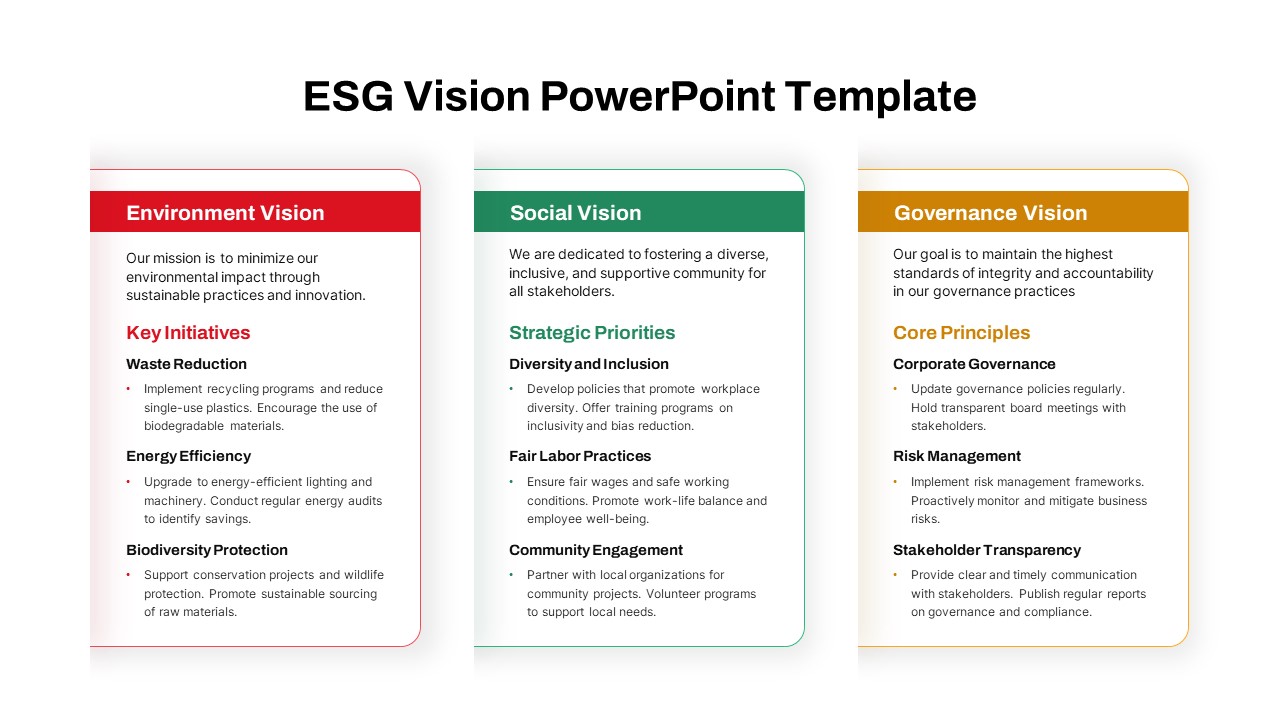
ESG Vision & Strategic Priorities Template for PowerPoint & Google Slides
Business Strategy
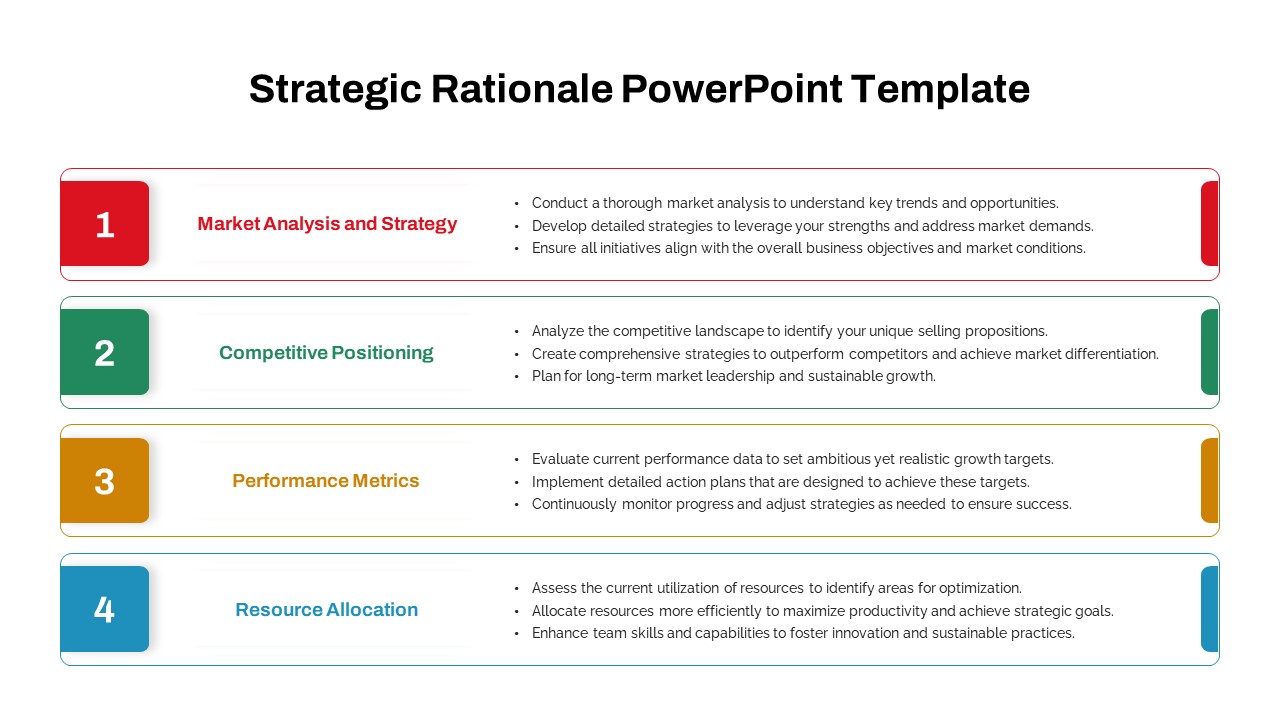
Strategic Rationale Framework Diagram Template for PowerPoint & Google Slides
Process
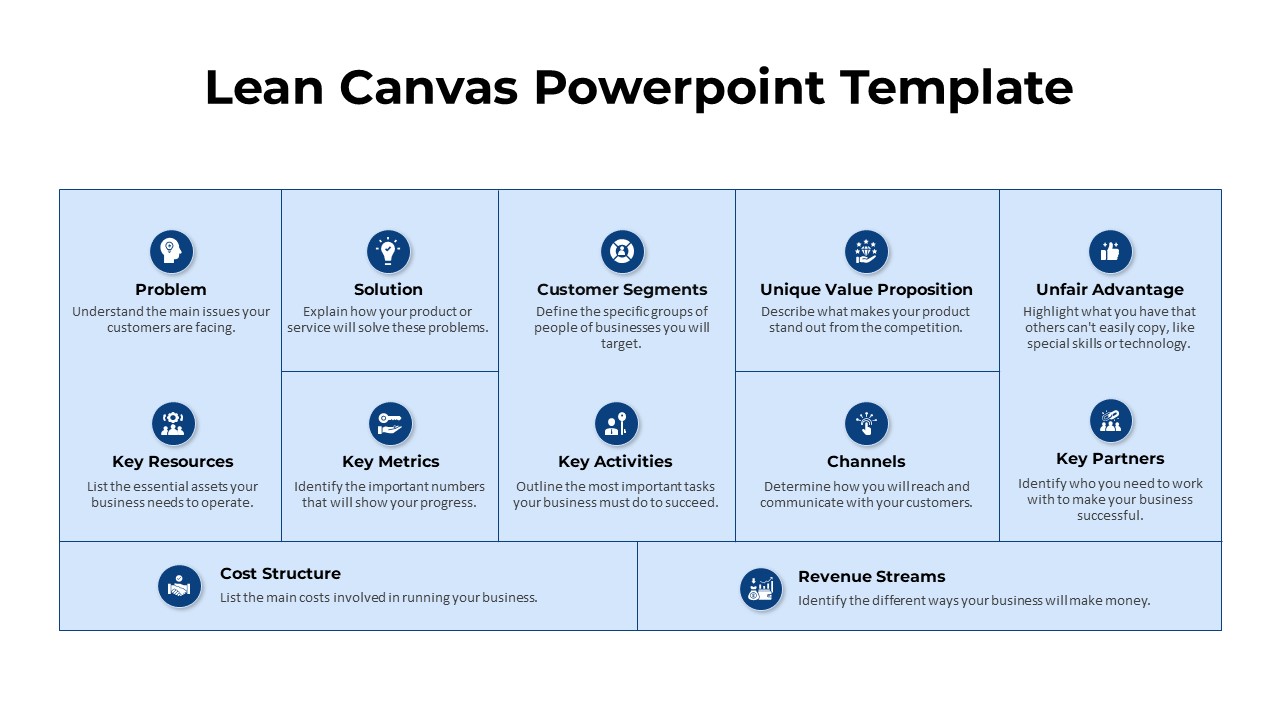
Strategic Lean Canvas Business Model Template for PowerPoint & Google Slides
Business Models