3D Block Infographic template for PowerPoint & Google Slides


Description
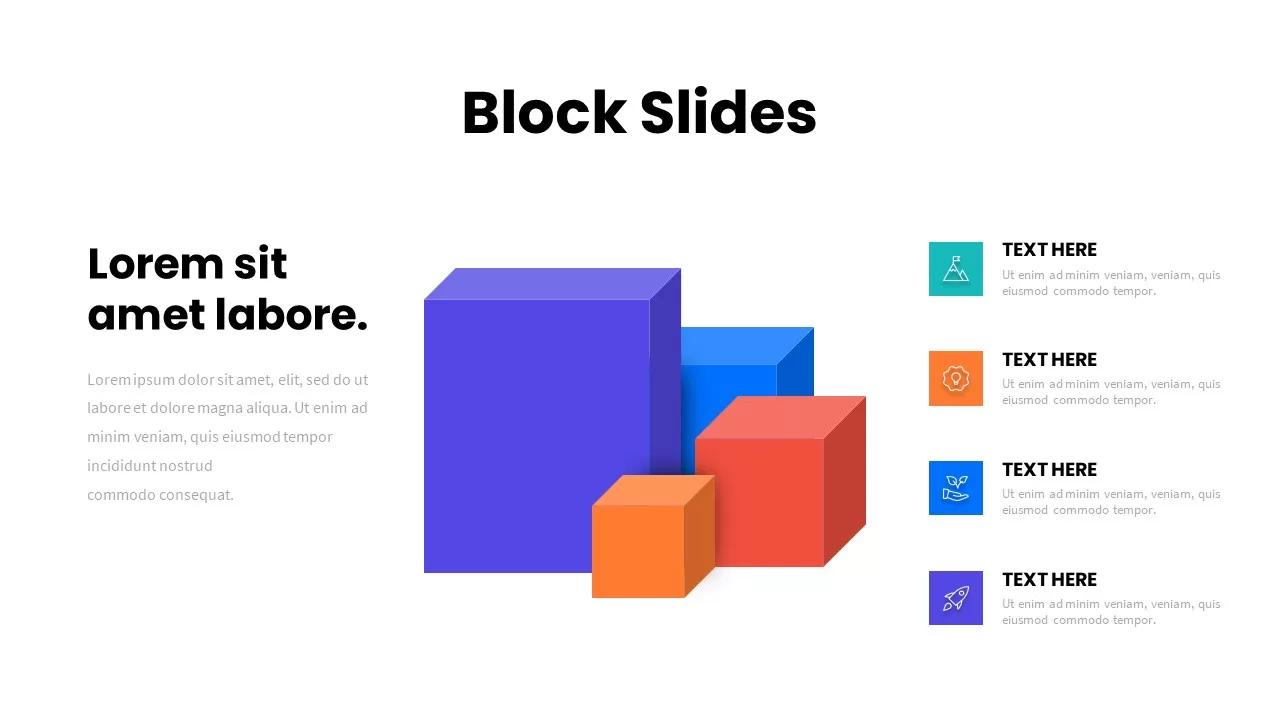
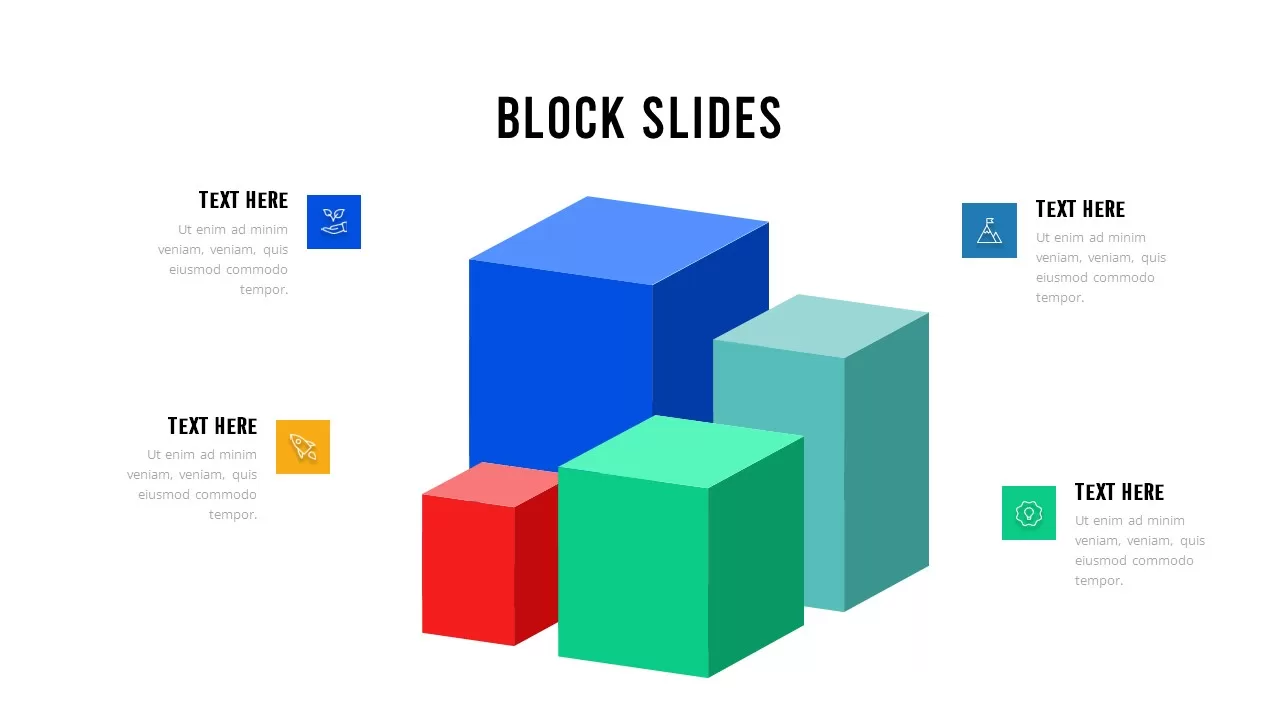
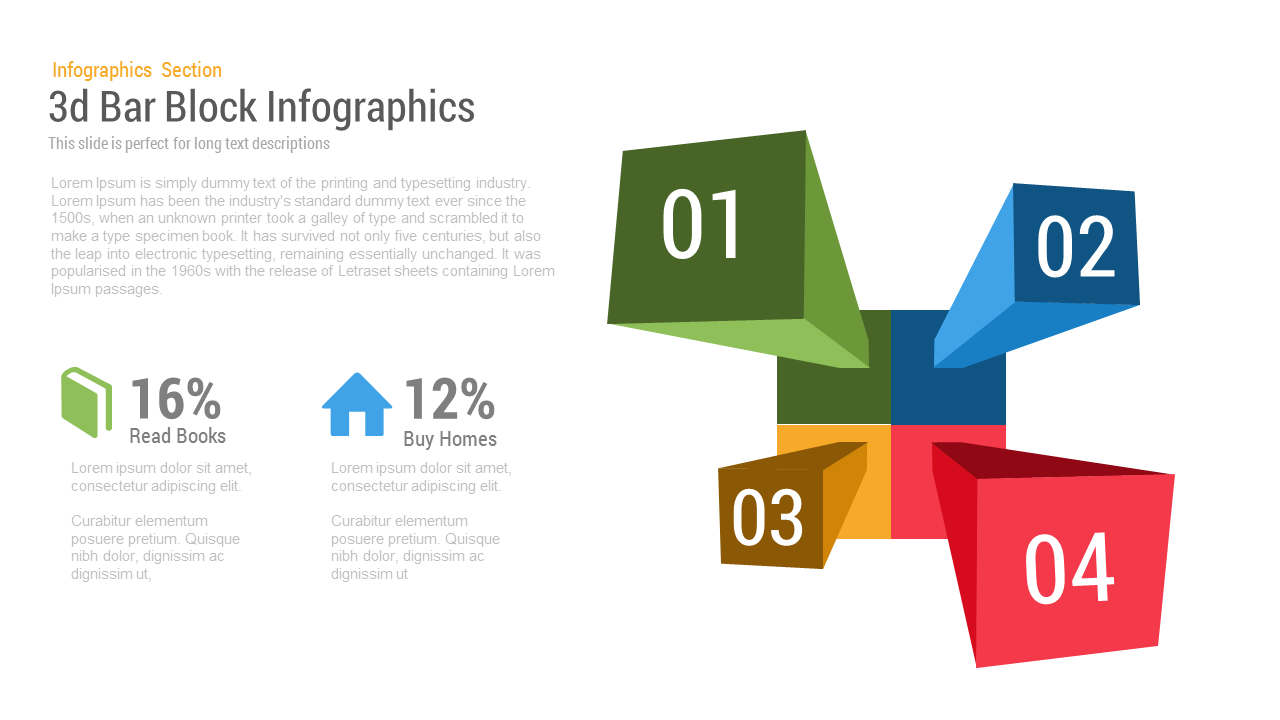
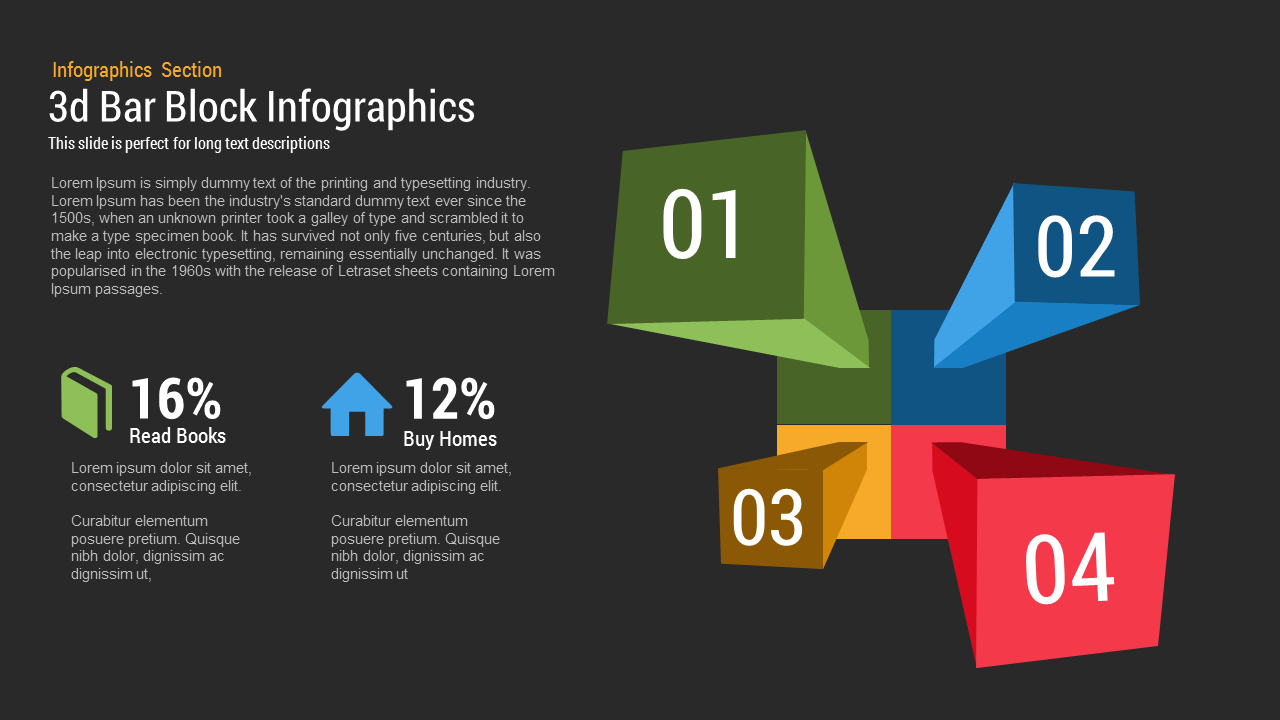
This 3D Block Infographic template features a clean white background with a dramatic 3D block chart on the right and a detailed text section on the left. The right side showcases four extruded colored blocks labeled “01,” “02,” “03,” and “04,” each rendered in distinct accent hues of green, blue, brown, and red. These blocks rise from a central four-square base, creating dynamic depth and perspective ideal for illustrating steps, categories, or comparative data. On the left, a structured text area includes a title and placeholder paragraph for long-form descriptions, followed by two editable percentage metrics with accompanying icons—a book icon for “16% Read Books” and a house icon for “12% Buy Homes.” Each metric section supports multiple lines of supporting text.
Built on master slides, every element—including the 3D block shapes, percentage graphics, and icons—is fully editable in PowerPoint and Google Slides. Users can adjust block colors, resize or reposition cubes, swap icons, and update text styles globally via theme settings. The design supports both 16:9 widescreen and 4:3 aspect ratios and maintains crisp visuals on HD displays and virtual meeting platforms. Subtle drop shadows and vector graphics ensure high fidelity at any zoom level, while free web fonts enable typographic consistency. Drag-and-drop placeholders streamline data updates, and hidden variation slides offer alternate color schemes and layout options for quick customization. Animations can be applied to individual blocks or text elements to guide audience focus and enhance storytelling flow.
Who is it for
Product managers, marketing teams, consultants, and data analysts who need to present process steps, feature breakdowns, or segmented metrics with visual impact. Educators and trainers can use it for instructional modules, while freelancers and agencies will appreciate its flexibility for client proposals.
Other Uses
Repurpose this template for feature comparisons, step-by-step guides, or quadrant analyses. Swap icons and labels to create risk assessments, roadmap milestones, or KPI dashboards. The modular 3D blocks can also represent organizational structures, resource allocations, or thematic categories with minimal editing.
Login to download this file

Item ID
SB00050
Related Templates

3D Block Arrow Infographic Diagram Template for PowerPoint & Google Slides
Arrow
Modular Block Infographic Slide Template for PowerPoint & Google Slides
Infographics
Six-Layer 3D Block Stack Infographic Template for PowerPoint & Google Slides
Process
Isometric Block Infographic Steps Template for PowerPoint & Google Slides
Process
Colorful Block Infographic Metrics Slide Template for PowerPoint & Google Slides
Infographics
Isometric Block Steps Infographic Template for PowerPoint & Google Slides
Process
Creative Block List Infographic Template for PowerPoint & Google Slides
Agenda
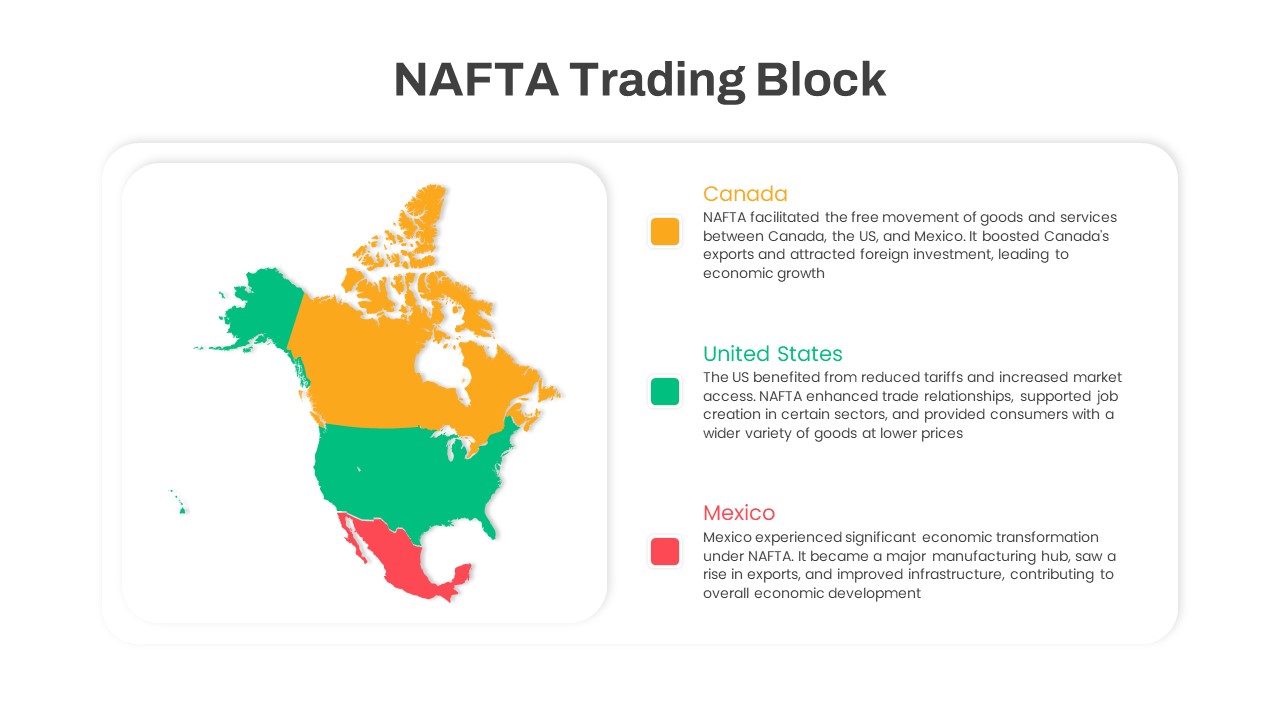
NAFTA Trading Block Map Infographic Template for PowerPoint & Google Slides
World Maps
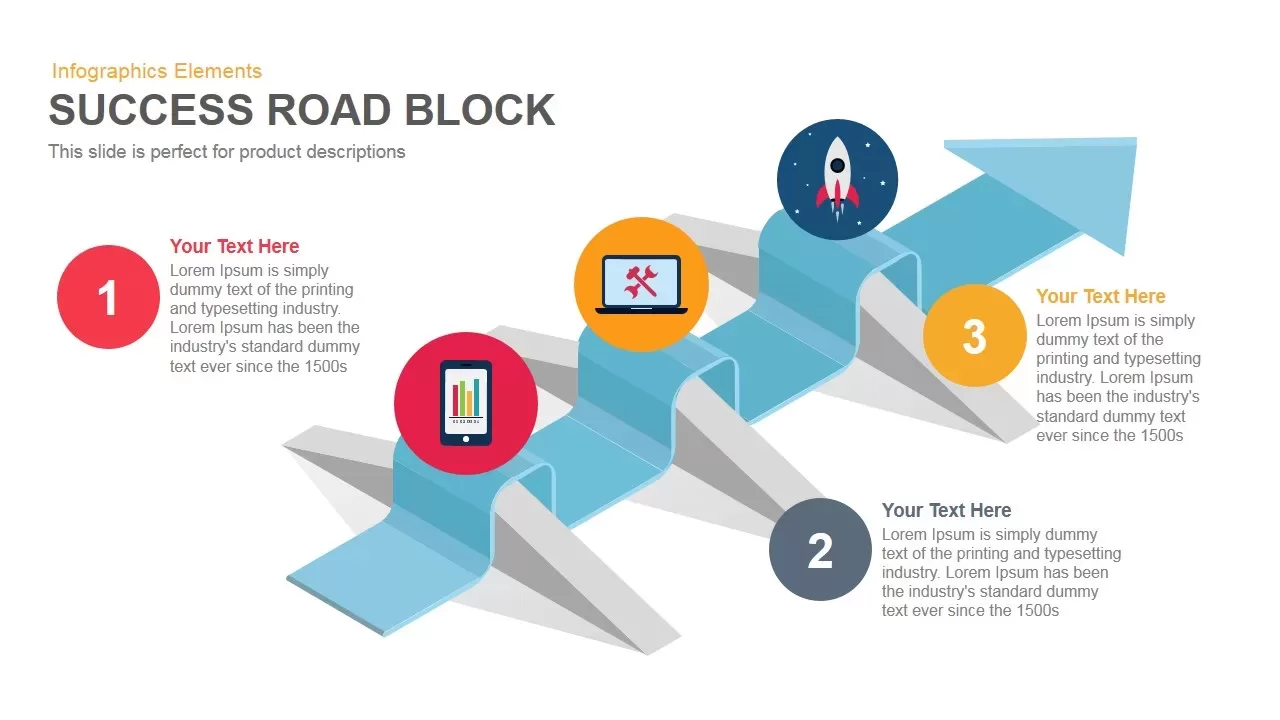
Success Road Block template for PowerPoint & Google Slides
Process

Modern Ten-Block Section Title Chart template for PowerPoint & Google Slides
Comparison
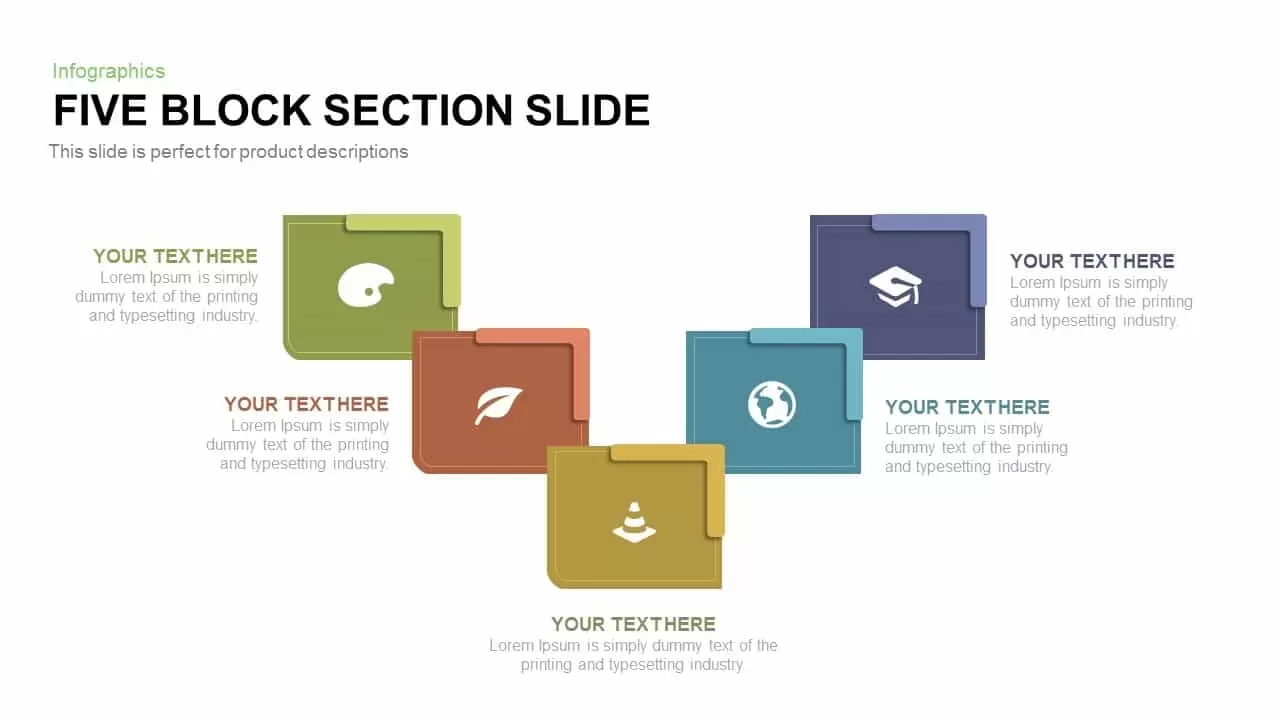
Five-Block Section Feature Highlights Template for PowerPoint & Google Slides
Comparison
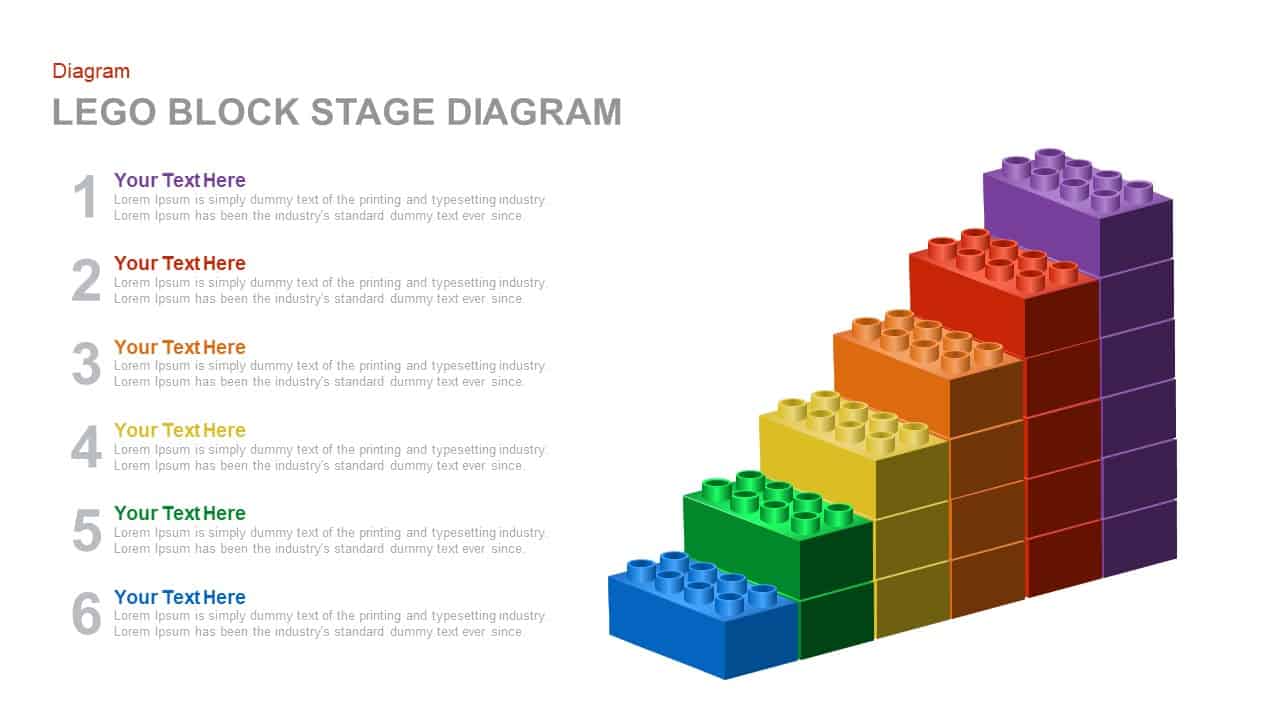
Colorful LEGO Block Stage Diagram Template for PowerPoint & Google Slides
Process

Isometric 3D Block Comparison Diagram Template for PowerPoint & Google Slides
Comparison
Six-Block Capability Statement Template for PowerPoint & Google Slides
Business Report
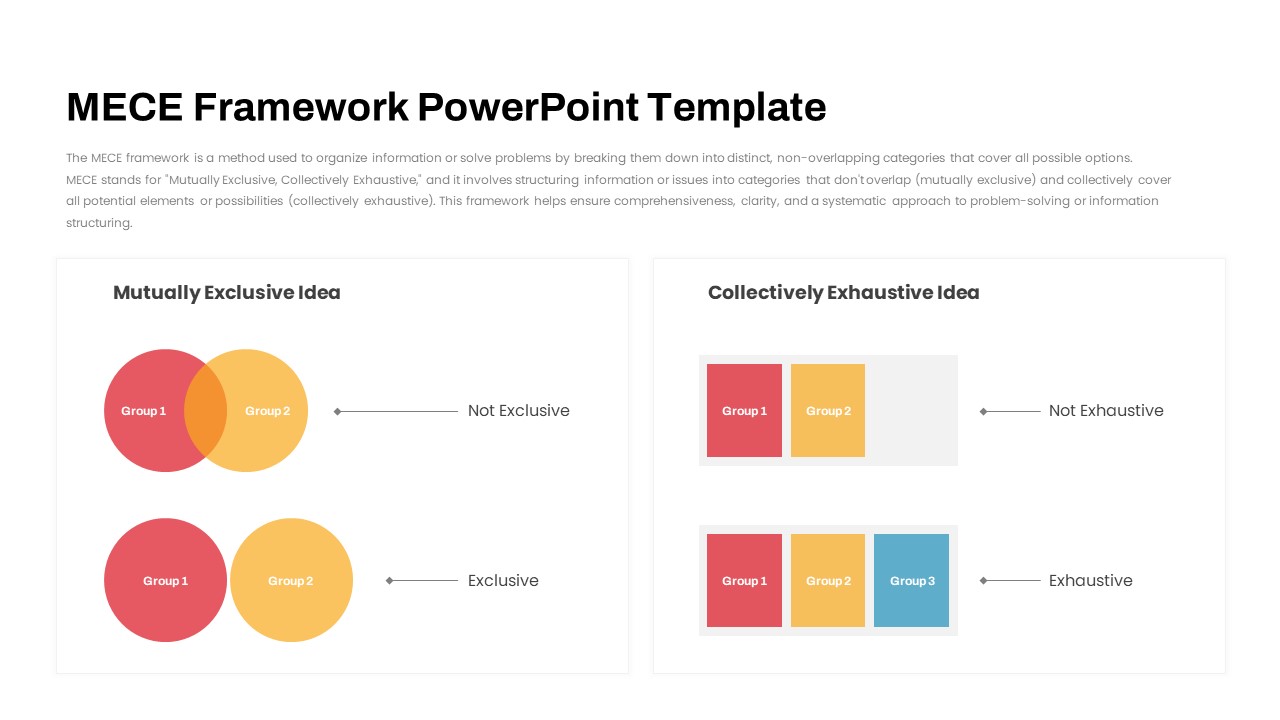
MECE Framework Venn & Block Diagram Template for PowerPoint & Google Slides
Comparison
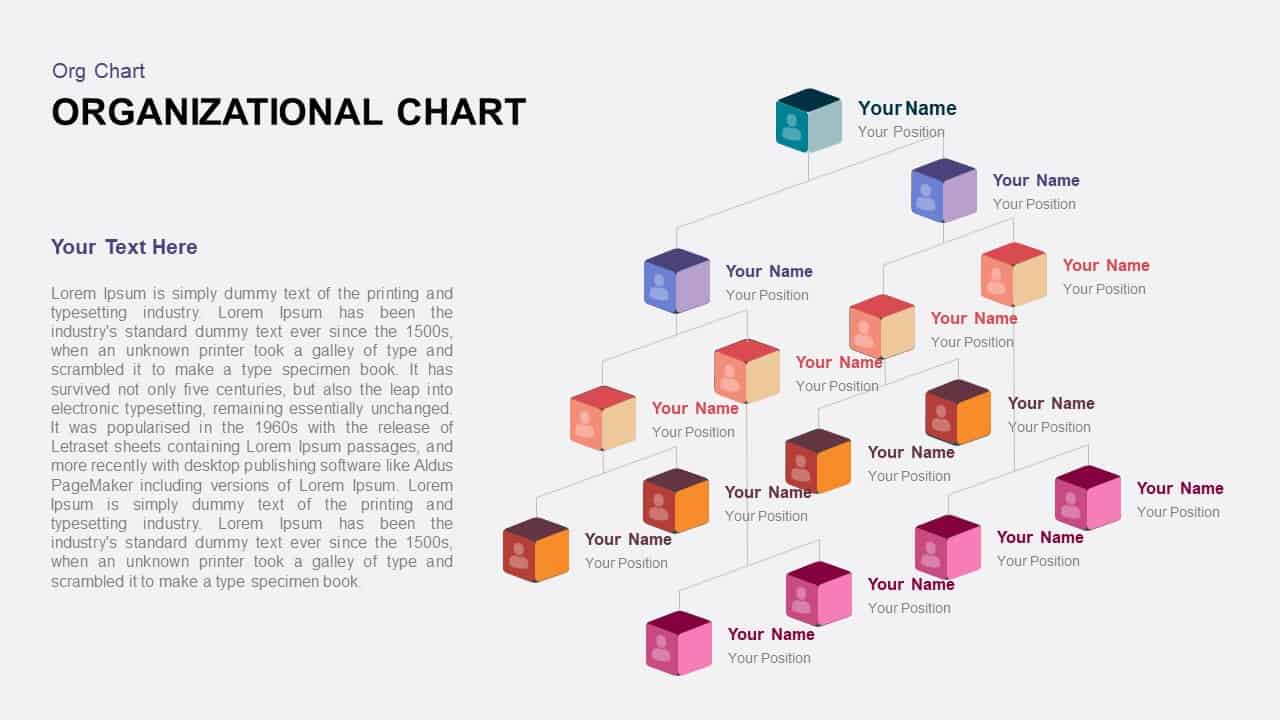
3D Color Block Organizational Chart Slide for PowerPoint & Google Slides
Org Chart
Google Ads Optimization & Performance Infographic Template for PowerPoint & Google Slides
Digital Marketing
SQ3R Study Strategy Infographic Slides Template for PowerPoint & Google Slides
Business Strategy
Six Double Diamond Infographic Slides Template for PowerPoint & Google Slides
Process

Sales Process Infographic Slides Pack Template for PowerPoint & Google Slides
Process
Casino/Poker Chips Infographic Slides template for PowerPoint & Google Slides
Business Strategy
Agenda Infographic Pack of 2 Slides Template for PowerPoint & Google Slides
Agenda
Quad Chart Infographic Pack of 8 Slides Template for PowerPoint & Google Slides
Comparison Chart
Four Options Infographic Slides Template for PowerPoint & Google Slides
Comparison
Game Plan Infographic Slides Pack Template for PowerPoint & Google Slides
Infographics
Teamwork PowerPoint Infographic Template for PowerPoint & Google Slides
Leadership
Kite Infographic PowerPoint Template for PowerPoint & Google Slides
Process
Cladogram Infographic Di Template for PowerPoint & Google Slides Template
Decision Tree
Workflow PowerPoint Process infographic for PowerPoint & Google Slides
Process
Free Infographic Deck PowerPoint Pack for PowerPoint & Google Slides
Infographics
Free
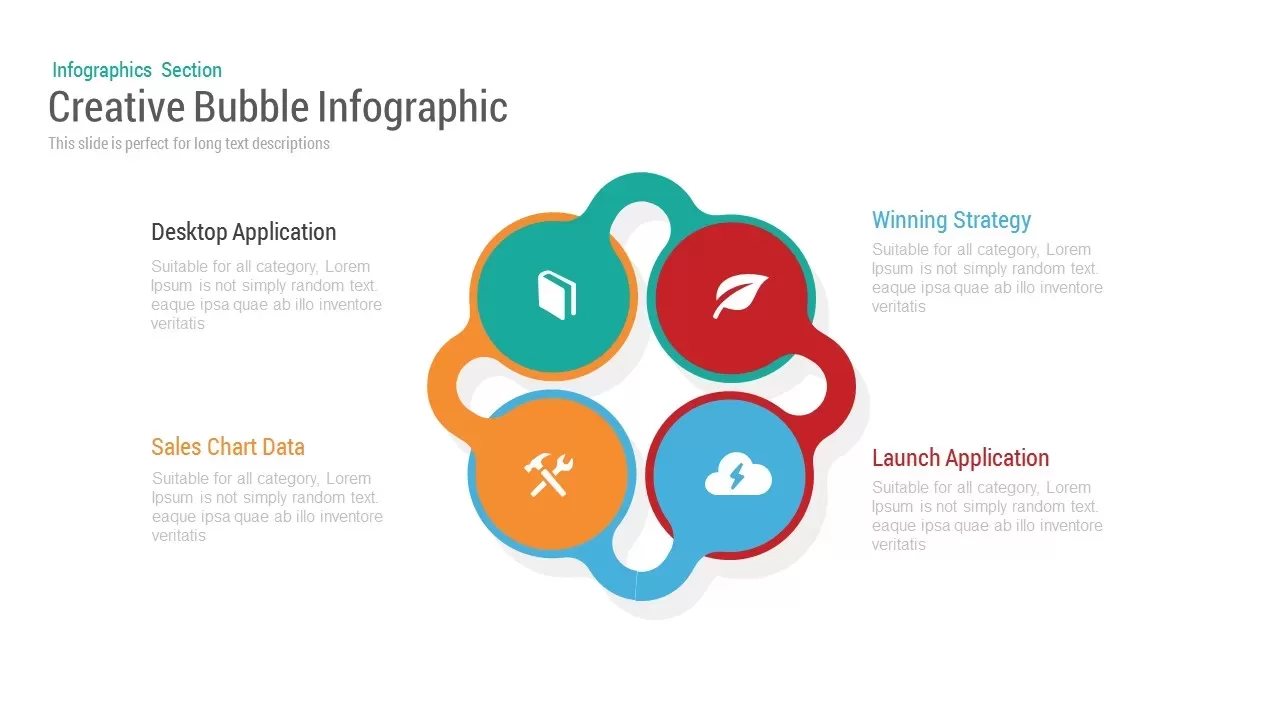
Bubble Infographic template for PowerPoint & Google Slides
Circular
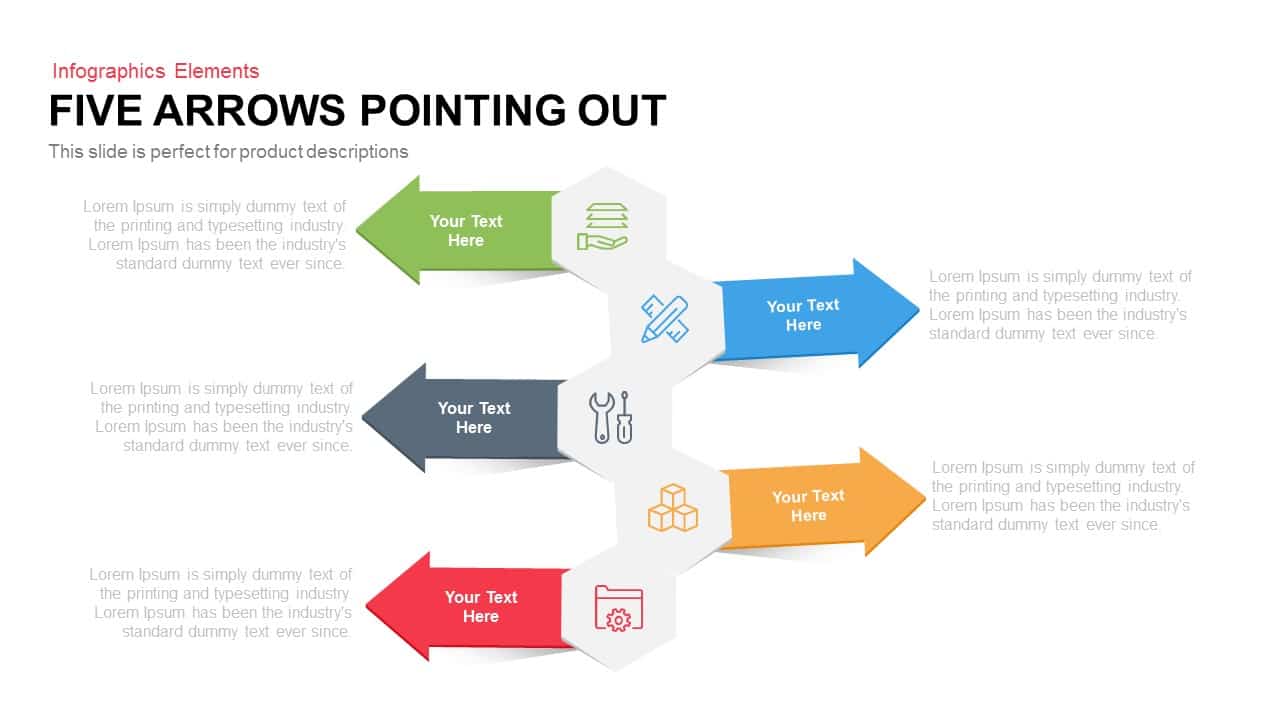
Five Arrows Pointing Out Infographic Template for PowerPoint & Google Slides
Arrow
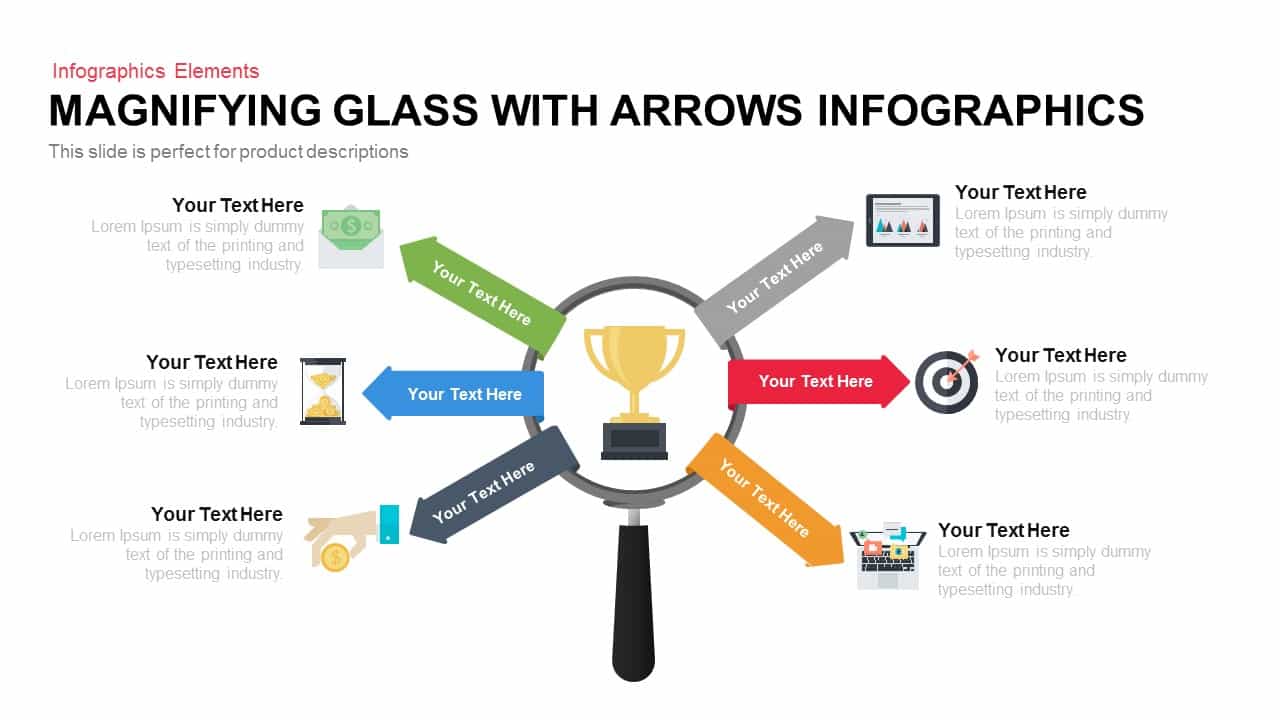
Magnifying Glass Arrows Infographic Template for PowerPoint & Google Slides
Arrow
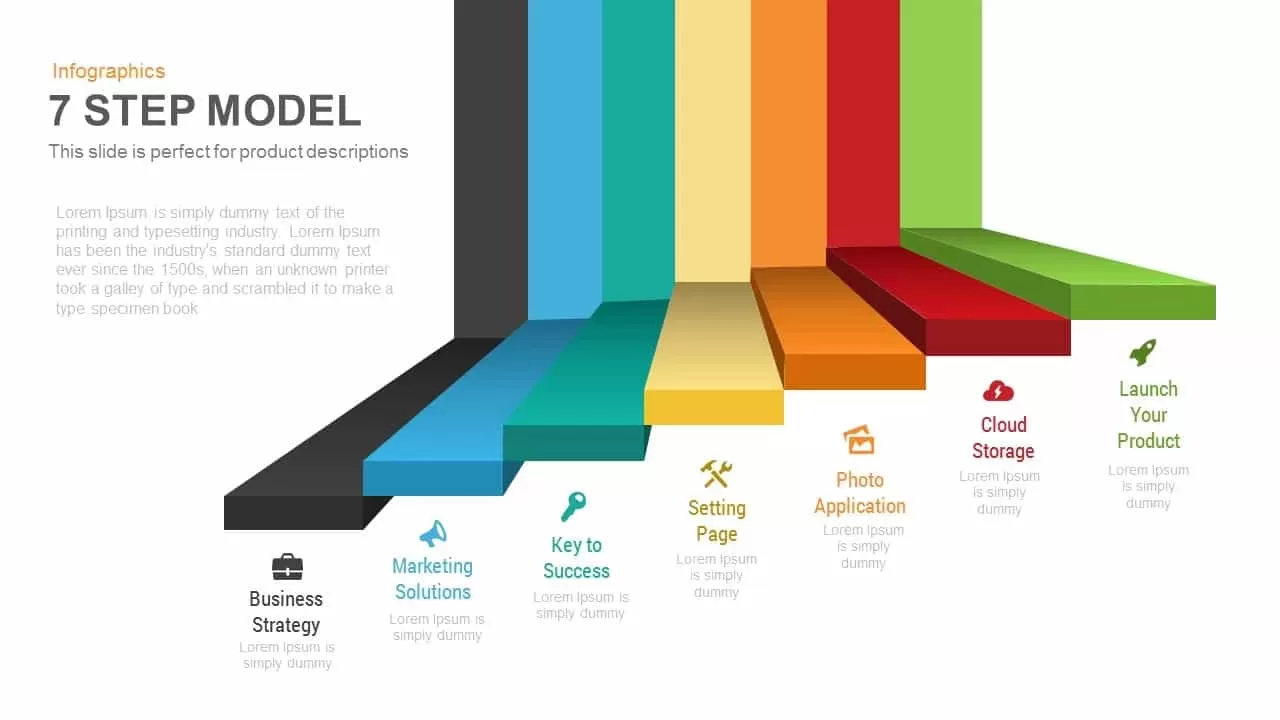
7-Step 3D Process Infographic Model template for PowerPoint & Google Slides
Process
Three Four Five Stage Timeline Infographic Template for PowerPoint & Google Slides
Timeline
Creative Lab Beakers Data Infographic template for PowerPoint & Google Slides
Infographics

Dynamic Data Dashboard Infographic Template for PowerPoint & Google Slides
Bar/Column
Five-Stage People Infographic Chart template for PowerPoint & Google Slides
Process
Curved Road Map Timeline Infographic Template for PowerPoint & Google Slides
Roadmap
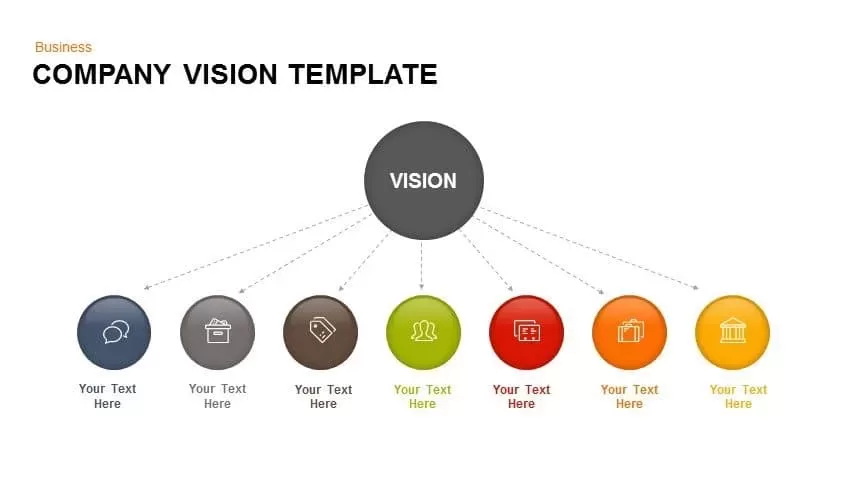
Company Vision Hub and Spoke Infographic Template for PowerPoint & Google Slides
Vision and Mission
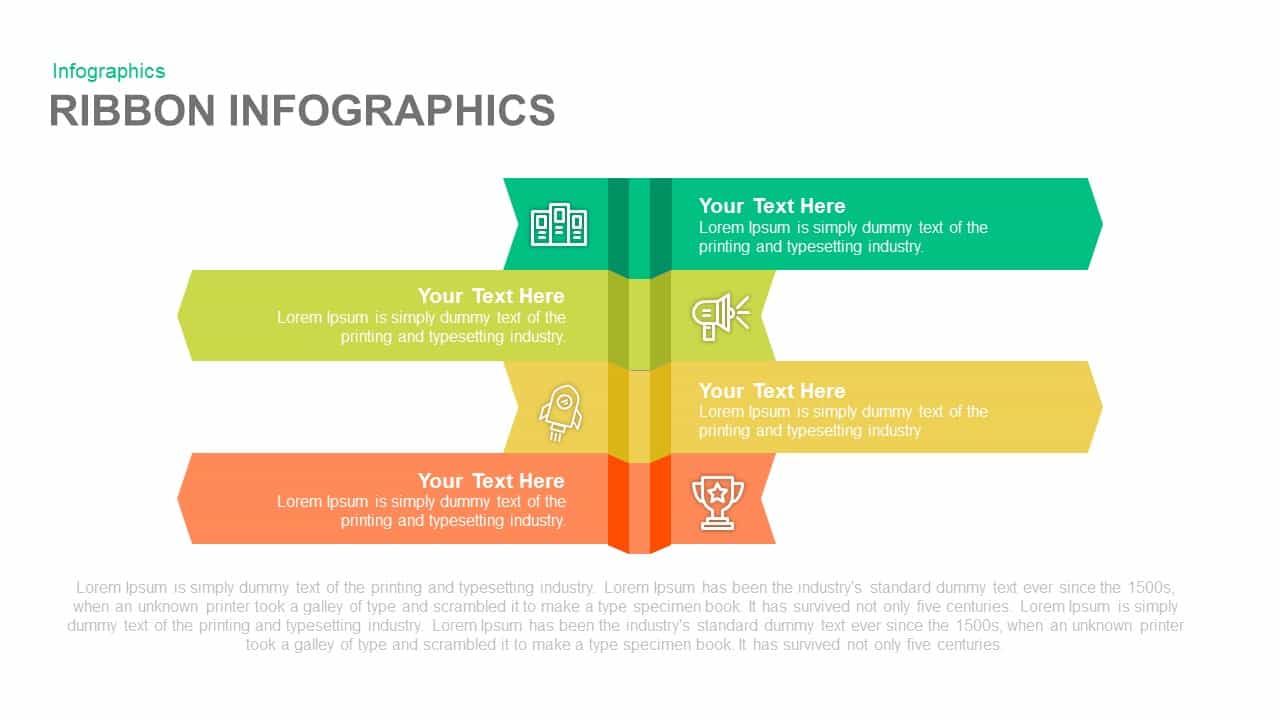
Dual-Side Three-Step Ribbon Infographic Template for PowerPoint & Google Slides
Comparison
Eight-Step Circular Diagram Infographic Template for PowerPoint & Google Slides
Circular
Four-Option 4-Step Arrow Infographic Template for PowerPoint & Google Slides
Arrow
Free Application Mockup Screens Infographic Template for PowerPoint & Google Slides
Comparison
Free
Social Media Mind Network Infographic Template for PowerPoint & Google Slides
Digital Marketing
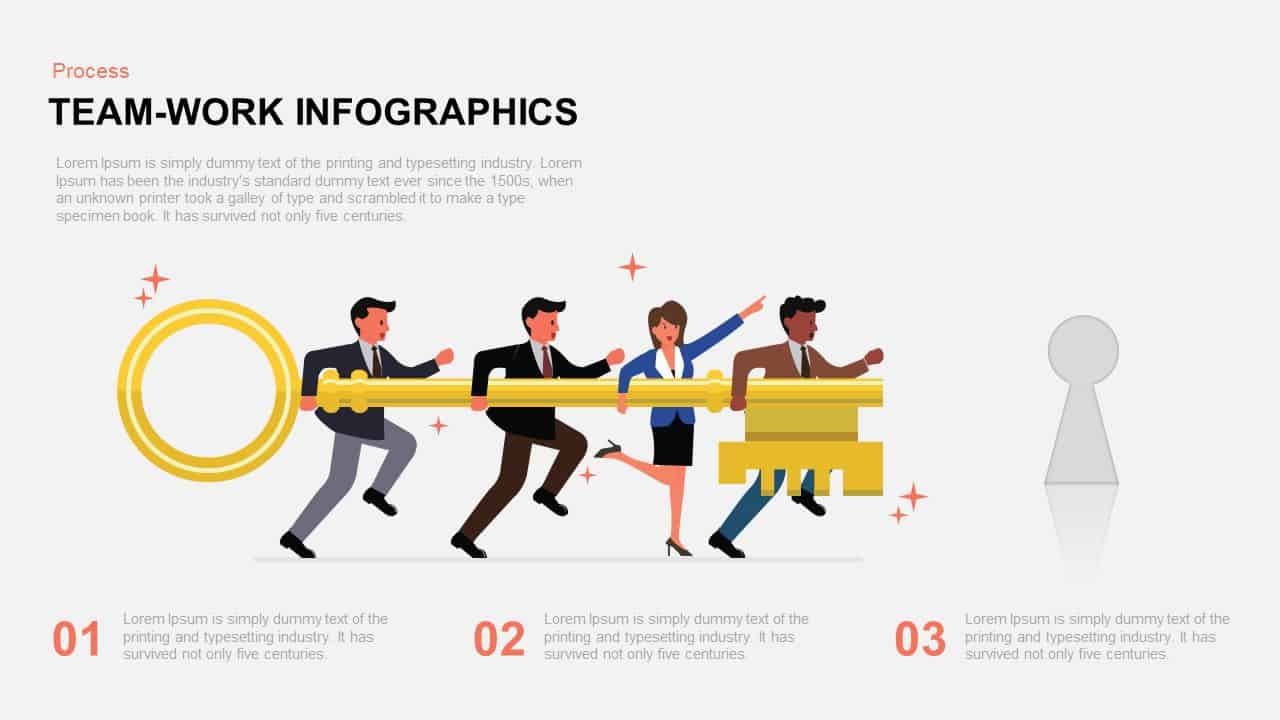
Teamwork Key Infographic Slide Template for PowerPoint & Google Slides
Process
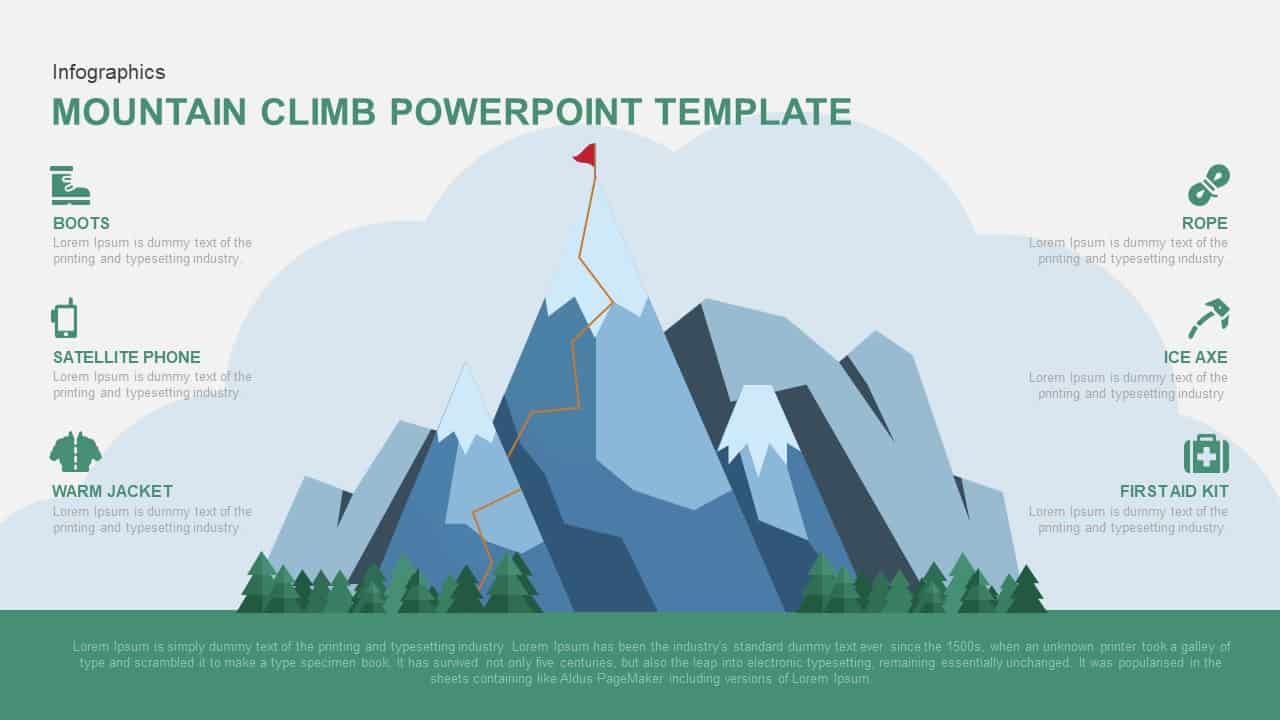
Mountain Climb Adventure Infographic Template for PowerPoint & Google Slides
Accomplishment
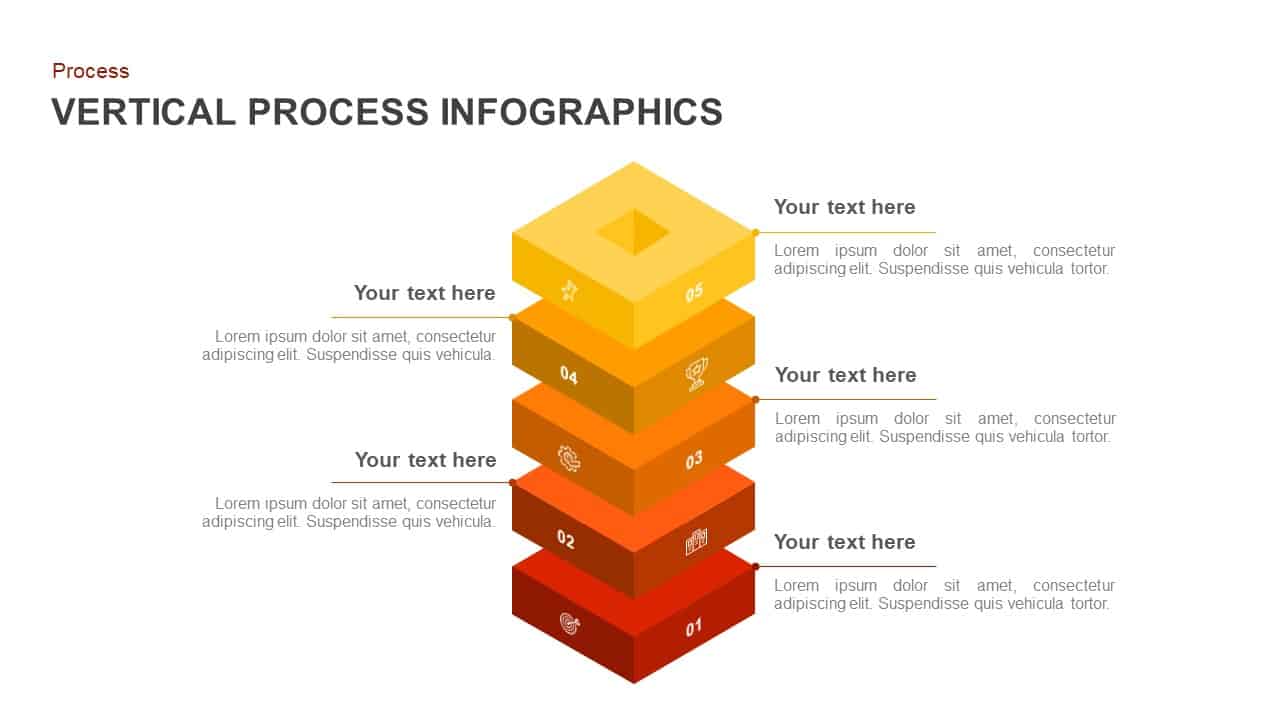
Vertical Stacked Process Infographic Template for PowerPoint & Google Slides
Process
4-Section Agenda Blobs Infographic Template for PowerPoint & Google Slides
Agenda
5 Stage Circular Timeline Infographic Template for PowerPoint & Google Slides
Timeline
Five-Step Growth Infographic Slide Template for PowerPoint & Google Slides
Process
Five Key Flashlight Infographic Points Template for PowerPoint & Google Slides
Agenda
5 Stage Timeline Infographic Slide Template for PowerPoint & Google Slides
Timeline

Team Achievements Infographic Slide Template for PowerPoint & Google Slides
Accomplishment
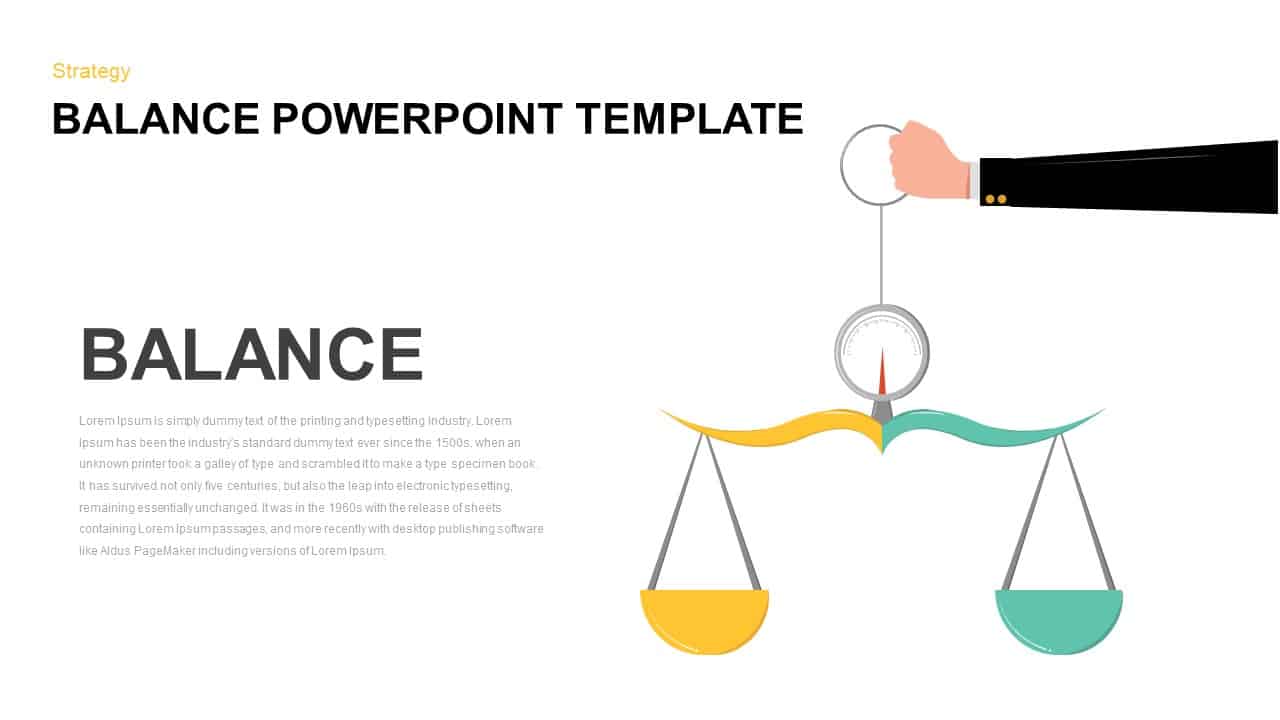
Balance Scale Visualization Infographic Template for PowerPoint & Google Slides
Comparison
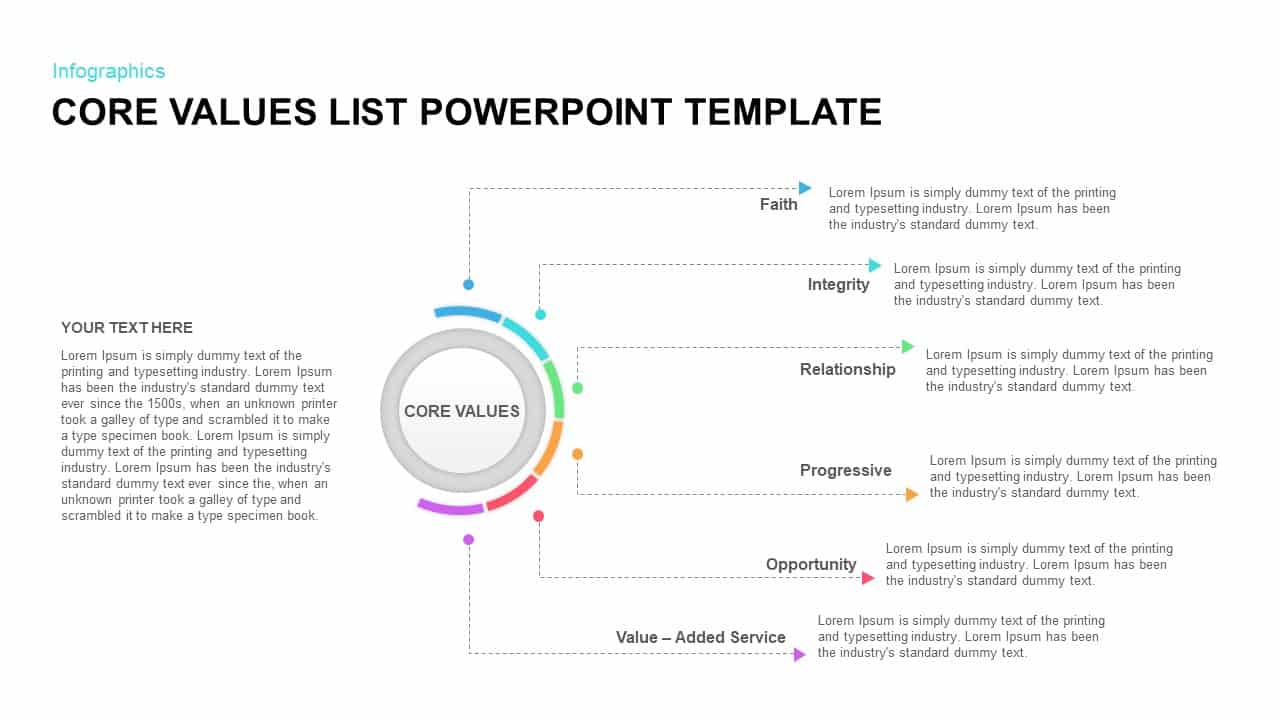
Circular Core Values Infographic List Template for PowerPoint & Google Slides
Circular
Six Sigma 6S Process Infographic Diagram Template for PowerPoint & Google Slides
Process
Fishbone Cause and Effect Infographic Template for PowerPoint & Google Slides
Infographics
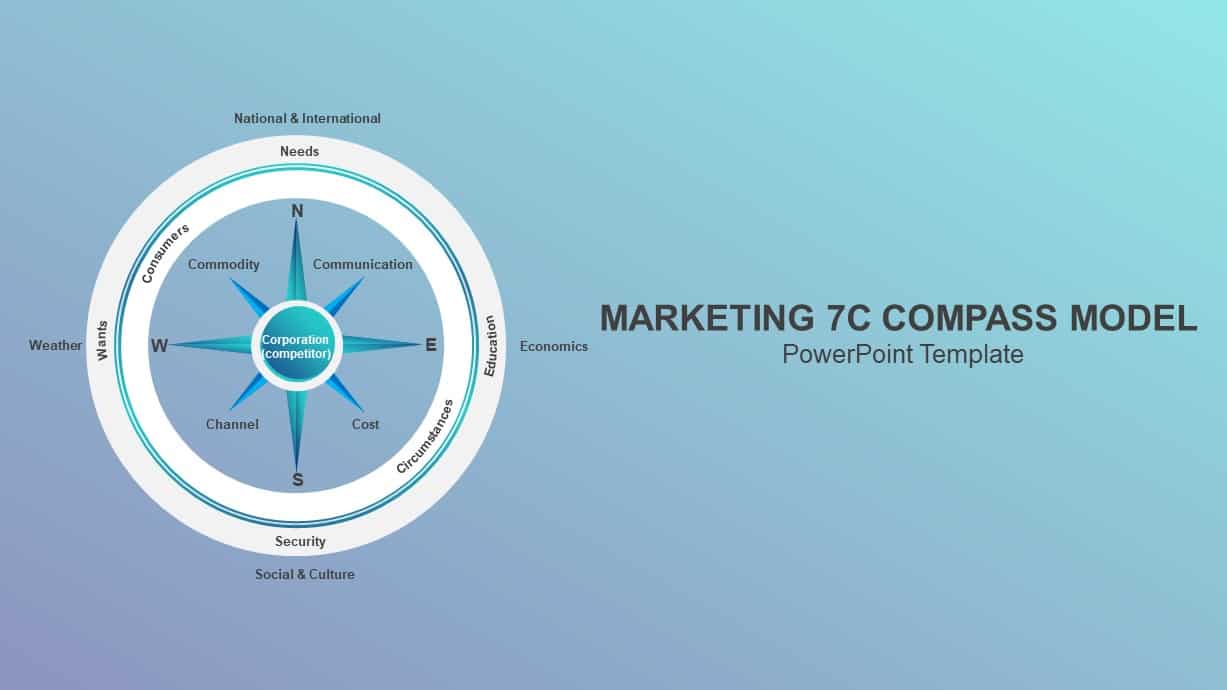
Marketing 7C Compass Model Infographic Template for PowerPoint & Google Slides
Circular
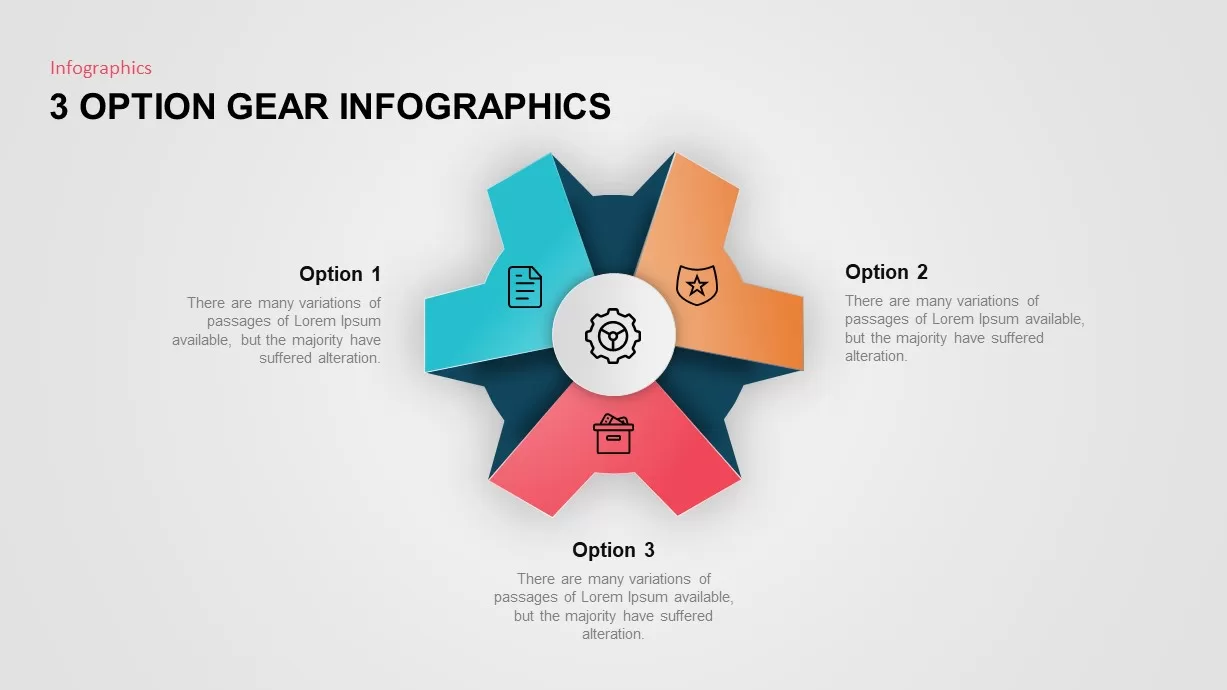
Three-Option Gear Infographic Pro Template for PowerPoint & Google Slides
Process
Eight-Node Mind Map Infographic Diagram Template for PowerPoint & Google Slides
Mind Maps
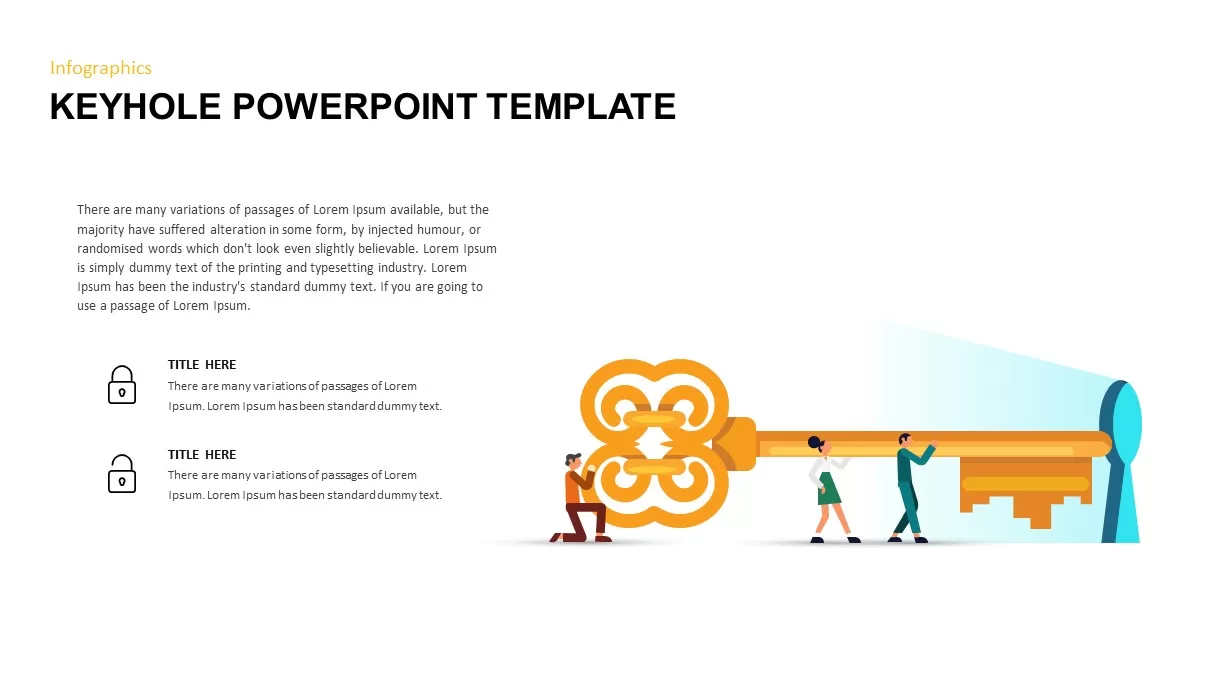
Keyhole Infographic Process Diagram Template for PowerPoint & Google Slides
Process
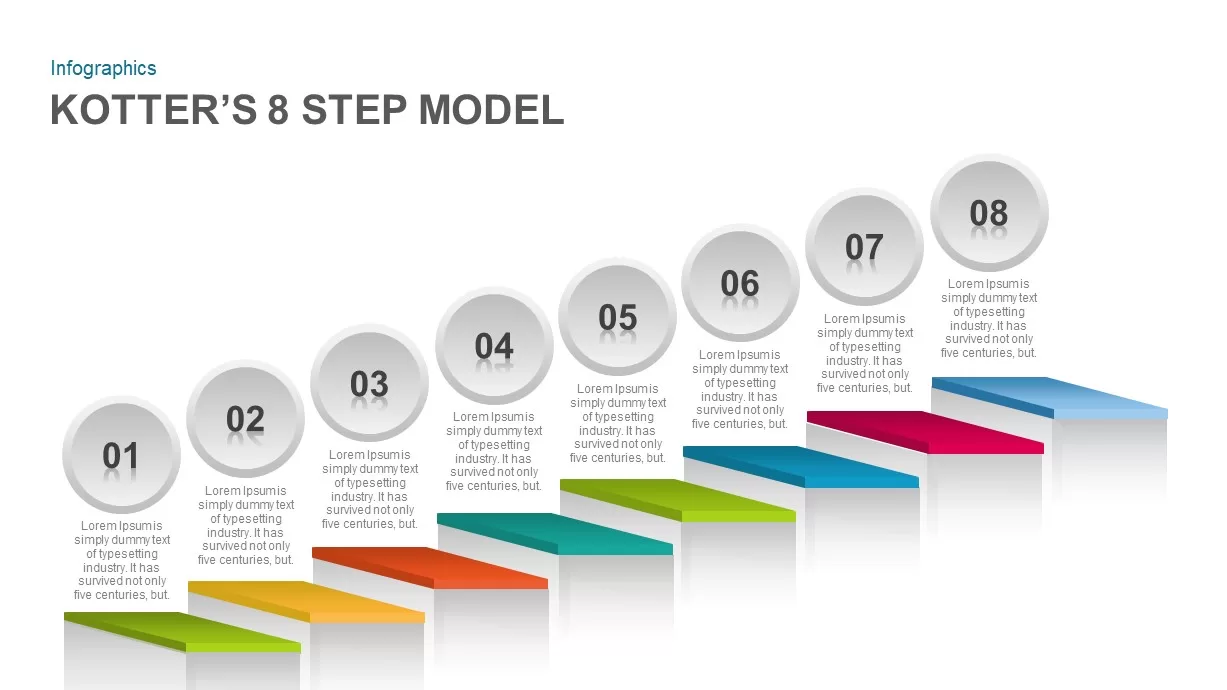
Kotter’s 8-Step Model Infographic Template for PowerPoint & Google Slides
Process
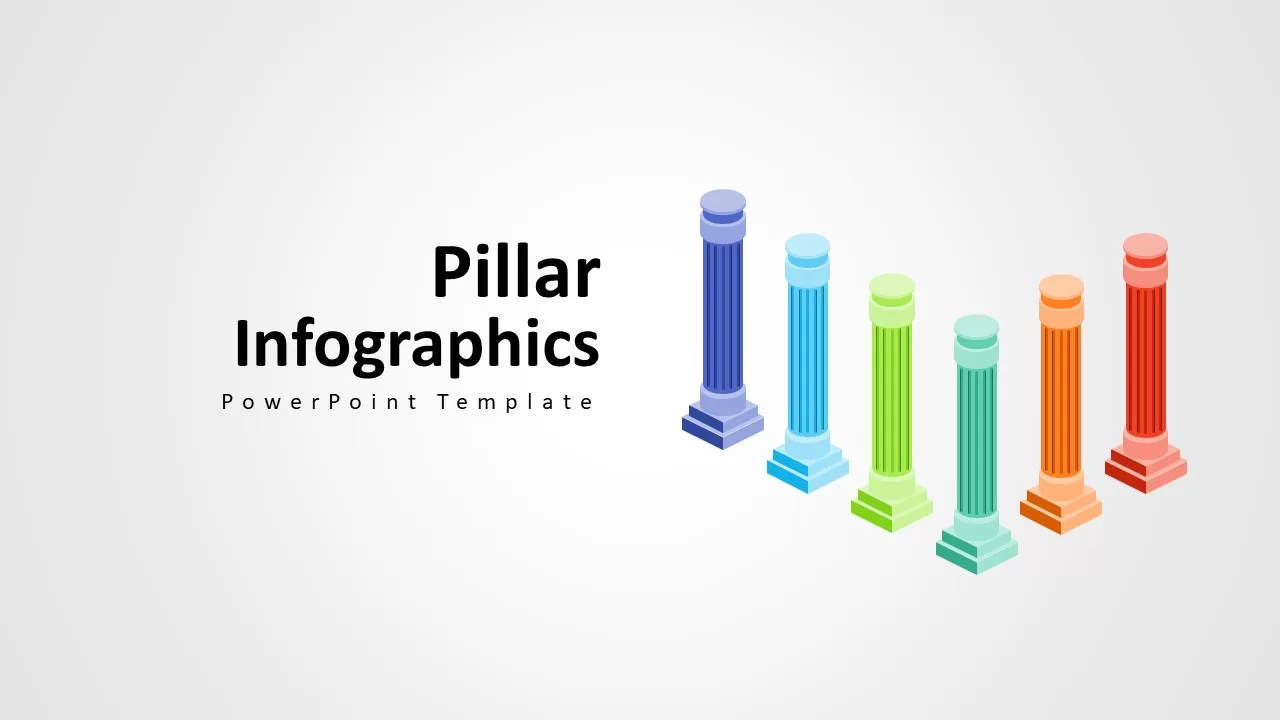
Pillars Infographic Template for PowerPoint & Google Slides
Infographics
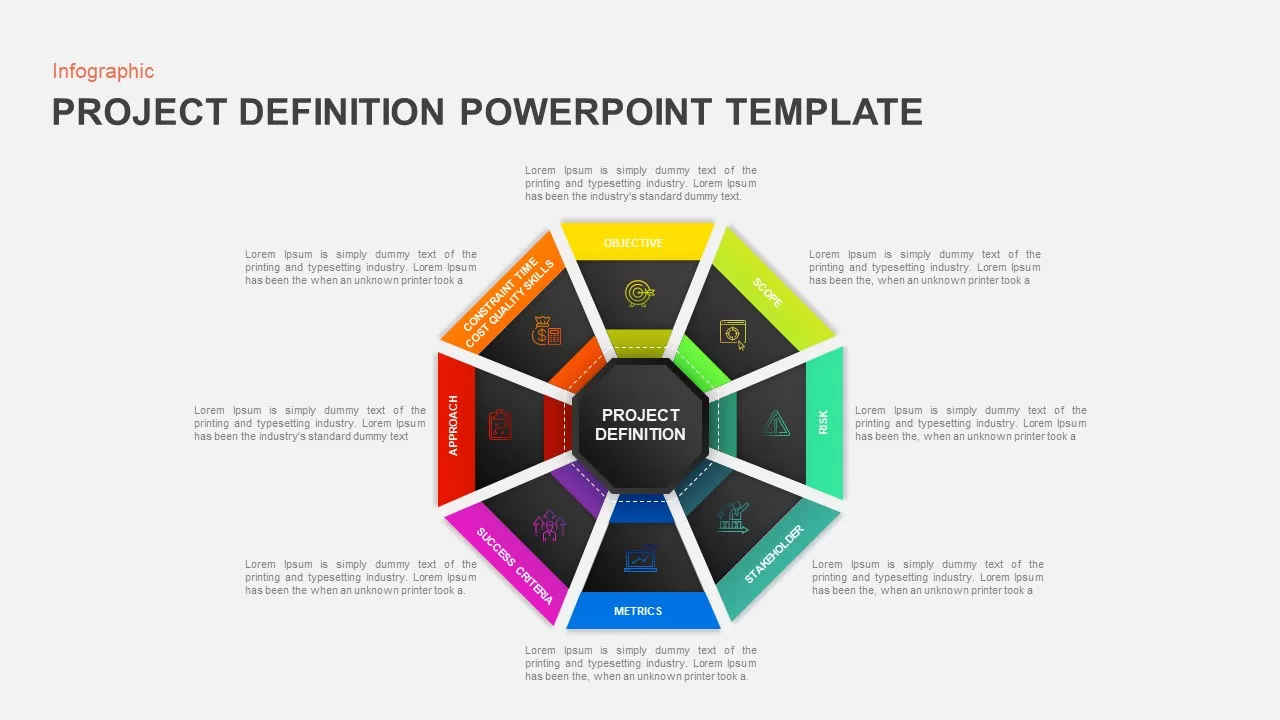
Octagonal Project Definition Infographic Template for PowerPoint & Google Slides
Process
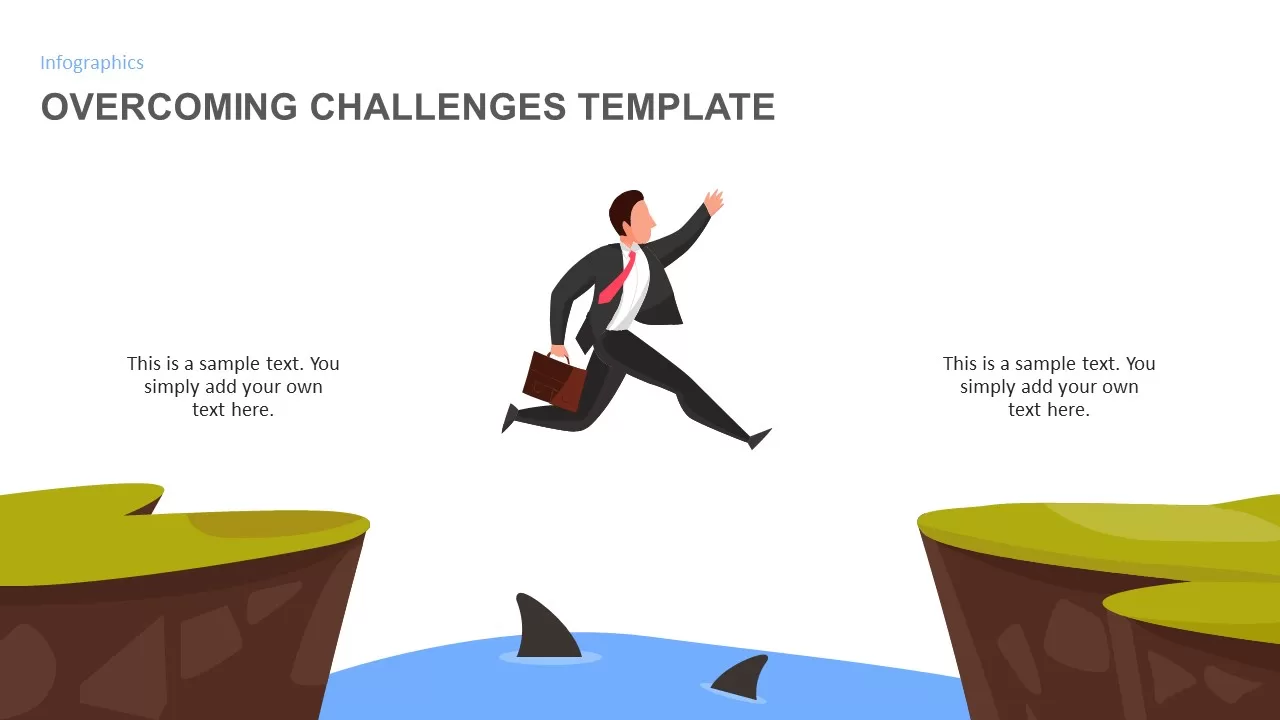
Overcoming Challenges Infographic Pack Template for PowerPoint & Google Slides
Opportunities Challenges
Affinity Diagram Infographic Template for PowerPoint & Google Slides
Business
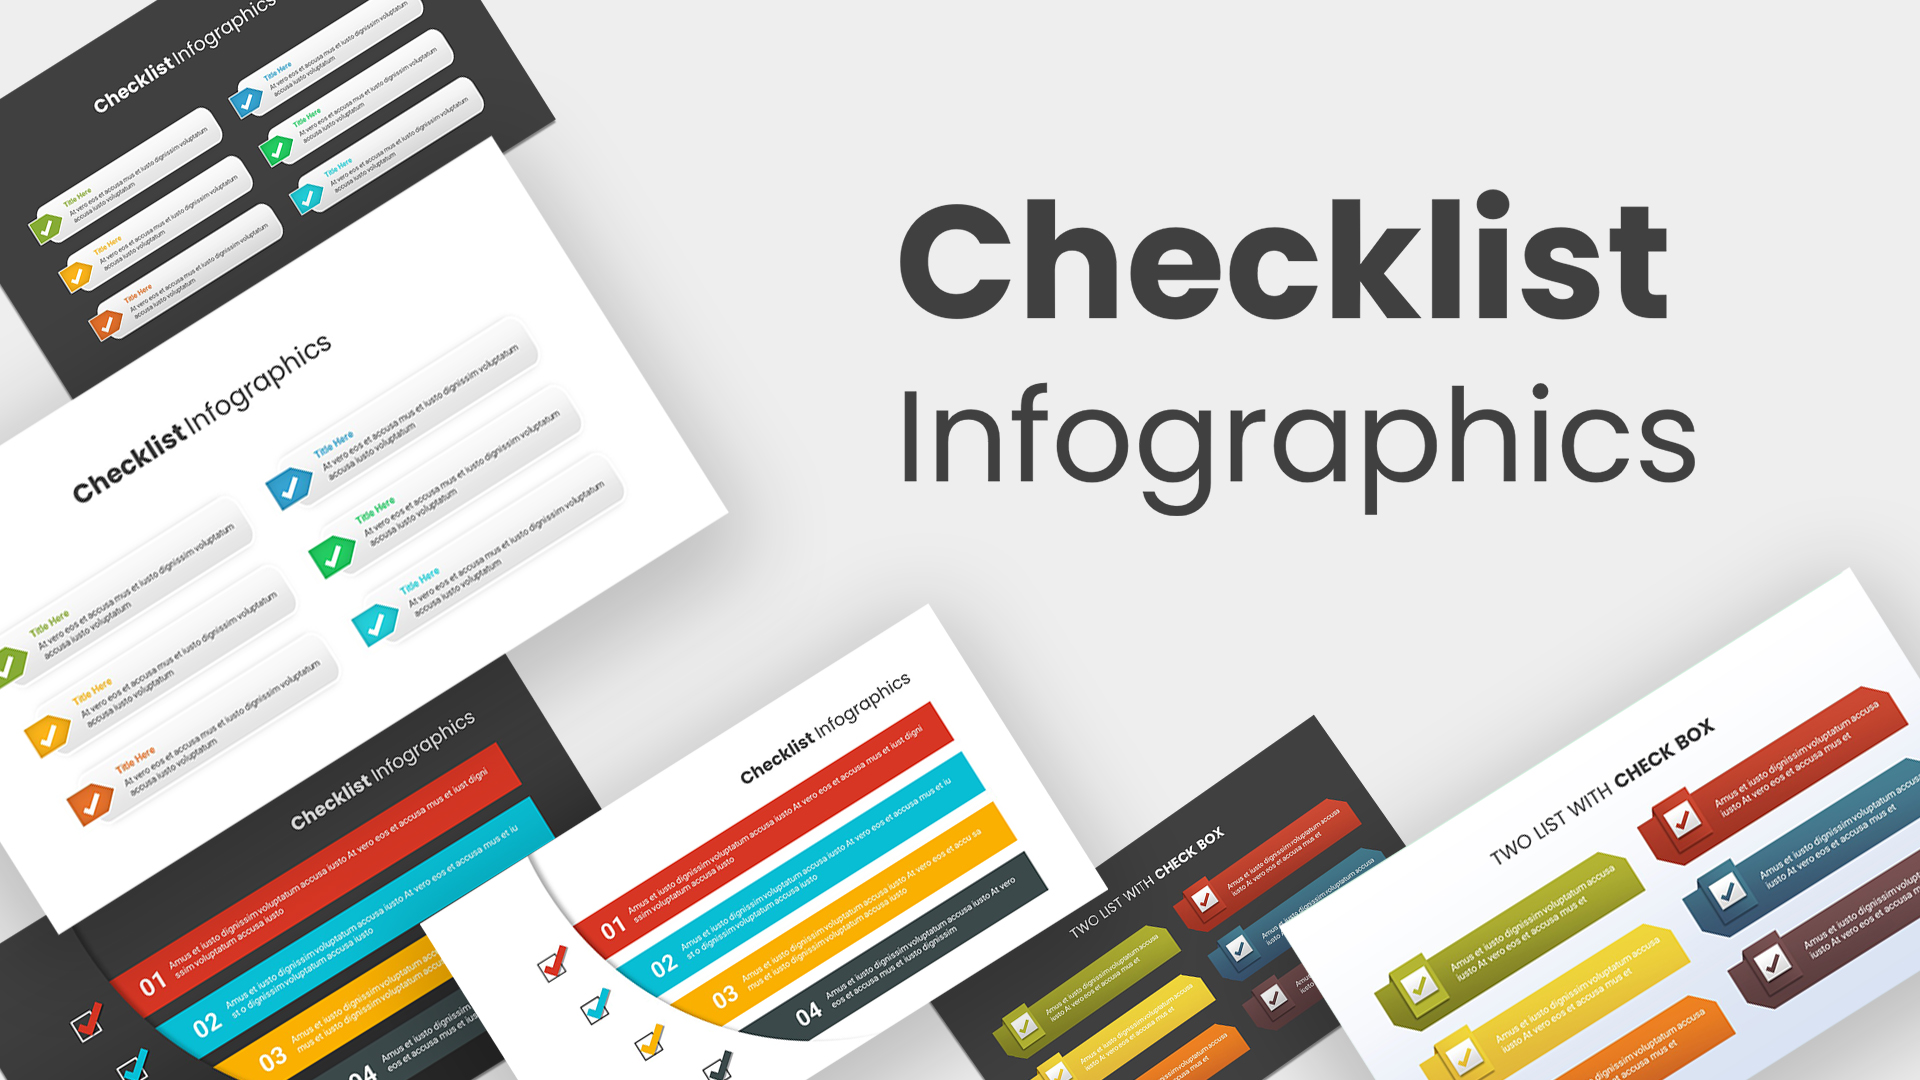
Checklist infographic template for PowerPoint & Google Slides
Infographics
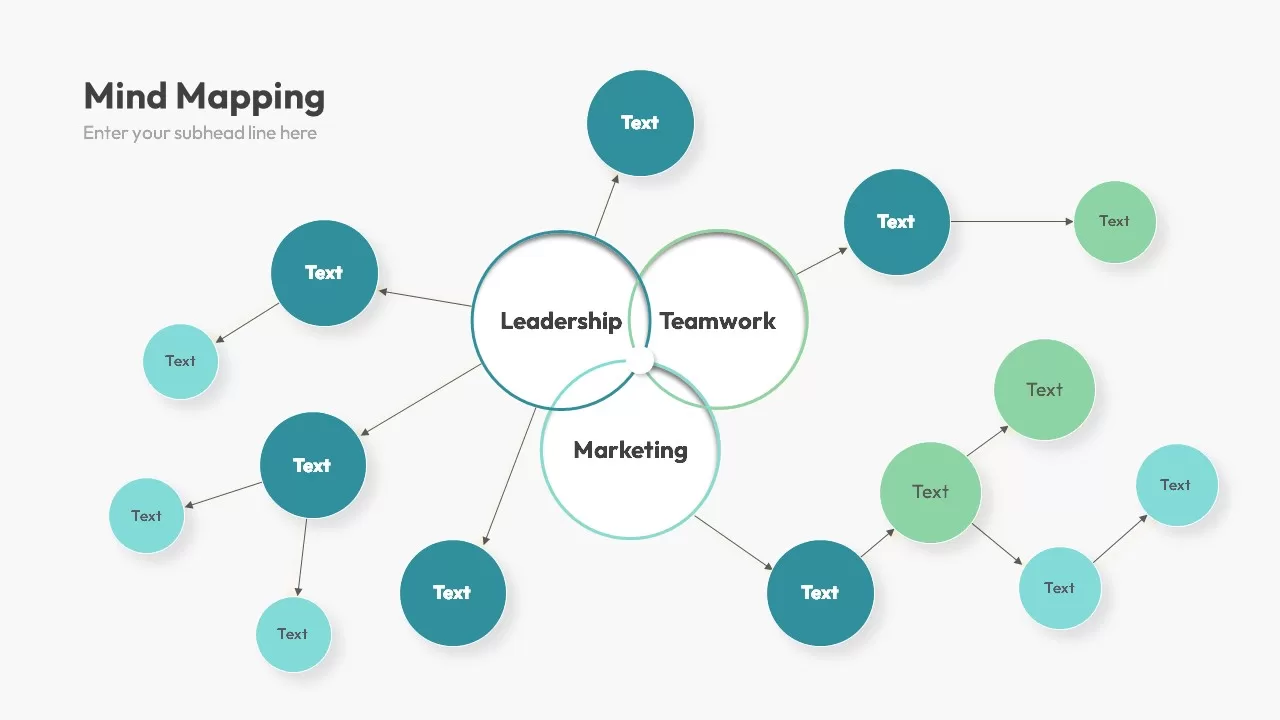
Tri-Cluster Mind Map Infographic Template for PowerPoint & Google Slides
Mind Maps
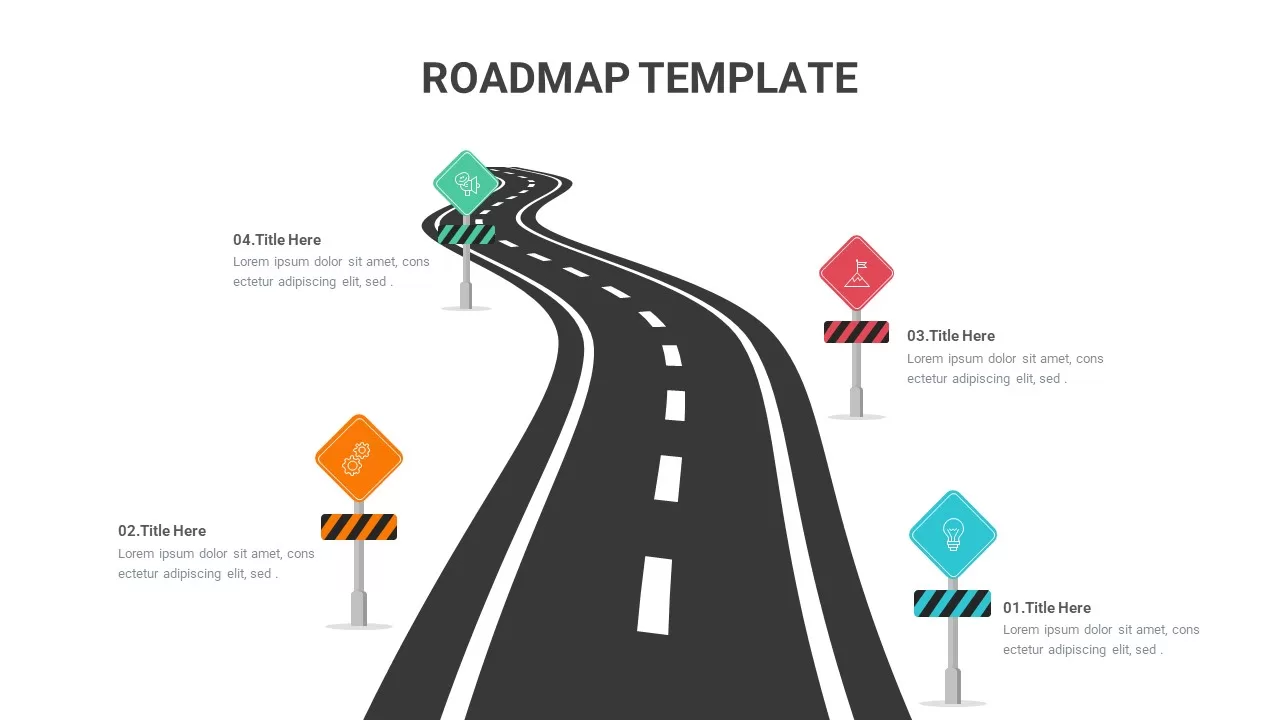
Roadmap Infographic Template for PowerPoint & Google Slides
Roadmap
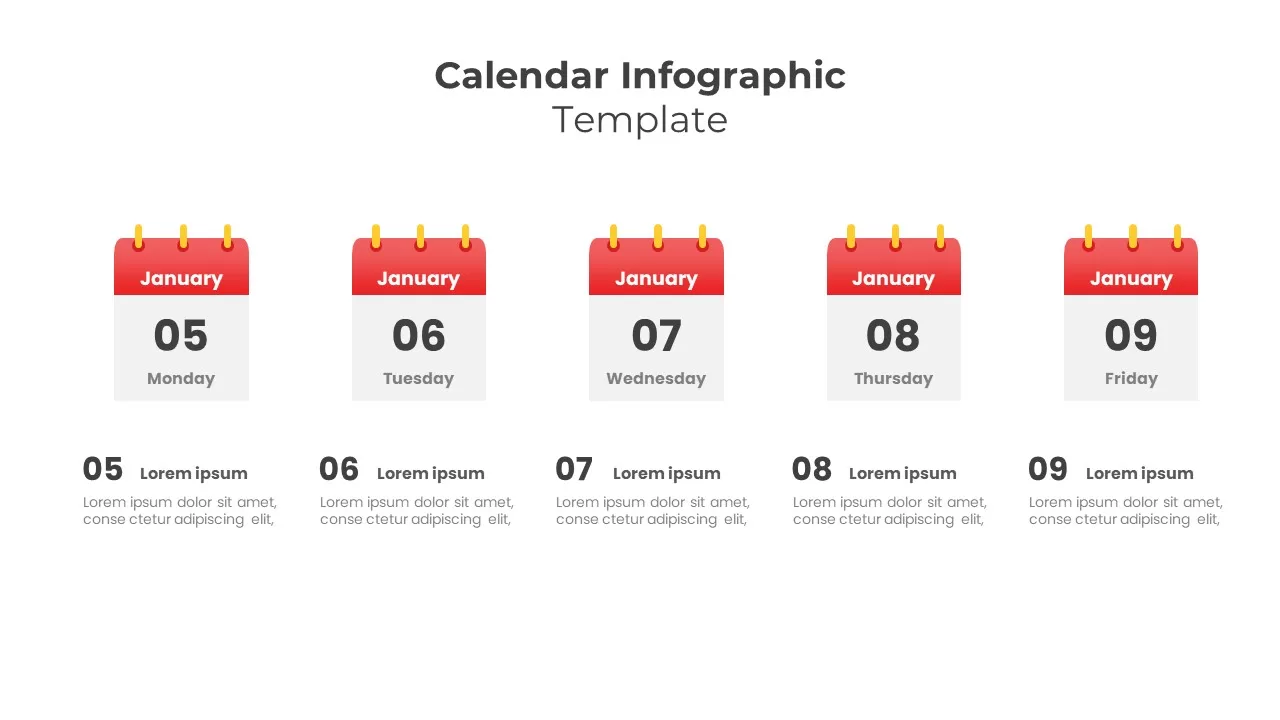
5-Day Calendar Event Infographic Template for PowerPoint & Google Slides
Agenda
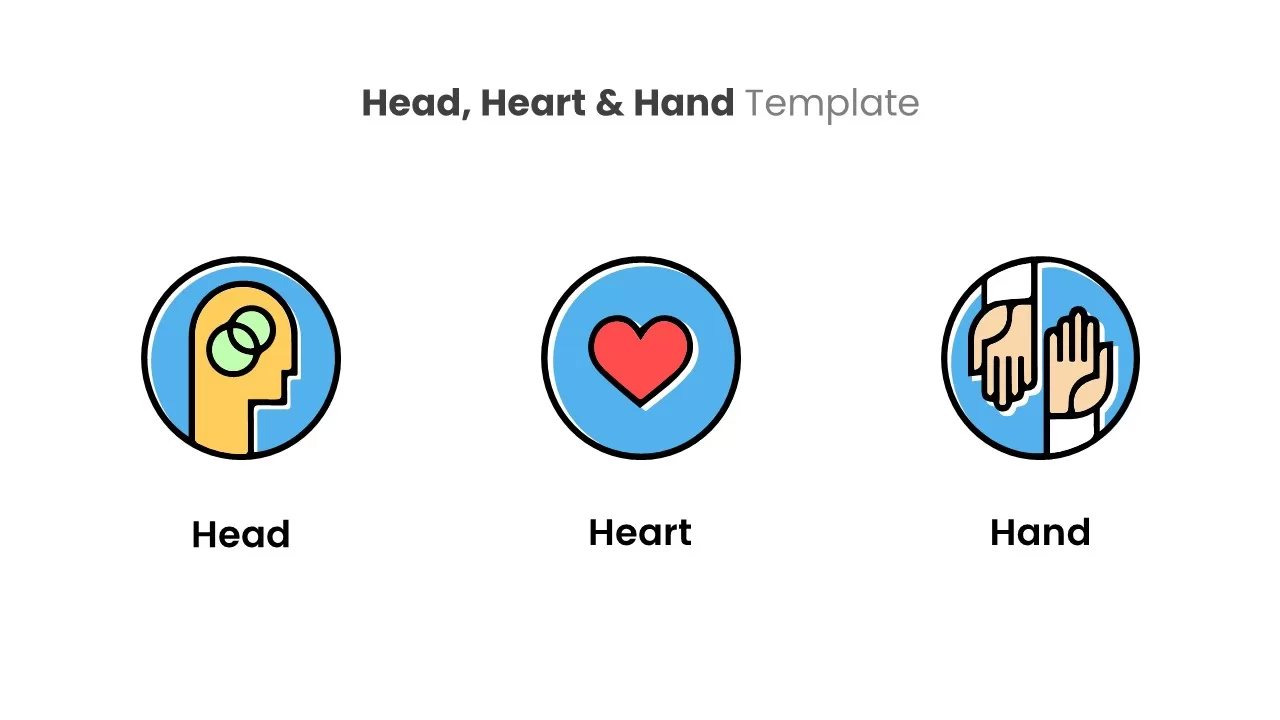
Head, Heart & Hand Infographic Template for PowerPoint & Google Slides
Process
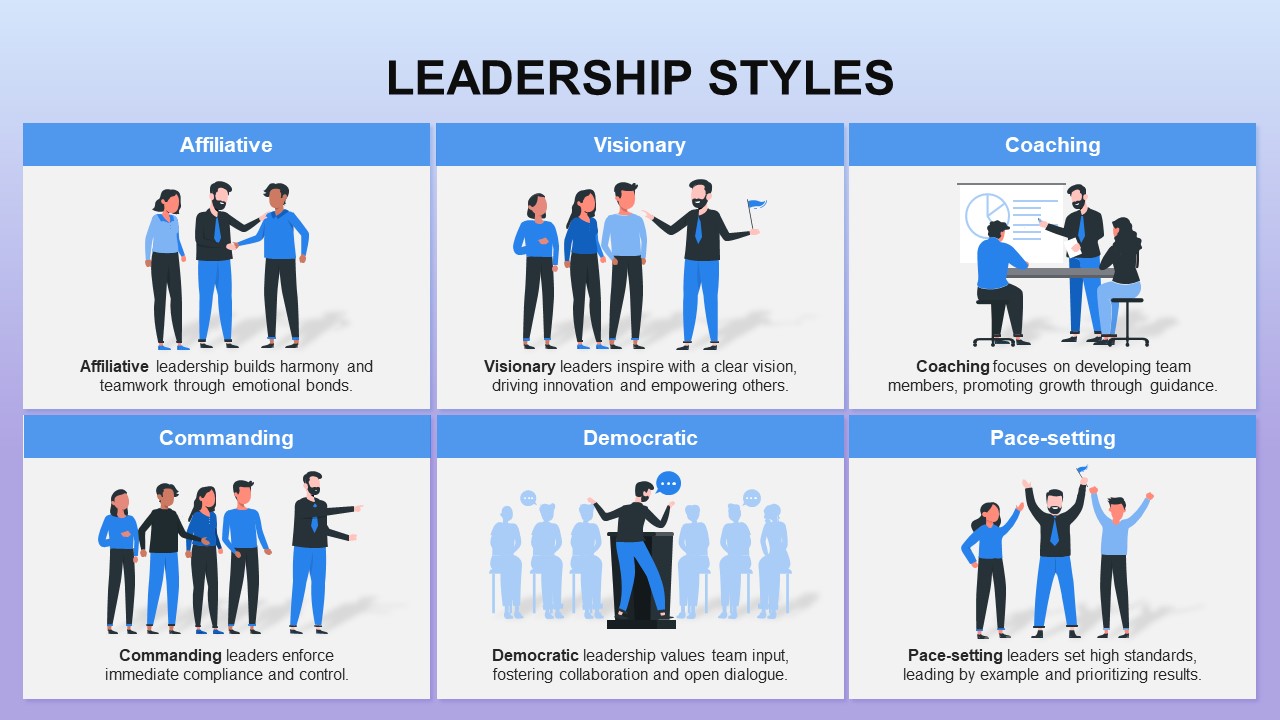
Six Leadership Styles Grid Infographic Template for PowerPoint & Google Slides
Leadership
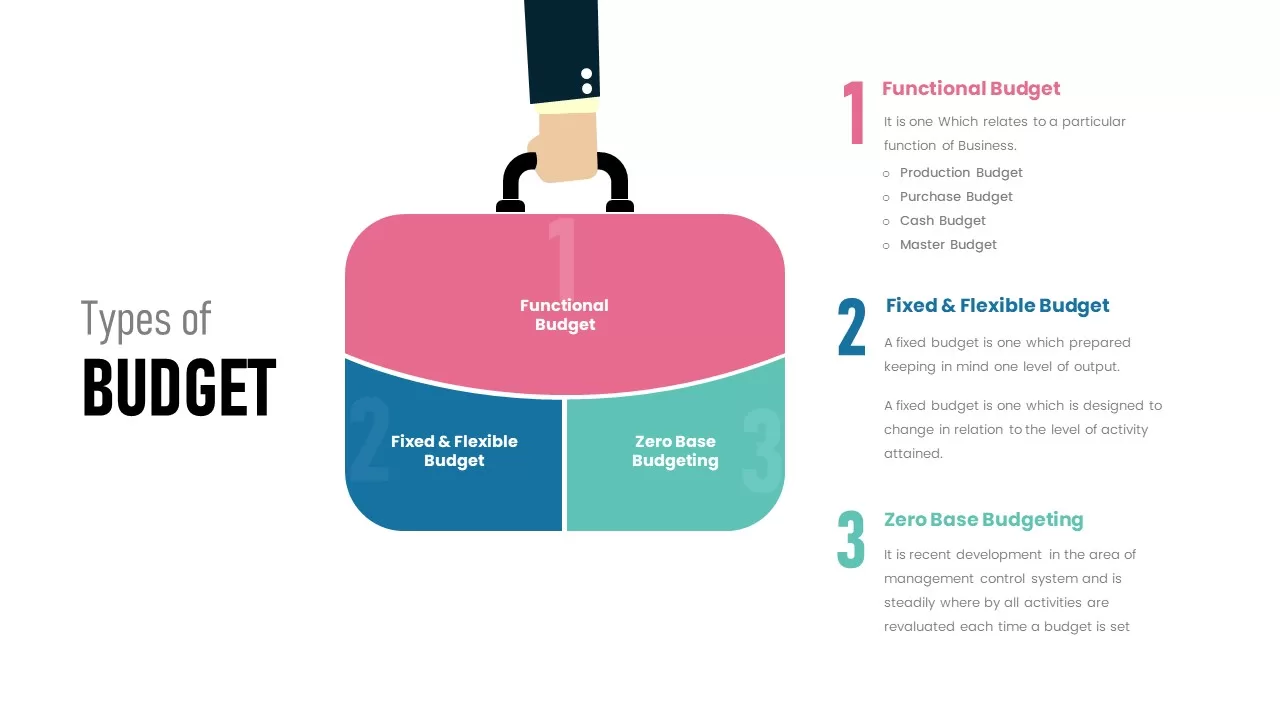
Types of Budget Infographic Pack Template for PowerPoint & Google Slides
Comparison
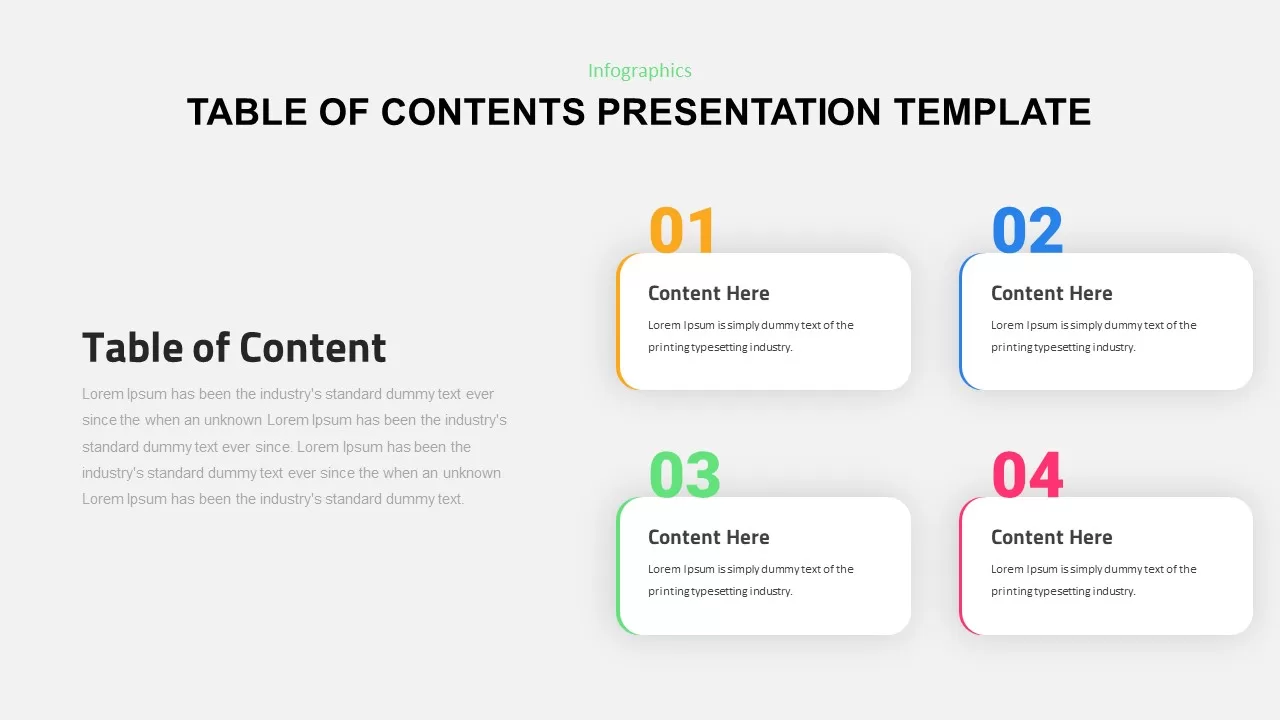
Four-Part Table of Contents Infographic Template for PowerPoint & Google Slides
Agenda
Four-Stage Circle Arrow Infographic Template for PowerPoint & Google Slides
Circular
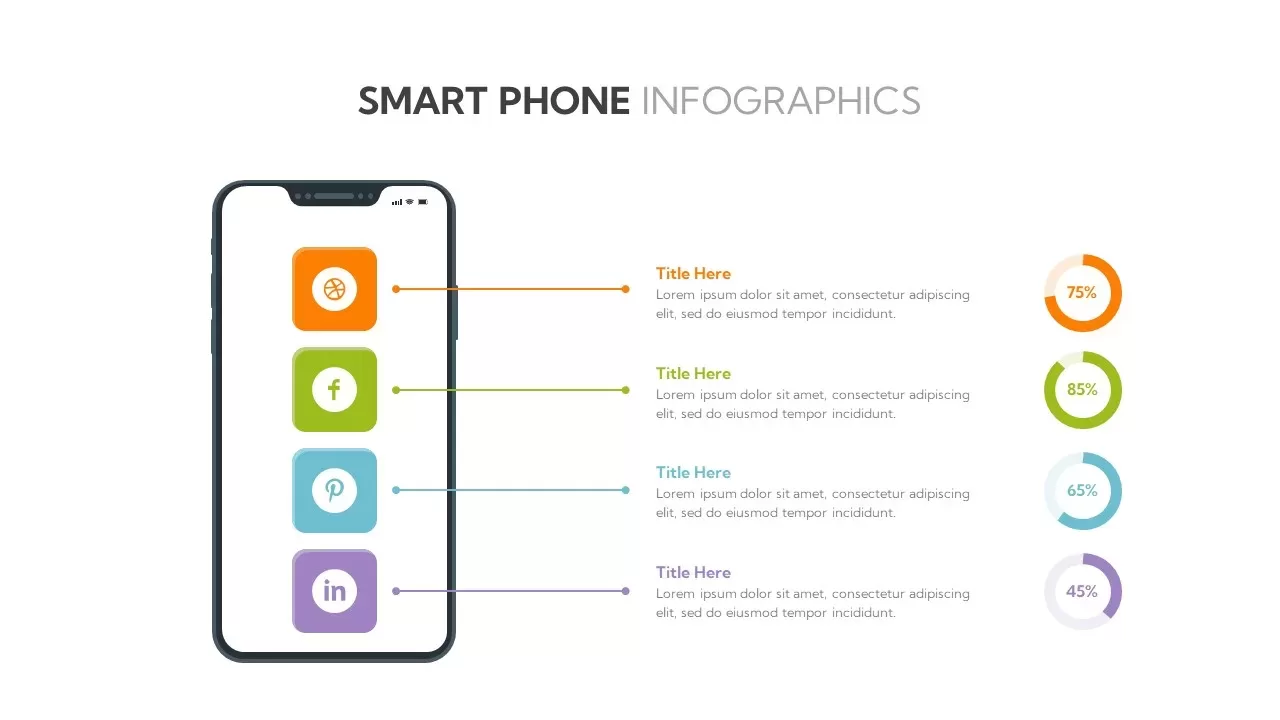
Social Media Smartphone Infographic Template for PowerPoint & Google Slides
Pie/Donut
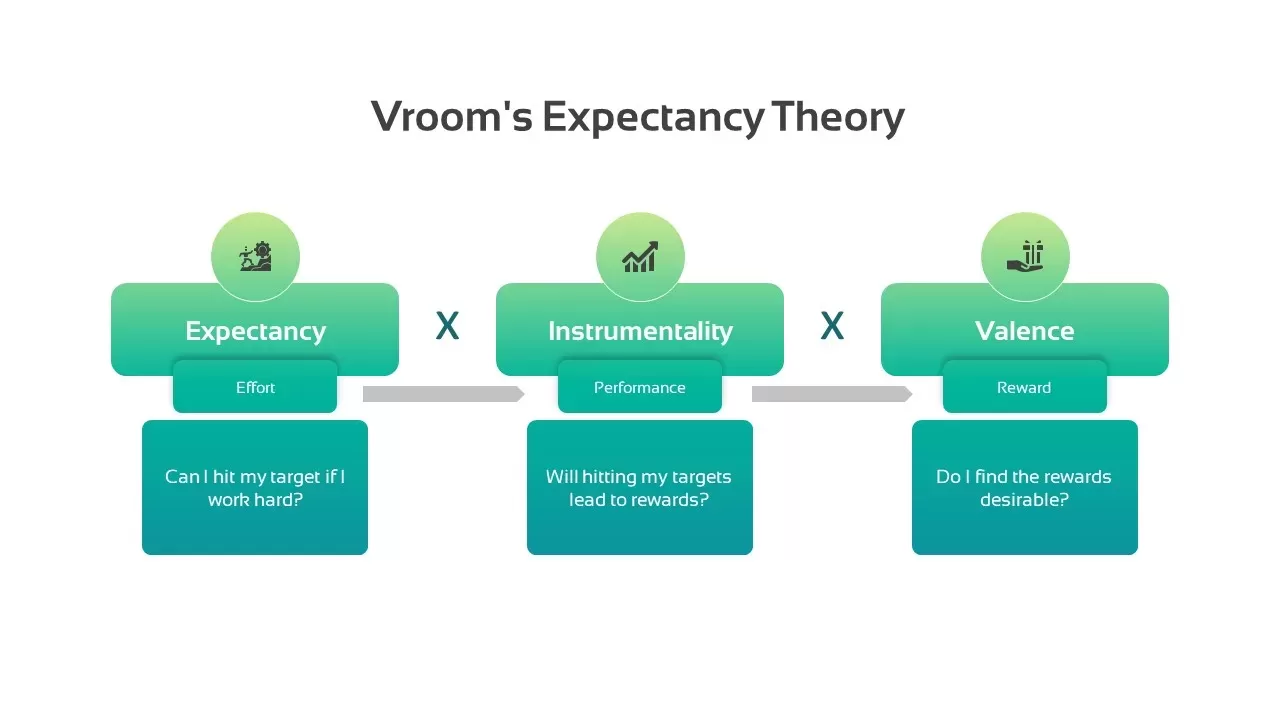
Vroom’s Expectancy Theory Infographic Template for PowerPoint & Google Slides
Process
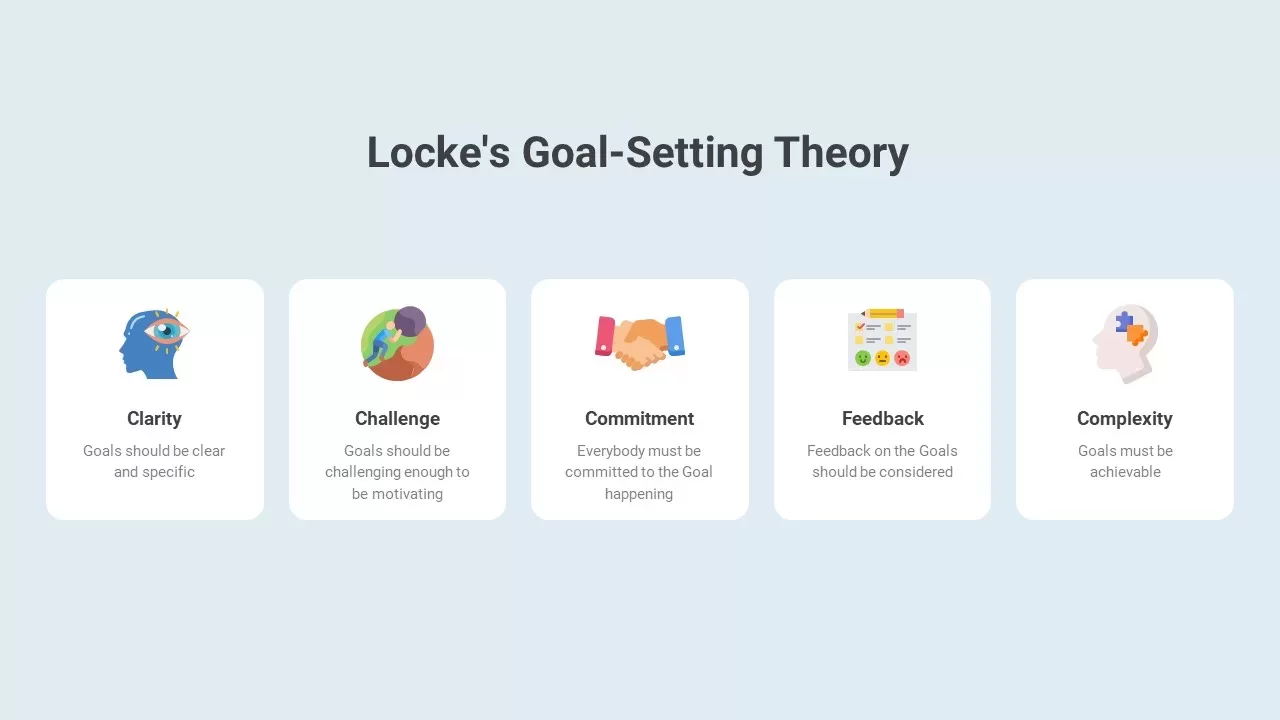
Locke’s Goal-Setting Theory Infographic Template for PowerPoint & Google Slides
Goals
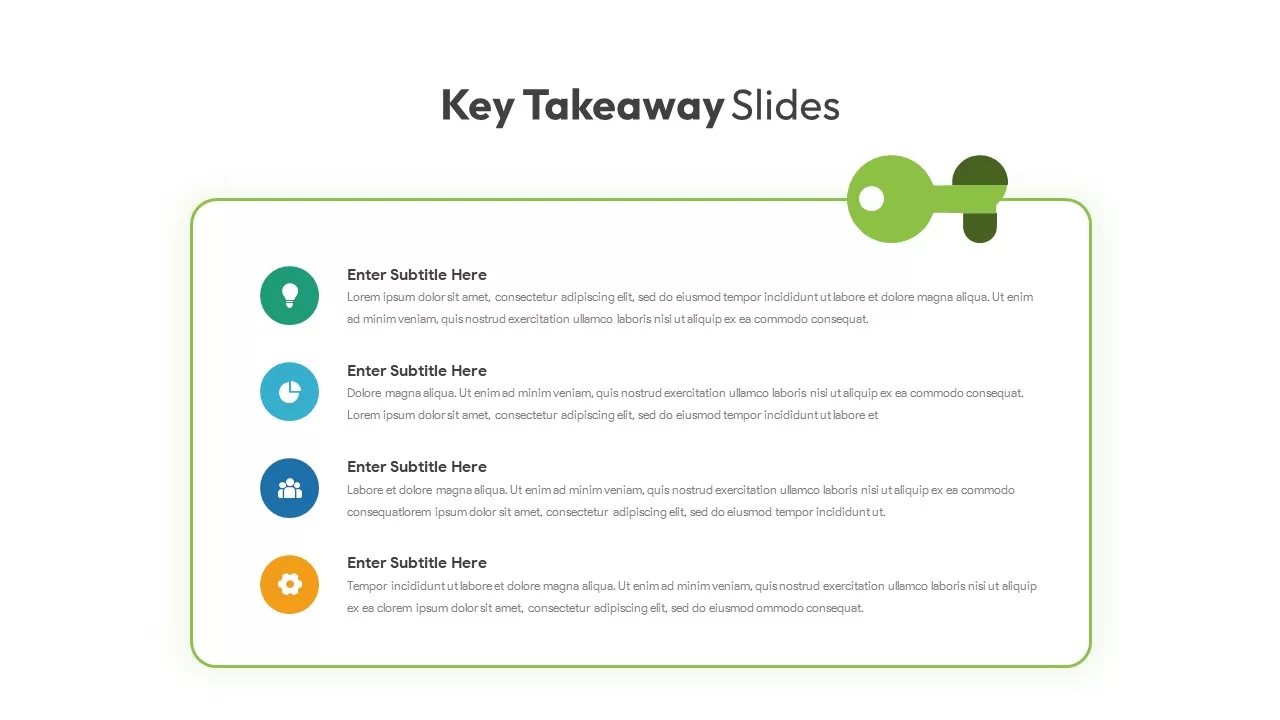
Key Takeaway Keyhole Infographic Slide Template for PowerPoint & Google Slides
Process
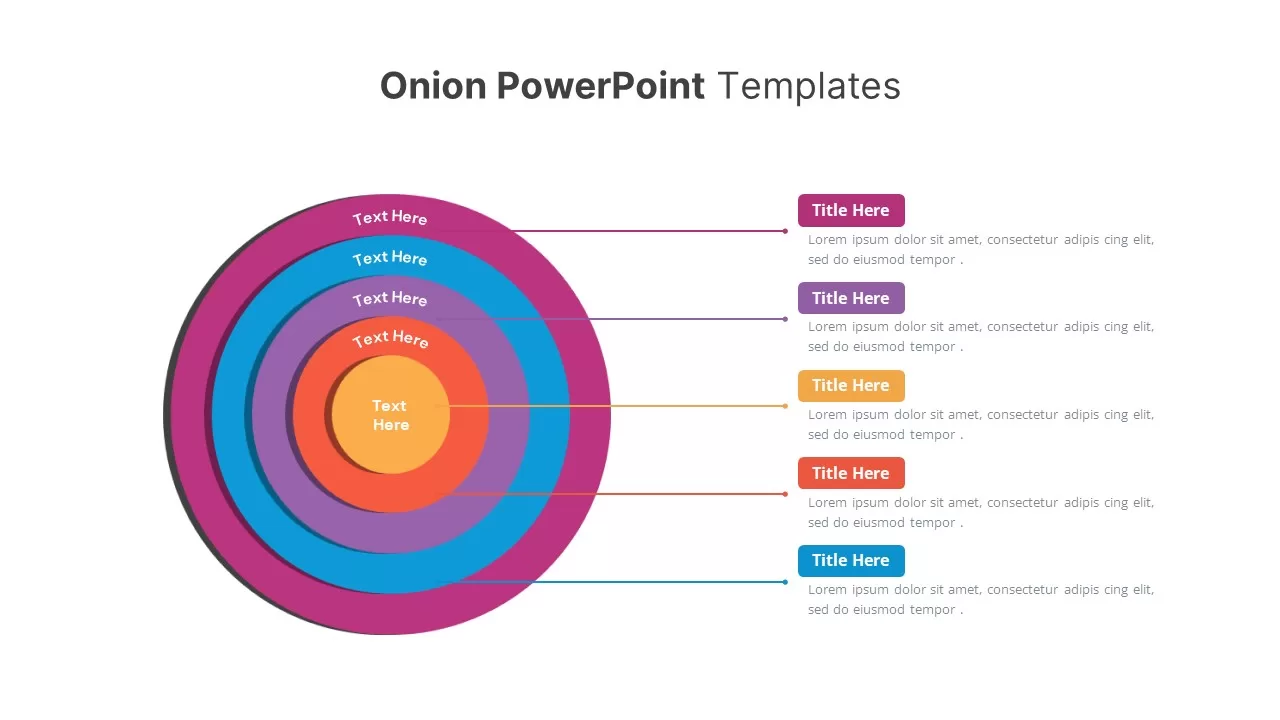
Onion Layer Infographic Diagram Template for PowerPoint & Google Slides
Process
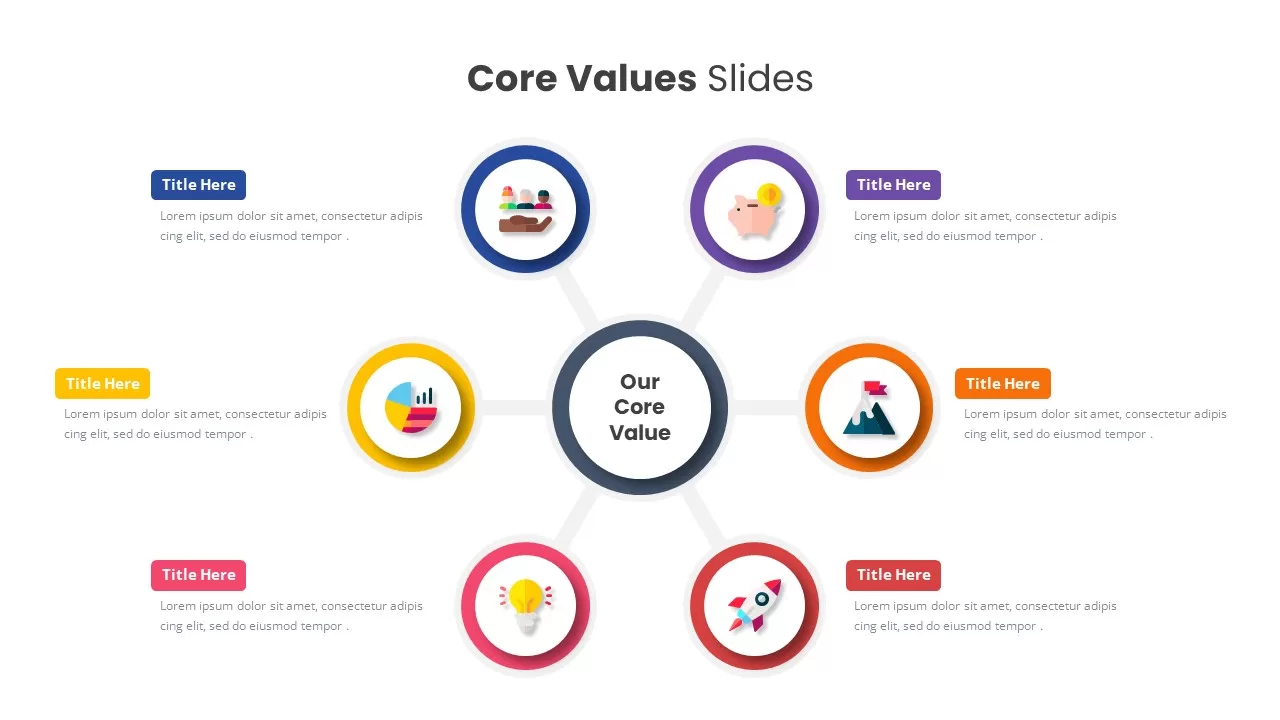
Core Values Infographic Diagram Template for PowerPoint & Google Slides
Circular
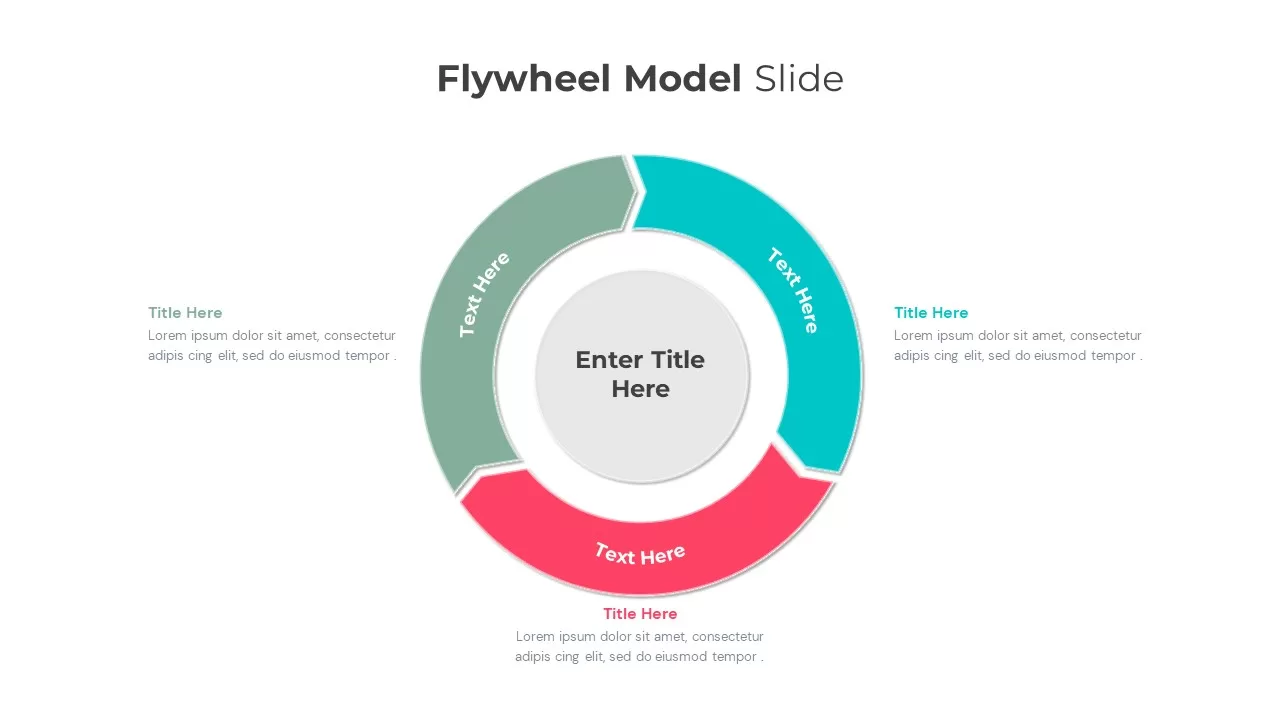
Flywheel Model Infographic Template for PowerPoint & Google Slides
Process
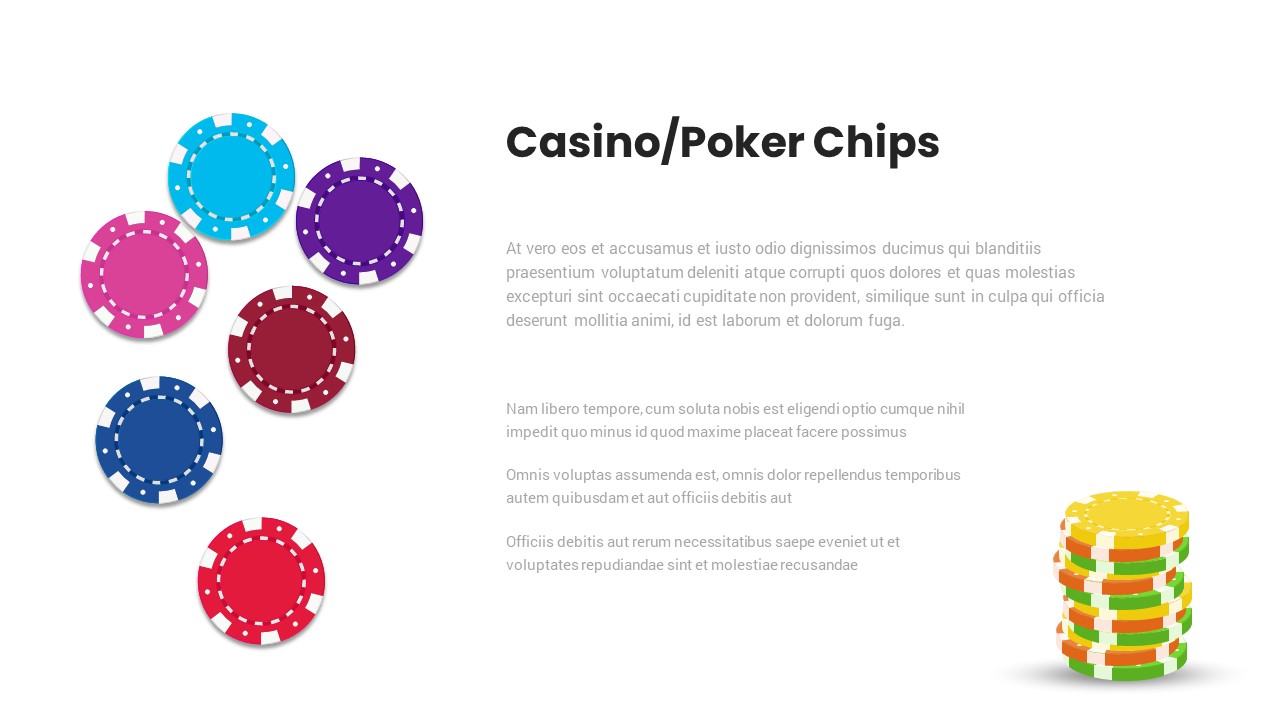
Casino/Poker Chips Infographic template for PowerPoint & Google Slides
Business Proposal

Modern Big Data Infographic Deck Template for PowerPoint & Google Slides
Decks
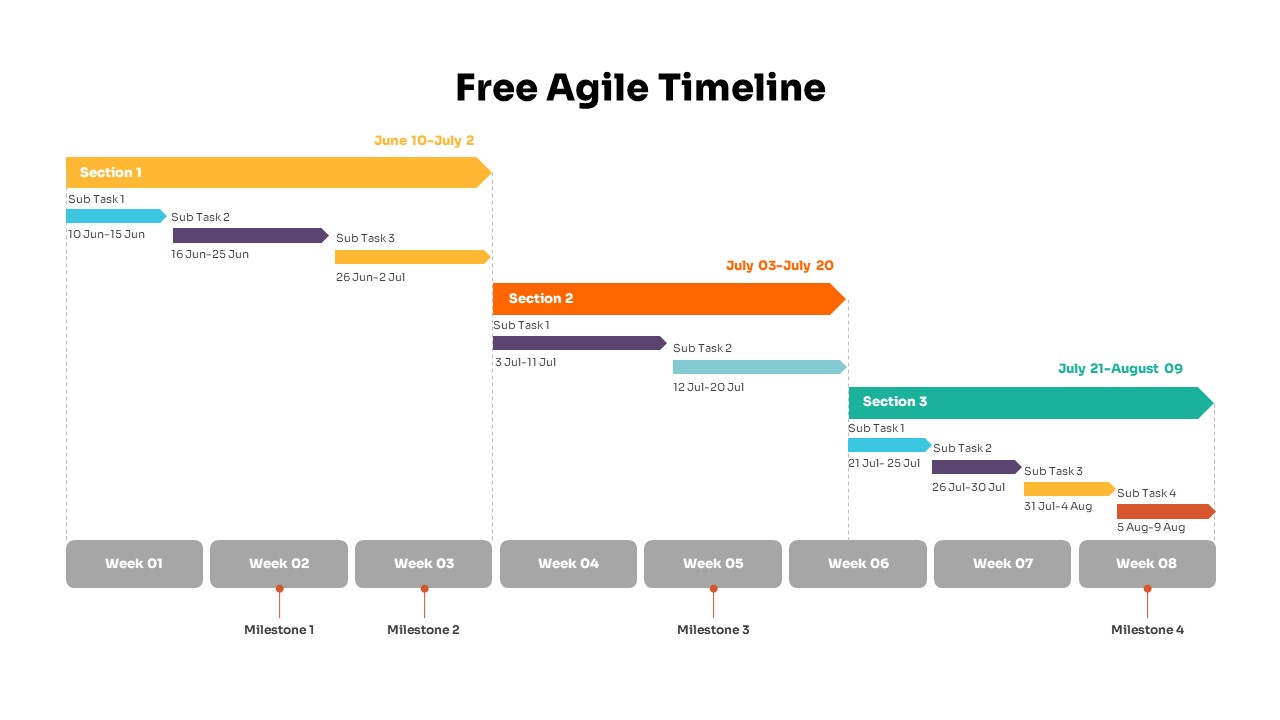
Colorful Agile Timeline Infographic Template for PowerPoint & Google Slides
Timeline
Free
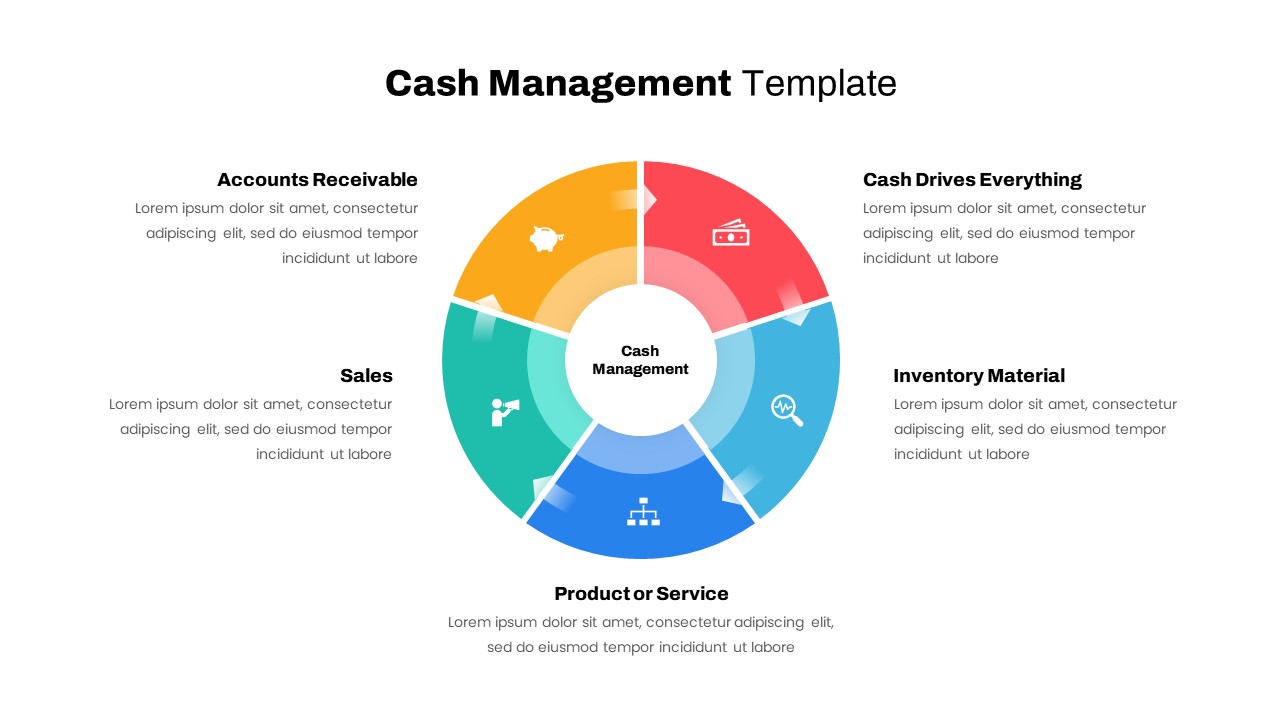
Cash Management Infographic Diagram Template for PowerPoint & Google Slides
Circular
Circular Sustainability Infographic Template for PowerPoint & Google Slides
Process
Free ChatGPT Infographic Presentation Template for PowerPoint & Google Slides
Pitch Deck
Free
Free Radiation Hub and Spoke Infographic Template for PowerPoint & Google Slides
Circular
Free

Free Colorful Infographic Slide Pack Template for PowerPoint & Google Slides
Roadmap
Free
Free Multi-Step Funnel Infographic Slide Pack Template for PowerPoint & Google Slides
Funnel
Free
Curved Roadmap Infographic Vision Journey Template for PowerPoint & Google Slides
Business Strategy
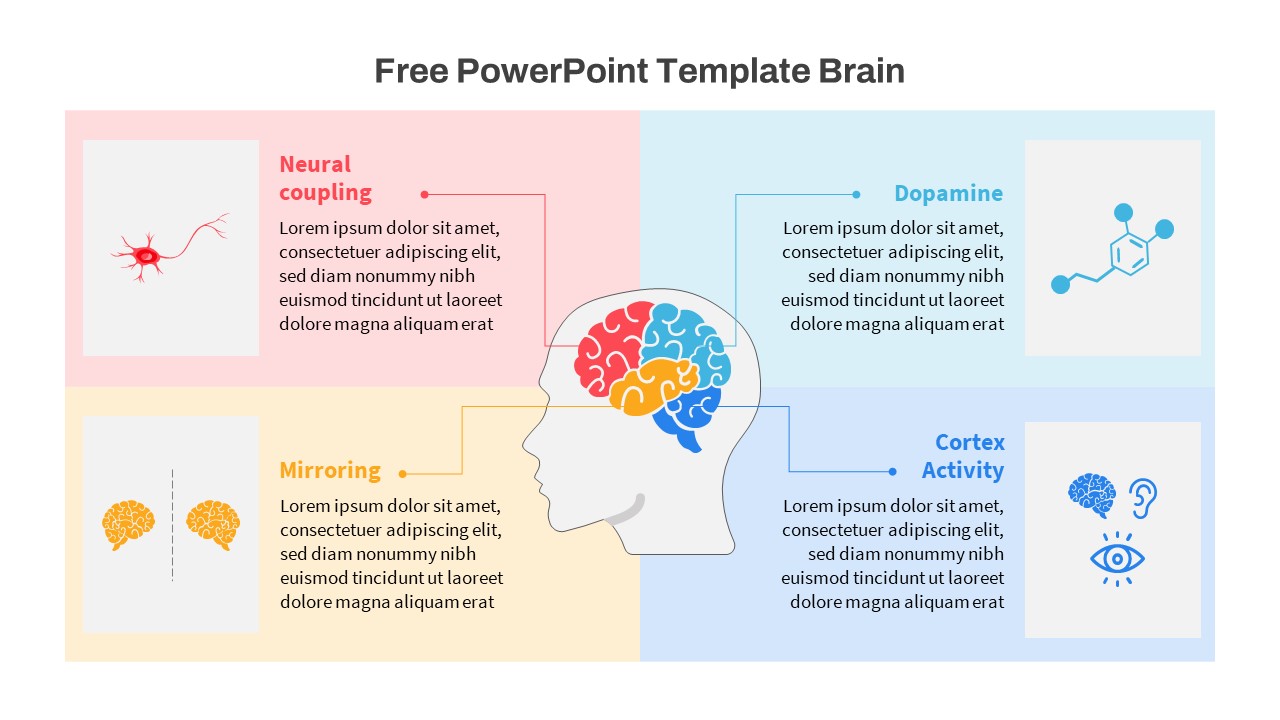
Free Brain Function Diagram Infographic Template for PowerPoint & Google Slides
Process
Free
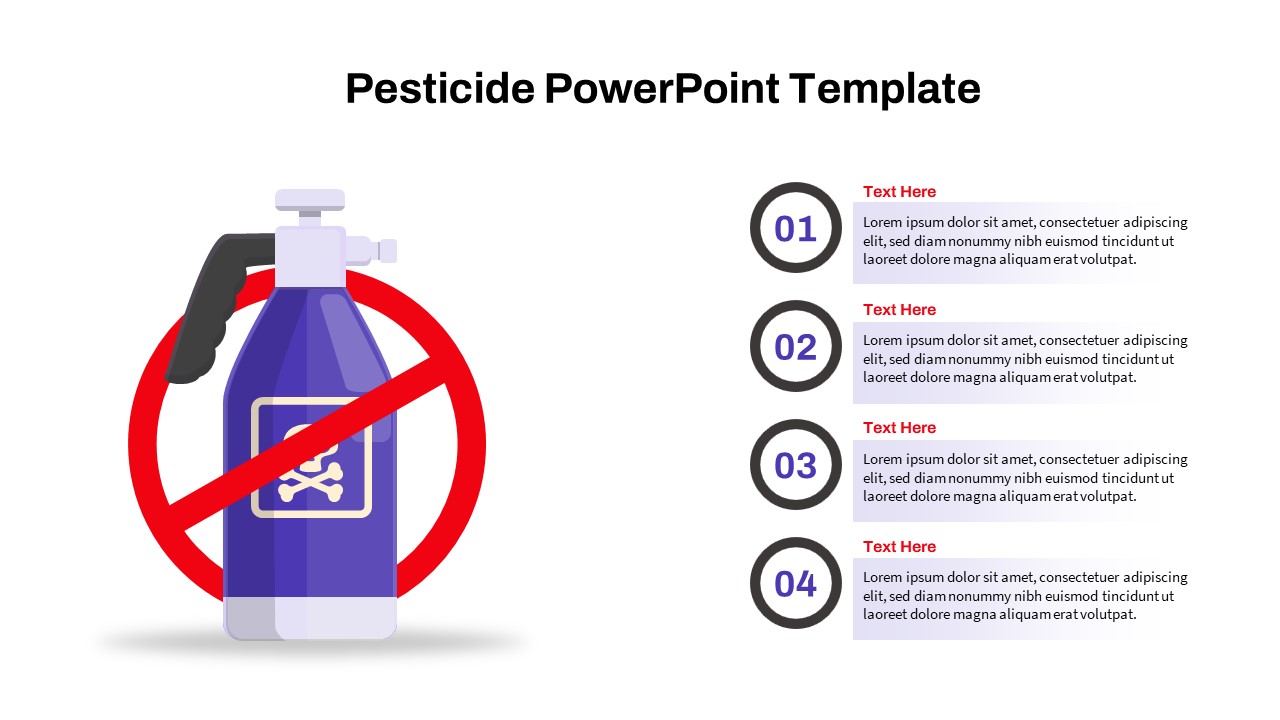
Pesticide Four-Step Process Infographic Template for PowerPoint & Google Slides
Process
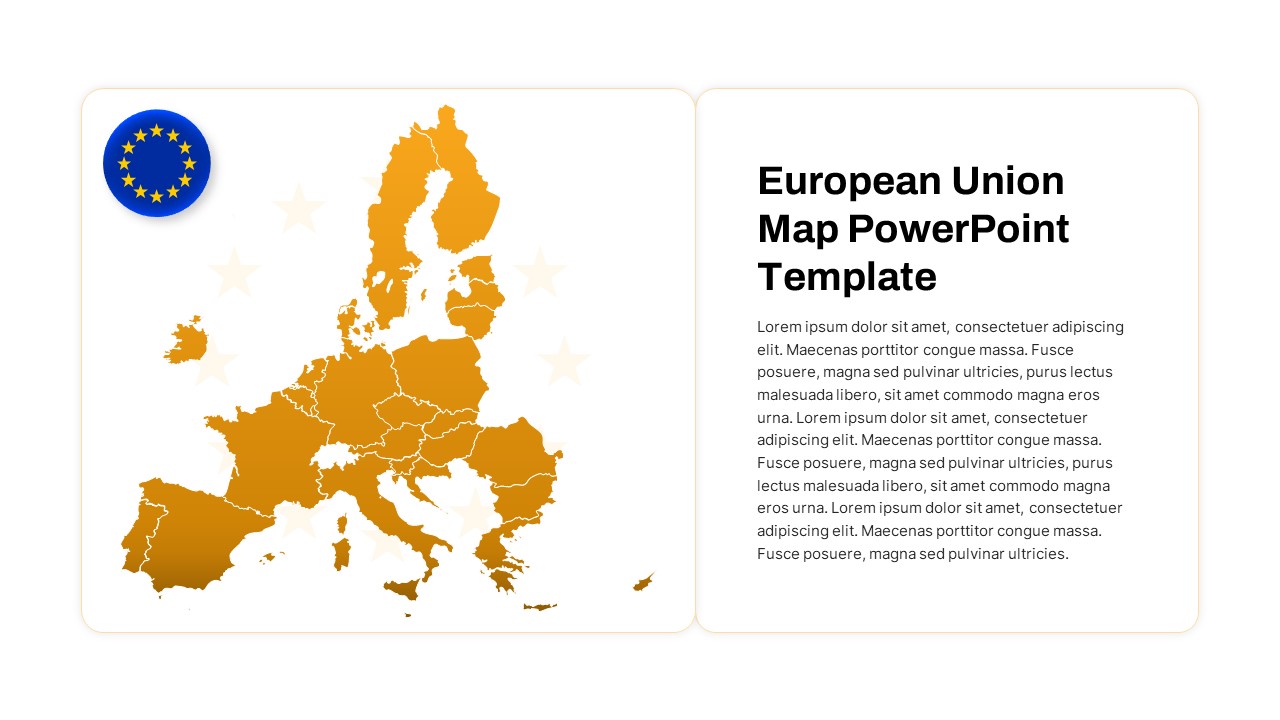
European Union Map Infographic Template for PowerPoint & Google Slides
World Maps
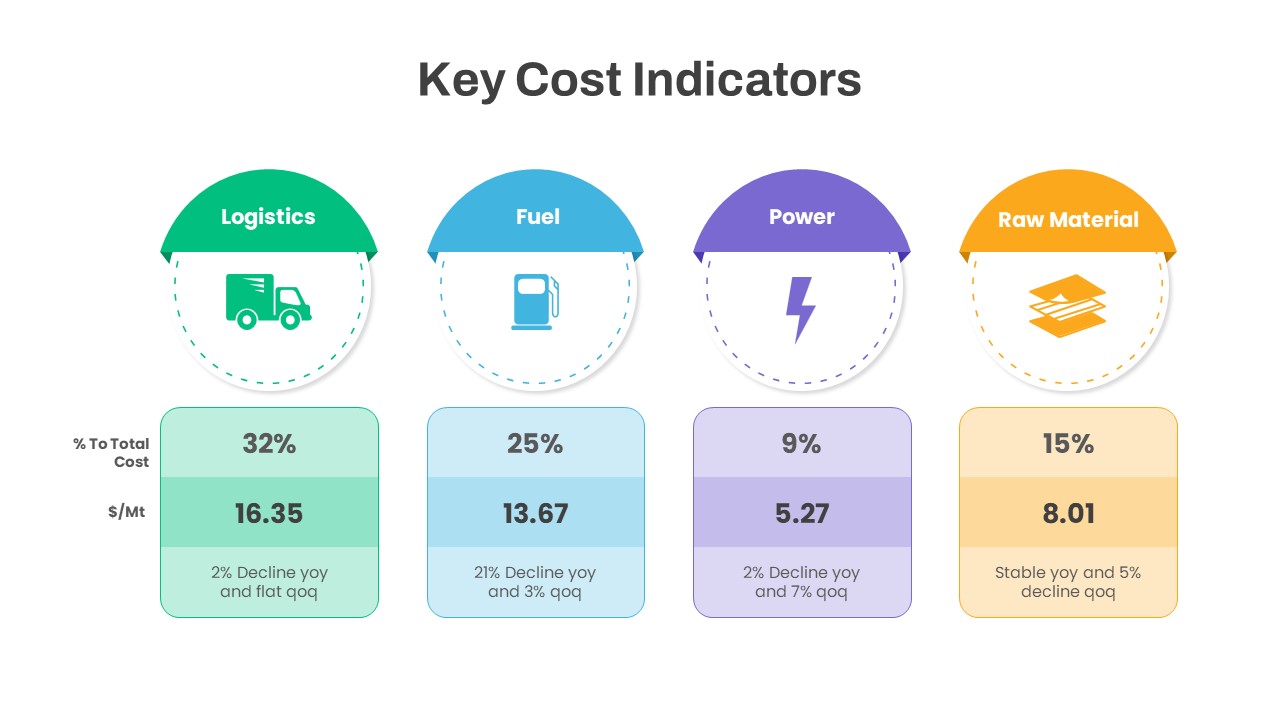
Key Cost Indicators Infographic Template for PowerPoint & Google Slides
Finance
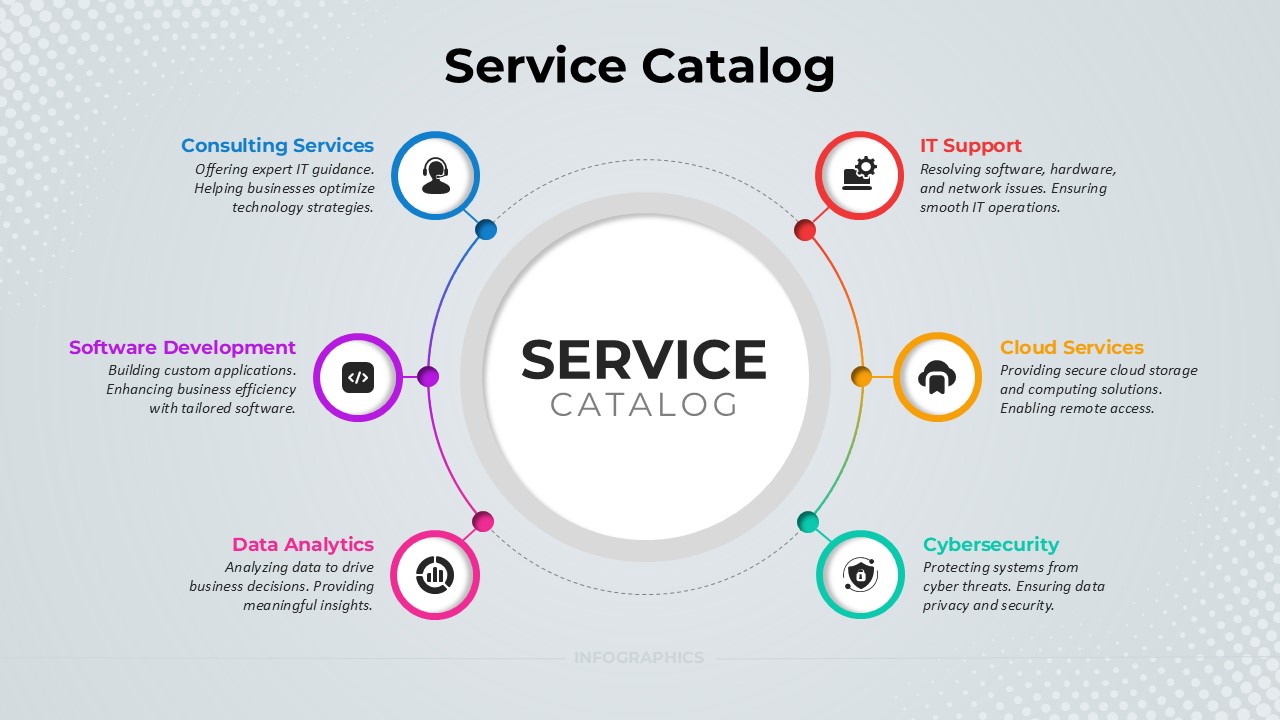
Service Catalog Circular Infographic Template for PowerPoint & Google Slides
Circular
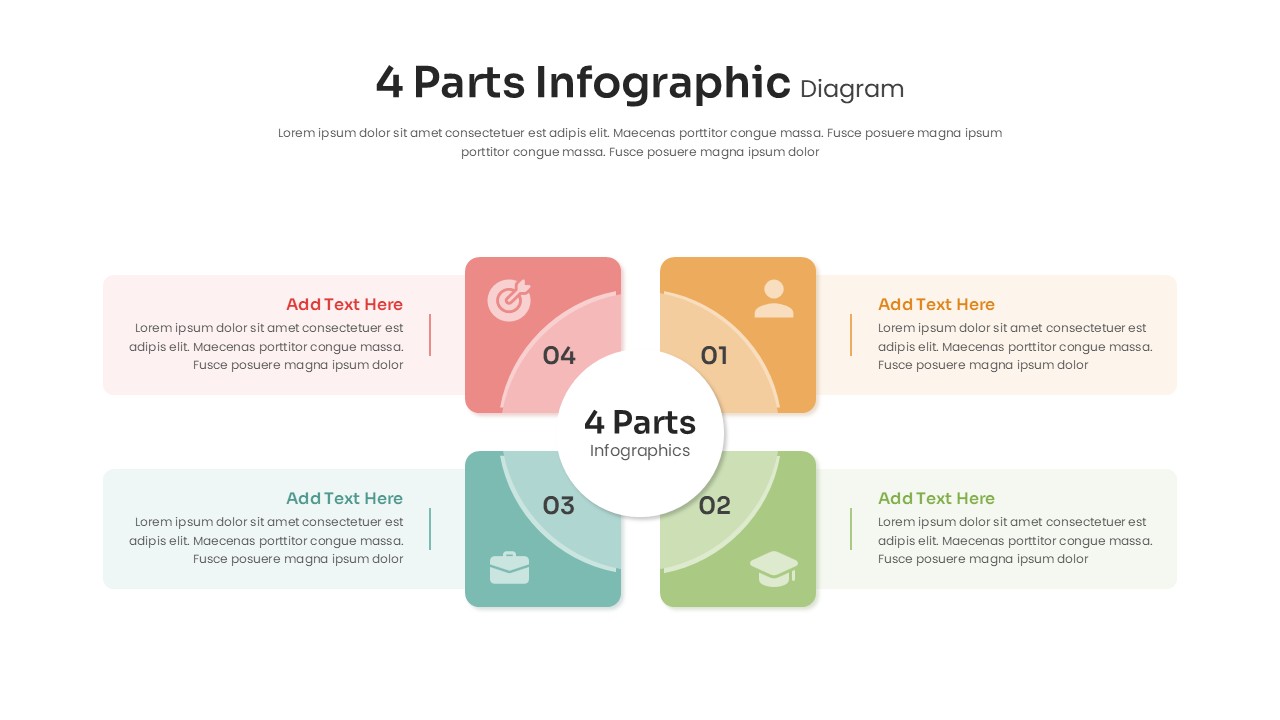
4 Parts Infographic Diagram Template for PowerPoint & Google Slides
Process
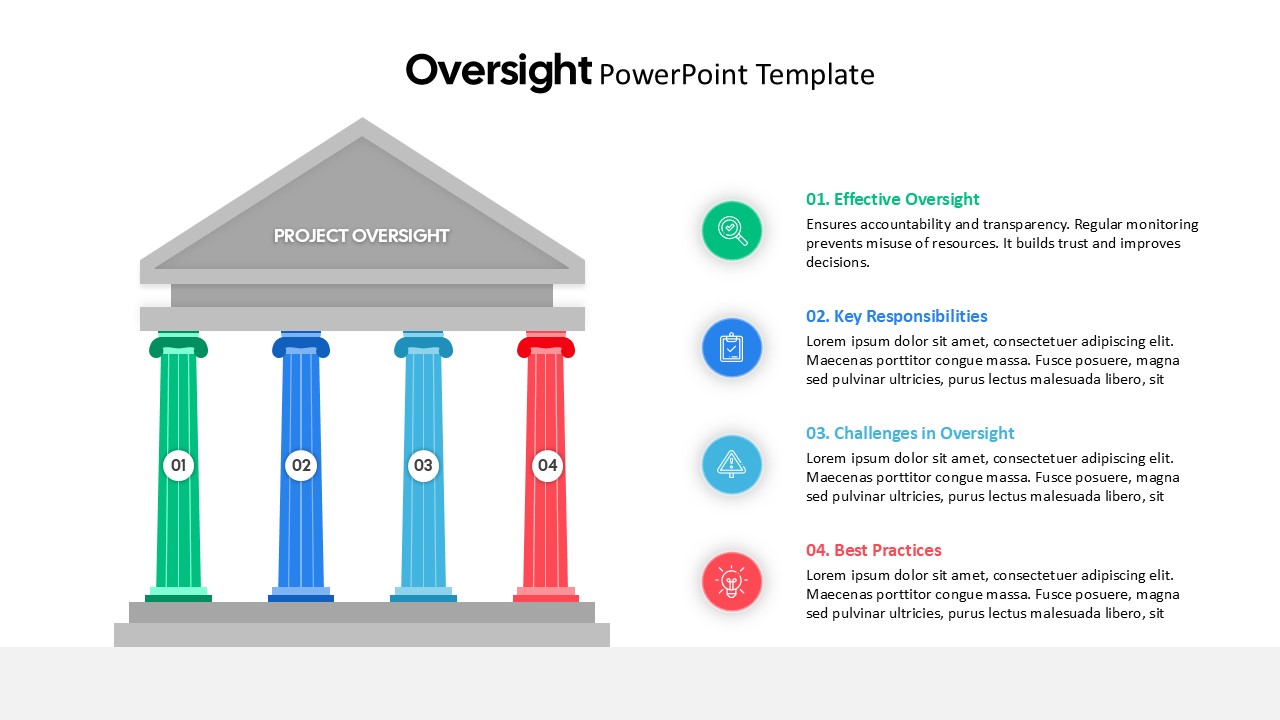
Project Oversight Pillars Infographic Template for PowerPoint & Google Slides
Process