Software Performance Testing Methodology Diagram for PowerPoint & Keynote
Software Performance Testing Methodology Template
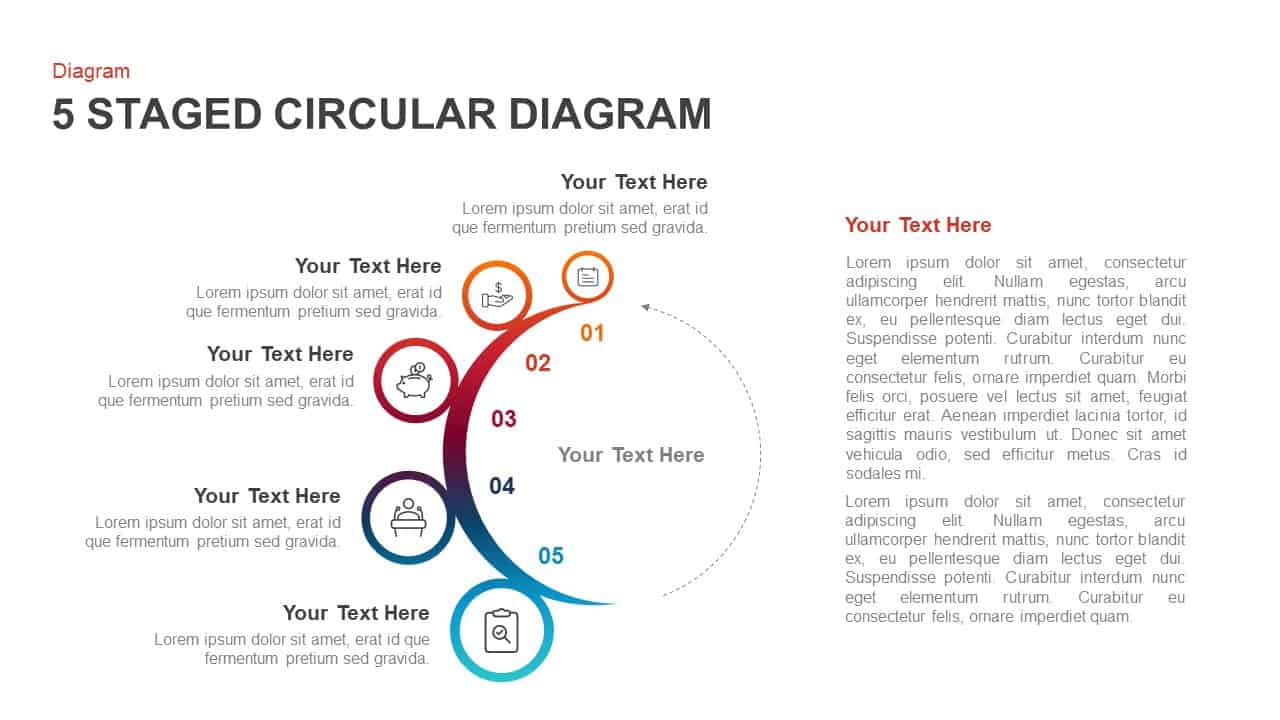
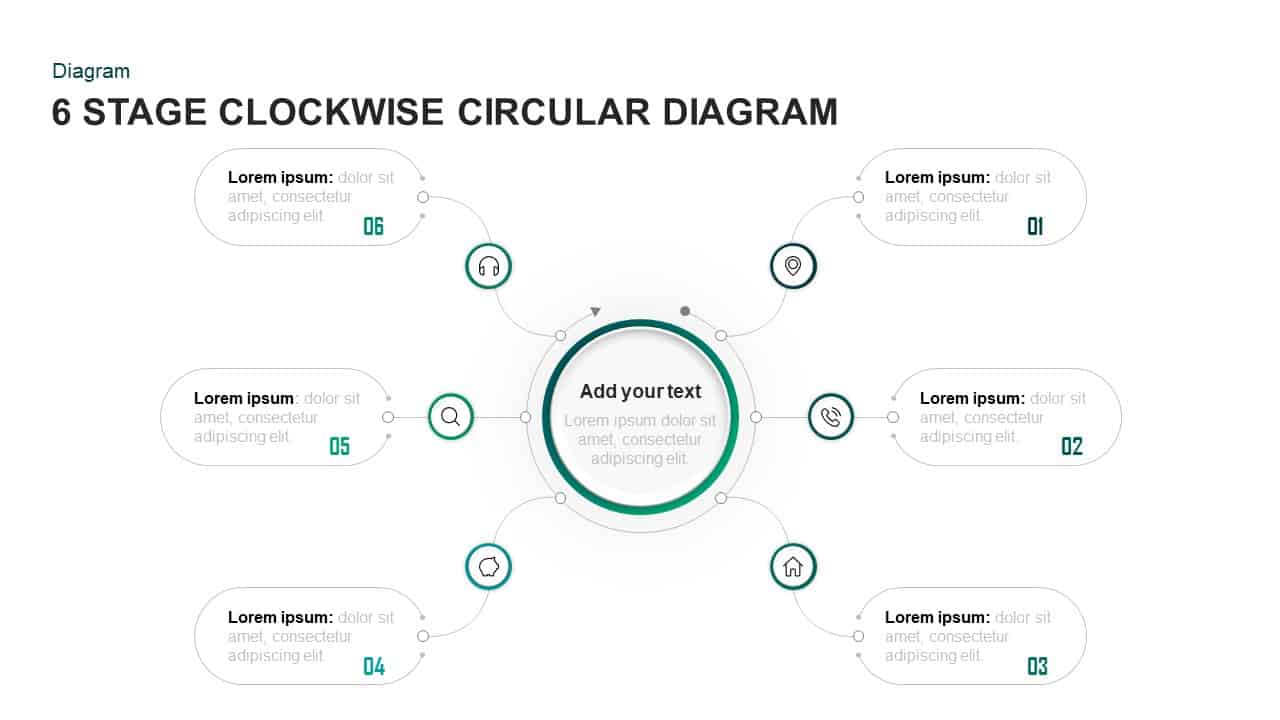
Software performance testing methodology is an IT diagram created with standardized methods of software testing. It is a five staged ppt template that appears as a vertical PowerPoint enriched with text placeholders and infographic icons. Software performance testing is the process of determining the responsiveness, speed, and stability of a computer, network, software program, or device under a workload. Performance testing can involve quantitative tests done in a lab or is in the production environment. The parameters of testing include data transfer rate, processing speed, workload efficiency, and reliability. It is a process for validating or verifying the quality attributes of the system. The system is tested under a mixture of load conditions and checks the time required responsive by the system under varying workloads. Software performance testing comprises the testing of Apps under test to ensure that Apps are functioning as expected under a variety of load conditions. You can access more Performance PowerPoint Templates & PowerPoint themes free here. Grab the free ppt now!
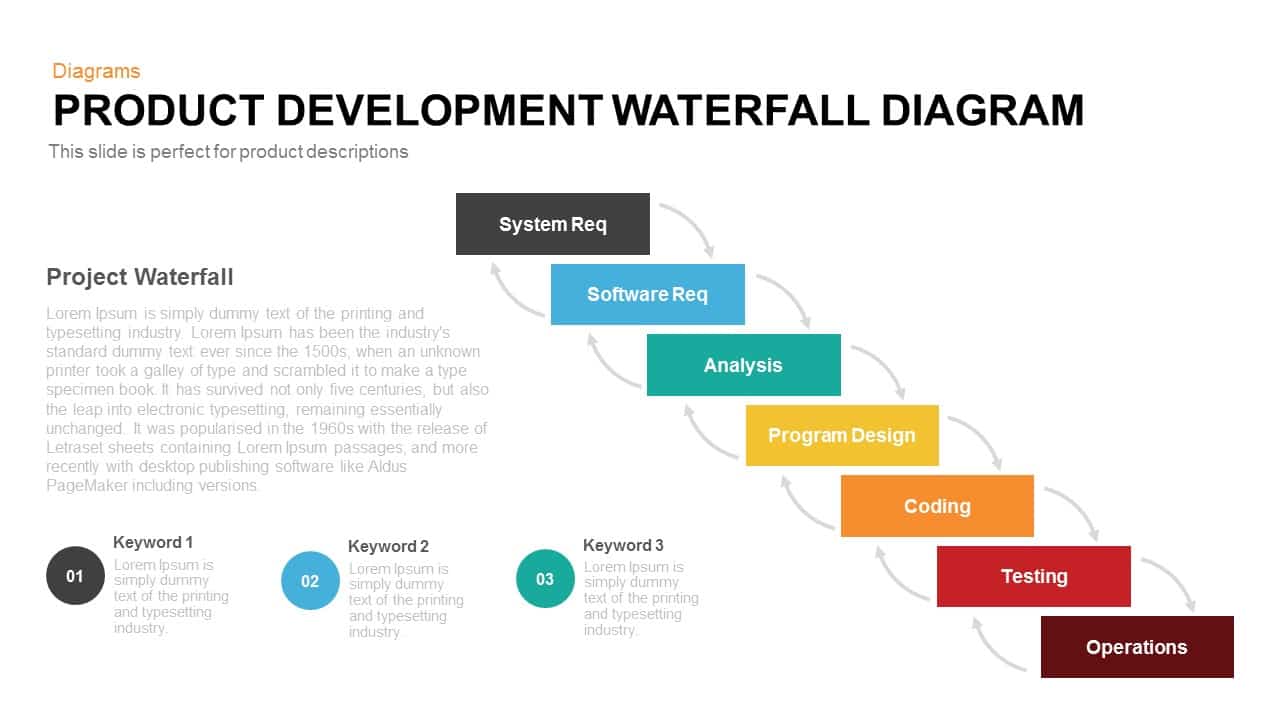
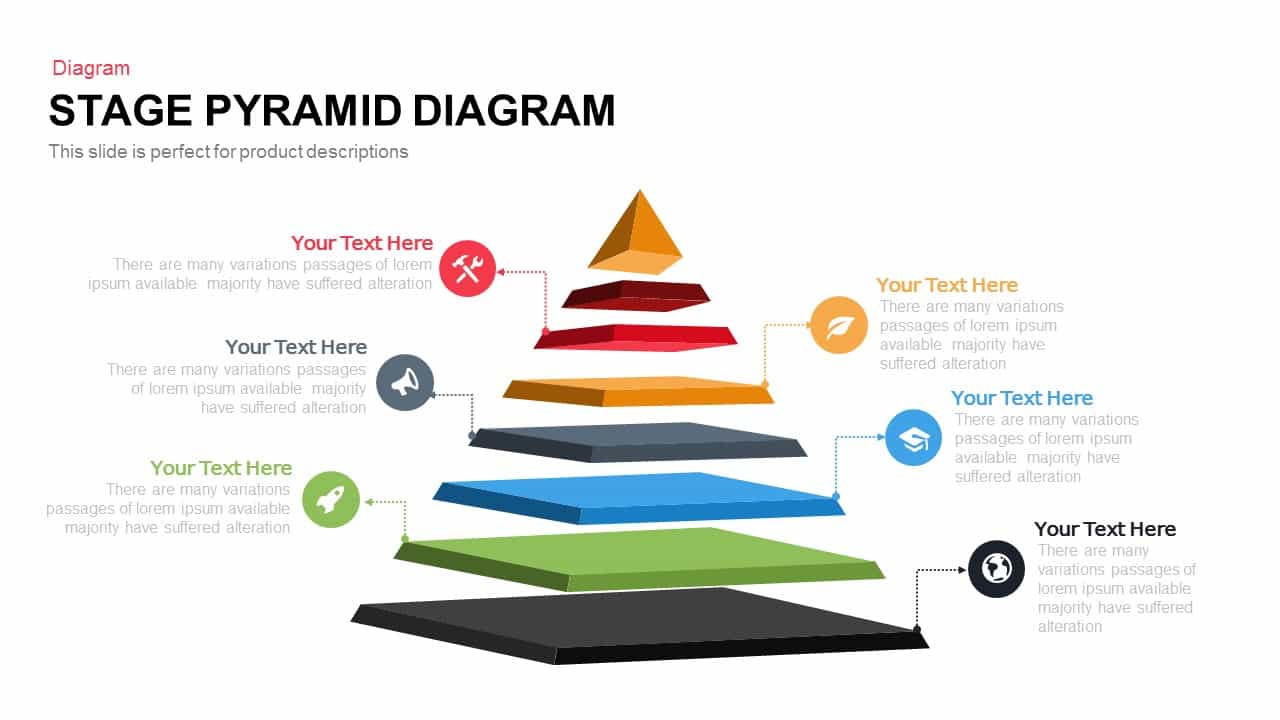
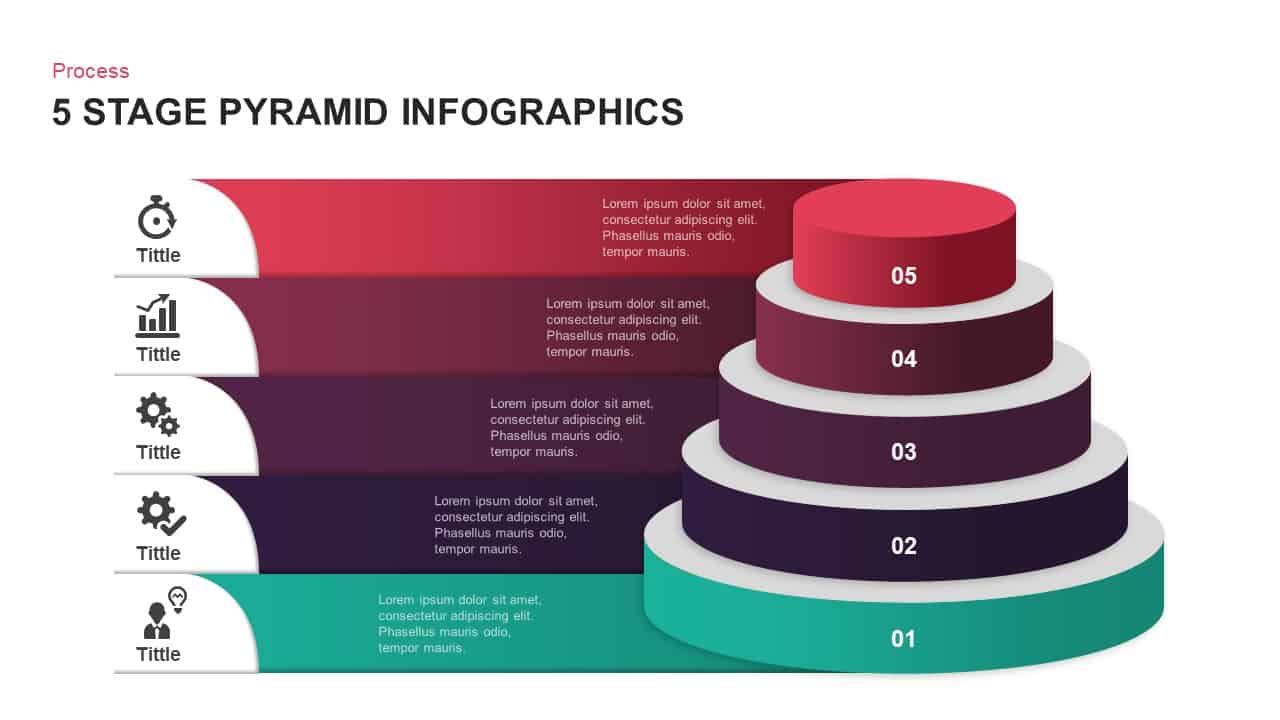
The step PowerPoint shapes are arranged in a step-by-step sequence. It is suitable for presenting the stage-by-stage development of an item or the passing phases of activity. Stair diagram template is ideal for illustrating career or professional growth stages either as personal or as a company. Here, the software performance testing methodologies are clearly defined by the sub-topics. These concepts are general concepts of any testing. It’s like research steps common for qualitative and quantitative inquiries. The points include; scope it, plan it, script it, do it and review it. You can reframe these concepts and add more innovative testing methodologies according to your knowledge and experience. So, you can fix your subject yourself.
The vertical PowerPoint template for software performance testing presentations is a professional PowerPoint. It contains a complete set of text placeholders, useful infographic icons, and visually interactive shapes. The shapes of the diagram ensure 100% audience attention. The colour of shapes is tinted in a varying pattern that makes a shadow effect. The users can modify any PowerPoint features using change options.
Login to download this file


