Quarterly Financial Summary Dashboard Template for PowerPoint & Google Slides

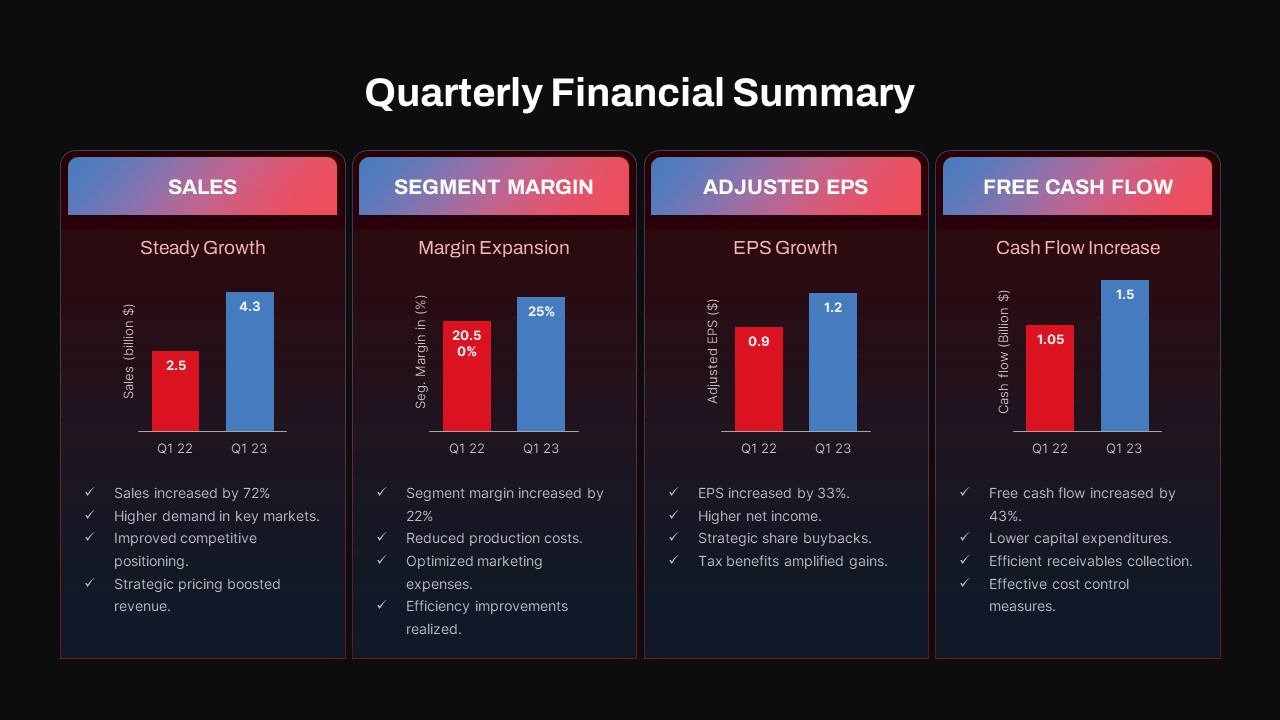

This Quarterly Financial Summary Dashboard slide template organizes four critical business metrics—Sales, Segment Margin, Adjusted EPS, and Free Cash Flow—into side-by-side panels, each equipped with bar column charts and interpretative bullet points. A vibrant top banner with a red-to-blue gradient highlights each metric’s name, while the body uses pale gradient backgrounds for visual separation. Each panel features two bars contrasting Q1’22 and Q1’23 data, complete with direct data labels and clear axis notation (“Sales (billion $)”, “Seg. Margin (%)”, “Adjusted EPS ($)”, “Cash Flow (Billion $)”). Beneath the charts, concise bullet lists summarize key takeaways—sales grew by 72%, margin expansion of 22%, EPS up 33%, and cash flow increase of 43%—enabling presenters to reinforce insights with evidence.
Set against a crisp white canvas, the slide leverages a balanced grid system and generous white space to maintain clarity, while removable drop shadows and rounded corners add subtle depth. The bold sans-serif headline sits atop the paneled content, ensuring immediate context. Built on master slides with named layers and grouped elements, this template lets you seamlessly swap sample data with your figures, recolor gradients via theme swatches, or adjust container sizes without breaking layout. The gradient accent bars are fully editable, and you can switch to flat color fills if preferred. All fonts, shapes, and chart styles can be globally updated in seconds.
Additional customization options include toggling gridlines, changing bullet icons, or applying entrance animations to spotlight each panel in sequence. The template is optimized for cross-platform use—PowerPoint on Microsoft 365, Google Slides, or earlier PPT versions—ensuring consistent formatting and print-friendly layouts. Whether for quarterly reviews, investor presentations, or internal dashboards, this slide drives engagement by combining data visualization with professional design finesse.
Who is it for
Financial analysts, corporate finance teams, and executive leadership who need a polished, data-driven dashboard for quarterly performance reviews. Investor relations managers and strategy consultants will also benefit from the clear side-by-side comparison of key financial metrics.
Other Uses
Repurpose this slide for board meeting decks, sales kick-off presentations, budget planning sessions, or KPI reports. It can also serve as a template for year-end summaries, forecasting workshops, and performance dashboards.
Login to download this file

Item ID
SB04268
Related Templates

Free Quarterly Business Review Dashboard Template for PowerPoint & Google Slides
Business
Free
Quarterly Business Review Dashboard Template for PowerPoint & Google Slides
Pitch Deck
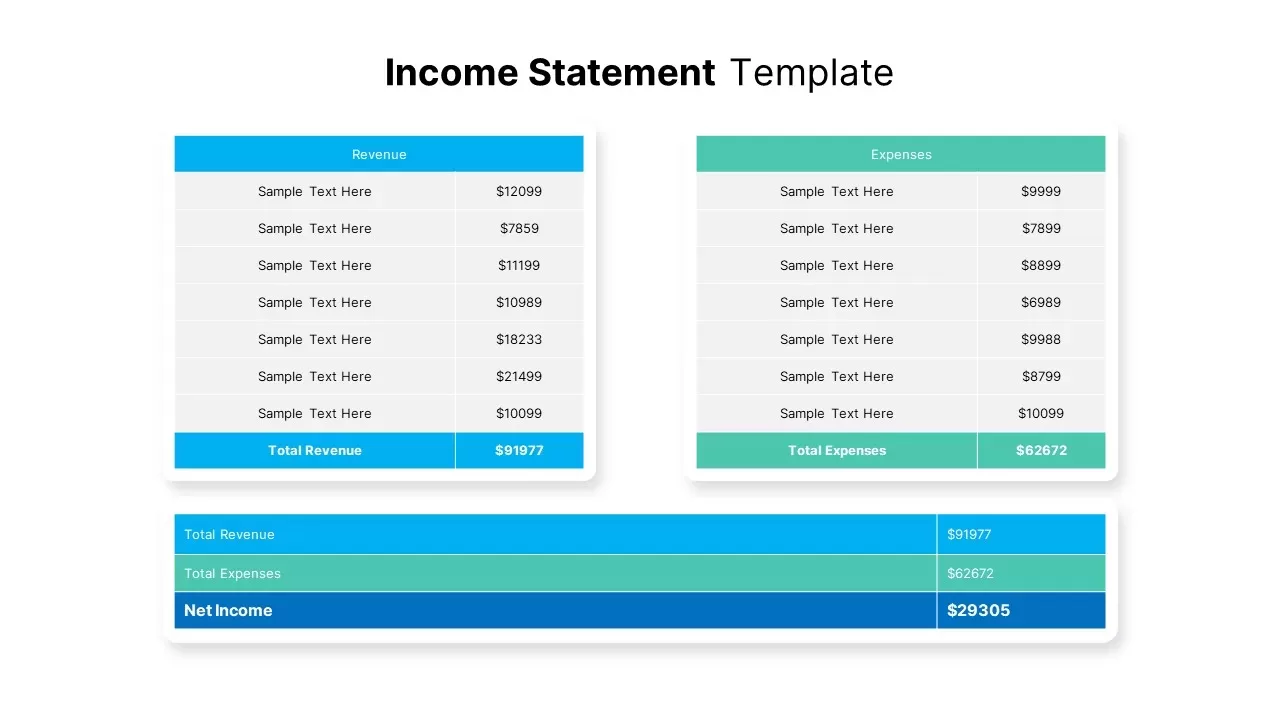
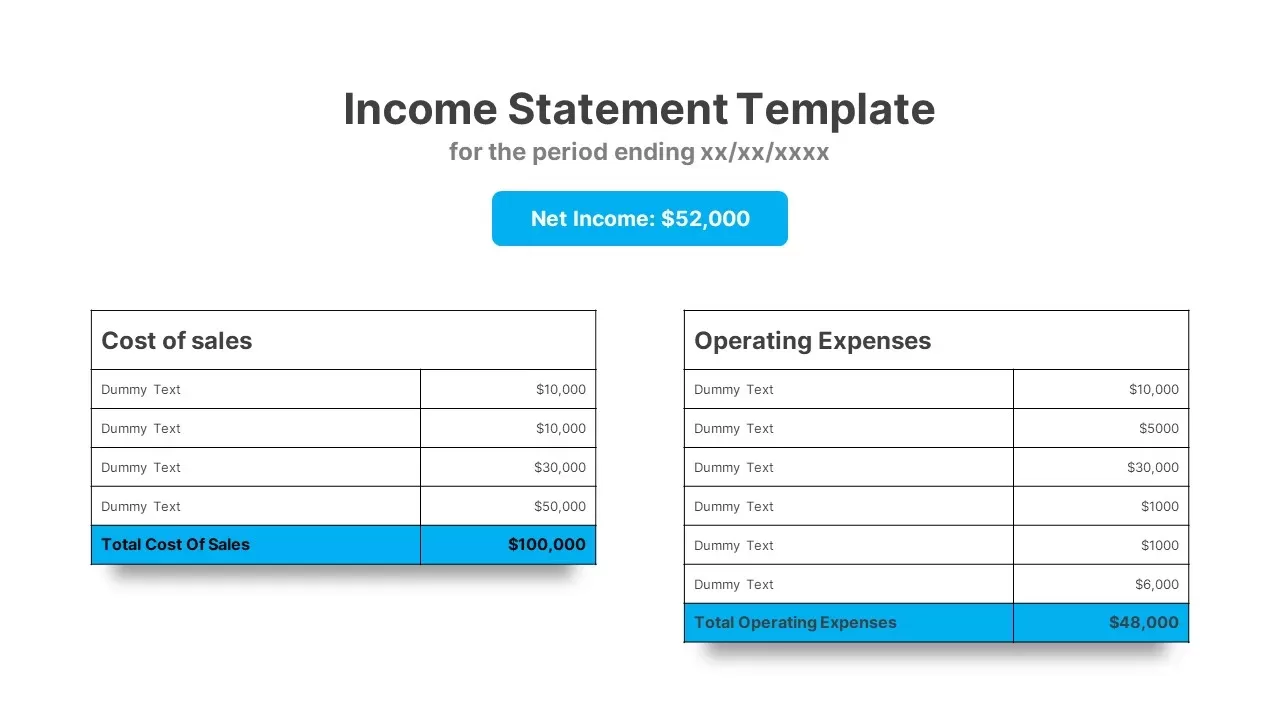
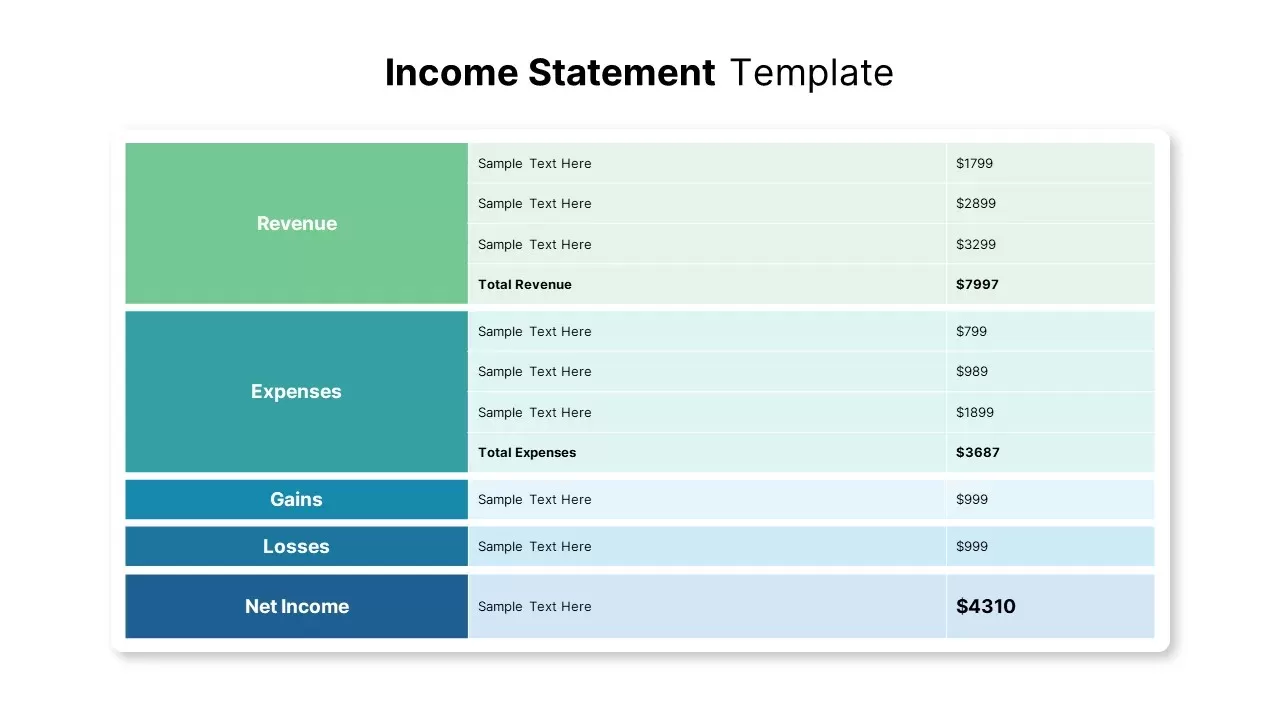
Income Statement Financial Summary Template for PowerPoint & Google Slides
Business Report
Free Monthly Report PowerPoint Template for PowerPoint & Google Slides
Business Report
Free
Banking Financial Overview Dashboard Template for PowerPoint & Google Slides
Finance
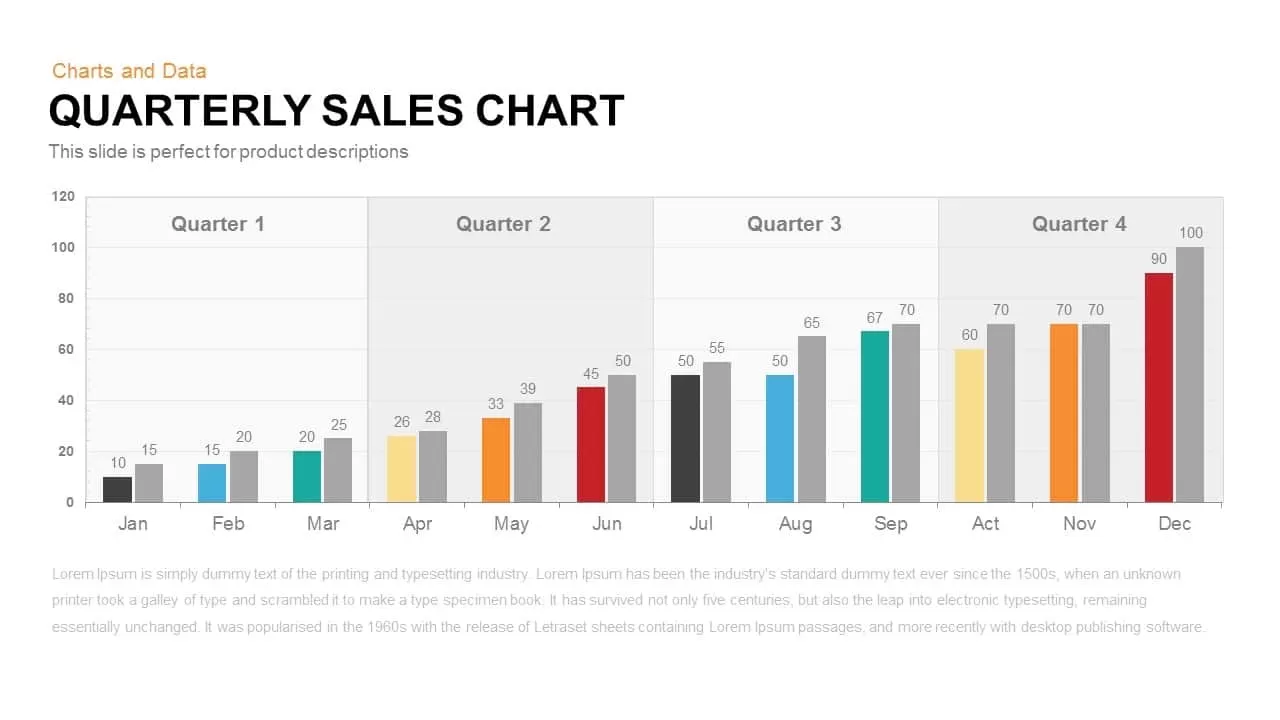
Quarterly Sales template for PowerPoint & Google Slides
Bar/Column
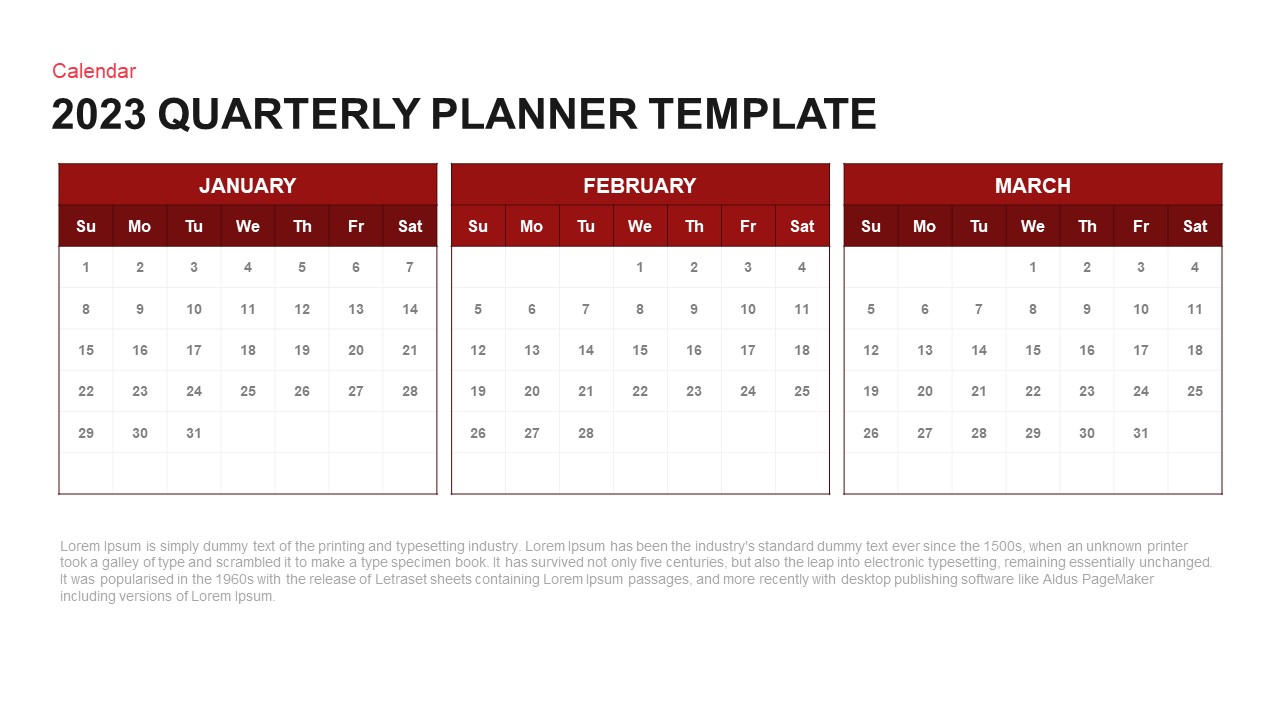
Quarterly Planner Calendar Layout Template for PowerPoint & Google Slides
Project
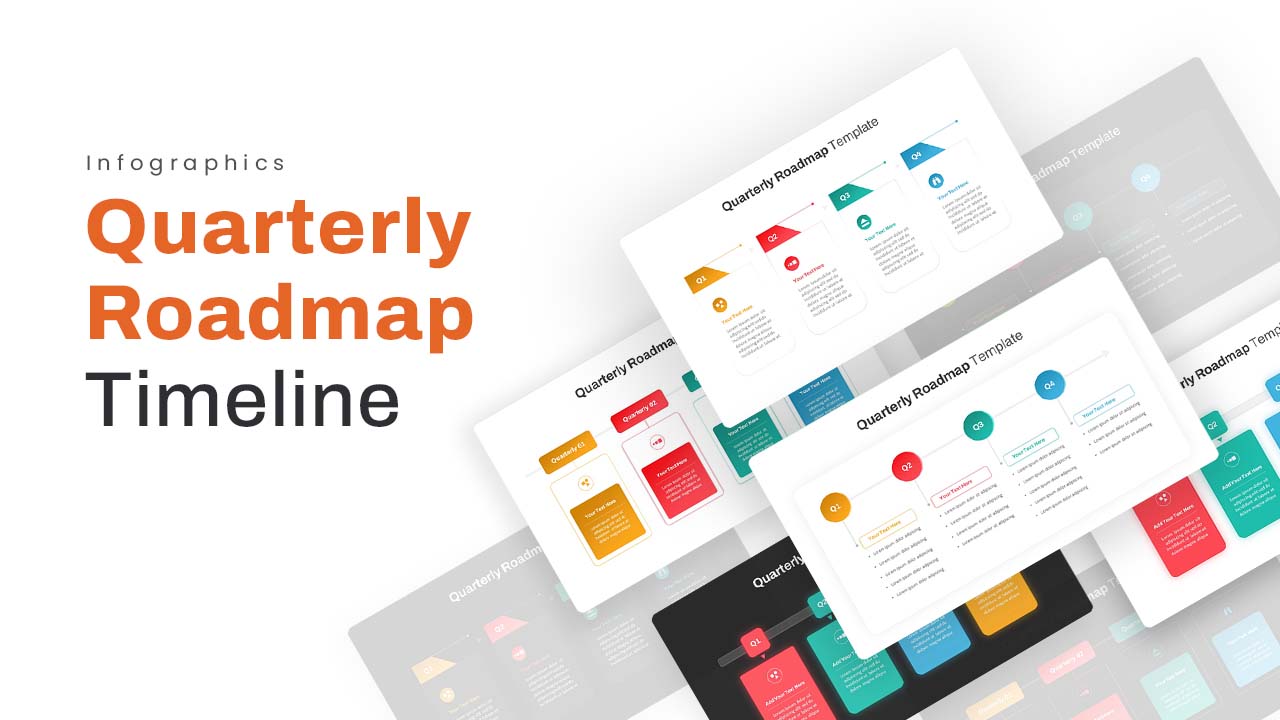
Quarterly Roadmap Timeline Infographic Template for PowerPoint & Google Slides
Timeline
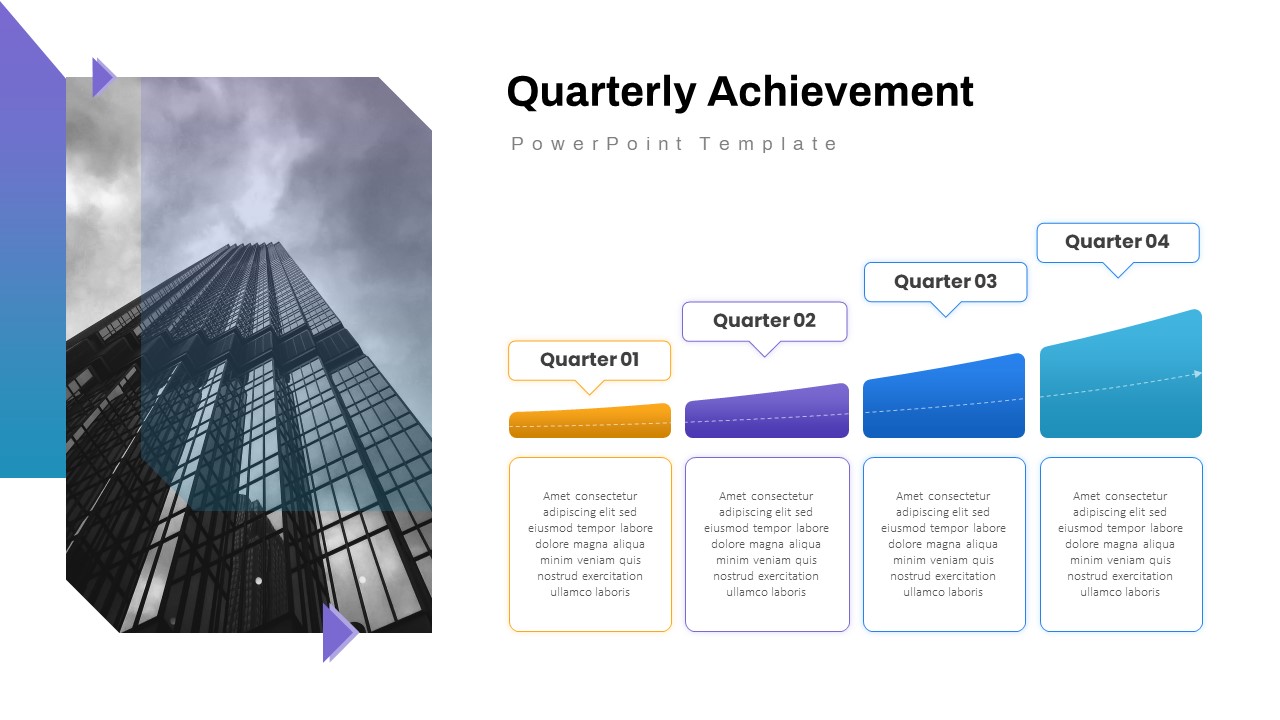
Quarterly Achievement Progress Template for PowerPoint & Google Slides
Accomplishment
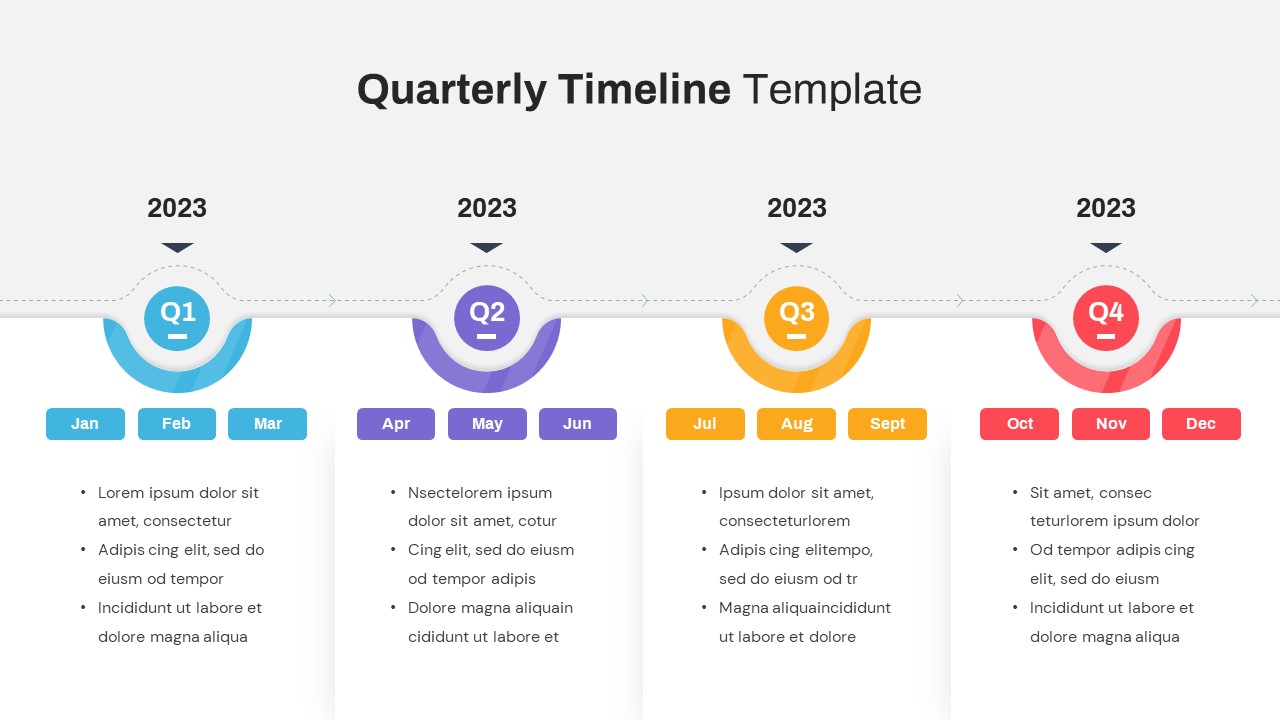
Quarterly Timeline Infographic Template for PowerPoint & Google Slides
Timeline
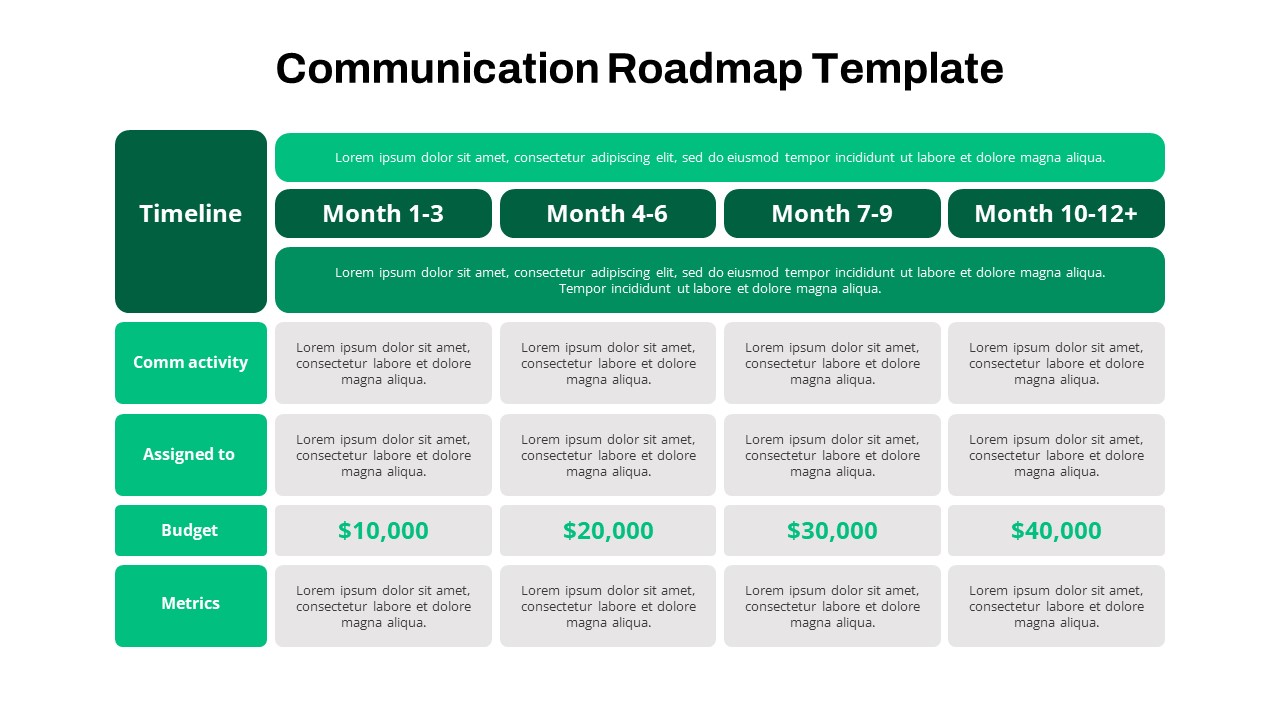
Quarterly Communication Roadmap Grid Template for PowerPoint & Google Slides
Marketing
Quarterly Credit Loss Provisions Chart Template for PowerPoint & Google Slides
Bar/Column
Quarterly Gross Profit Rate Chart Template for PowerPoint & Google Slides
Revenue
Quarterly Network Volume Analysis Template for PowerPoint & Google Slides
Business Report
Quarterly Revenue Comparison Bar Chart Template for PowerPoint & Google Slides
Bar/Column

Quarterly Net Interest Income Growth Template for PowerPoint & Google Slides
Bar/Column
Quarterly Sales Review Bar Chart Template for PowerPoint & Google Slides
Bar/Column
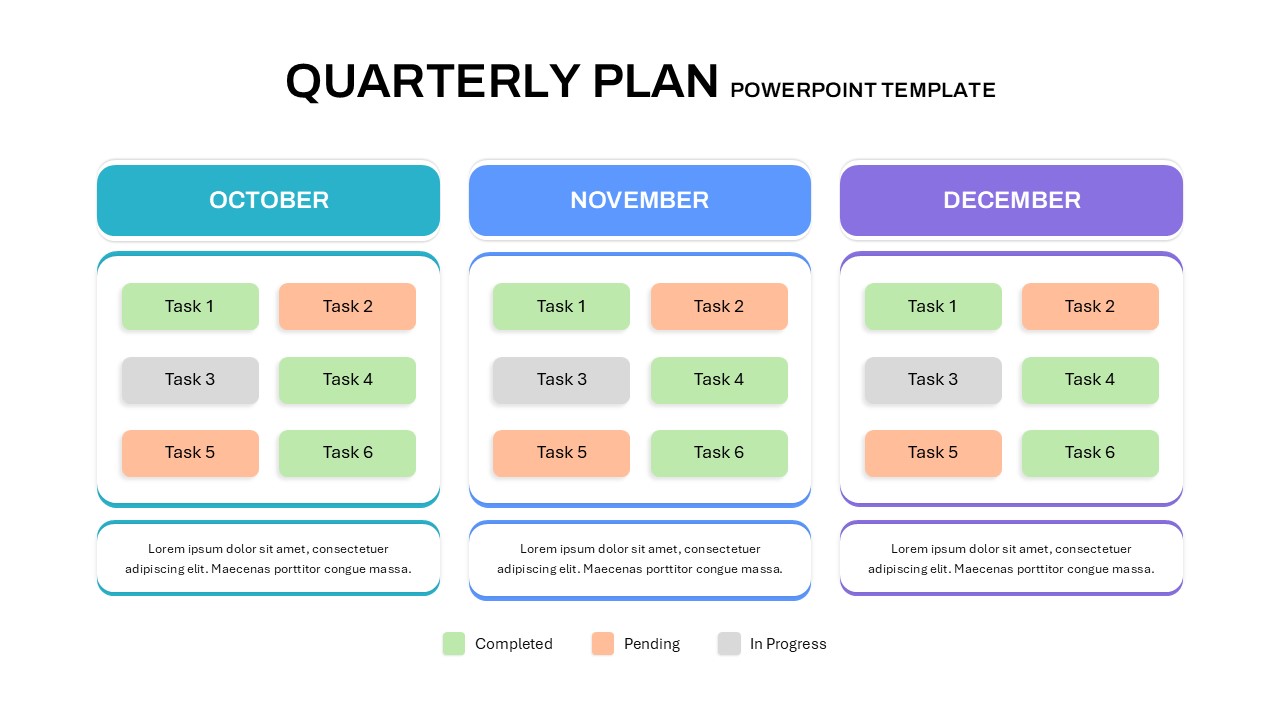
Quarterly Plan Template for PowerPoint & Google Slides
Project Status

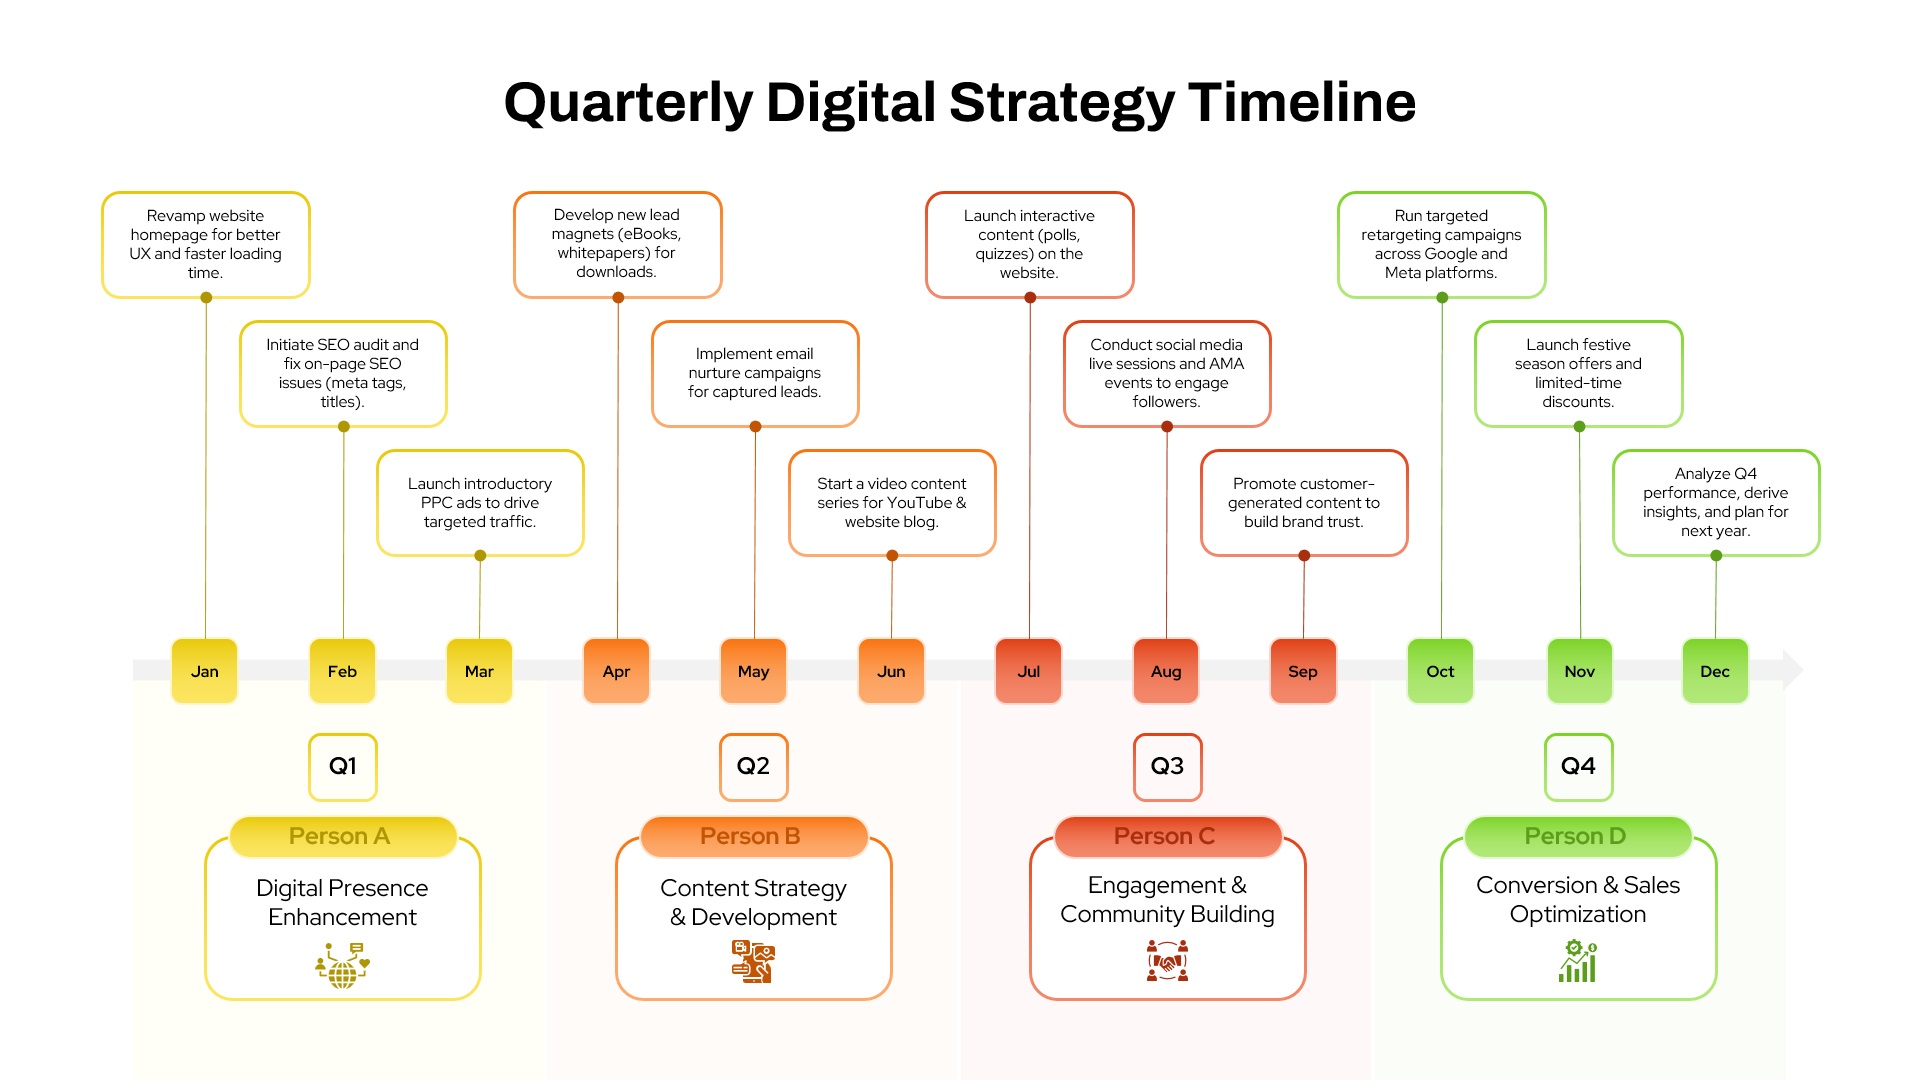
Quarterly Digital Strategy Timeline template for PowerPoint & Google Slides
Digital Marketing
Quarterly Gantt Chart with Today Marker Template for PowerPoint & Google Slides
Gantt Chart
Quarterly Comparison Pie Chart Template for PowerPoint & Google Slides
Pie/Donut
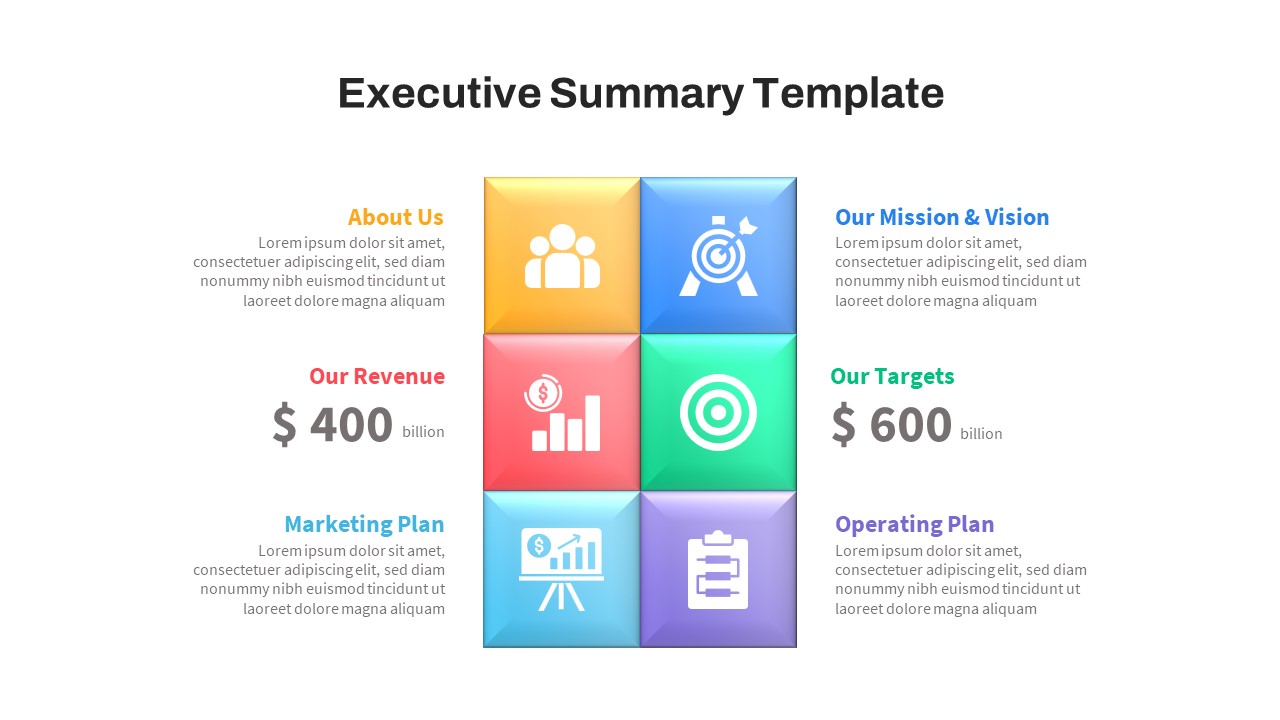
Executive Summary template for PowerPoint & Google Slides
Business
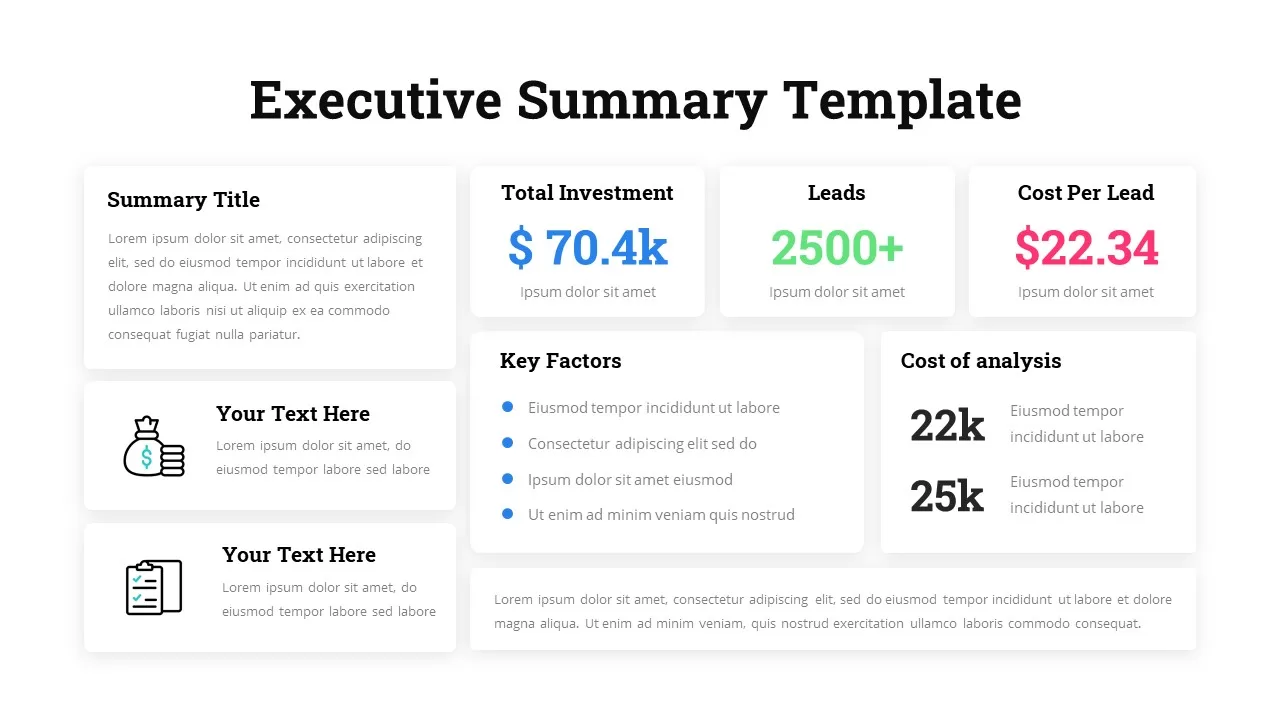
Free Executive Summary Template for PowerPoint & Google Slides
Business
Free
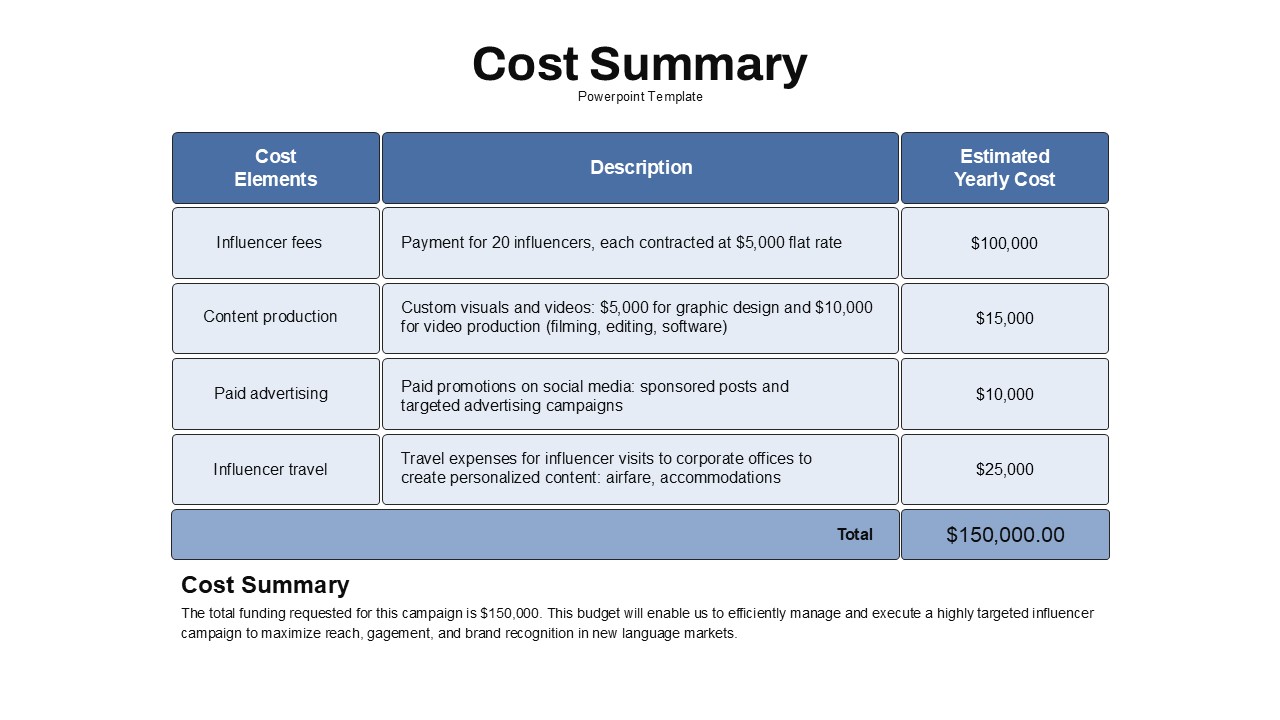
Cost Summary Table Template for PowerPoint & Google Slides
Business Report
Startup Executive Summary Template for PowerPoint & Google Slides
Business Report
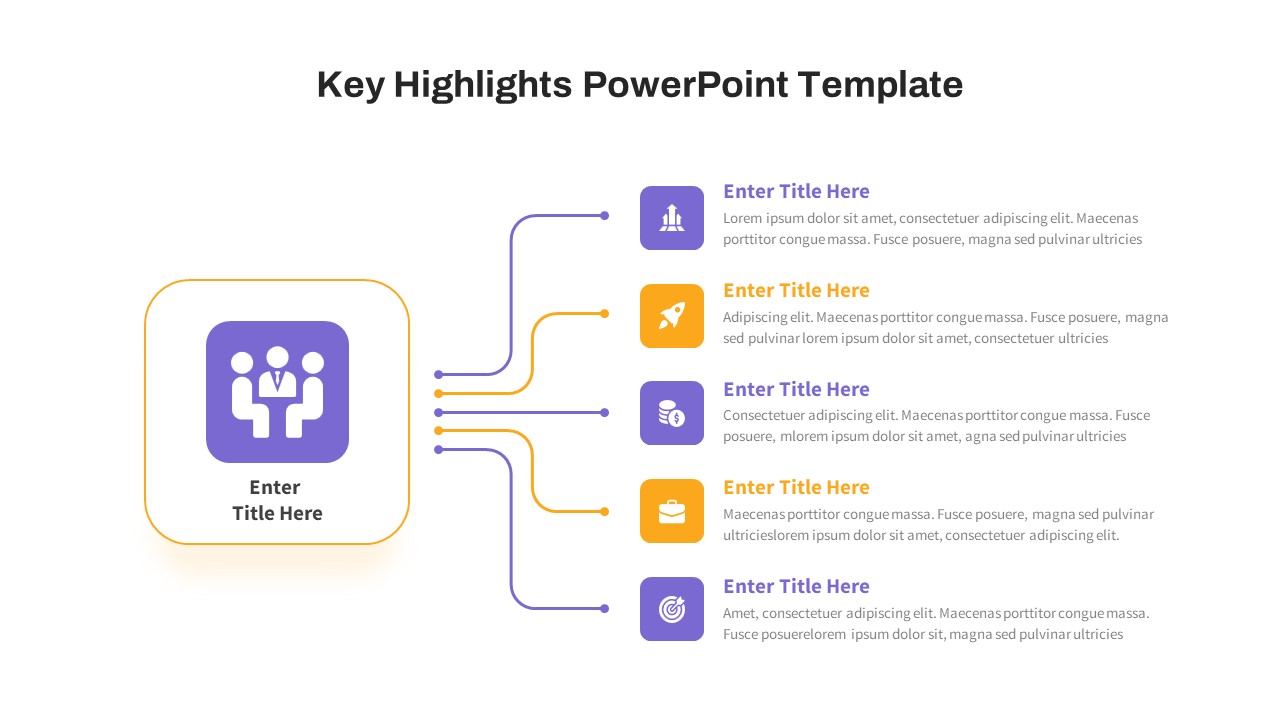
Free Key Highlights Business Summary Slide for PowerPoint & Google Slides
Accomplishment
Free
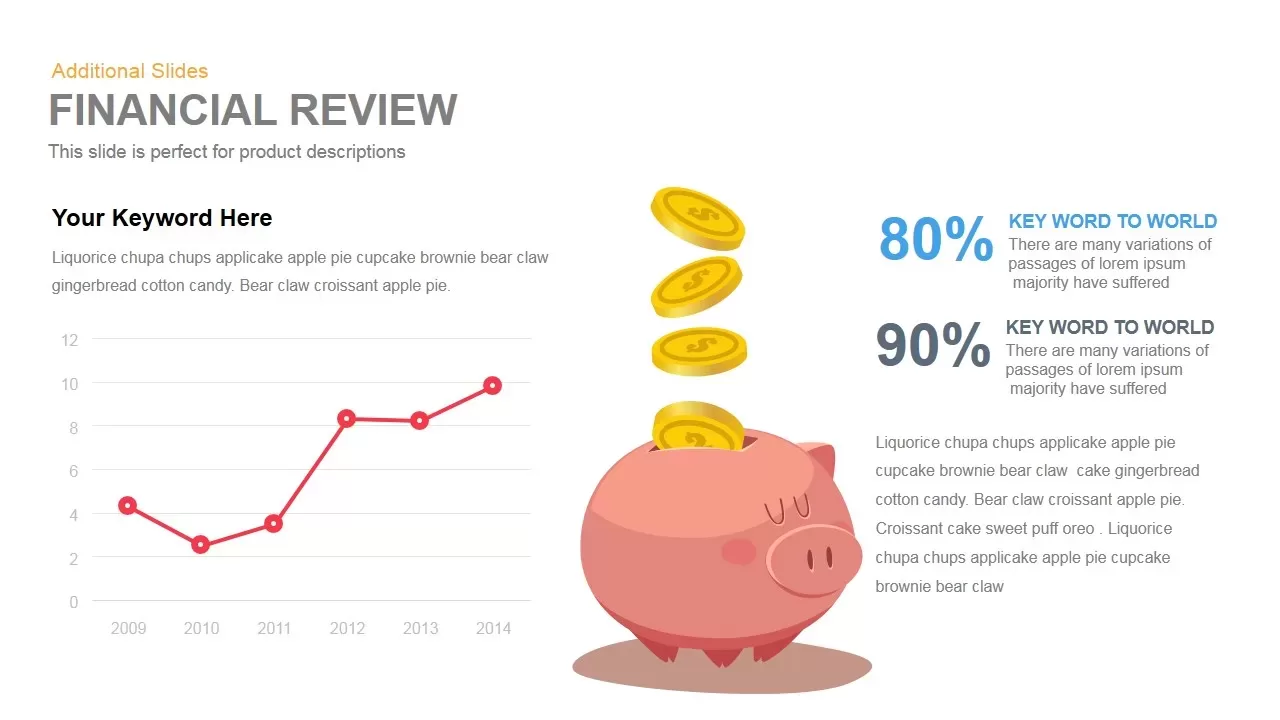
Financial Review template for PowerPoint & Google Slides
Finance

Money Metaphor Financial Overview Template for PowerPoint & Google Slides
Finance
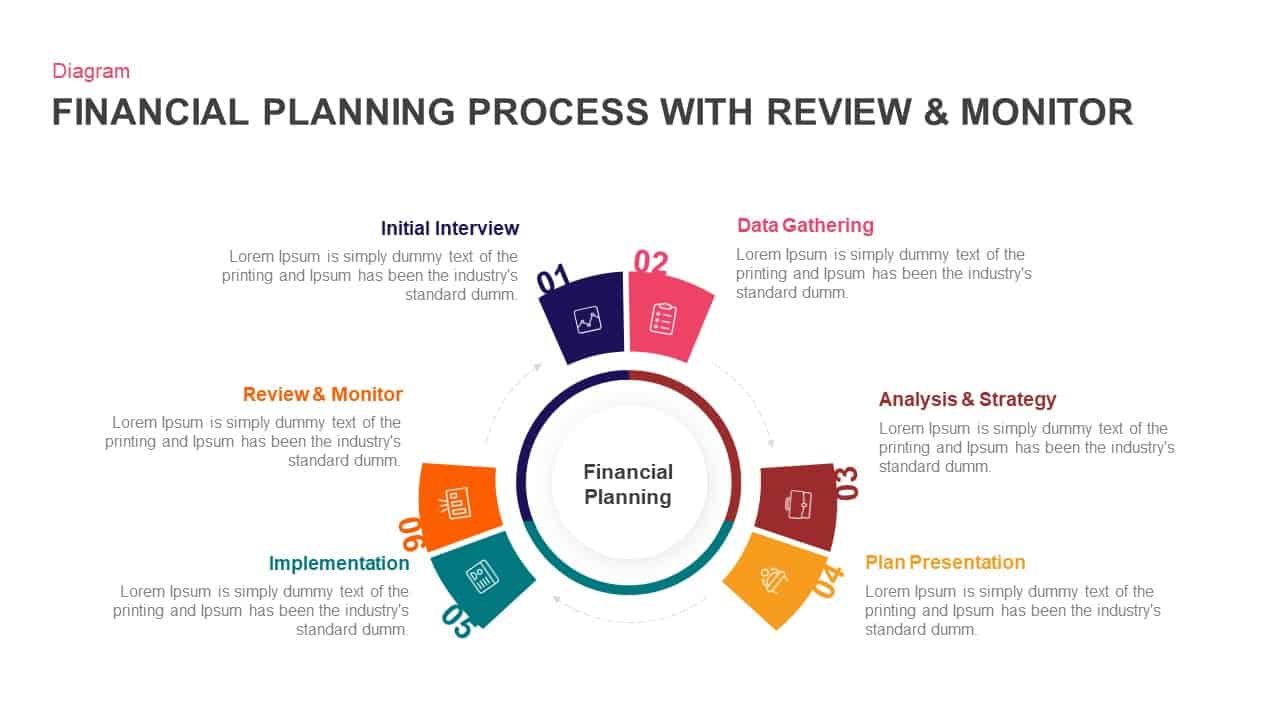
Financial Planning Circular Process Template for PowerPoint & Google Slides
Process
5-Stage Financial Growth Timeline Template for PowerPoint & Google Slides
Timeline
Financial Agreement Signing Flow Diagram Template for PowerPoint & Google Slides
Process
Financial Report Metaphor Illustration Template for PowerPoint & Google Slides
Finance
Income Statement Financial Reporting Template for PowerPoint & Google Slides
Finance
Income Statement Financial Report Template for PowerPoint & Google Slides
Business Report
Corporate Financial Auditing Service Template for PowerPoint & Google Slides
Finance

Financial Advisory Service Pitch Deck Template for PowerPoint & Google Slides
Finance
Financial Institutions Presentation Template for PowerPoint & Google Slides
Company Profile
Financial Consulting Company Profile Template for PowerPoint & Google Slides
Finance
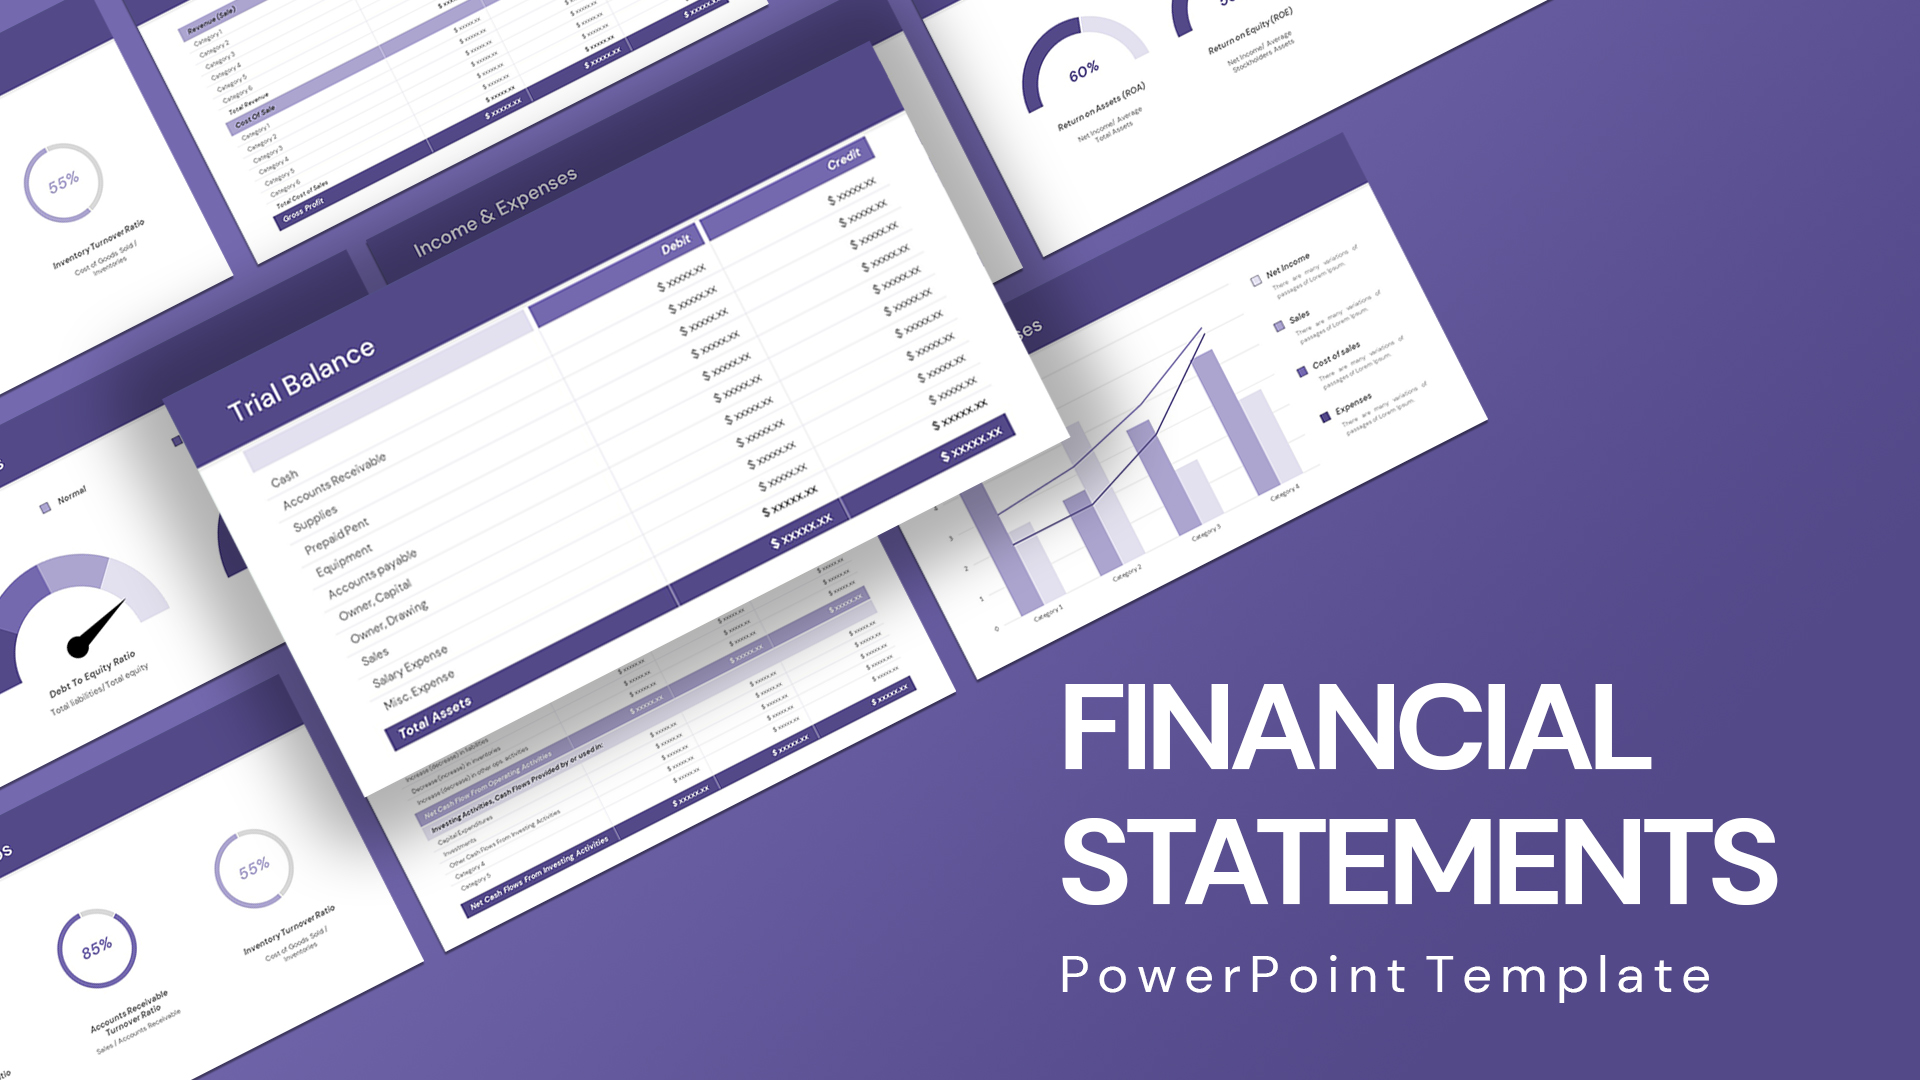
Comprehensive Financial Statements Template for PowerPoint & Google Slides
Finance
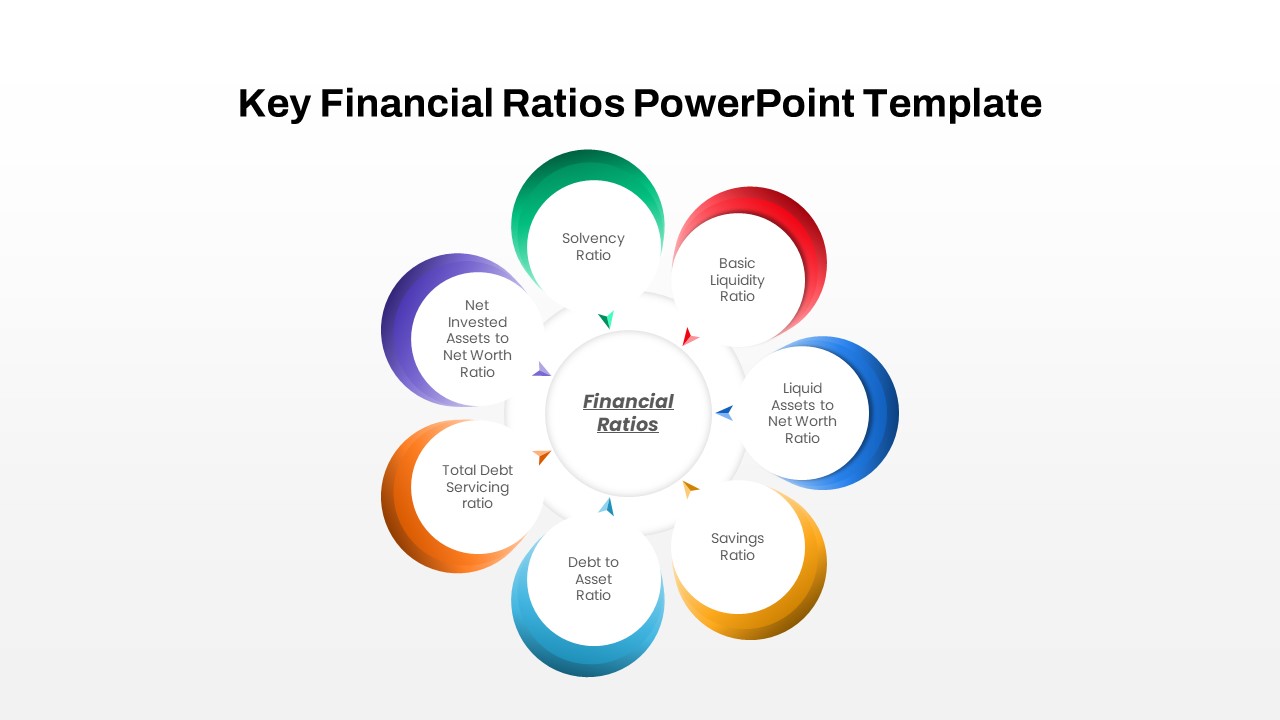
Circular Financial Ratios Infographic Template for PowerPoint & Google Slides
Finance
Sunk Costs Financial Concept Diagram Template for PowerPoint & Google Slides
Finance
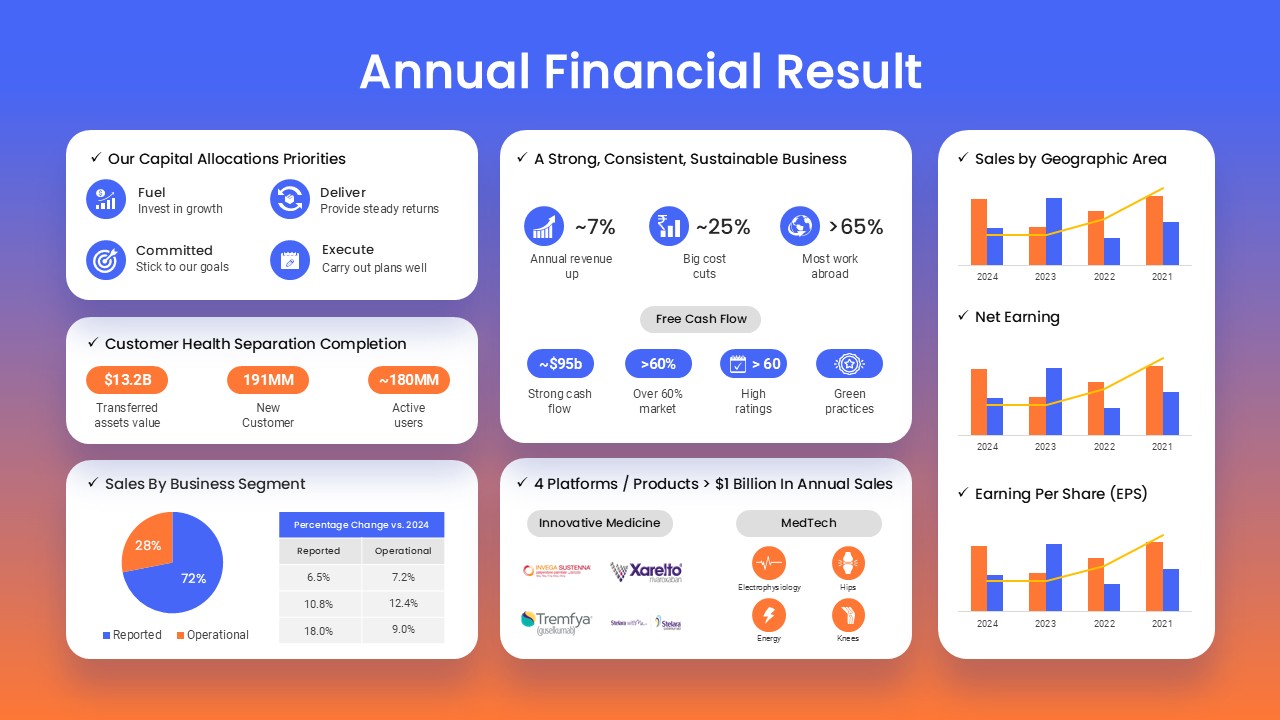
Annual Financial Results Slide Deck Template for PowerPoint & Google Slides
Finance
Dynamic Financial Analysis Line Chart Template for PowerPoint & Google Slides
Finance
Financial Snapshot & Metrics Overview Template for PowerPoint & Google Slides
Finance
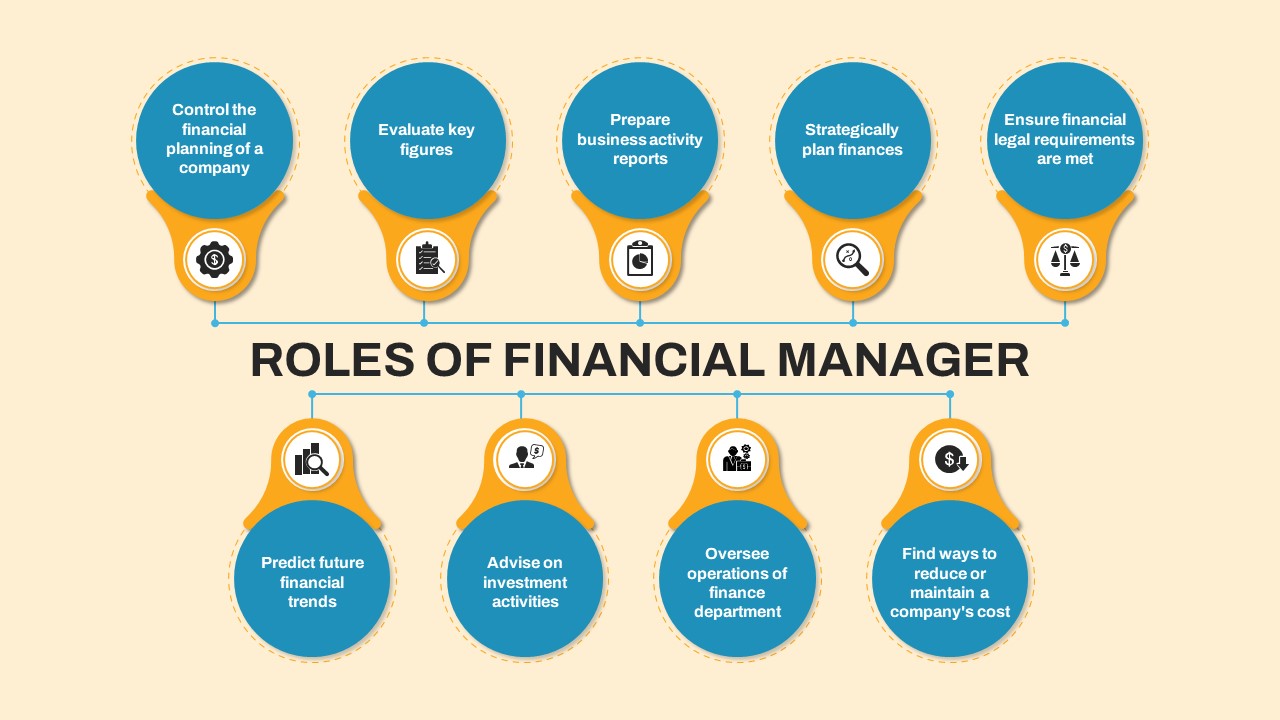
Financial Manager Roles Template for PowerPoint & Google Slides
Process
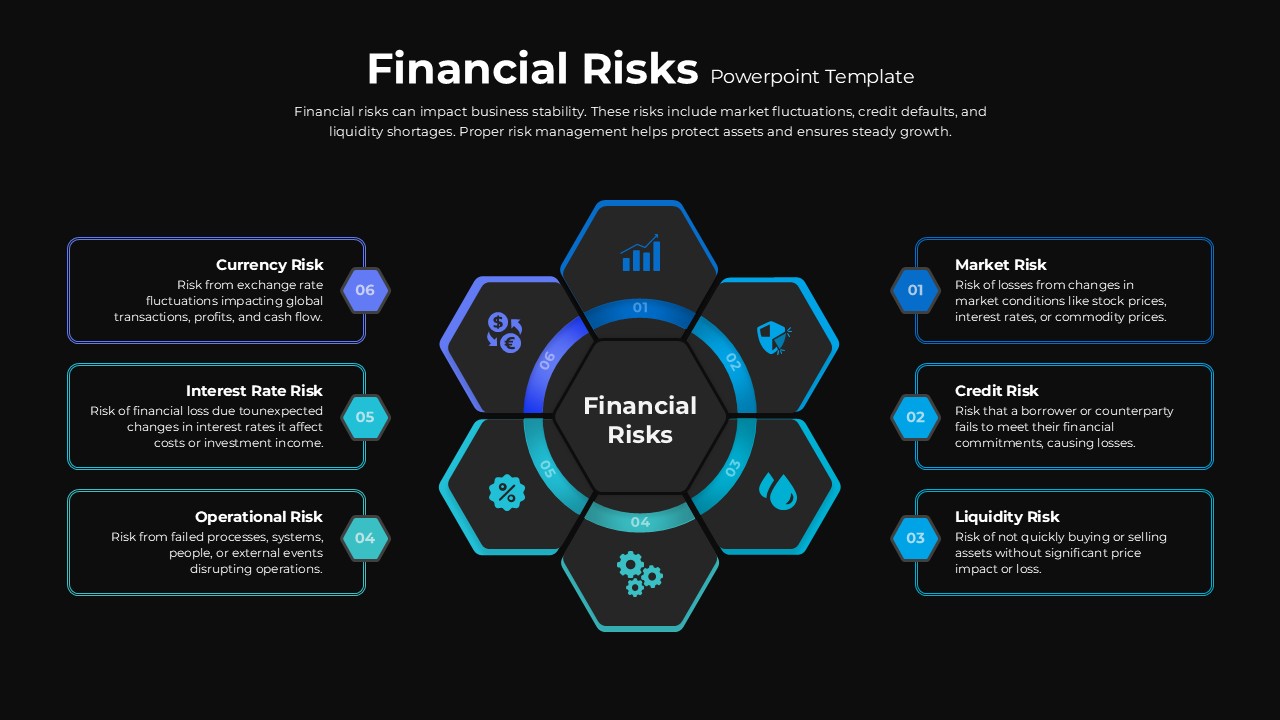
Financial Risks Hexagon Diagram Template for PowerPoint & Google Slides
Risk Management
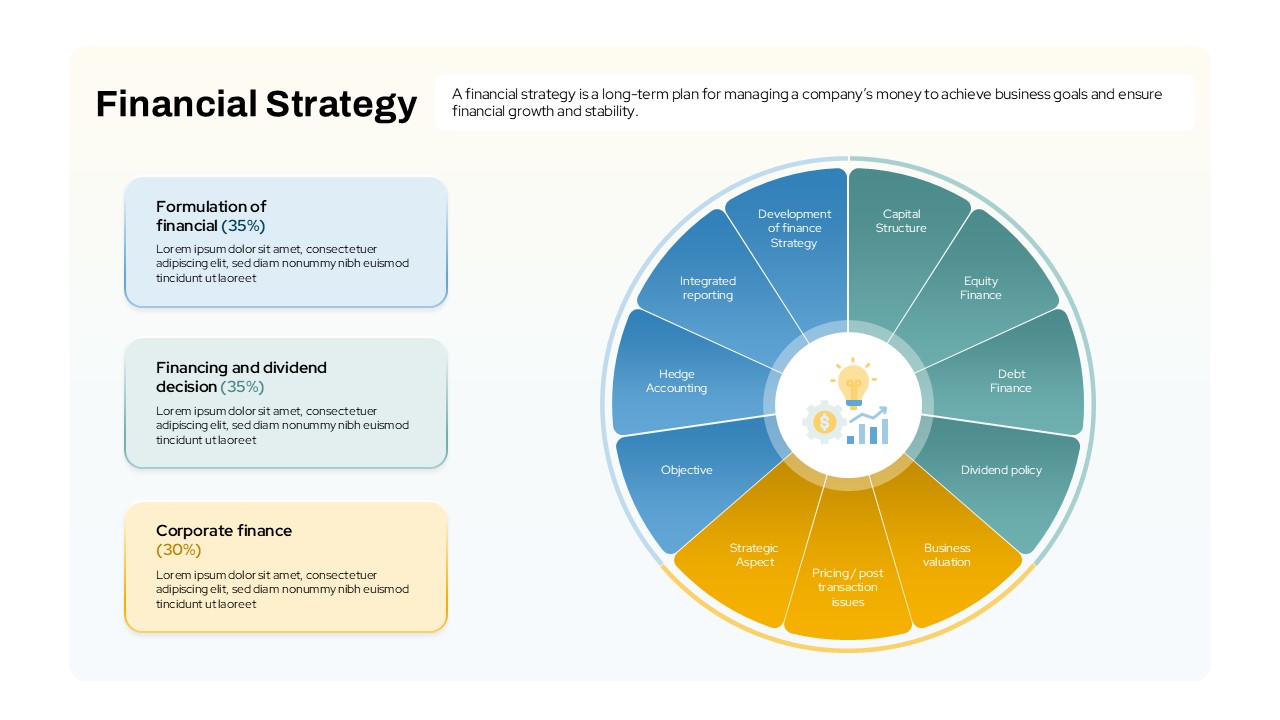
Financial Strategy template for PowerPoint & Google Slides
Business Strategy
Financial Gap Analysis Framework Template for PowerPoint & Google Slides
Finance
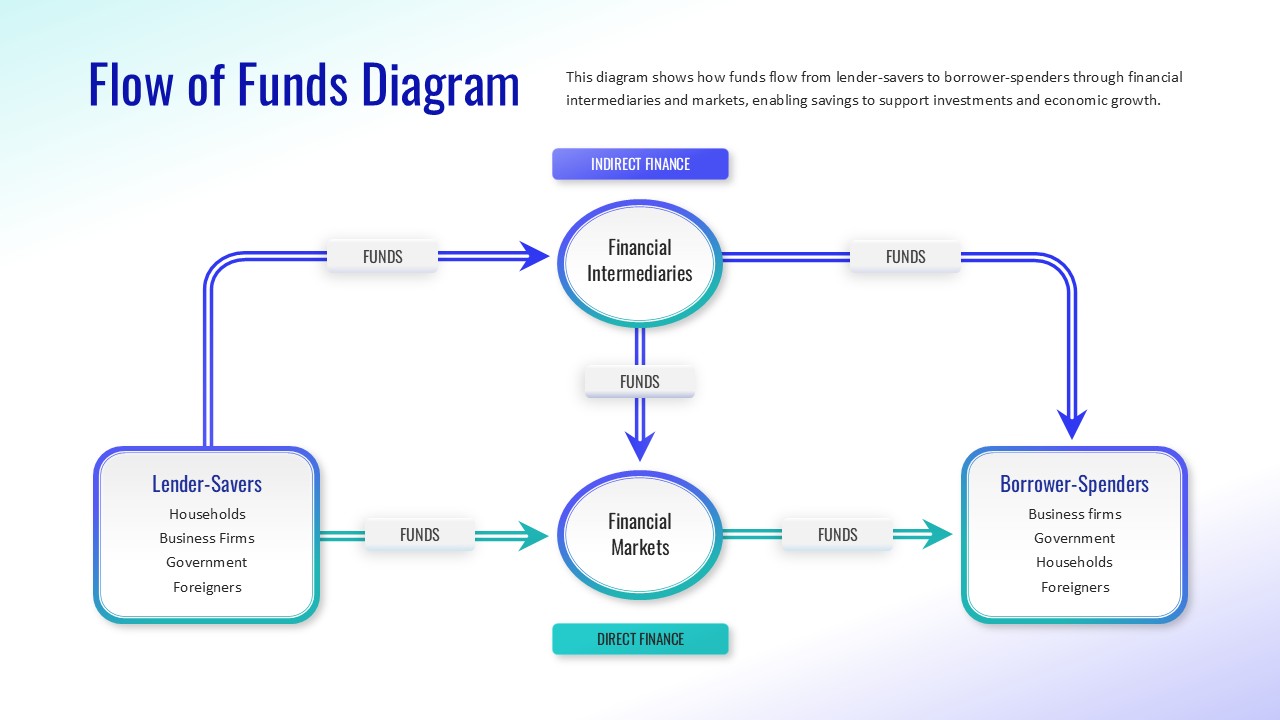
Flow of Funds Financial System Diagram Template for PowerPoint & Google Slides
Finance
Stacked Area Chart with Financial Highlights for PowerPoint & Google Slides
Finance
Free Financial Accounting Overview Slide for PowerPoint & Google Slides
Accounting
Free
Free KPI Dashboard PowerPoint Template for PowerPoint & Google Slides
Charts
Free

Dynamic Data Dashboard Infographic Template for PowerPoint & Google Slides
Bar/Column
Product Usage Analytics Dashboard Chart Template for PowerPoint & Google Slides
Bar/Column
Data Analytics Dashboard Design template for PowerPoint & Google Slides
Bar/Column
Business Dashboard Analytics & KPIs Template for PowerPoint & Google Slides
Bar/Column
Professional Team Efficiency Dashboard Template for PowerPoint & Google Slides
Business Report
Website Performance Dashboard template for PowerPoint & Google Slides
Charts
Employee Skill Analysis Dashboard Template for PowerPoint & Google Slides
Employee Performance
Net Promoter Score Dashboard Template for PowerPoint & Google Slides
Customer Experience
Modern Project Status Report Dashboard Template for PowerPoint & Google Slides
Project Status
Performance KPI Dashboard Slide Template for PowerPoint & Google Slides
Business Report
KPI Dashboard template for PowerPoint & Google Slides
Business Report
KPI Dashboard Data Overview Slide Template for PowerPoint & Google Slides
Bar/Column
Professional Nurse Infographic Dashboard Template for PowerPoint & Google Slides
Nursing
Interactive Benchmarking Gauge Dashboard Template for PowerPoint & Google Slides
Pie/Donut
Heat Map Risk Matrix Dashboard Template for PowerPoint & Google Slides
Comparison Chart
Colorful Project Status Dashboard Template for PowerPoint & Google Slides
Project Status
Weekly Update Schedule Dashboard Template for PowerPoint & Google Slides
Agenda
Project Status Dashboard Template for PowerPoint & Google Slides
Project Status
Weekly Status Report Dashboard Template for PowerPoint & Google Slides
HR
Free Metro UI Dashboard Infographic Template for PowerPoint & Google Slides
Business Report
Free
One Pager Annual Report Dashboard Template for PowerPoint & Google Slides
Business Report
Social Media Analytics Dashboard Template for PowerPoint & Google Slides
Digital Marketing
Social Media Statistics 2023 Dashboard Template for PowerPoint & Google Slides
Comparison
Mastodon Metrics Infographic Dashboard Template for PowerPoint & Google Slides
Business Report
Soccer Match Stats Dashboard Slide Template for PowerPoint & Google Slides
Graphics
Employee Satisfaction Survey Dashboard Template for PowerPoint & Google Slides
Employee Performance
Customer Satisfaction KPI Dashboard Template for PowerPoint & Google Slides
Customer Experience
Weekly Project Status Dashboard Template for PowerPoint & Google Slides
Project Status
Freight Logistics Dashboard Infographic Template for PowerPoint & Google Slides
Comparison Chart
Cost Cutting Savings Dashboard Template for PowerPoint & Google Slides
Pie/Donut
Macroeconomic Indicators Dashboard Template for PowerPoint & Google Slides
PEST
Michigan County Map with KPI Dashboard Template for PowerPoint & Google Slides
World Maps
Purchasing KPI Metrics Dashboard Template for PowerPoint & Google Slides
Business Report
Inventory Management Dashboard Template for PowerPoint & Google Slides
Process
Digital Marketing KPIs Dashboard Dark Template for PowerPoint & Google Slides
Business Report
Employee Performance Metrics Dashboard Template for PowerPoint & Google Slides
Employee Performance
Turnover Analysis Dashboard Template for PowerPoint & Google Slides
Employee Performance
Customer Interview Insights Dashboard Template for PowerPoint & Google Slides
Customer Experience
Account Overview Dashboard template for PowerPoint & Google Slides
Business
Project Status Update Dashboard Table Template for PowerPoint & Google Slides
Project Status
Cohort Analysis Retention Dashboard Template for PowerPoint & Google Slides
Comparison Chart
Project Status Dashboard Template for PowerPoint & Google Slides
Project Status
Dashboard Project Status Template for PowerPoint & Google Slides
Project Status
Project Status Dashboard with RAG Legend Template for PowerPoint & Google Slides
Project Status
End of Year Review Dashboard Template for PowerPoint & Google Slides
Business Report
Construction Project Dashboard Template for PowerPoint & Google Slides
Project
Employee Headcount Dashboard Report Template for PowerPoint & Google Slides
Employee Performance
4DX Scoreboard KPI Gauge Dashboard Template for PowerPoint & Google Slides
Business Strategy