Profit and Loss Chart Infographic for PowerPoint Presentation
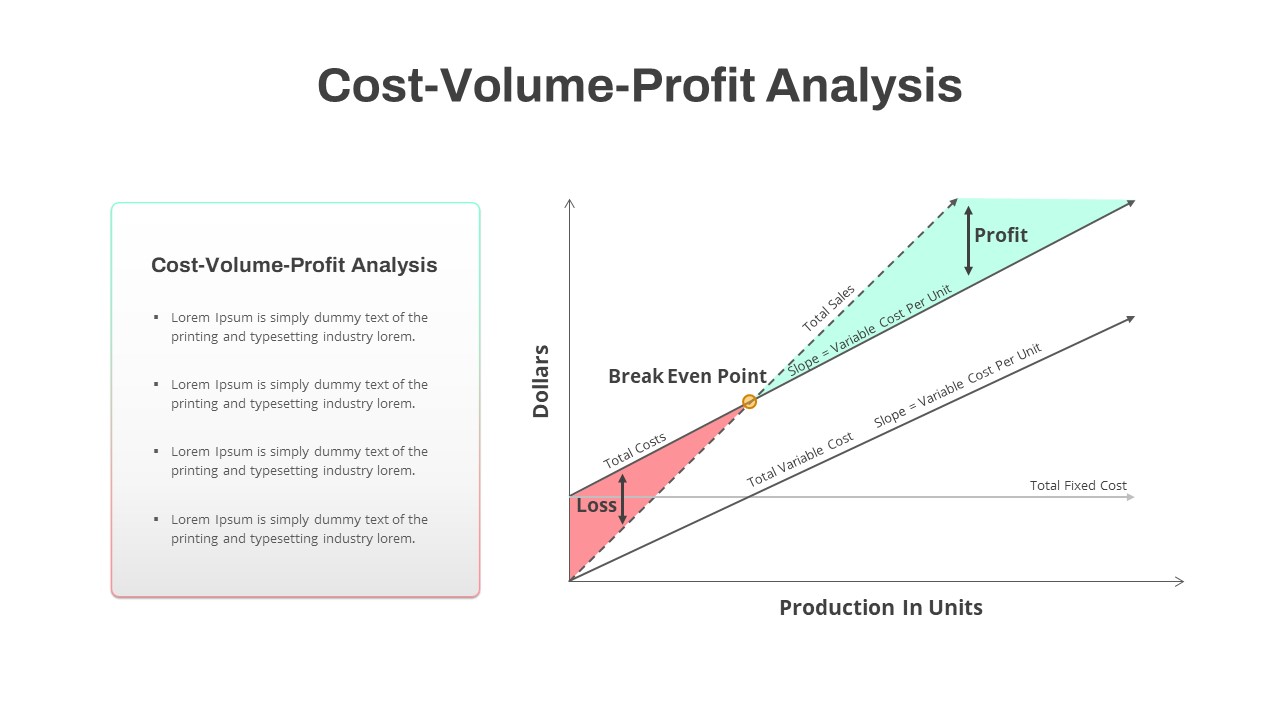
Two section comparison slide of profit and loss chart infographics is modern bullet point creation that shows the two elements of an activity or a process. This is a high-impactful arrow PowerPoint presentation crafted as a comparison slide of production descriptions. This template is used for profit and loss reports of an organization with simple graphical techniques. If you would like to give statistics of profit and loss, it may be easy to understand by this simple infographic presentation template. So, this is a user-friendly design of a profit and loss presentation template, giving all valuable accounts in a single easy-to-understand format. No matter, whatever your message might be, this will help you present two sides of a coin.
Profit and loss chart infographic for PowerPoint presentation is the generic slide for comparison presentation. Apart from the profit and loss presentation, the users can display pros and cons, dos and don’ts, likes and dislikes, similarities and differences, and have many other options to display negative and positive sides of an action or process. For example, the wide use of the internet and computers has been spawned many pros and cons related to human development and societal development. On the one hand, it improves the mode of communication through social media and other network options. On the other hand, it generates a lot of ethical and privacy issues. Hence, the profit and loss PowerPoint template can illustrate the pros and cons of different concepts and fields.
Profit and loss report PowerPoint chart is an editable common presentation diagram that showcases four elements on both sides. Comparison PowerPoint template allows the user to show product features by comparing the nearest competitive product. The two-slide template is a traditional PowerPoint for a business presentation, fully projecting the written fonts all over the design. So, when users’ need more text areas, the presenters could be downloading profit and loss ppt presentation slides to meet purposes.
Login to download this file


