Circular Financial Ratios Infographic Template for PowerPoint & Google Slides


Description
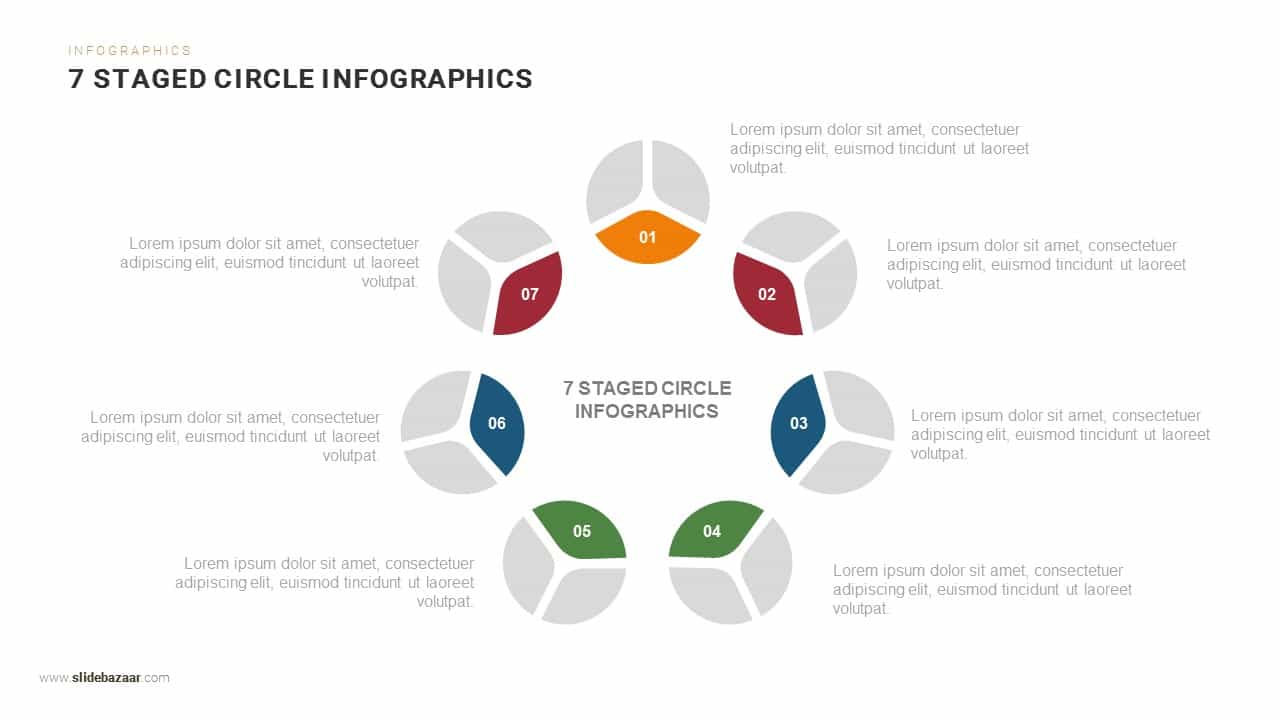
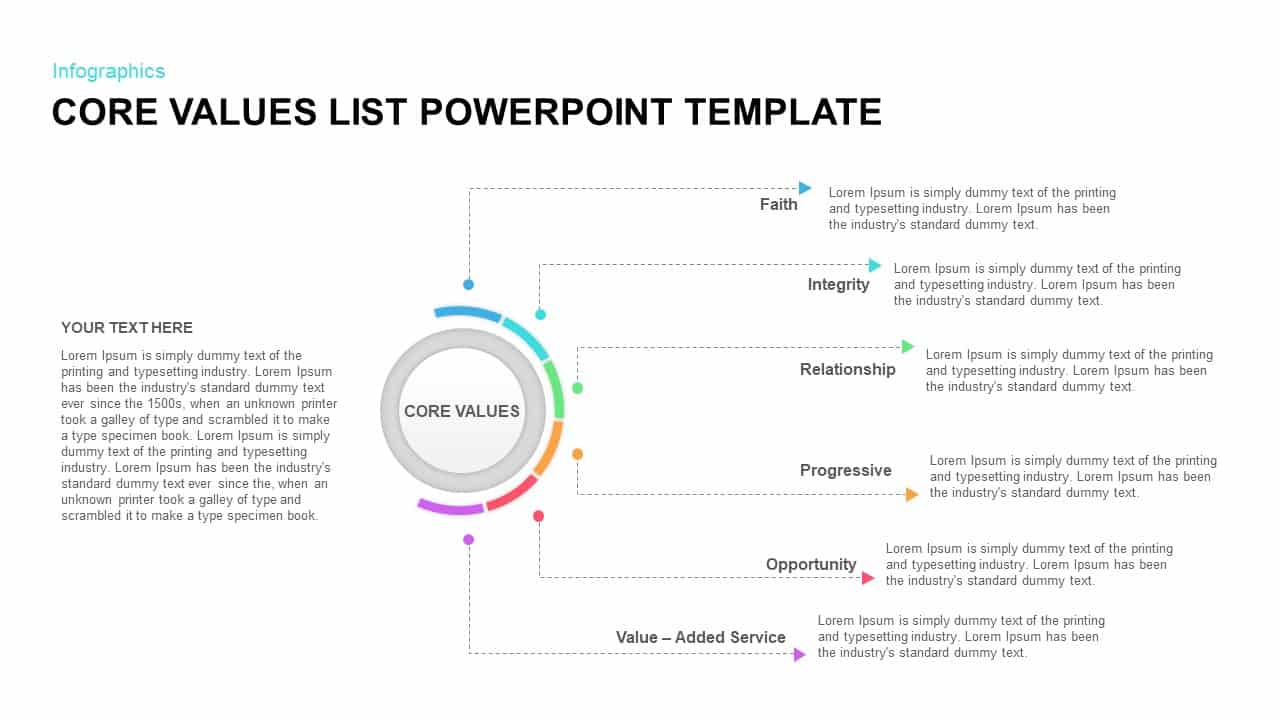
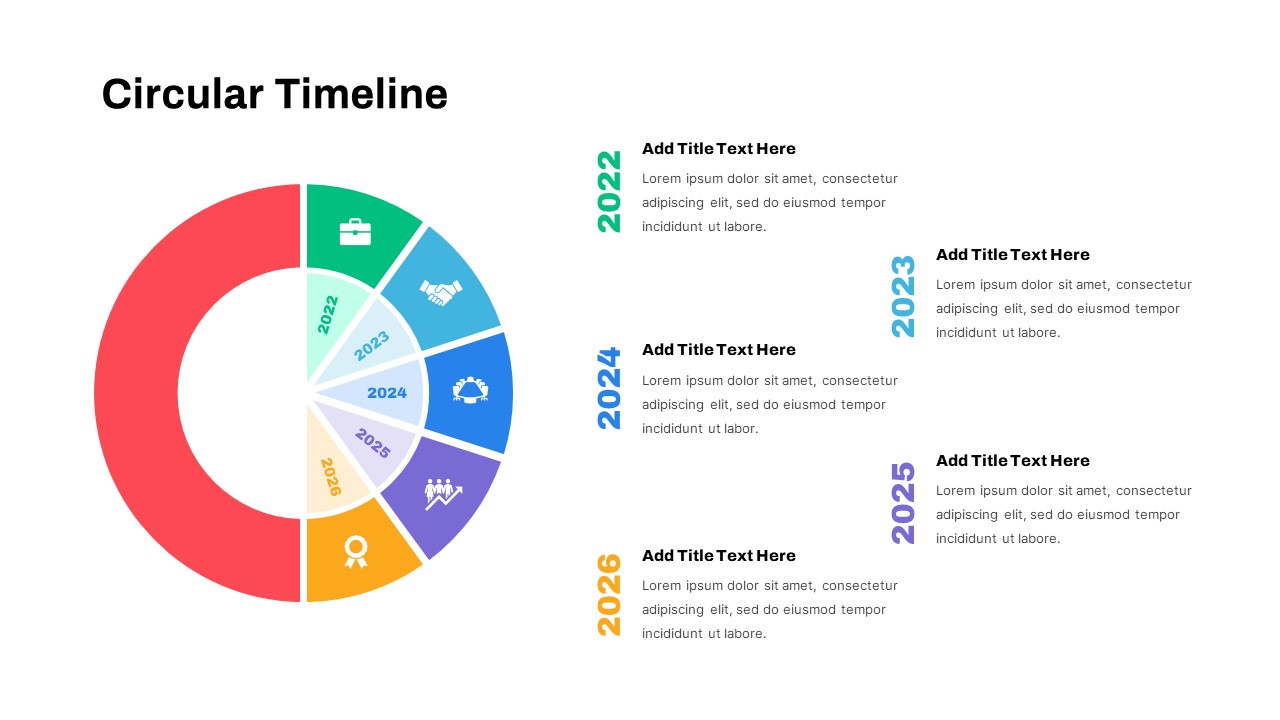
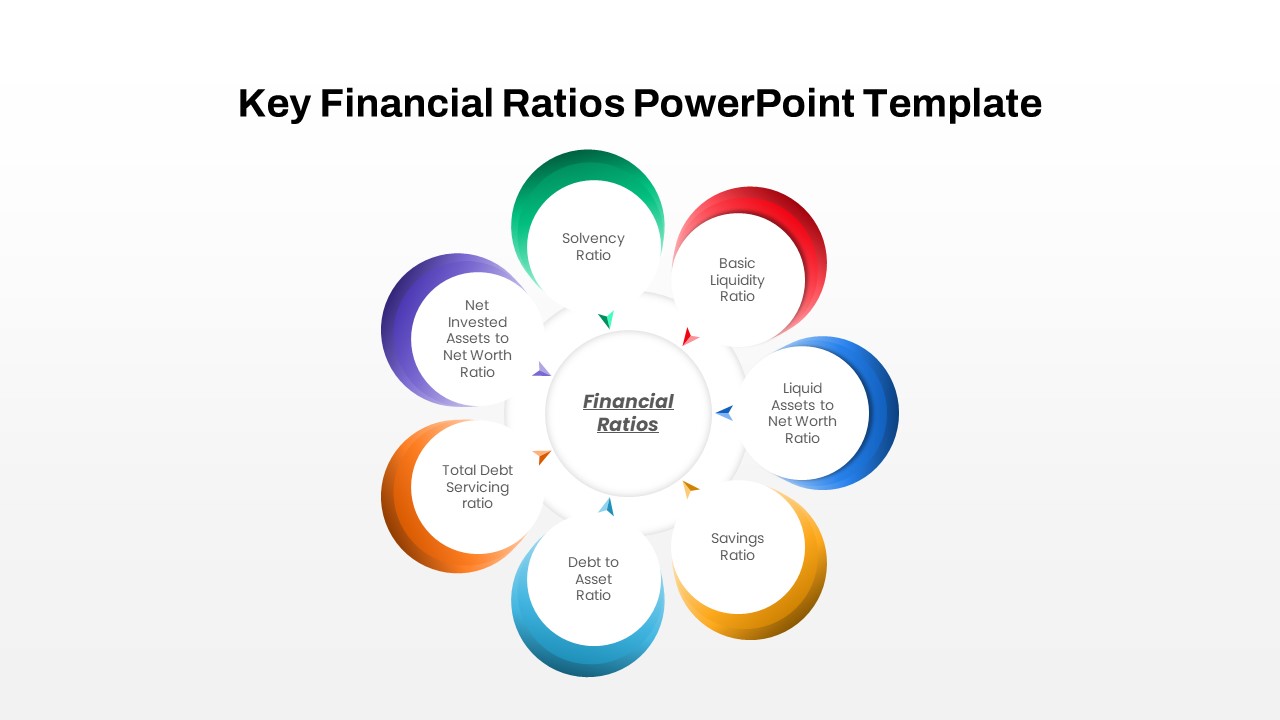
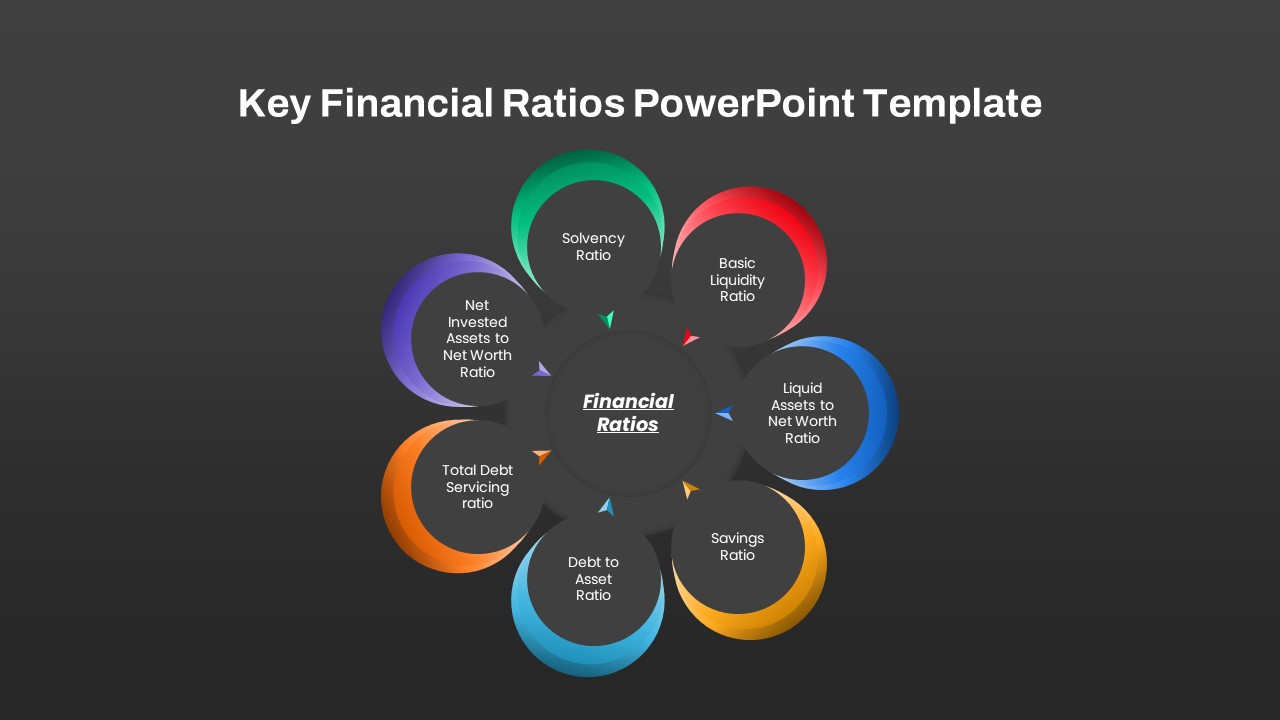
This infographic slide presents a clear, circular arrangement of seven key financial ratios in vibrant gradient segments surrounding a central hub. Each semi-circular shape—rendered in green, red, blue, yellow, teal, orange, and purple—encapsulates a distinct ratio such as solvency, basic liquidity, liquid assets to net worth, savings, debt-to-asset, total debt servicing, and net invested assets to net worth. Crisp vector outlines and subtle shadows add depth, while a gentle gray gradient background maintains focus on the data.
Built on editable master slides for PowerPoint and Google Slides, every element is fully customizable. Swap ratio labels, adjust gradient fills, and recolor individual segments or apply global theme colors in seconds. The central circle can host your slide title or icon, and the consistent use of vector shapes ensures infinite scalability without pixelation. Placeholder text styles preserve typographic hierarchy, while layered objects allow drag-and-drop rearrangement.
The slide also includes an optional legend placeholder and ratio-specific icons for streamlined annotations. Leverage PowerPoint’s linked data features or Google Slides’ linked charts to synchronize values automatically, ensuring the infographic updates when underlying figures change. Accessibility-focused color contrasts and legible typography guarantee readability for diverse audiences, and the lightweight file minimizes load times on any device. Predefined aspect ratios and hidden guide lines maintain layout precision, while vector elements support high-resolution printing for handouts or posters.
Whether you need to highlight performance indicators in an investor pitch, board meeting, or financial workshop, this circular financial ratios infographic delivers a professional, data-driven visual. The gradient style adds modern flair, and the structured layout guides viewers through complex metrics at a glance.
Who is it for
Finance professionals, analysts, and CFOs will benefit from this infographic when presenting key performance indicators to stakeholders. Consultants, educators, and MBA students can leverage the circular design to teach ratio fundamentals or illustrate comparative analyses.
Other Uses
Beyond quarterly reports and investor decks, repurpose this slide for KPI dashboards, budget reviews, or strategic planning sessions. Adapt the gradient segments to highlight regional metrics, product performance, or risk assessments in any business context.
Login to download this file

Item ID
SB04169
Related Templates

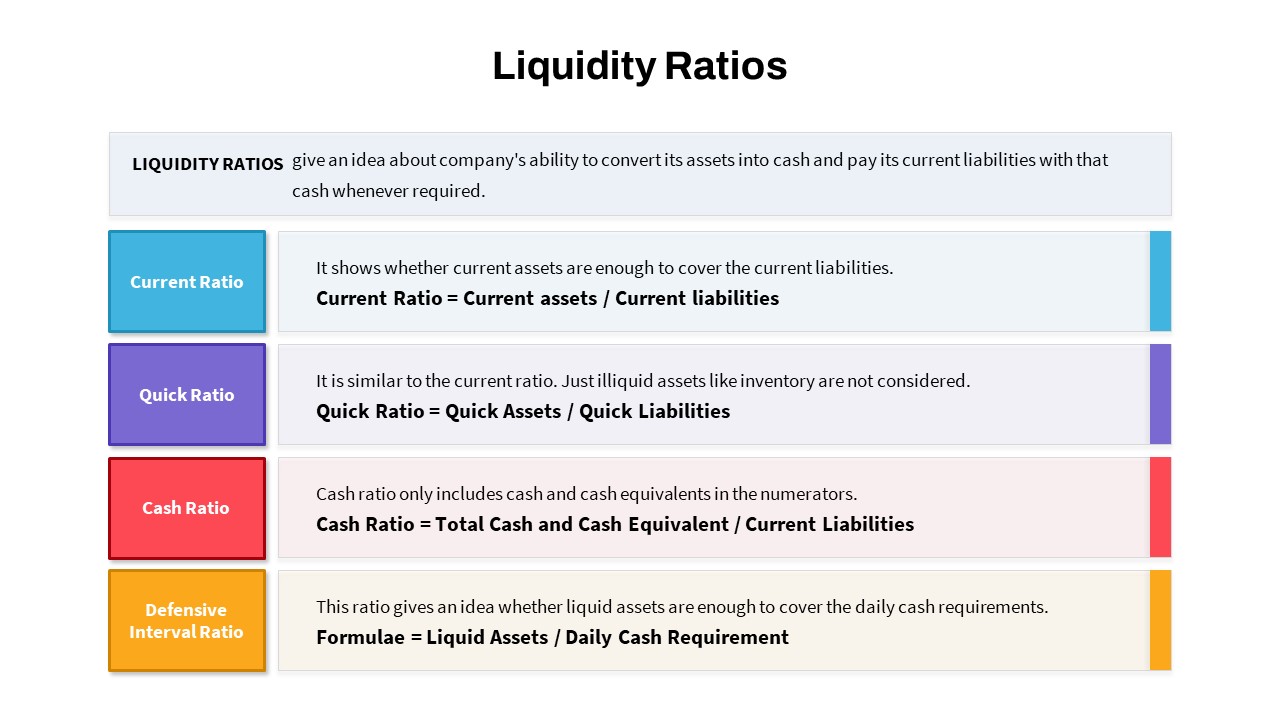
Liquidity Ratios Infographic Slide Template for PowerPoint & Google Slides
Finance
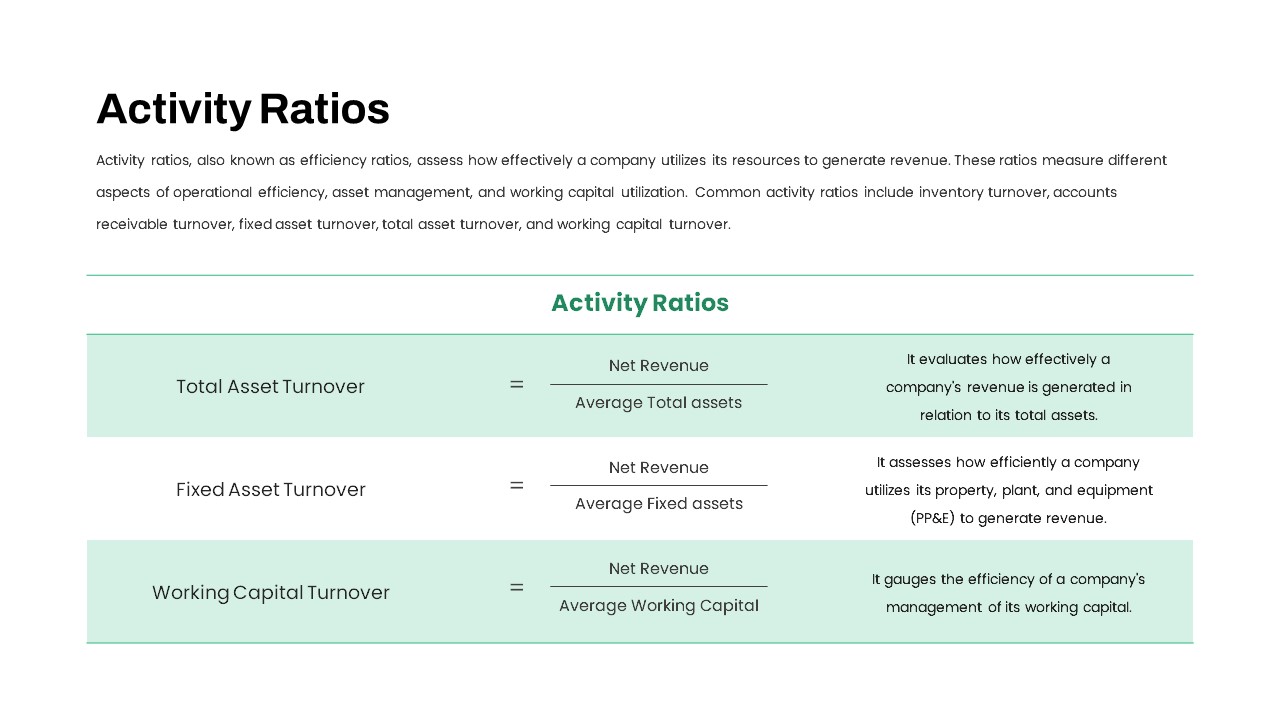
Activity Ratios Formula Table Slide Template for PowerPoint & Google Slides
Comparison Chart
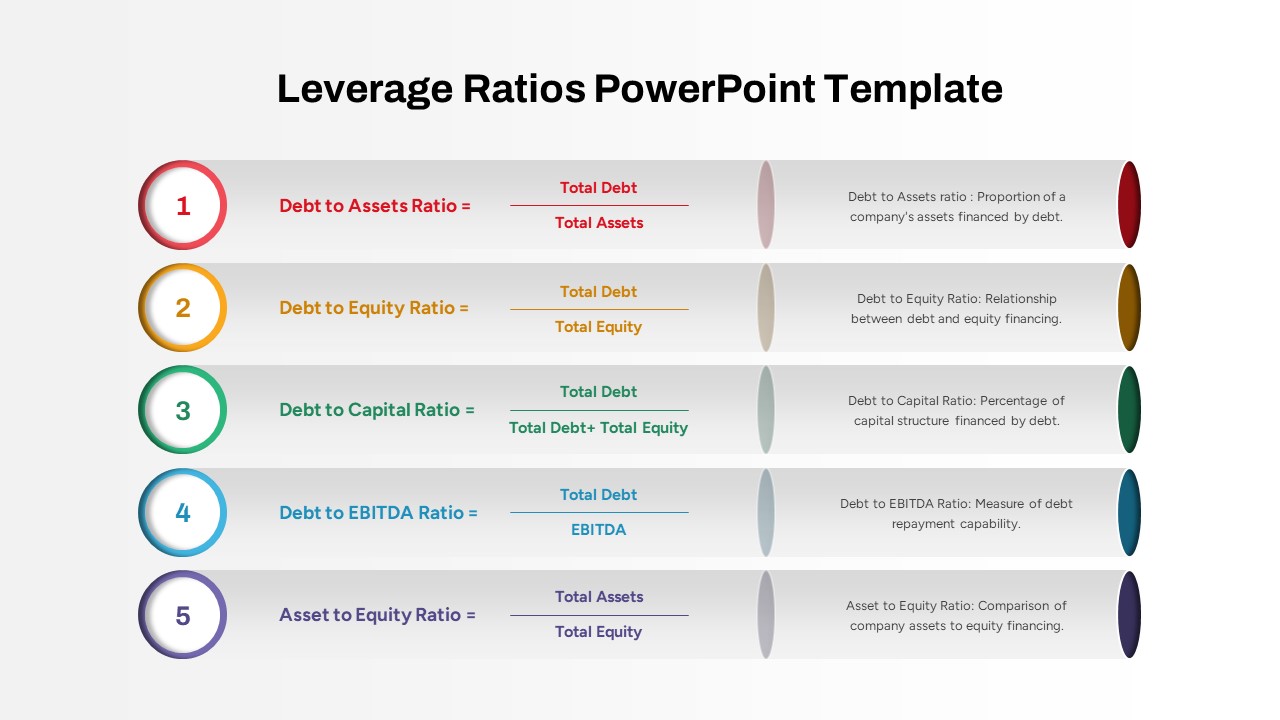
Five Key Leverage Ratios Overview Template for PowerPoint & Google Slides
Finance
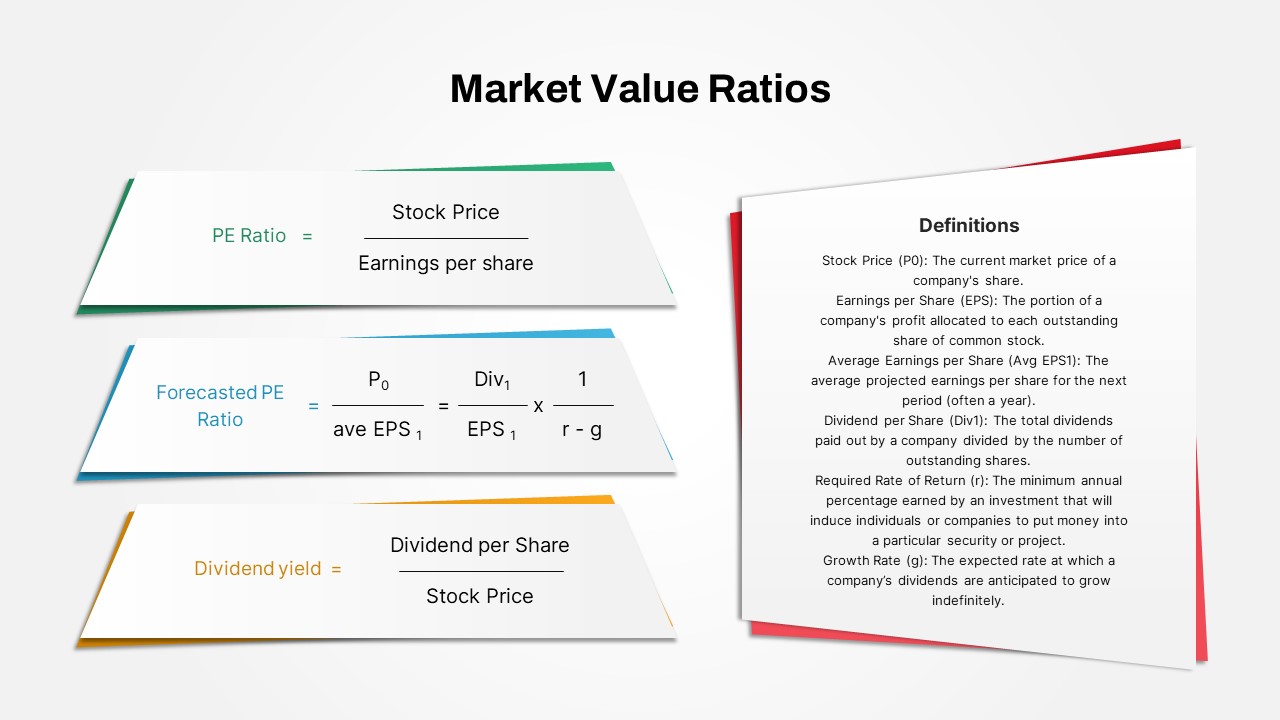
Market Value Ratios Formula Overview Template for PowerPoint & Google Slides
Business Report
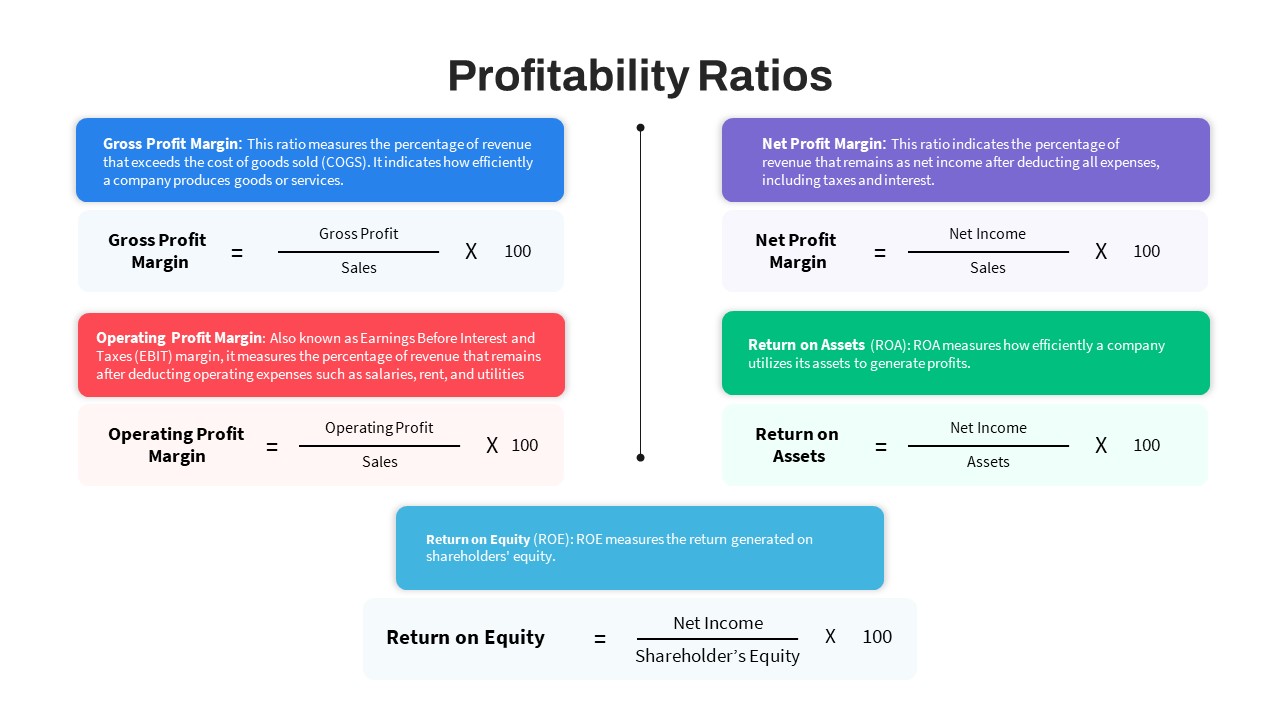
Profitability Ratios Formula Overview Template for PowerPoint & Google Slides
Revenue
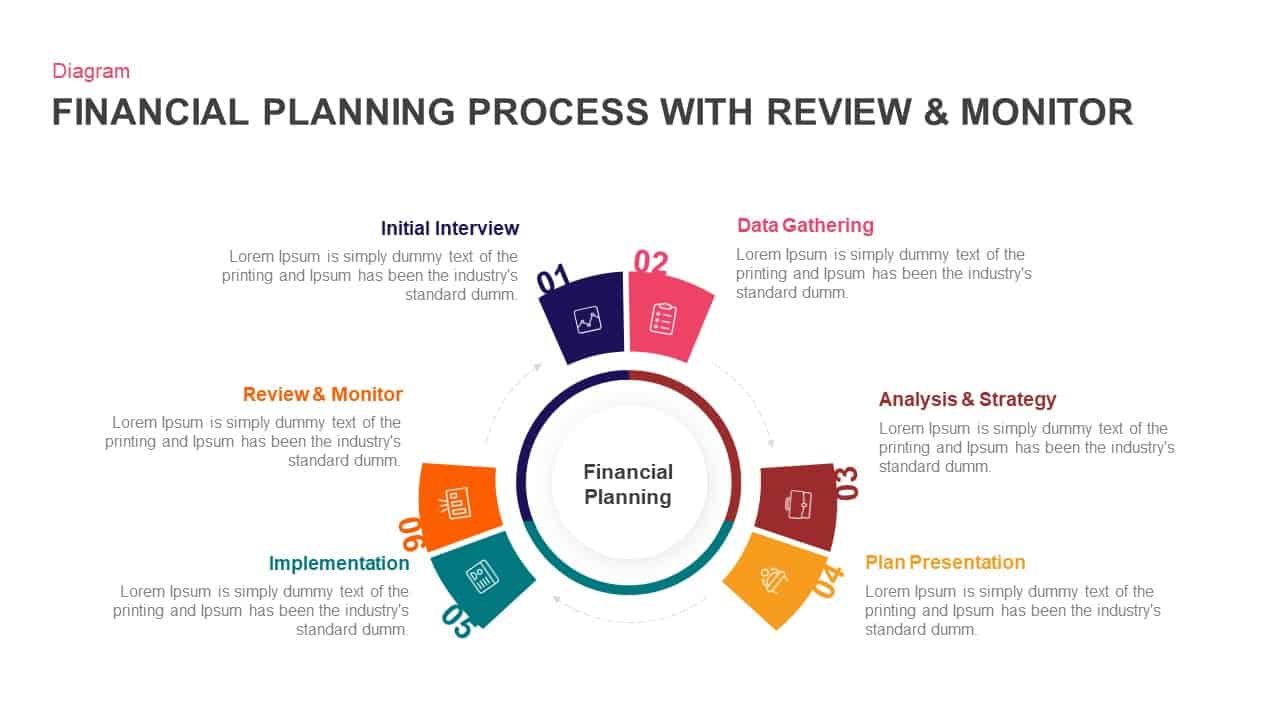
Financial Planning Circular Process Template for PowerPoint & Google Slides
Process
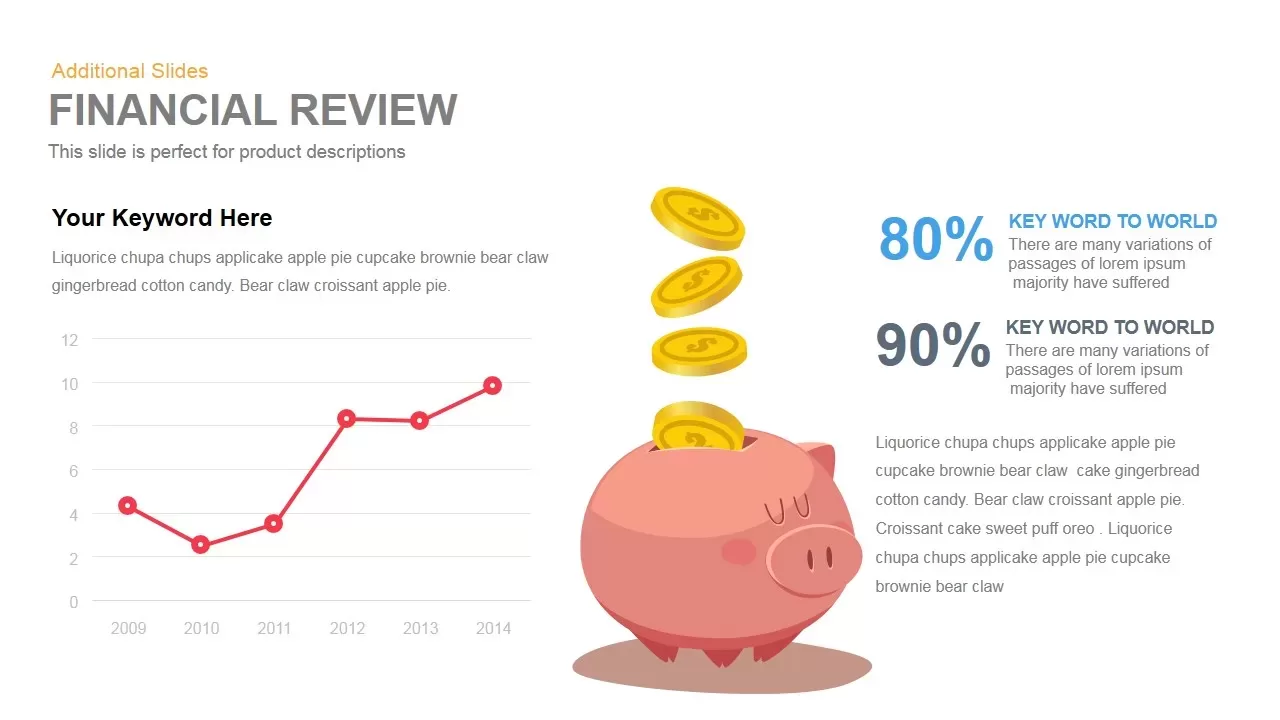
Financial Review template for PowerPoint & Google Slides
Finance

Money Metaphor Financial Overview Template for PowerPoint & Google Slides
Finance
5-Stage Financial Growth Timeline Template for PowerPoint & Google Slides
Timeline
Financial Agreement Signing Flow Diagram Template for PowerPoint & Google Slides
Process
Financial Report Metaphor Illustration Template for PowerPoint & Google Slides
Finance
Income Statement Financial Reporting Template for PowerPoint & Google Slides
Finance
Income Statement Financial Summary Template for PowerPoint & Google Slides
Business Report
Income Statement Financial Report Template for PowerPoint & Google Slides
Business Report
Corporate Financial Auditing Service Template for PowerPoint & Google Slides
Finance

Financial Advisory Service Pitch Deck Template for PowerPoint & Google Slides
Finance
Financial Institutions Presentation Template for PowerPoint & Google Slides
Company Profile
Financial Consulting Company Profile Template for PowerPoint & Google Slides
Finance

Comprehensive Financial Statements Template for PowerPoint & Google Slides
Finance
Free Monthly Financial Dashboard & Cash Flow Template for PowerPoint & Google Slides
Business Report
Free
Sunk Costs Financial Concept Diagram Template for PowerPoint & Google Slides
Finance
Quarterly Financial Summary Dashboard Template for PowerPoint & Google Slides
Business Report
Banking Financial Overview Dashboard Template for PowerPoint & Google Slides
Finance
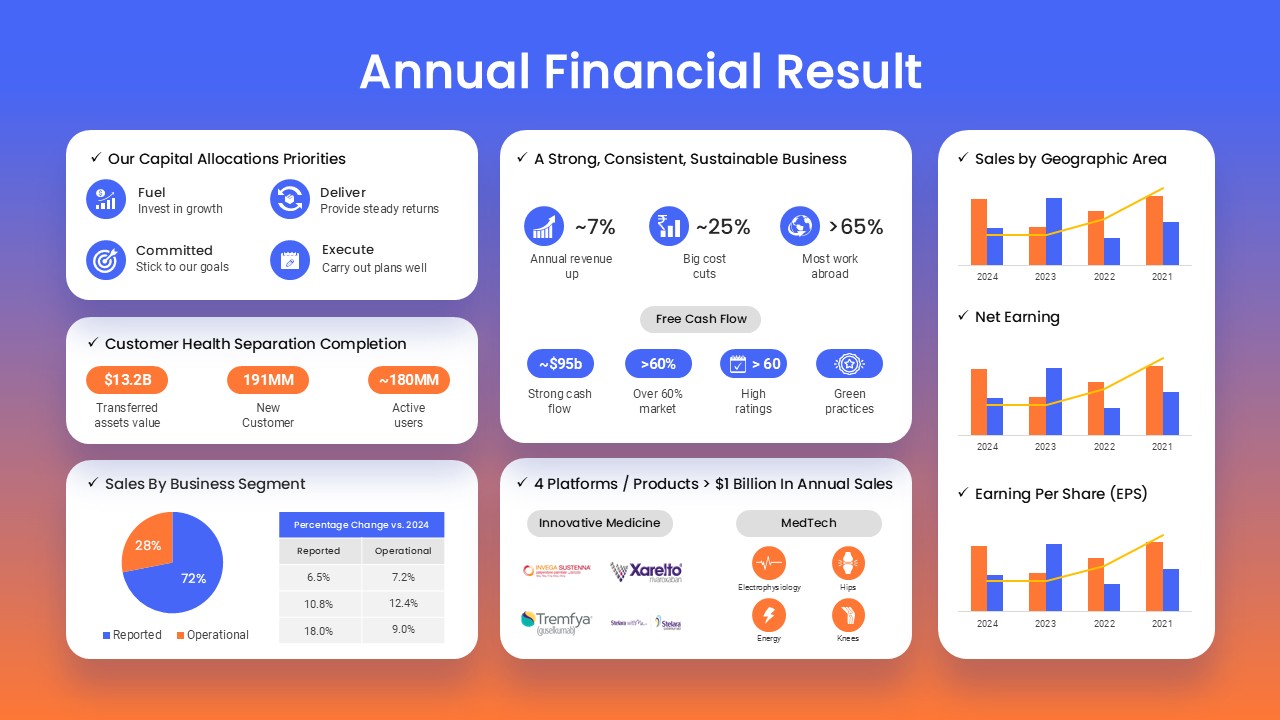
Annual Financial Results Slide Deck Template for PowerPoint & Google Slides
Finance
Dynamic Financial Analysis Line Chart Template for PowerPoint & Google Slides
Finance
Financial Snapshot & Metrics Overview Template for PowerPoint & Google Slides
Finance
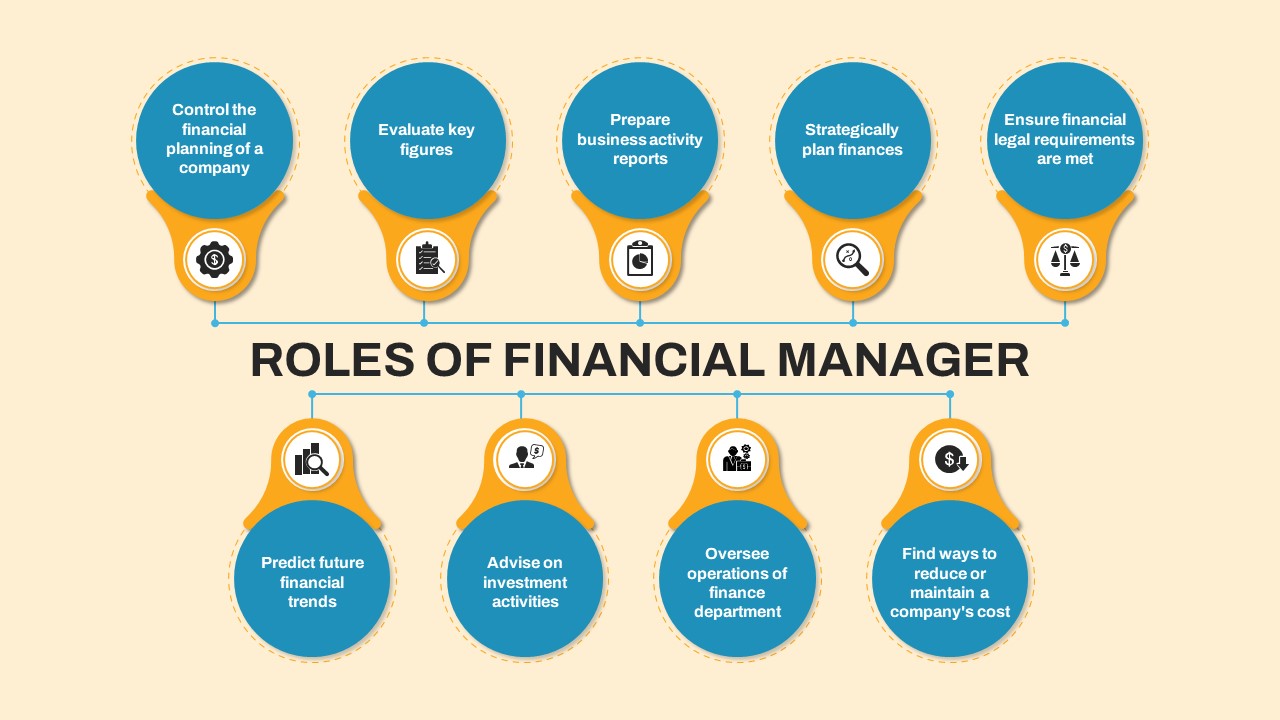
Financial Manager Roles Template for PowerPoint & Google Slides
Process
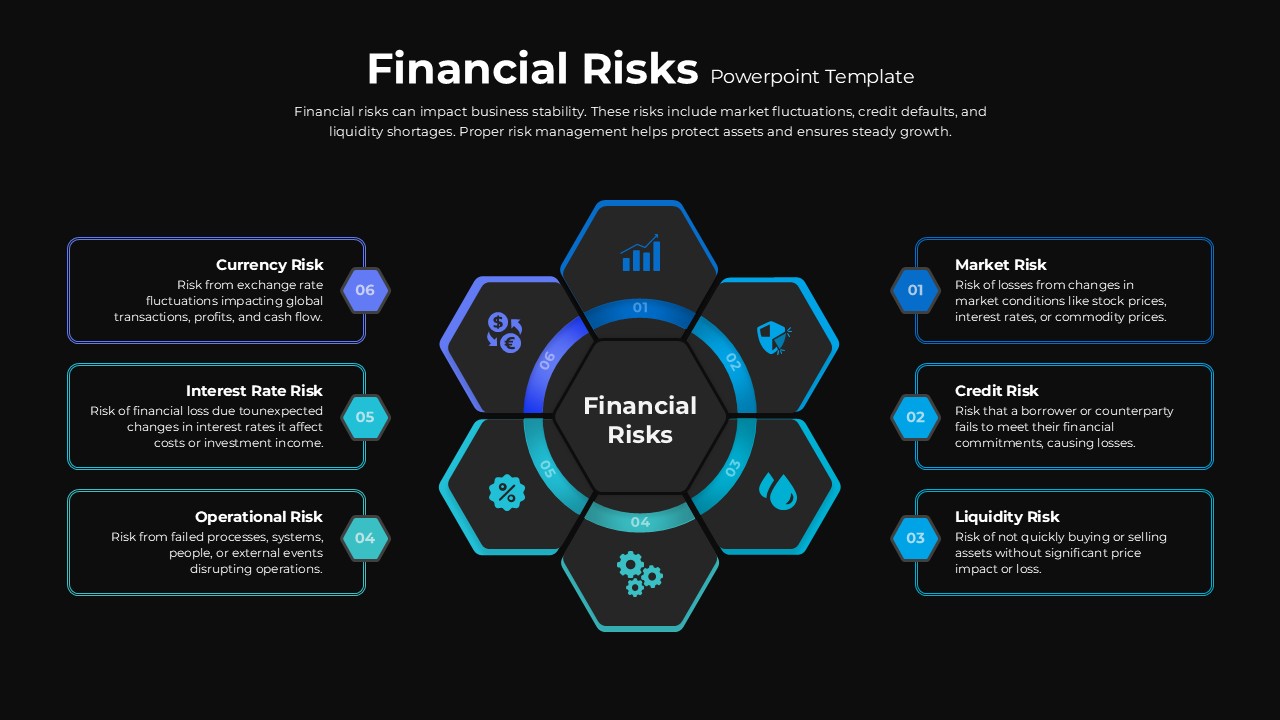
Financial Risks Hexagon Diagram Template for PowerPoint & Google Slides
Risk Management
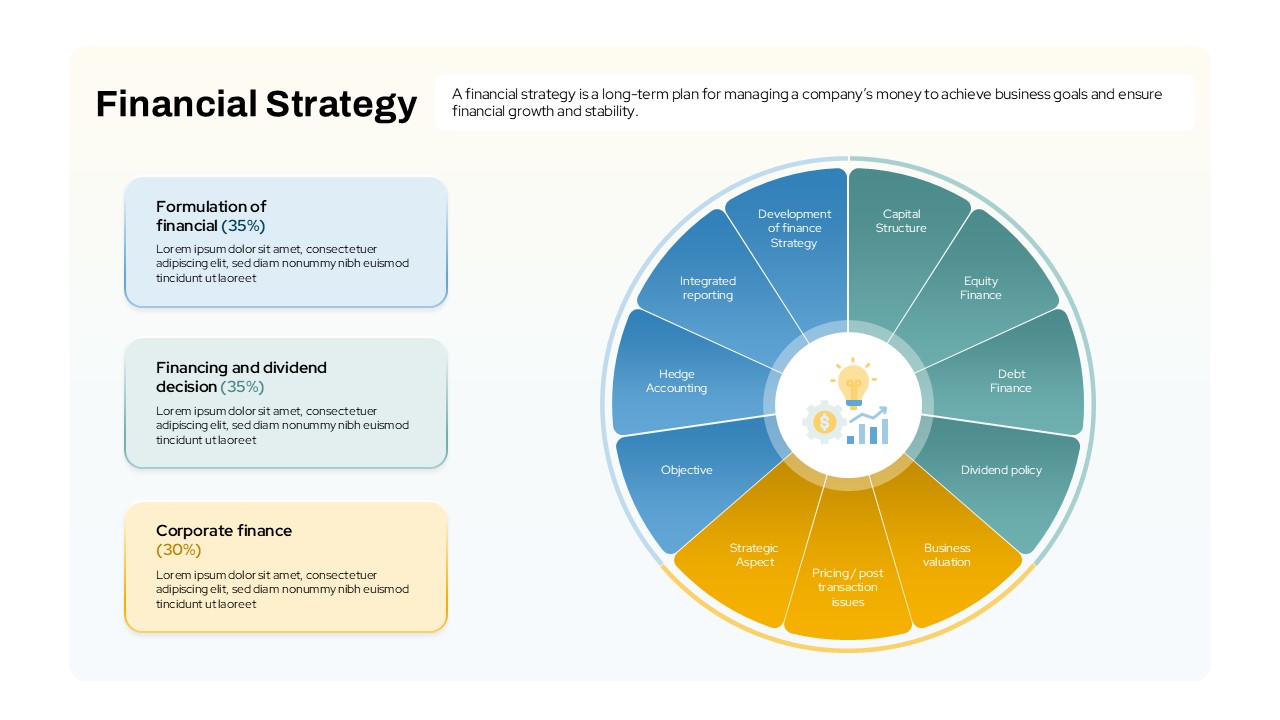
Financial Strategy template for PowerPoint & Google Slides
Business Strategy
Financial Gap Analysis Framework Template for PowerPoint & Google Slides
Finance
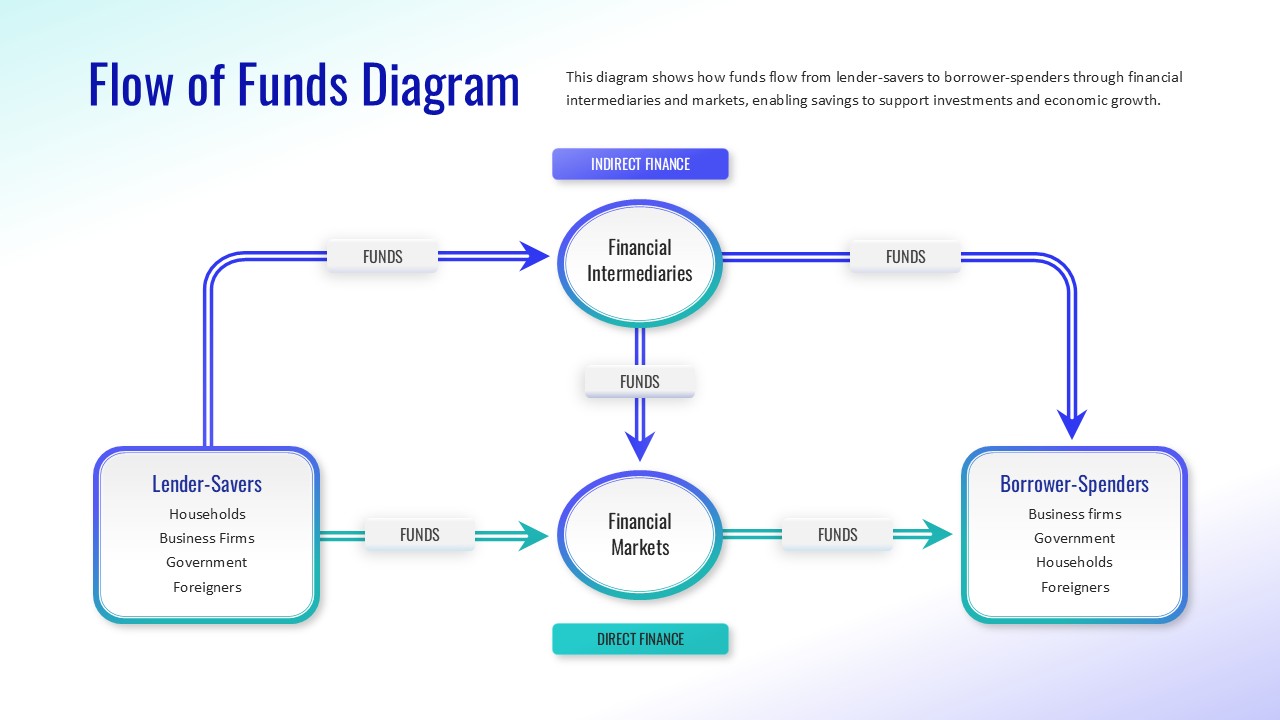
Flow of Funds Financial System Diagram Template for PowerPoint & Google Slides
Finance
Stacked Area Chart with Financial Highlights for PowerPoint & Google Slides
Finance
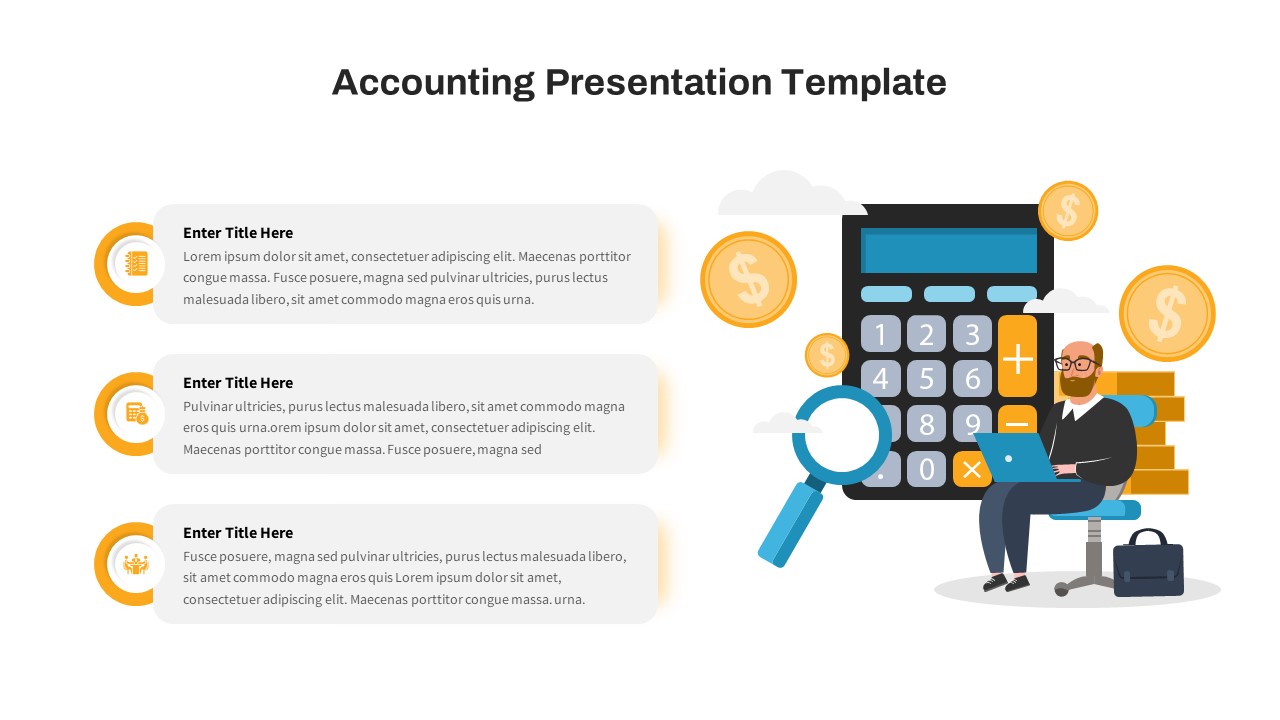
Free Financial Accounting Overview Slide for PowerPoint & Google Slides
Accounting
Free
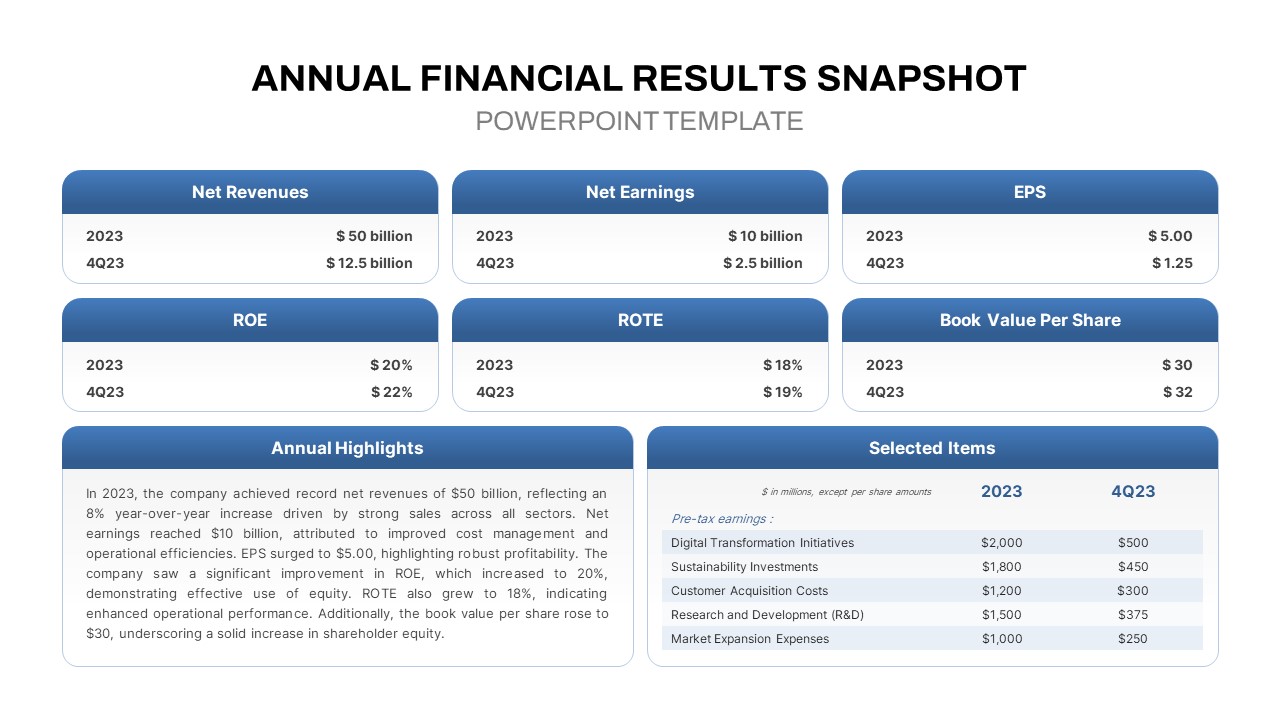
Annual Financial Results Snapshot Template for PowerPoint & Google Slide
Finance
Six Section Circular Infographic Diagram Template for PowerPoint & Google Slides
Circular
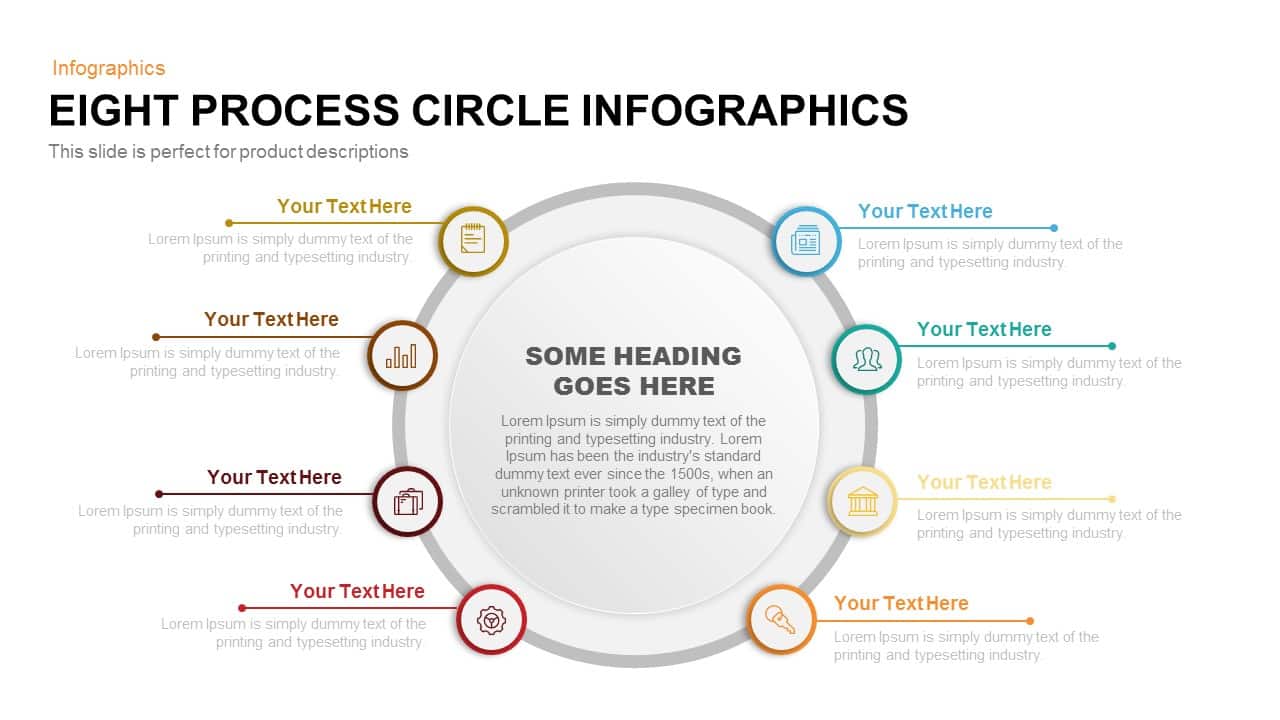
Eight-Stage Circular Process Infographic Template for PowerPoint & Google Slides
Circular
Seven-Stage Circular Infographic Template for PowerPoint & Google Slides
Circular
Six-Segment Circular Hub Infographic Template for PowerPoint & Google Slides
Circular
Eight-Step Circular Diagram Infographic Template for PowerPoint & Google Slides
Circular
Five-Stage Circular Infographic Diagram Template for PowerPoint & Google Slides
Process
Four-Stage Circular Diagram Infographic Template for PowerPoint & Google Slides
Circular
5 Stage Circular Timeline Infographic Template for PowerPoint & Google Slides
Timeline
4 Factors Circular Diagram Infographic Template for PowerPoint & Google Slides
Circular
Circular CRM Process Diagram Infographic Template for PowerPoint & Google Slides
Circular
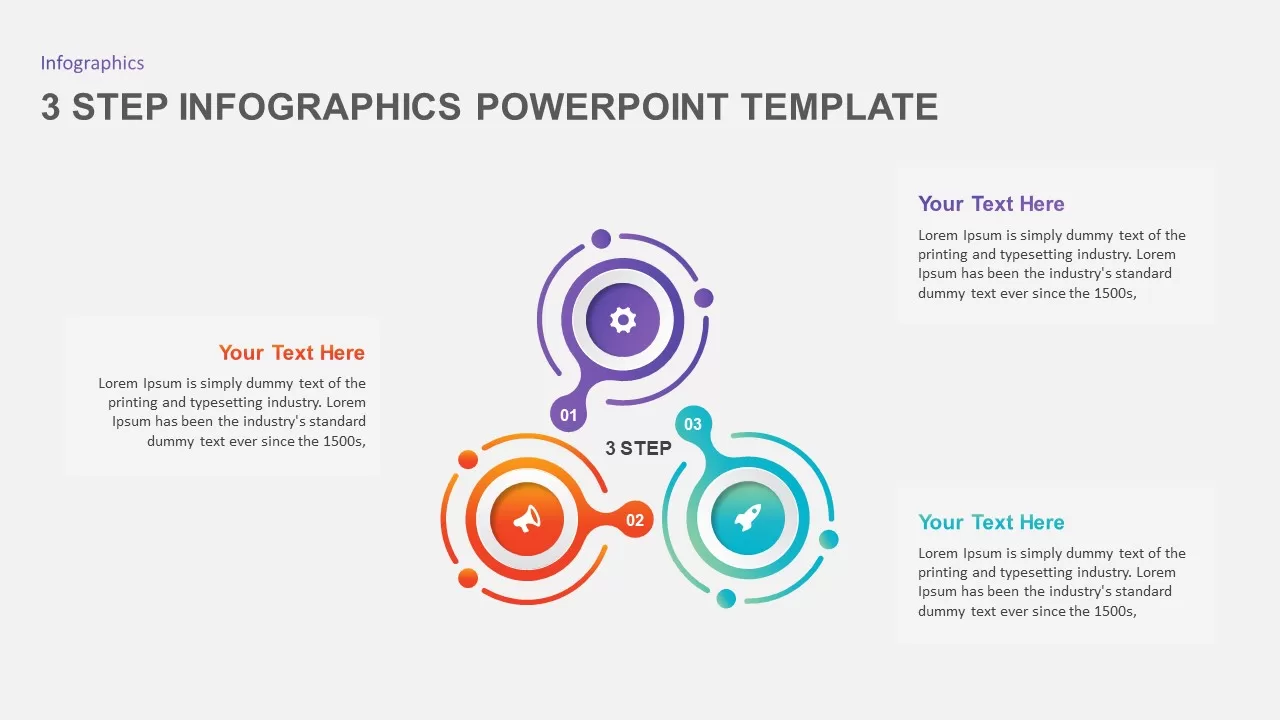
Circular Three-Step Infographic Diagram Template for PowerPoint & Google Slides
Circular
Circular Market Drivers Infographic Template for PowerPoint & Google Slides
Circular
4-Step Circular Roadmap Infographic Template for PowerPoint & Google Slides
Roadmap
Circular Core Values Infographic List Template for PowerPoint & Google Slides
Circular
6-Step Circular Diagram Infographic Template for PowerPoint & Google Slides
Circular
8-Step Circular Gear Infographic Diagram Template for PowerPoint & Google Slides
Circular
6-Part Circular Gear Infographic Diagram Template for PowerPoint & Google Slides
Process

Circular CRM Process Infographic Diagram Template for PowerPoint & Google Slides
Circular
4-Step Circular Infographic Diagram Template for PowerPoint & Google Slides
Circular
SWOT Analysis Circular Infographic Template for PowerPoint & Google Slides
SWOT
3 & 4 Step Circular Process Infographic Template for PowerPoint & Google Slides
Process
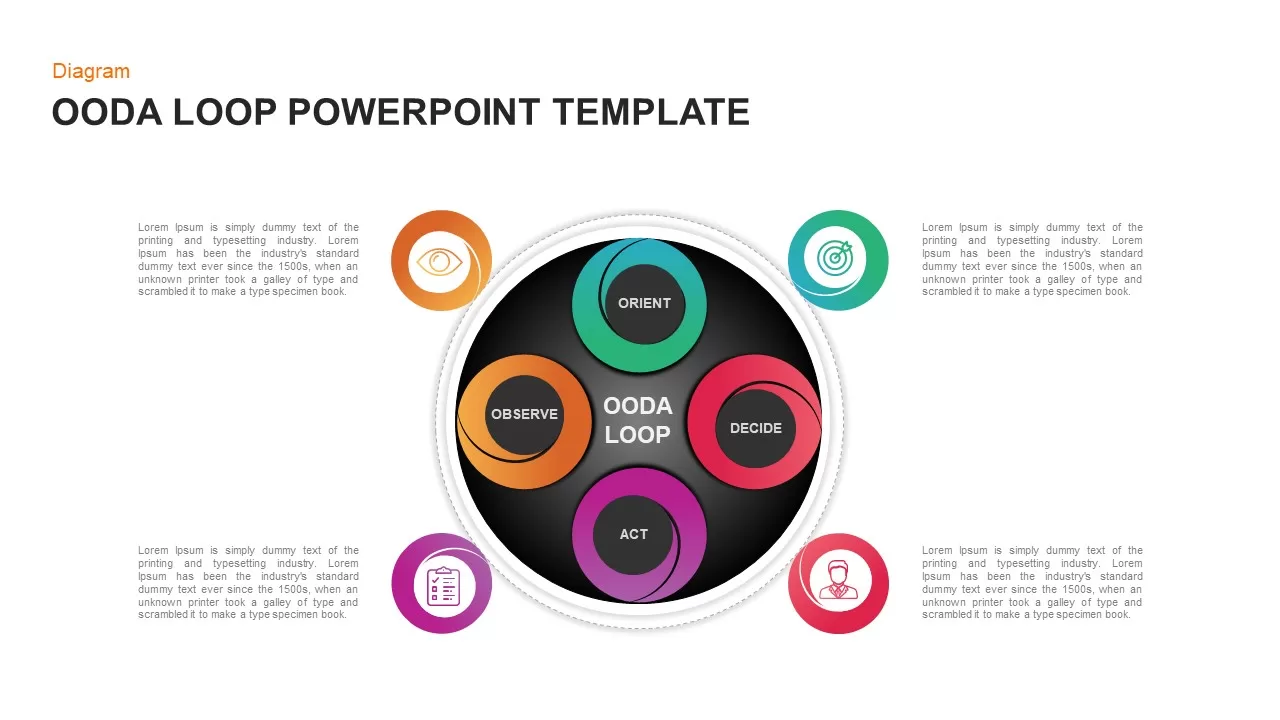
Modern Circular OODA Loop Infographic Template for PowerPoint & Google Slides
Circular
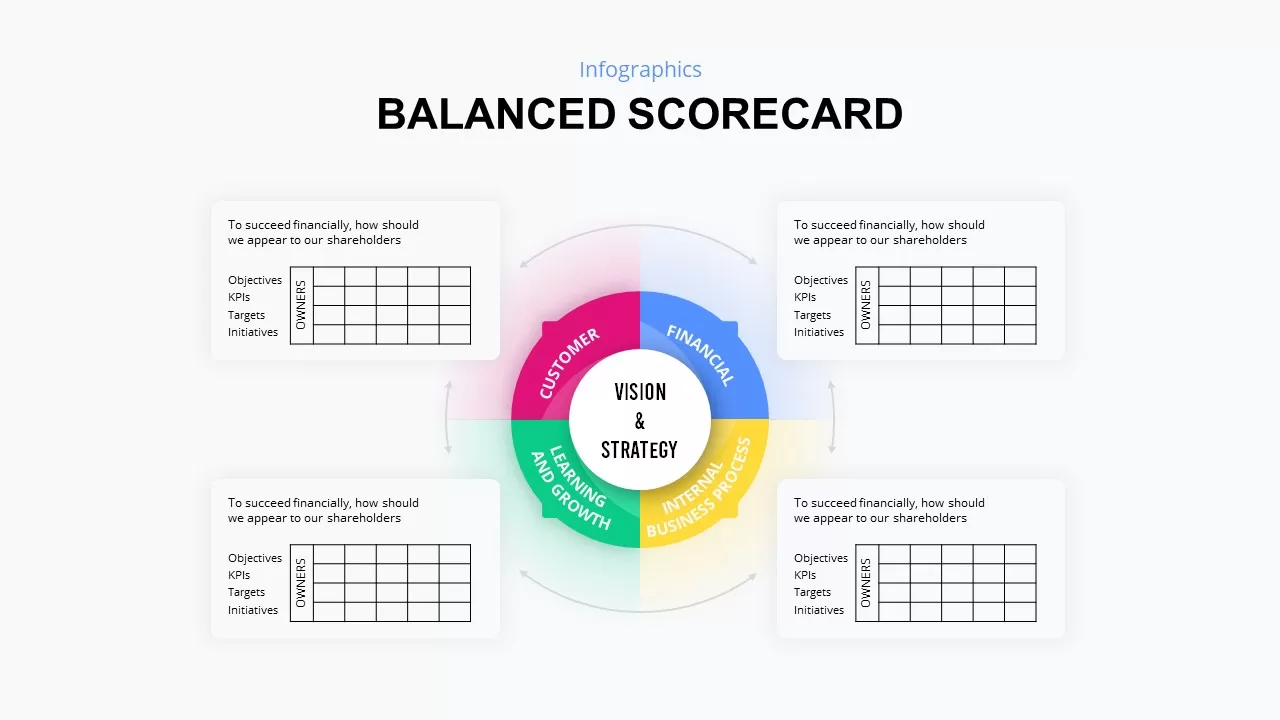
Circular Balanced Scorecard Infographic Template for PowerPoint & Google Slides
Business Strategy
Circular Arrows Infographic Template for PowerPoint & Google Slides
Business
Circular SWOT Analysis Infographic Template for PowerPoint & Google Slides
SWOT
Free Five-Step Circular Timeline Infographic Template for PowerPoint & Google Slides
Timeline
Free
Five-Stage Circular Arrow Infographic Template for PowerPoint & Google Slides
Circular
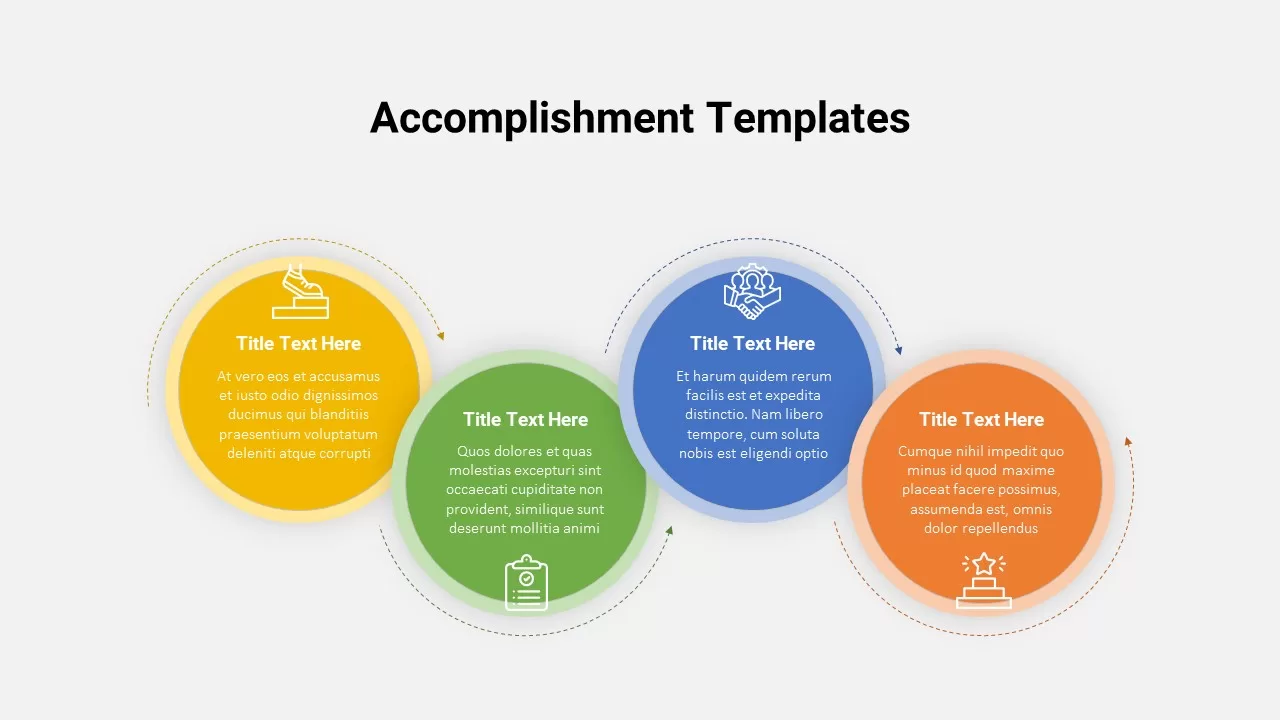
Accomplishment Circular Infographic Template for PowerPoint & Google Slides
Accomplishment
Six-Segment Circular Arrow Infographic Template for PowerPoint & Google Slides
Circular
Healthcare Nursing Circular Infographic Template for PowerPoint & Google Slides
Nursing
Ten Step Circular Process Infographic Template for PowerPoint & Google Slides
Process
Ten-Step Circular Process Infographic Template for PowerPoint & Google Slides
Circular
Dynamic Circular Hub-and-Spoke Infographic Template for PowerPoint & Google Slides
Circular
Circular Sustainability Infographic Template for PowerPoint & Google Slides
Process
Circular Timeline Infographic Template for PowerPoint & Google Slides
Timeline
Sustainable Business Model Circular Infographic Template for PowerPoint & Google Slides
Business Strategy
Circular Business Strategy Infographic Template for PowerPoint & Google Slides
Circular
Service Catalog Circular Infographic Template for PowerPoint & Google Slides
Circular
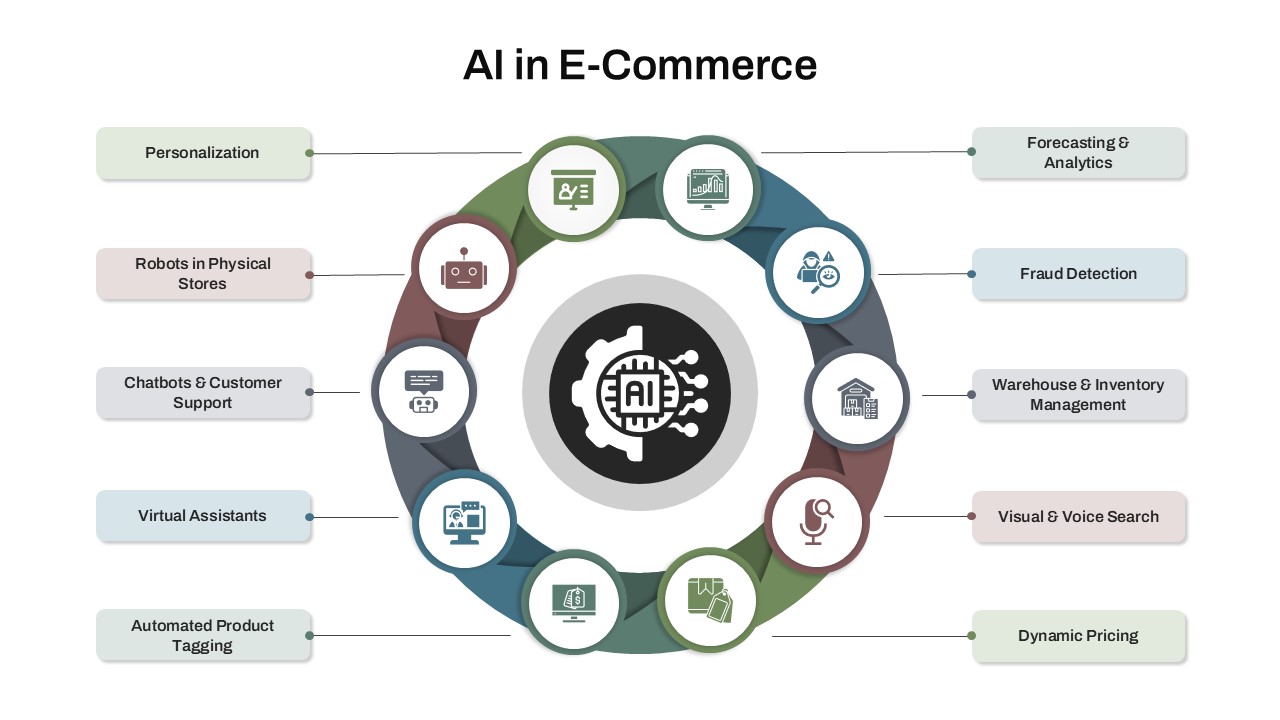
AI in E-Commerce Circular Infographic Template for PowerPoint & Google Slides
AI
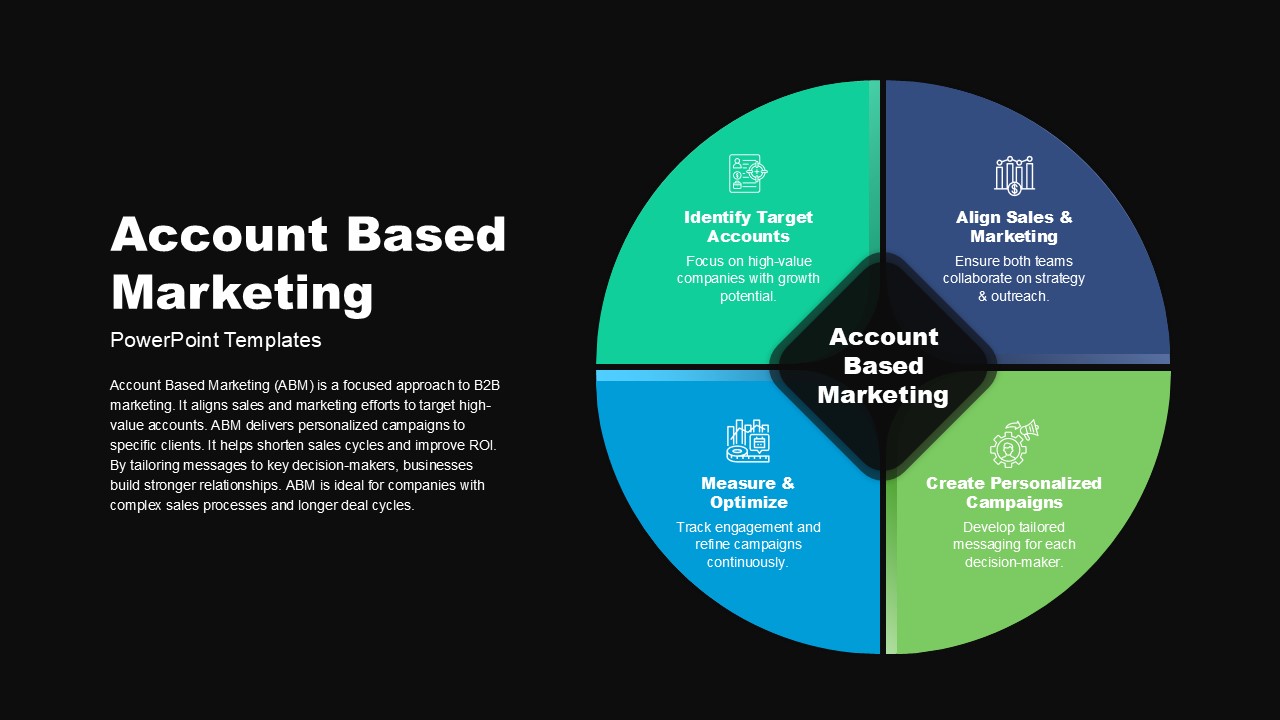
Account Based Marketing Circular Infographic Template for PowerPoint & Google Slides
Marketing
SWOT Analysis Infographic with Circular Icons Template for PowerPoint & Google Slides
SWOT

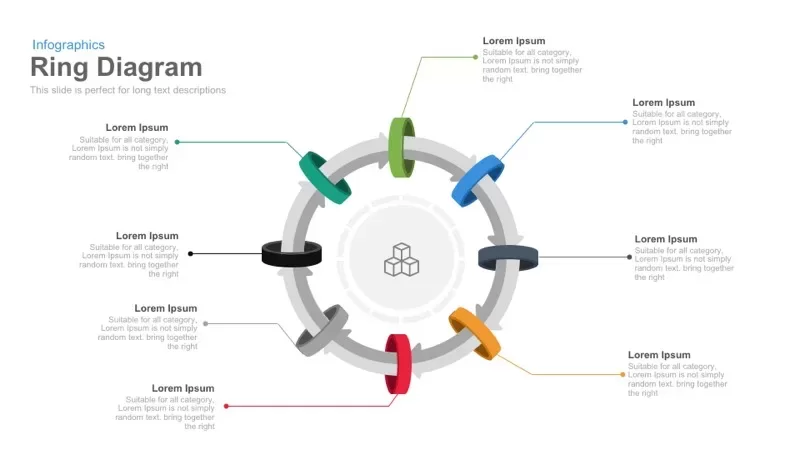
8 Circular Ring Diagram template for PowerPoint & Google Slides
Infographics
Circular Flow Diagram Template for PowerPoint & Google Slides
Infographics
Three-Stage Circular Options Chart Template for PowerPoint & Google Slides
Comparison
PEST Analysis Circular Diagram Template for PowerPoint & Google Slides
PEST
Five-Stage Circular Flow Diagram Template for PowerPoint & Google Slides
Circular
Value Chain Circular Process Diagram Template for PowerPoint & Google Slides
Business Models
Six-Stage Circular Flow Diagram Template for PowerPoint & Google Slides
Circular
5-Step Circular Gradient Process Flow Template for PowerPoint & Google Slides
Process
2-8 Step Circular Diagram Template for PowerPoint & Google Slides
Infographics
4-Step Circular PDCA Cycle Diagram Template for PowerPoint & Google Slides
Process
Circular Mind Map Template for PowerPoint & Google Slides
Mind Maps
Circular Arrows Process Flow template for PowerPoint & Google Slides
Process
Three-Step Circular Arrows Diagram Template for PowerPoint & Google Slides
Process
10-Step Colorful Circular Diagram Template for PowerPoint & Google Slides
Circular
Multi-Variation Circular Chart Diagram Template for PowerPoint & Google Slides
Circular
Free Corporate Governance Circular Model Template for PowerPoint & Google Slides
Circular
Free
AI Methods Circular Diagram Slide Template for PowerPoint & Google Slides
AI
5Cs of Network Effect Circular Diagram Template for PowerPoint & Google Slides
Circular
Circular Organizational Structure Template for PowerPoint & Google Slides
Org Chart
Workshop 5-Step Circular Process Diagram Template for PowerPoint & Google Slides
Circular
Cultural Web Analysis Circular Diagram Template for PowerPoint & Google Slides
Circular
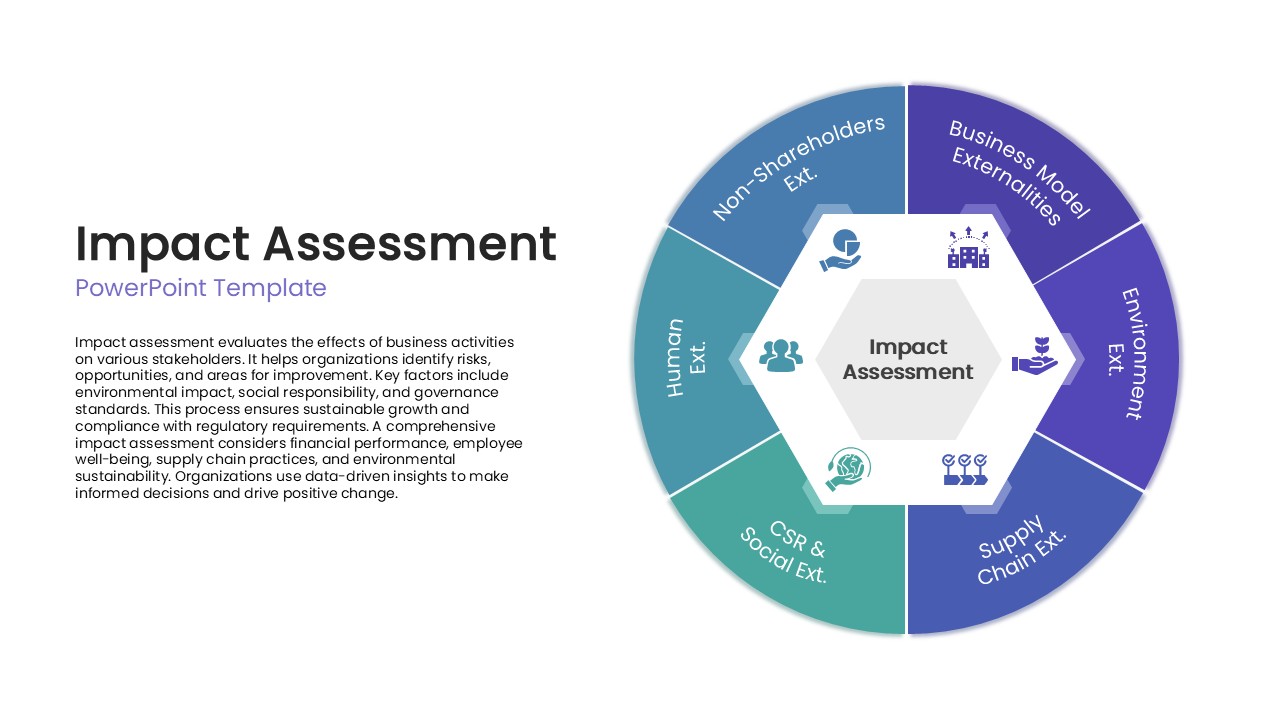
Impact Assessment Circular Diagram Template for PowerPoint & Google Slides
Circular
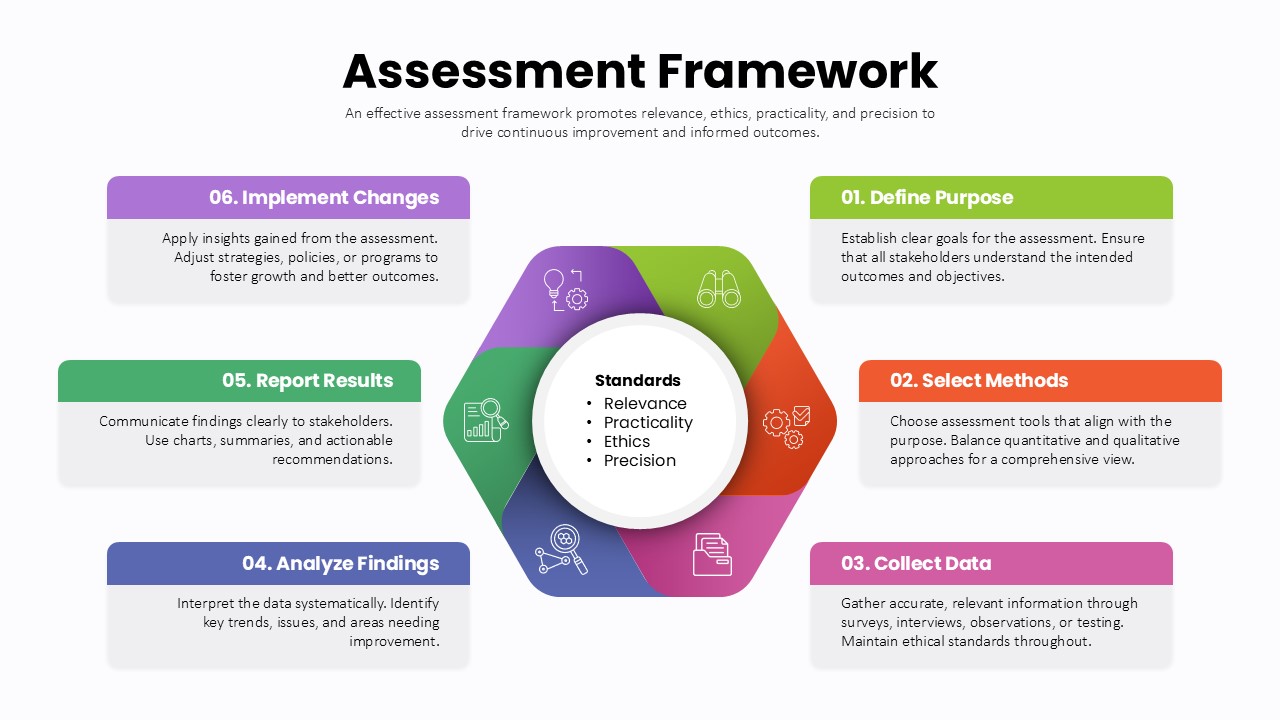
Assessment Framework Circular Diagram Template for PowerPoint & Google Slides
Circular
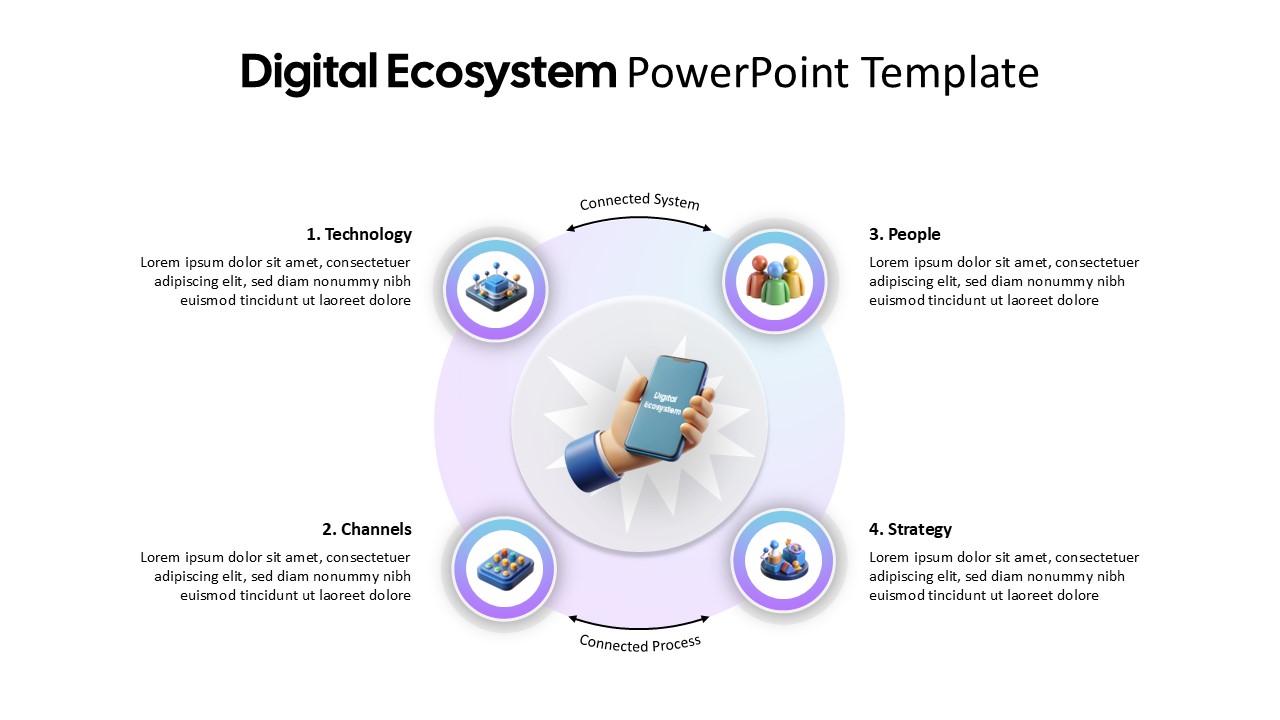
Digital Ecosystem Circular Model Template for PowerPoint & Google Slides
Information Technology
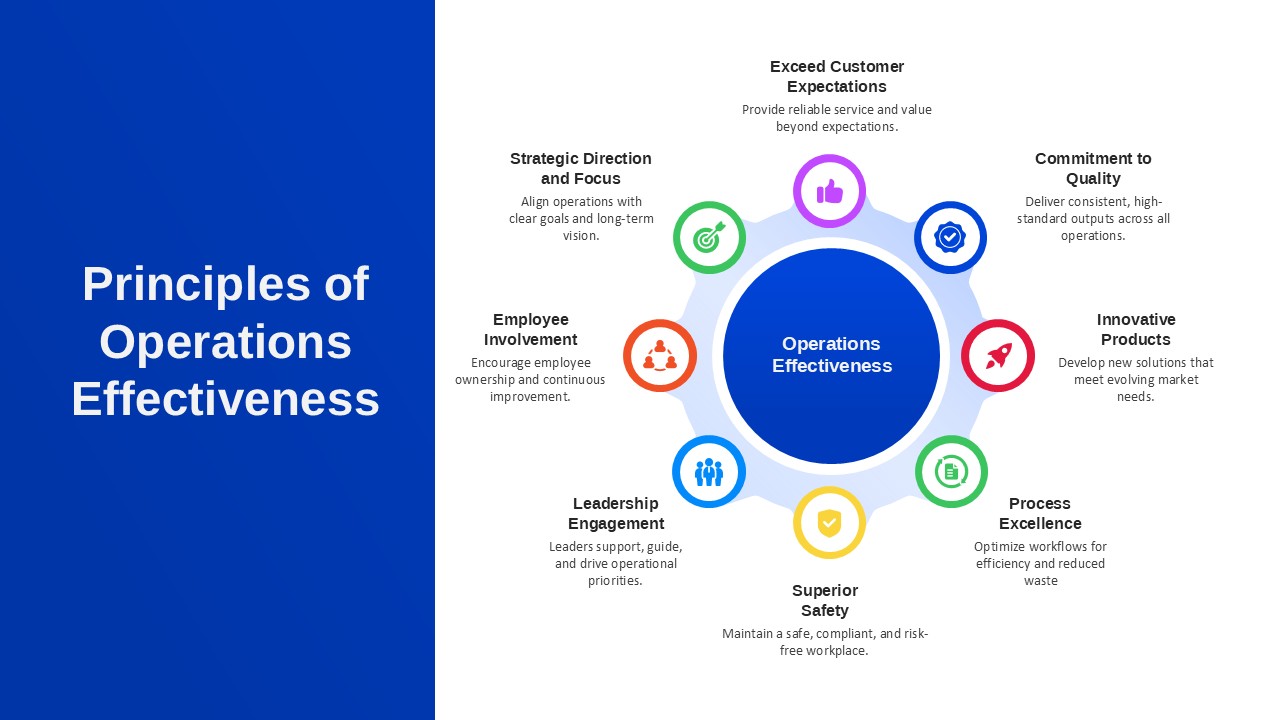
Principles of Operations Effectiveness Circular Diagram Template for PowerPoint & Google Slides
Leadership