Gantt Chart PowerPoint Template
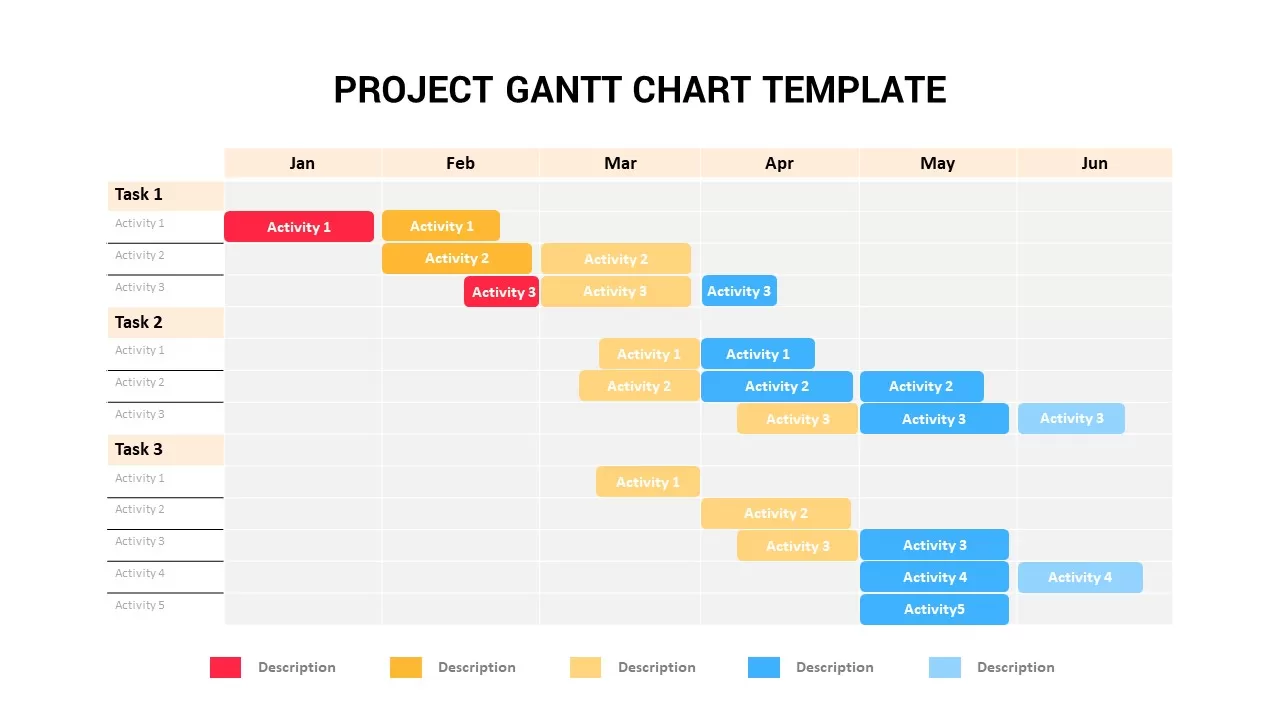
The editable Gantt Chart PowerPoint Template & Keynote Slide is a horizontal graphical representation designed to easily create project plans portraits in a Gantt chart diagram. The users will be able to drag and drop apparatuses and customize them, connect them and finally arrange them into the time-based table to describe the project and tasks. A Gantt chart is a horizontal bar chart develops as a project control tool in 1917 by Hentry L. Gantt, an American engineer and social scientist. This template helps to plan, coordinate and track specific tasks in a project. It gives a clear illustration of projects status.
Gantt chart PowerPoint templates can be used for planning projects of all sizes, and they are useful way of showing what work is scheduled to be done on a particular day. They also help you view the beginning and end dates of a project in one simple interpretation. The users can edit all properties of the diagram, including color and the bar columns.
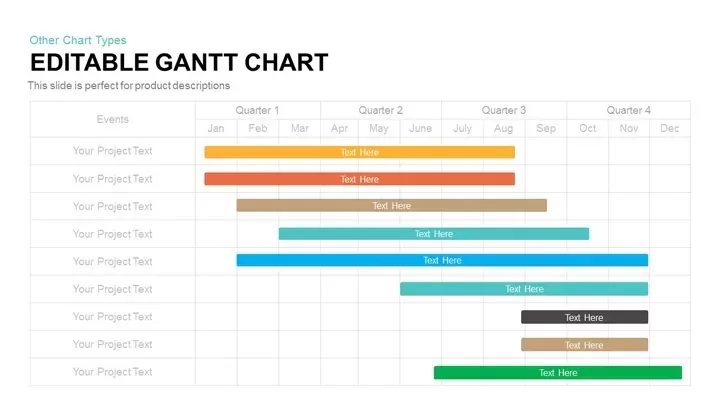
Editable Gantt Chart PowerPoint Template & Keynote Slide is a type of bar chart that exhibits the start and finish of a project schedule. This Editable Gantt chart can be used when you need to illustrate 4 quarters according to the related events conducted over a year. Every three months comprise of a year and hence, four quarters for twelve months. According to each event or related program, you can insert your details on the text box aligned to each event. There are nine events in total and the text box comes in varied lengths in different colors of blue, green, red, yellow, orange, black, brown etc. Another variation of the Gantt Chart PowerPoint and Keynote template is where you have the project or event column and a date column next to it along with the 4 quarters and there are also arrows connecting each text box to the corresponding events. Both these variations are available in the white background. Consider exploring the Gantt Chart PPT template as an alternative variation.
Login to download this file


