
Continuous Improvement Using Six Sigma Process Methodologies
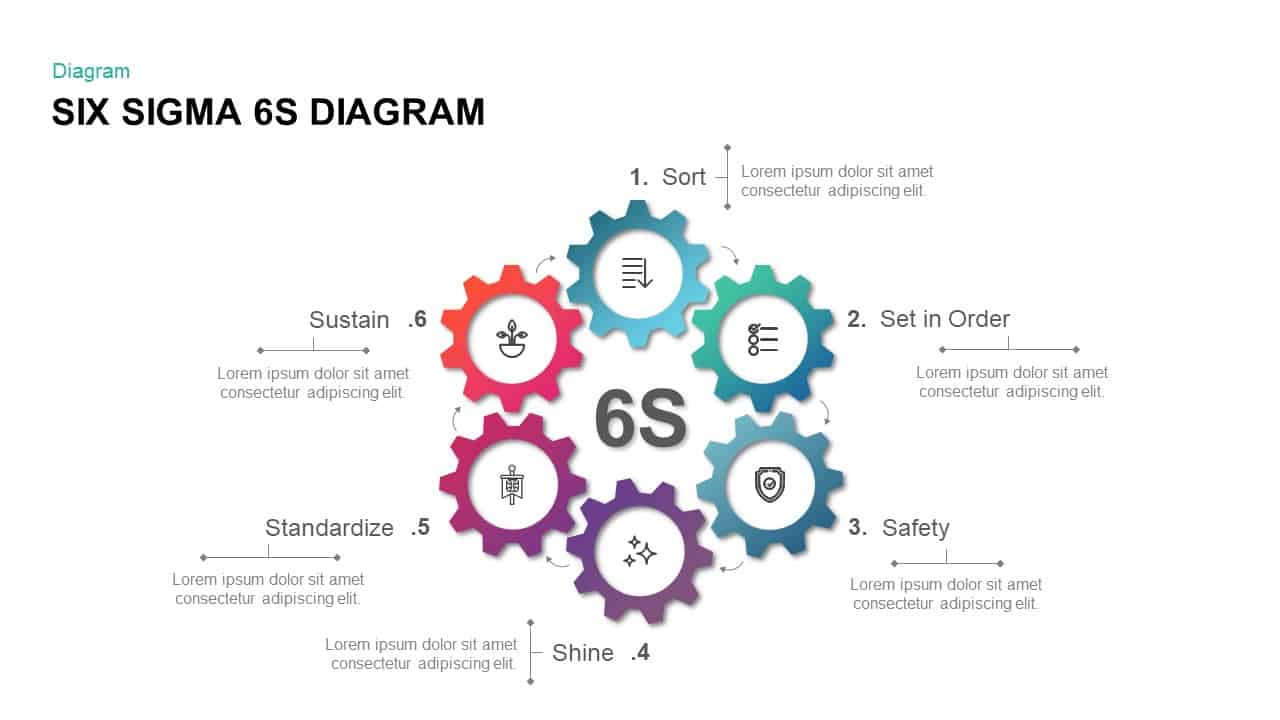

The accurate implementation of six sigma process will bring process improvement and business success. Six Sigma is a data-driven approach used by companies to upgrade their business processes. The method uses 5 step methodology to eliminate defects at all stages within a company. It is a measurement-based approach that focuses on identifying and improving defects. Six Sigma has a proven track record of adding value and ensuring quality to the output of a business in the form of step-by-step improvements to a product or service. You can use to enhance supply chain processes and thereby increase customer satisfaction. The benefits of six sigma are more than problem-solving and study the entire production process from the materials to the end product and suggest remedies for defects in each stage. So, six sigma methodology will identify critical success factors for your business process. It will help define process metrics to measure process performance. By the use of six sigma methodology, you can improve this process performance. It is a logically structured approach to improve business processes.
Six Sigma methodology helps to identify how much a given process deviates from its perfection. So, it enables an organization to measure the number of “defects” in a process and suggest methods of eliminating defects and get close to the “defect-free” process as much as possible. Managers face challenges in improving the efficiency and quality of the business. To eliminate business problems, they need to implement the best methodology and techniques to analyze and regulate the process.
In short, six sigma is a measurement-based strategy for process improvement. It enables to improve customer satisfaction by improving process methodology. The concept behind this approach is to reduce the variation in processes. Therefore, continuous process improvement with minimum defects is the ultimate goal of this method.
DMAIC Model for business process improvement
Six Sigma follows the DMAIC for process improvement and problem-solving. This well-defined methodology consists of five phases in a sequence.
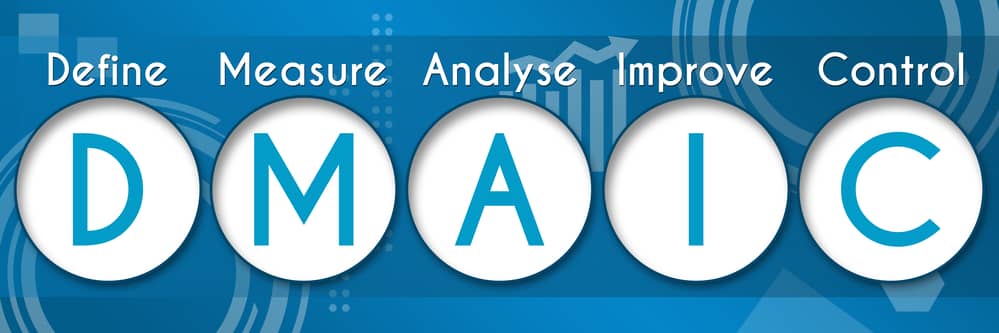
The DMAIC framework is the abbreviated form of;
• Define
• Measure
• Analyze
• Improve
• Control
It is an integral part of Lean manufacturing process but can be implemented as a standalone quality improvement process. Of course, it is the most considered tool that can help to improve the efficiency and effectiveness of any organization. Within the DMAIC model, Six sigma can utilize several quality management tools.
Apply the 7 basic quality tools to the DMAIC methodology
1. Fishbone diagram or cause and effect diagram
2. Flow chart
3. Pareto chart
4. Histogram
5. Check sheet
6. Control chart
7. Scatter plot
These basic tools are useful in six sigma project at different times. Each presentation diagram clearly transfers your idea and how defect management works on. Have a detailed look to get better clarity and understanding:
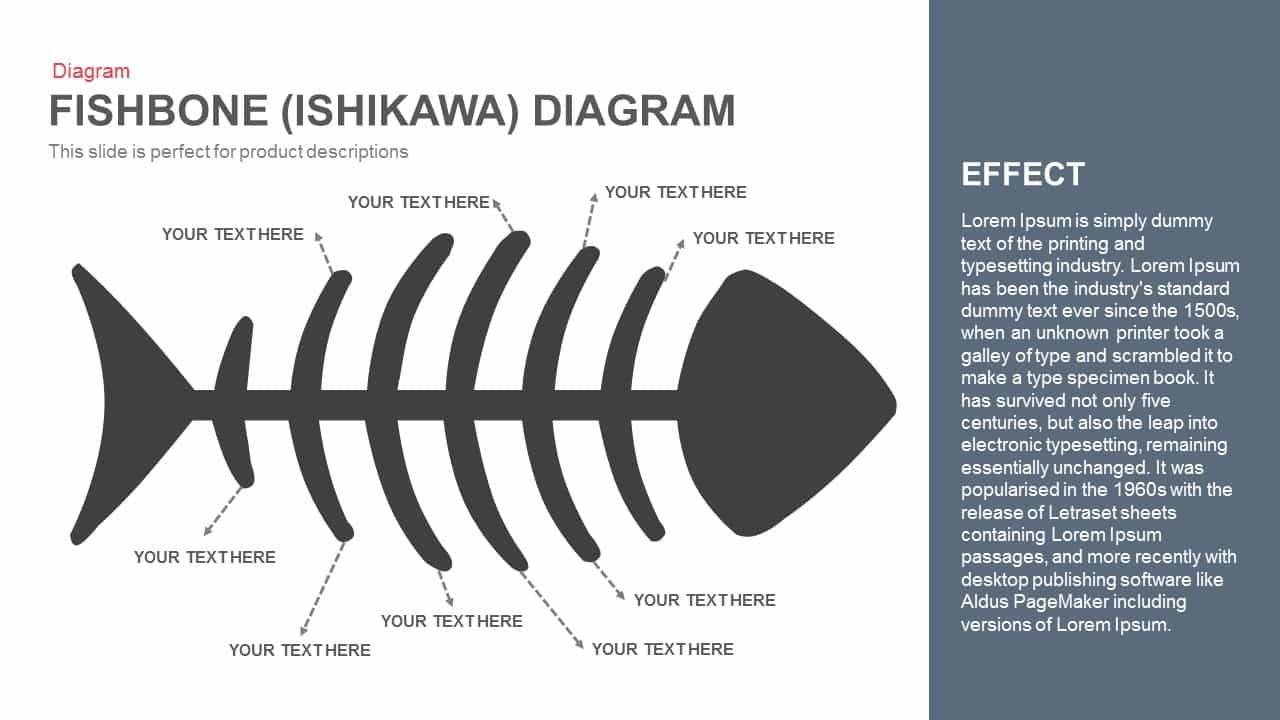
1. Cause and effect diagram
Also, known as the Ishikawa diagram or fishbone diagram, is a graphical visualization tool for categorizing the potential causes of a problem in order to identify its root causes. It is popular for root cause analysis. This tool is used to explore the causes of a single effect through brainstorming. It is visualized through a fish skeleton, there, the head is the problem or effect and the fish bones are the causes. The fishbone diagram categorizes many possible causes for an effect or problem. It quickly sorts ideas into useful categories. The fishbone diagram can be used during the Analyze phase to categorize root causes in order to simplify prioritization and to better assess them. In project management, the team should analyze the all possible causes and sub causes of the problem and get the accurate inference by brainstorming. Cause and effect diagrams are used in the “analyze” phase of six sigma’s DMAIC. The fishbone diagram can be created in six steps:
• Draw problem statement
• Draw major cause categories
• Brainstorm causes
• Categorize causes
• Determine intensive causes
• Identify root causes
Fishbone diagrams are an excellent way to identify and visually illustrate the causes of a problem.
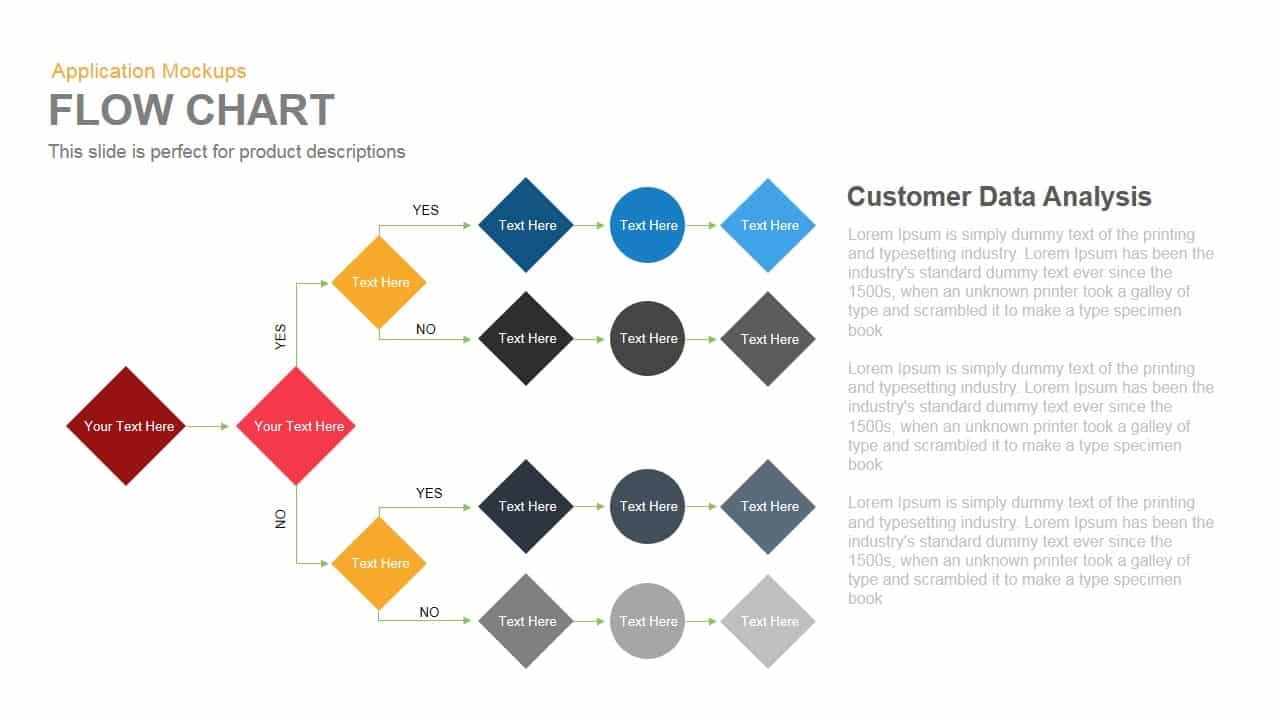
2. Flow chart
A flow chart illustrates how a company’s workflows can be used to initiate process improvement activities. It is designed using standard clipart’s and shows the sequence of tasks performed and their relationship in a graphical format. A good flowchart helps structure the entire process of DMAIC.
• Define – in this phase, a researcher can understand the process and provide insight into the defects and inefficiency so that improvement measures can be made.
• Measure – here, reviewing the define phase, and additional information can be added to make them more comprehensive.
• Analyze- an analysis of the problem can expose some fairly obvious sources of defects and delays in the process.
• Improve – a flow chart can be created for the new process that will be followed as a result of the improvements being implemented.
• Control –the design created during the improve phase, should be completely examined and updated in order to reflect any changes resulting from a rollout.
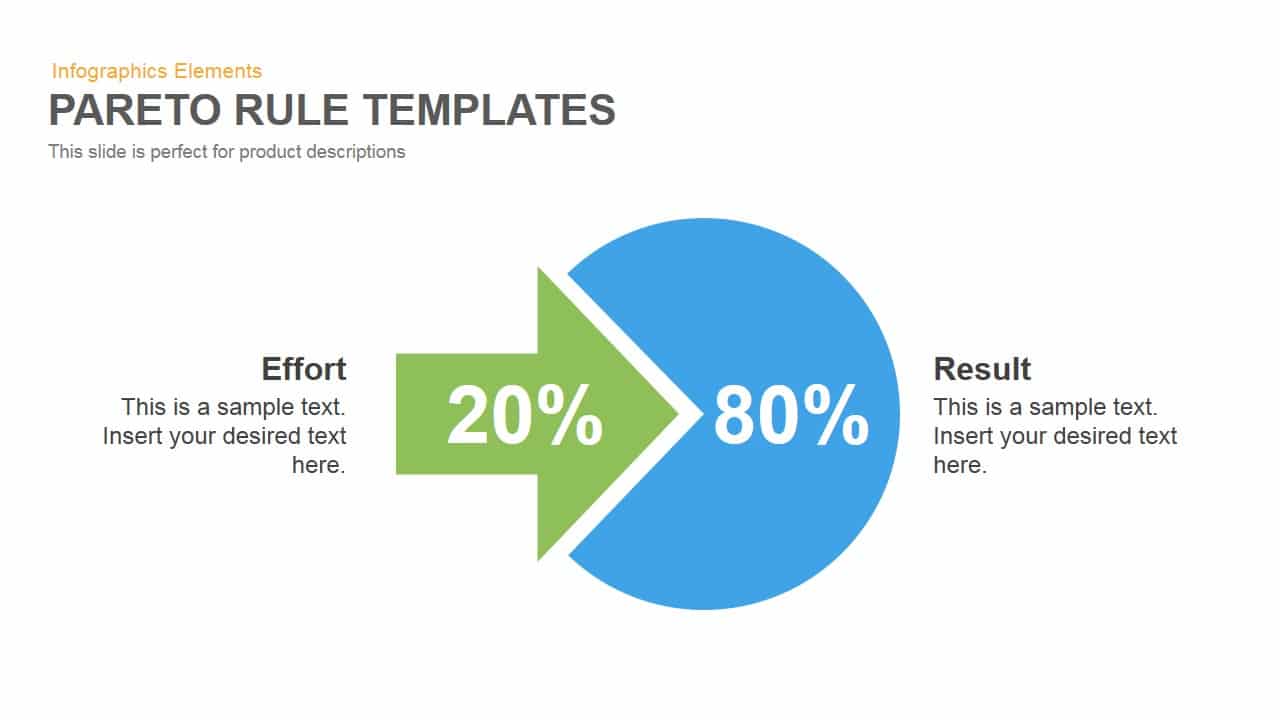
3. Pareto chart
Pareto chart is a popular diagram to define and improves the root causes of a problem. It is also known as the 80-20 principle, which is coined by renowned thinker Vilfredo Pareto. According to this theory, a small number of causes (20%) are responsible for a large percentage (80%) of the effects. That is, 20% of your activities will account for 80% of your results. In a society, the “vital few” or the 20 per cent have money and influence, they are ruling over the 80 per cent and the 20 per cent are the deciding factors of social improvement and growth. We can take 80 20 rule and apply it to almost any situation. Understanding the principle is essential to learning how to prioritize your tasks and project process. the graphical slideshows can be used to display the types of problems that affect a process and their relative significance.
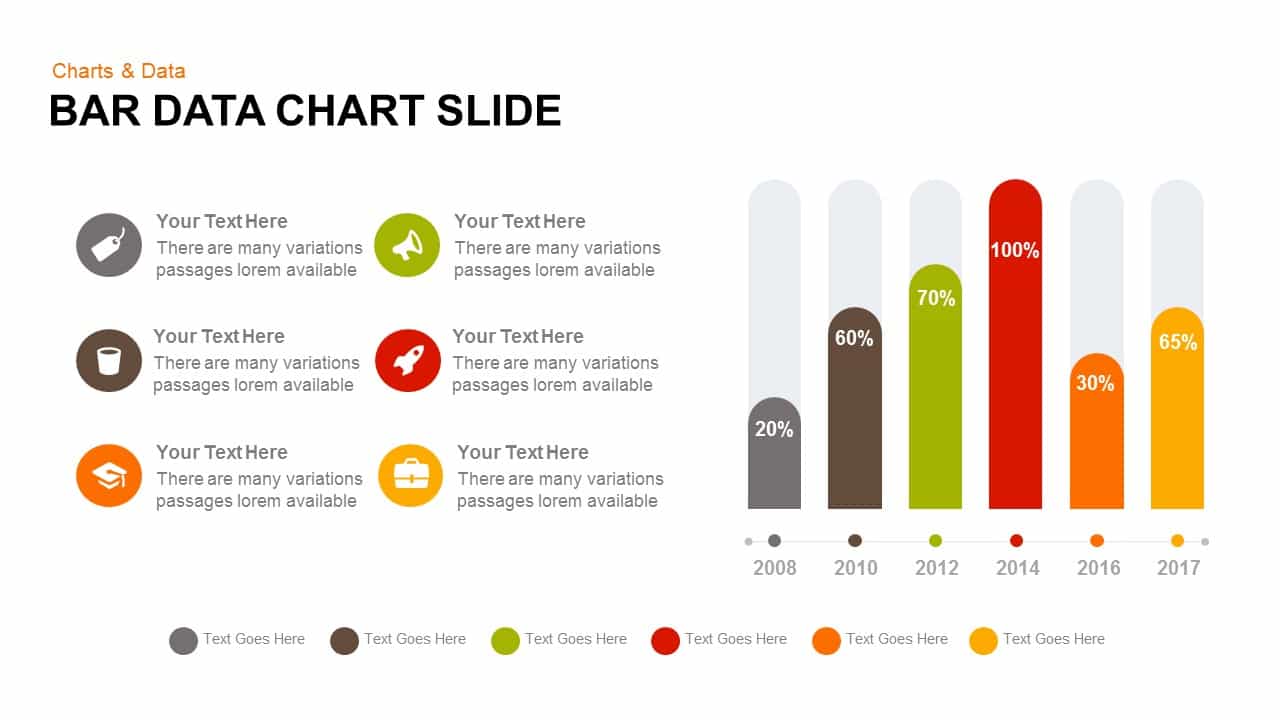
4. histogram
The Histogram is a bar chart to represent the frequency distribution of the data set. The height of the bars depends on the varying nature of data and its values. It makes easier to interpret where the problems are coming. It can be used to analyze the variance of process parameters in six sigma methodology, as well as predict future process performance.
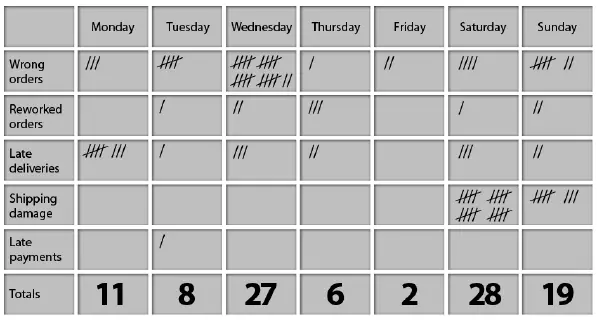
5. check sheet
A check sheet is a structured, prepared form for collecting and analyzing data. This is a generic tool for data collection and analyzing. It can be used to record information in real-time at a specific location over a period of time. The occurrence of problem and defects associated with a particular process can be documented on a check sheet and used to create interrelationship of variables. The occurrence of data can be measured for further analysis.
6. Control chart
A control chart is a visual graph used to learn how a process changes over time. It is used for controlling ongoing processes by finding and correcting problems as they occur. It is a statistical tool that differentiates process variations as a result of your findings. It is very useful for demonstrating out-of-control signals. You can differentiate common cause and specific factor that contribute to the process defects. The control chart is fit for presenting, Measure, Control, and Improve DMAIC framework. This chart is used to check, whether process data remains under control for the shorter time span. Process data is examined to remain within process control limits.
7. Scatter plot
 A scatter plot is a numerical graph presenting the relationship between two variables. It contains an X-axis and a Y-axis and a series of dots representing the individual X and Y-axis values. A scatter diagram lets the identification of possible relationships between two different set of variables. It can be used during the Analyze phase to categorize root cause in order to simply rank and to better evaluate them. It can also use after brainstorming cause and effects by fishbone analysis. So, the scatter plot is fit to display the correlation.
Explaining DMAIC – each phase one by one
The process and tools of six sigma are explained in the following sections –
Define
The define phase is the first phase of the six sigma DMAIC process. In this stage, the project team creates a project charter, a high-level map of the process and begins to understand the needs of the system for better improvement. Hence, the key objective of this phase is to summarize the project plan. This phase emphasizes on accurately specifying the problems; the goals of the process improvement, what is the scope of the project and identifying the customers along with their requirements. Every problem-solving phase starts with the definition of the problem. This is a serious phase in which the team outlines the project focus for themselves and the management of the organization. A project charter outlines the essential elements of a project. It includes the definition of the problem, the customers, voice of the customers, the voice of the business, the voice of the process and sometimes the voice of the employees. Tools in a defined period are necessary to measure CTQ (Critical to Quality) characteristics. The SIPOC diagram and Pareto chart are the valuable tools of this phase
Measure
In this phase, the researcher can collect data that is relevant to the scope of the project. The major objective in this phase is to find out the magnitude of the problem. Measurement is crucial throughout the life of the project. As the team starts collecting data they emphasize both the process as well as measuring what customers care about. The aim of this step is to quantitatively establish current baselines as the basis for improvement. The team chooses what should be measured and how to measure.
Histogram can be used to understand data distribution. The measure phase includes more quantitative studies and data analysis than the DEFINE phase. In the measure phase, different tools can be used such as process flow charts, Run charts and process capability.
Analyze
How does a problem generating within a process? Or what is causing the problem? The major objective of this phase is to identify the root cause of the problem. It identifies the gaps between actual and goal performance, determines its variables and opportunities for its improvement. A large number of potential causes of the defects are identified by root cause analysis. Fishbone diagrams are fit to present the problems and causes effectively. This phase starts with exploring all possible causes to the main problem. Then, these causes are examined and validated through assumptions & statistical tools. Common used tools in analyze phase are Mind maps, Fishbone diagram, Hypothesis testing, Histogram and Scatter plot.
Improve
In this fourth phase, the researcher is keen on determining potential solutions, and frames the remedial methodologies, test and implements them for improvement. The ways of improvement executed in the phase after thorough verification of the solutions. The improvement plan is outlined to mitigate the risk and include customer feedback and satisfaction. Identification of the pros and cons of the possible solution by team efforts will lead to accuracy and continuity. Deep brainstorming sessions help sort out the best possible solutions.
Control
The essential goal of this phase is to generate a detailed solution monitoring plan. This process ensures that the required performance is maintained. This is the conclusion phase of the team’s journey. This phase defines and validates the monitoring system, develops standards and processes, verifying and examines benefits and profit growths, and communicate to the business. This is not the statistically intensive phase; it’s a managing phase to control the developments. Control phase helps detect changes and assure the improvement process to implement continuously. The most vital part of this phase is to provide training and on new changes to all relevant stakeholders.
Six sigma is a highly organized and logical methodology. The framework followed passes through five important phases – DMAIC. The DMAIC framework is used when the organization is improving its existing processes. There is another framework of lean six sigma called DMADV.
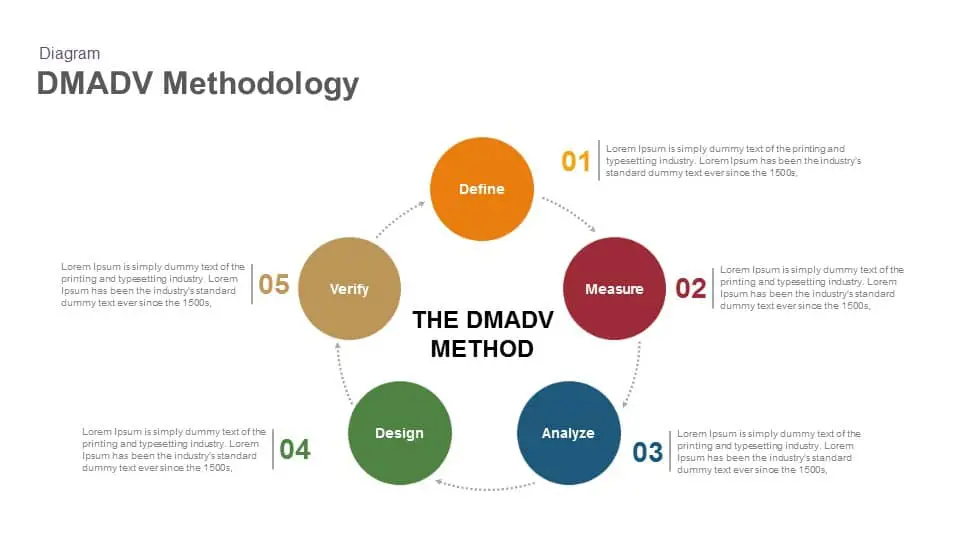
DMADV framework is used when an organization is creating a new process in order to achieve their customer’s needs. It is the short form of five project phases: Define Measure, Analyze, Design and Verify.
Related Articles
-
 May 21st, 2017
How Visual Storytelling Impacts in Business
Presentation Skills -
 January 16th, 2019
Presentation Approaches – A Glimpse
Presentation Skills -
 October 5th, 2019
How To Make Interview Presentation
Presentation Skills