ML Development Life Cycle Diagram Template for PowerPoint & Google Slides

Description
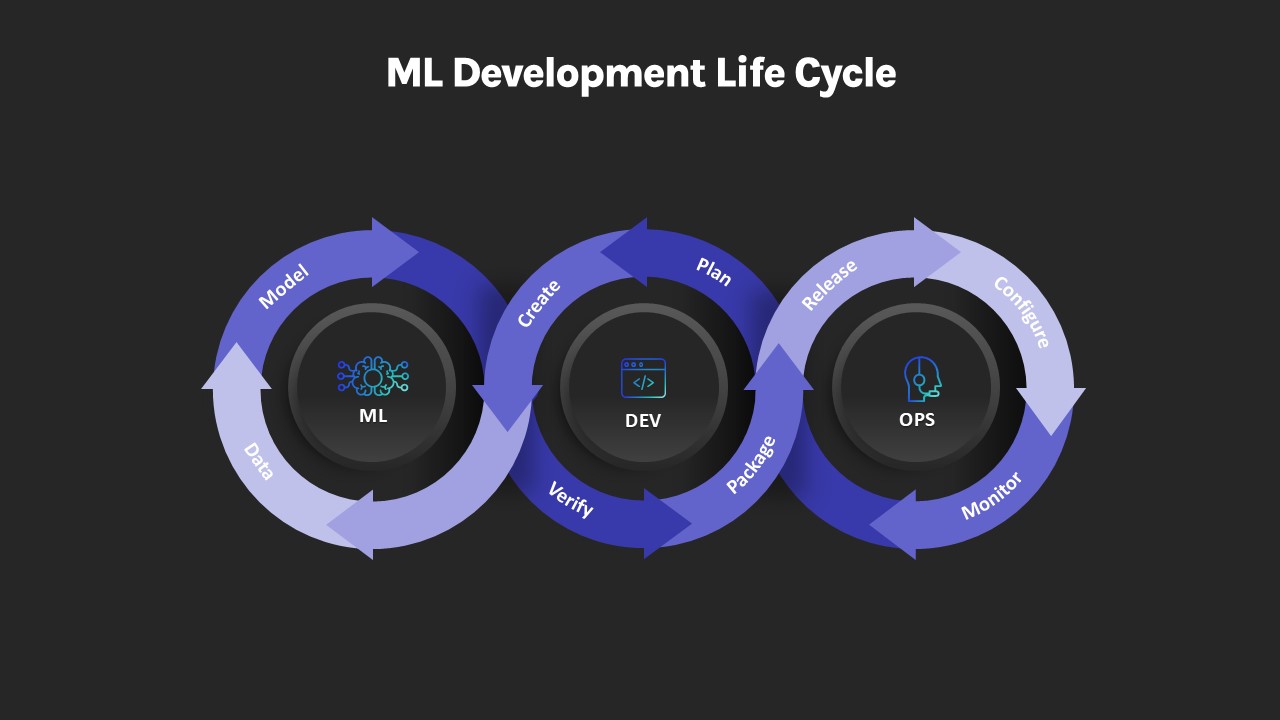
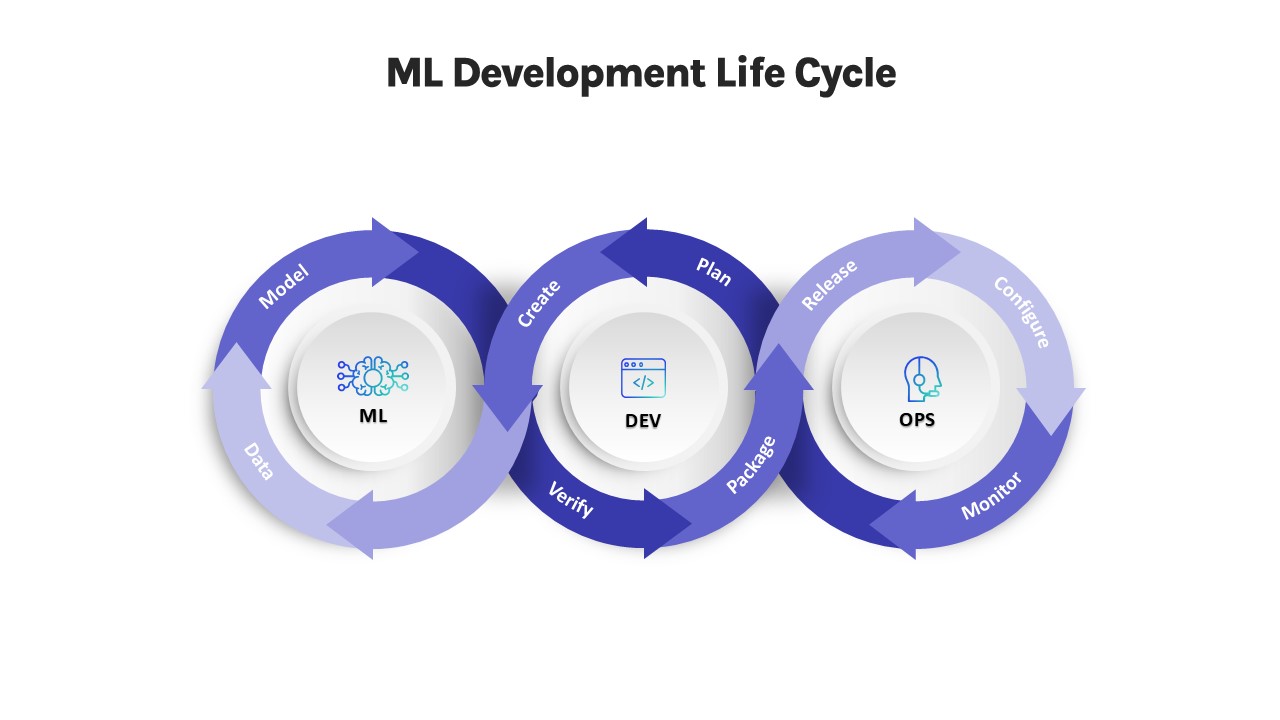
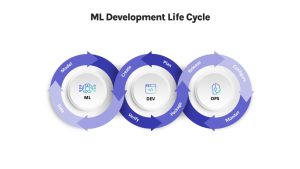
Visualize the end-to-end ML DevOps workflow with this comprehensive life-cycle slide, featuring three interlinked circular loops for ML, Dev, and Ops. Each loop comprises five directional arrows—data ingestion, feature engineering, model training, evaluation, and deployment in the ML cycle; planning, coding, building, testing, and releasing in the Dev cycle; and provisioning, monitoring, scaling, securing, and automating in the Ops cycle—color-coded to reinforce stage distinctions. Centered icons and bold headings anchor the layout, while clean vector shapes and generous white space maintain clarity even when presenting complex processes.
Built on fully editable master slides, this template supports both 4:3 and 16:9 aspect ratios for seamless integration into PowerPoint and Google Slides. Swap theme palette colors in seconds, replace icons with industry-specific visuals, or adjust text placeholders without disrupting alignment. The gradient-filled arrows and subtle drop shadows lend modern depth, and high-resolution vectors guarantee crisp output across virtual meetings, large screens, and printed reports.
Engineered for adaptability, the modular loops can be duplicated or reordered to reflect custom workflows or additional phases. Use entrance animations to guide audiences through each cycle sequentially, or apply slide transitions to highlight hand-off points between teams. Whether you’re documenting MLOps best practices, training data science and DevOps teams, or auditing your model deployment pipeline, this slide saves design time and elevates technical storytelling.
Who is it for
Data scientists, ML engineers, DevOps and SRE teams, and engineering managers will benefit from this slide when mapping out model development pipelines, aligning cross-functional stakeholders, or training new hires on MLOps processes.
Other Uses
Repurpose this diagram for CI/CD workflow overviews, software release roadmaps, quality assurance lifecycles, or IT operations hand-off frameworks. Adjust labels to document custom toolchains, security audits, or performance monitoring strategies.
Login to download this file

Item ID
SB04764
Related Templates

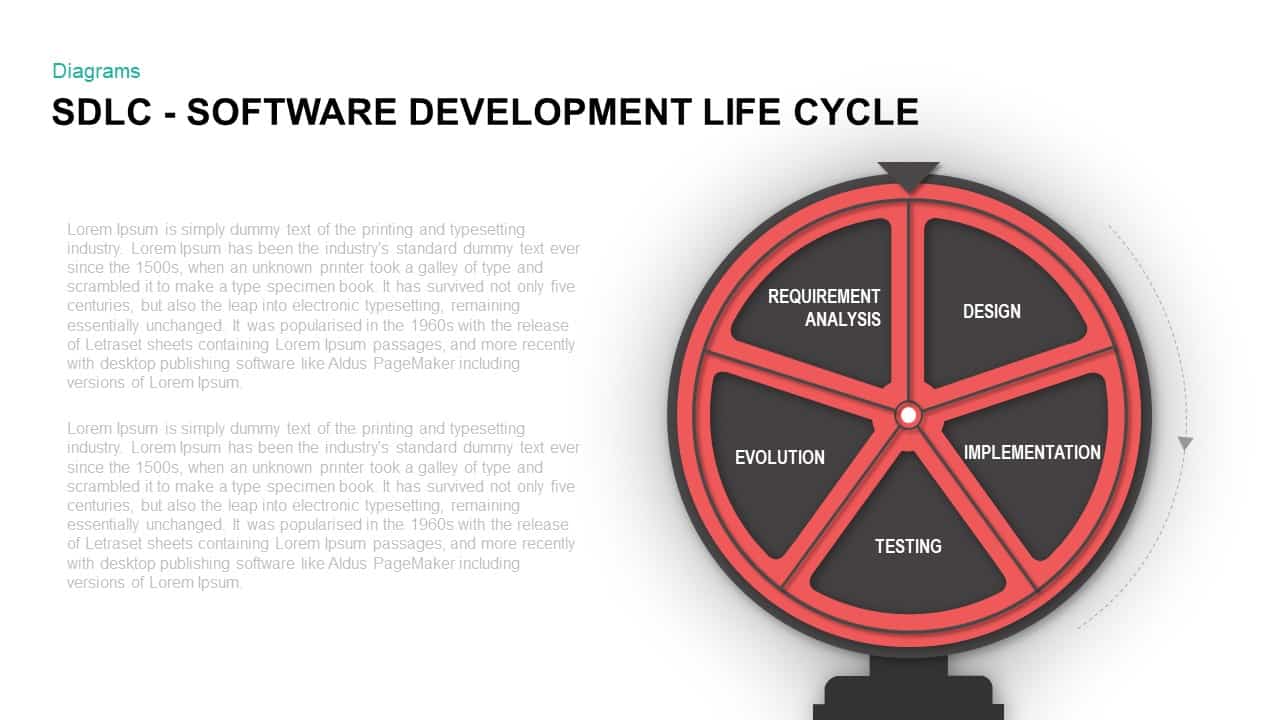
Software Development Life Cycle Diagram Template for PowerPoint & Google Slides
Circle
Premium
Data Migration Life Cycle Curved Diagram Template for PowerPoint & Google Slides
Process
Premium
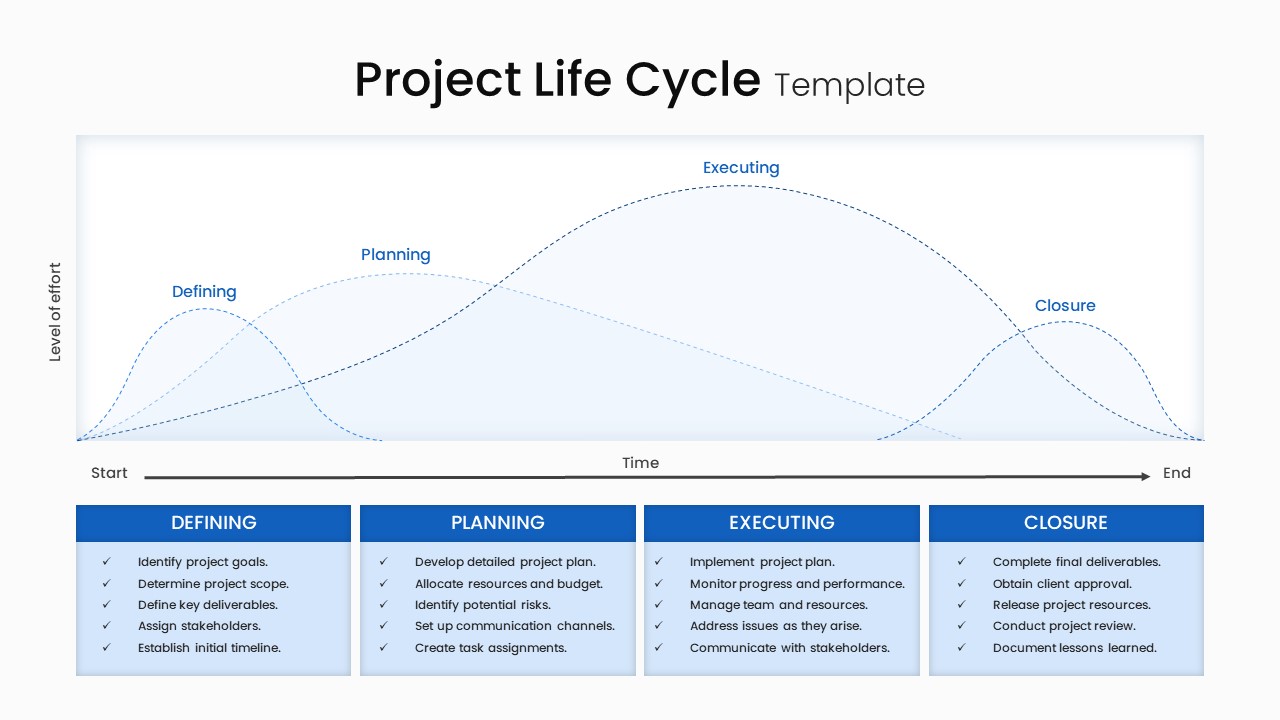
Multi-Style Project Life Cycle Diagram Template for PowerPoint & Google Slides
Process
Premium
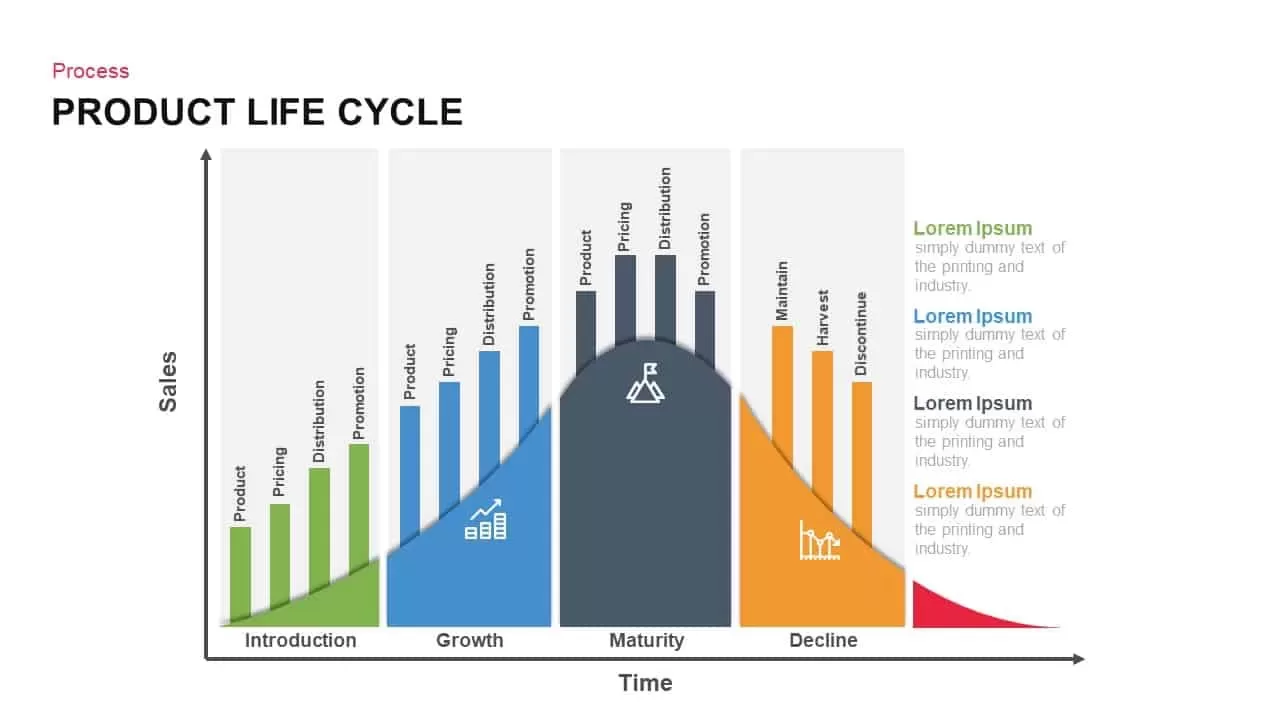
Corporate Product Life Cycle Diagram Template for PowerPoint & Google Slides
Process
Premium
Project Life Cycle Workflow Diagram Template for PowerPoint & Google Slides
Process
Premium
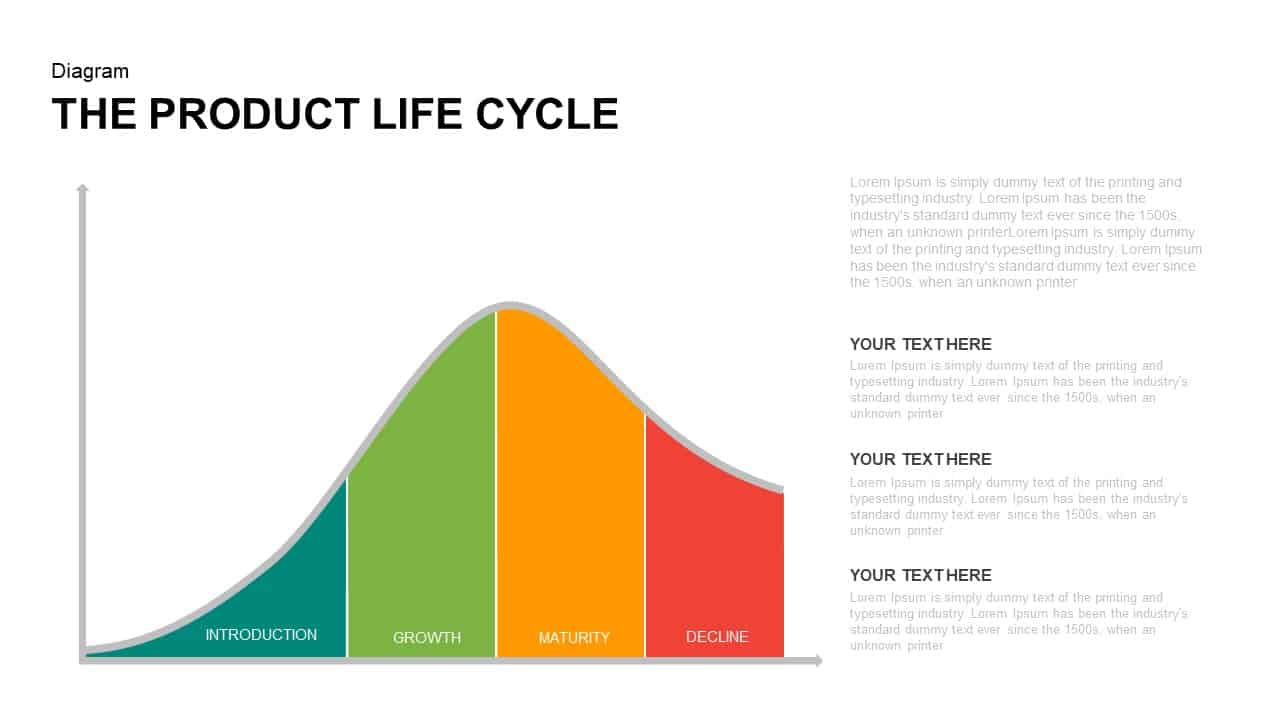
Product Life Cycle Infographics template for PowerPoint & Google Slides
Business
Premium
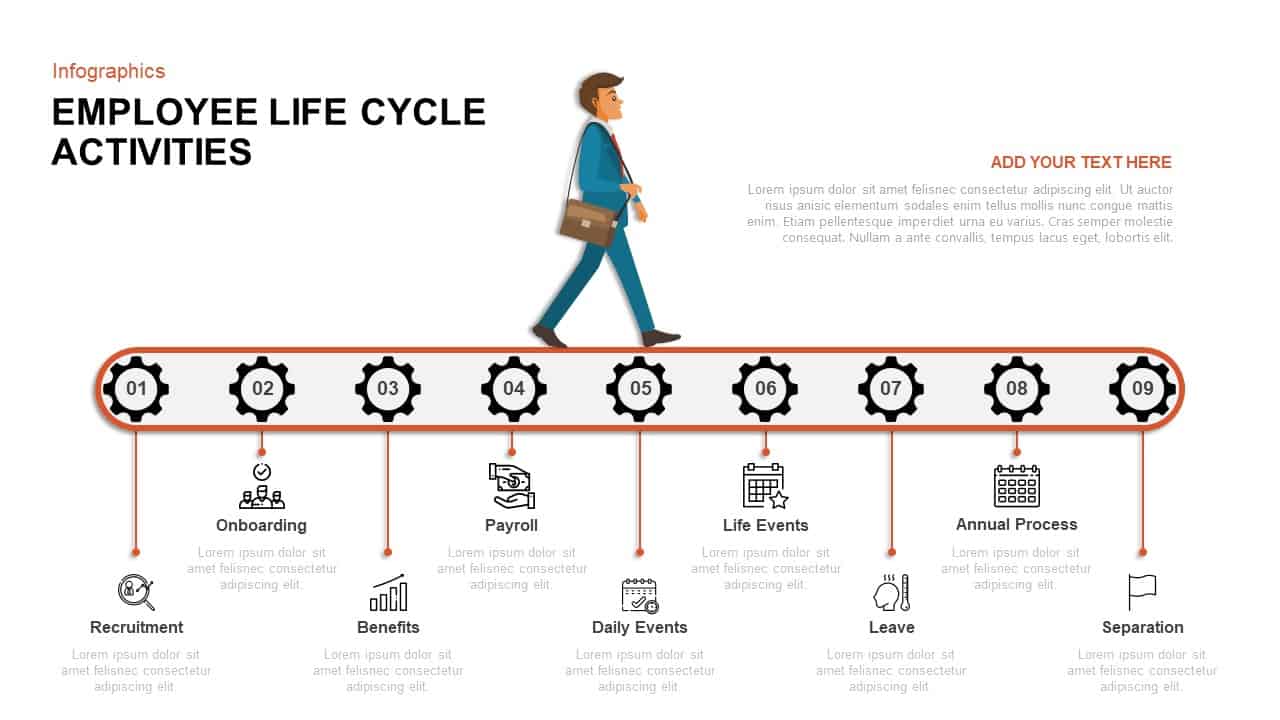
Employee Life Cycle Activities Template for PowerPoint & Google Slides
Timeline
Premium
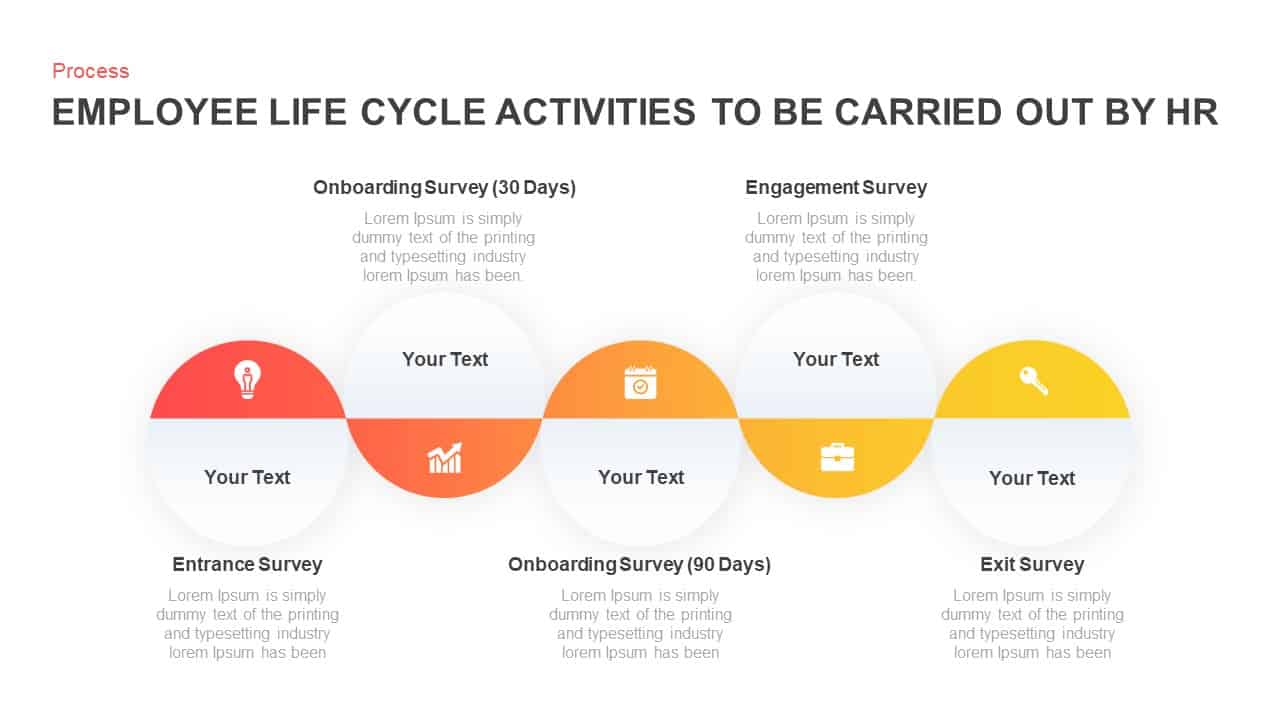
Employee Life Cycle Activities Process Template for PowerPoint & Google Slides
Employee Performance
Premium
Strategic ADL Matrix by Industry Life Cycle & Position Template for PowerPoint & Google Slides
Business Strategy
Premium
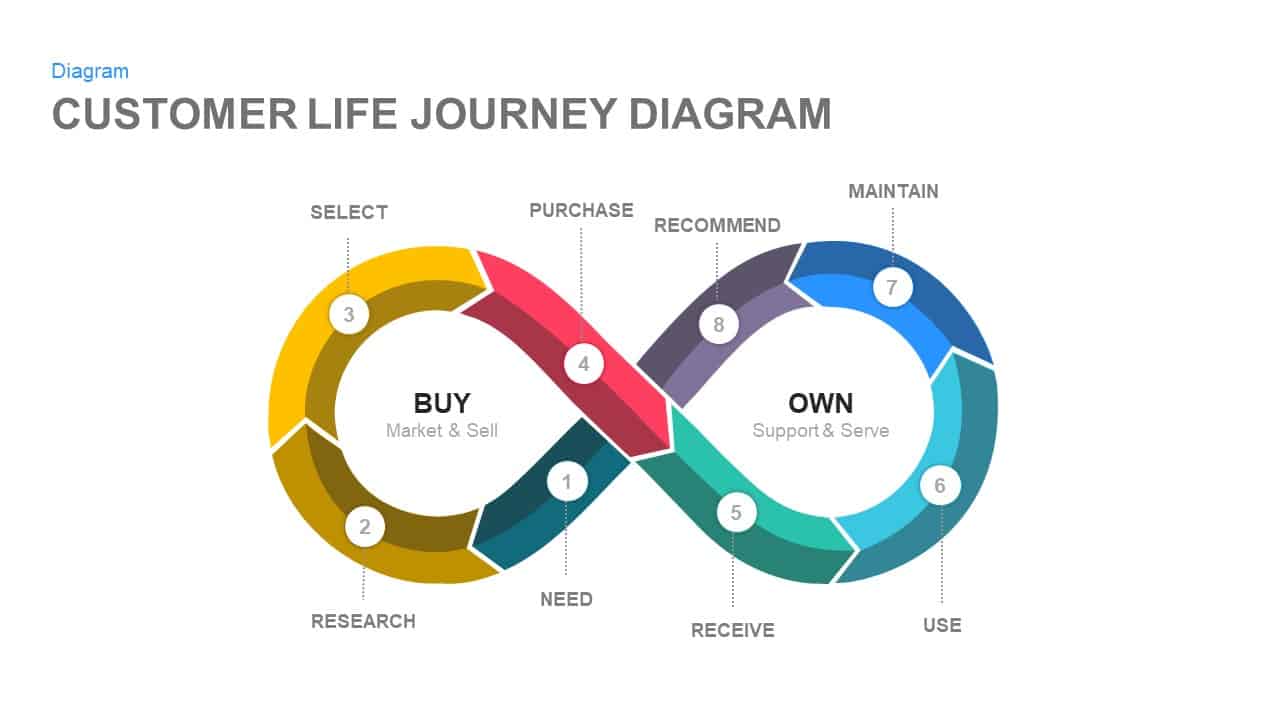
Customer Life Journey Infinity Diagram Template for PowerPoint & Google Slides
Customer Journey
Premium
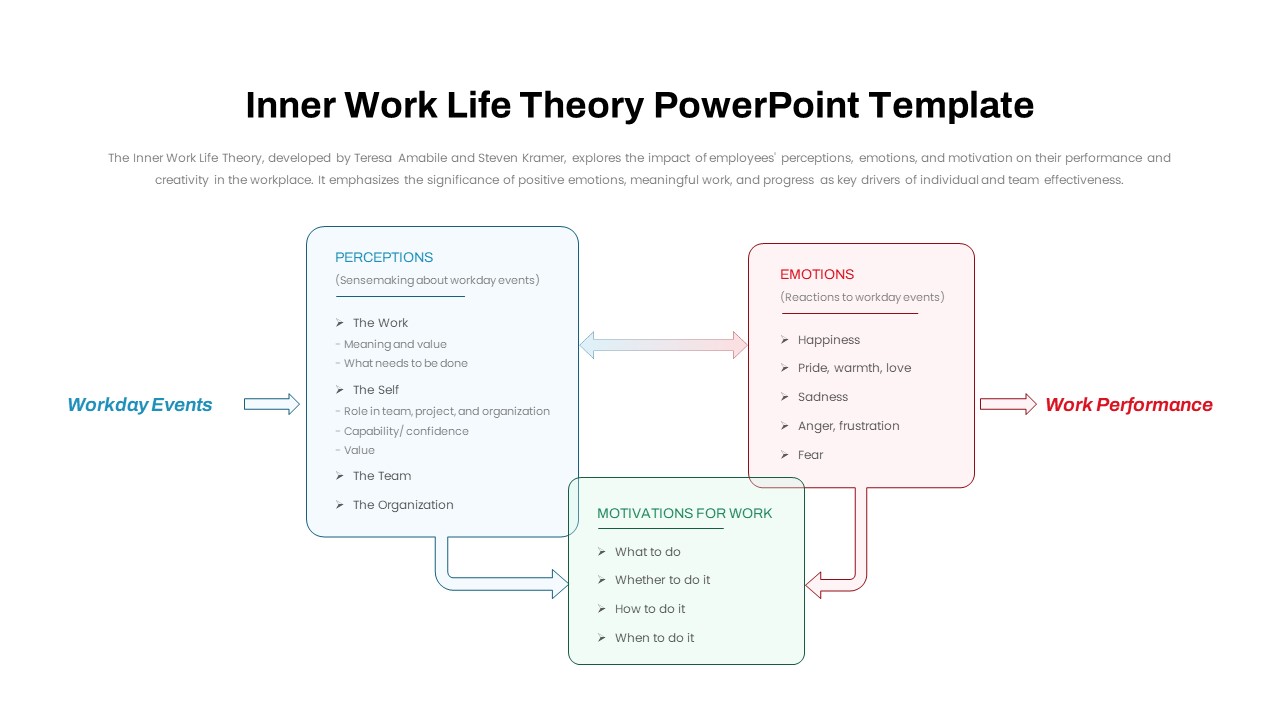
Inner Work Life Theory Diagram Slide for PowerPoint & Google Slides
Employee Performance
Premium
Wheel of Life template for PowerPoint & Google Slides
Business
Premium
Life Roadmap for PowerPoint & Google Slides
Infographics
Premium
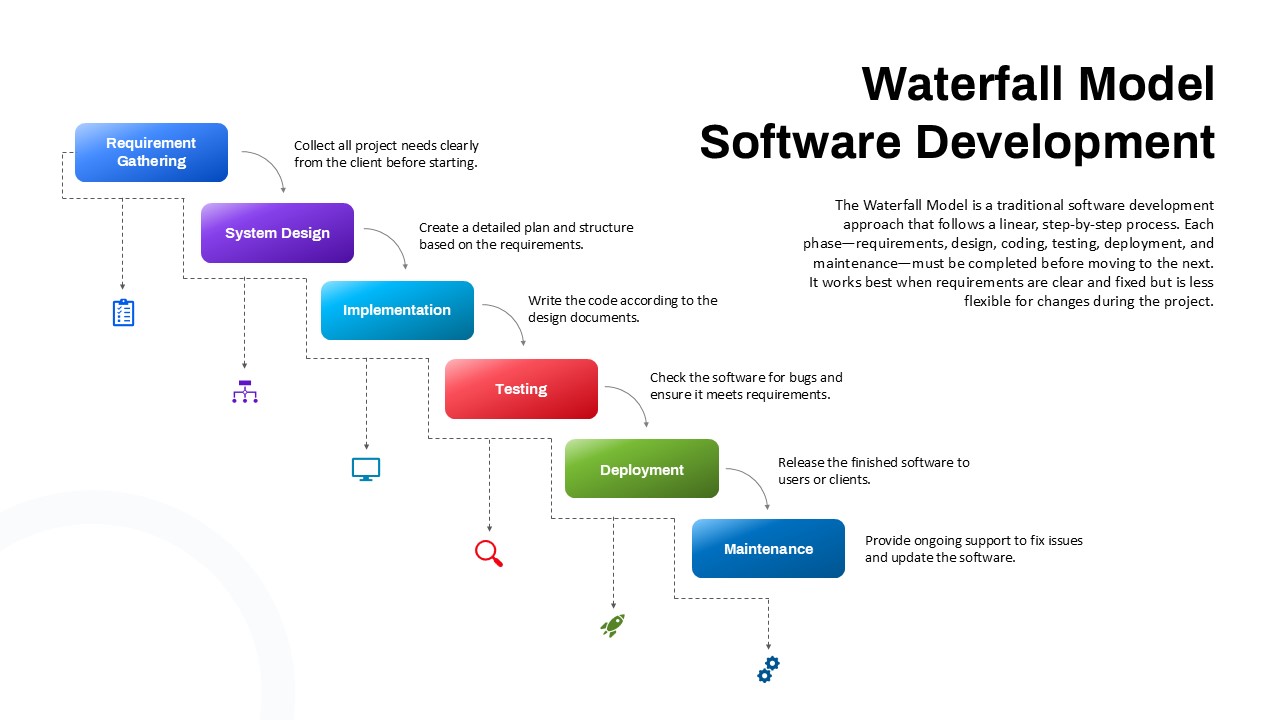
Product Development Waterfall Diagram Template for PowerPoint & Google Slides
Process
Premium

Product Development Stage Diagram Template for PowerPoint & Google Slides
Process
Premium
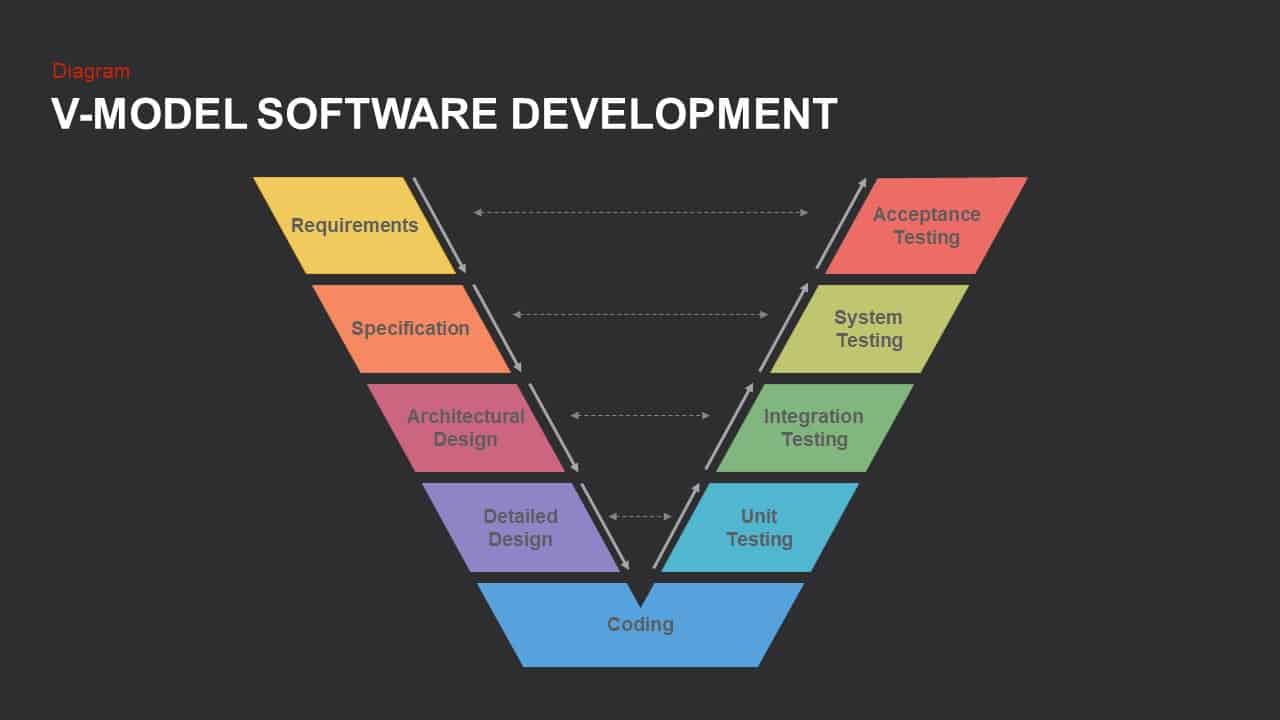
V-Model Software Development Diagram Template for PowerPoint & Google Slides
Software Development
Premium
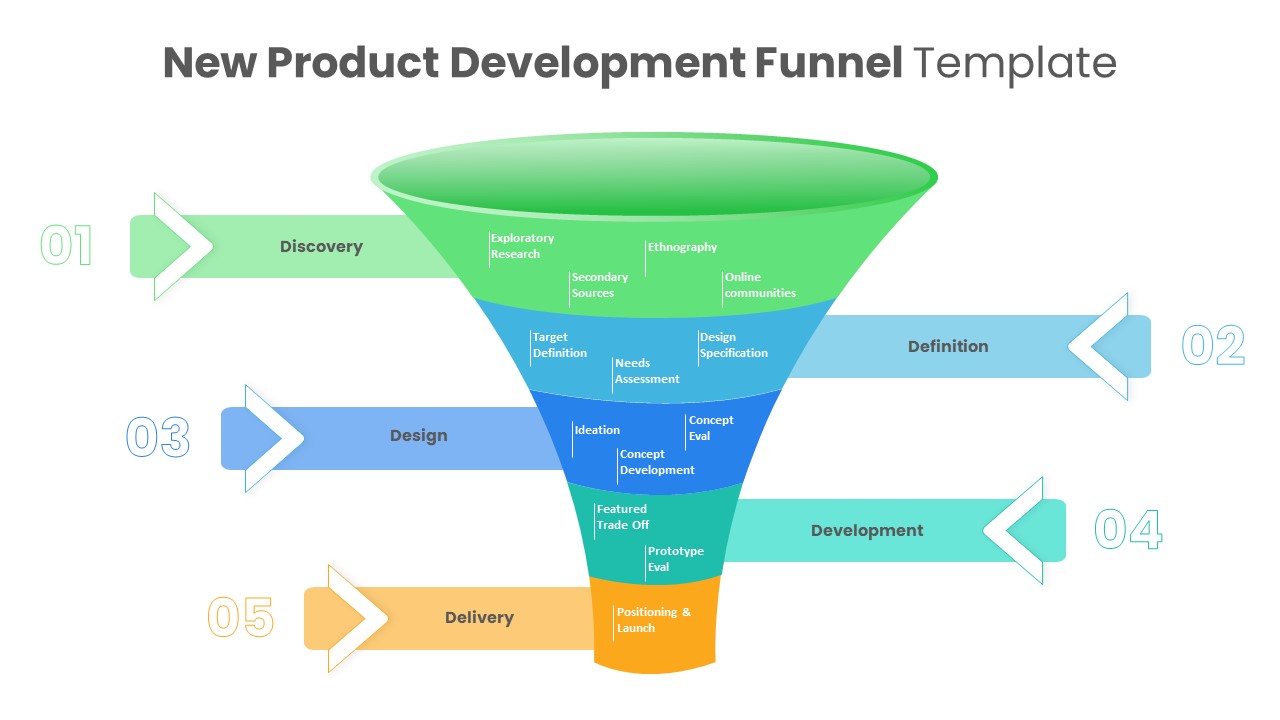
New Product Development Funnel Diagram Template for PowerPoint & Google Slides
Funnel
Premium
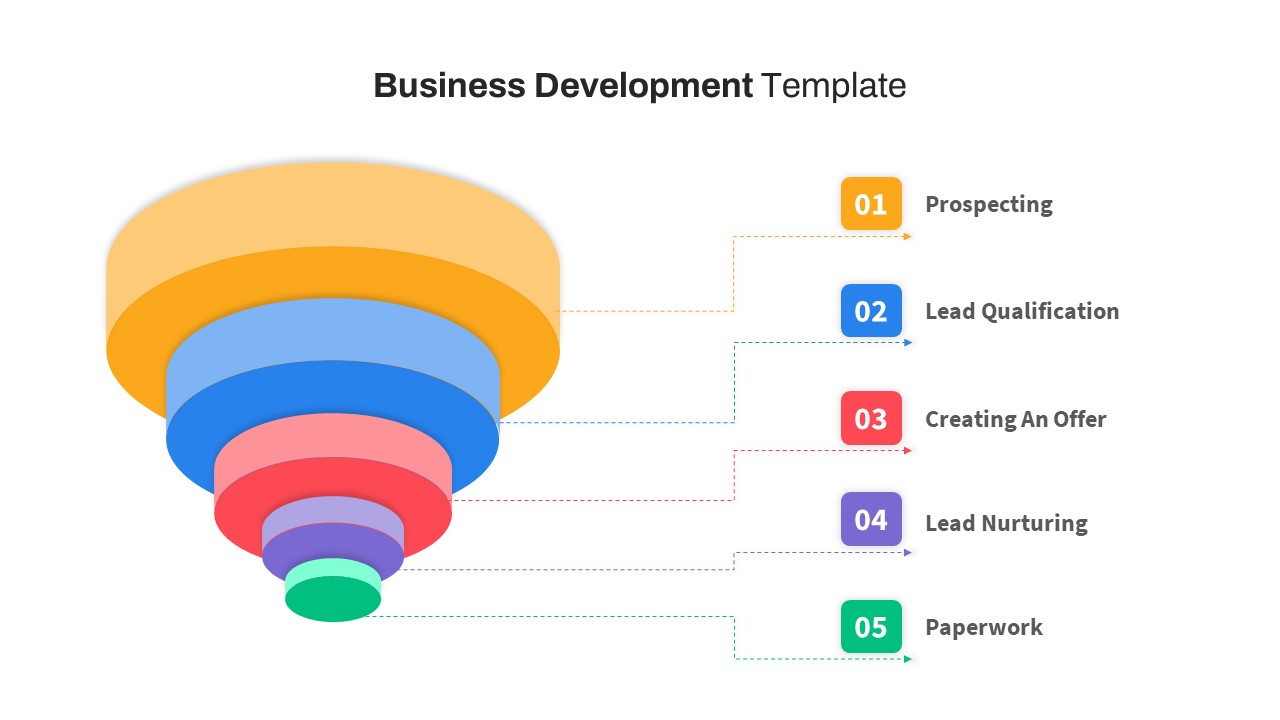
Free Business Development Funnel Diagram Template for PowerPoint & Google Slides
Marketing Funnel
Free
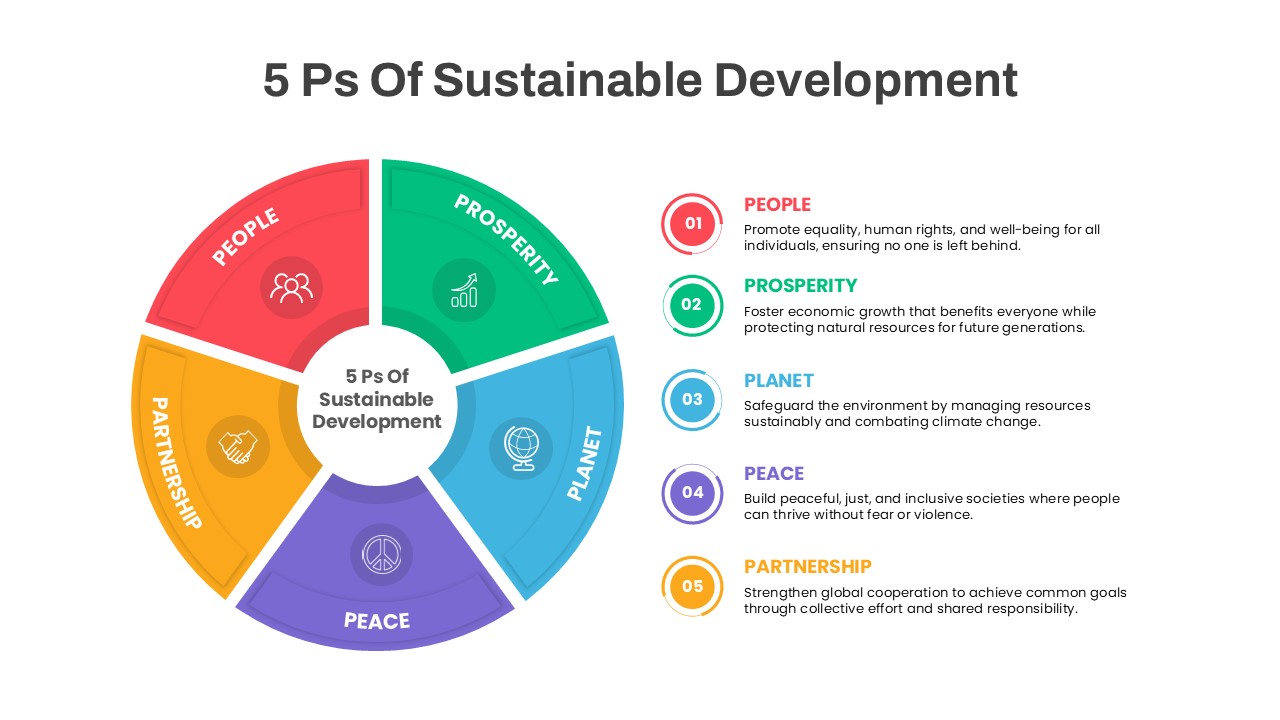
5 Ps Sustainable Development Diagram Template for PowerPoint & Google Slides
Circle
Premium
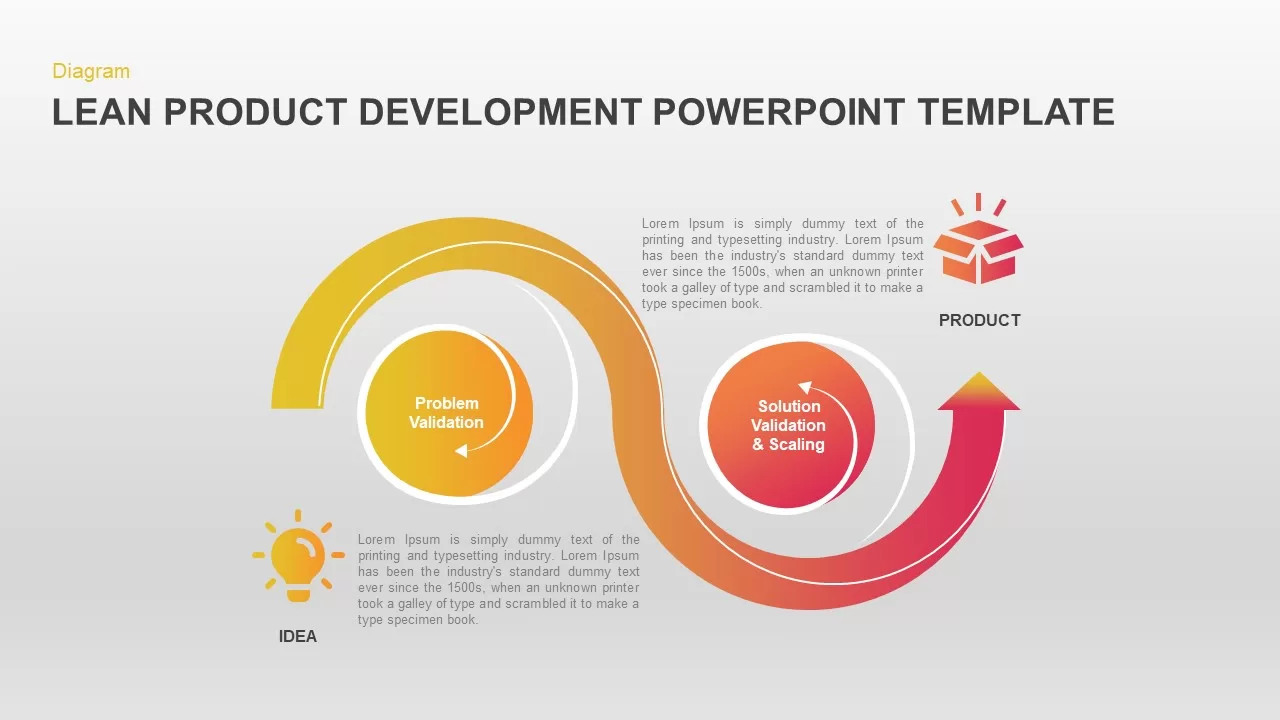
Lean Product Development Process diagram for PowerPoint & Google Slides
Business
Premium
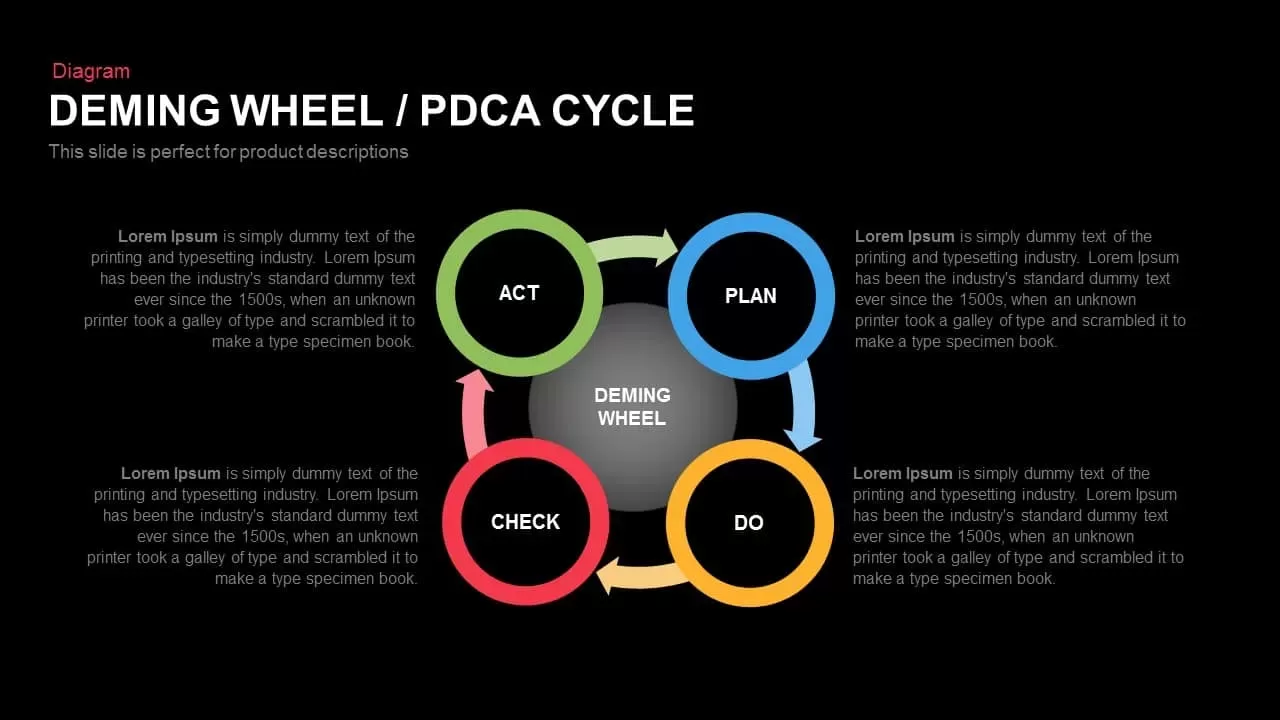
Deming Wheel PDCA Cycle Diagram Template for PowerPoint & Google Slides
Business Plan
Premium
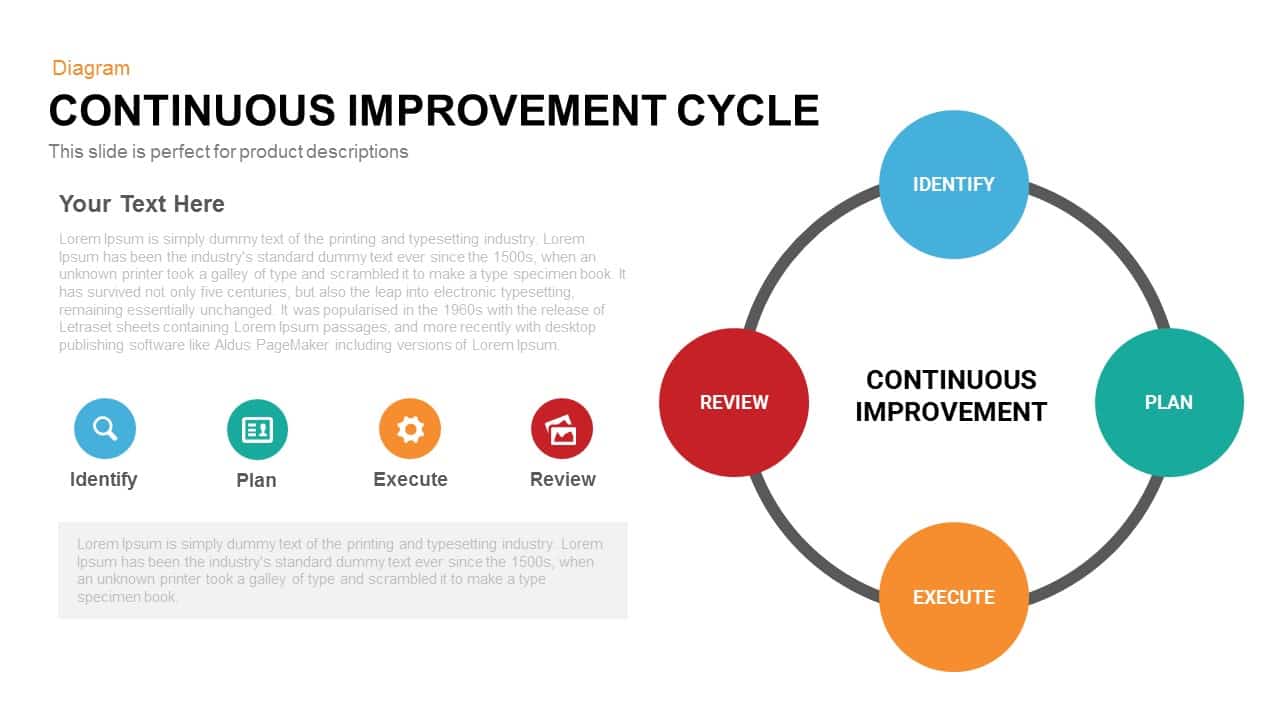
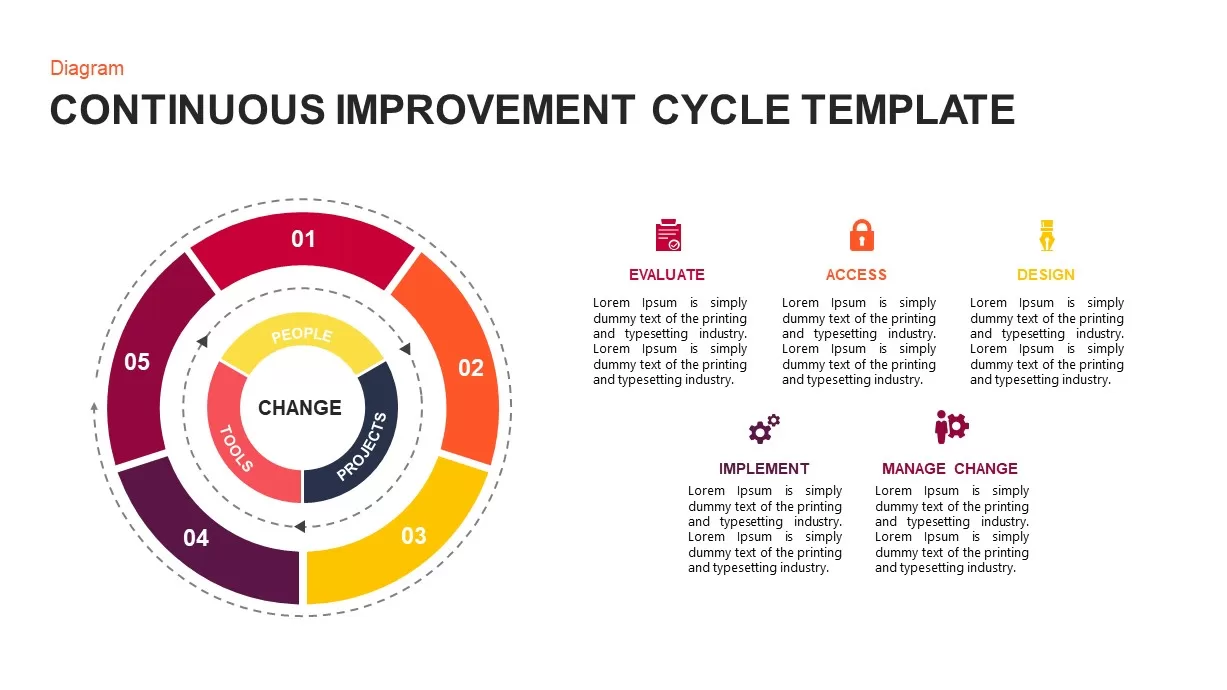
Continuous Improvement Cycle Diagram Template for PowerPoint & Google Slides
Circle
Premium
Modern Five-Stage Cycle Process Diagram Template for PowerPoint & Google Slides
Process
Premium
Six-Stage Circular Cycle Diagram Template for PowerPoint & Google Slides
Process
Premium
Four-Point Arrow Cycle Diagram Template for PowerPoint & Google Slides
Arrow
Premium

Data-Driven Marketing Cycle Diagram Template for PowerPoint & Google Slides
Customer Journey
Premium
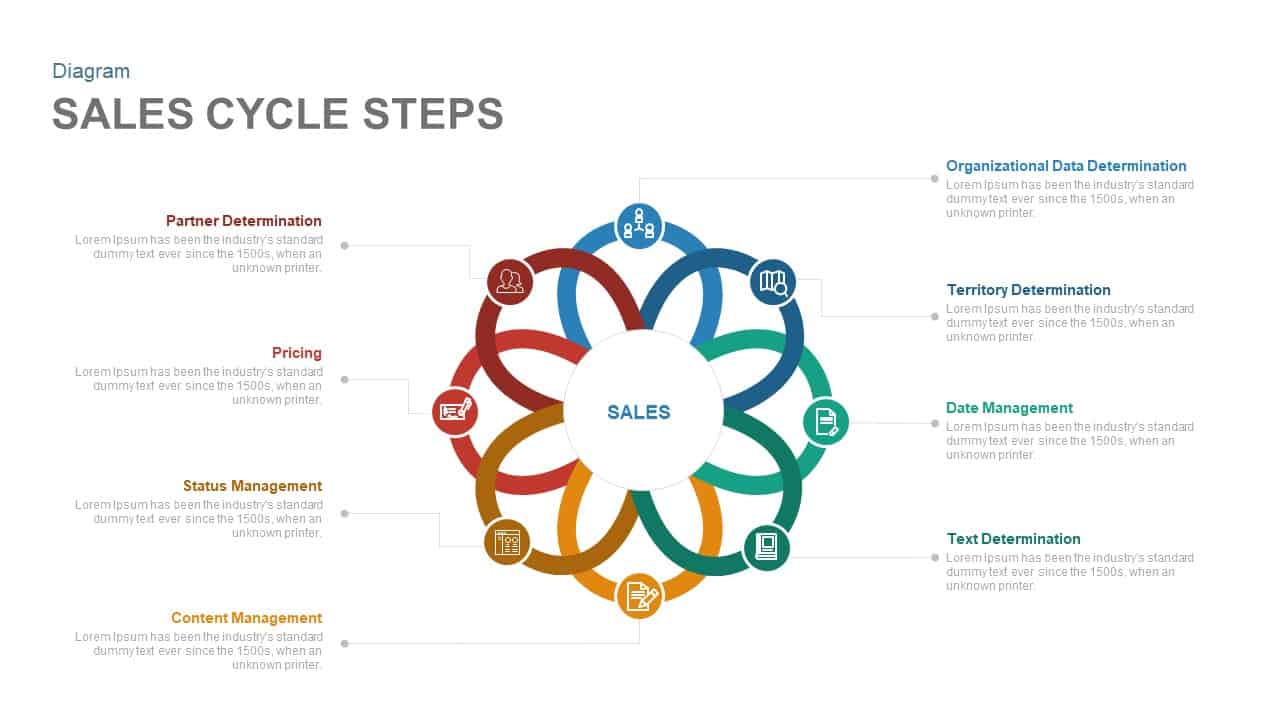
Eight-Step Sales Cycle Diagram Template for PowerPoint & Google Slides
Process
Premium
3, 4 & 5 Circular Stages Cycle Diagram Deck Template for PowerPoint & Google Slides
Circle
Premium
Four-Stage Cycle Process Diagram Template for PowerPoint & Google Slides
Process
Premium
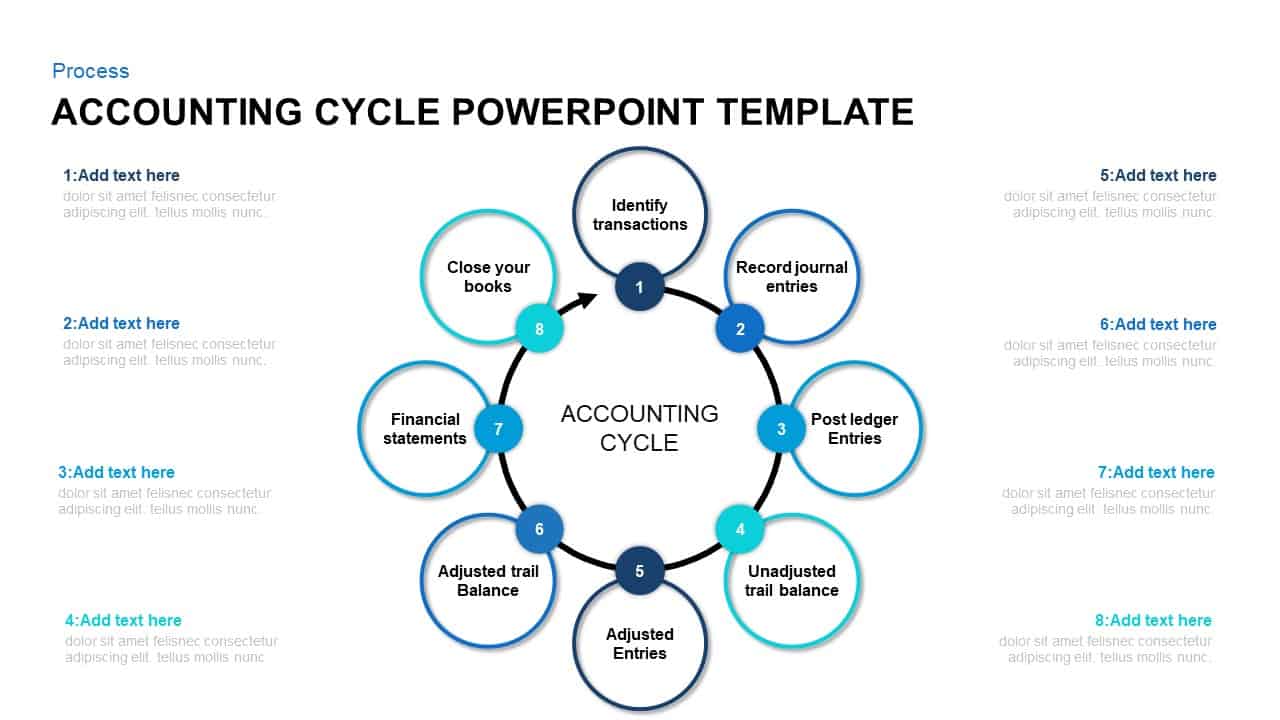
8-Step Circular Accounting Cycle Diagram Template for PowerPoint & Google Slides
Accounting
Premium
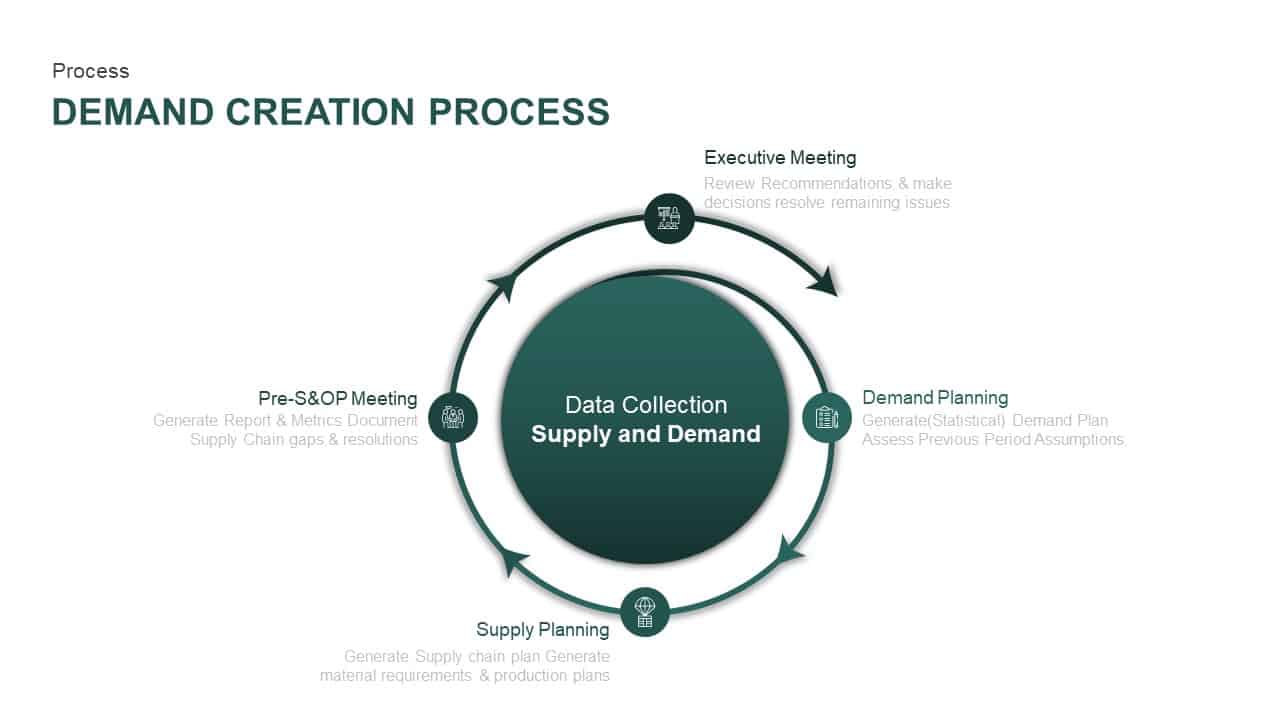
Supply and Demand Creation Cycle Diagram Template for PowerPoint & Google Slides
Process
Premium

Modern 6-Step Cycle Diagram Slide Deck Template for PowerPoint & Google Slides
Process
Premium
Enterprise Risk Management Cycle Diagram Template for PowerPoint & Google Slides
Process
Premium
4MAT Learning Cycle Circular Diagram Template for PowerPoint & Google Slides
Circle
Premium
4-Step Circular PDCA Cycle Diagram Template for PowerPoint & Google Slides
Process
Premium
Continuous Improvement Cycle Diagram Template for PowerPoint & Google Slides
Process
Premium
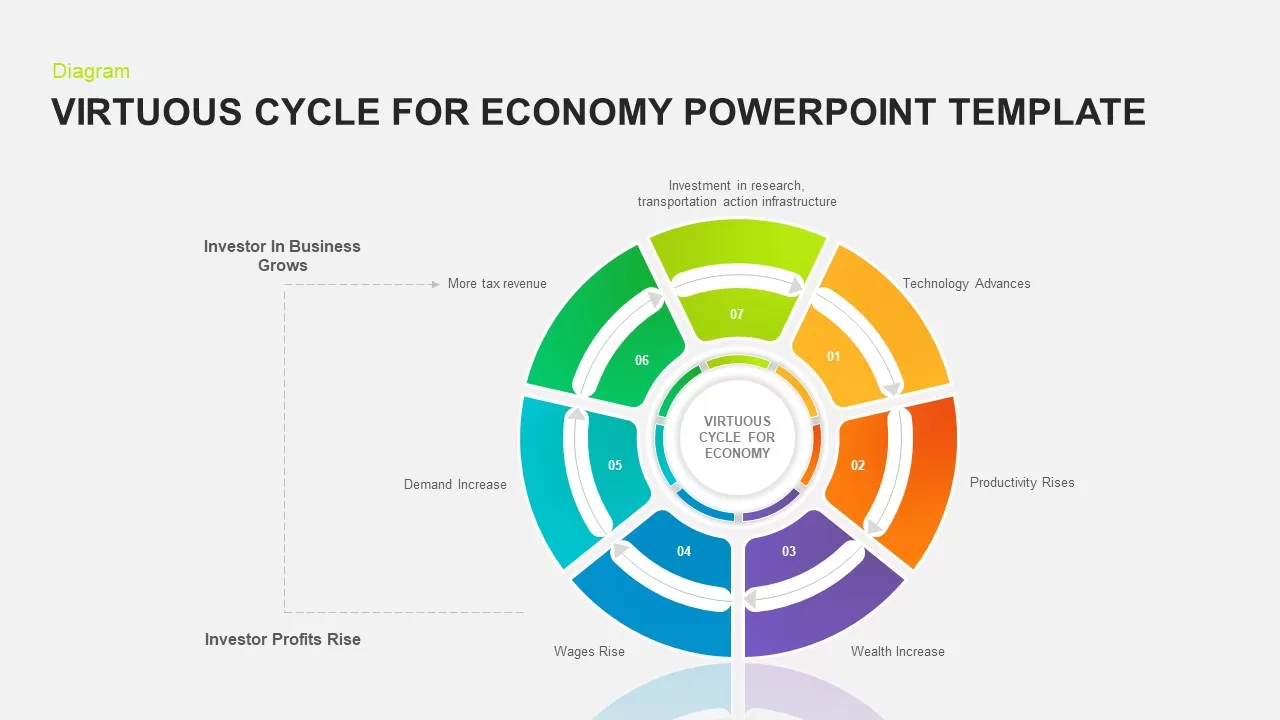
7-Step Virtuous Economy Cycle Diagram Template for PowerPoint & Google Slides
Process
Premium
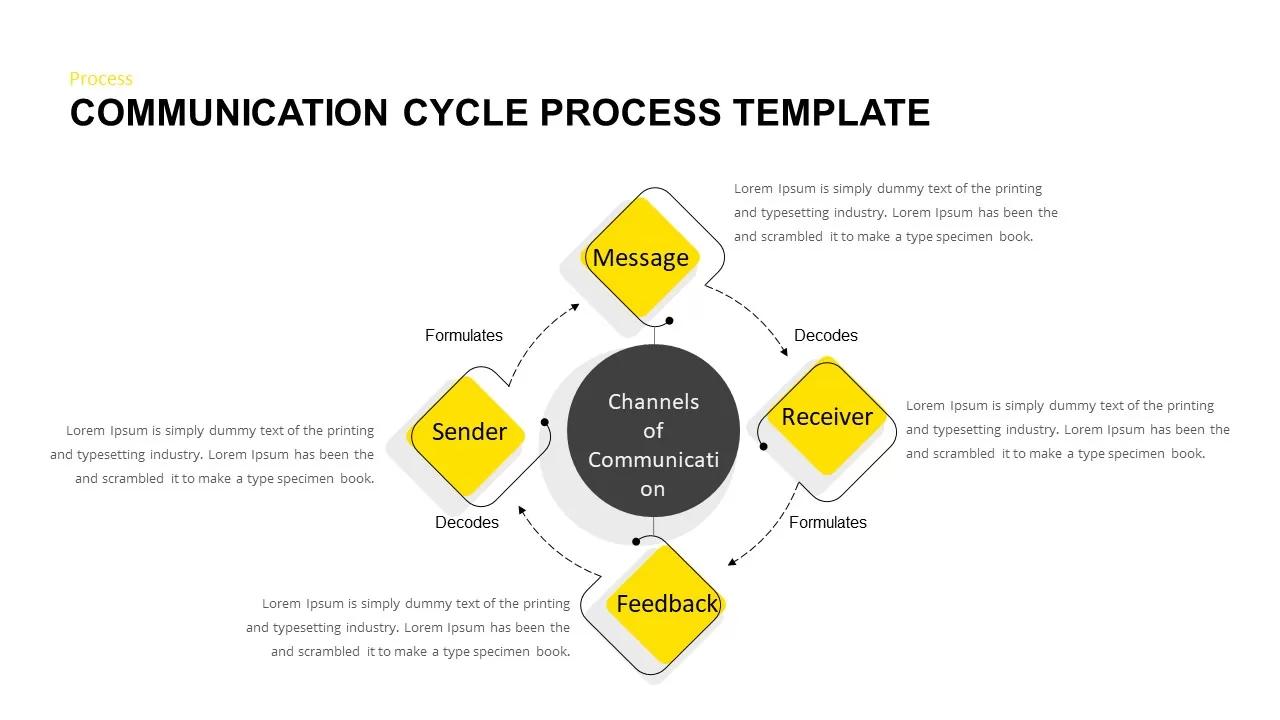
Communication Cycle Process Diagram template for PowerPoint & Google Slides
Business
Premium
Concentric Circular Arrow Cycle Diagram Template for PowerPoint & Google Slides
Process
Premium
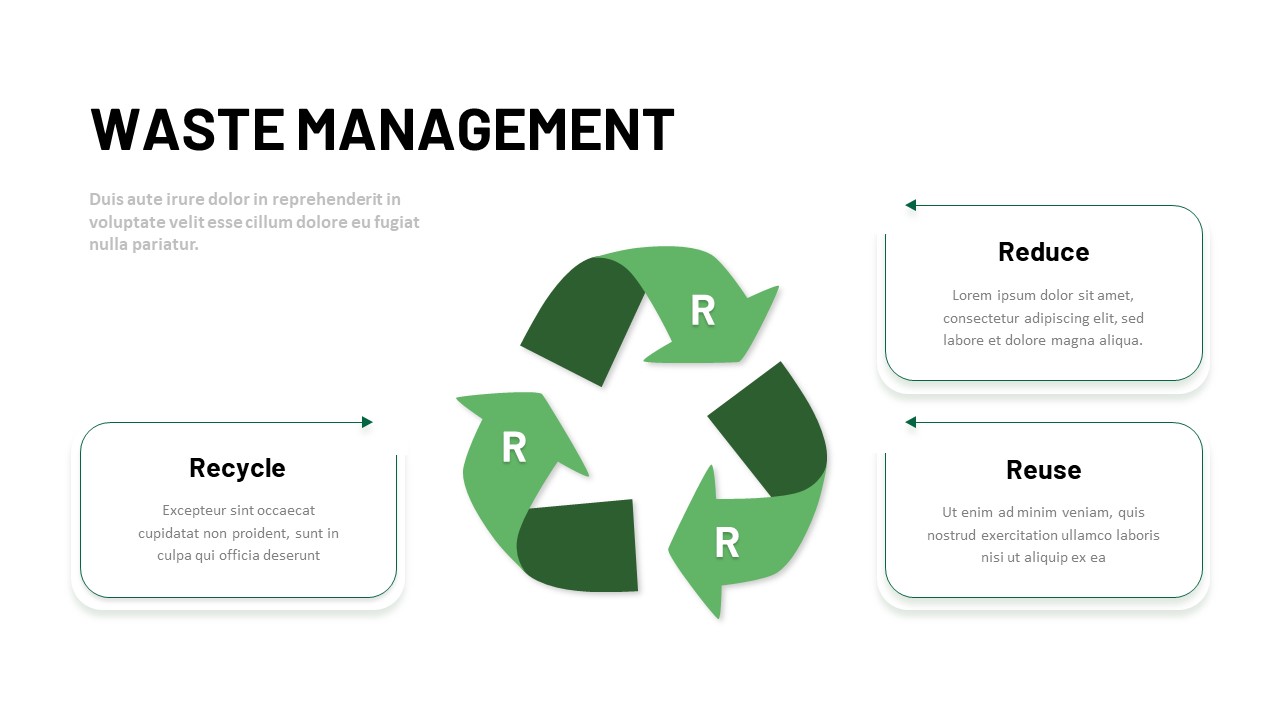
3R Waste Management Cycle Diagram Template for PowerPoint & Google Slides
Circle
Premium
Release Management Cycle Circular Diagram Template for PowerPoint & Google Slides
Software Development
Premium
Business Process Analysis Cycle Diagram Template for PowerPoint & Google Slides
Business Strategy
Premium
Free Time Management Clock Cycle Diagram Template for PowerPoint & Google Slides
Process
Free
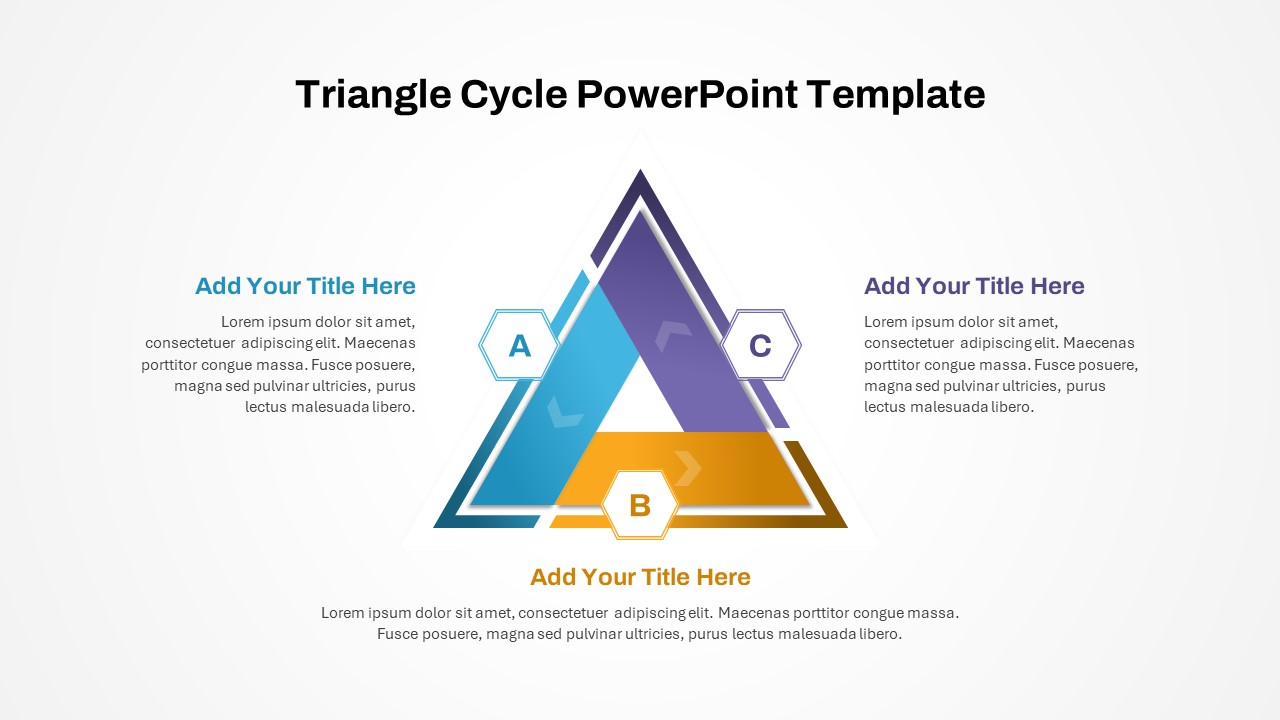
Three-Phase Triangle Cycle Diagram Template for PowerPoint & Google Slides
Infographics
Premium
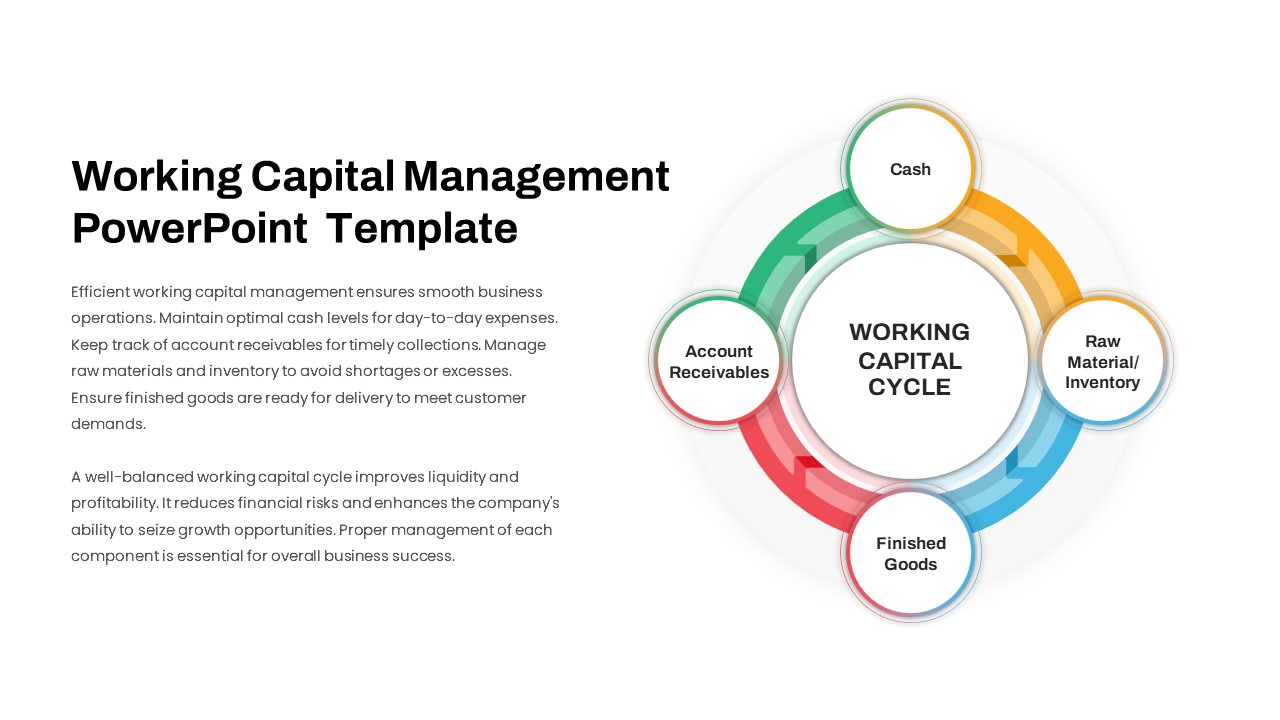
Working Capital Cycle Diagram Template for PowerPoint & Google Slides
Circle
Premium
Gartner Hype Cycle Adoption Curve Diagram Template for PowerPoint & Google Slides
Infographics
Premium
Colorful Startup Financing Cycle Diagram Template for PowerPoint & Google Slides
Finance
Premium
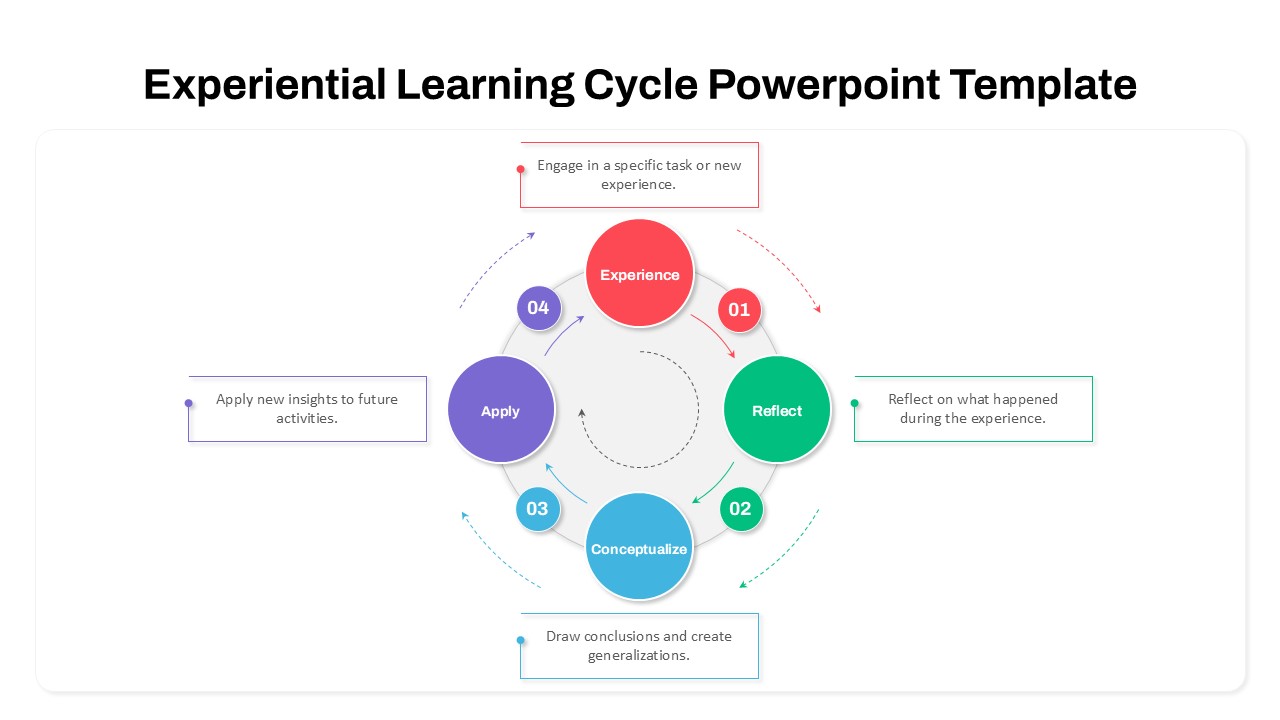
Experiential Learning Cycle Diagram Template for PowerPoint & Google Slides
Circle
Premium
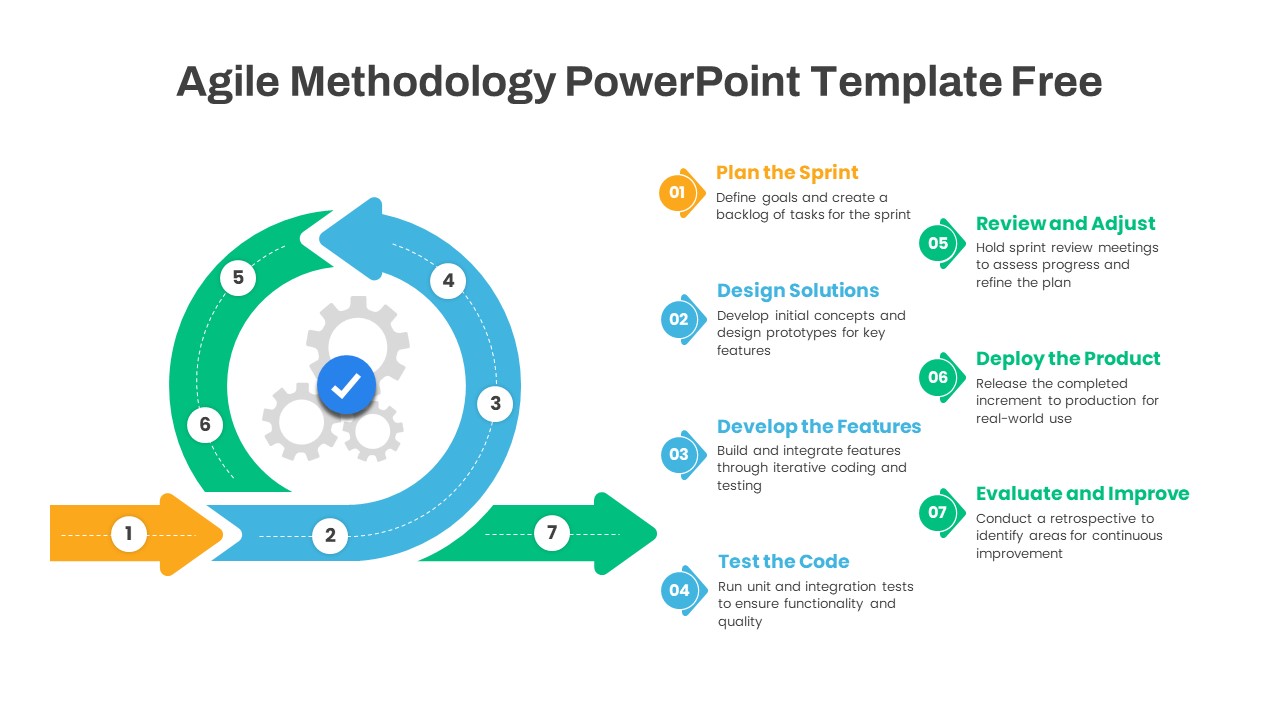
Agile Methodology Cycle Diagram Template for PowerPoint & Google Slides
Project
Free
Change Management Process Cycle Diagram Template for PowerPoint & Google Slides
Process
Premium
Flywheel Growth Cycle Diagram Template for PowerPoint & Google Slides
Circle
Premium
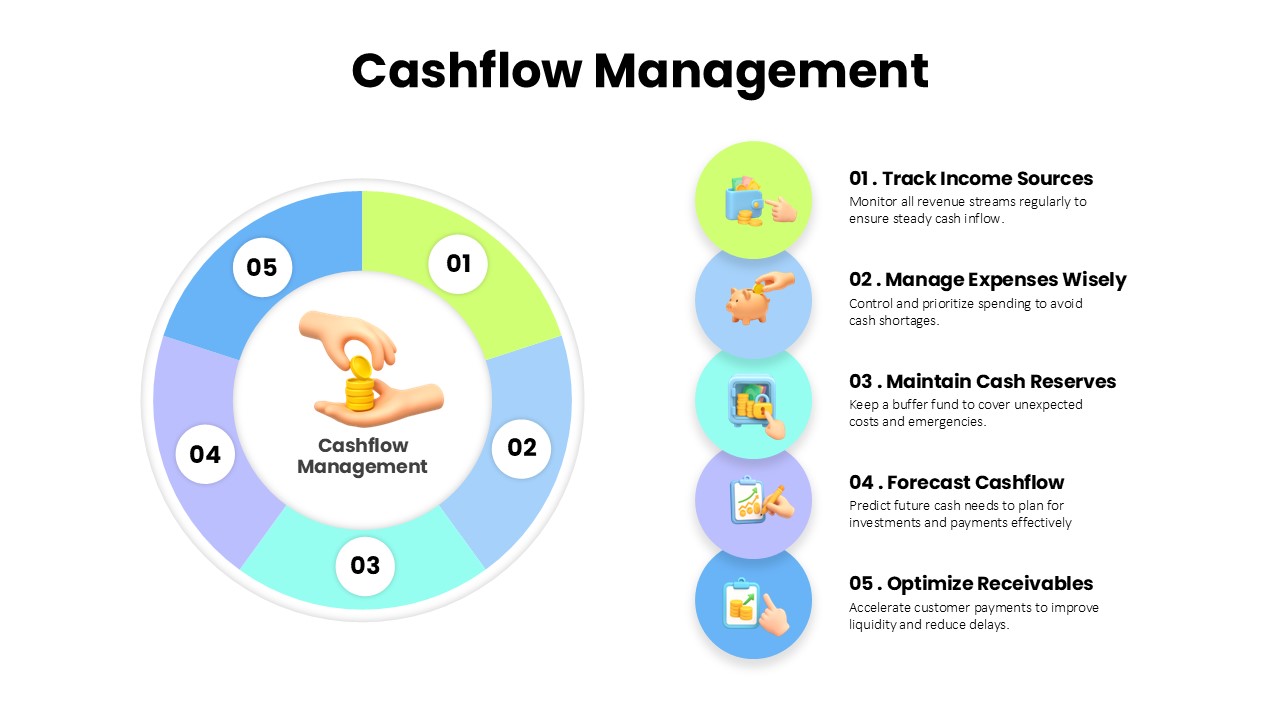
Cashflow Management Cycle Diagram Template for PowerPoint & Google Slides
Finance
Premium
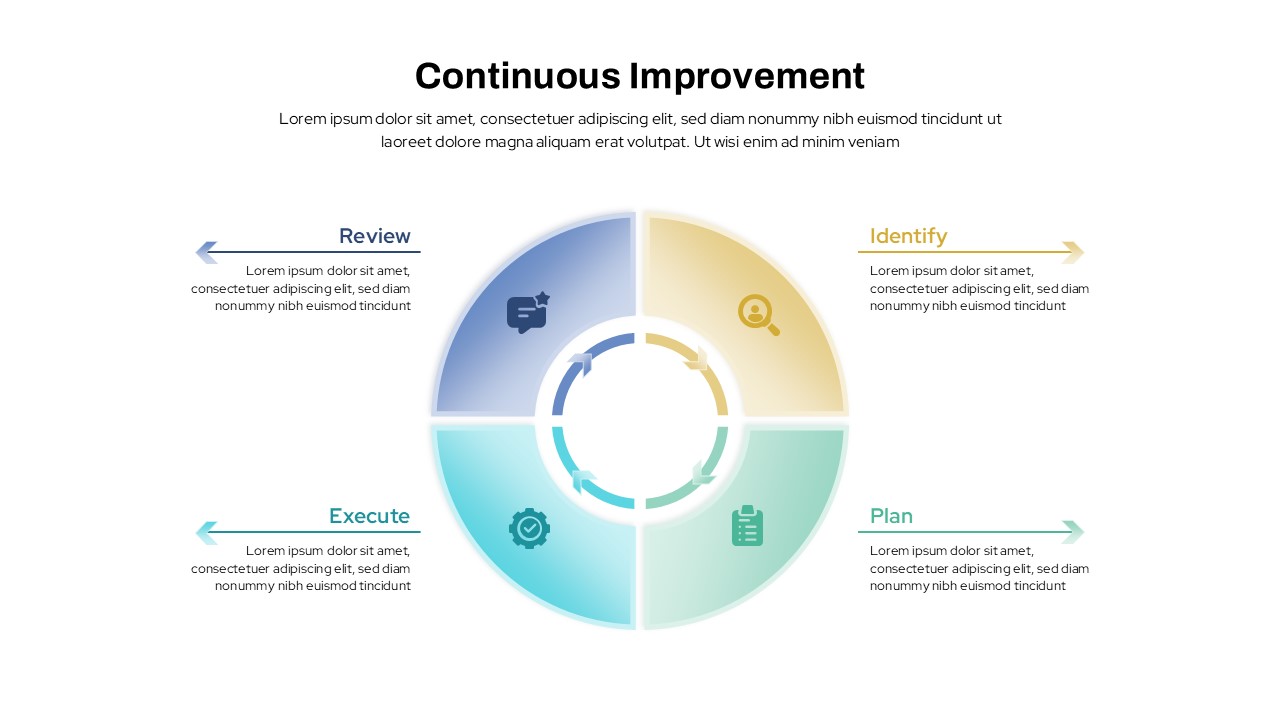
Continuous Improvement Cycle Diagram Template for PowerPoint & Google Slides
Process
Premium
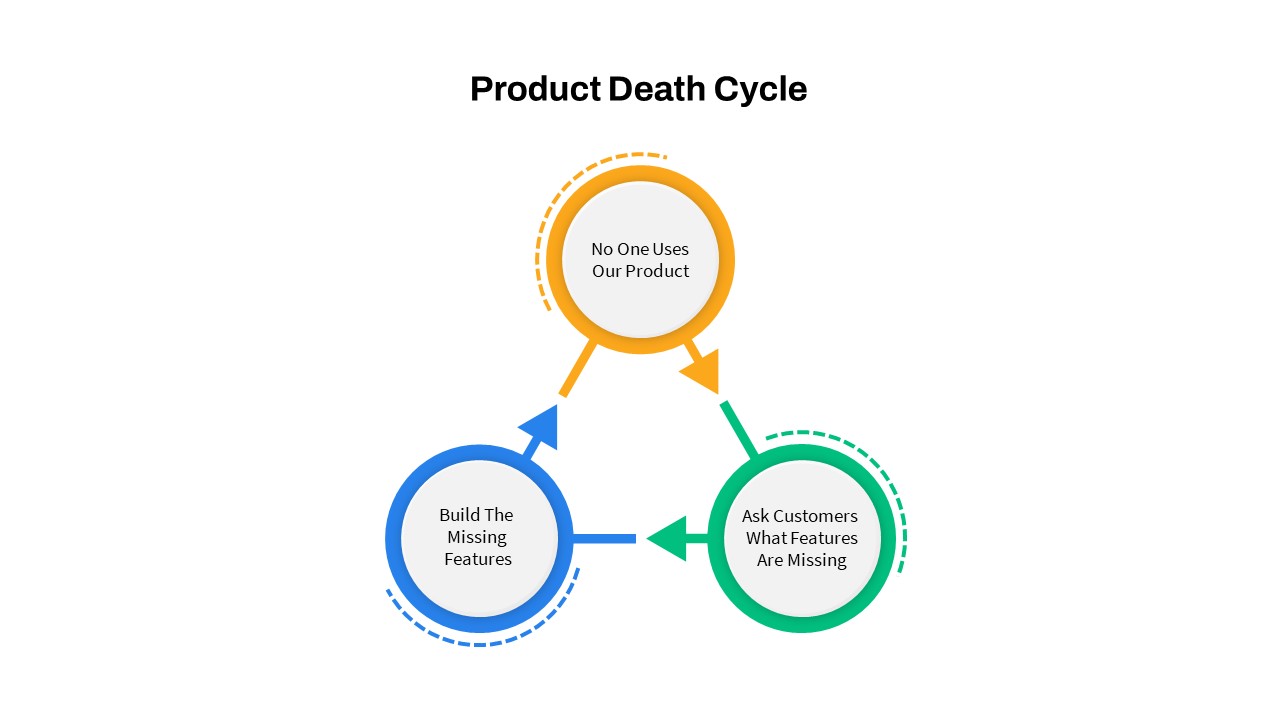
Product Death Cycle Diagram Slide for PowerPoint & Google Slides
Circle
Premium
Market Development Matrix Chart Template for PowerPoint & Google Slides
Comparison Chart
Premium
Product Development template for PowerPoint & Google Slides
Process
Premium

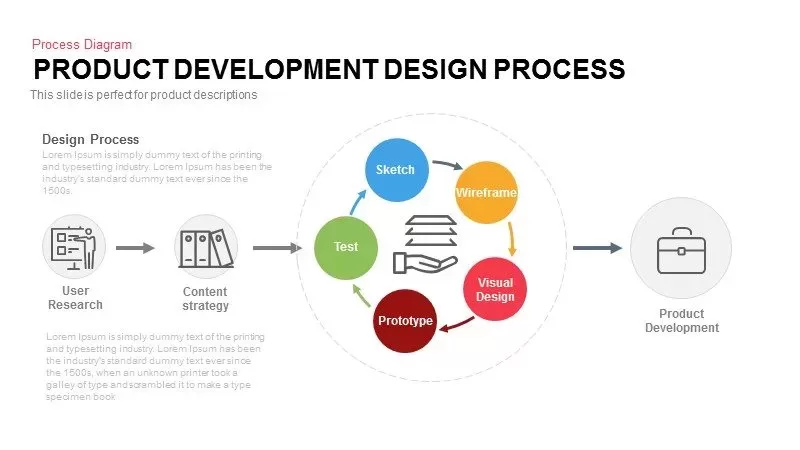
Product Development Design Process template for PowerPoint & Google Slides
Process
Premium
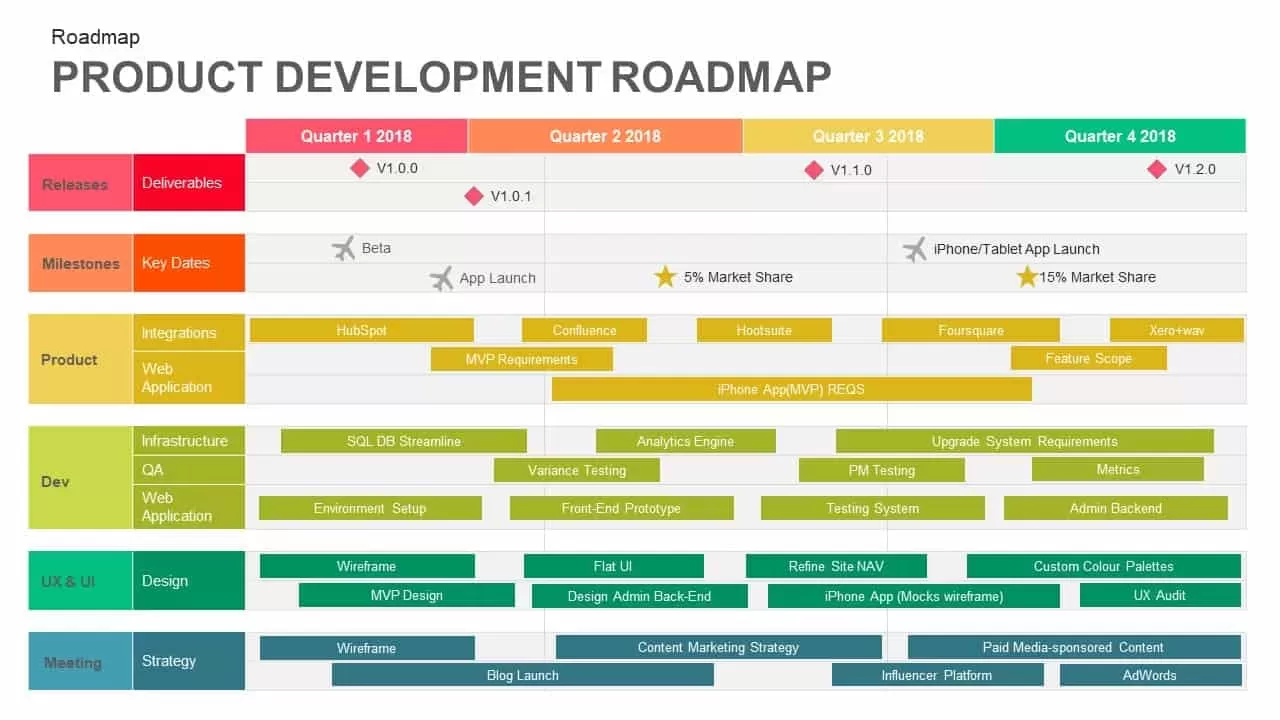
Product Development Roadmap template for PowerPoint & Google Slides
Roadmap
Premium

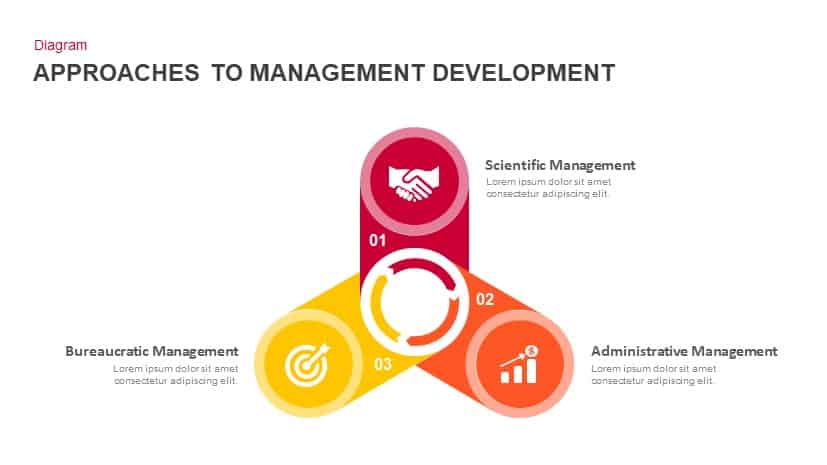
Approaches to Management Development template for PowerPoint & Google Slides
Infographics
Premium
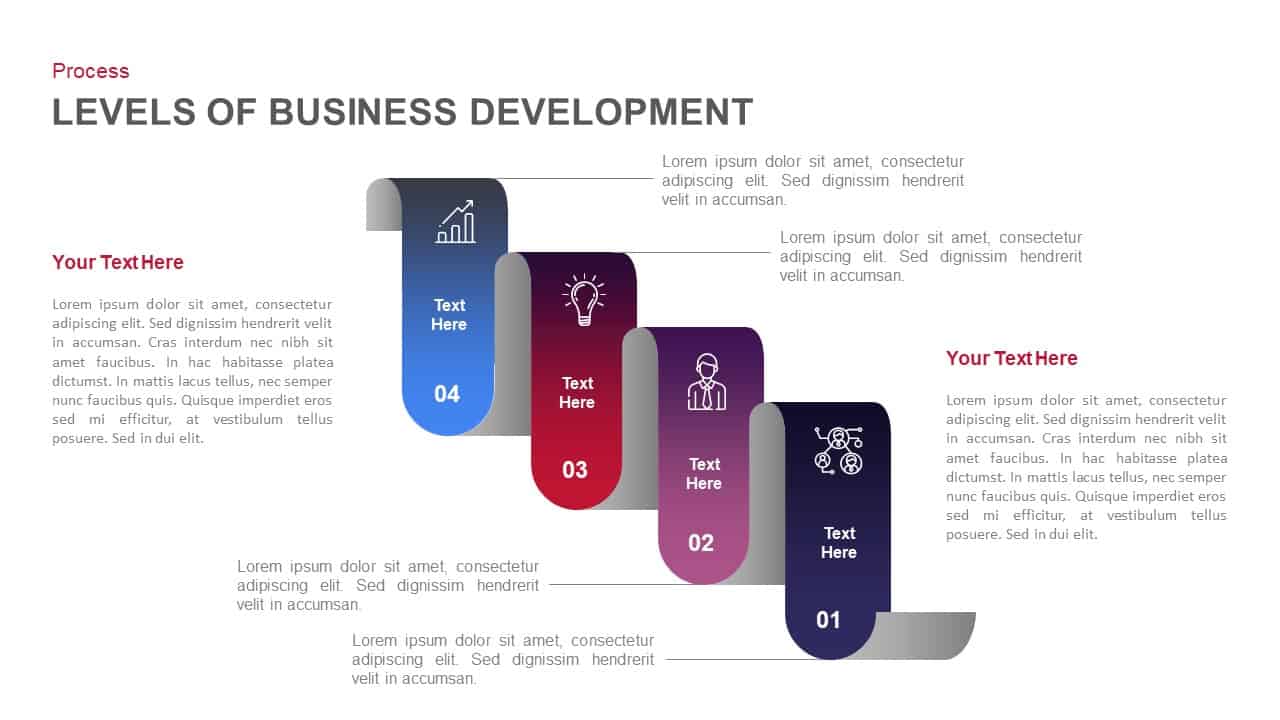
Four Levels of Business Development Template for PowerPoint & Google Slides
Process
Premium
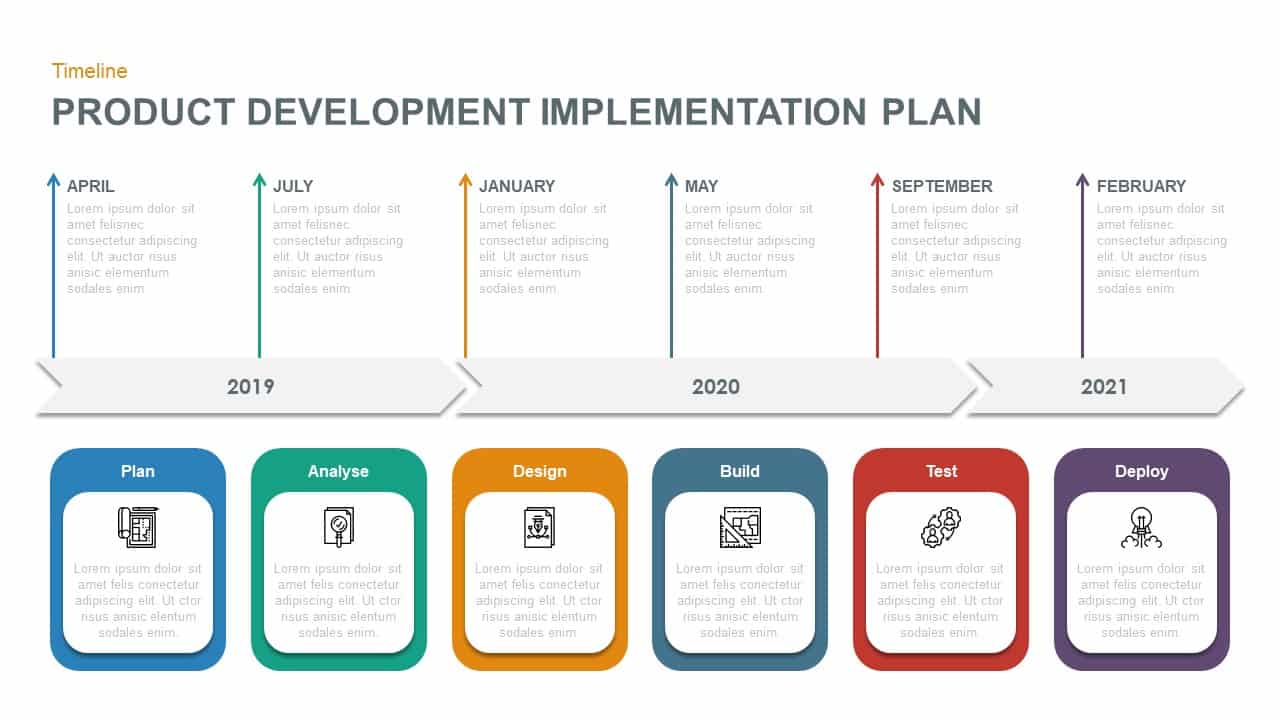
Product Development Plan Timeline Template for PowerPoint & Google Slides
Timeline
Premium
Six-Step Accounting Process Development Template for PowerPoint & Google Slides
Process
Premium
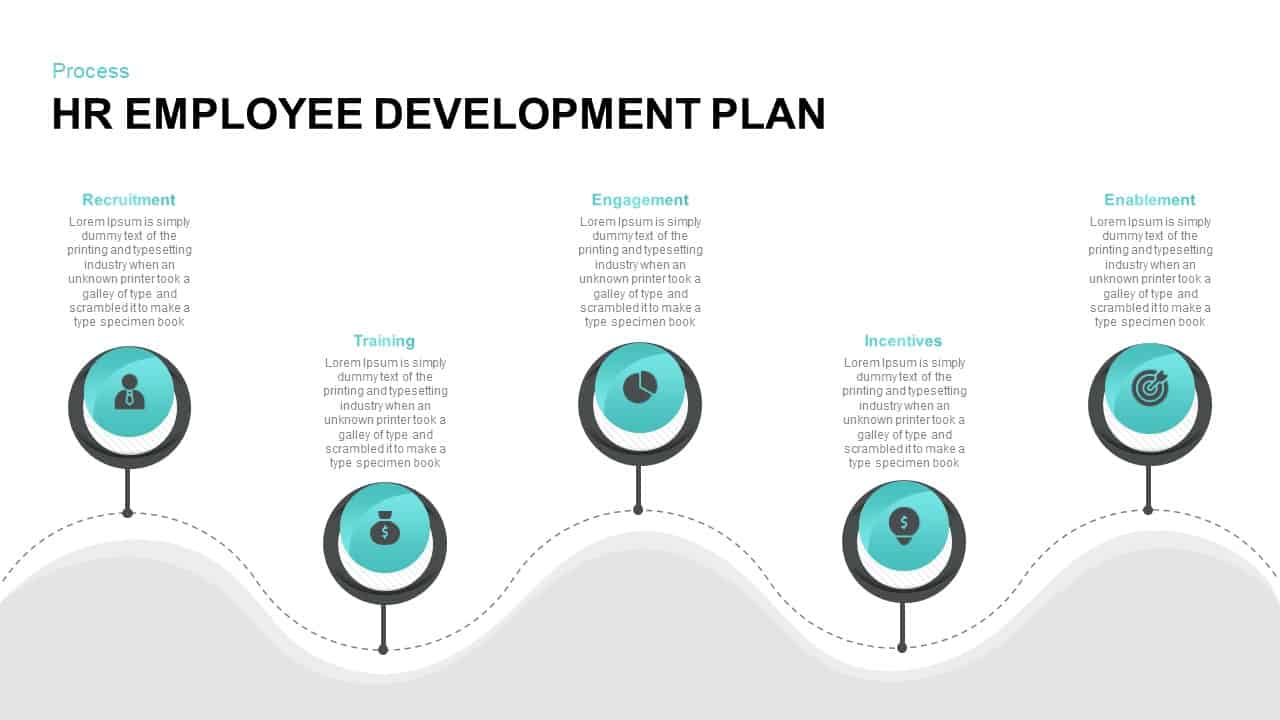
HR Employee Development Plan Process Template for PowerPoint & Google Slides
Employee Performance
Premium
Development Goals Timeline Process Template for PowerPoint & Google Slides
Goals
Premium
Product Development Process Overview template for PowerPoint & Google Slides
Process
Premium
HR Employee Development Plan Process template for PowerPoint & Google Slides
Recruitment
Premium
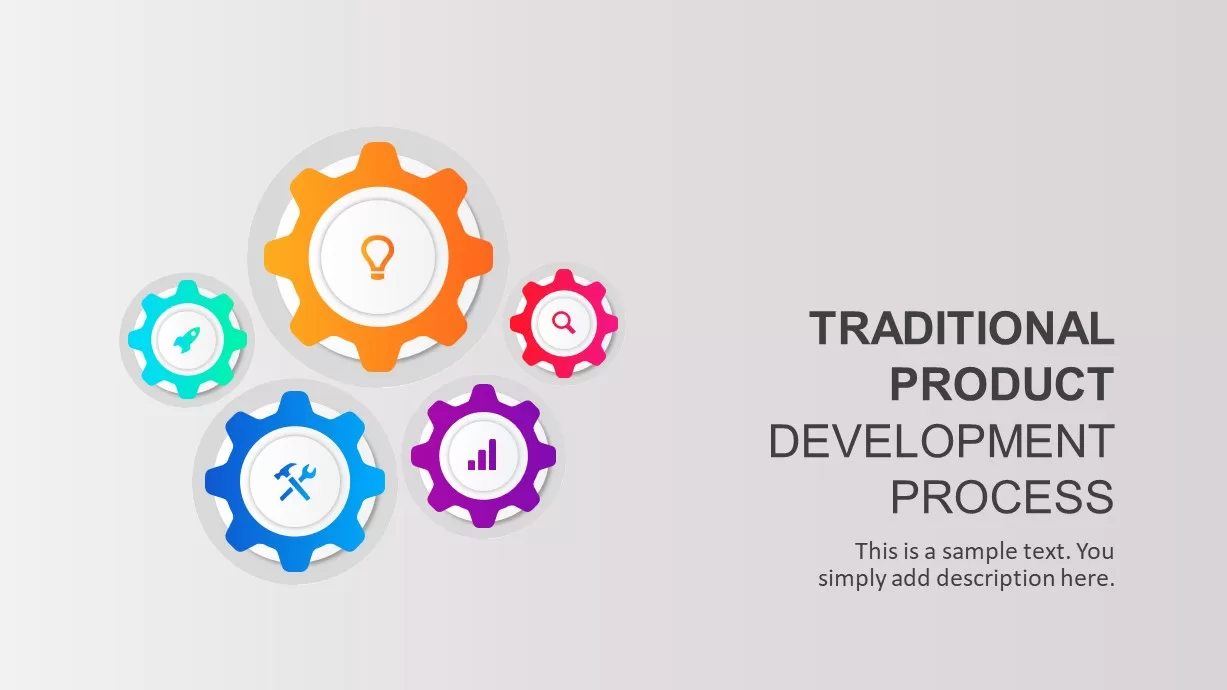
Traditional Product Development Process Template for PowerPoint & Google Slides
Process
Premium
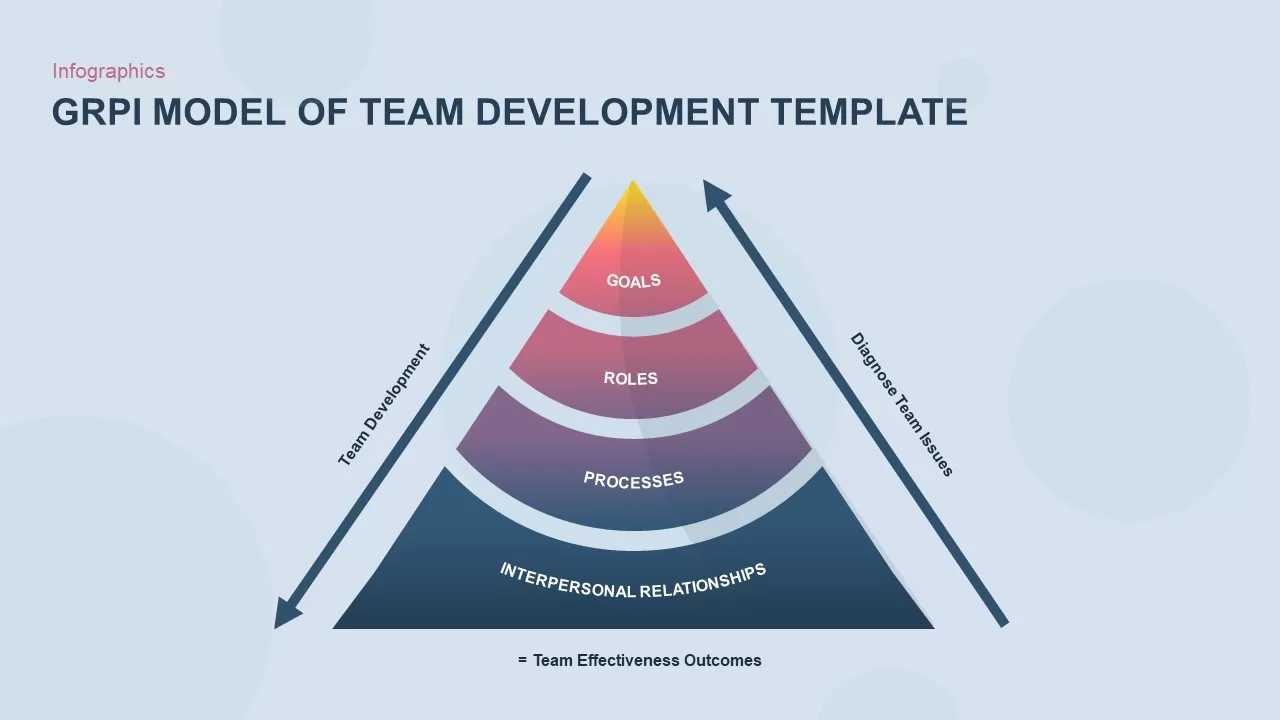
GRPI Model of Team Development Framework Template for PowerPoint & Google Slides
Leadership
Premium
Free App Development Company Profile template for PowerPoint & Google Slides
Company Profile
Free
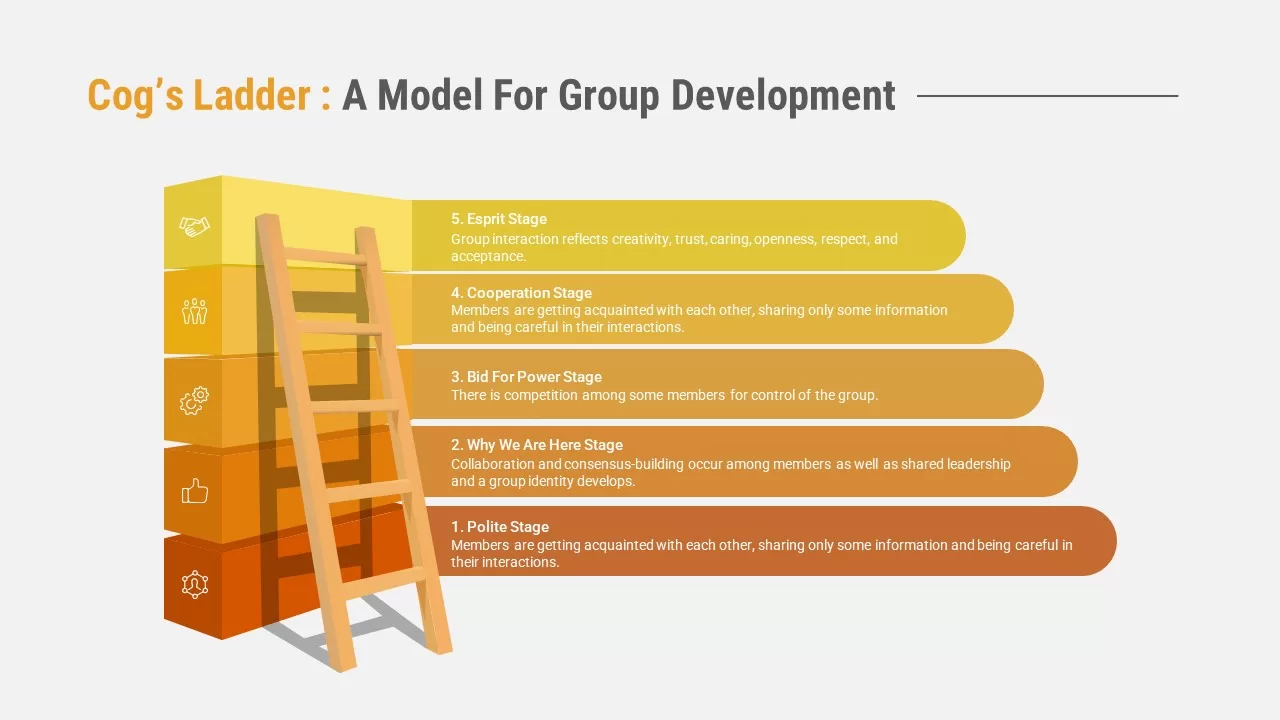
Cog’s Ladder Model for Group Development PowerPoint & Google Slides Template
Leadership
Premium
Four-Stage Development Pipeline Template for PowerPoint & Google Slides
Process
Premium
Development Pipeline Process template for PowerPoint & Google Slides
Process
Premium
Development Pipeline Process Infographic Template for PowerPoint & Google Slides
Process
Premium

Leadership Development Training Template for PowerPoint & Google Slides
Employee Performance
Premium
Leadership Training & Development Template for PowerPoint & Google Slides
Leadership
Premium
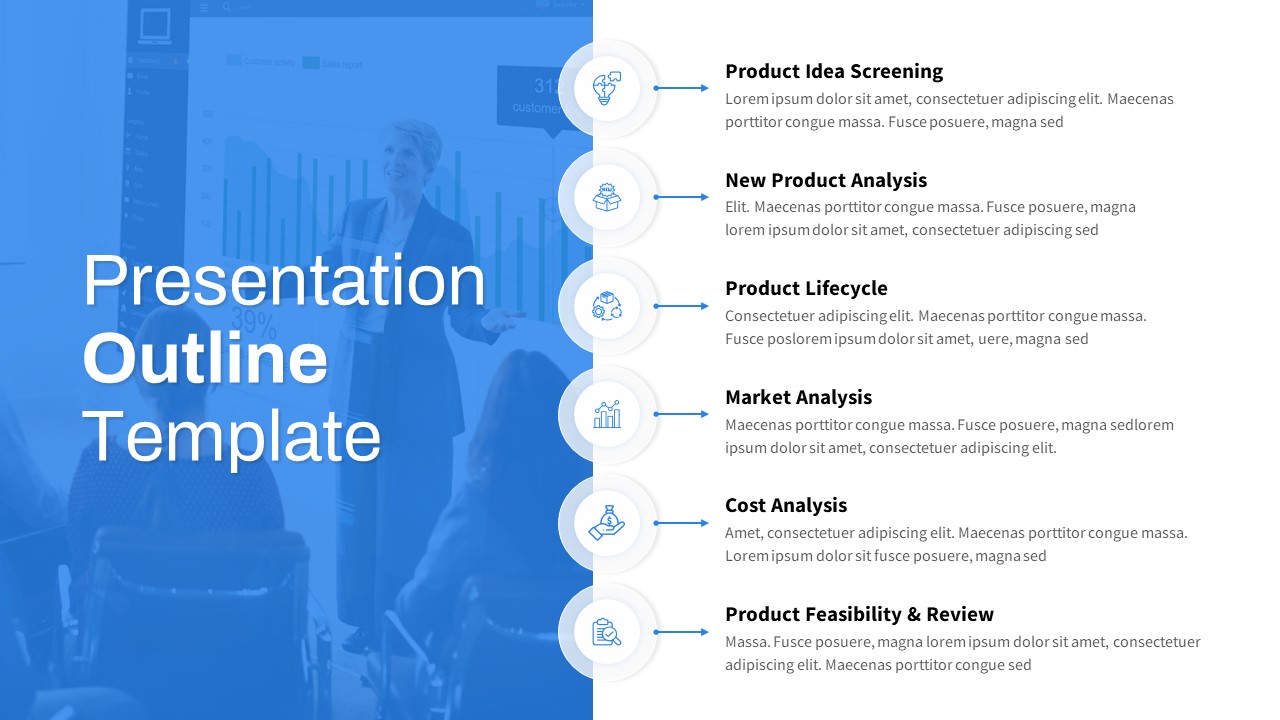
Free Product Development Process Outline Template for PowerPoint & Google Slides
Infographics
Free
Growth Plant Nurture Business Development Template for PowerPoint & Google Slides
Decks
Premium
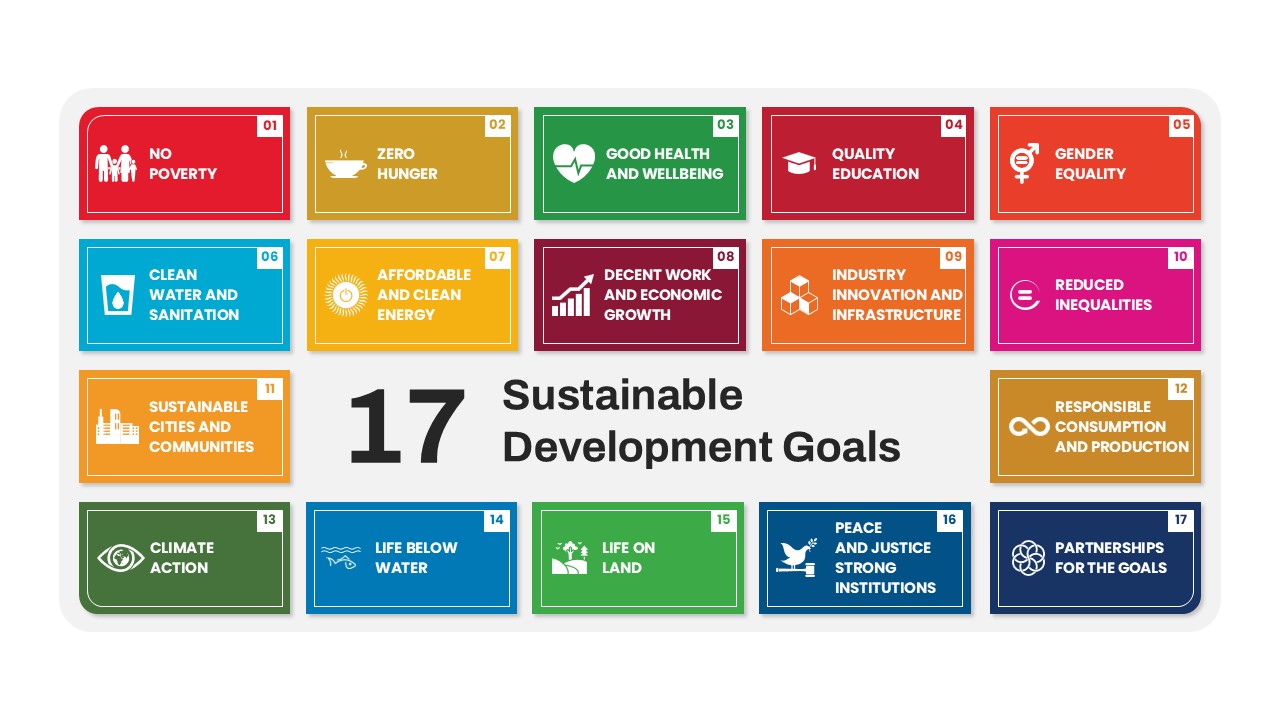
17 Sustainable Development Goals List Template for PowerPoint & Google Slides
Goals
Premium
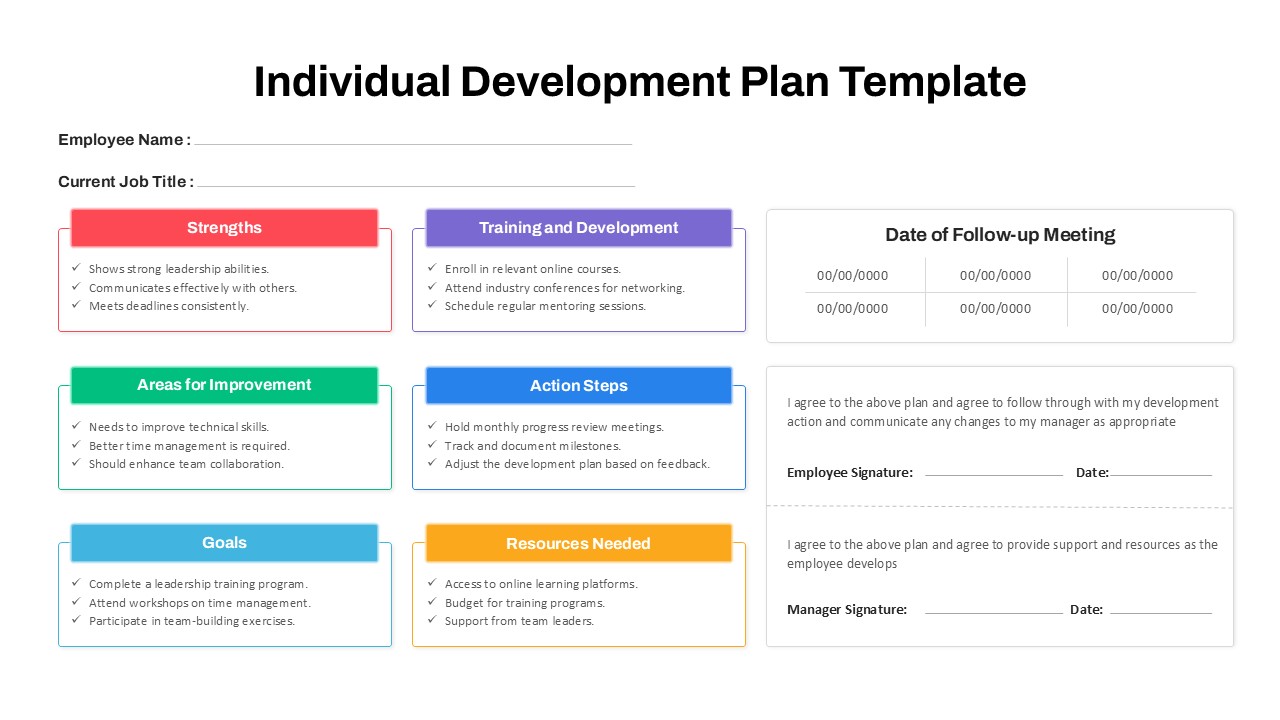
Employee Individual Development Plan Template for PowerPoint & Google Slides
Employee Performance
Premium
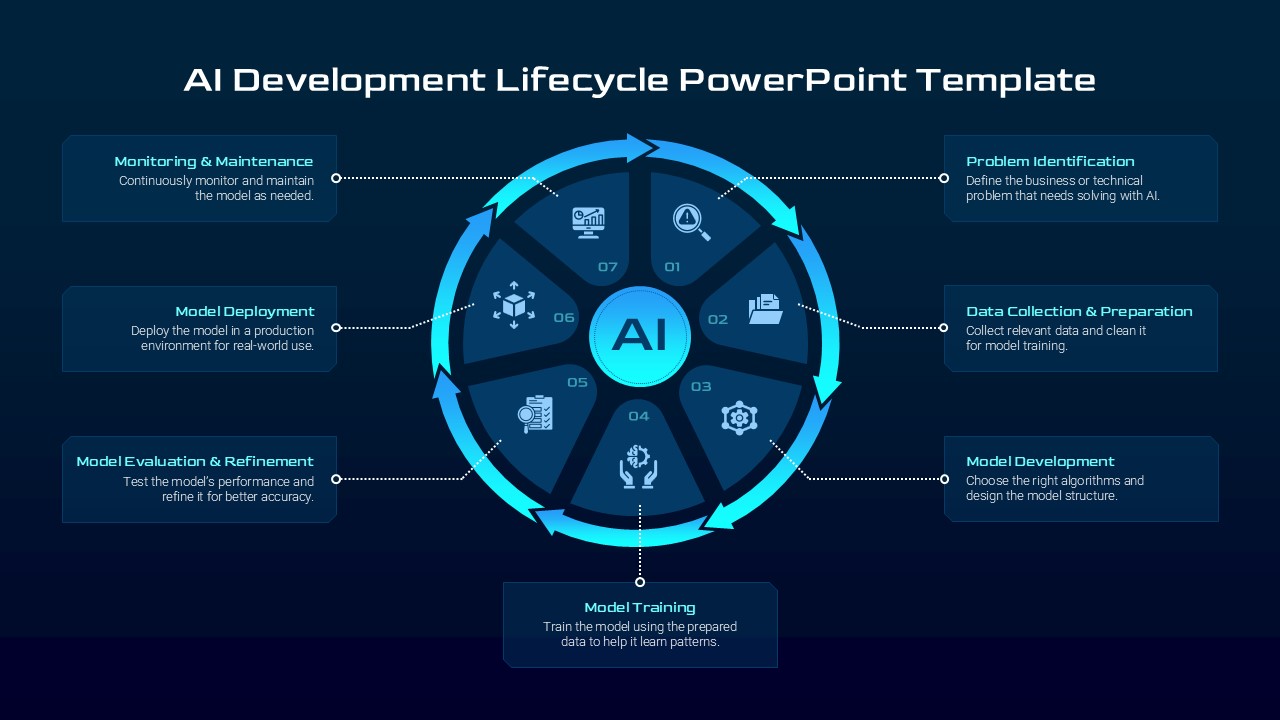
AI Development Lifecycle Dark Circular Template for PowerPoint & Google Slides
Circle
Premium
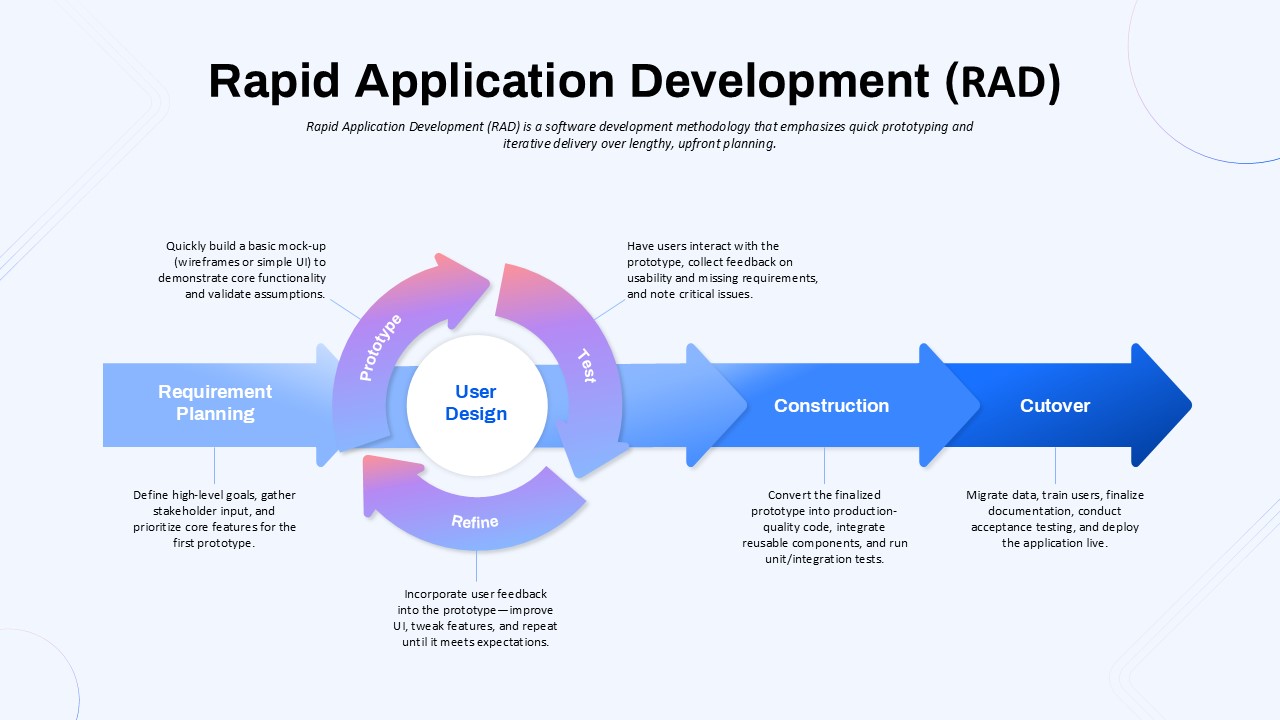
Rapid Application Development (RAD) Process template for PowerPoint & Google Slides
Software Development
Premium
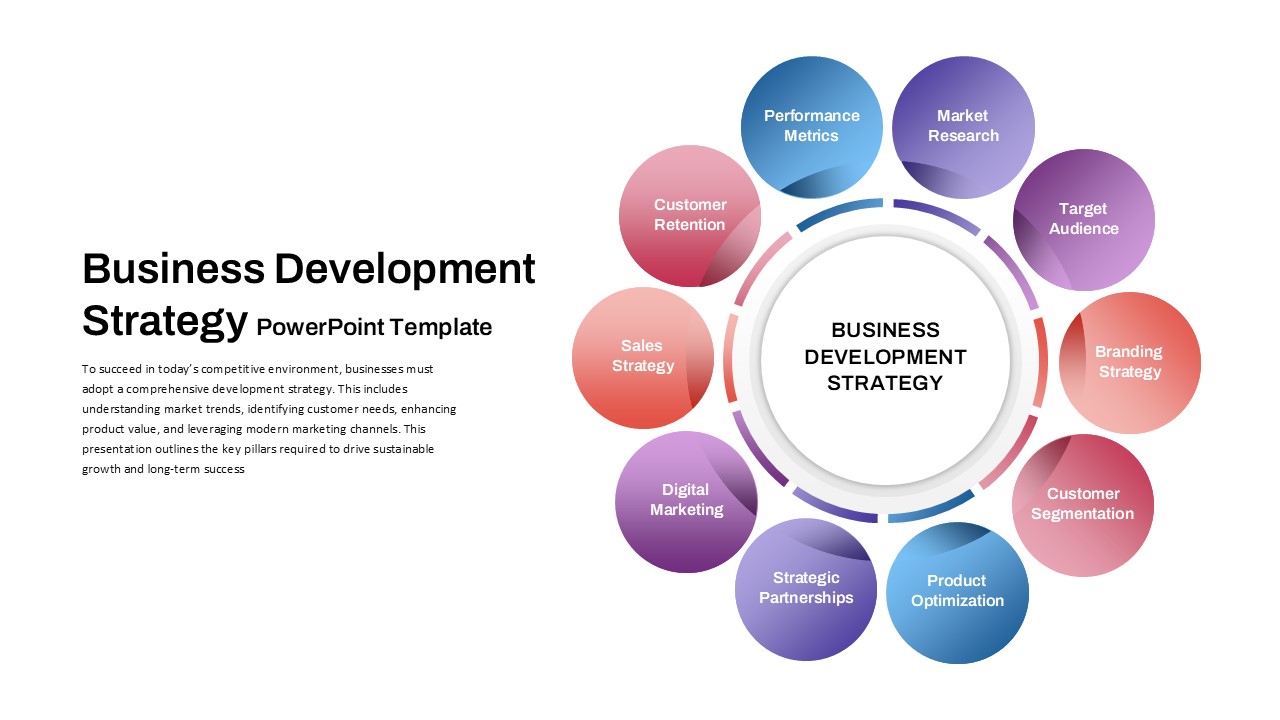
Business Development Strategy Radial Hub Template for PowerPoint & Google Slides
Circle
Premium
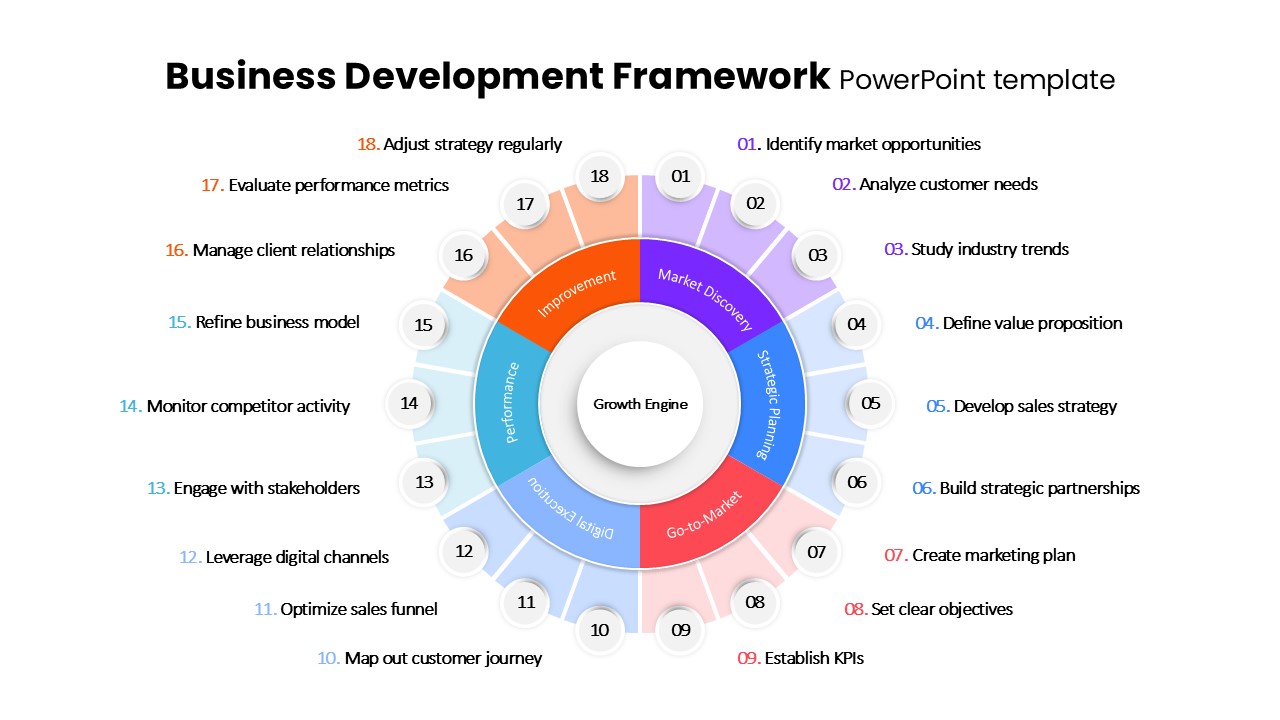
Business Development Framework Pack Template for PowerPoint & Google Slides
Business Strategy
Premium
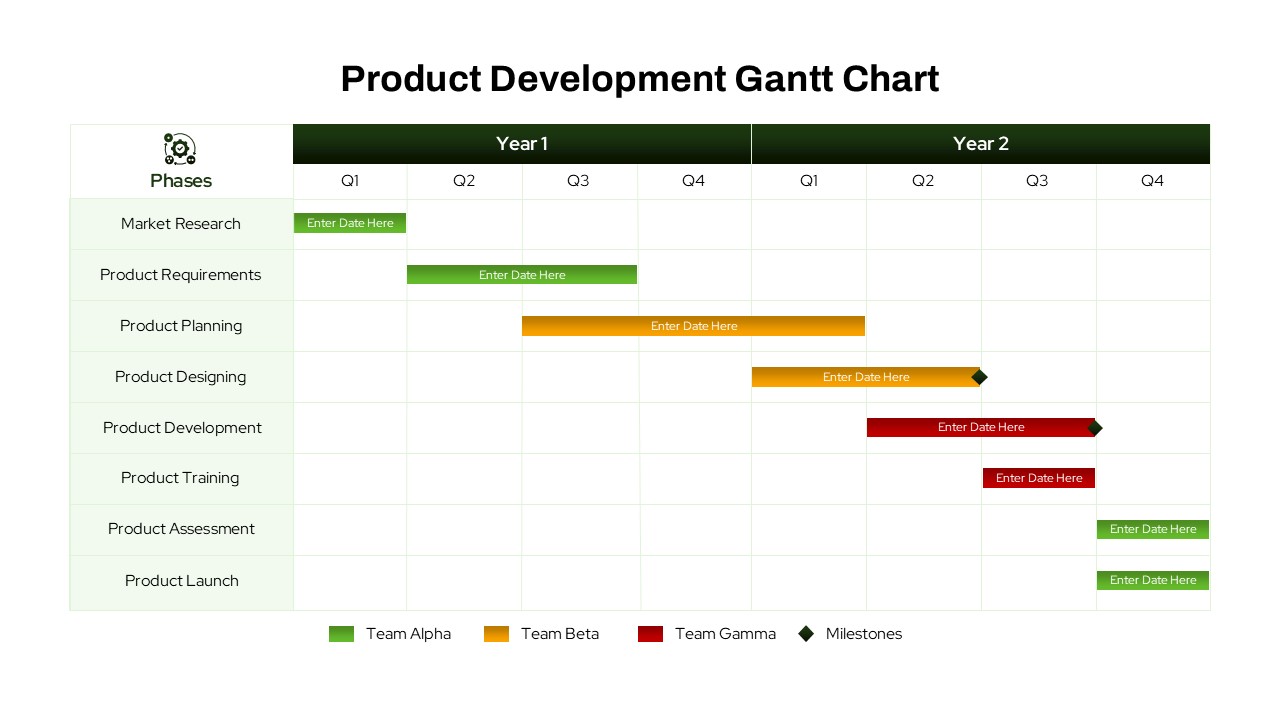
Product Development Gantt Chart template for PowerPoint & Google Slides
Gantt Chart
Premium
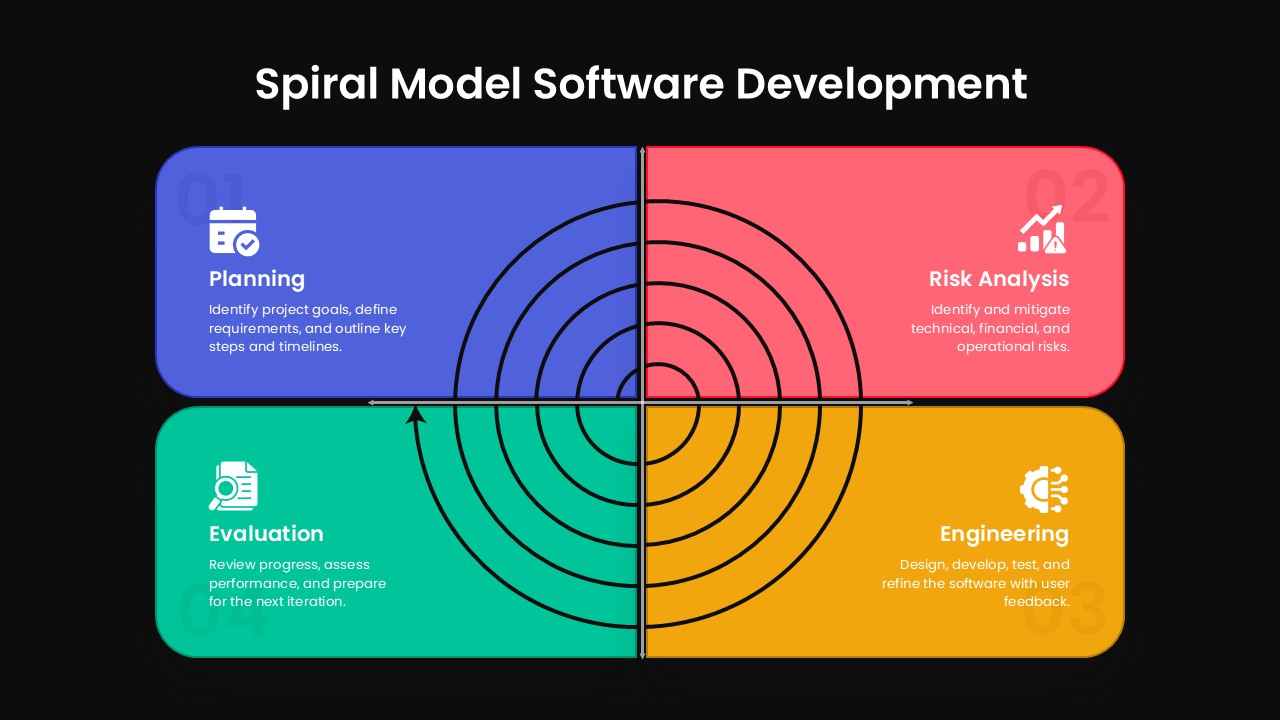
Spiral Model Software Development Template for PowerPoint & Google Slides
Process
Premium
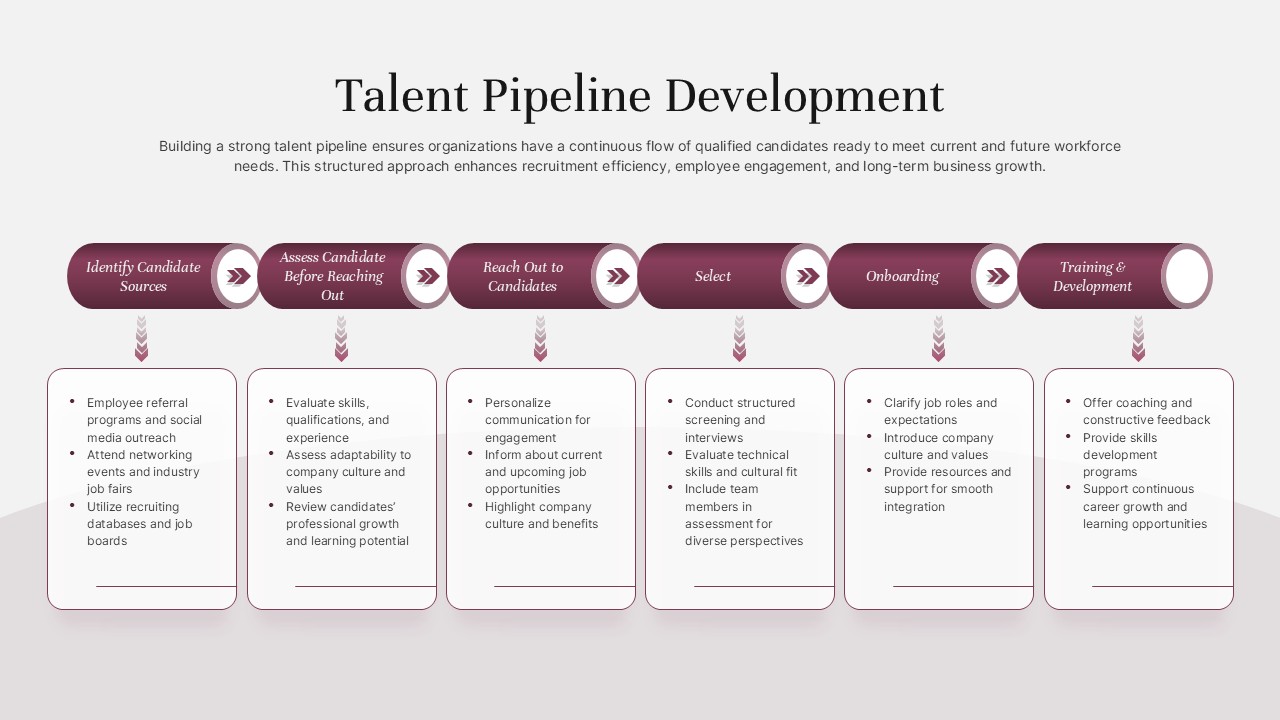
Talent Pipeline Development template for PowerPoint & Google Slides
Business
Premium
Waterfall Software Development Process Template for PowerPoint & Google Slides
Software Development
Premium
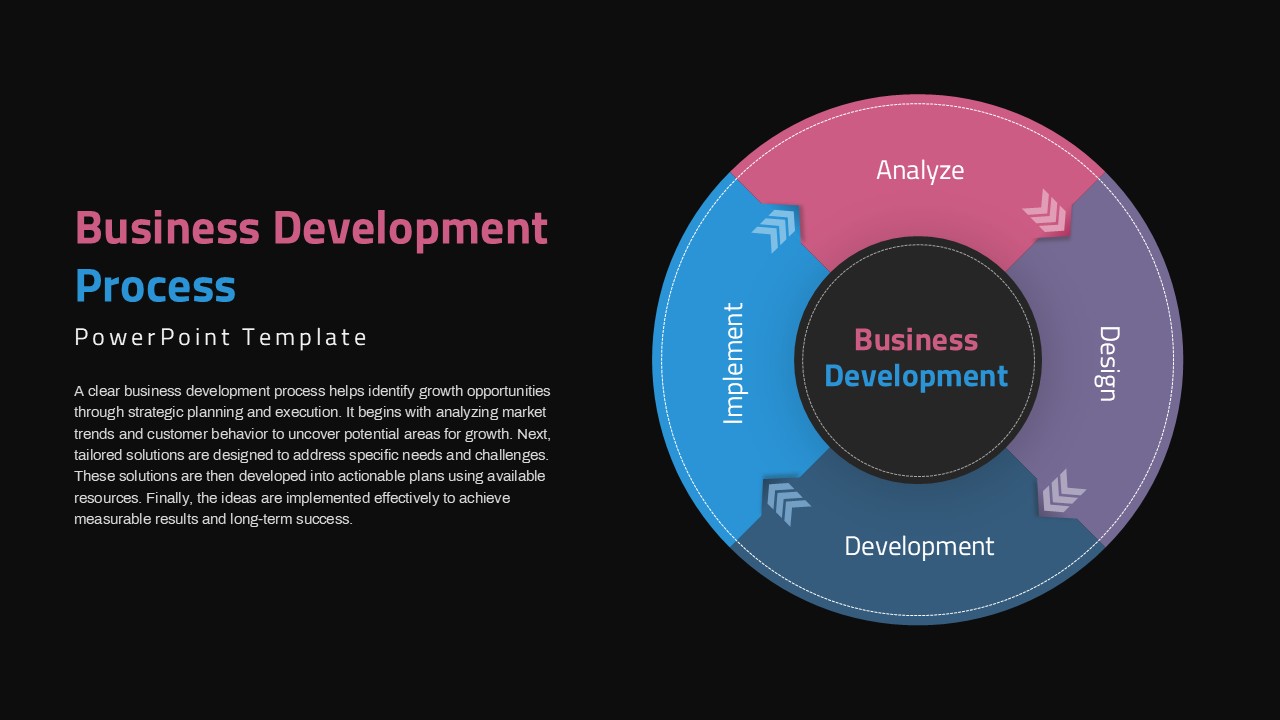
Circular Business Development Process Template for PowerPoint & Google Slides
Process
Premium
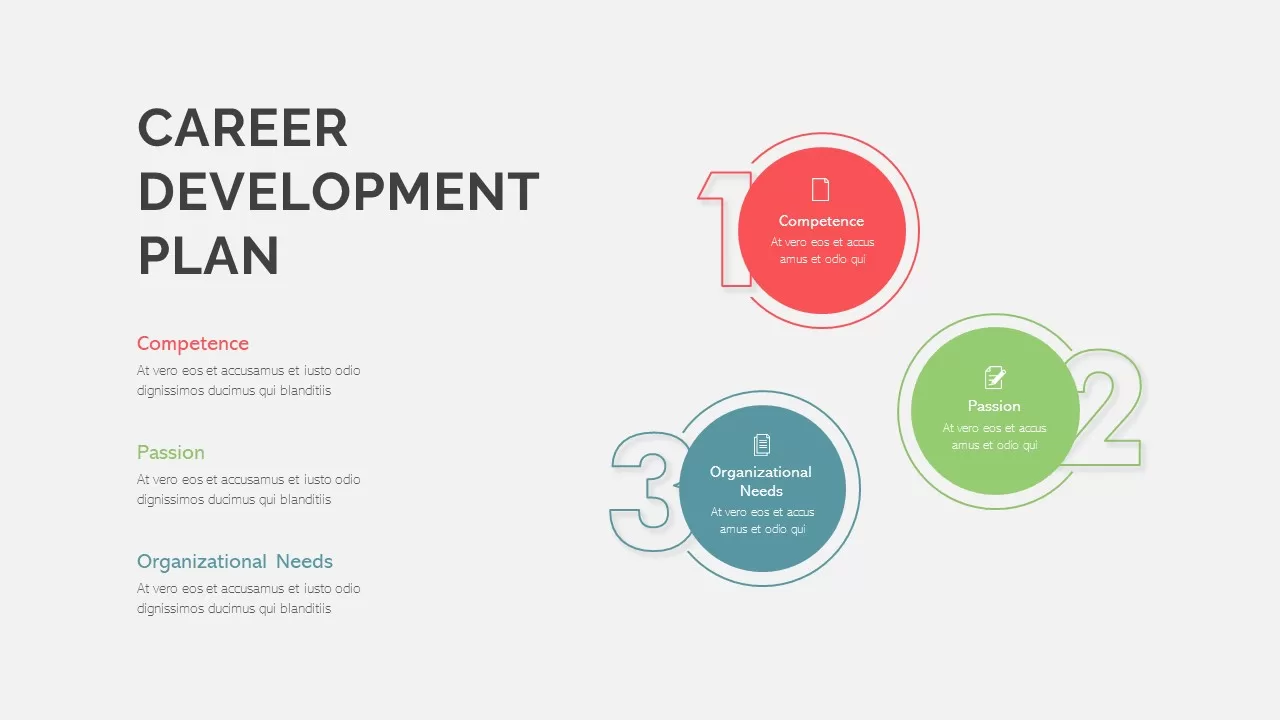
Career Development Plan Infographics Pack for PowerPoint & Google Slides
Infographics
Premium

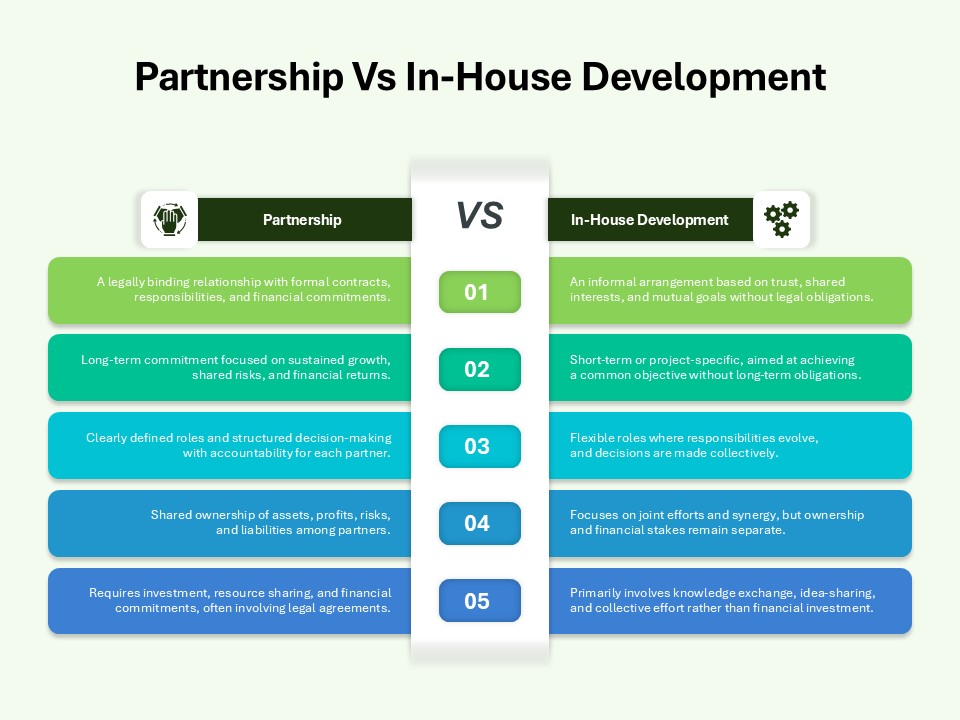
Partnership Vs In-House Development for PowerPoint & Google Slides
Comparison Chart
Premium
Training and Development Plans for PowerPoint & Google Slides
Recruitment
Premium
Performance Review Process Management Cycle template for PowerPoint & Google Slides
Employee Performance
Premium
Four-Stage Process Cycle Variations Pack Template for PowerPoint & Google Slides
Process
Premium
Creative Cycle Process Infographics Template for PowerPoint & Google Slides
Process
Premium
Four-Segment Circular Arrow Cycle Template for PowerPoint & Google Slides
Circle
Premium
Six-Segment Circular Arrow Cycle Template for PowerPoint & Google Slides
Circle
Premium
PDCA Four-Stage Cycle Infographic Template for PowerPoint & Google Slides
Process
Premium
Robotics Process Cycle Infographic Template for PowerPoint & Google Slides
Process
Premium
Seeds Growth Cycle Business Model Template for PowerPoint & Google Slides
Process
Premium
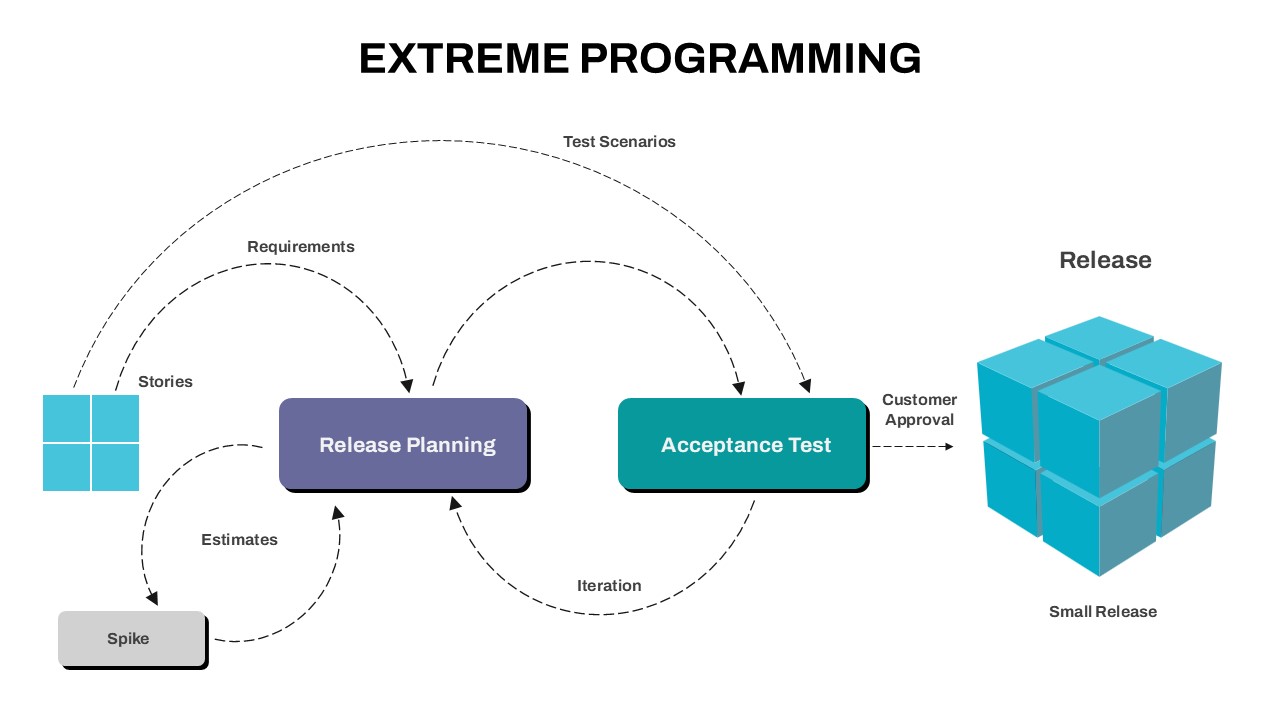
Extreme Programming Process Cycle Template for PowerPoint & Google Slides
Software Development
Premium