Benchmarking Performance Score Template for PowerPoint & Google Slides

Description
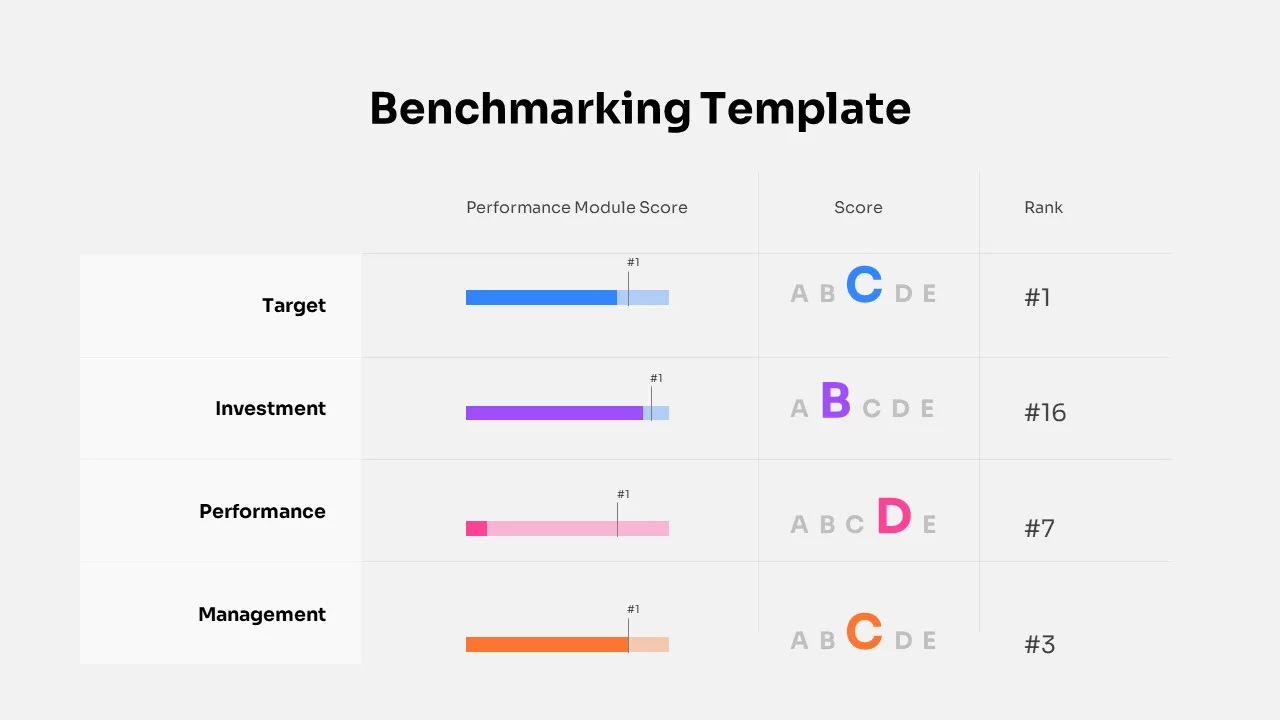
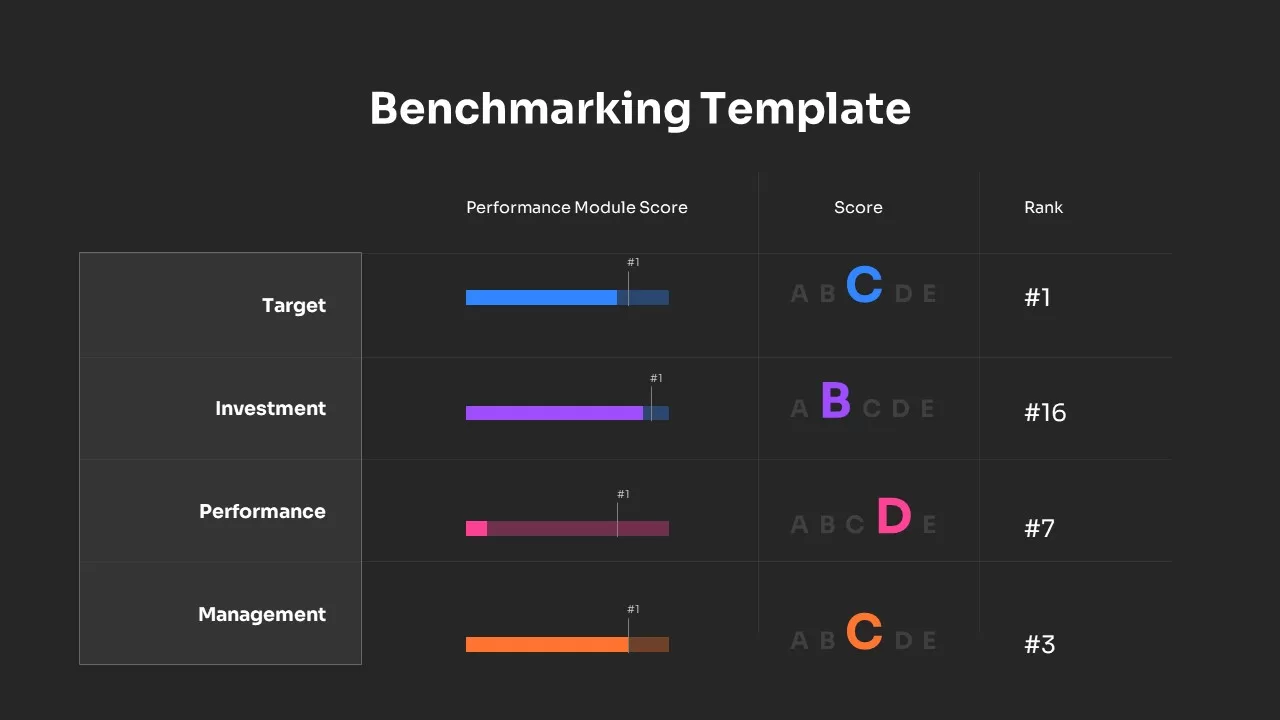
This benchmarking template provides a sleek and organized way to compare different performance metrics across multiple categories. Featuring color-coded bar charts for each performance module, the template visually breaks down scores for “Target,” “Investment,” “Performance,” and “Management,” allowing you to track and compare rankings in a clear and intuitive manner. The use of horizontal bars, score labels, and a ranking column makes it easy to highlight strengths, weaknesses, and areas for improvement.
Built on master-slide layouts for both PowerPoint and Google Slides, this template is fully customizable. You can change the text, adjust the colors of the performance bars, or swap out categories to match your specific benchmarking data. The clean design, with ample white space and modern typography, keeps your audience focused on the key information, while the color-coded bars and rankings provide immediate visual impact.
Whether you’re presenting company performance, product evaluations, or competitive benchmarking, this template allows you to quickly communicate critical insights to stakeholders, clients, or management. It’s designed for efficiency and visual appeal, ensuring your data is both clear and impactful.
Who is it for
Business analysts, product managers, marketing teams, and executives will benefit from this template when presenting performance metrics, benchmarking results, or competitive analyses.
Other Uses
Repurpose this template for financial analysis, KPI tracking, project performance evaluation, or market research comparisons. The design can easily accommodate various use cases for showcasing measurable performance indicators.
Login to download this file
Add to favorites
Add to collection

Item ID
SB02855
Related Templates

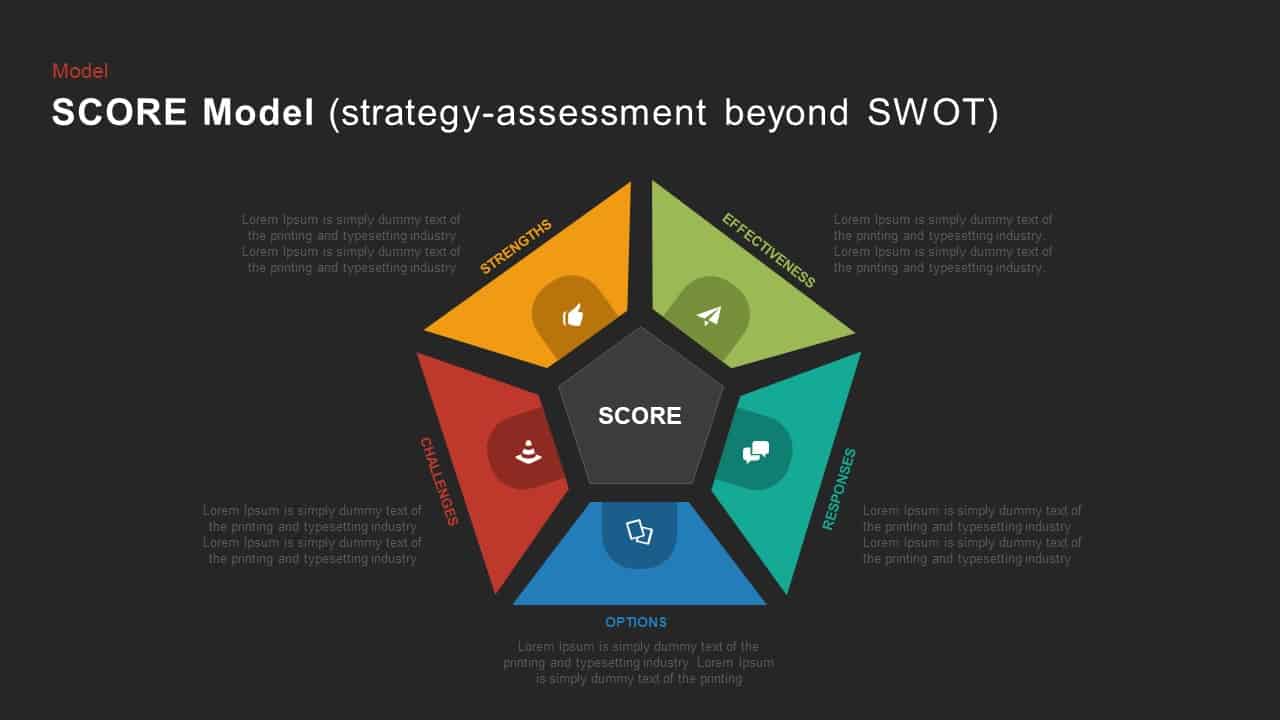
SCORE Model Pentagon Assessment Diagram Template for PowerPoint & Google Slides
Circle
Premium

Net Promoter Score Dashboard Template for PowerPoint & Google Slides
Customer Experience
Premium
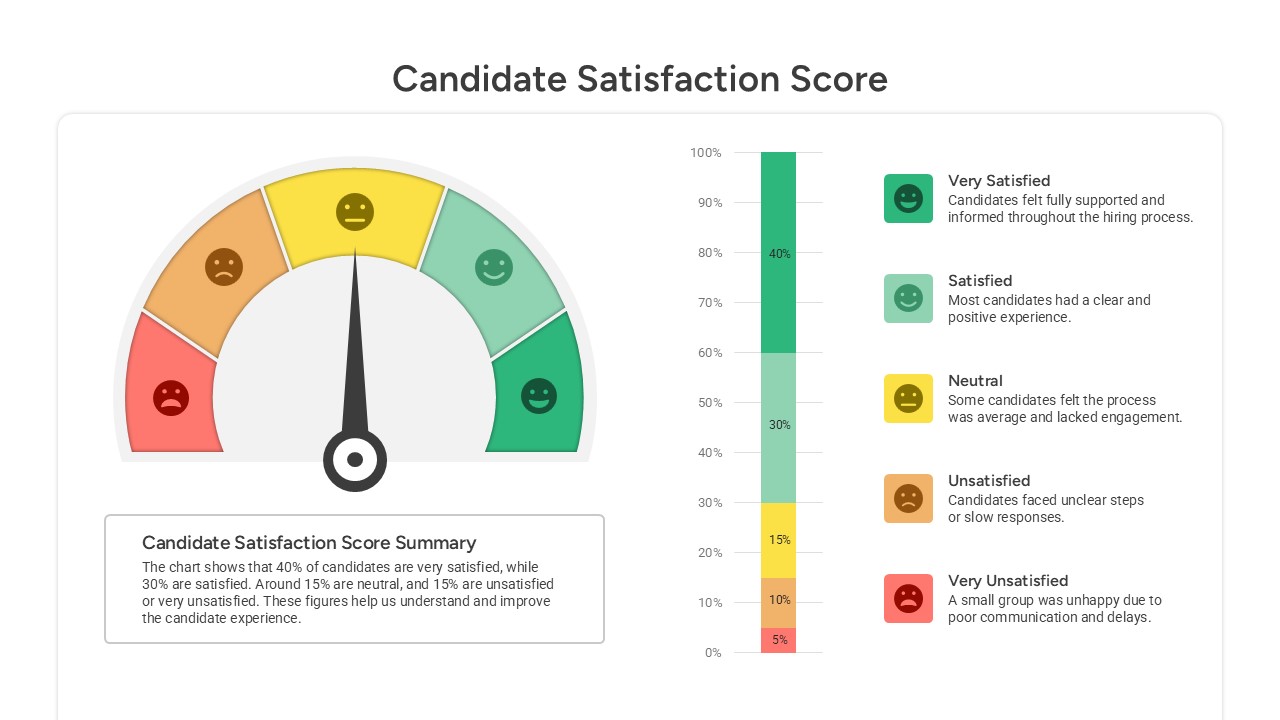
Candidate Satisfaction Score template for PowerPoint & Google Slides
Business
Premium
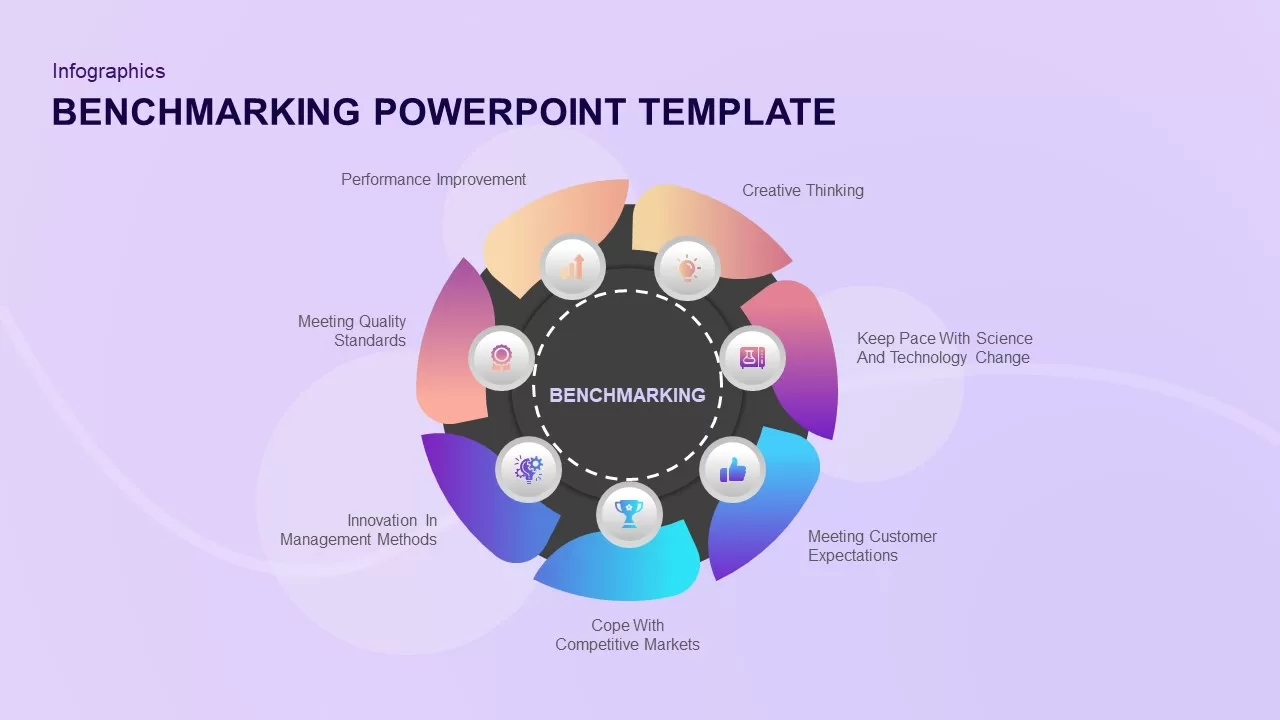
Benchmarking PowerPoint Template for PowerPoint & Google Slides
Process
Premium
Interactive Benchmarking Gauge Dashboard Template for PowerPoint & Google Slides
Pie/Donut
Premium
Benchmarking Metrics Comparison Slide Template for PowerPoint & Google Slides
Pie/Donut
Premium
Dynamic Benchmarking Comparison Chart Template for PowerPoint & Google Slides
Comparison Chart
Premium
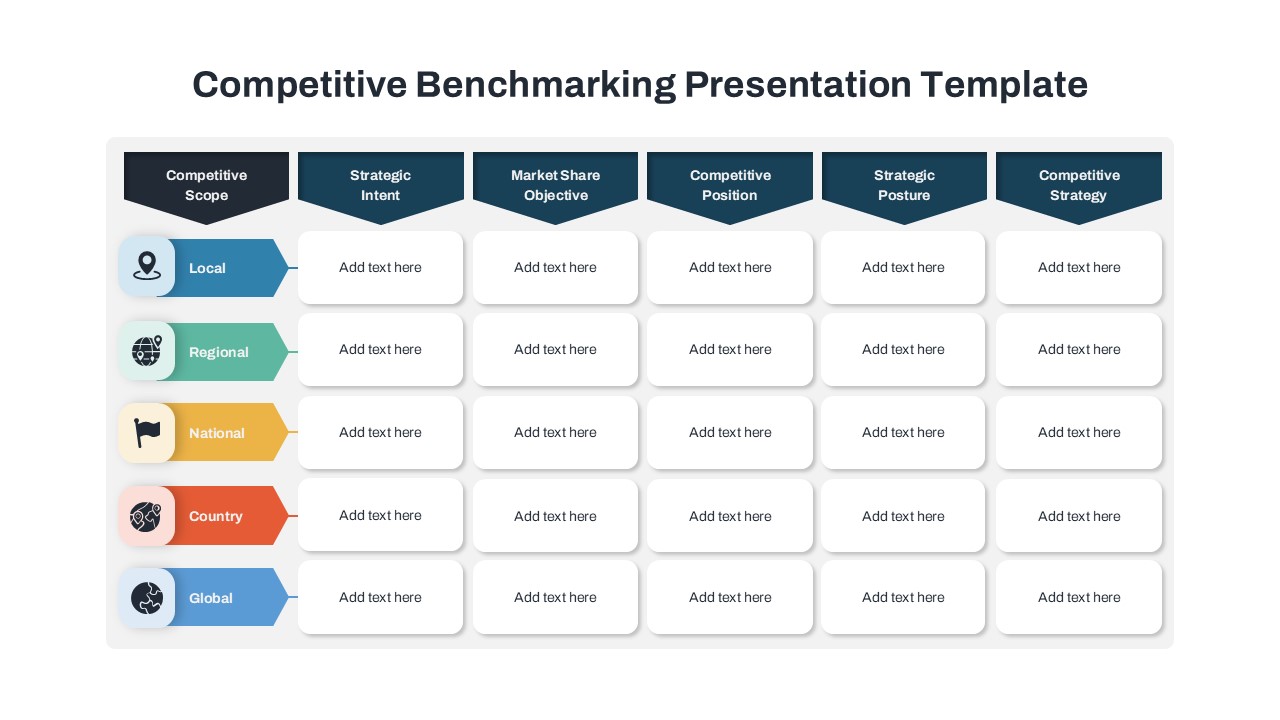
Competitive Benchmarking Presentation Template for PowerPoint & Google Slides
Comparison
Premium
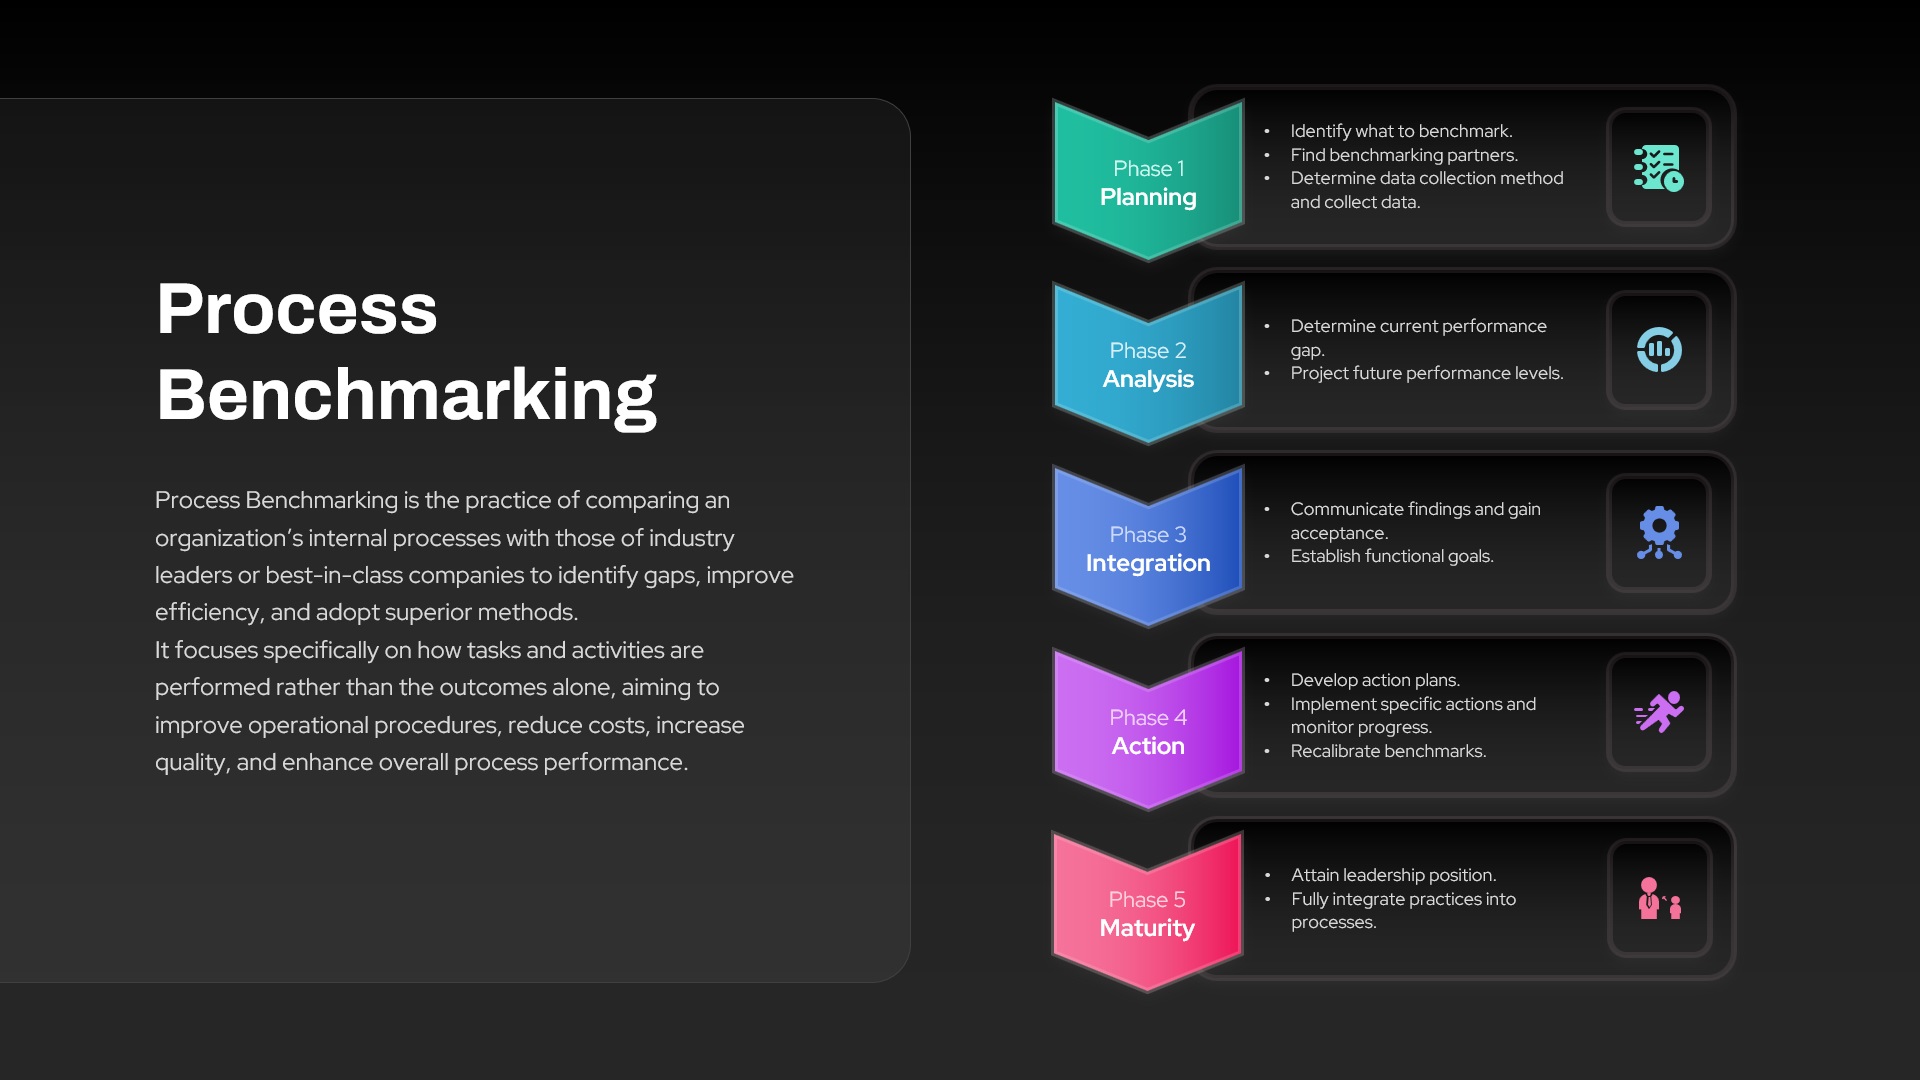
Process Benchmarking Five-Phase Framework Template for PowerPoint & Google Slides
Process
Premium
Google Ads Optimization & Performance Infographic Template for PowerPoint & Google Slides
Digital Marketing
Premium
Profit Performance Trend Chart Template for PowerPoint & Google Slides
Finance
Premium
Sales vs Budget Performance Chart Template for PowerPoint & Google Slides
Bar/Column
Premium

Website Performance Dashboard template for PowerPoint & Google Slides
Charts
Premium
Sales Performance Dashboard template for PowerPoint & Google Slides
Business Report
Premium
Performance Review Process Management Cycle template for PowerPoint & Google Slides
Employee Performance
Premium
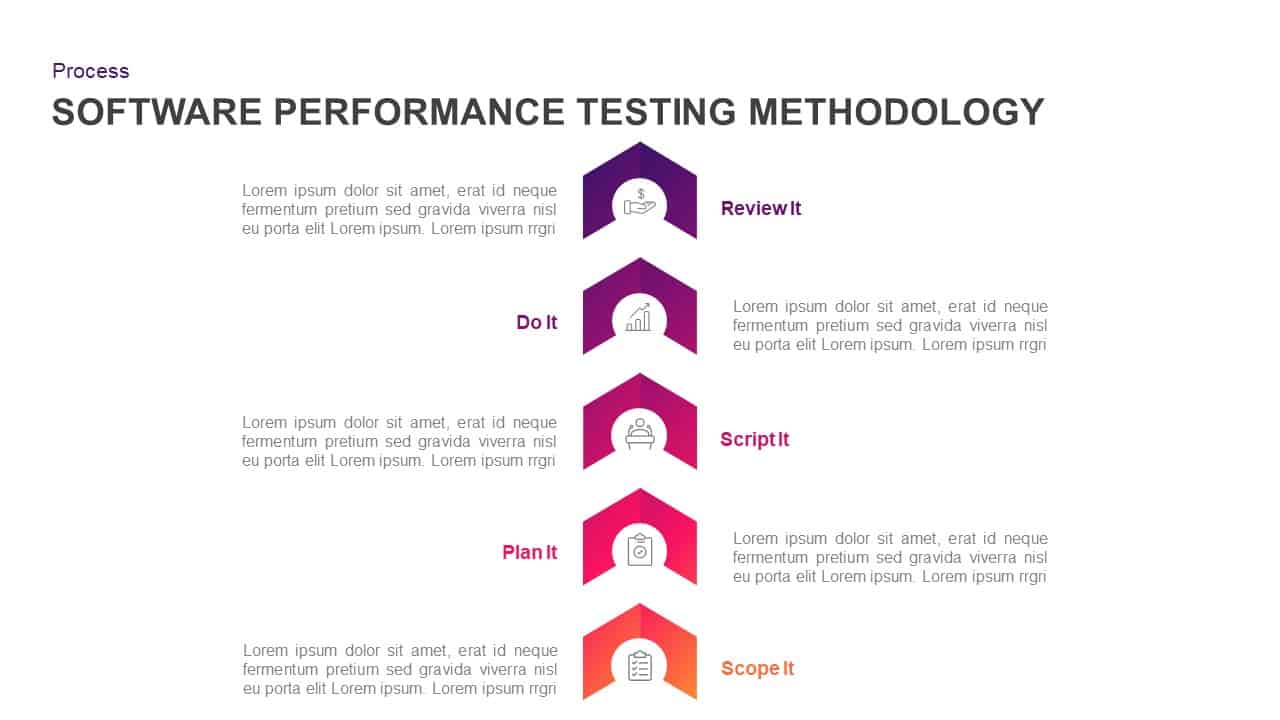
Software Performance Testing Methodology Template for PowerPoint & Google Slides
Process
Premium
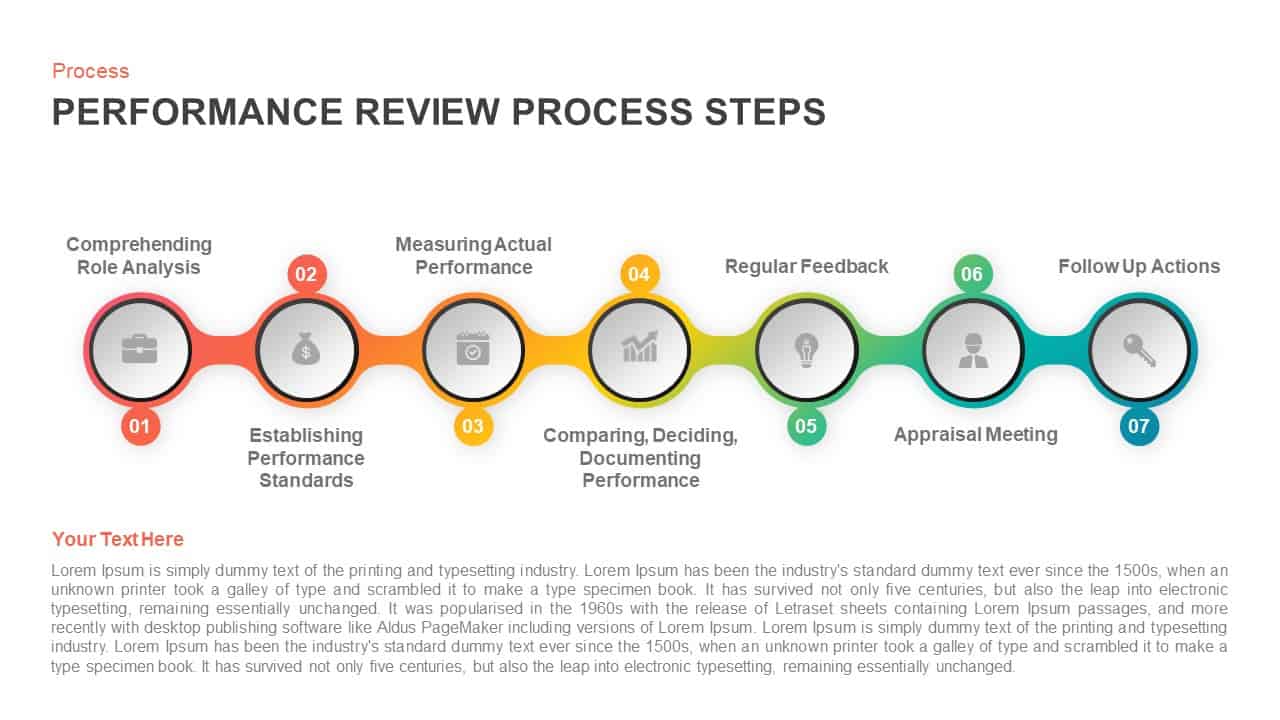
Performance Review Process Steps Template for PowerPoint & Google Slides
Employee Performance
Premium
Social Media Performance Dashboard Template for PowerPoint & Google Slides
Bar/Column
Premium
Professional Sales Performance Report Template for PowerPoint & Google Slides
Business Report
Premium
Performance Review Progress Management Template for PowerPoint & Google Slides
Process
Premium
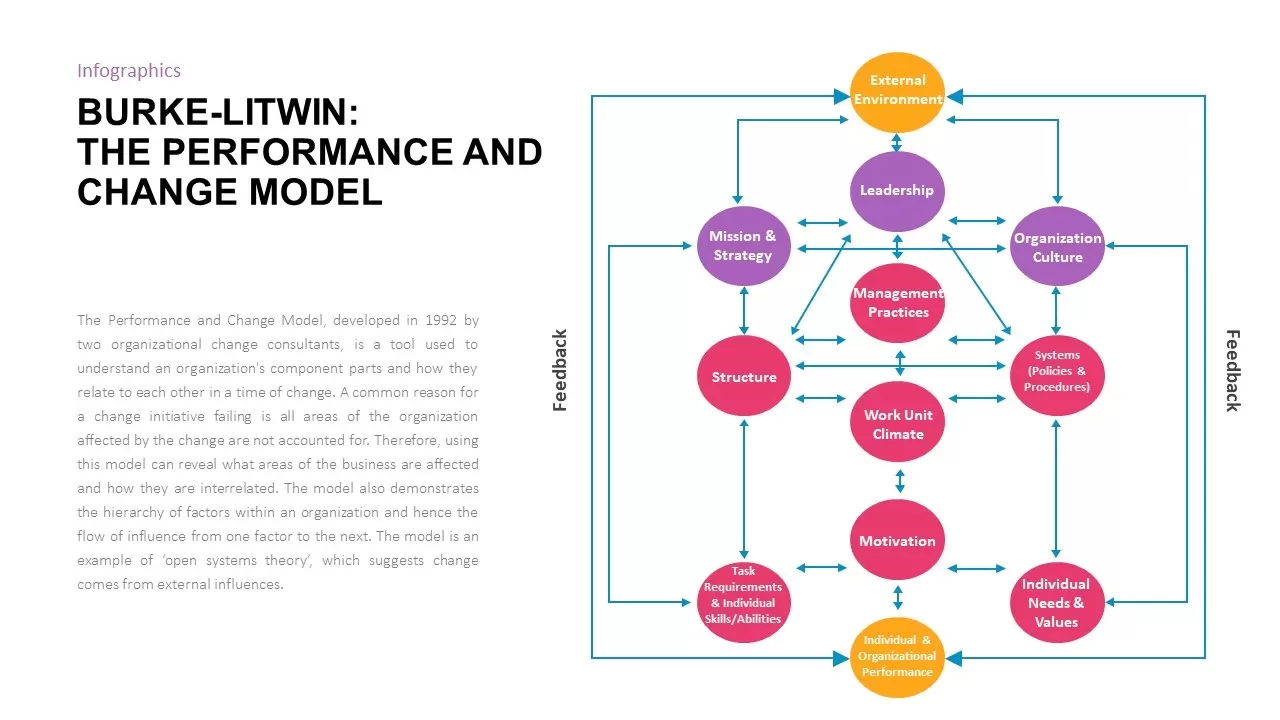
Burke-Litwin Performance and Change Model template for PowerPoint & Google Slides
Infographics
Premium
Corporate Performance Management Template for PowerPoint & Google Slides
Pitch Deck
Premium
Performance KPI Dashboard Slide Template for PowerPoint & Google Slides
Business Report
Premium
Free Stock Market Performance Overview template for PowerPoint & Google Slides
Finance
Free
9-Box Matrix for Performance & Potential Template for PowerPoint & Google Slides
Employee Performance
Premium
Website Performance Monitoring Dashboard Template for PowerPoint & Google Slides
Business Report
Premium
AMO Performance Model Feedback Diagram Template for PowerPoint & Google Slides
Employee Performance
Premium
Hits and Misses Performance Comparison Template for PowerPoint & Google Slides
Comparison
Premium
Detailed Performance Improvement Plan Template for PowerPoint & Google Slides
Employee Performance
Premium
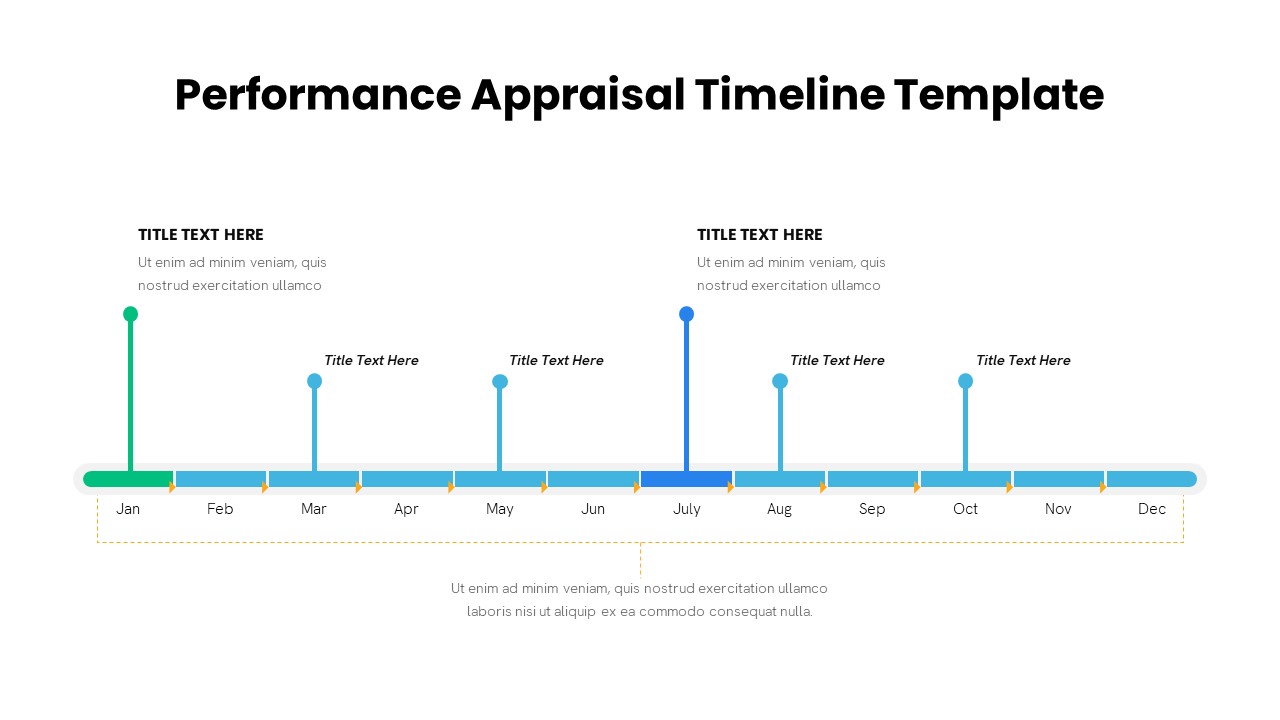
Performance Appraisal Timeline Diagram Template for PowerPoint & Google Slides
Timeline
Premium
DevOps KPI Dashboard Performance Metrics Template for PowerPoint & Google Slides
Software Development
Premium
Monthly Sales Performance Dashboard Template for PowerPoint & Google Slides
Charts
Premium
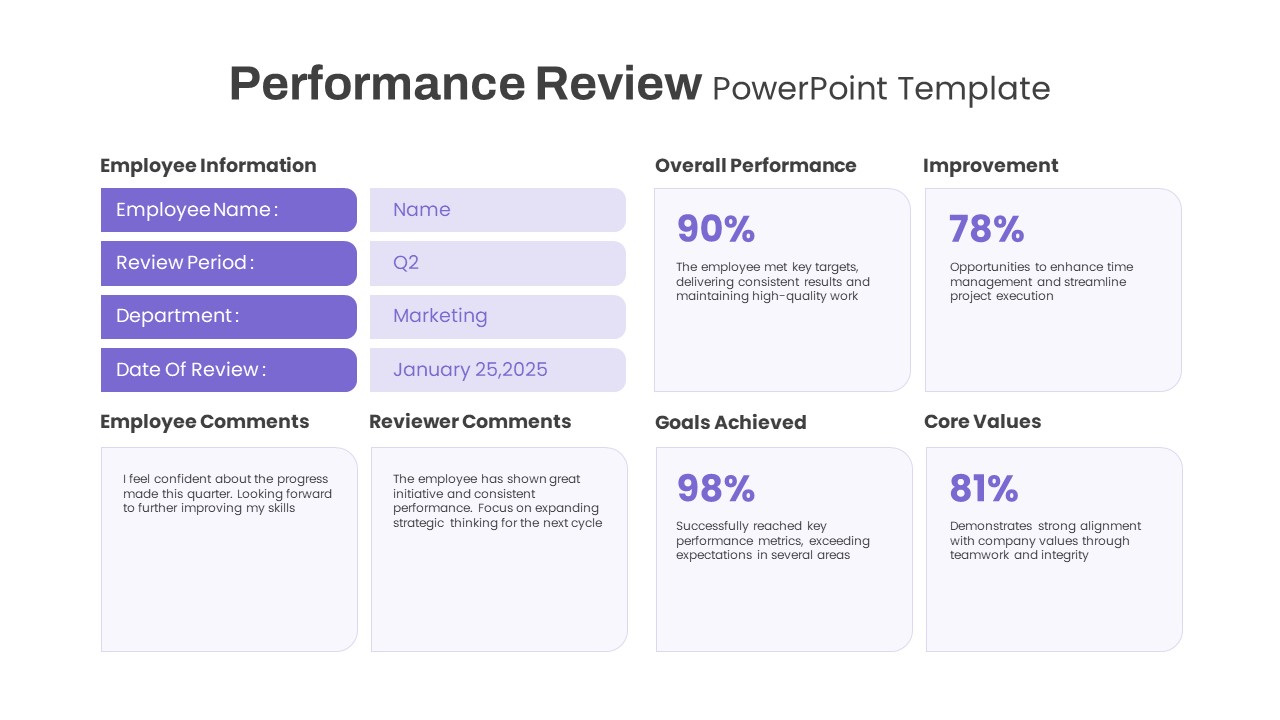
Performance Review template for PowerPoint & Google Slides
Employee Performance
Premium
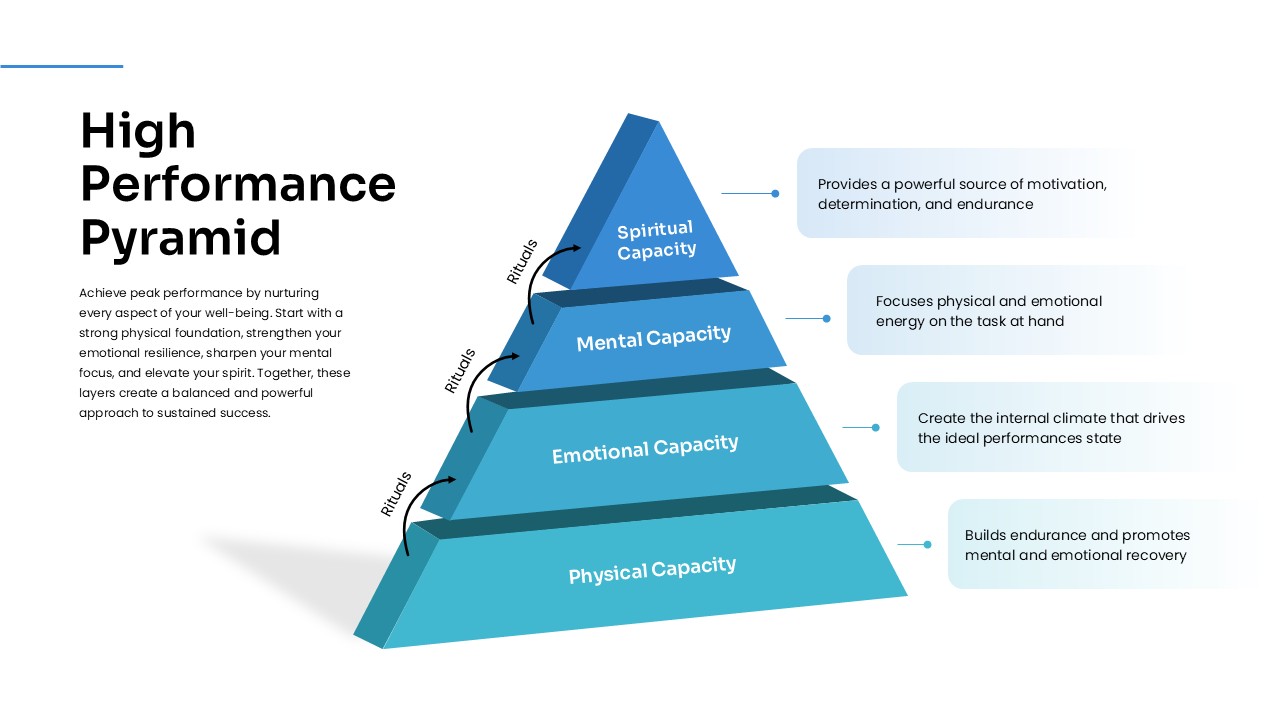
High Performance Pyramid Diagram Template for PowerPoint & Google Slides
Pyramid
Premium
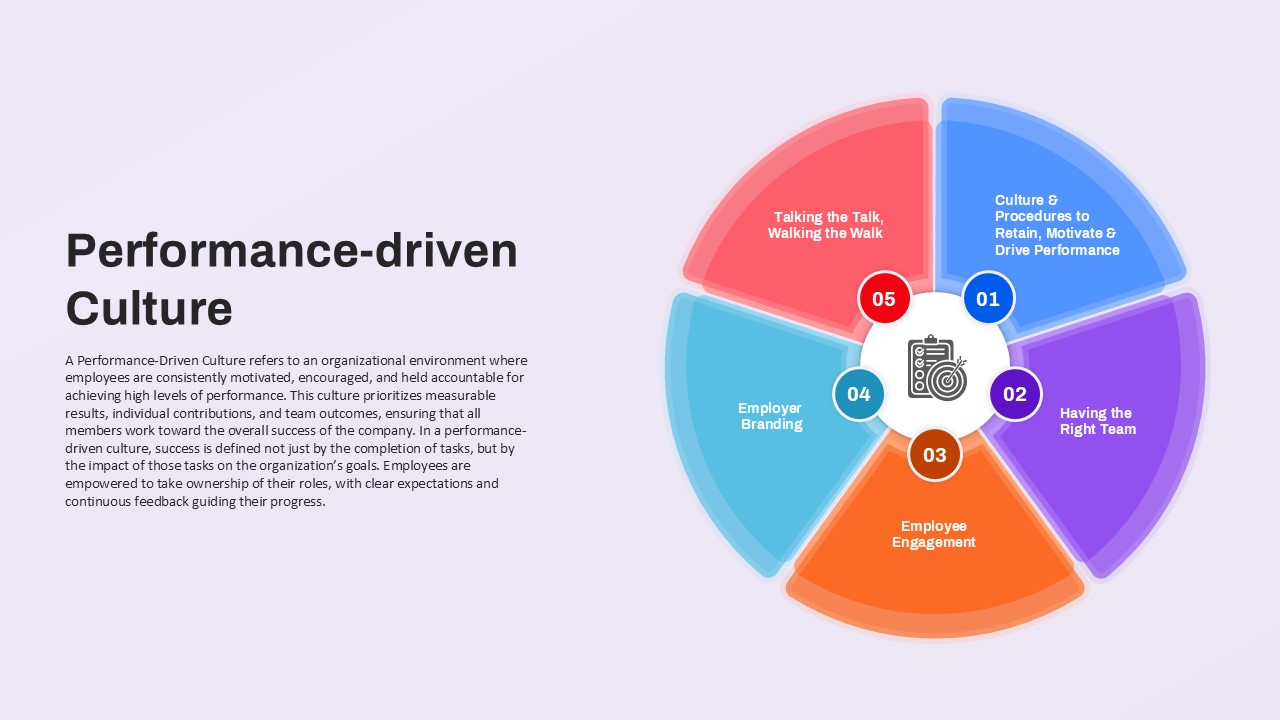
Performance-driven Culture framework template for PowerPoint & Google Slides
Leadership
Premium
Employee Performance Metrics Dashboard Template for PowerPoint & Google Slides
Employee Performance
Premium
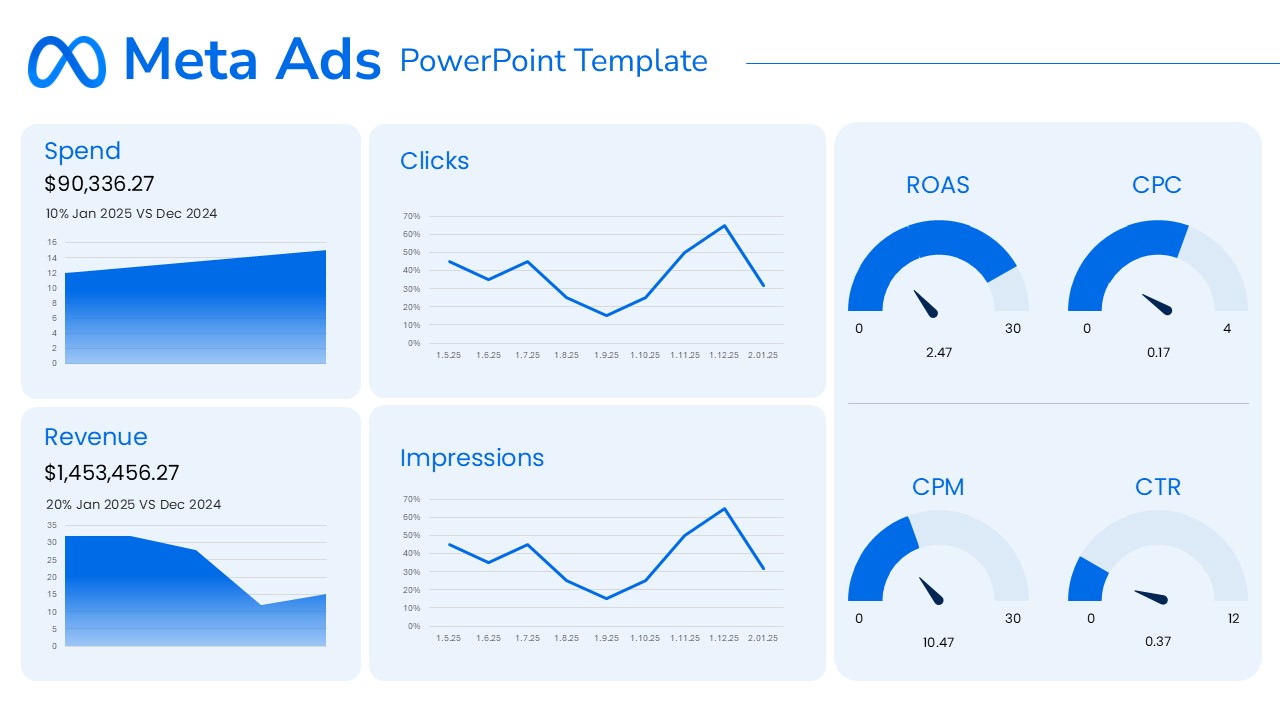
Meta Ads Performance Overview template for PowerPoint & Google Slides
Advertising
Premium
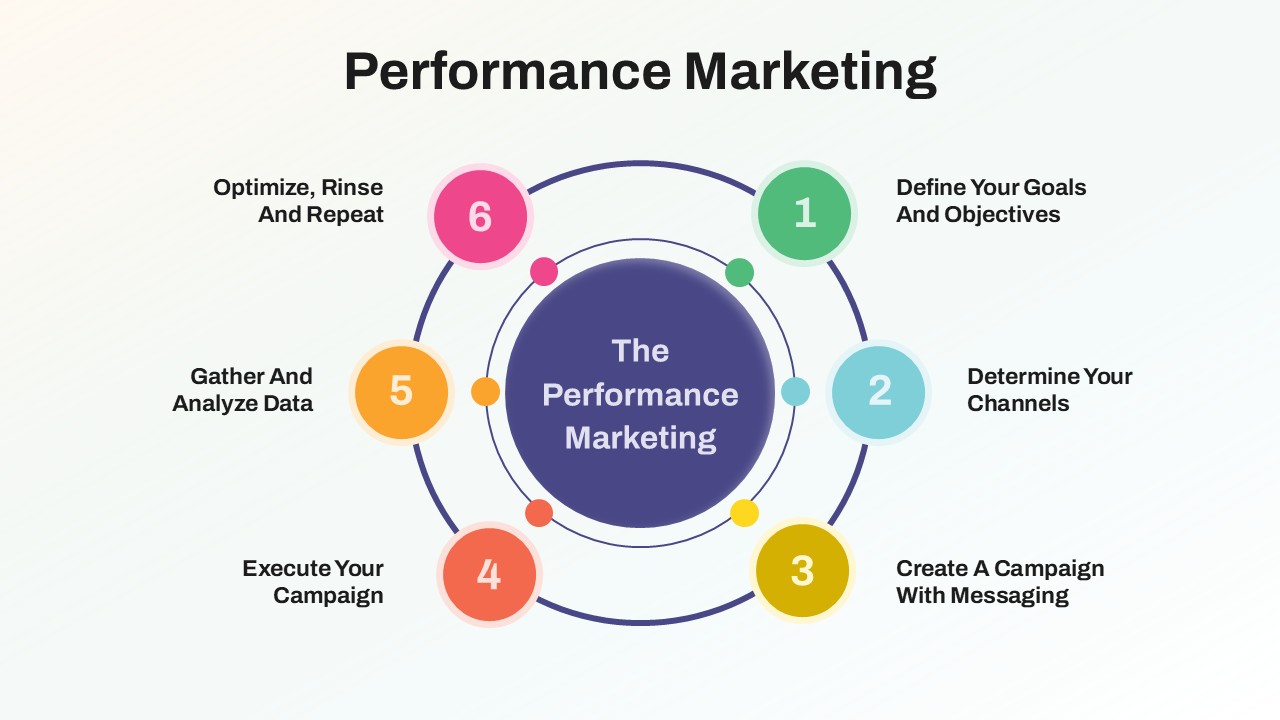
Performance Marketing Strategy template for PowerPoint & Google Slides
Digital Marketing
Premium
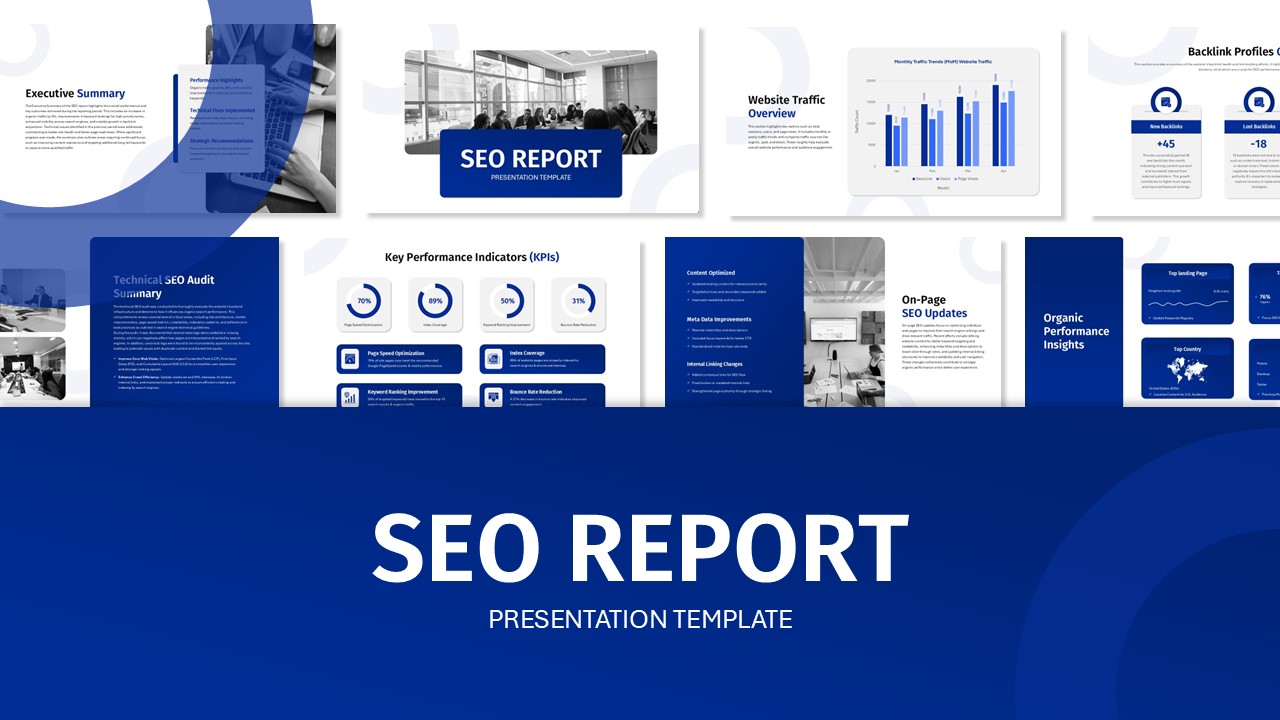
SEO Performance Report Overview template for PowerPoint & Google Slides
Digital Marketing
Premium
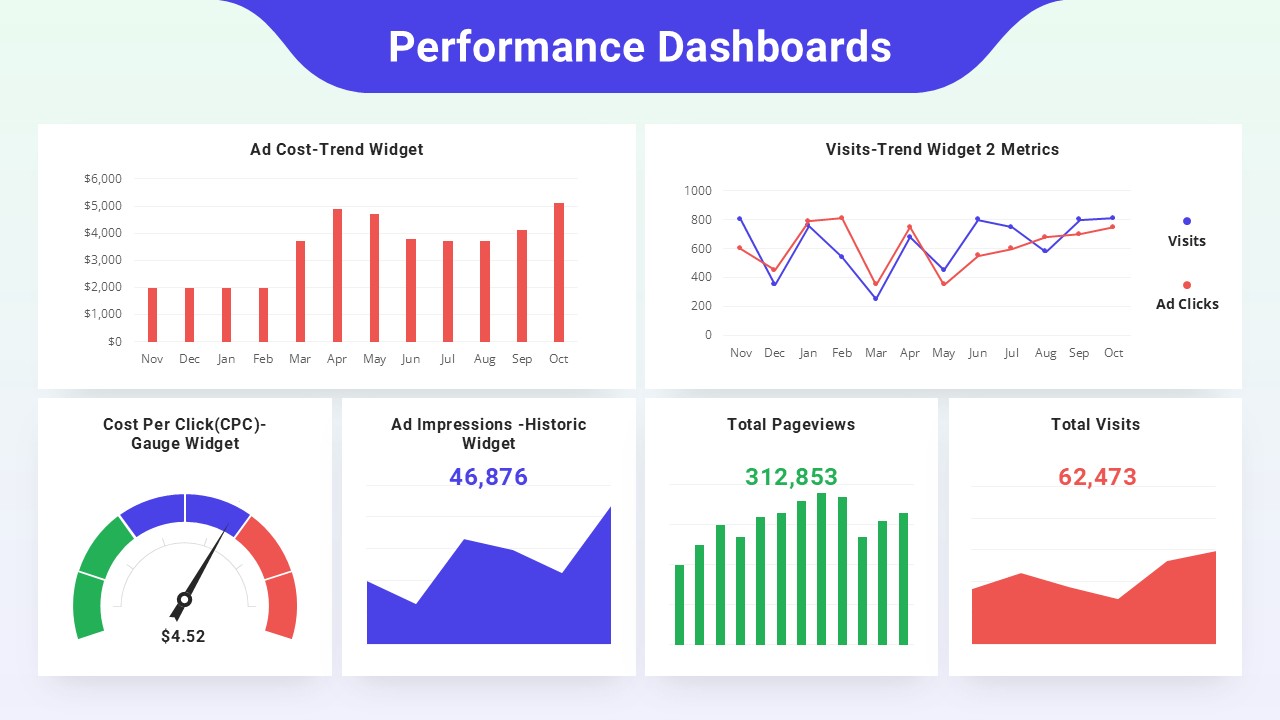
Performance Dashboards Overview Template for PowerPoint & Google Slides
Business Report
Premium
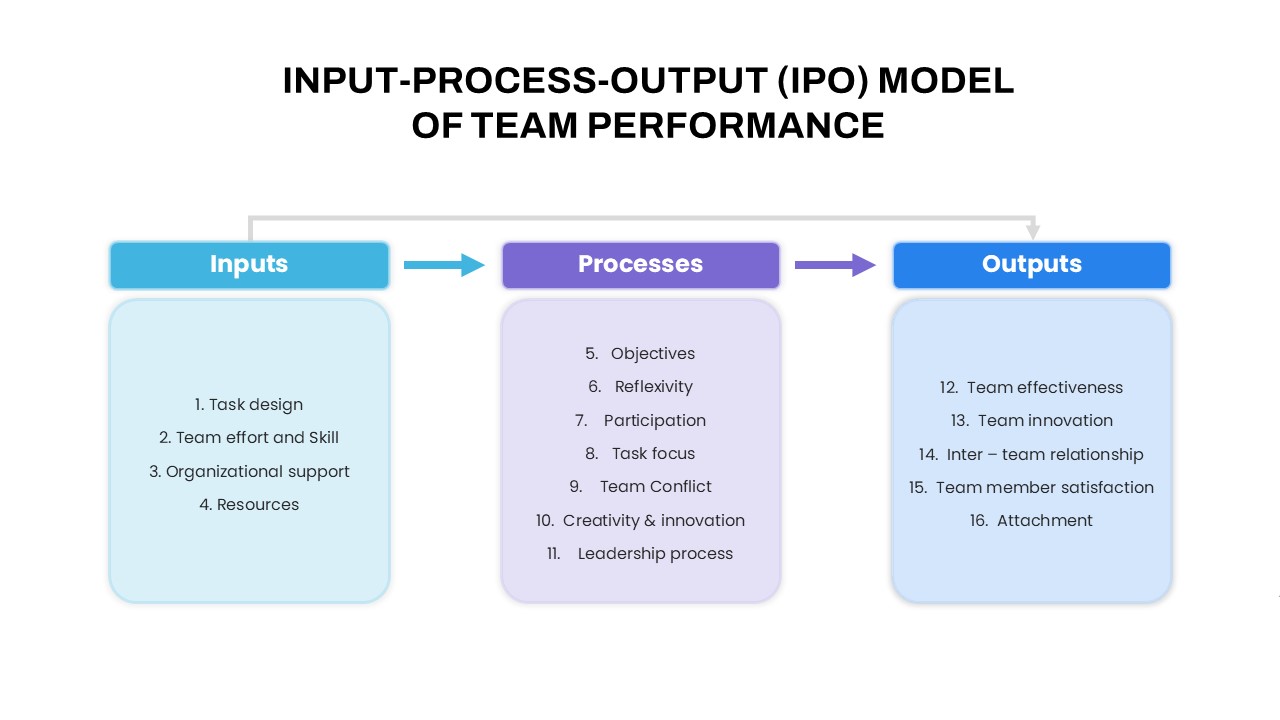
IPO Model of Team Performance for PowerPoint & Google Slides
Process
Premium
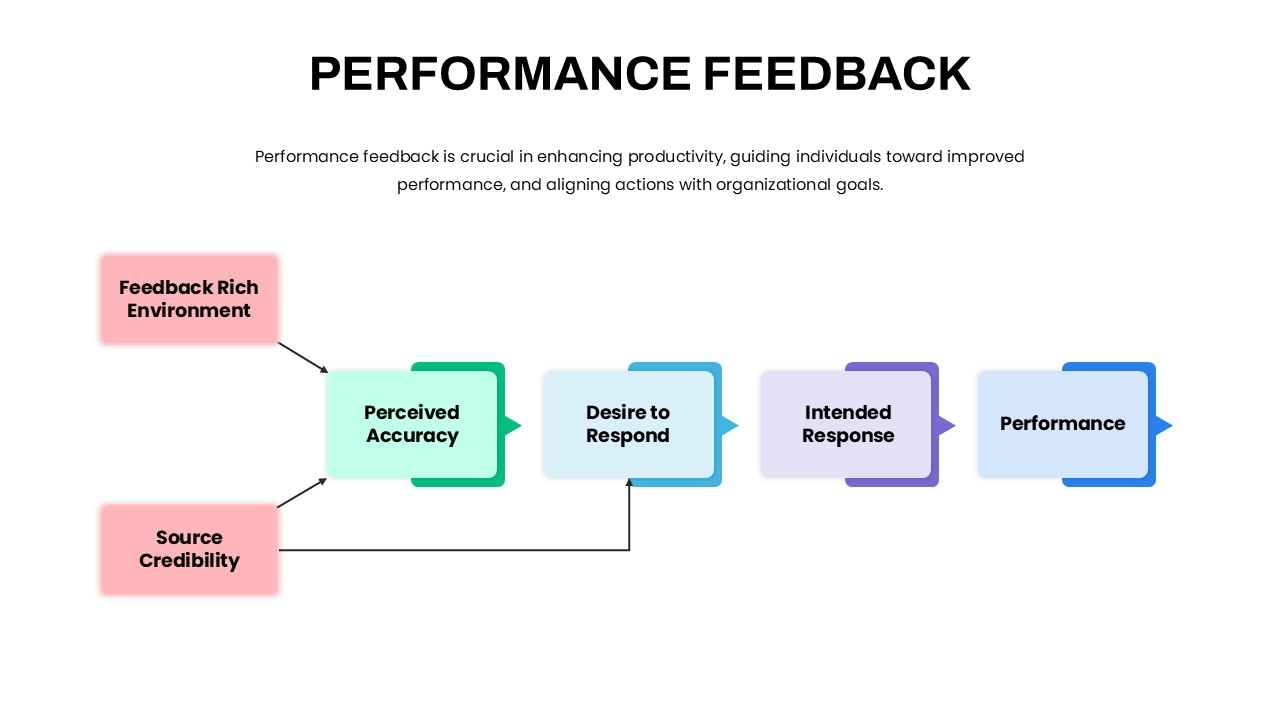
Performance Feedback Model for PowerPoint & Google Slides
Employee Performance
Premium
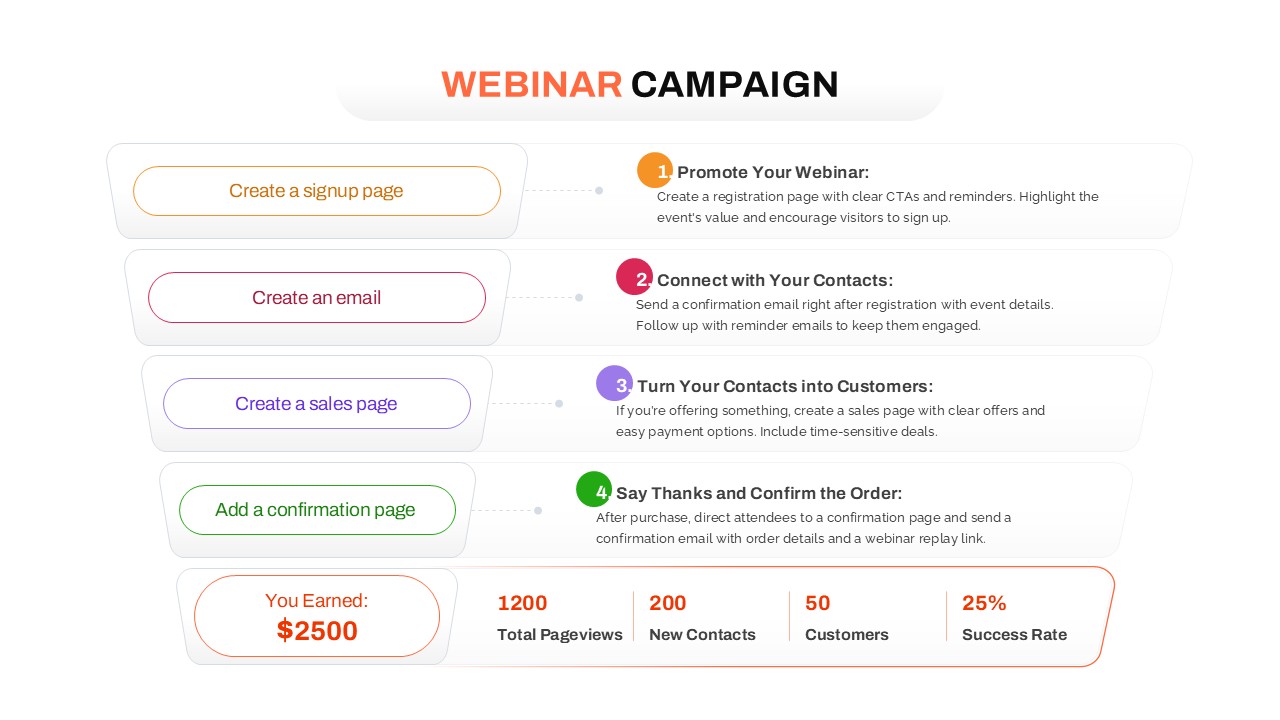
Webinar Campaign Steps and Performance for PowerPoint & Google Slides
Advertising
Premium
4 Step Process PowerPoint & Google Slides Template for PowerPoint & Google Slides
Process
Premium
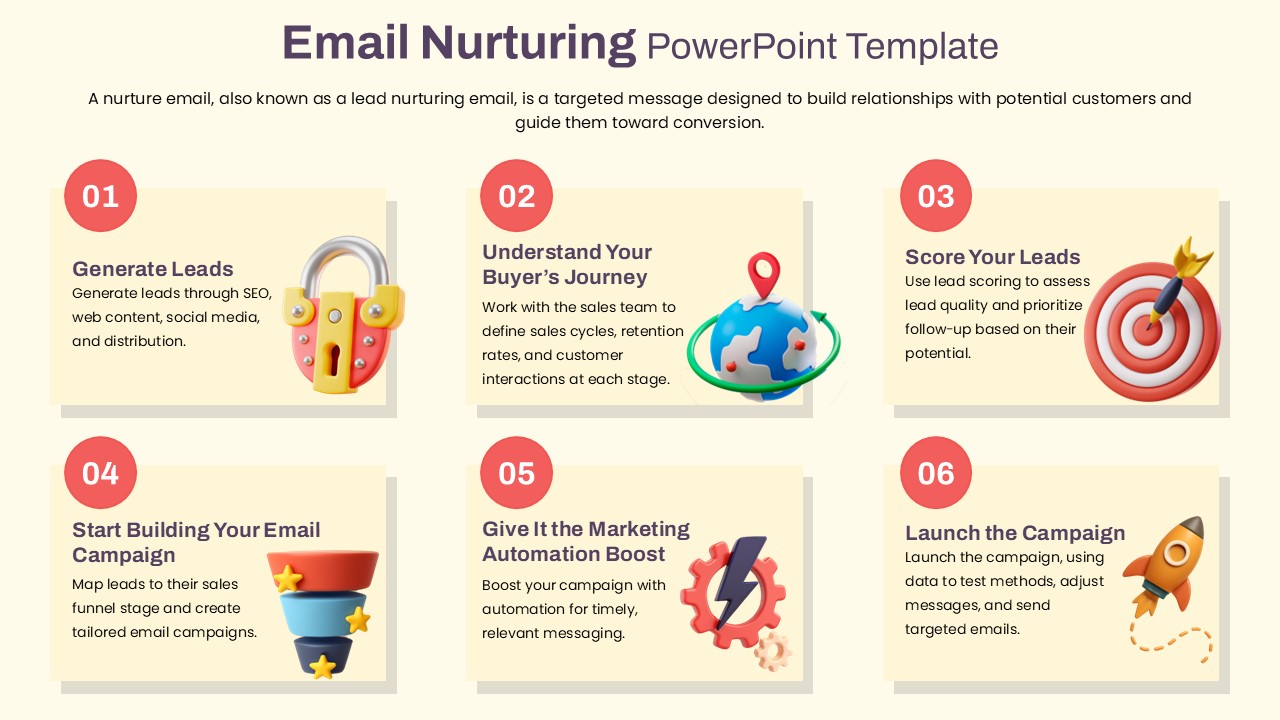
Email Nurturing Template for PowerPoint & Google Slides
Digital Marketing
Premium