PERT Chart Project Management template for PowerPoint & Google Slides
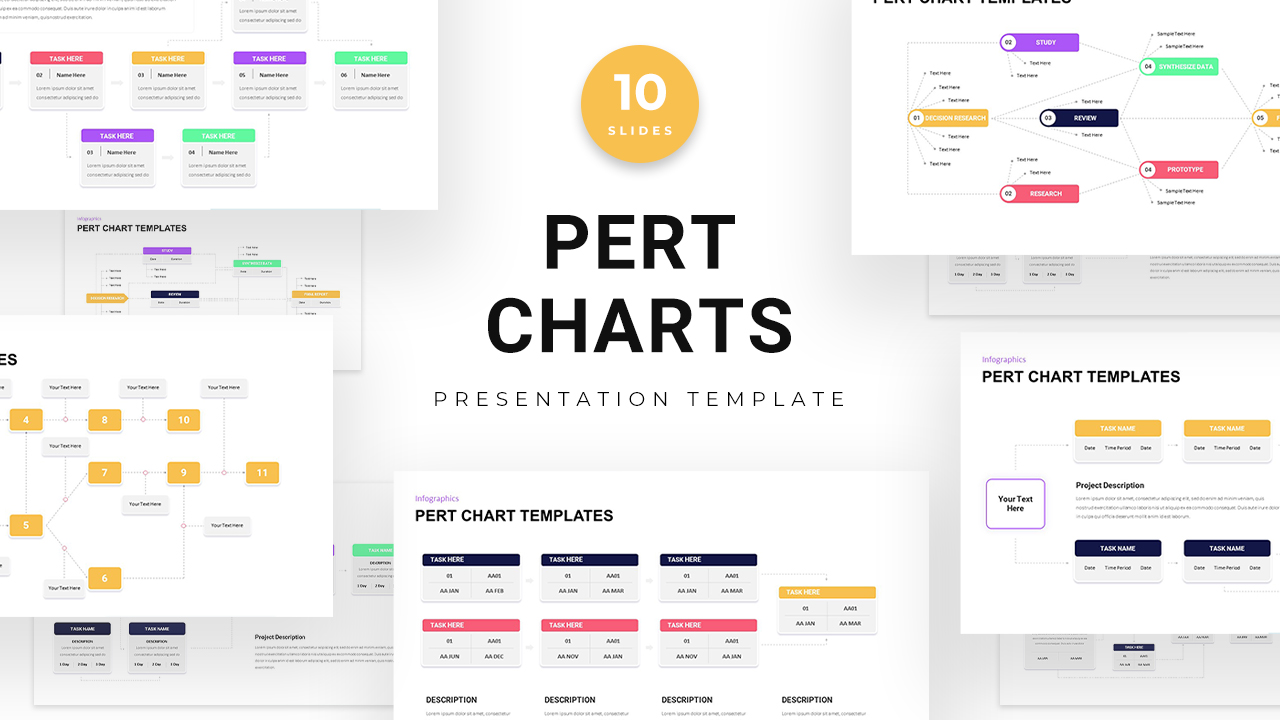
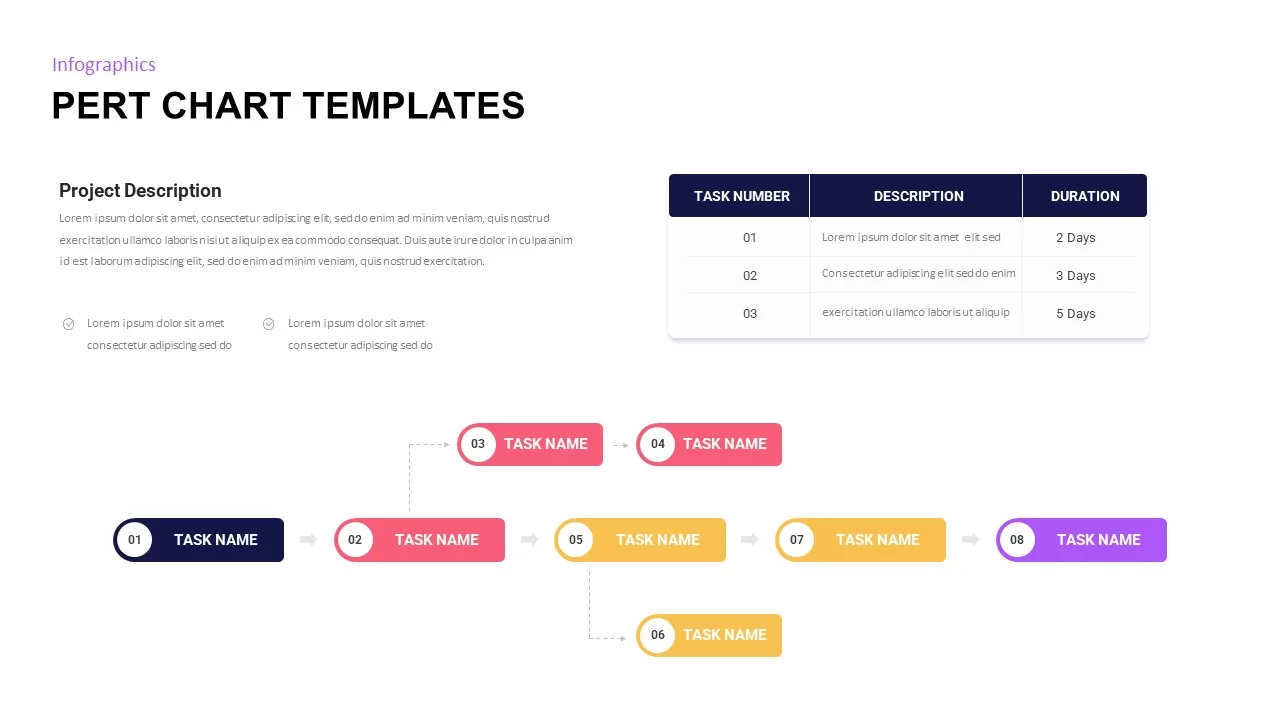
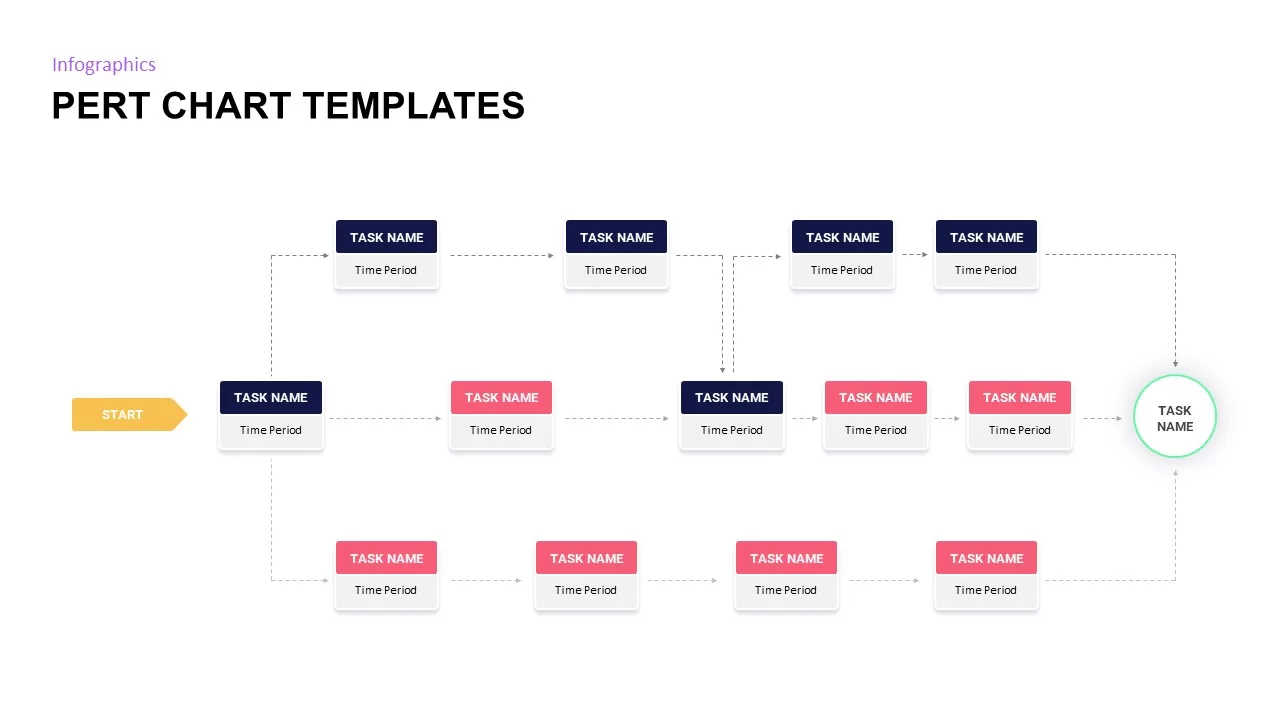
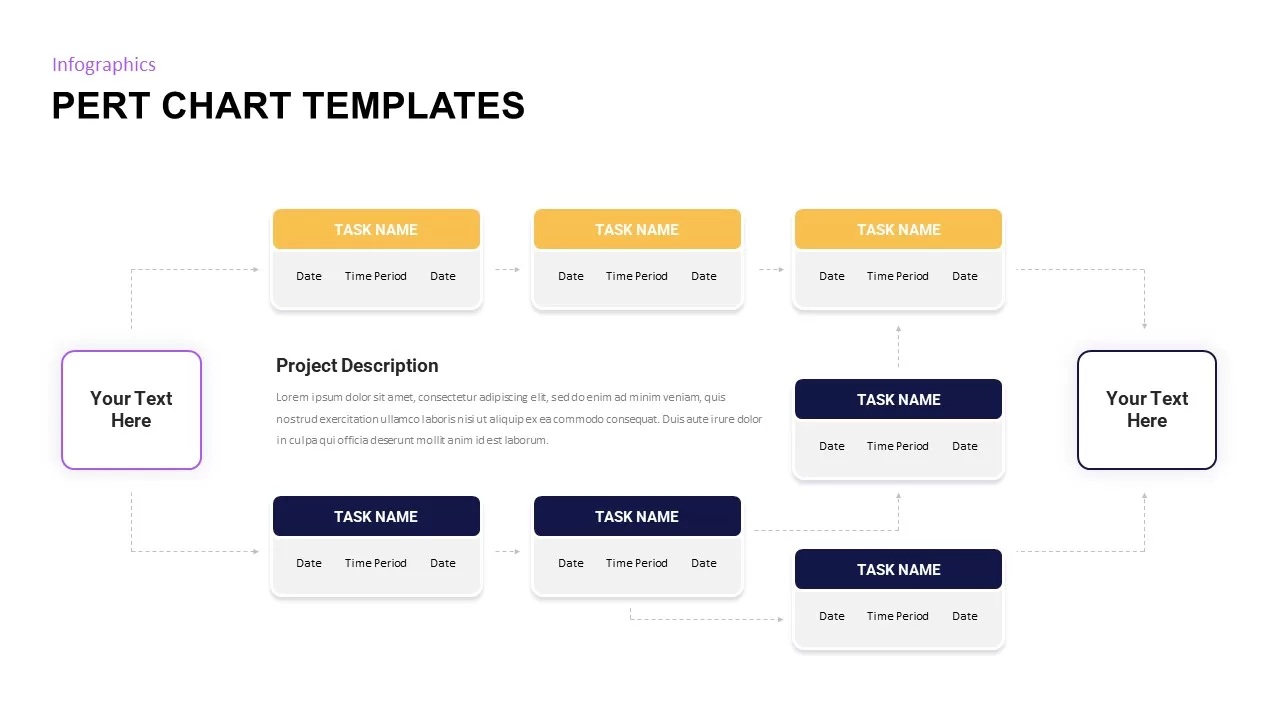
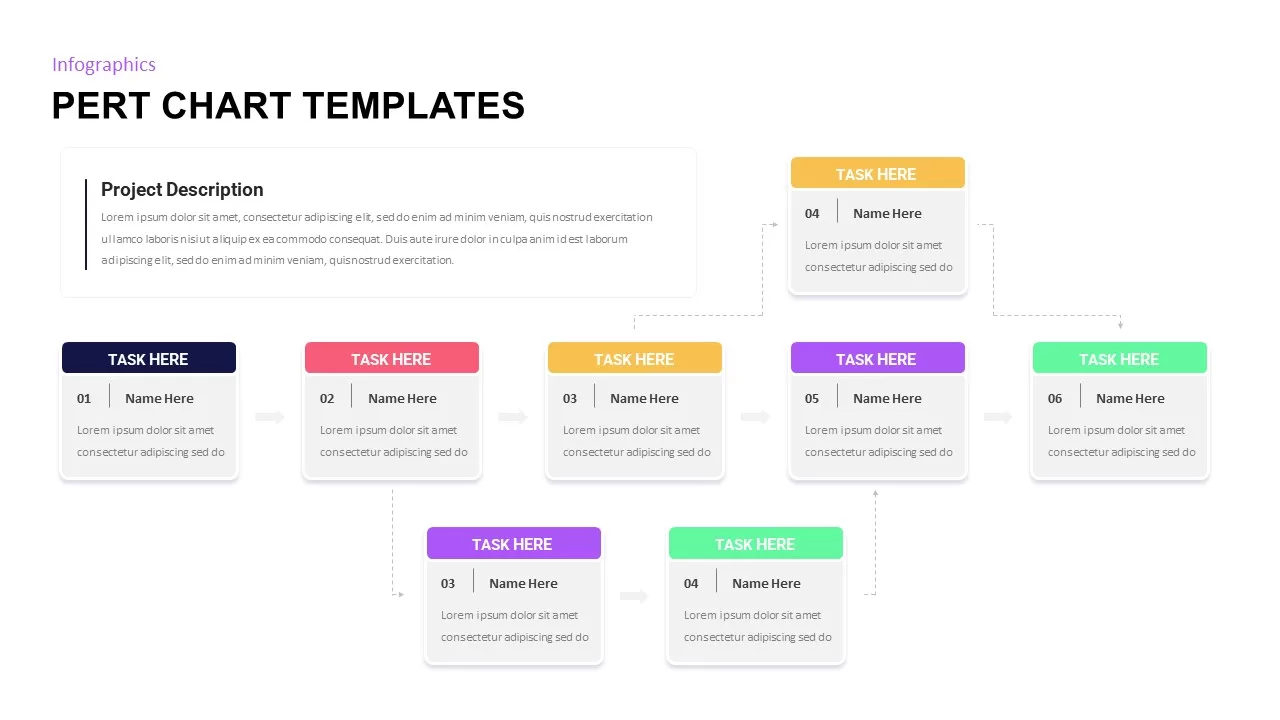

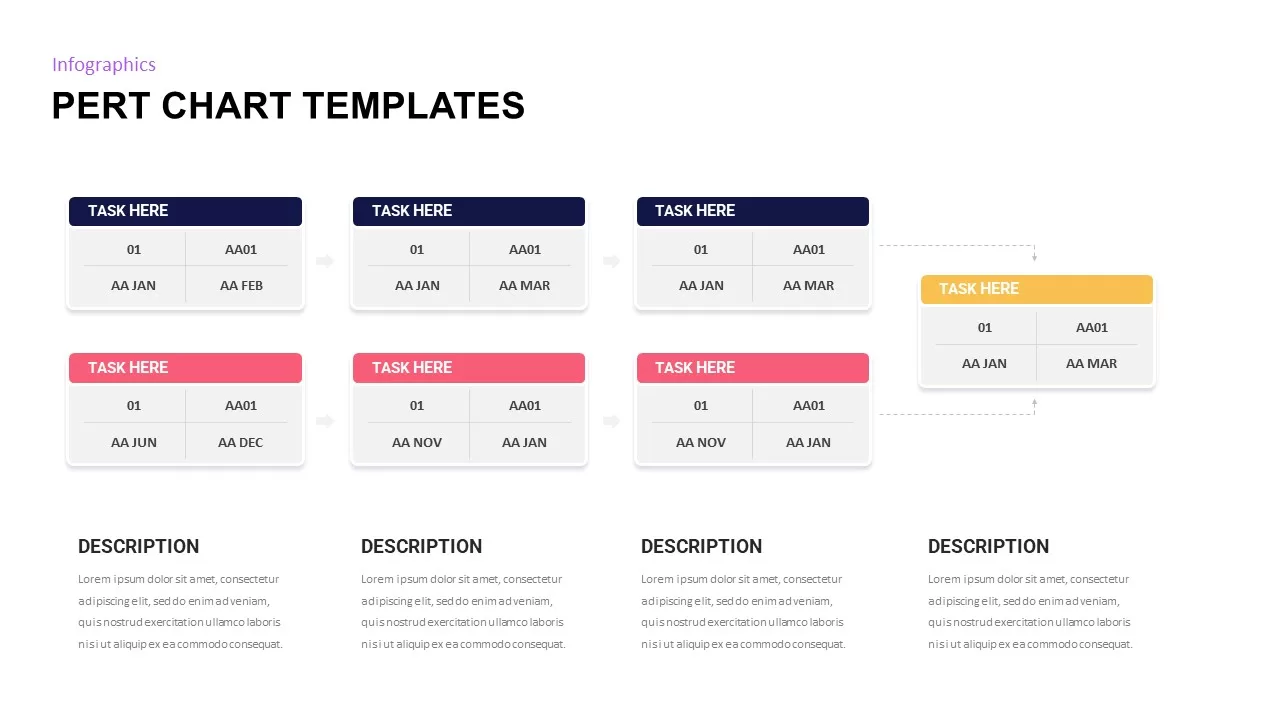

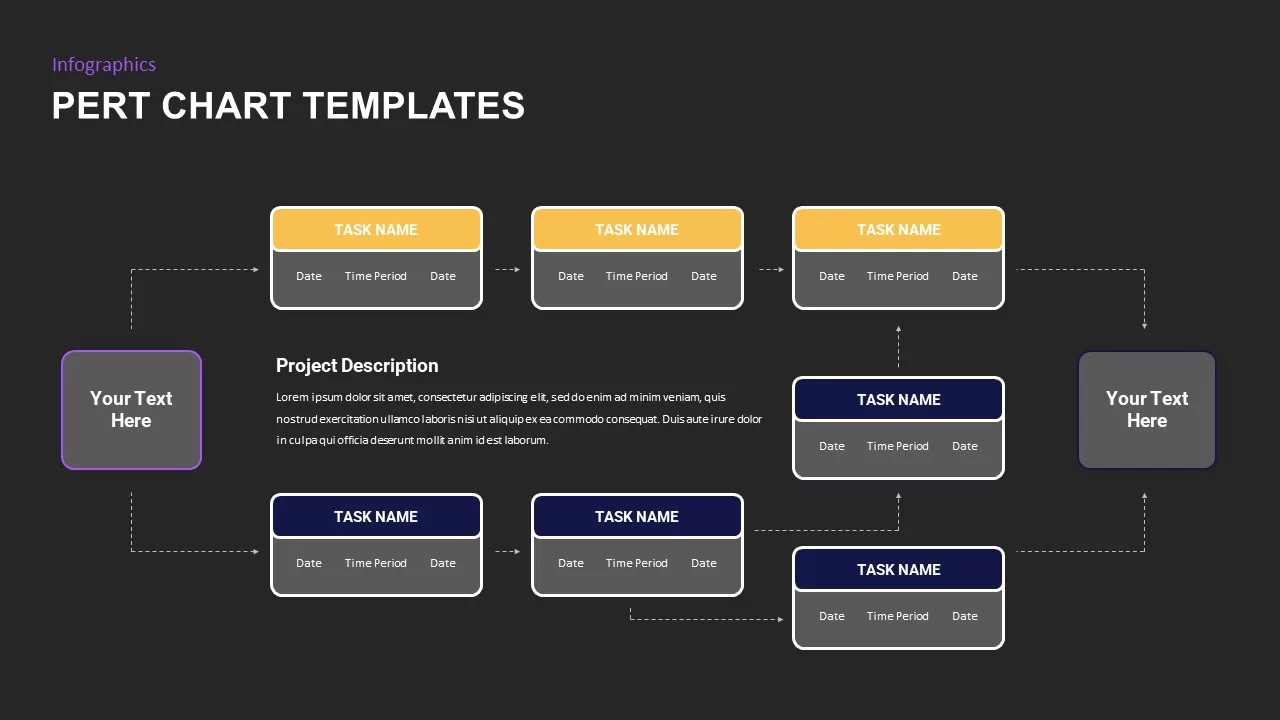
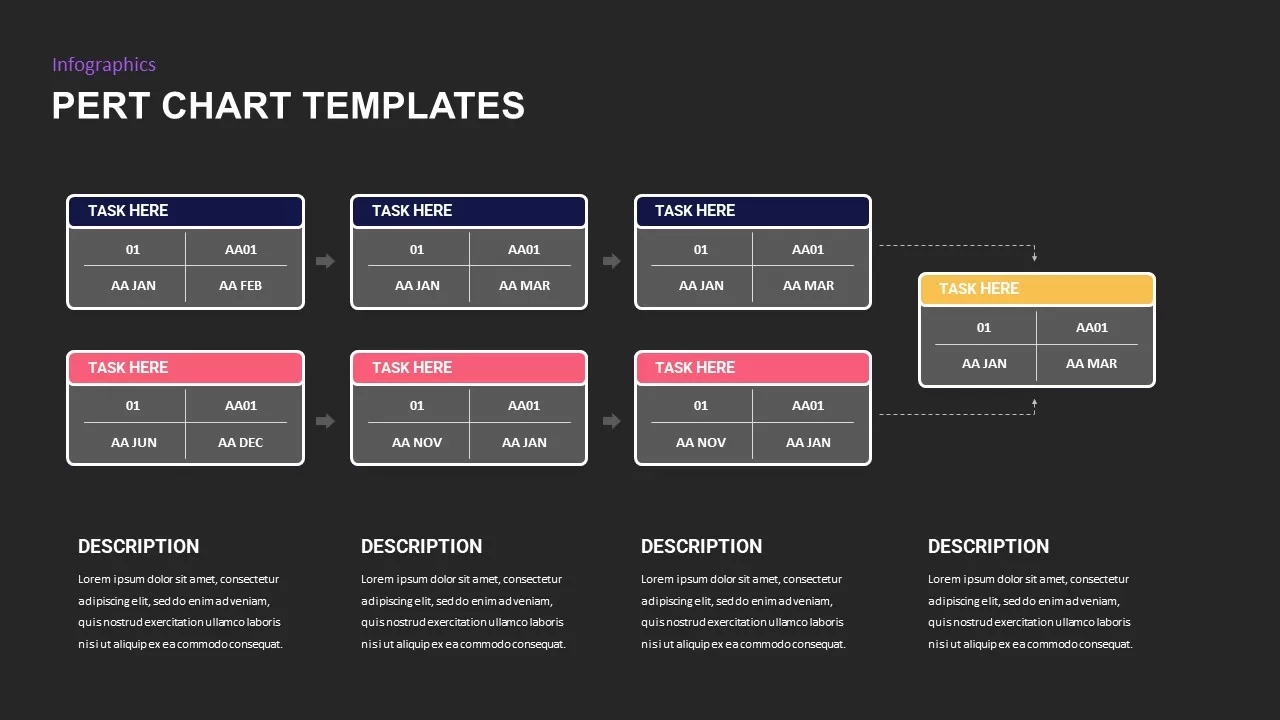
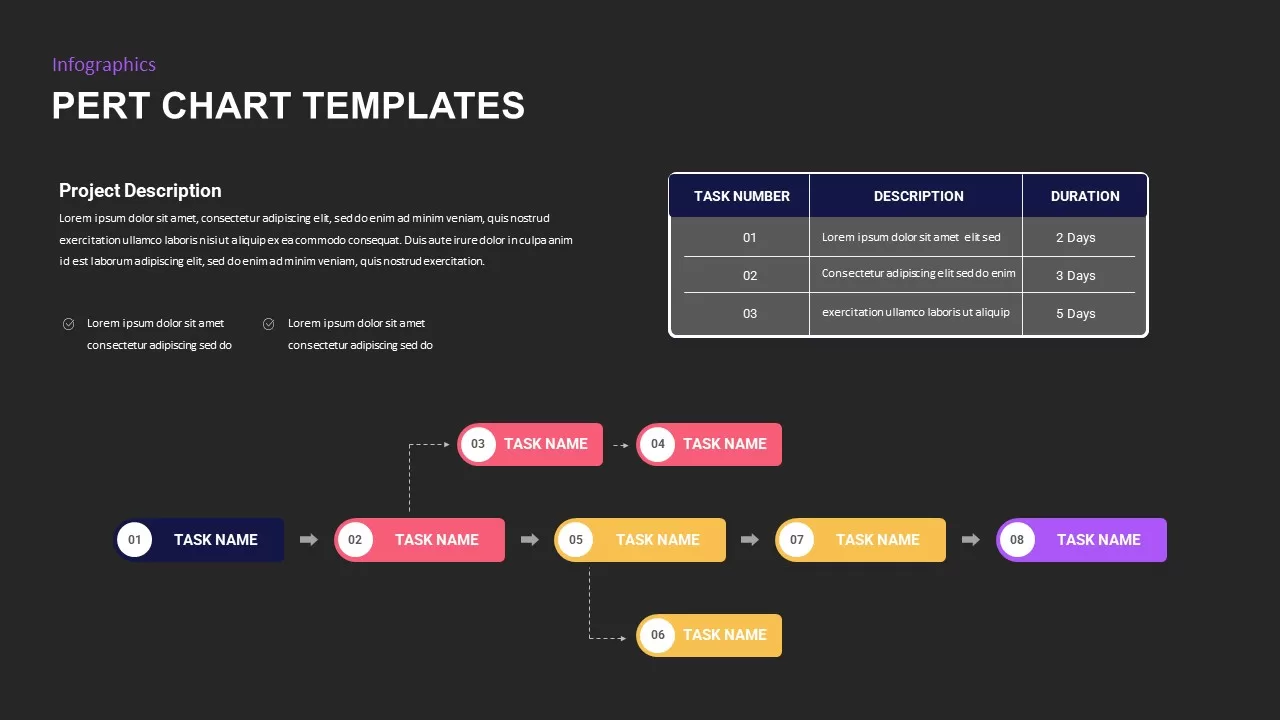

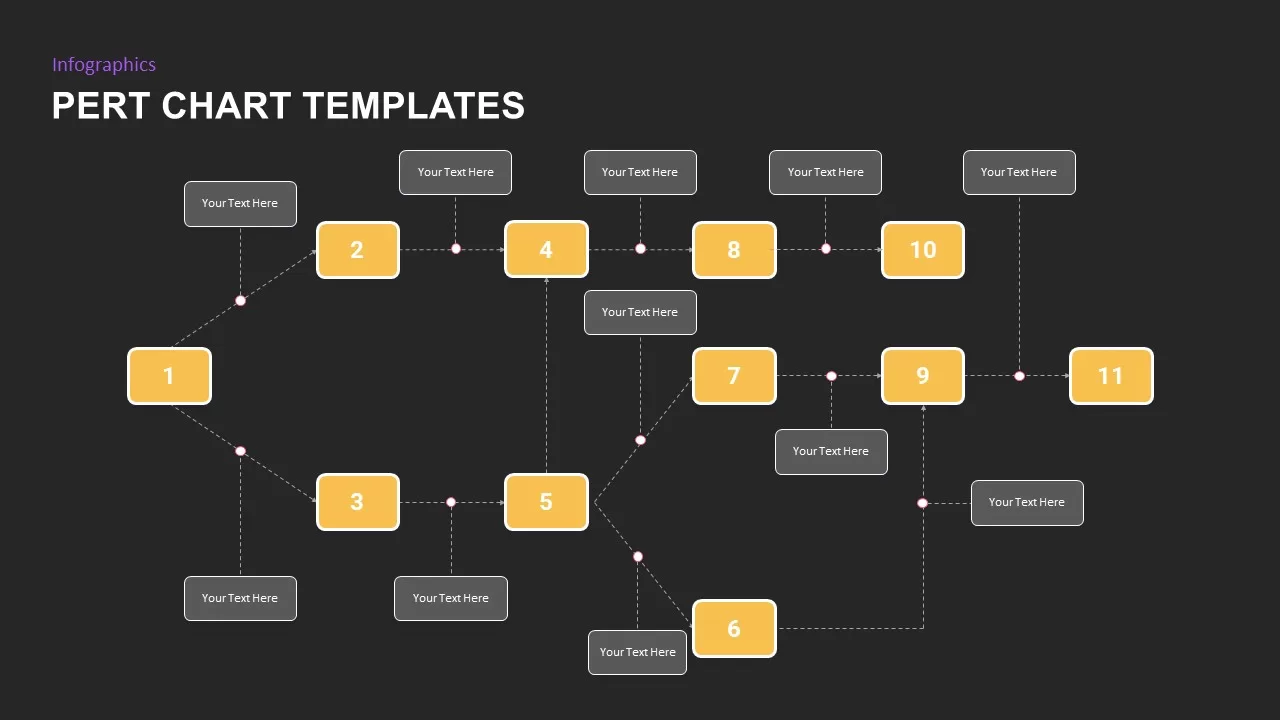
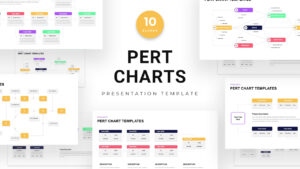

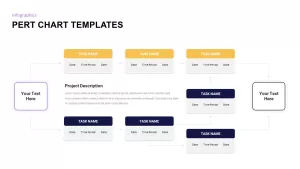
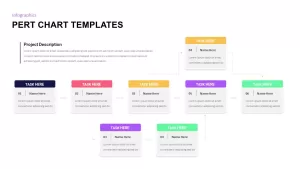
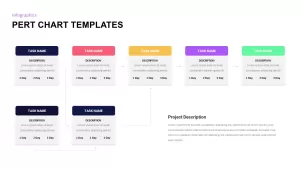
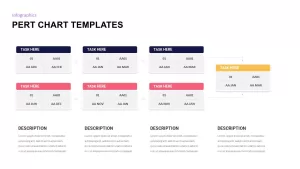
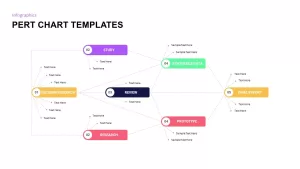
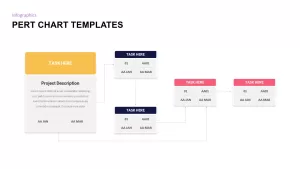
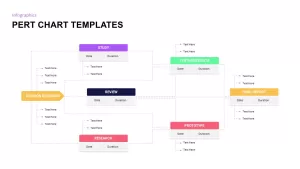
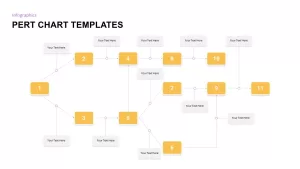
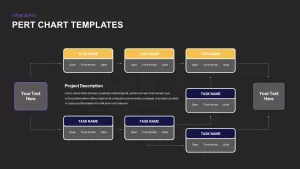
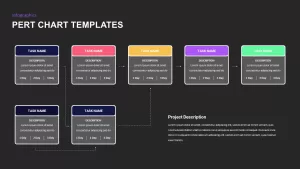
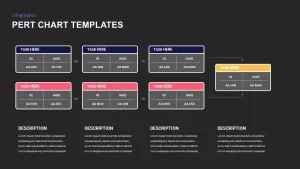
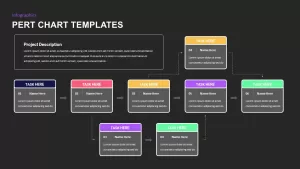
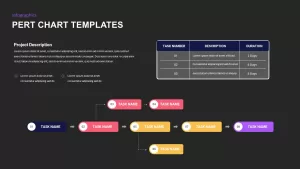
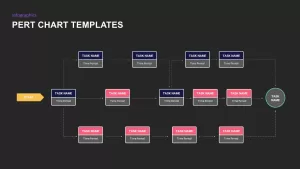
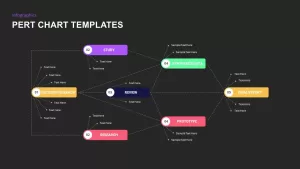
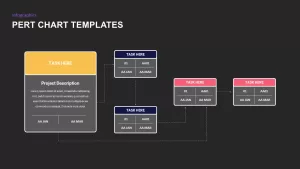
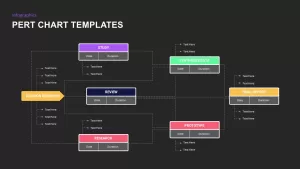
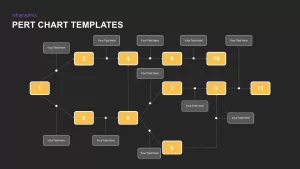
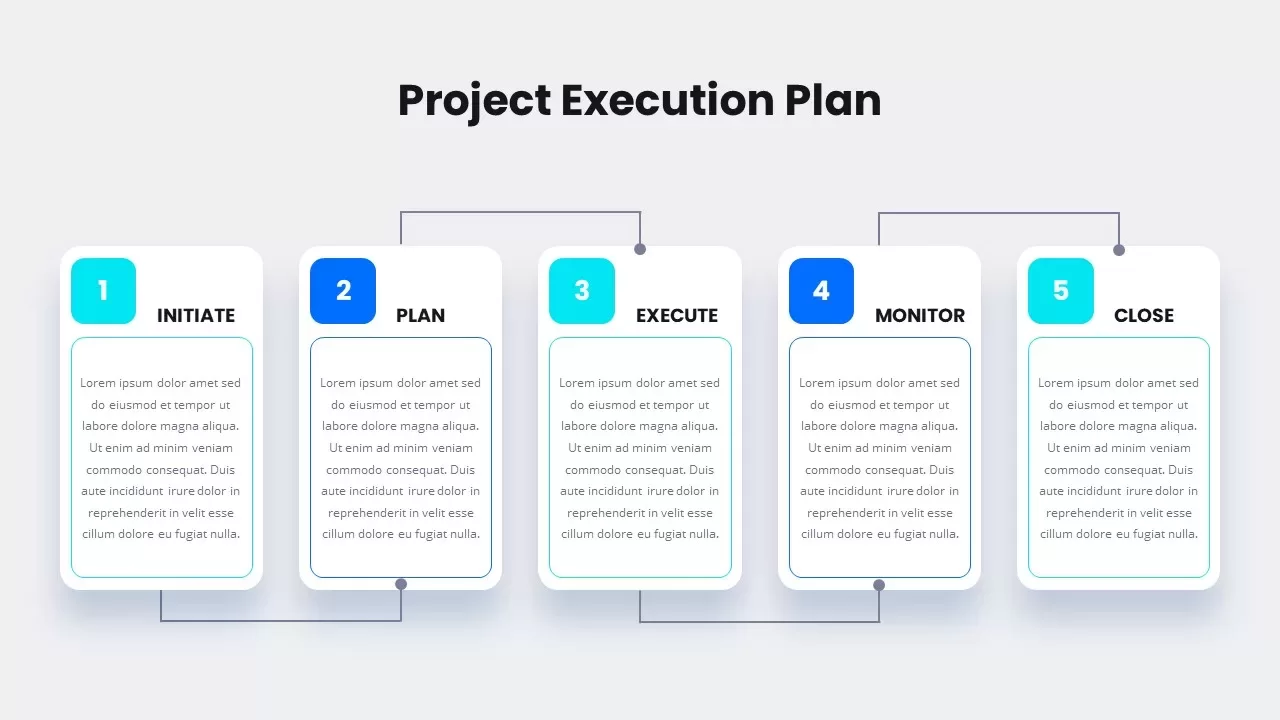
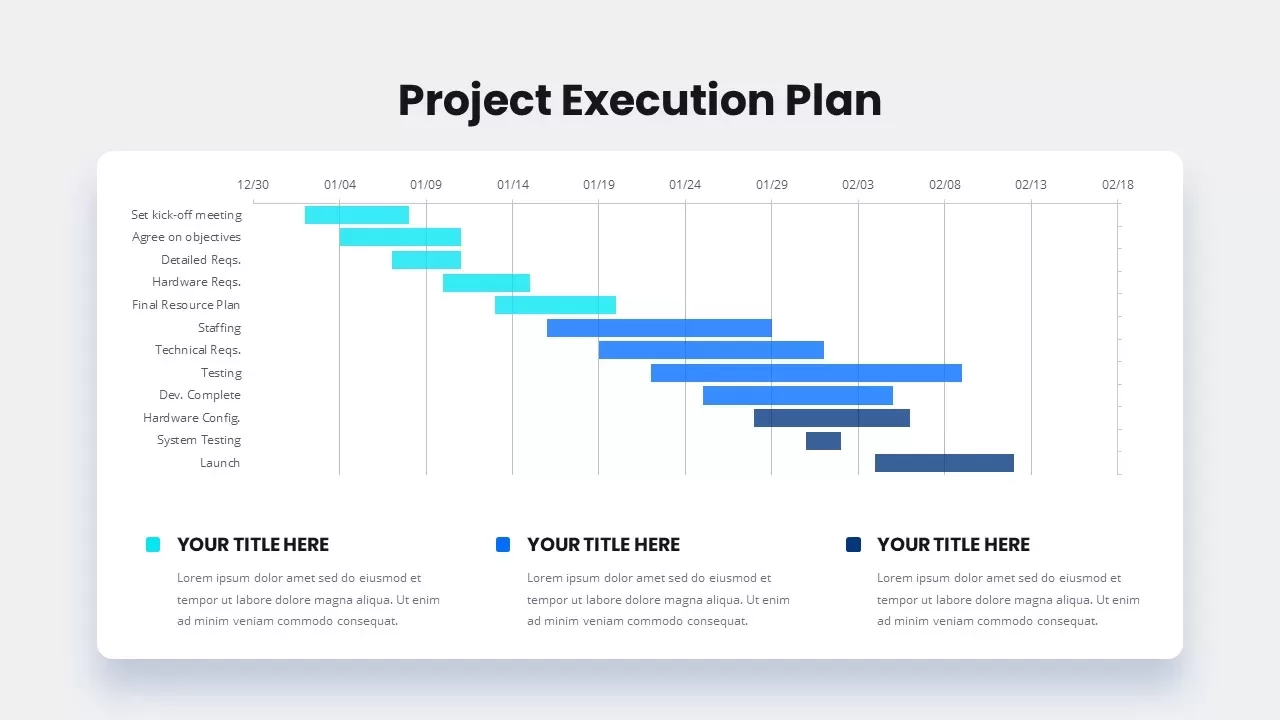
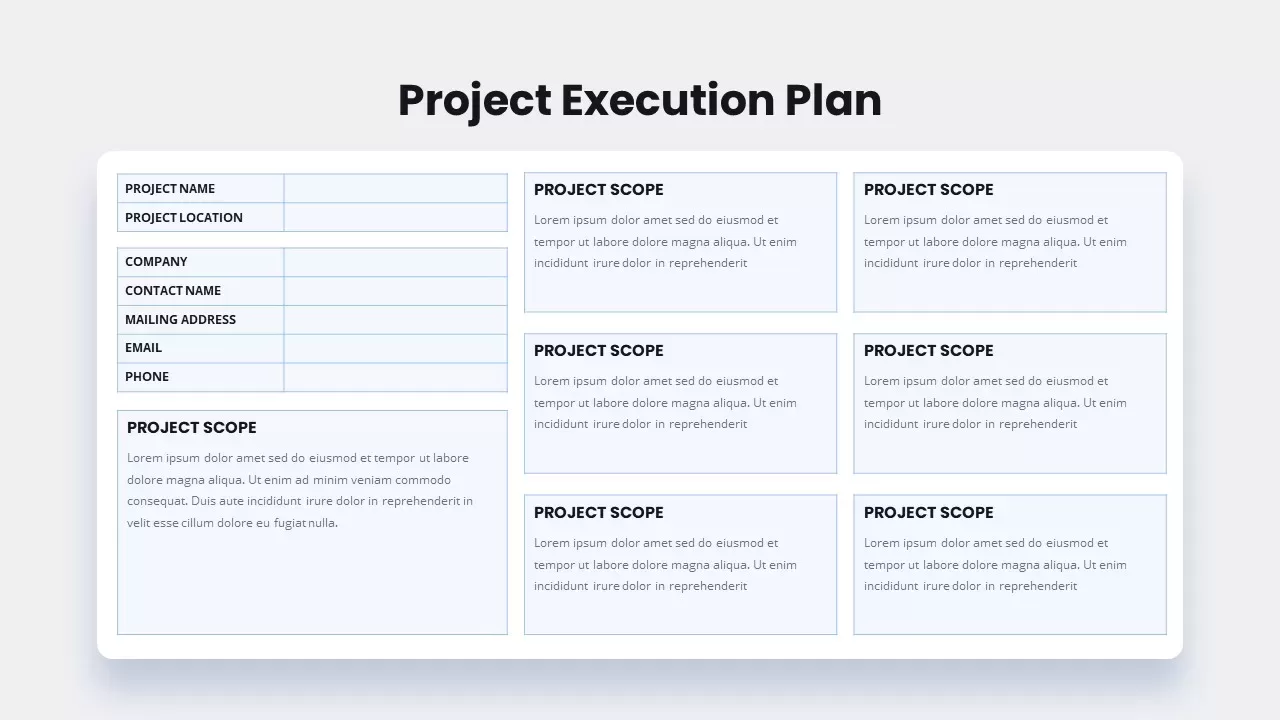
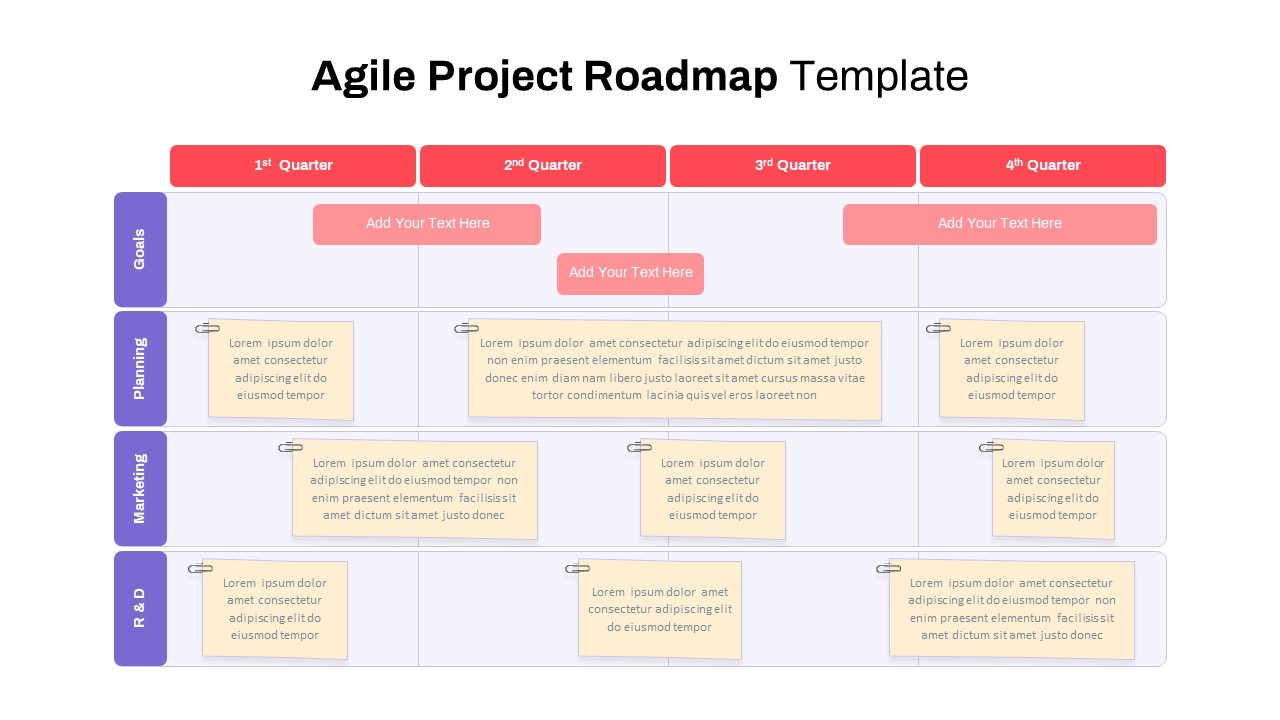
This comprehensive PERT Chart template is designed to streamline project management by offering a clear and visually engaging way to present complex project timelines and task dependencies. With 10 slides included, the template features various layouts for mapping out tasks, time periods, and sequencing, ensuring that every step of your project is easy to understand and communicate.
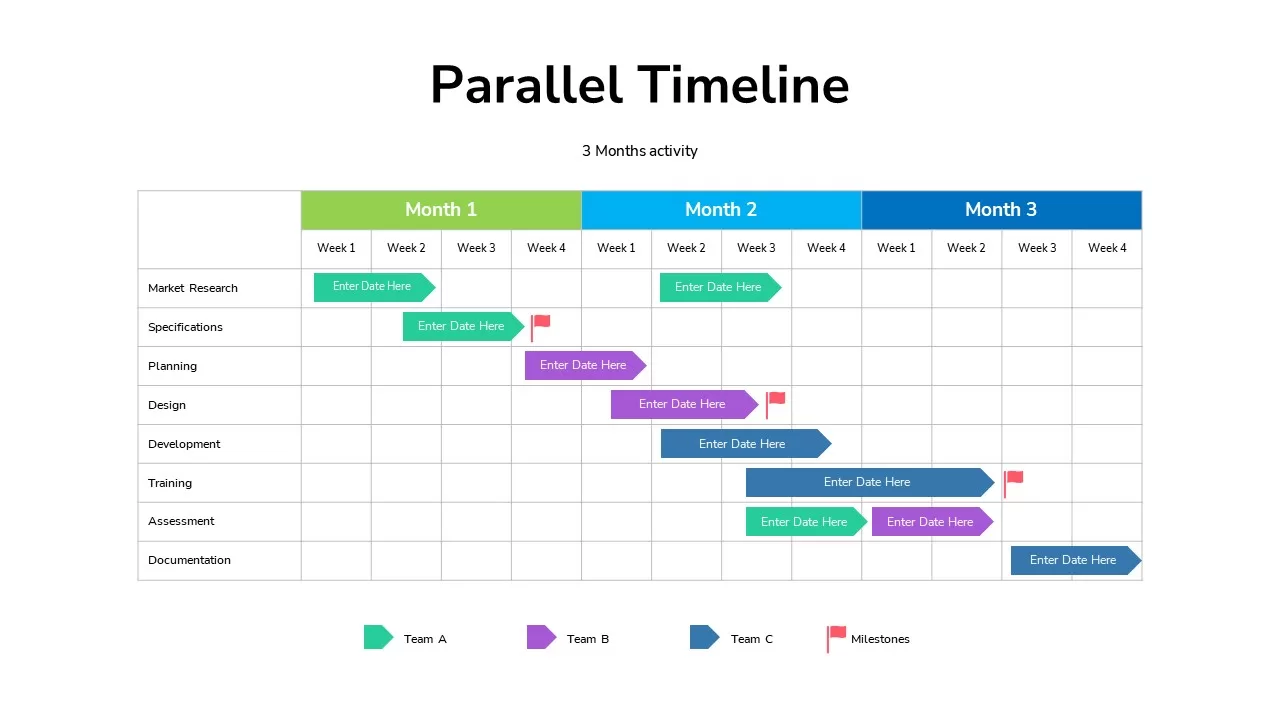
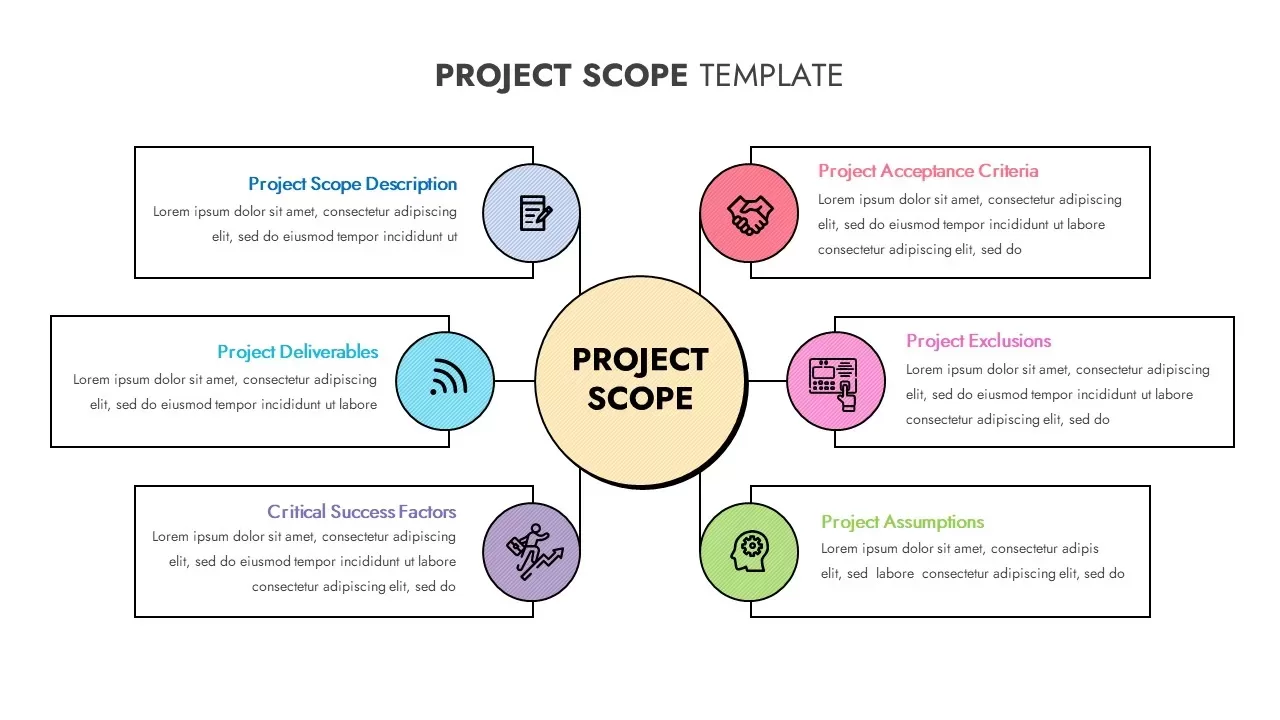
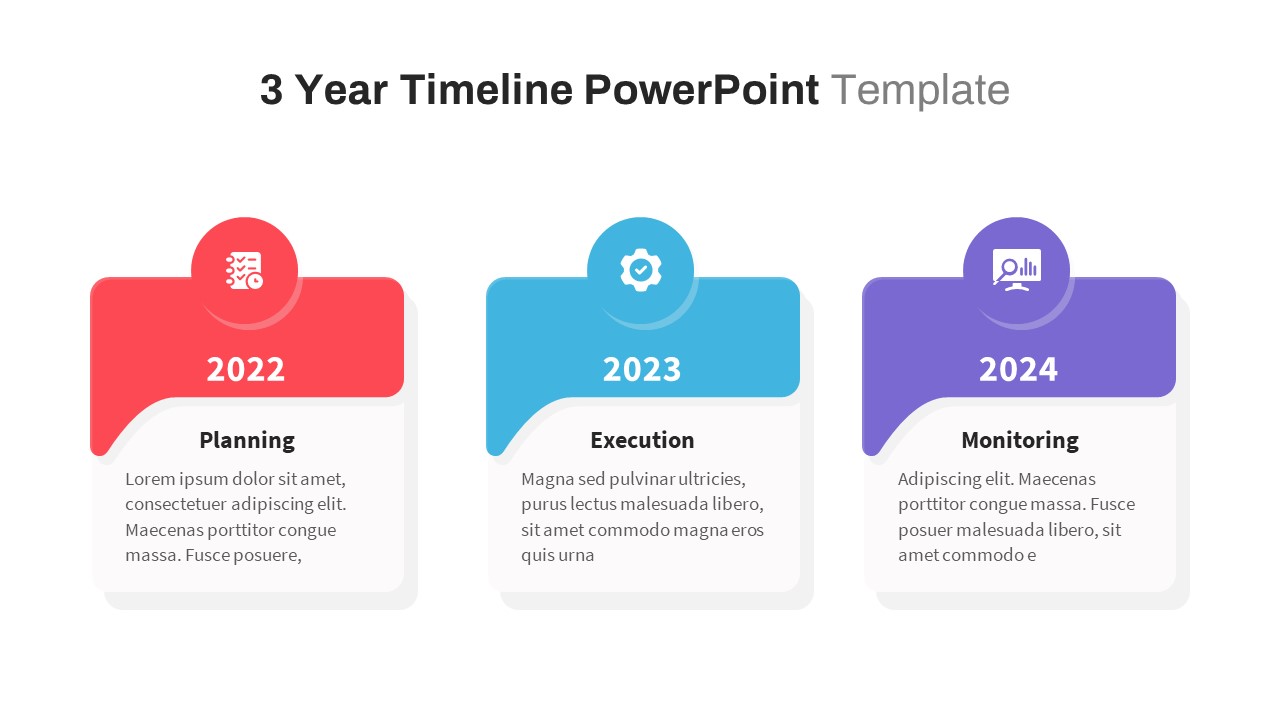
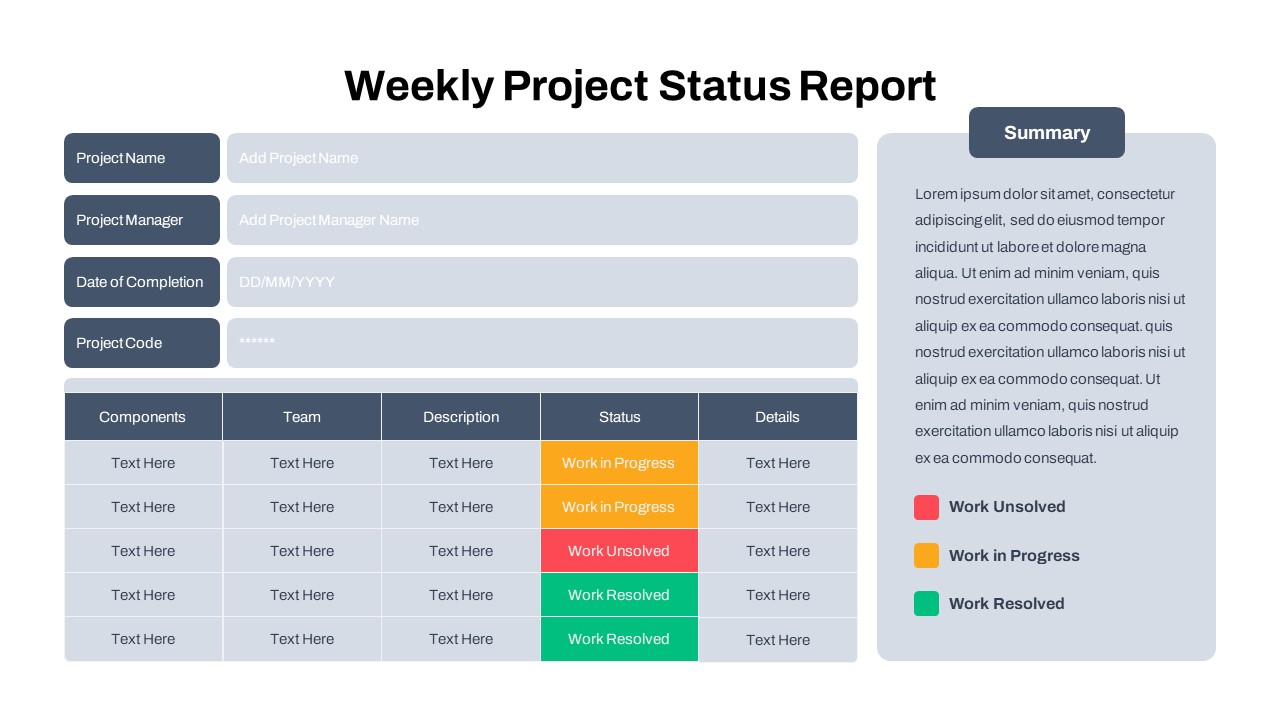
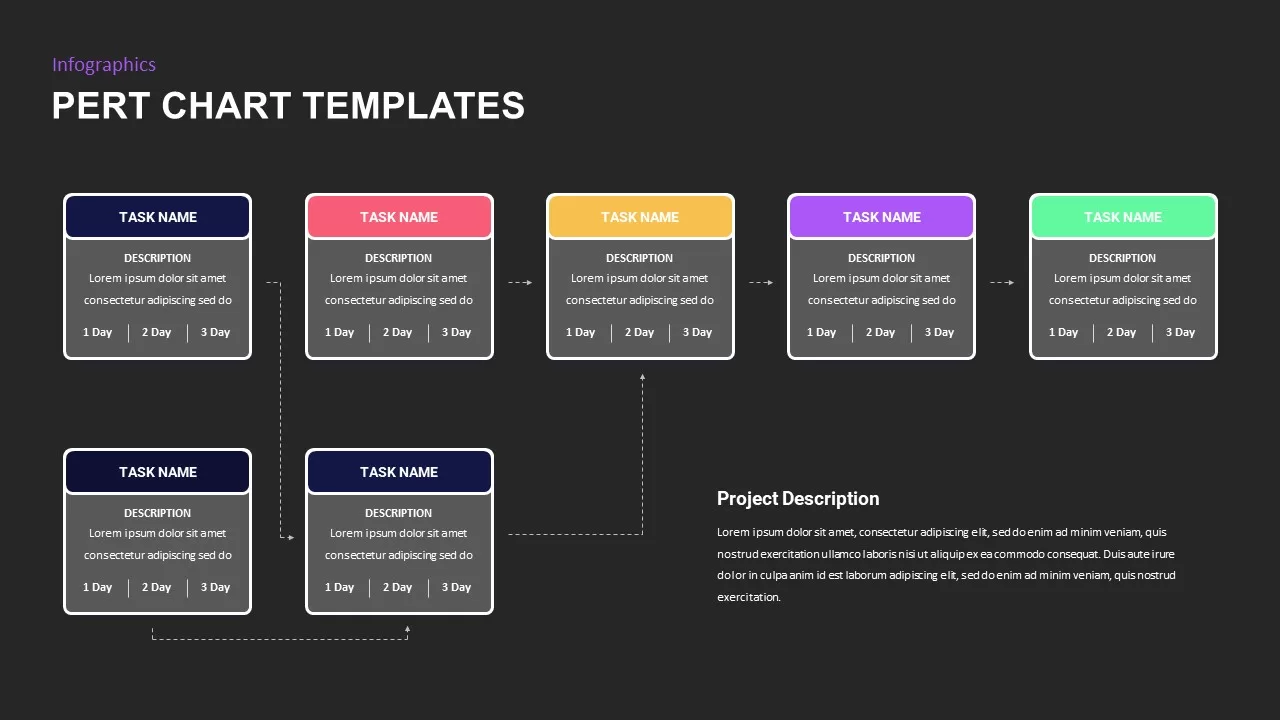
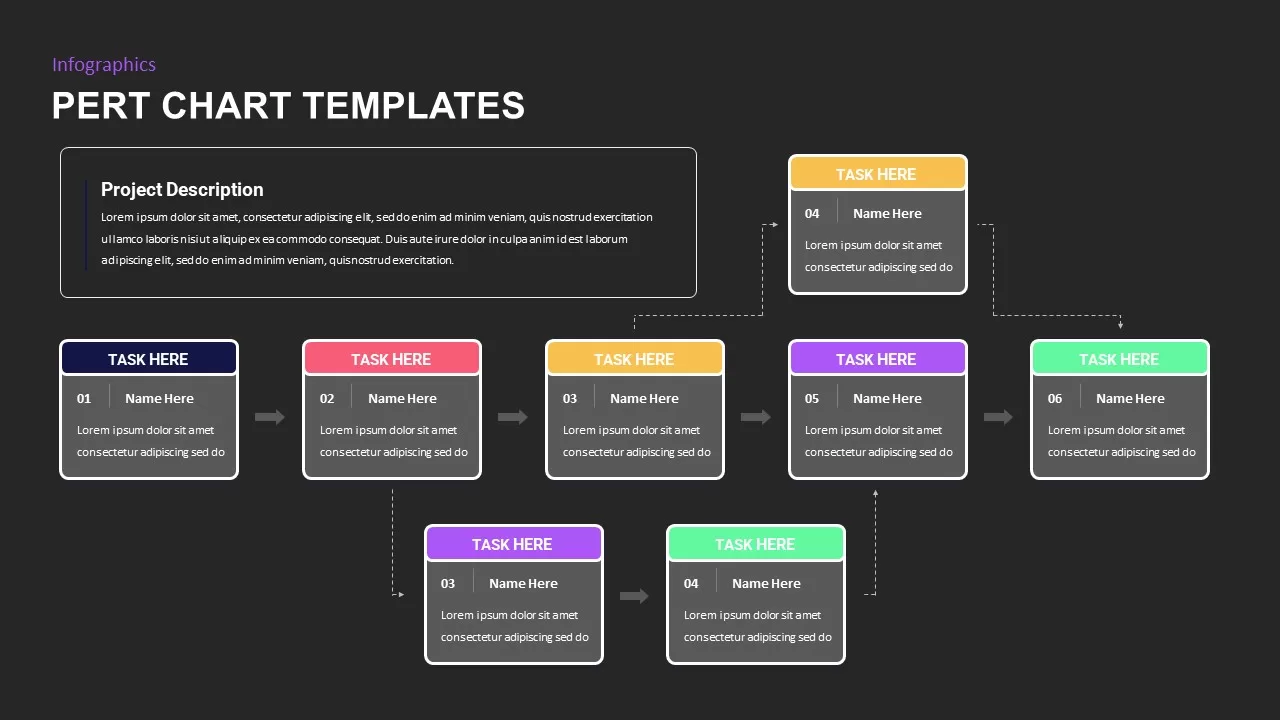
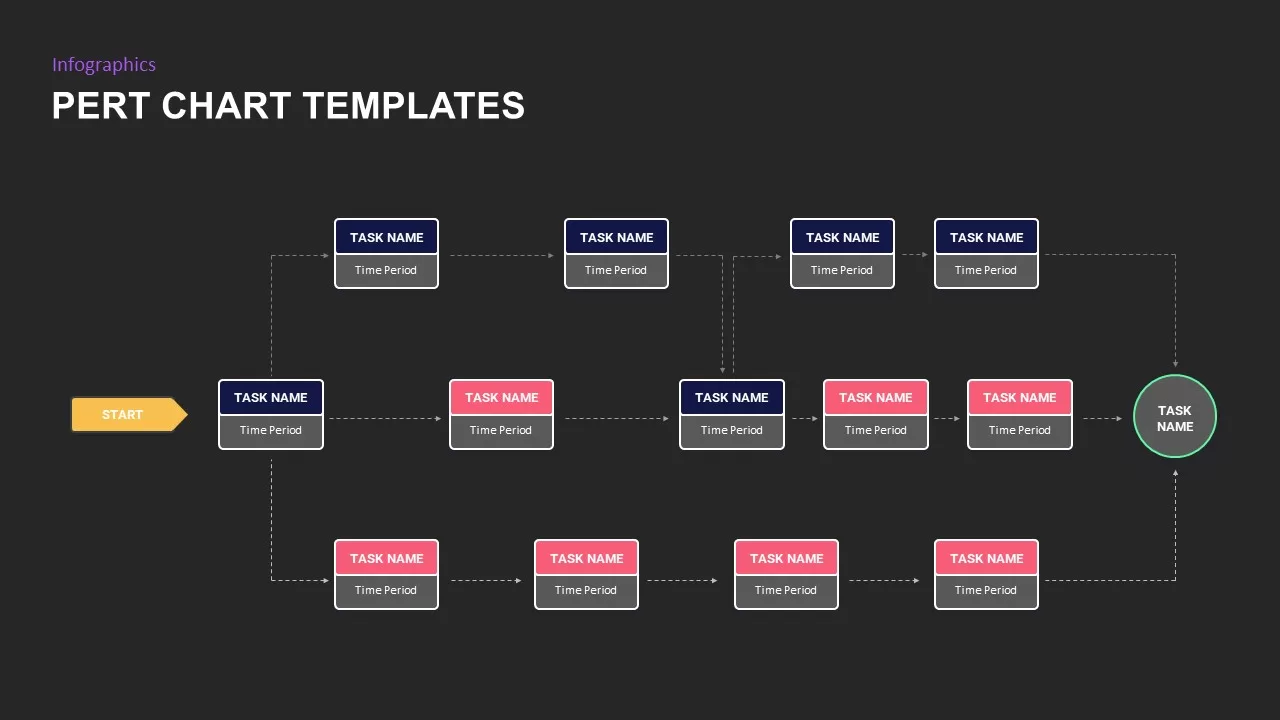
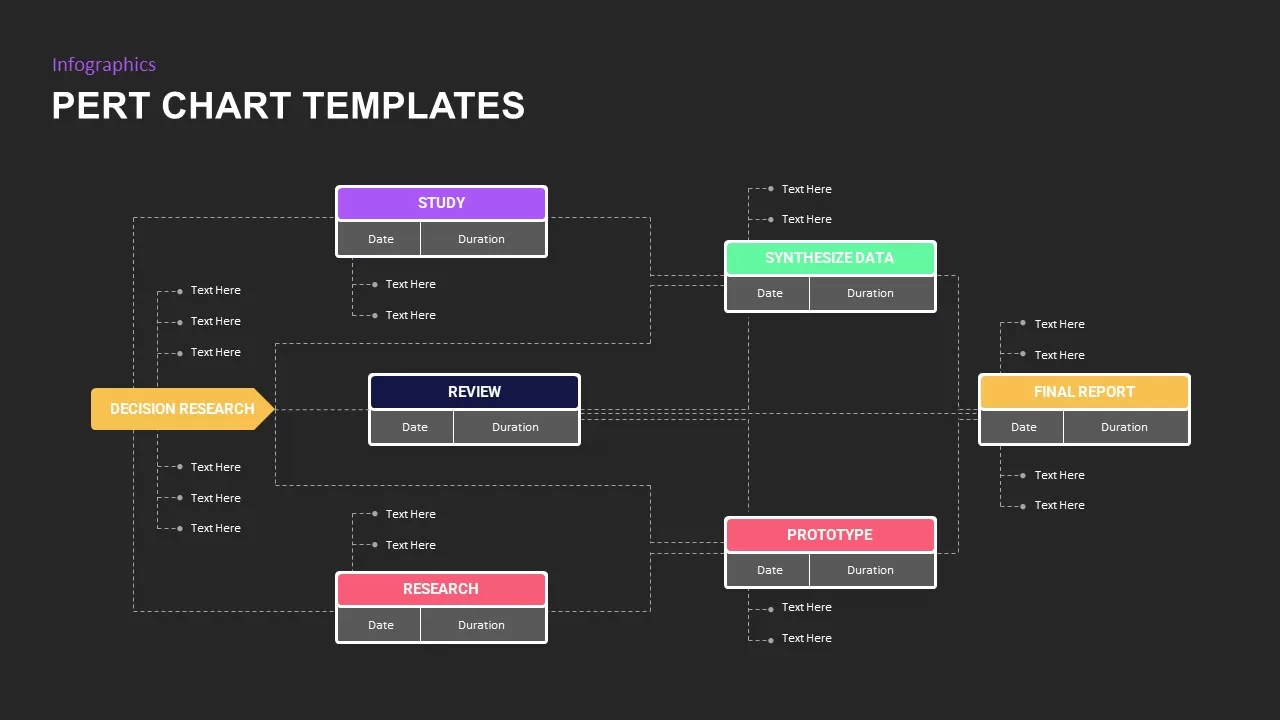
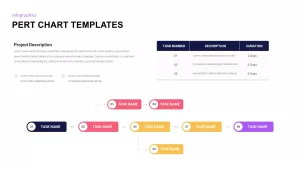
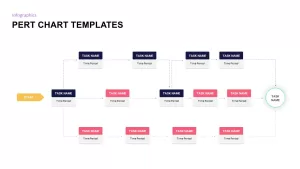
The template utilizes a vibrant color scheme, including purple, yellow, and green, to distinguish between different phases of the project, providing both clarity and visual appeal. Each slide is fully customizable, allowing you to input task names, descriptions, and durations while ensuring that all project stages are logically connected. Whether you’re tracking milestones, reviewing progress, or laying out a sequence of project activities, this template offers flexibility for a wide range of project types.
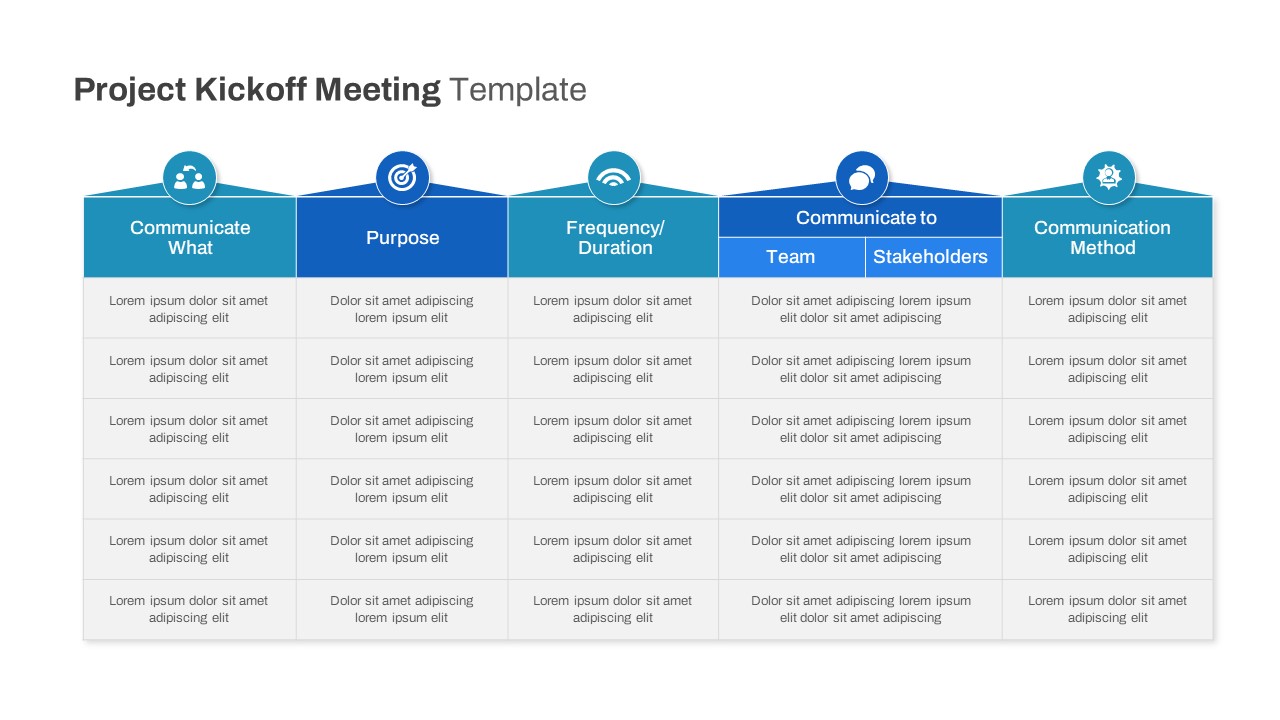
Ideal for project managers, consultants, or teams involved in complex initiatives, this PERT Chart template helps to visualize the project workflow, ensuring that all stakeholders are aligned and aware of the critical path. It’s optimized for both PowerPoint and Google Slides, making it easy to integrate into your presentation and share with colleagues or clients.
Who is it for
This template is ideal for project managers, team leaders, consultants, and business analysts who need to organize and present detailed project timelines and tasks. It’s also suitable for anyone managing complex processes that involve interdependent tasks or stages.
Other Uses
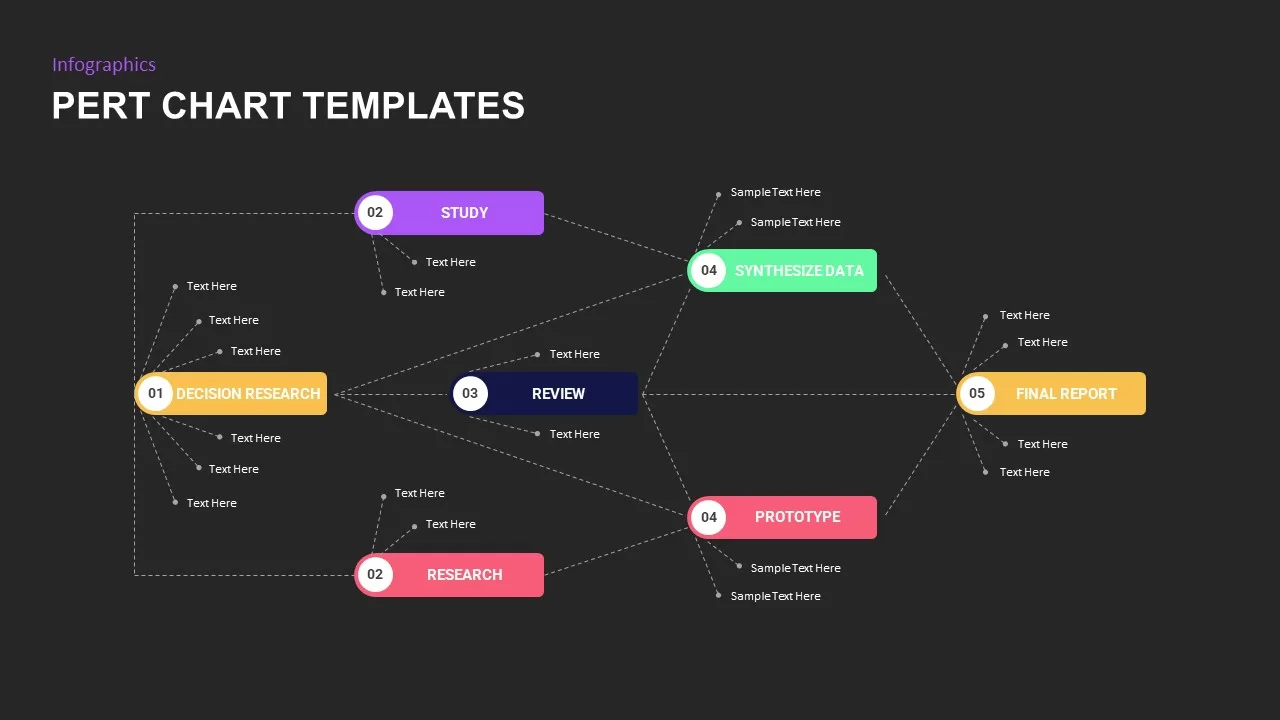
In addition to project management, this slide can be adapted for use in process flow presentations, research project timelines, or any situation where task dependencies need to be visualized. It’s also ideal for academic or corporate settings where projects are being analyzed or reviewed.
Login to download this file

Item ID
SB02056
Related Templates

Project Management Dashboard Template for PowerPoint & Google Slides
Project
Premium

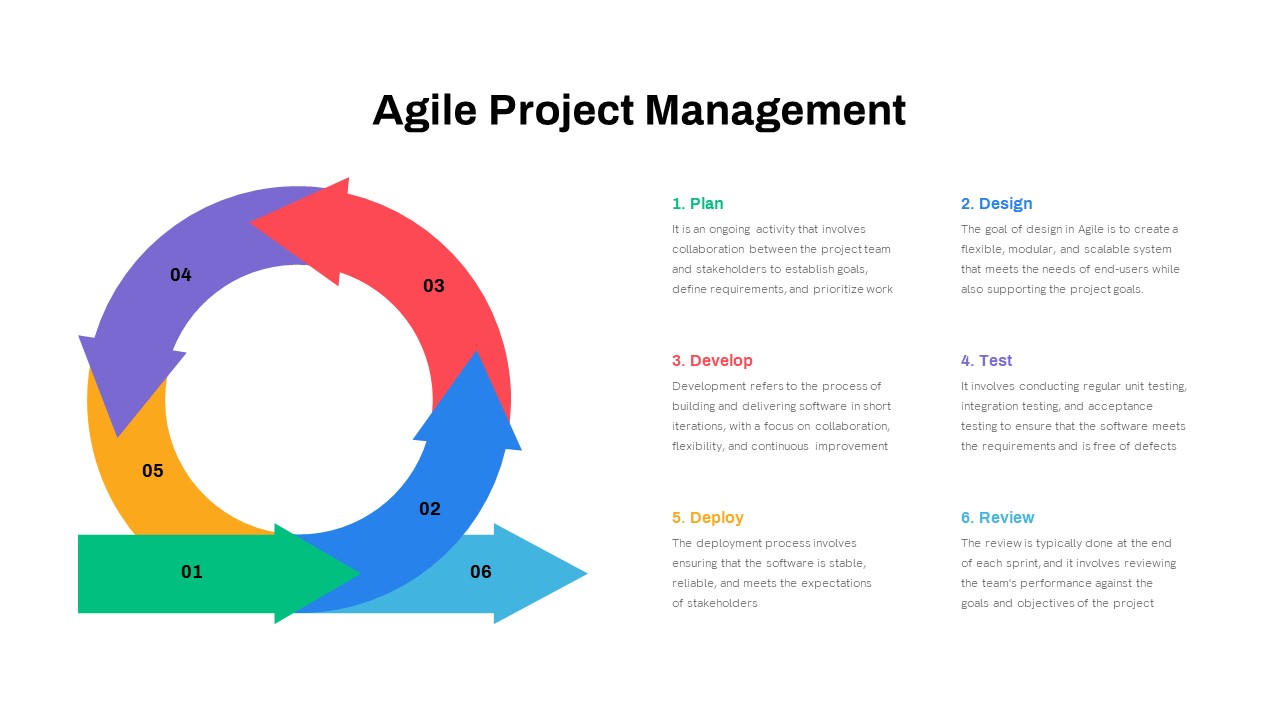
Comprehensive Agile Project Management Template for PowerPoint & Google Slides
Scrum
Premium

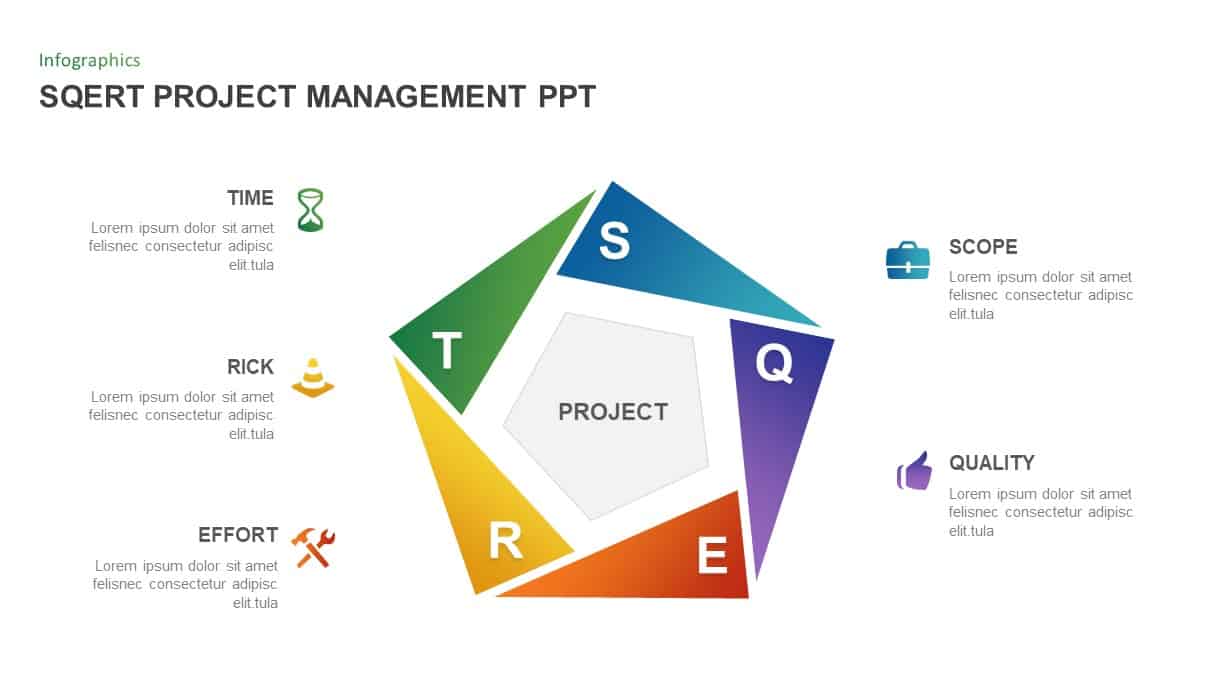
SQERT Project Management Infographic Template for PowerPoint & Google Slides
Process
Premium
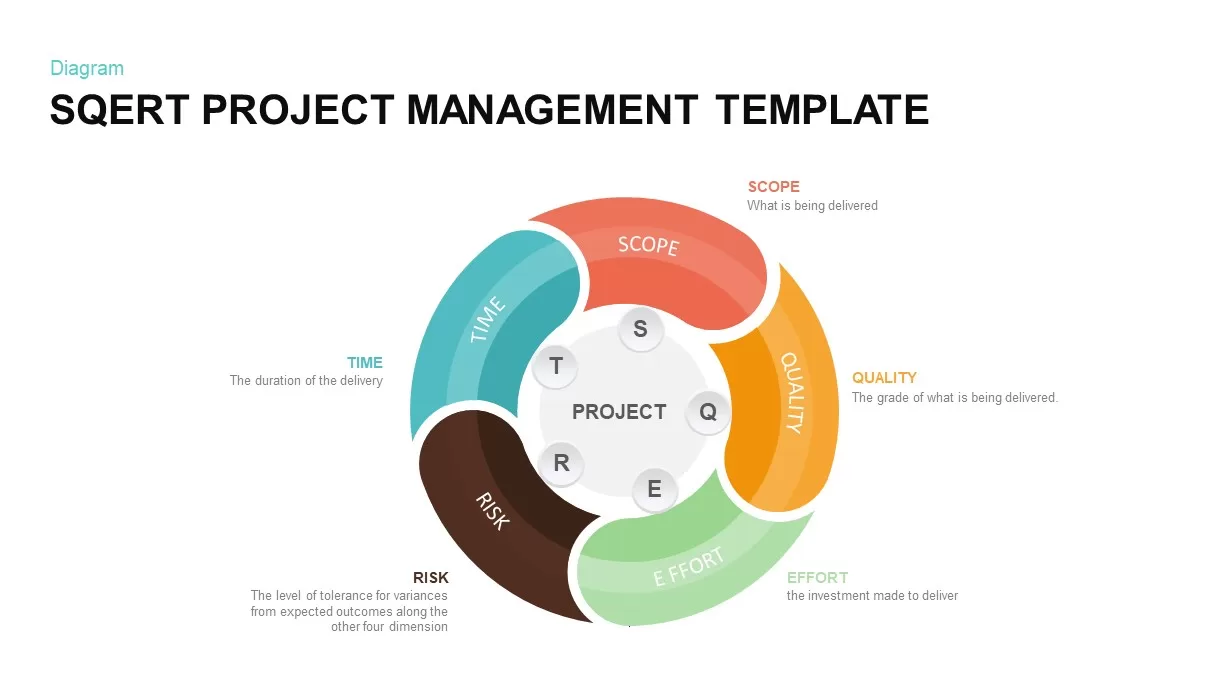
SQERT Project Management Infographic Template for PowerPoint & Google Slides
Process
Premium
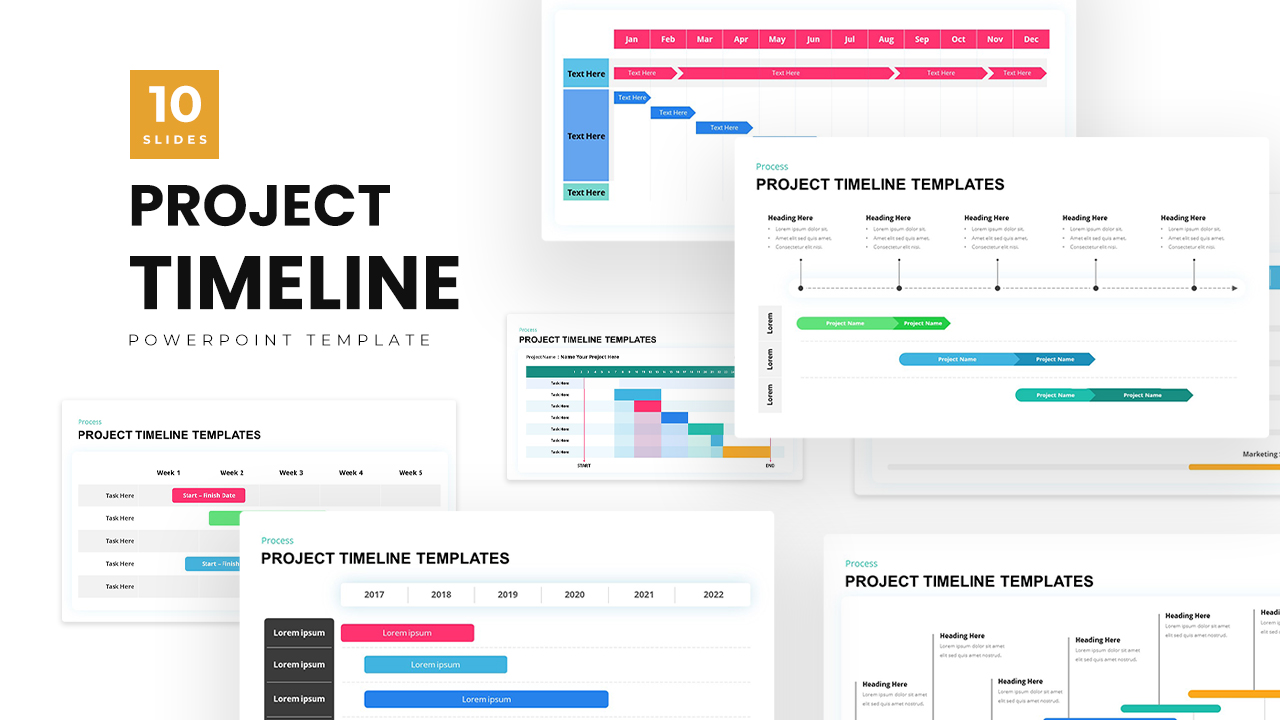
Project Timeline Management template for PowerPoint & Google Slides
Project Status
Premium
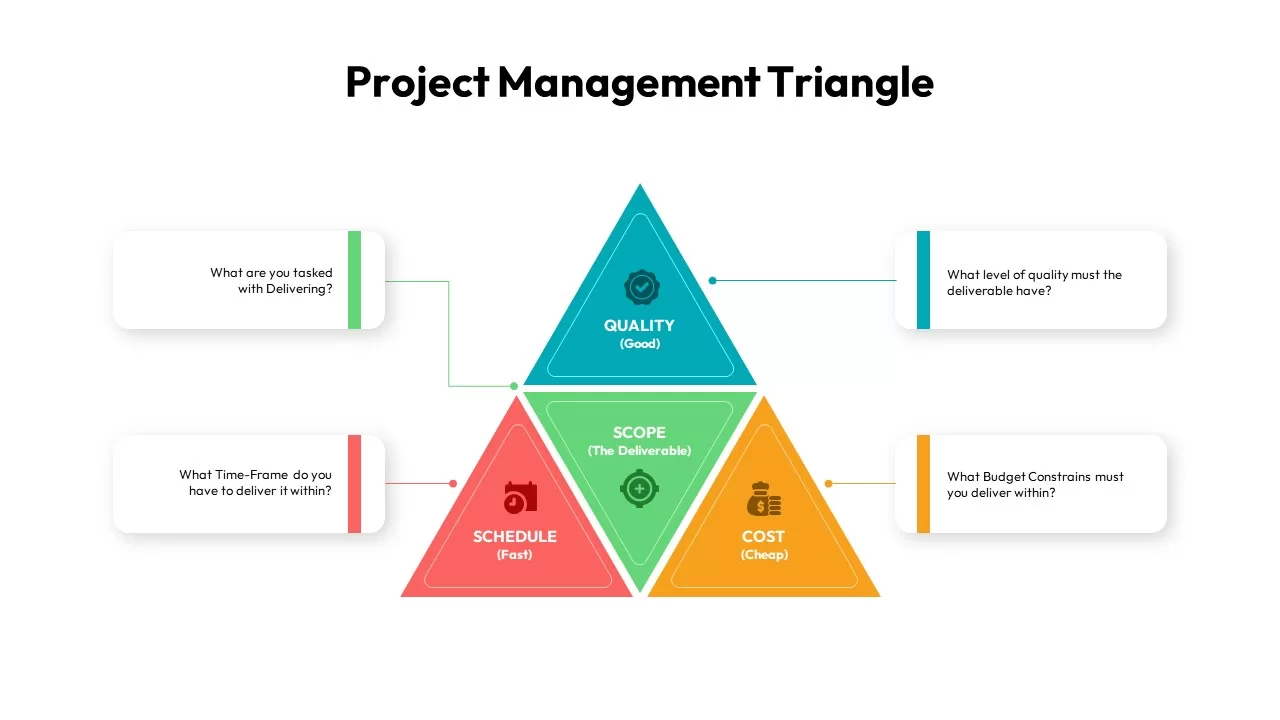
Project Management Triangle Diagram Template for PowerPoint & Google Slides
Project
Premium

Project Management Deck template for PowerPoint & Google Slides
Project
Premium
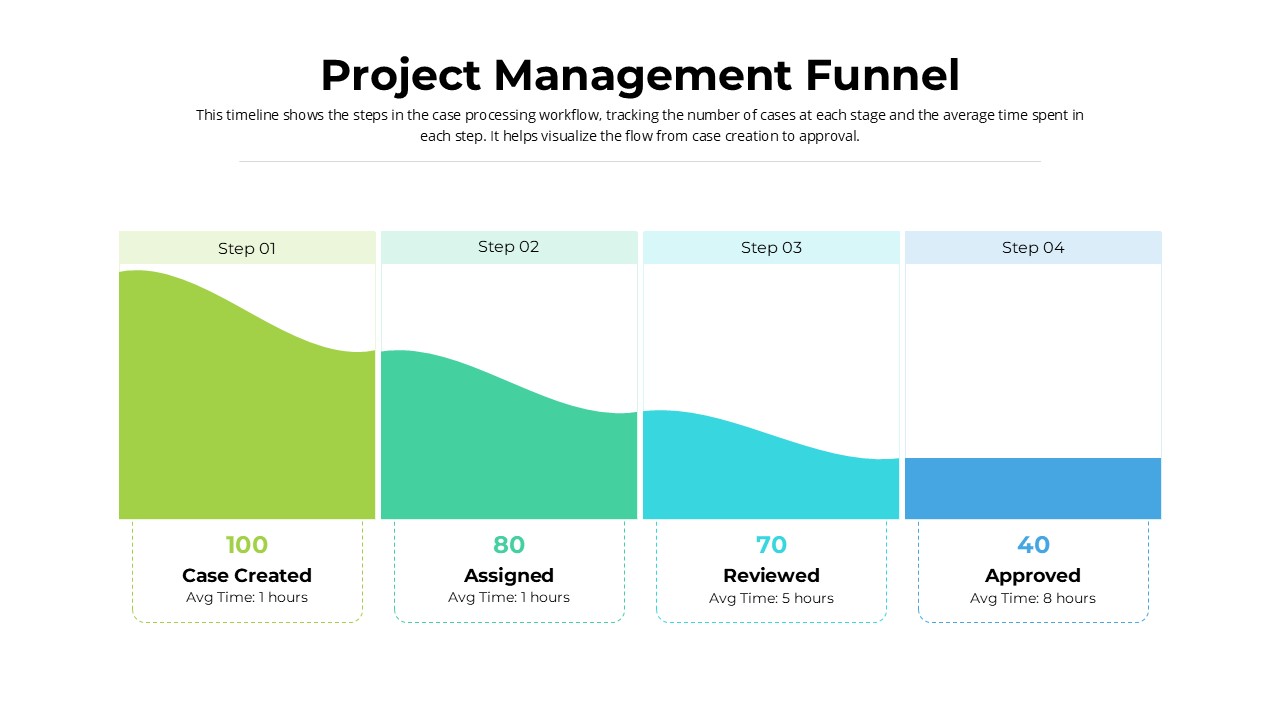
Project Management Funnel template for PowerPoint & Google Slides
Project
Premium
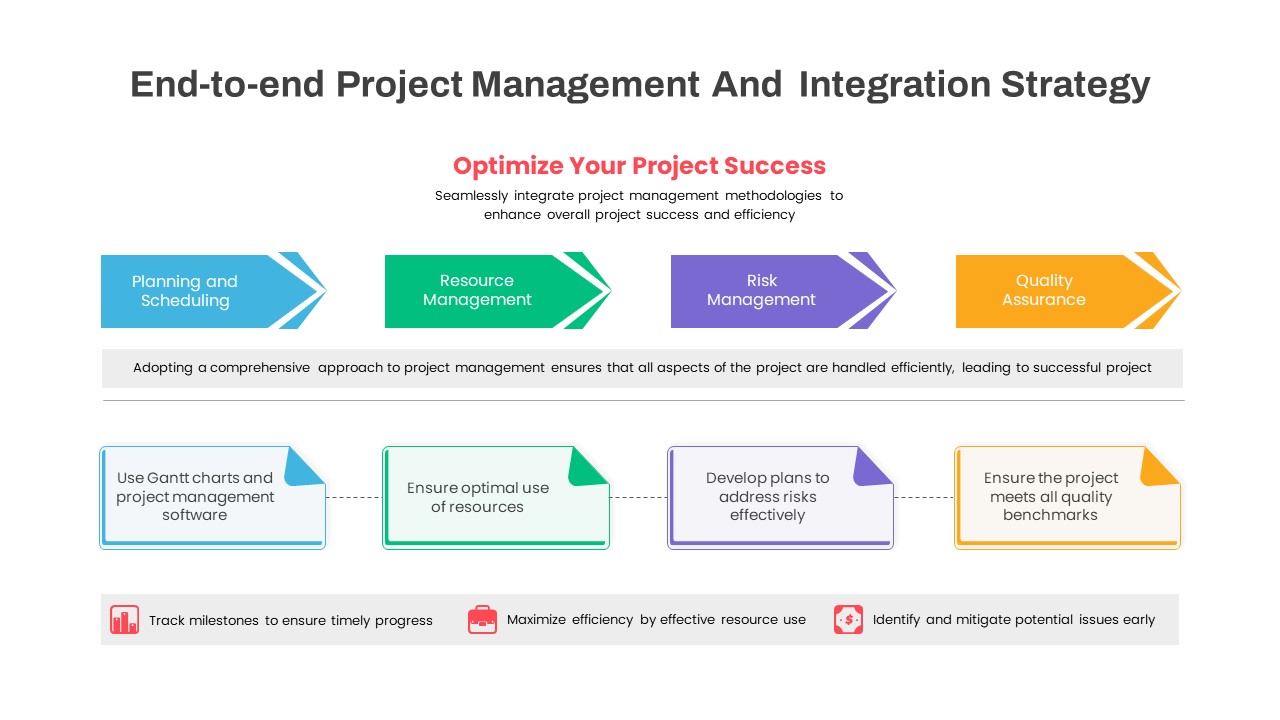
End-to-End Project Management Strategy Template for PowerPoint & Google Slides
Project
Premium
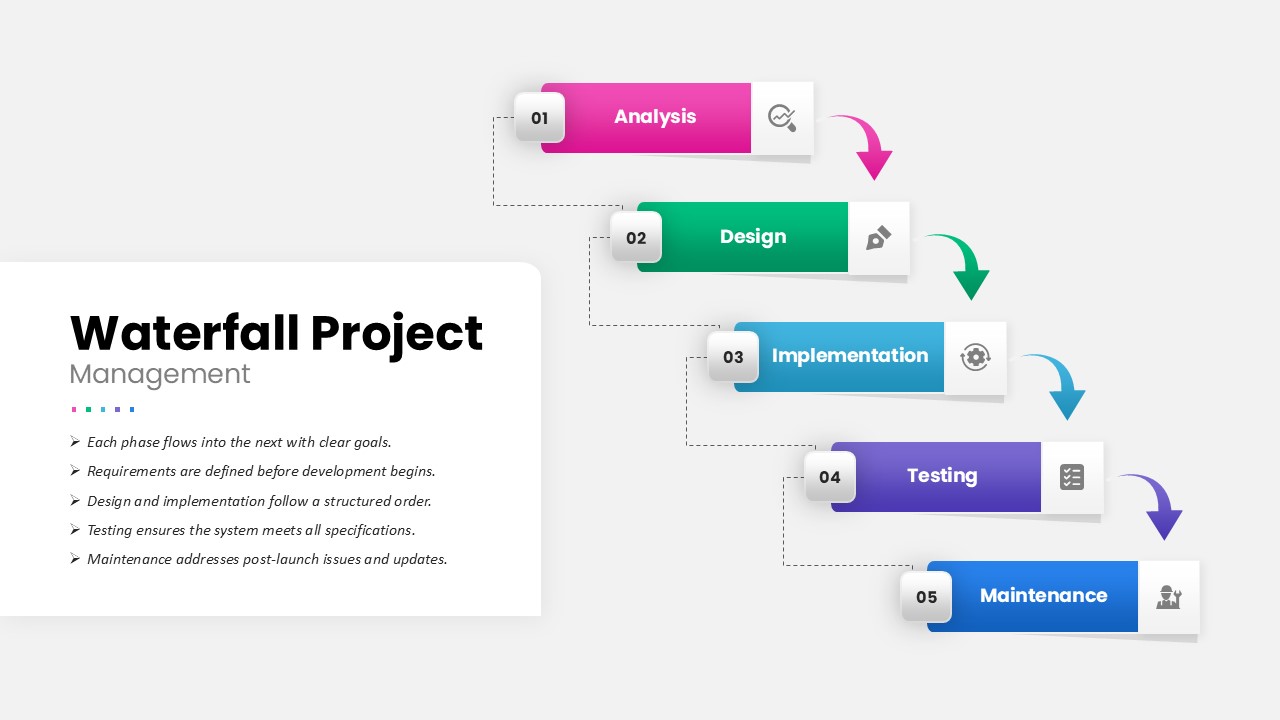
Waterfall Project Management Process template for PowerPoint & Google Slides
Process
Premium
Project Management Funnel Template for PowerPoint & Google Slides
Funnel
Premium
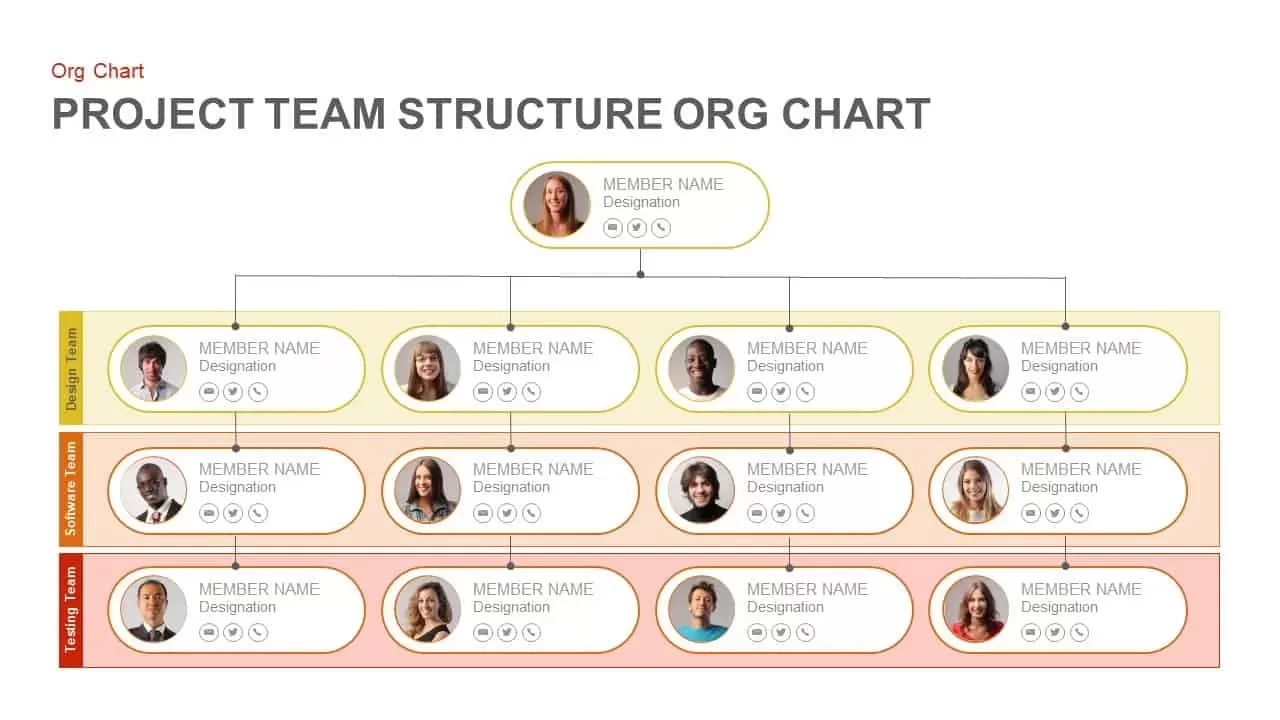
Project Team Structure Org Chart Template for PowerPoint & Google Slides
Org Chart
Premium
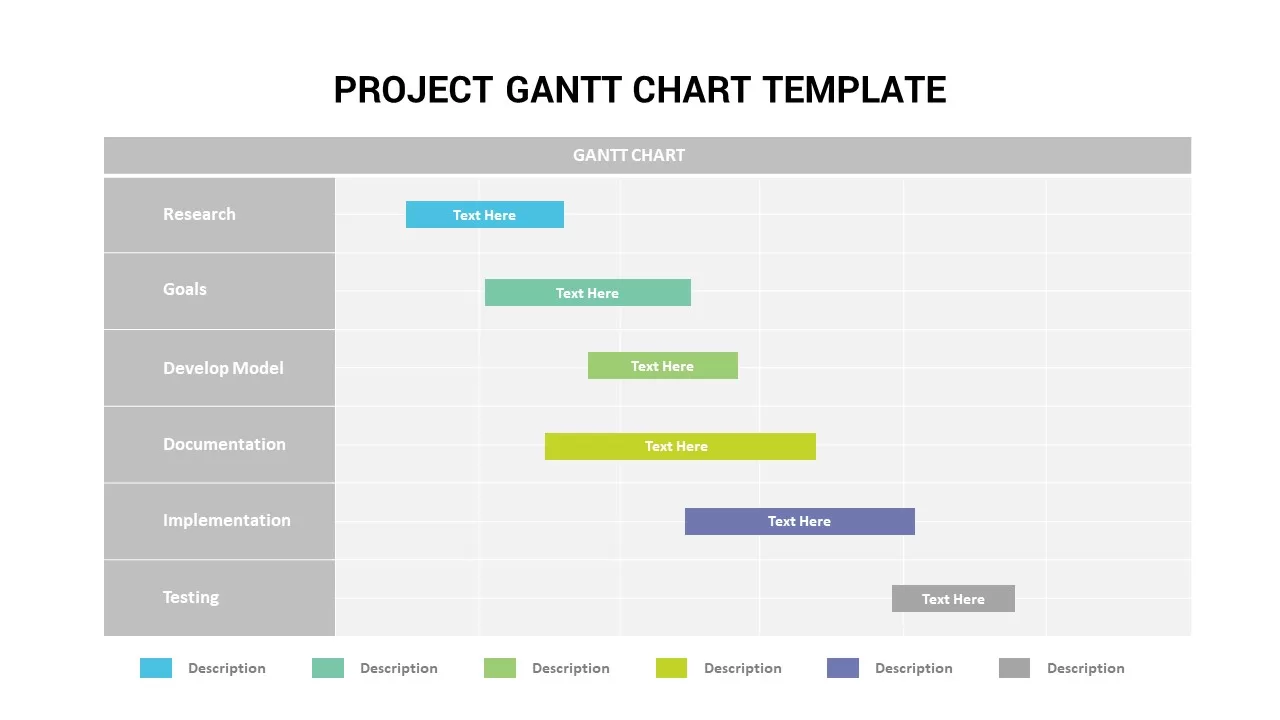
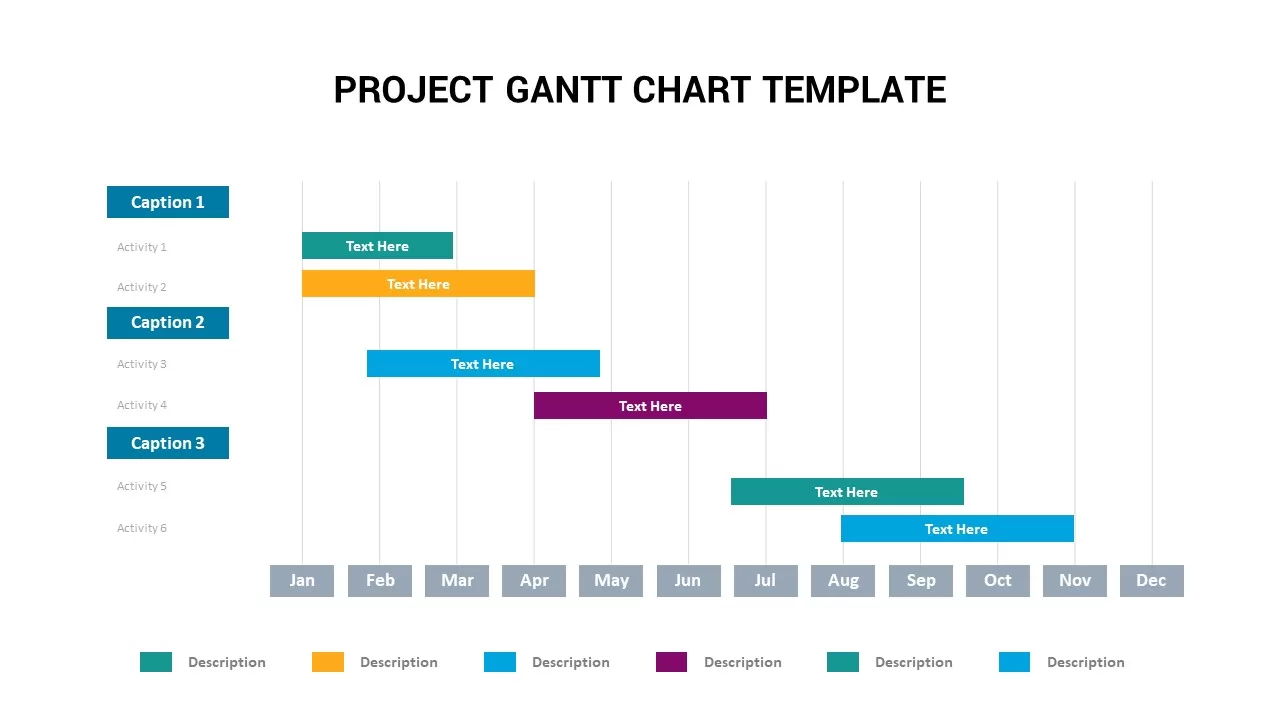
Project Gantt Chart template for PowerPoint & Google Slides
Gantt Chart
Premium
Interactive Project Gantt Chart Timeline Template for PowerPoint & Google Slides
Gantt Chart
Premium
Annual Project Gantt Chart Timeline Template for PowerPoint & Google Slides
Gantt Chart
Premium
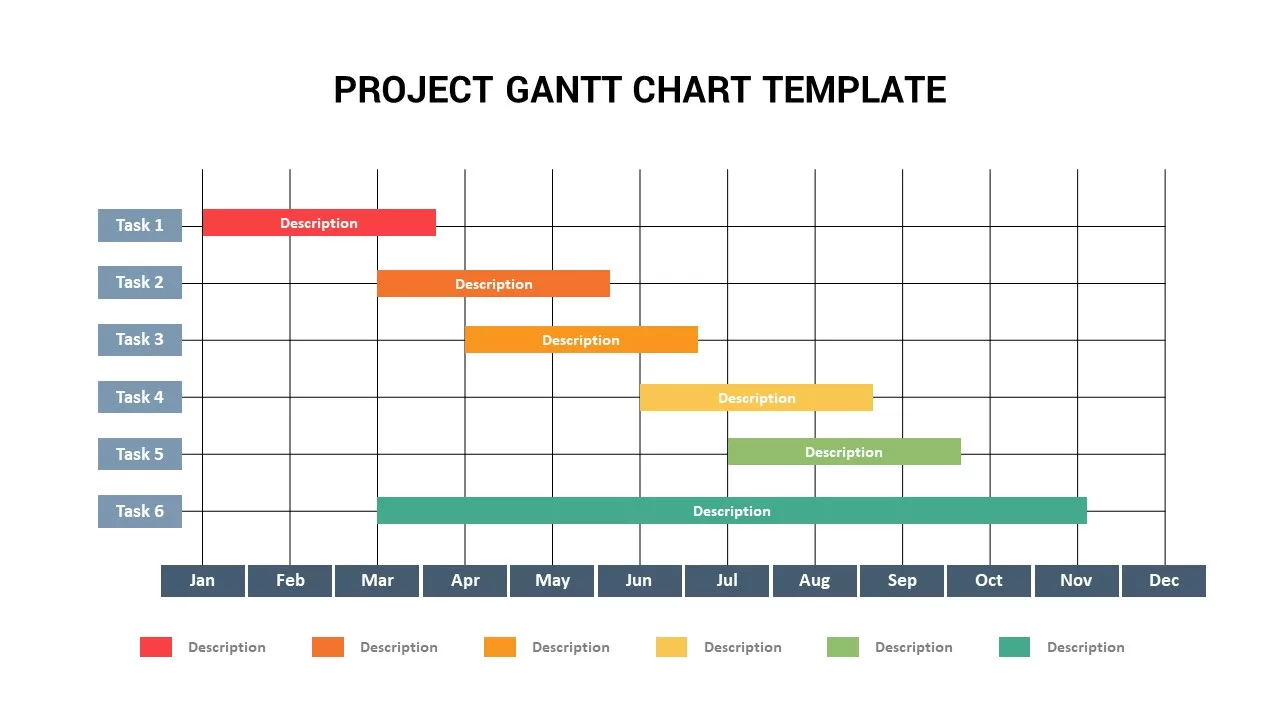
Project Gantt Chart Template for PowerPoint & Google Slides
Gantt Chart
Premium
Project Tracker Timeline Gantt Chart Template for PowerPoint & Google Slides
Project Status
Premium
Weekly Gantt Chart Project Timeline Template for PowerPoint & Google Slides
Gantt Chart
Premium
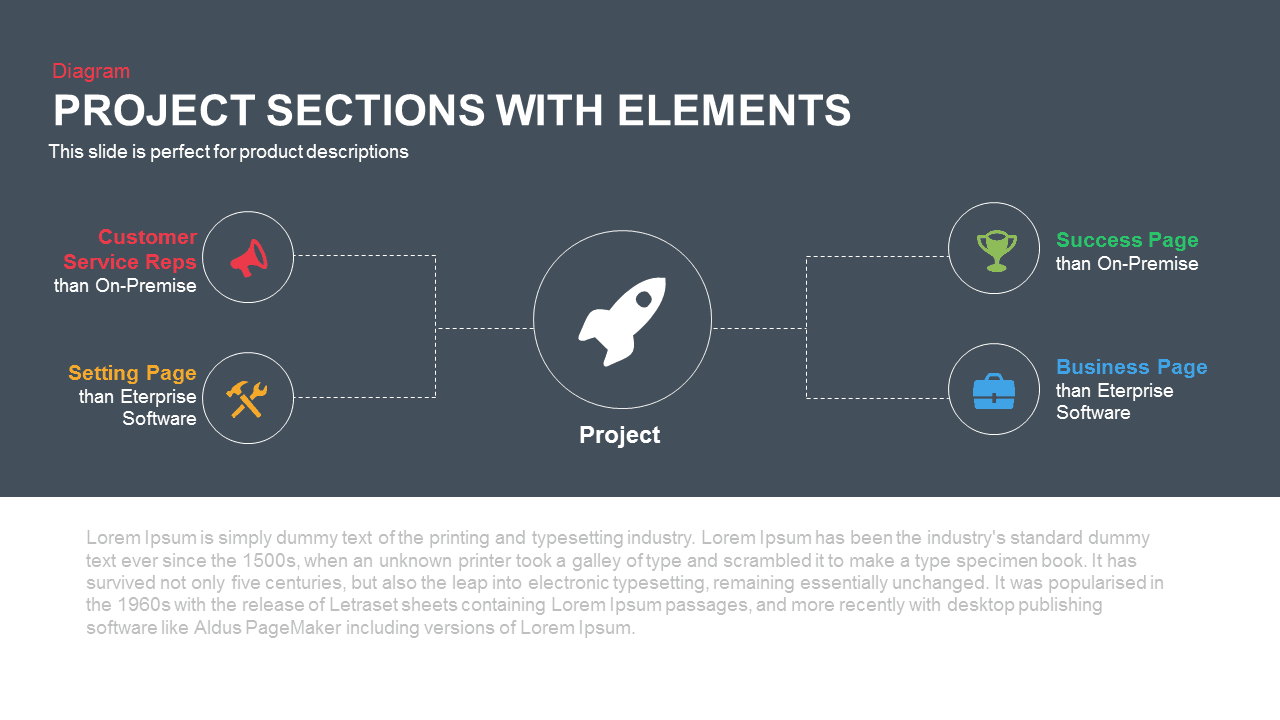
Project Sections Hub-and-Spoke Diagram template for PowerPoint & Google Slides
Flow Charts
Premium
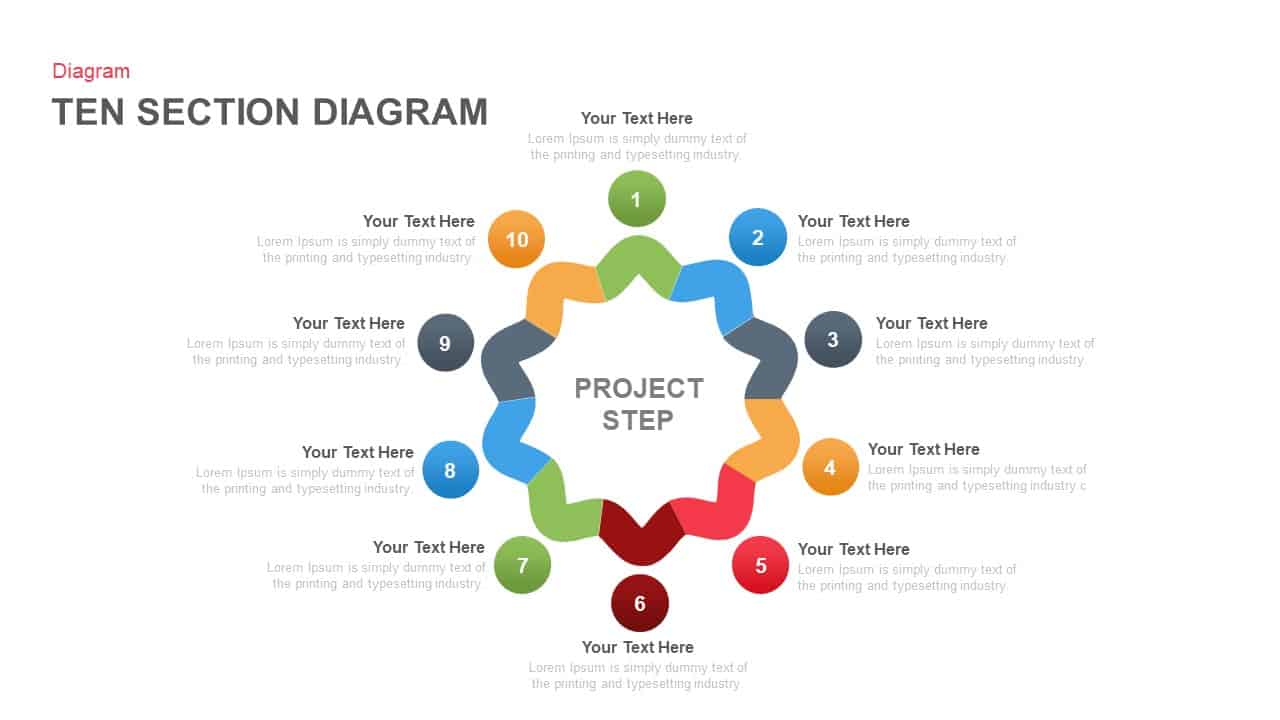
Ten-Section Project Steps Diagram Template for PowerPoint & Google Slides
Process
Premium
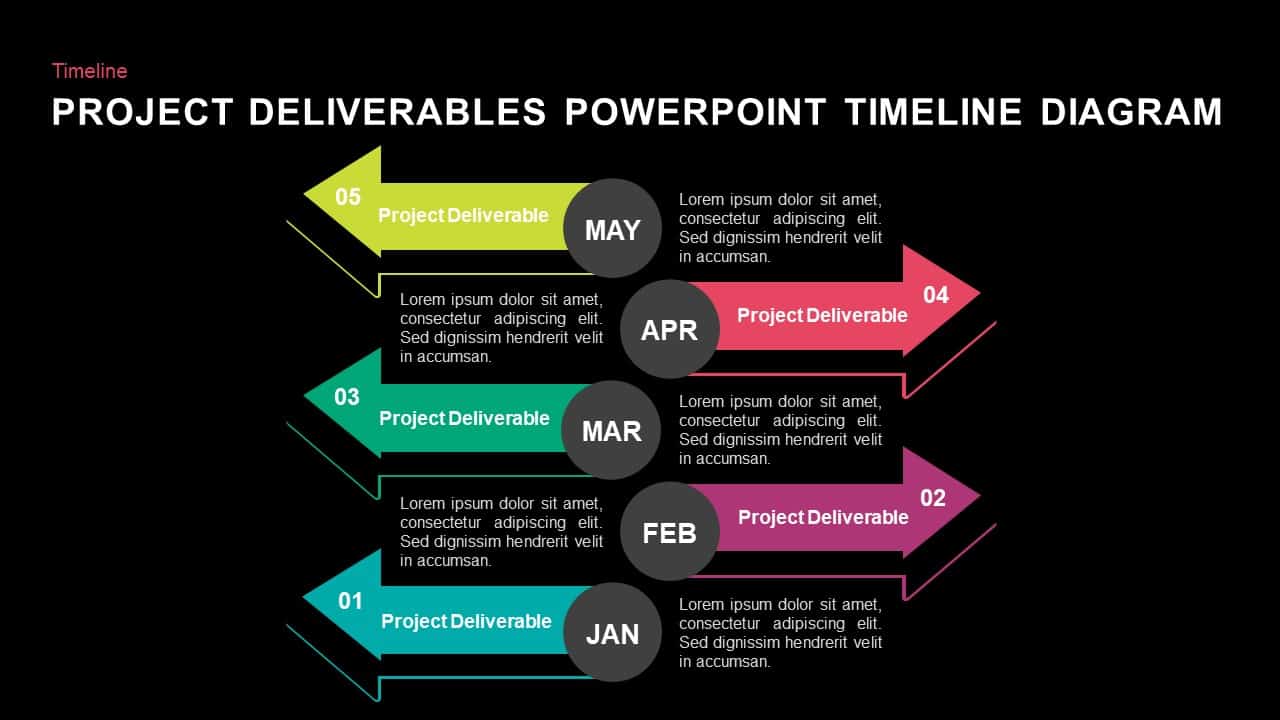
Project Deliverables Timeline Template for PowerPoint & Google Slides
Timeline
Premium
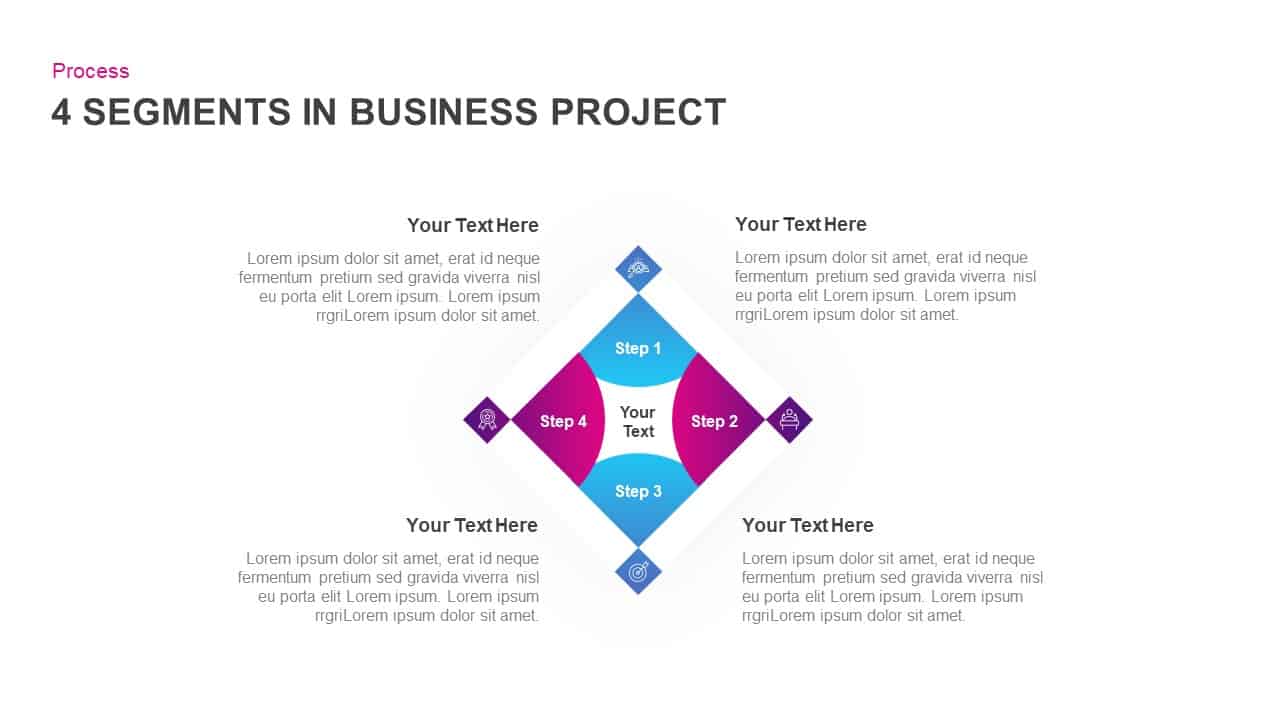
4-Segment Business Project Diamond Diagram Template for PowerPoint & Google Slides
Process
Premium
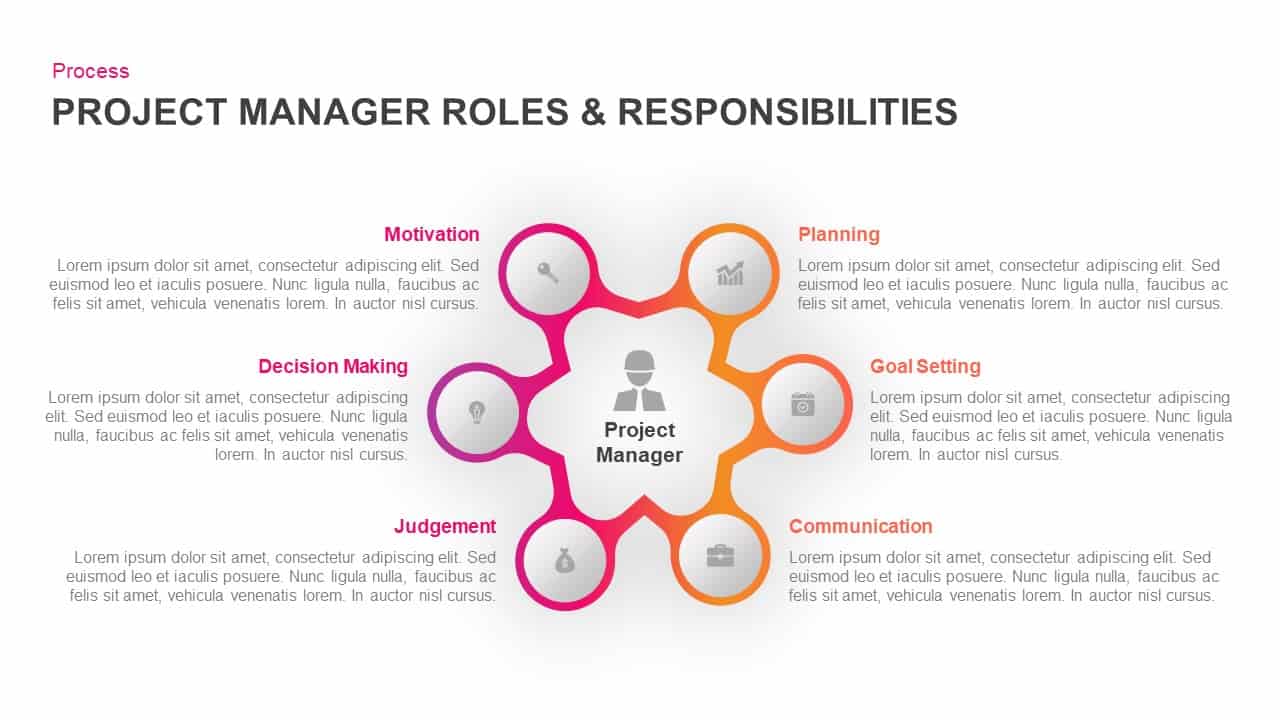
Project Manager Roles Hub-Spoke Process Template for PowerPoint & Google Slides
Process
Premium
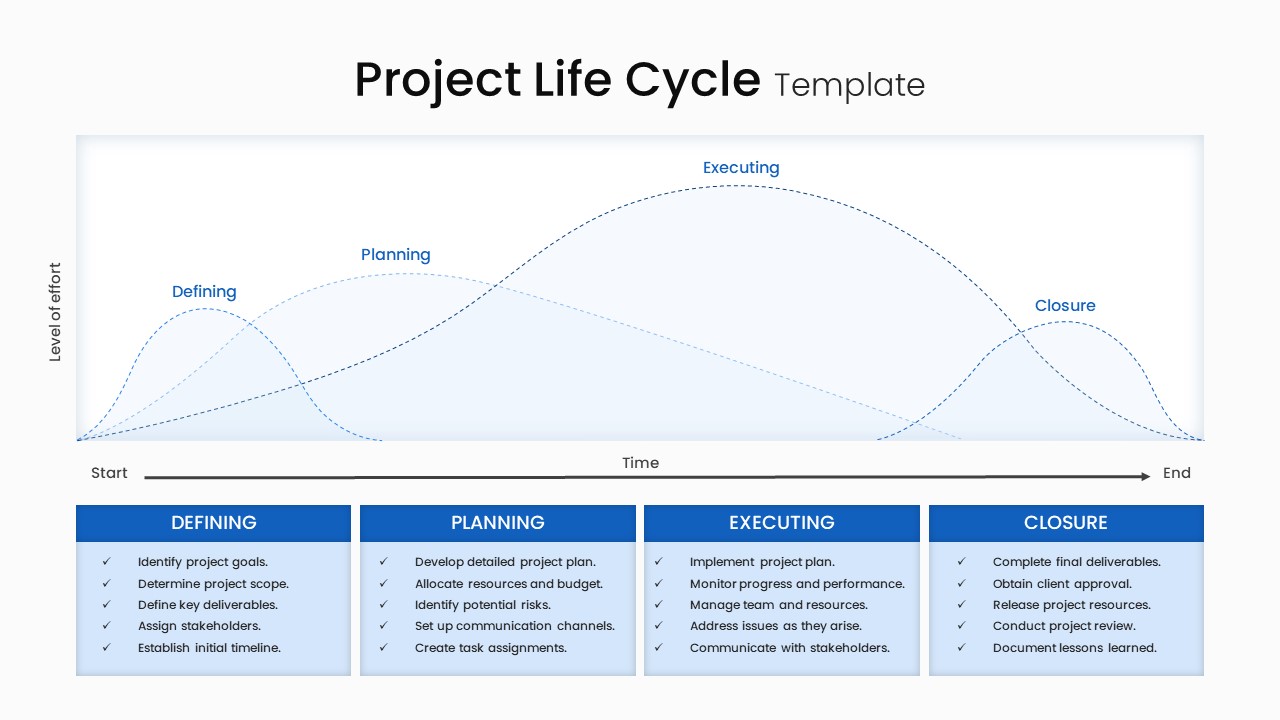
Multi-Style Project Life Cycle Diagram Template for PowerPoint & Google Slides
Process
Premium
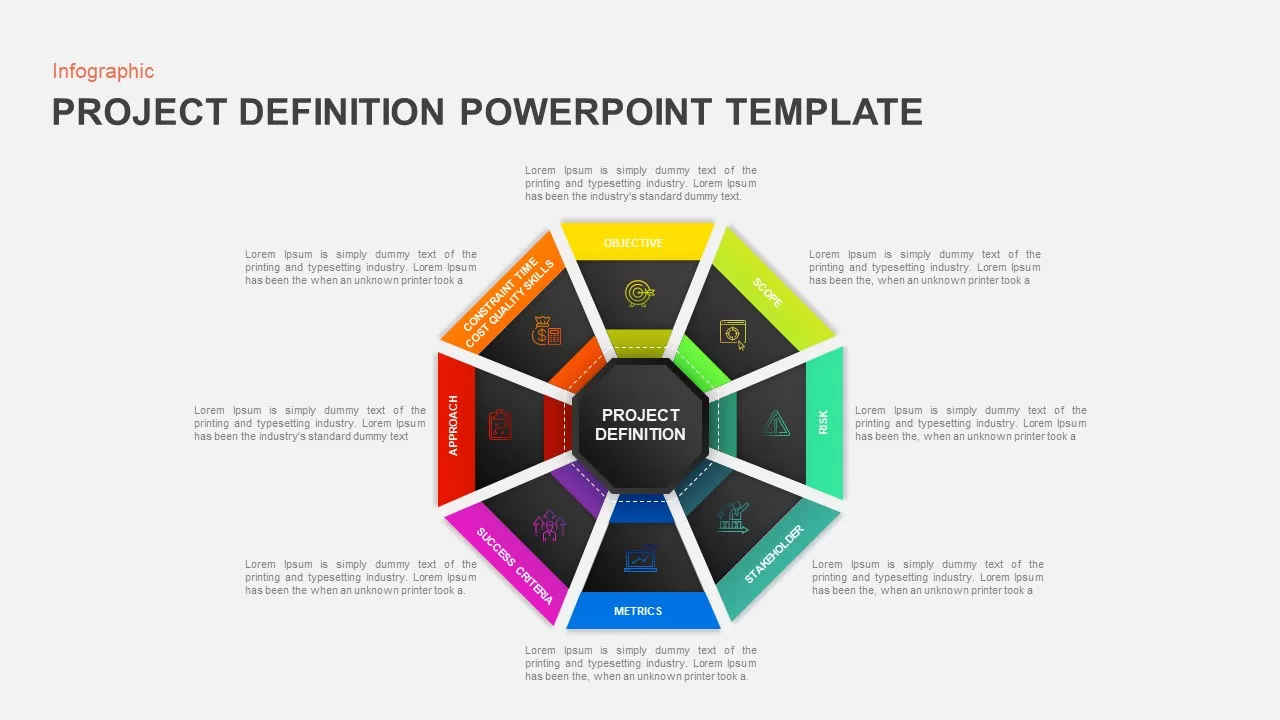
Octagonal Project Definition Infographic Template for PowerPoint & Google Slides
Process
Premium
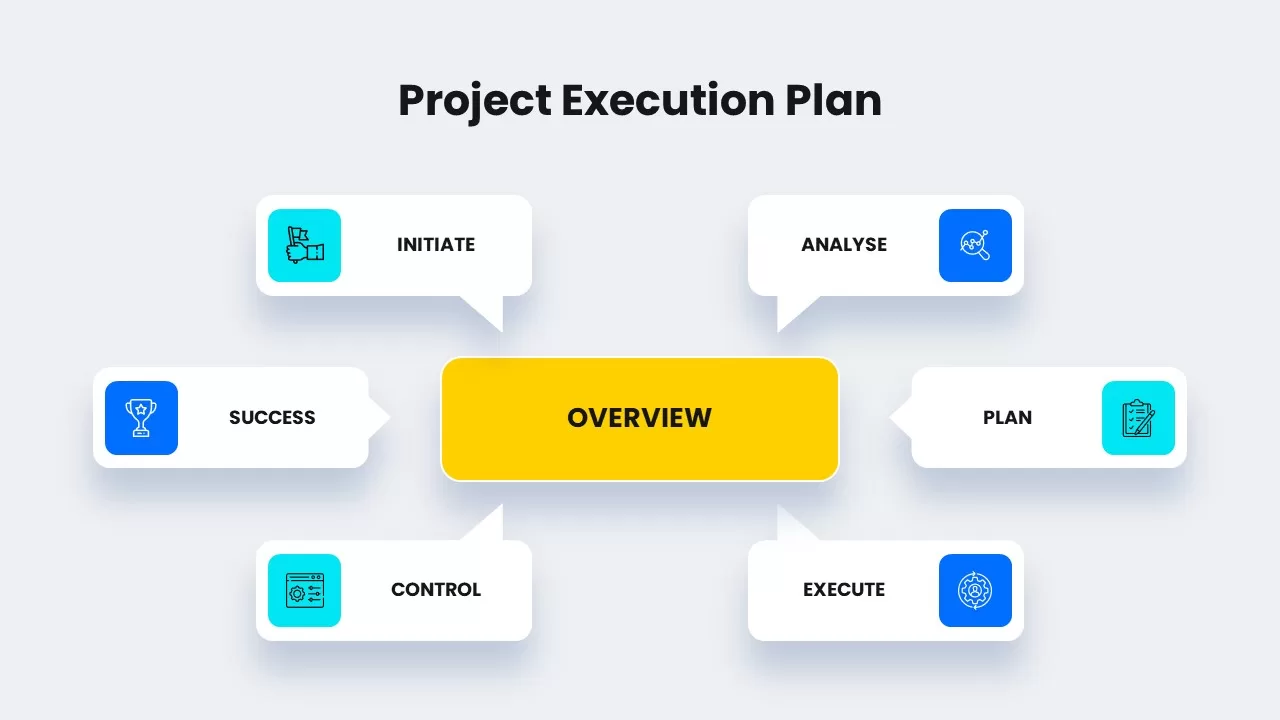
Project Execution Plan Overview Template for PowerPoint & Google Slides
Project Status
Premium
Animated Parallel Timeline Project template for PowerPoint & Google Slides
Infographics
Premium
Project Update & Timeline Infographic Template for PowerPoint & Google Slides
Business
Premium
Modern Project Status Report Dashboard Template for PowerPoint & Google Slides
Project Status
Premium
Project Scope Diamond Framework Template for PowerPoint & Google Slides
Project Status
Premium
Project Charter Overview template for PowerPoint & Google Slides
Business Plan
Premium
Minimal Project Proposal Presentation Template for PowerPoint & Google Slides
Pitch Deck
Premium
Project Execution Plan Template for PowerPoint & Google Slides
Project
Premium
Project Execution Gantt Timeline Template for PowerPoint & Google Slides
Gantt Chart
Premium
Project Execution Plan Overview Template for PowerPoint & Google Slides
Business Proposal
Premium
Project Scope Hub & Spoke Layout Template for PowerPoint & Google Slides
Process
Premium
Comprehensive Project Execution Plan template for PowerPoint & Google Slides
Project Status
Premium
Modern Project Scope Template for PowerPoint & Google Slides
Project
Premium
Creative Project Scope Template for PowerPoint & Google Slides
Project
Premium
Clean Minimal Project Status Update Template for PowerPoint & Google Slides
Project
Premium
Project Status Dashboard Table Template for PowerPoint & Google Slides
Project Status
Premium
Project Status Dashboard with Metrics Template for PowerPoint & Google Slides
Project Status
Premium
Colorful Project Status Dashboard Template for PowerPoint & Google Slides
Project Status
Premium
Color-Coded Project Status Template for PowerPoint & Google Slides
Project Status
Premium
Color-Coded Project Status Slide Template for PowerPoint & Google Slides
Project Status
Premium
Project Status Table Template for PowerPoint & Google Slides
Project Status
Premium
Circular Project Status Template for PowerPoint & Google Slides
Project Status
Premium
Project Status Dashboard Template for PowerPoint & Google Slides
Project Status
Premium
Horizontal Timeline Project Status Template for PowerPoint & Google Slides
Project Status
Premium
Project Stage Gate Process Diagram Template for PowerPoint & Google Slides
Process
Premium
One Pager Project Status Dashboard Template for PowerPoint & Google Slides
Project Status
Premium
Five-Phase Project Intake Process Flow Template for PowerPoint & Google Slides
Process
Premium
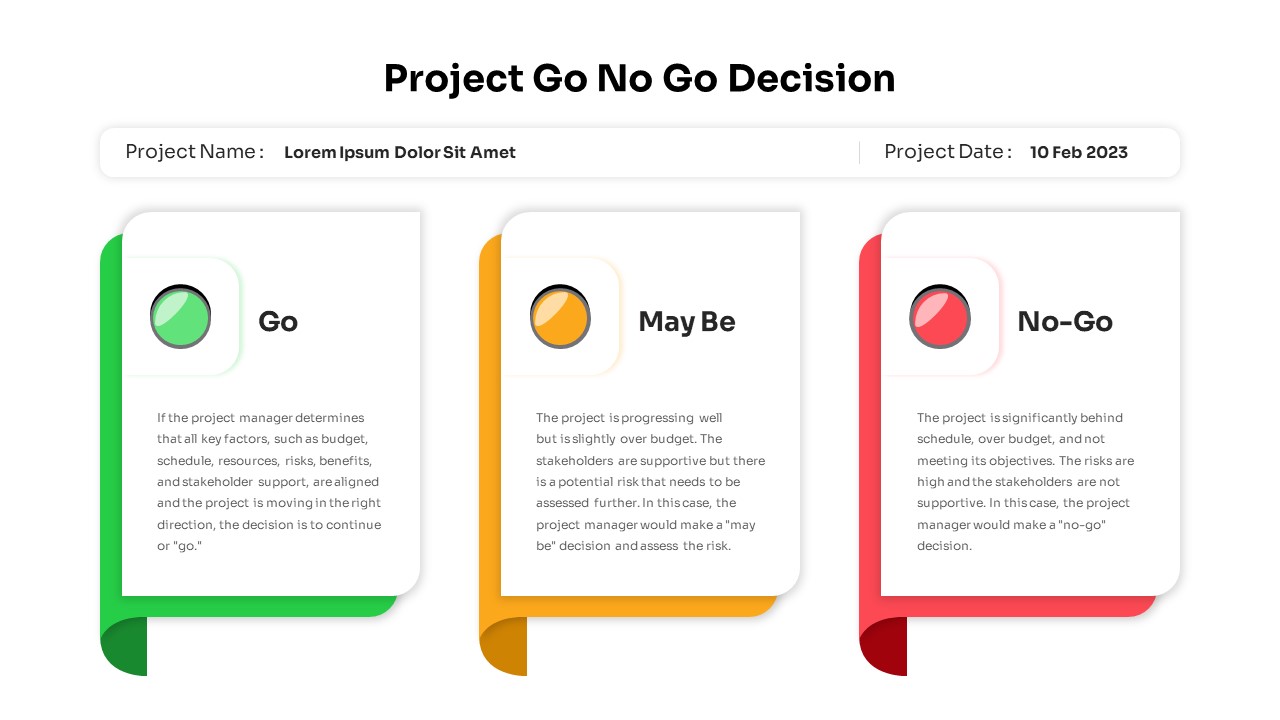
Project Go No-Go Decision Slide Template for PowerPoint & Google Slides
Process
Premium
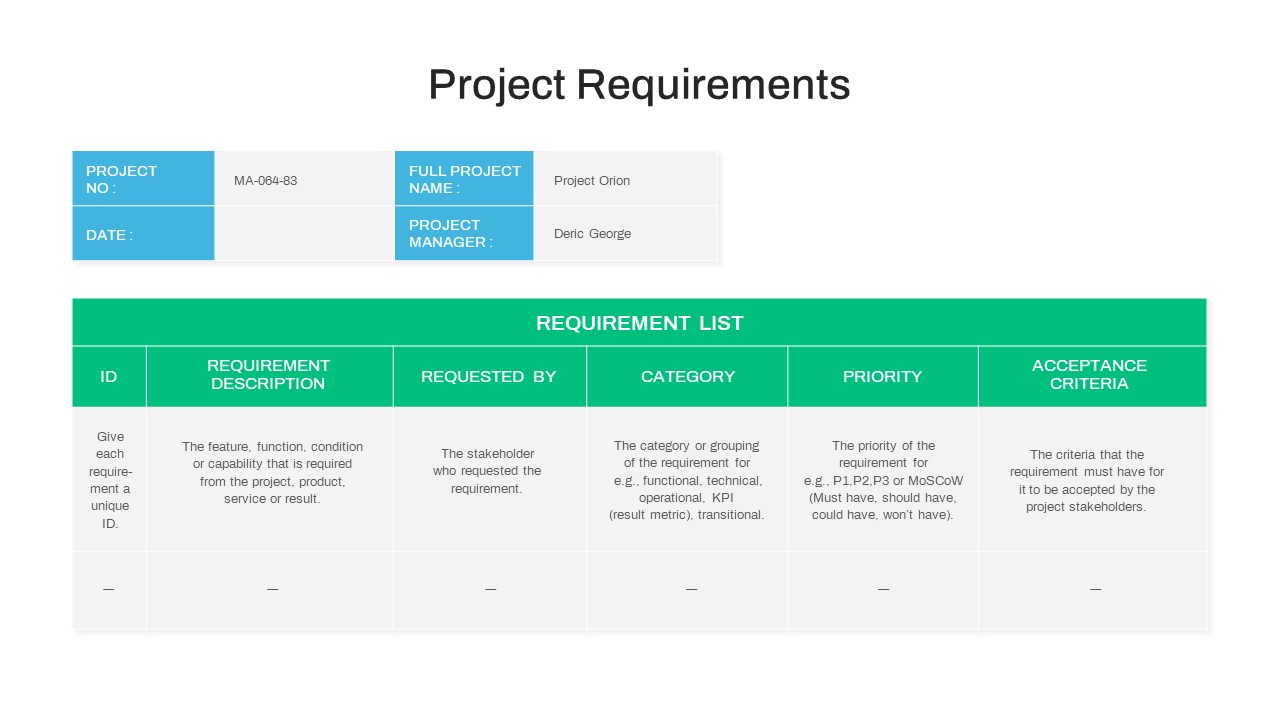
Project Requirements Matrix Template for PowerPoint & Google Slides
Project
Premium
Weekly Project Status Dashboard Template for PowerPoint & Google Slides
Project Status
Premium
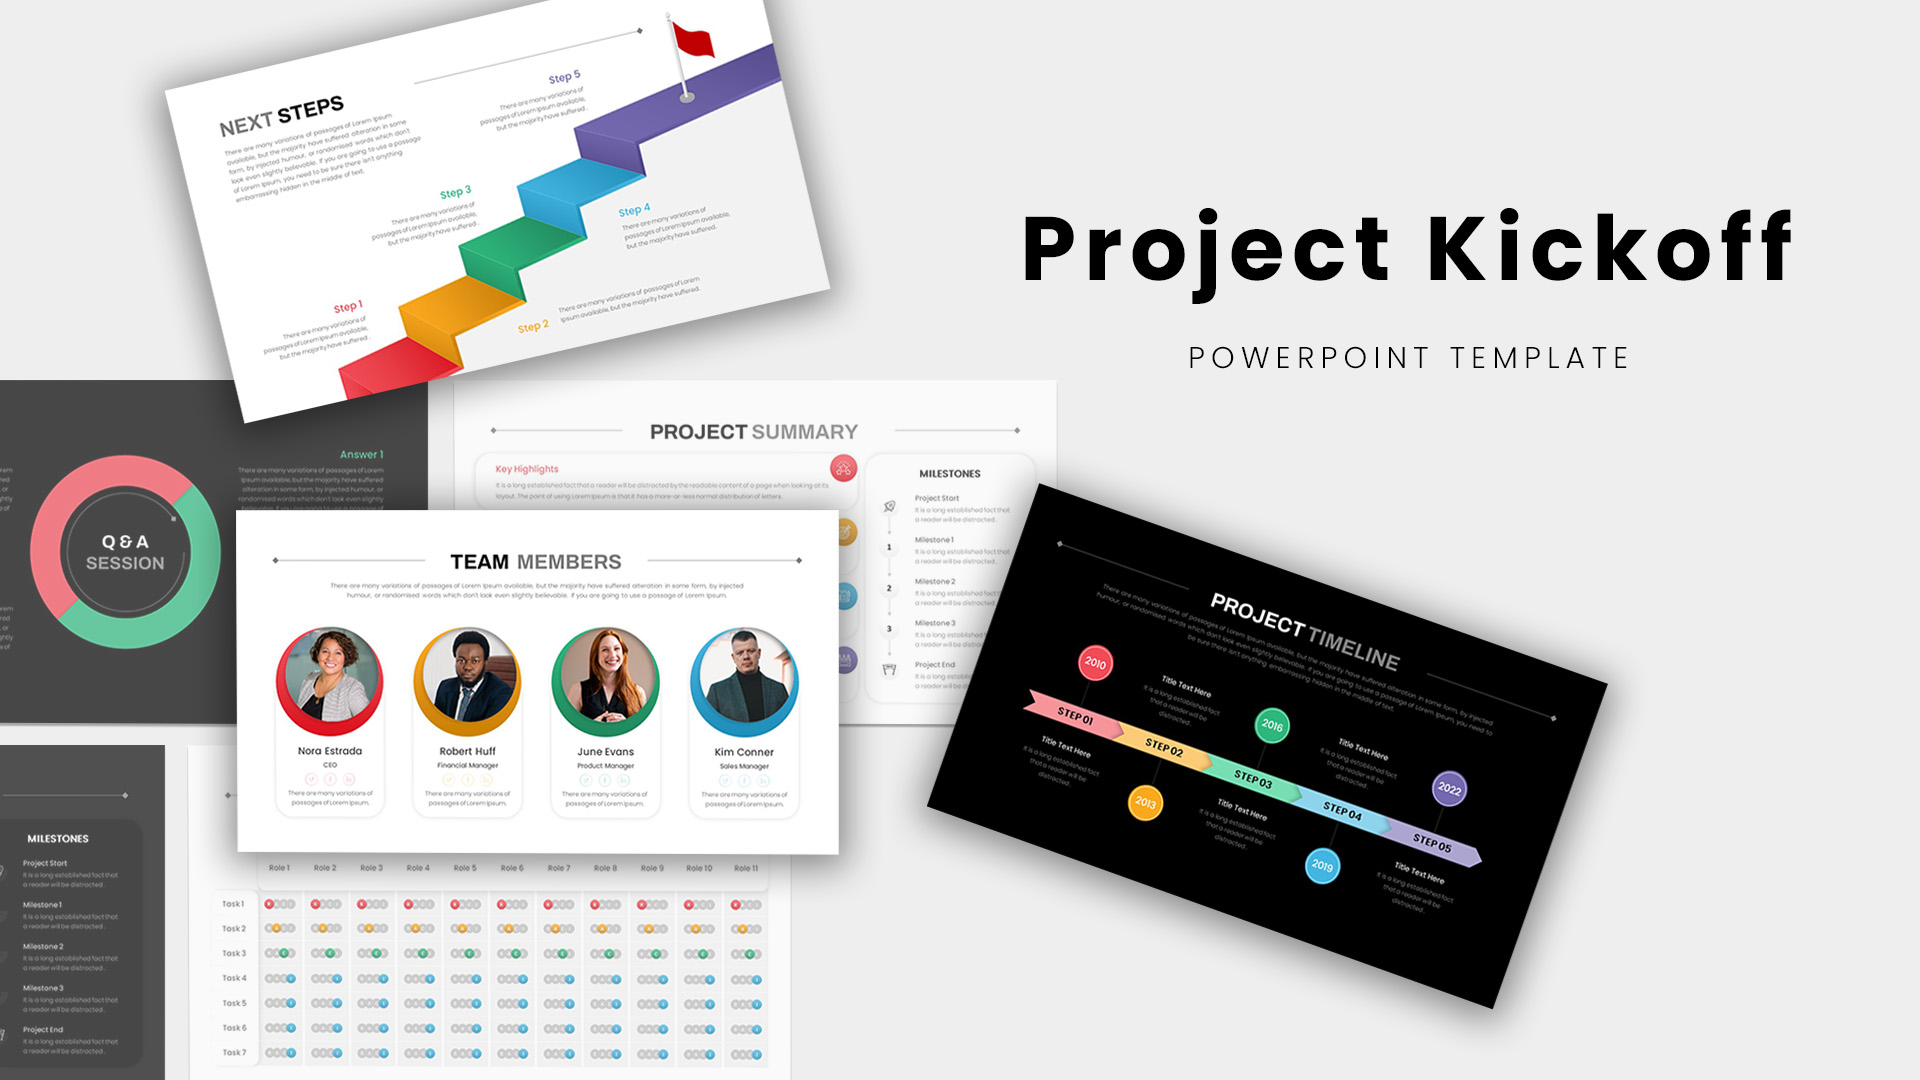
Professional Project Kickoff Deck Template for PowerPoint & Google Slides
Project
Premium
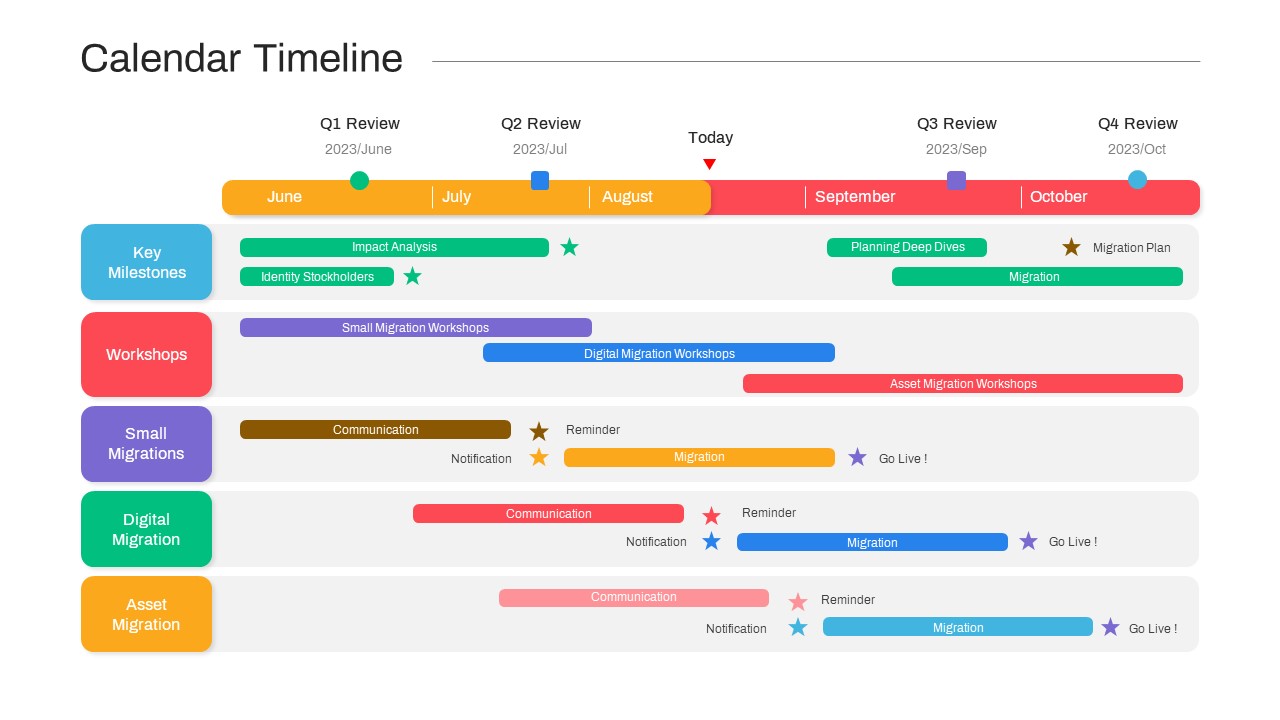
Calendar Migration Project Timeline Template for PowerPoint & Google Slides
Timeline
Premium
Three-Year Project Roadmap Timeline Template for PowerPoint & Google Slides
Timeline
Premium
Agile Project Roadmap Timeline Template Pack for PowerPoint & Google Slides
Scrum
Premium
Free Simple Weekly Project Status Report Template for PowerPoint & Google Slides
Project Status
Free
Free Project Kickoff Communication Plan Template for PowerPoint & Google Slides
Project
Free

Modern Construction Project Overview Template for PowerPoint & Google Slides
Pitch Deck
Premium
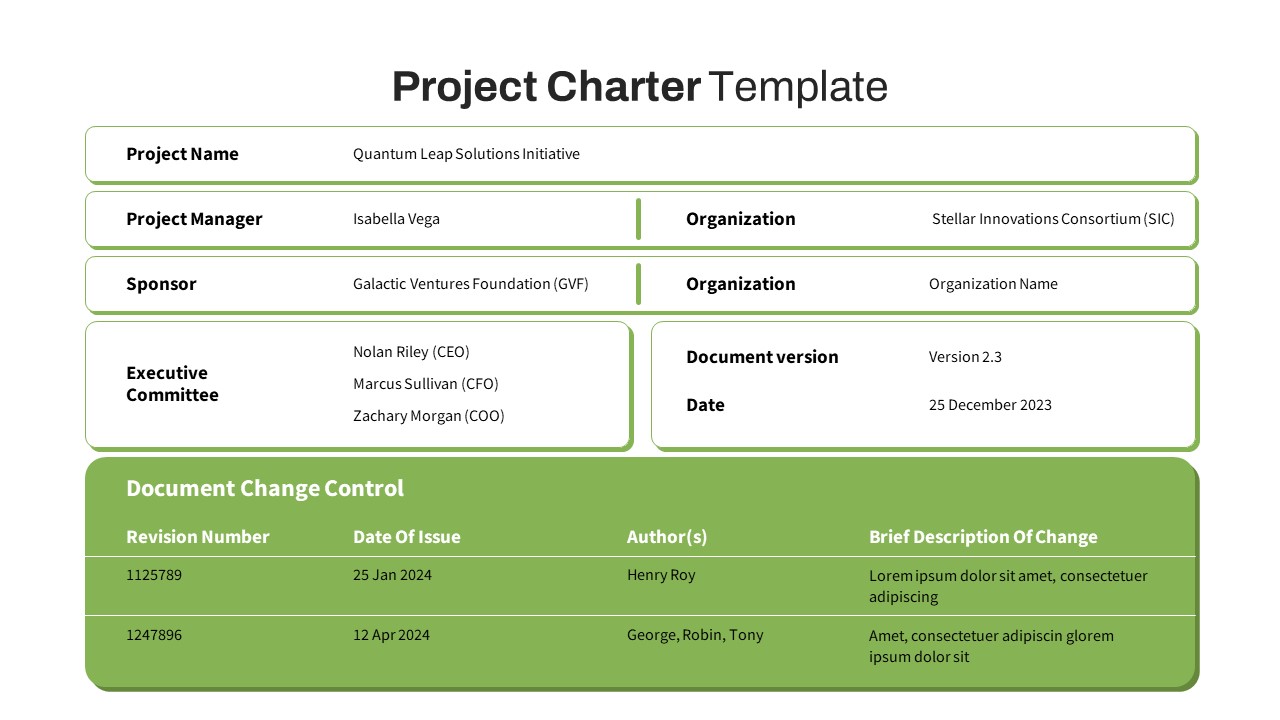
Free Project Charter with Revision History Template for PowerPoint & Google Slides
Project
Free
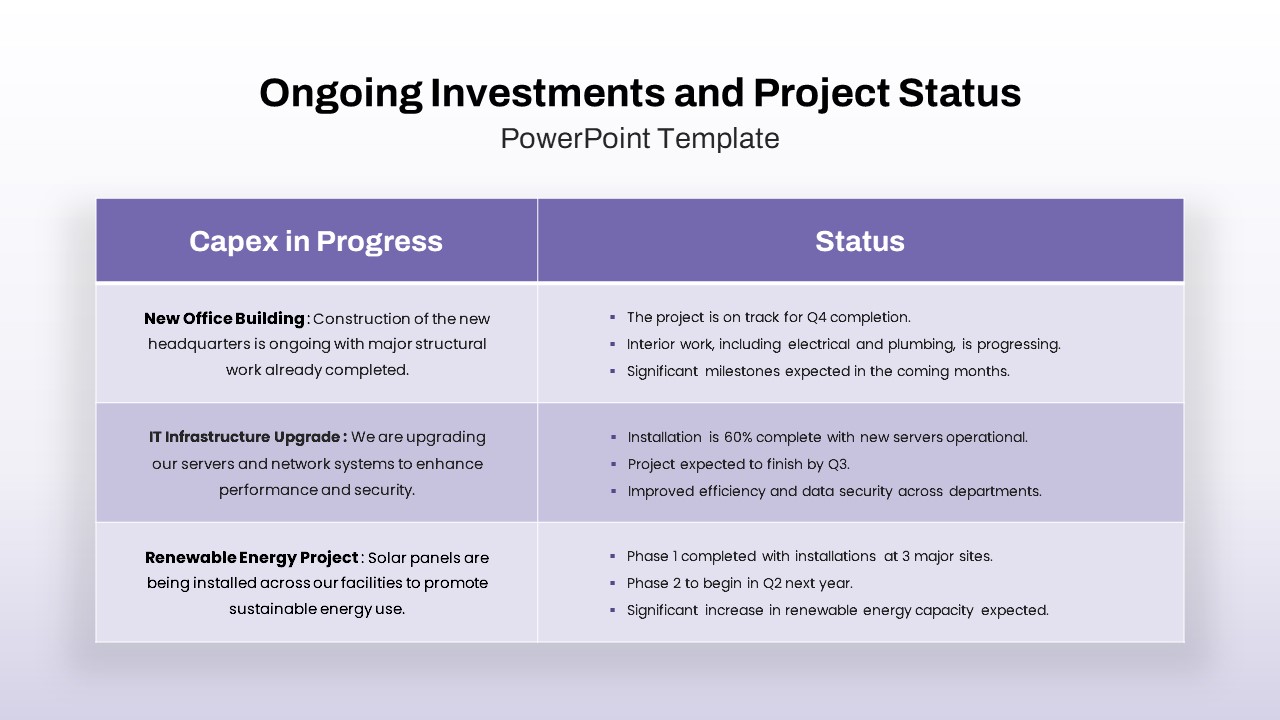
Ongoing Investments and Project Status Template for PowerPoint & Google Slides
Project Status
Premium
Project Proposal Deck Template for PowerPoint & Google Slides
Pitch Deck
Premium
Project Progress Dashboard Pie Charts Template for PowerPoint & Google Slides
Project
Premium
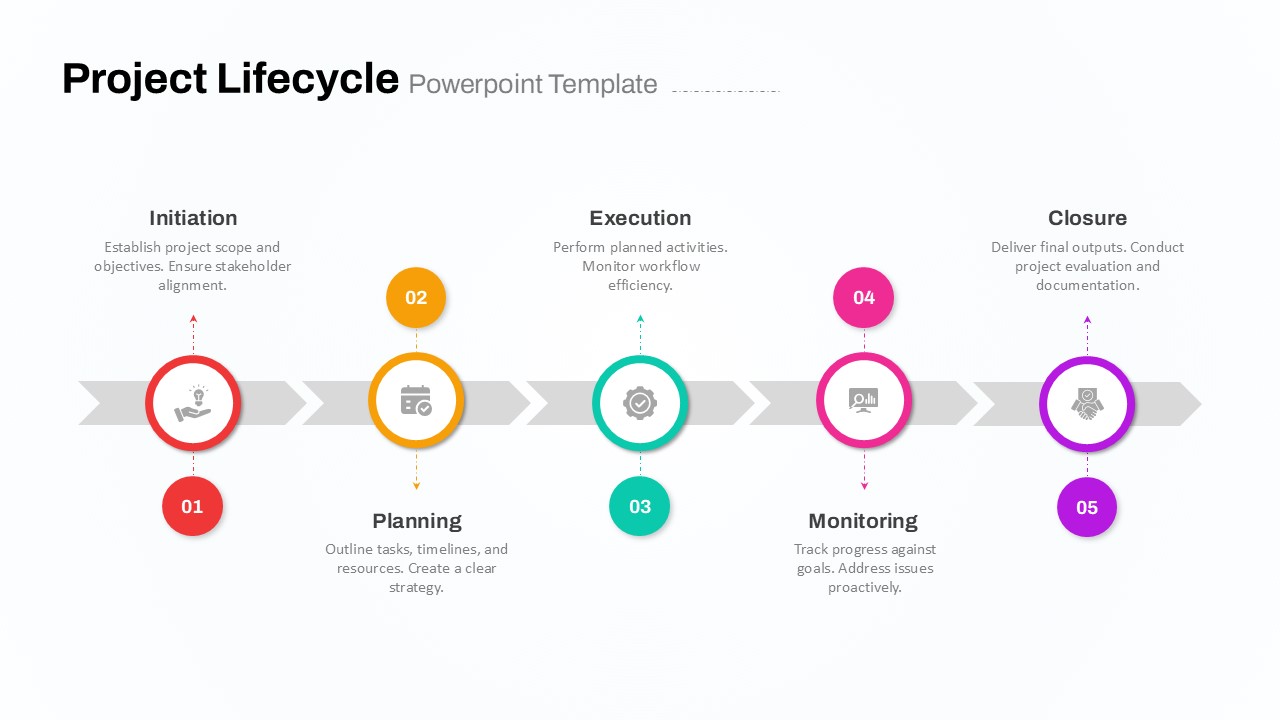
Five-Phase Project Lifecycle Diagram Template for PowerPoint & Google Slides
Infographics
Premium
Project Comparison Timeline Roadmap Template for PowerPoint & Google Slides
Comparison
Premium
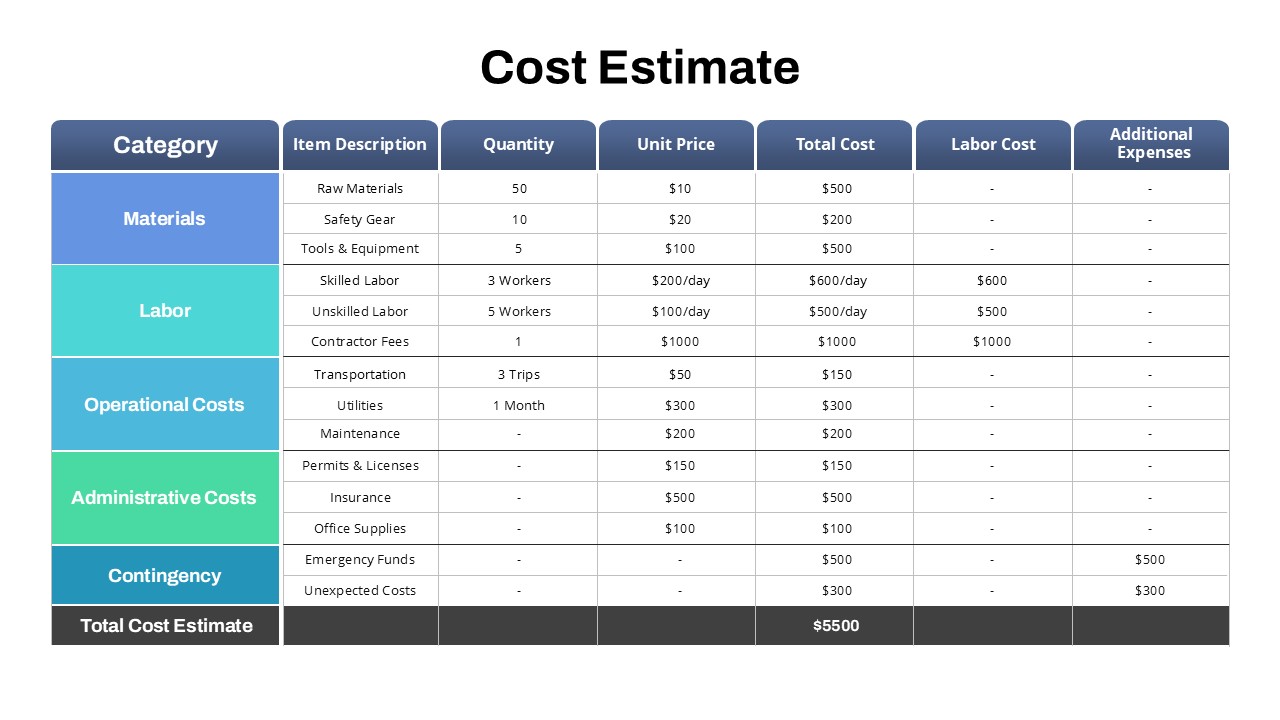
Project Detailed Cost Estimate Table Template for PowerPoint & Google Slides
Project
Premium
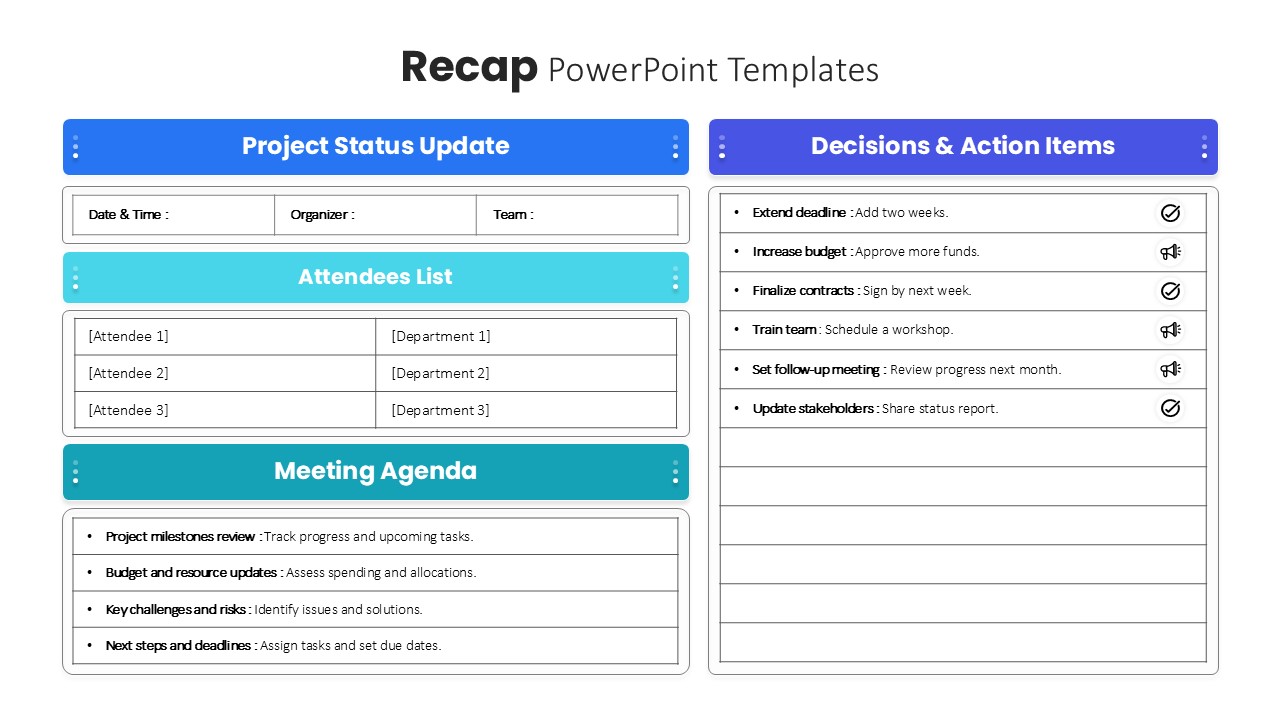
Project Meeting Recap & Action Items Template for PowerPoint & Google Slides
Project Status
Premium
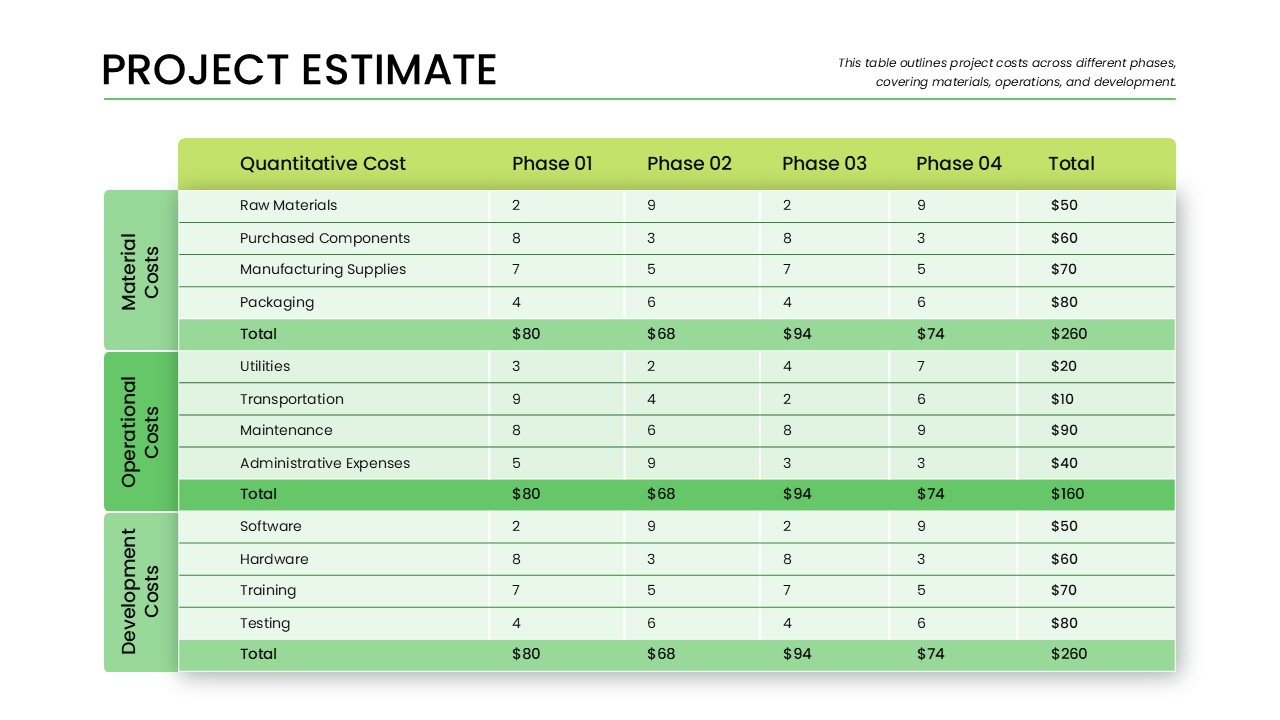
Phase-Wise Project Estimate Table Template for PowerPoint & Google Slides
Business Report
Premium
Project Life Cycle Workflow Diagram Template for PowerPoint & Google Slides
Process
Premium
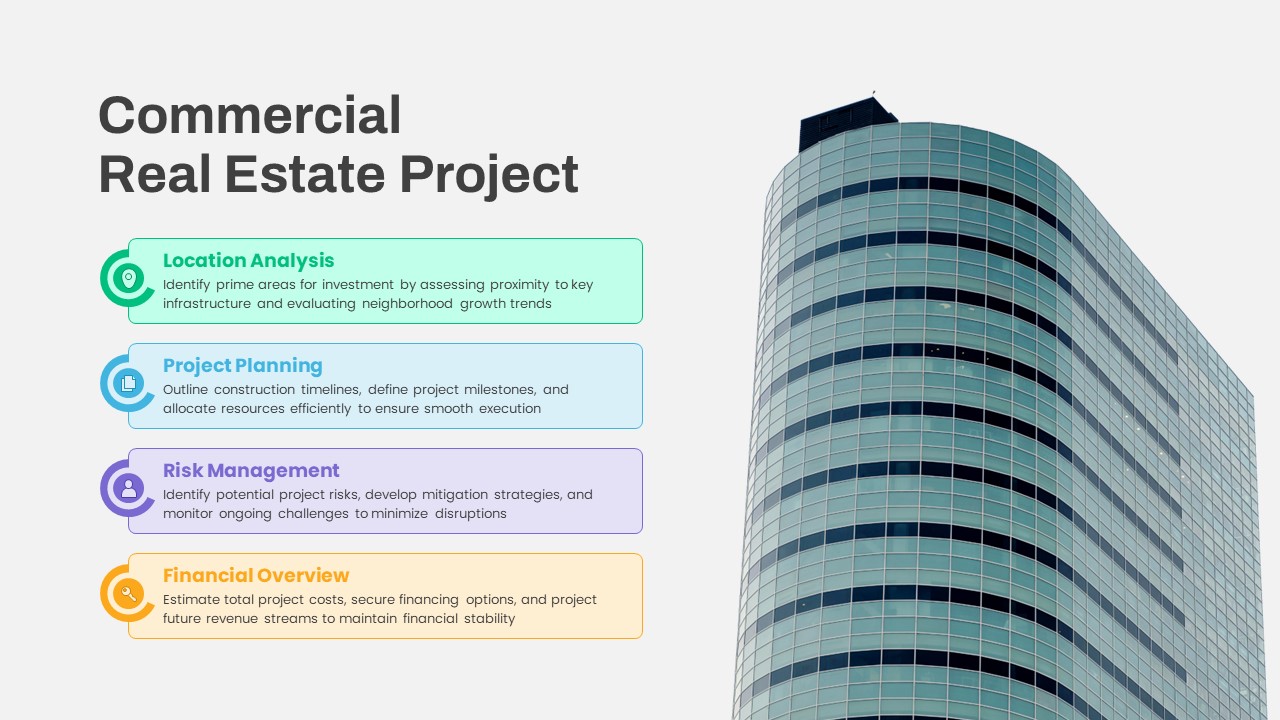
Commercial Real Estate Project template for PowerPoint & Google Slides
Business
Premium
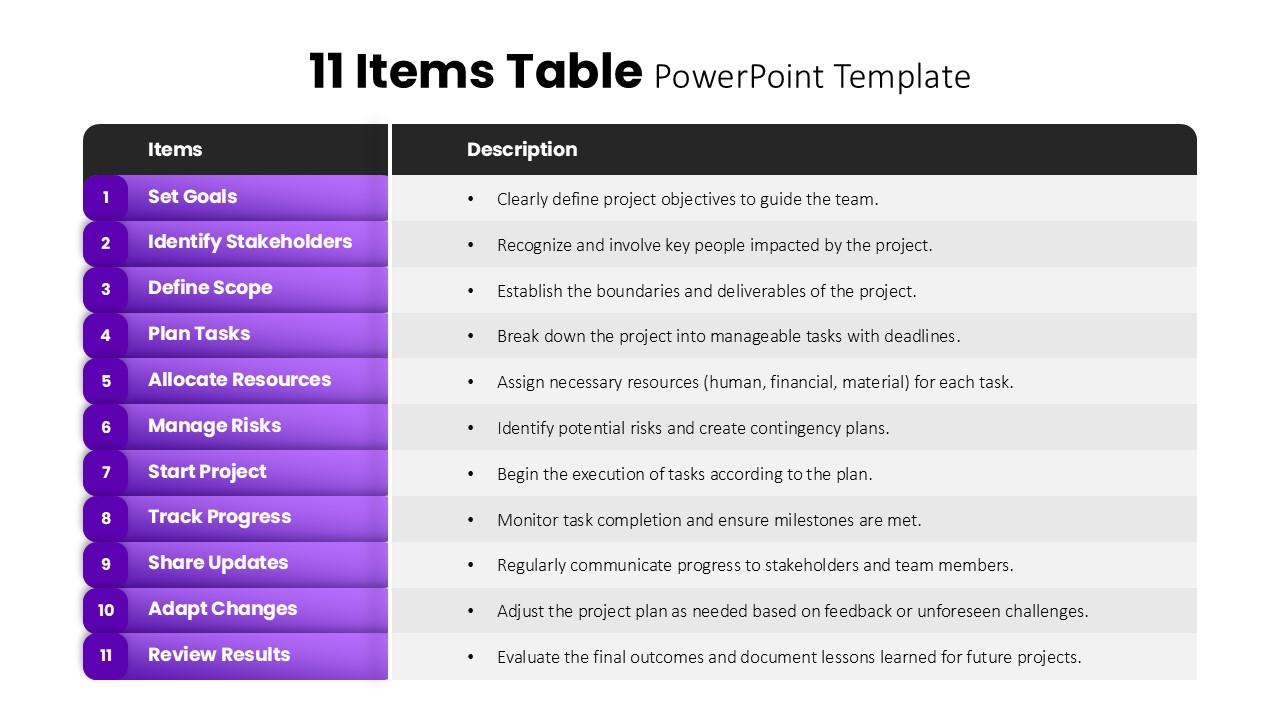
11 Items Table Project Planning Steps template for PowerPoint & Google Slides
Business Plan
Premium
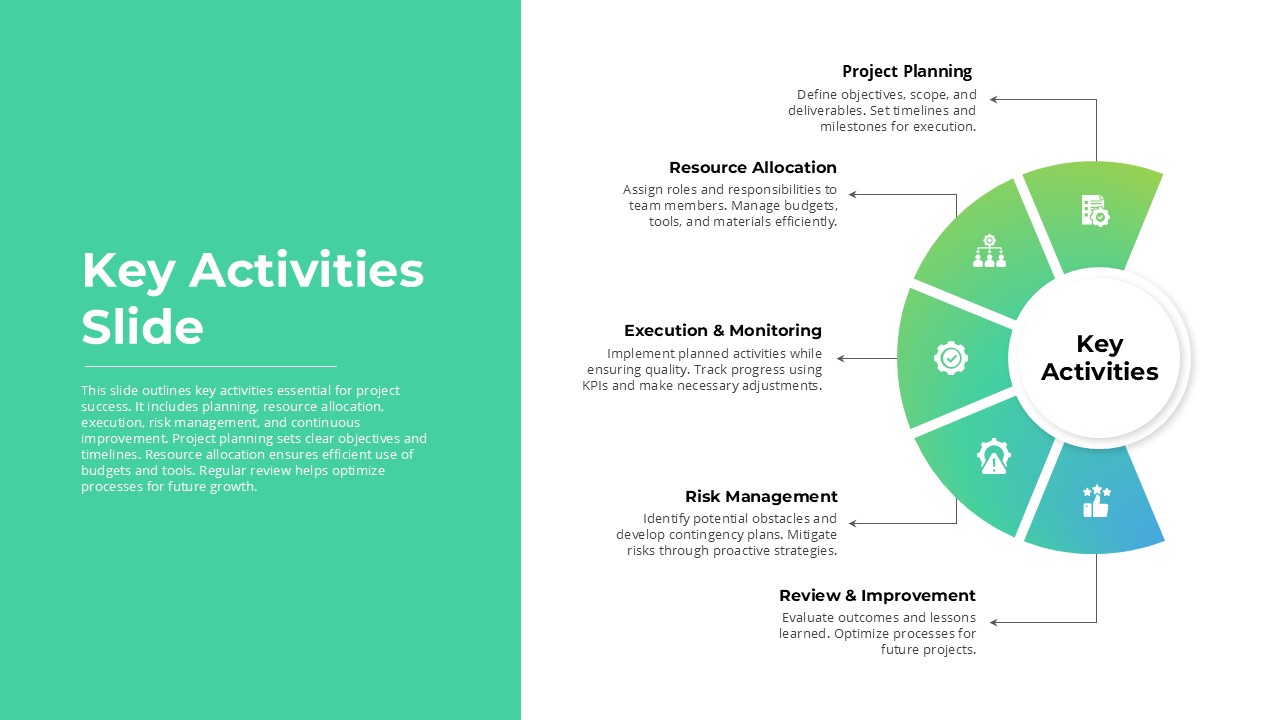
Project Key Activities Circular Diagram Template for PowerPoint & Google Slides
Process
Premium
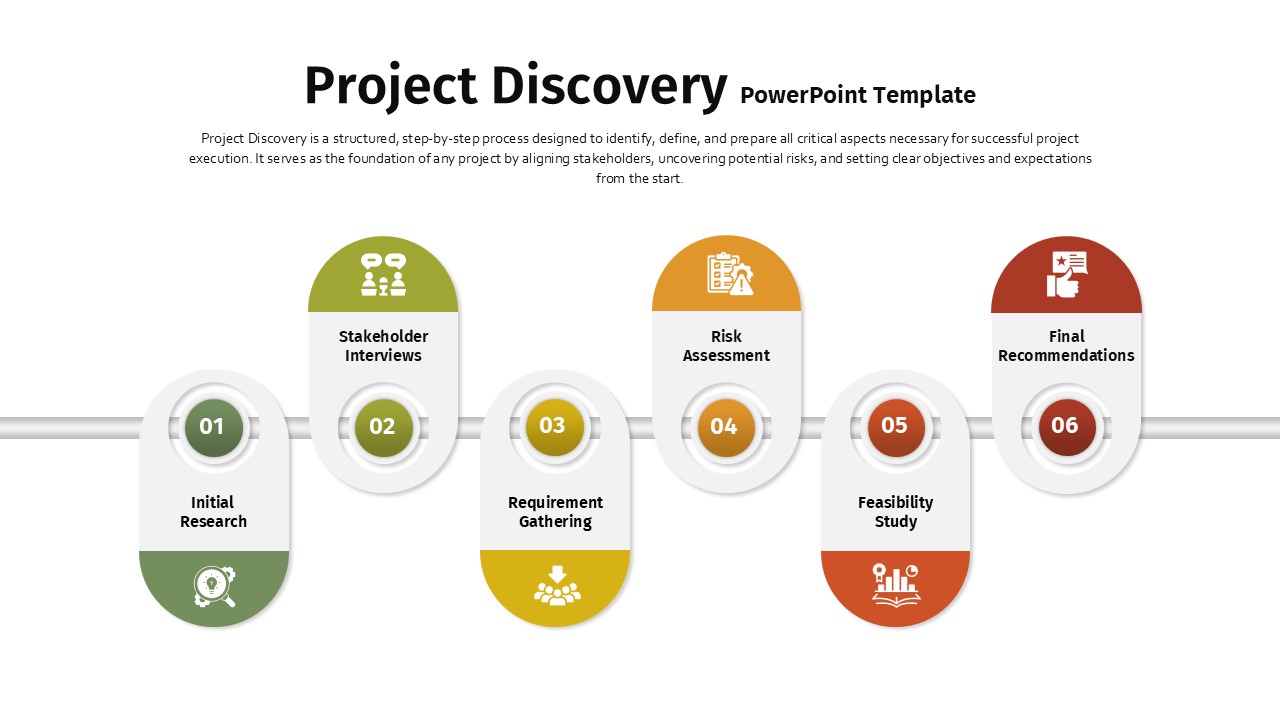
Project Discovery Infographic Pack Template for PowerPoint & Google Slides
Timeline
Premium
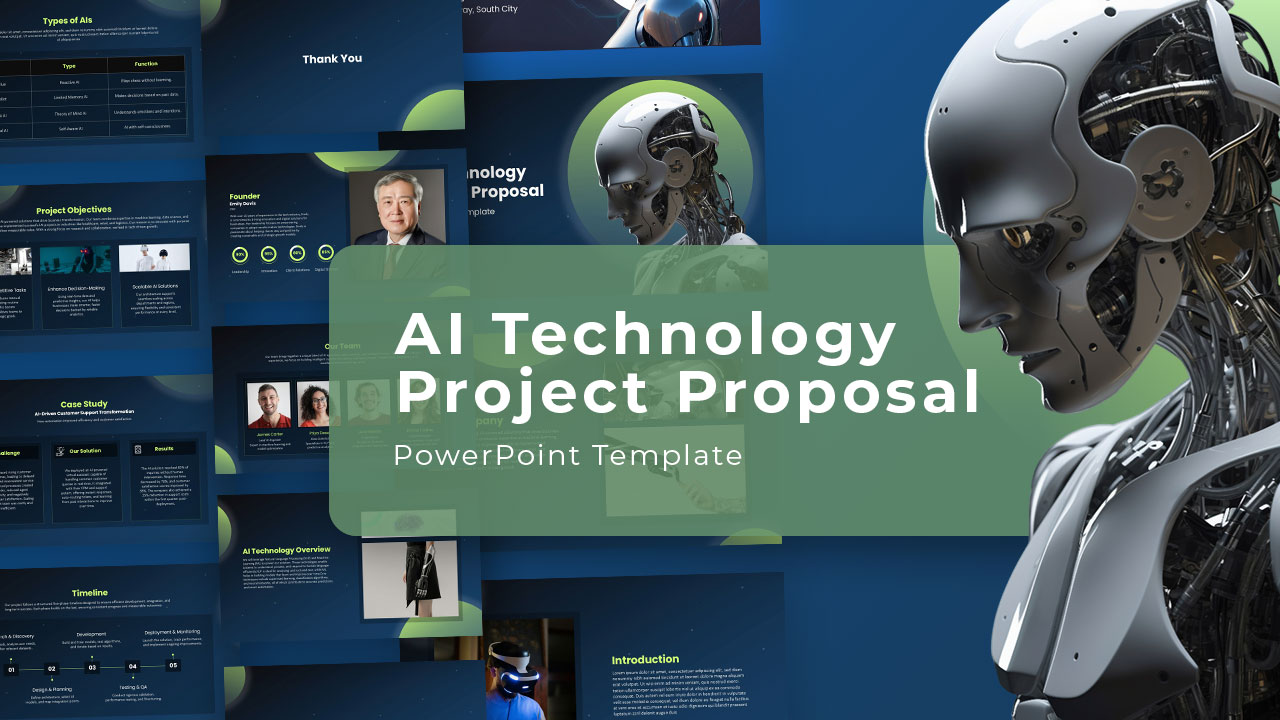
AI Technology Project Proposal Template for PowerPoint & Google Slides
AI
Premium
Project Tracking Dashboard Table Template for PowerPoint & Google Slides
Project Status
Premium
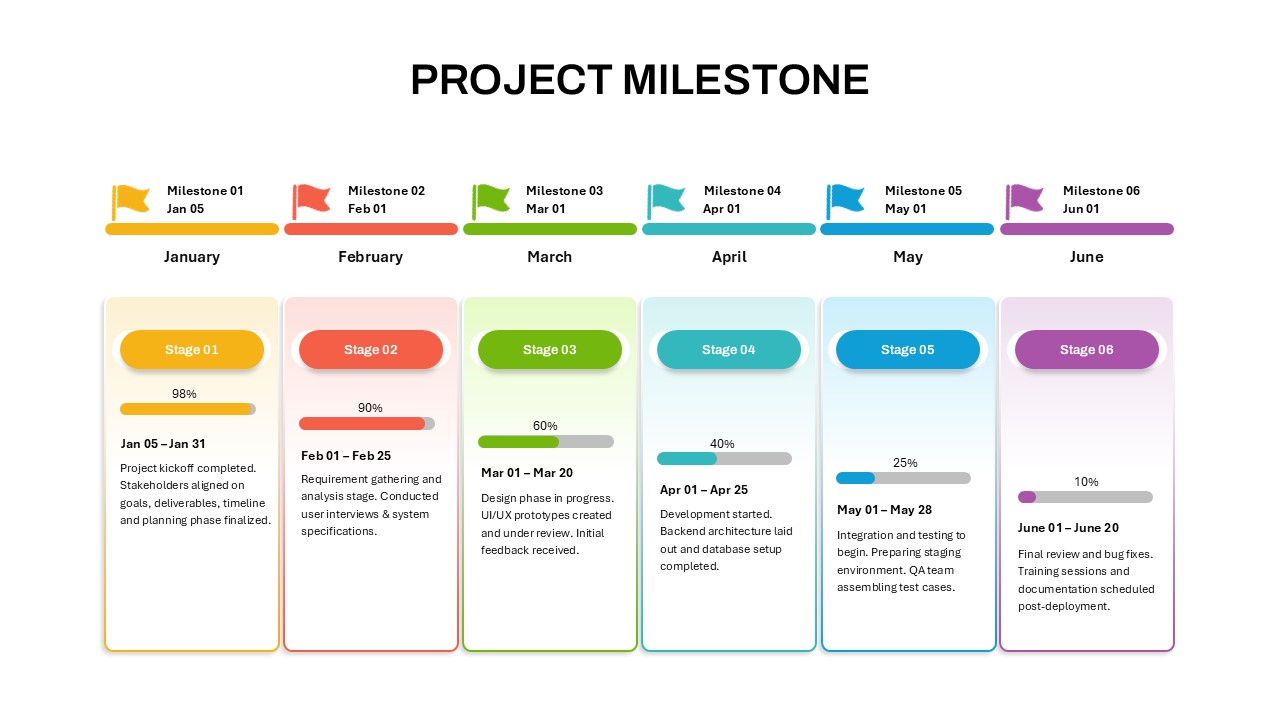
Project Milestone Timeline Infographic Template for PowerPoint & Google Slides
Timeline
Premium
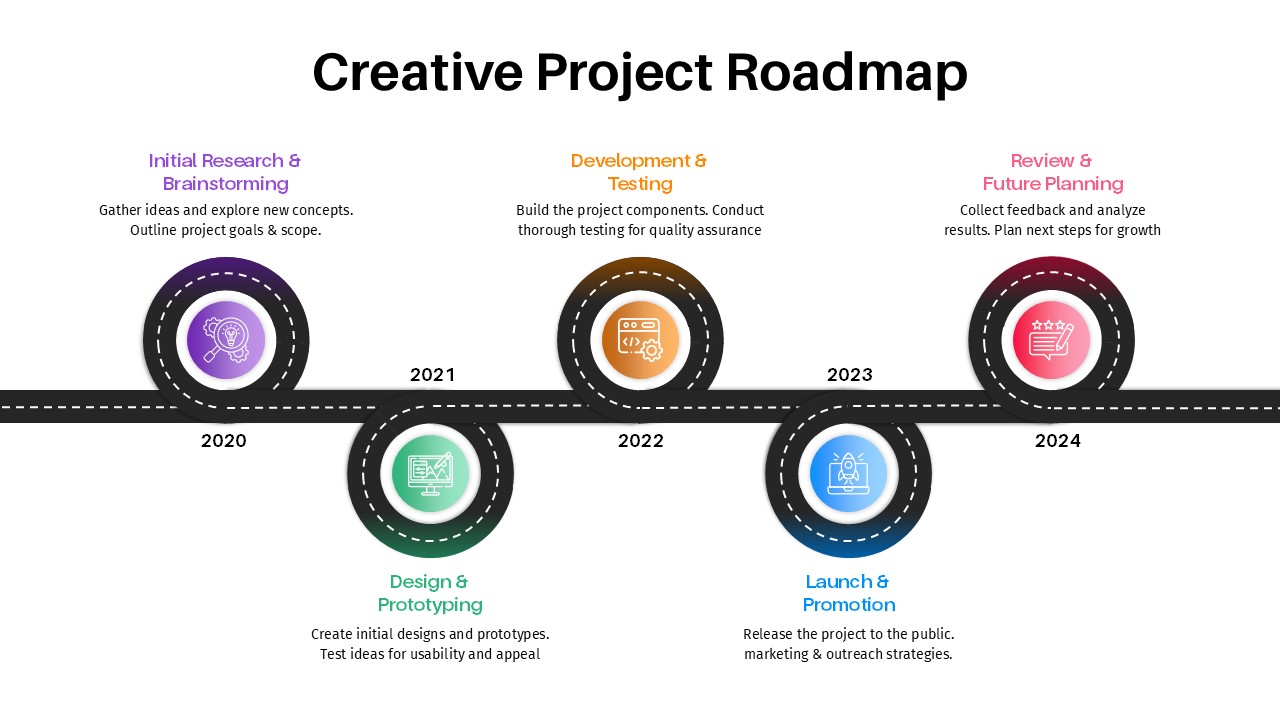
Creative Project Roadmap template for PowerPoint & Google Slides
Business
Premium
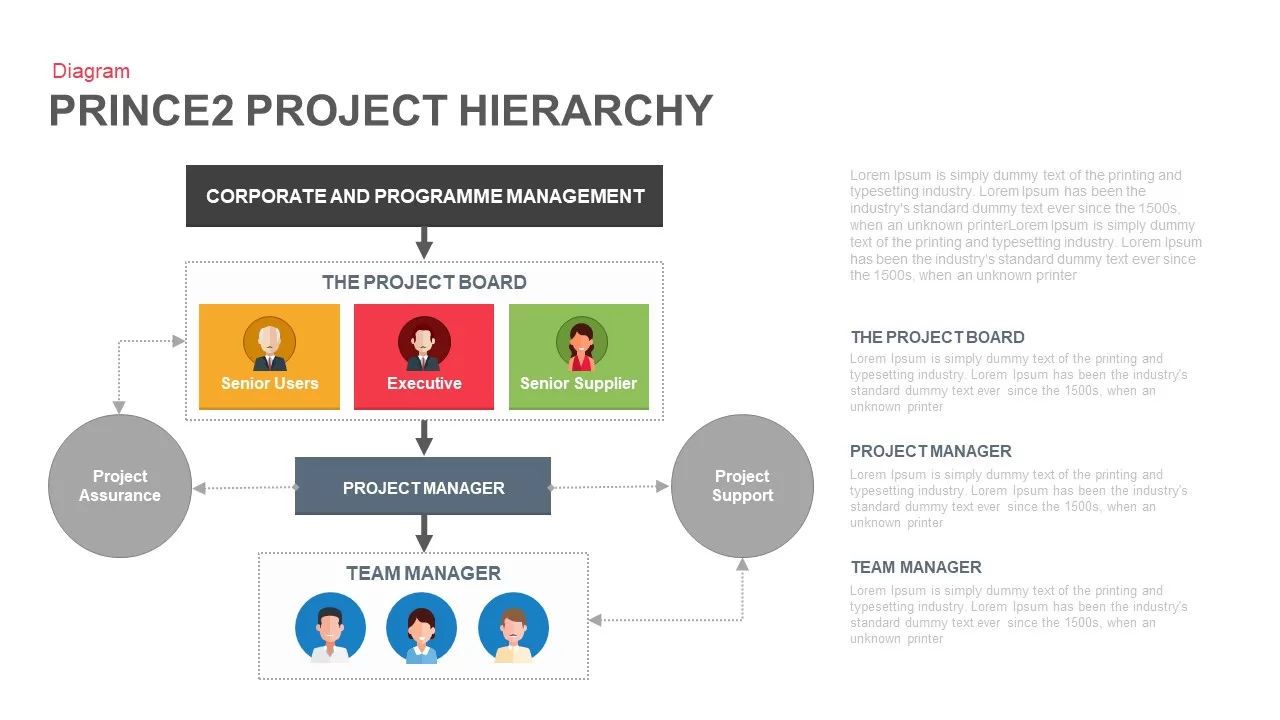
PRINCE2 Project Hierarchy Diagram for PowerPoint & Google Slides
Org Chart
Premium
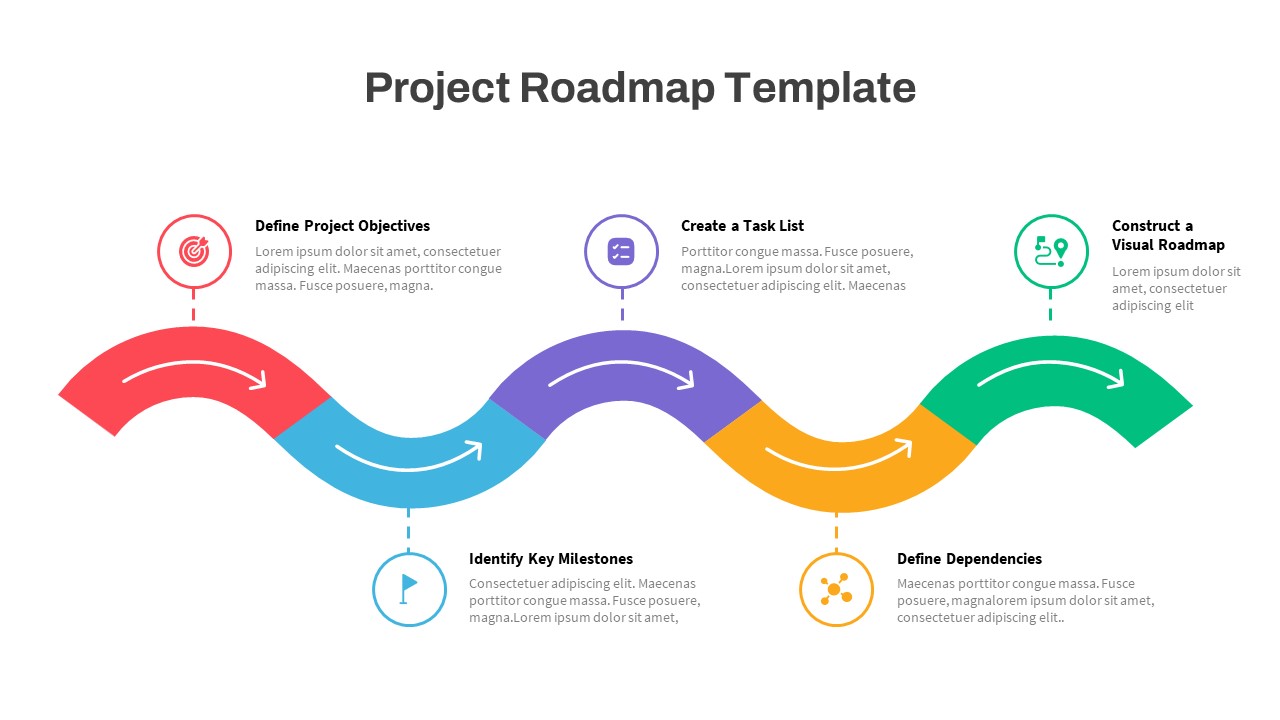
Wavy Timeline Project Roadmap Slide for PowerPoint & Google Slides
Project Status
Premium
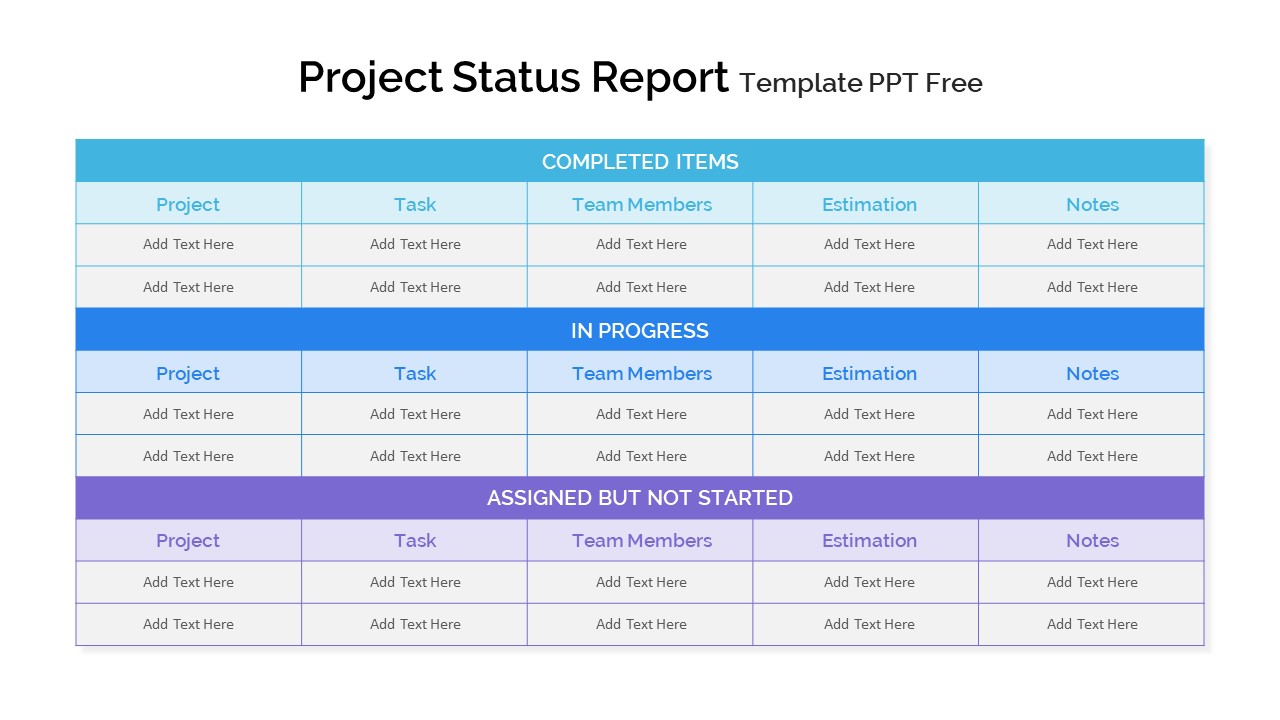
Project Status Report Tracker Slide for PowerPoint & Google Slides
Project Status
Premium
Research Project Proposal Deck for PowerPoint & Google Slides
Pitch Deck
Premium
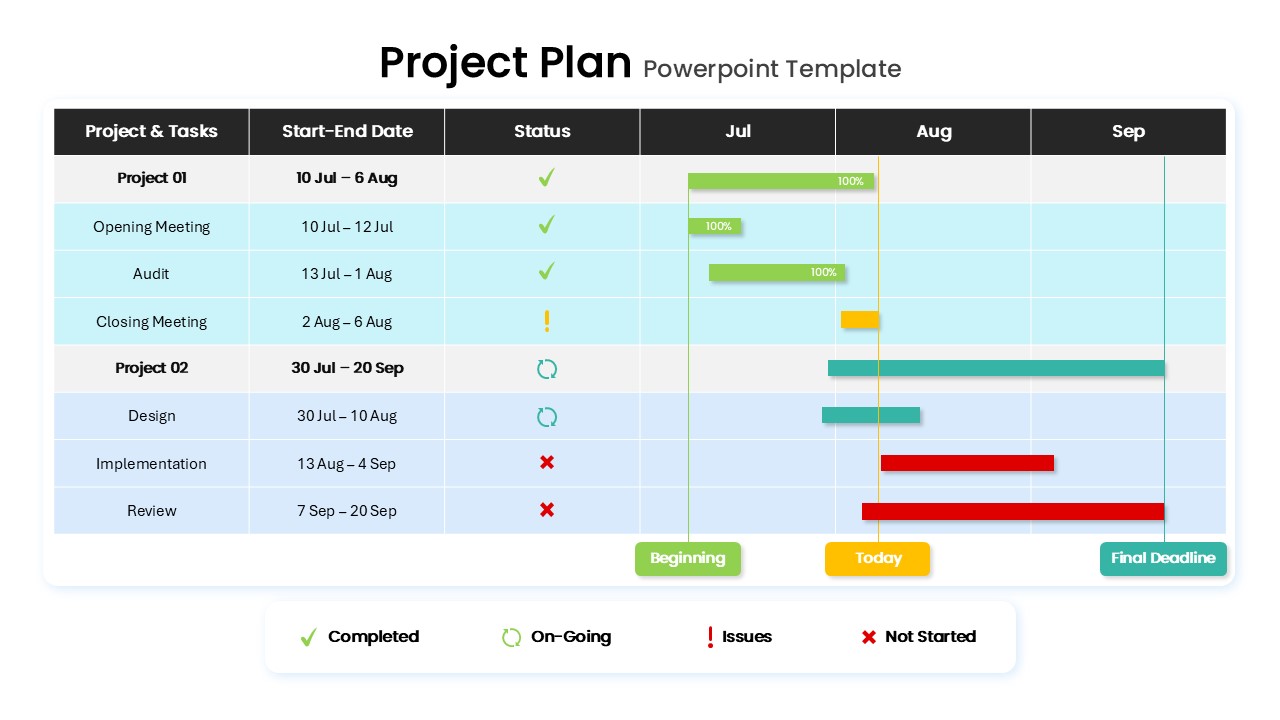
Project Plan Timeline for PowerPoint & Google Slides
Business Plan
Premium

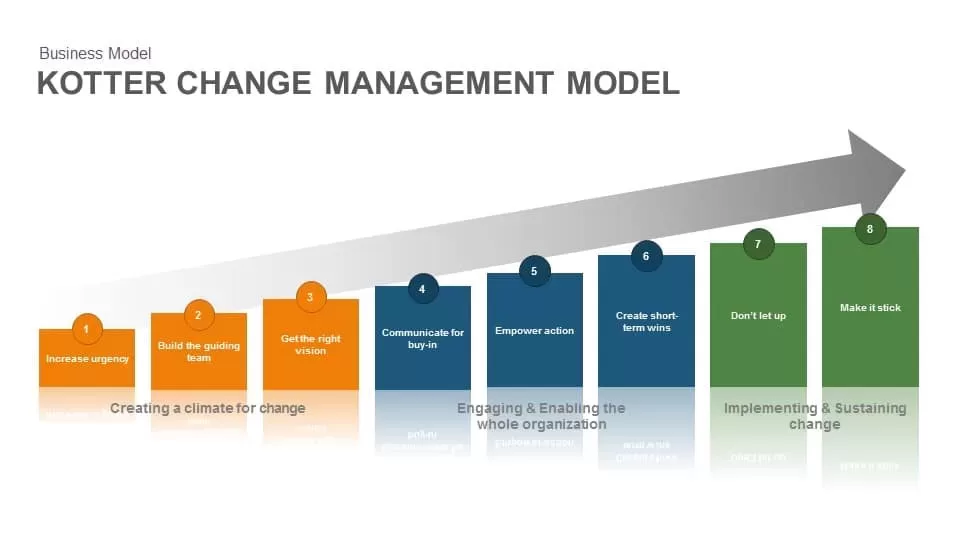
Kotter Change Management Model template for PowerPoint & Google Slides
Business Strategy
Premium
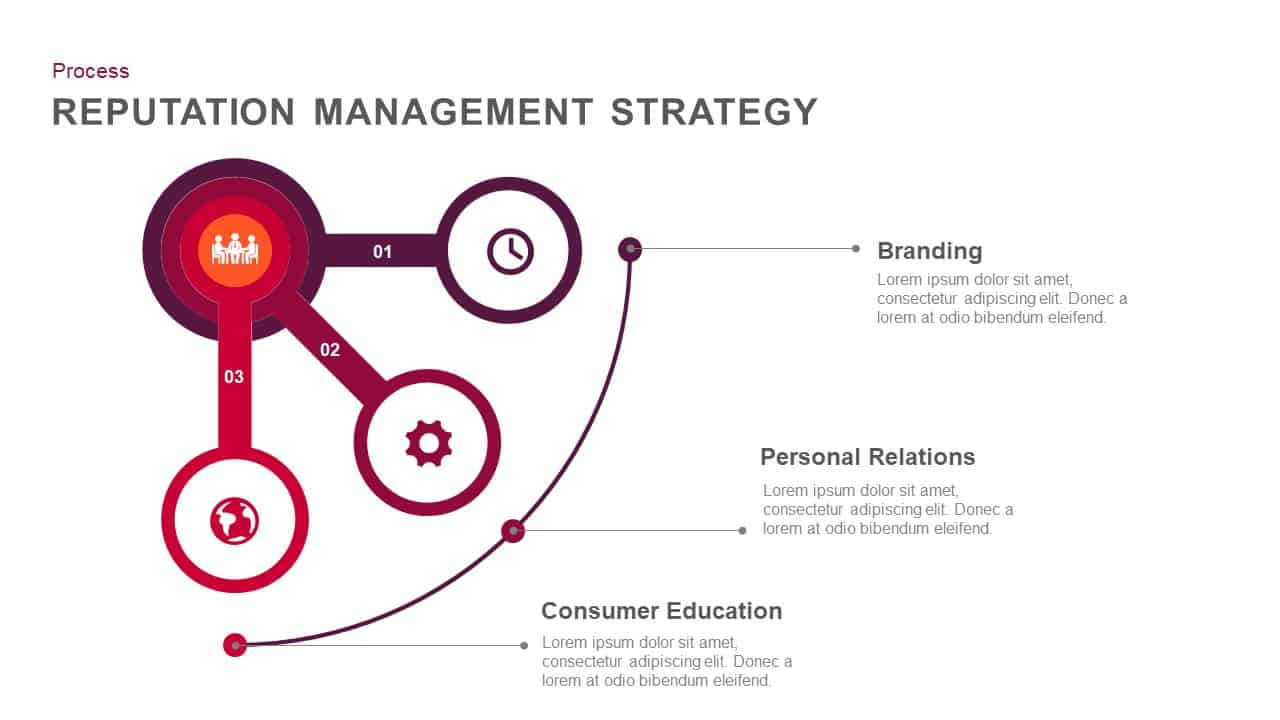
Reputation Management Strategy template for PowerPoint & Google Slides
Business Strategy
Premium
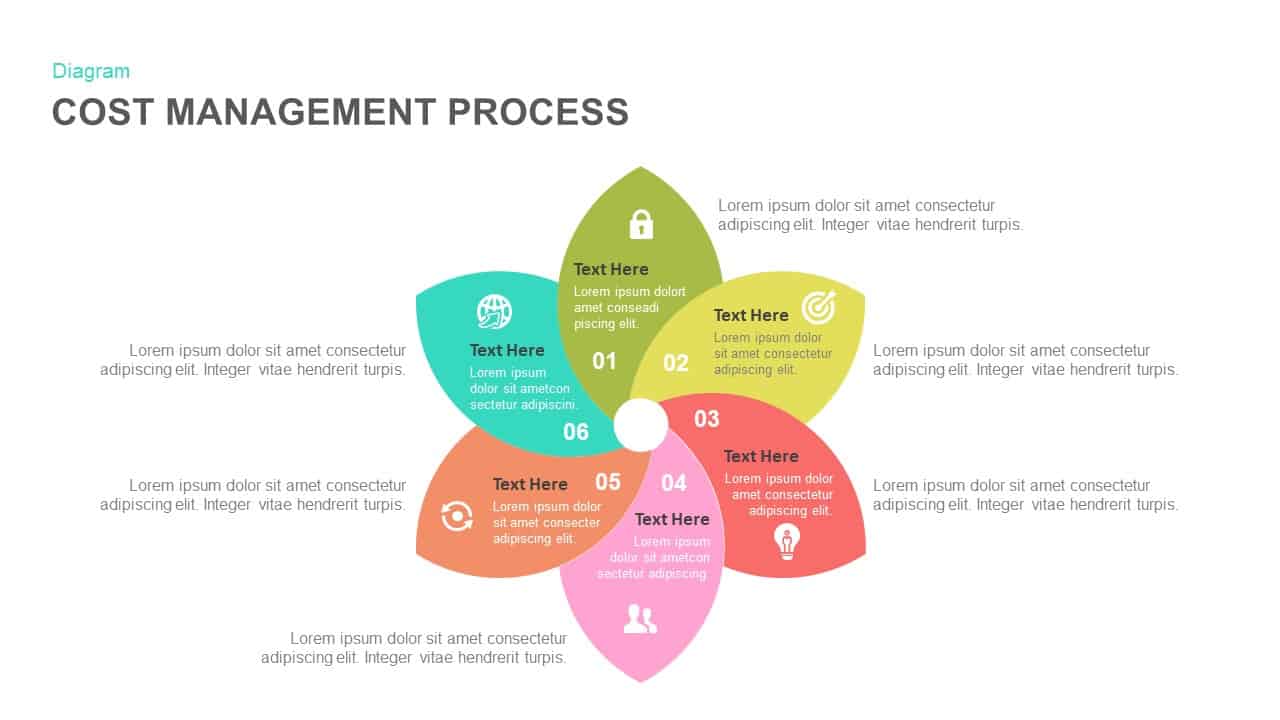
Cost Management Process template for PowerPoint & Google Slides
Process
Premium

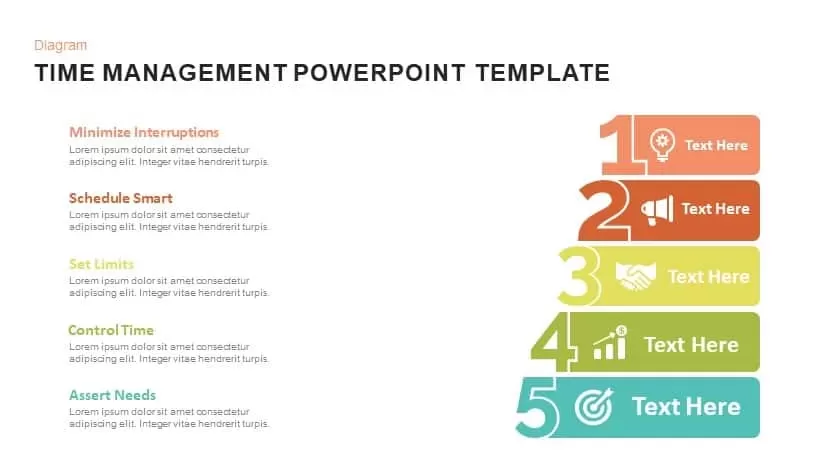
Time Management template for PowerPoint & Google Slides
Business Strategy
Premium
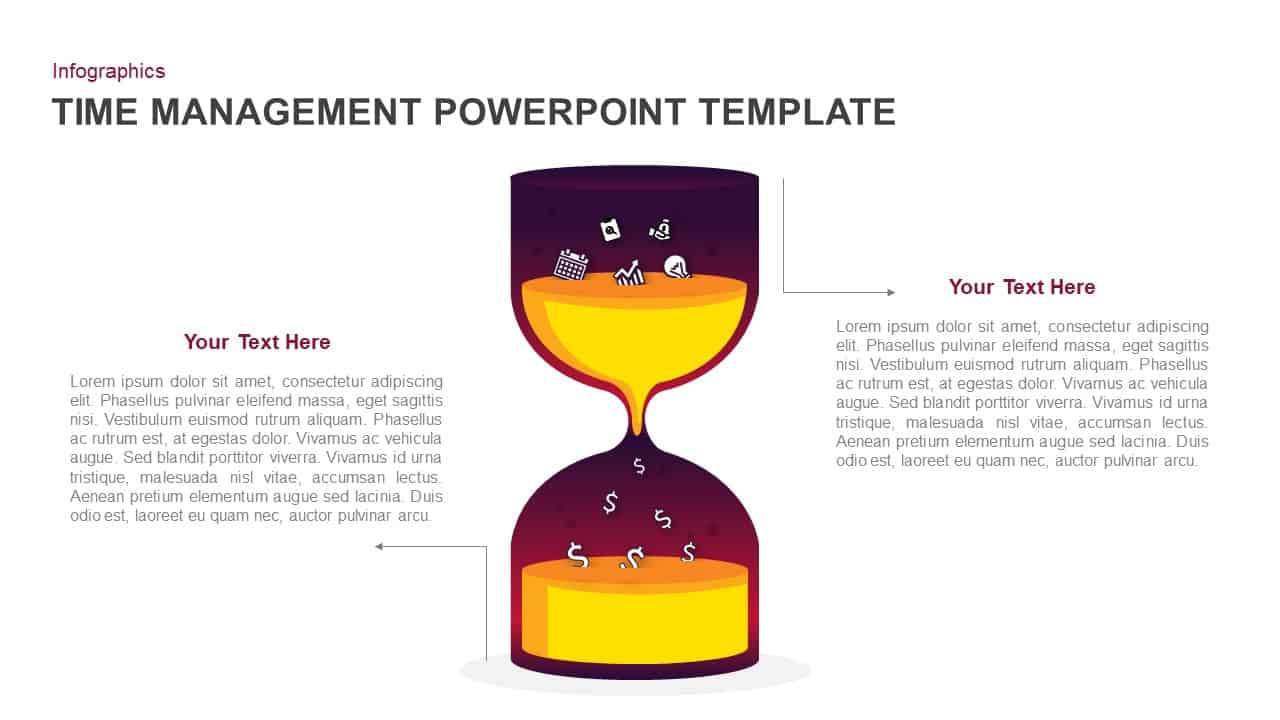
Time Management Hourglass Infographic Template for PowerPoint & Google Slides
Business
Premium
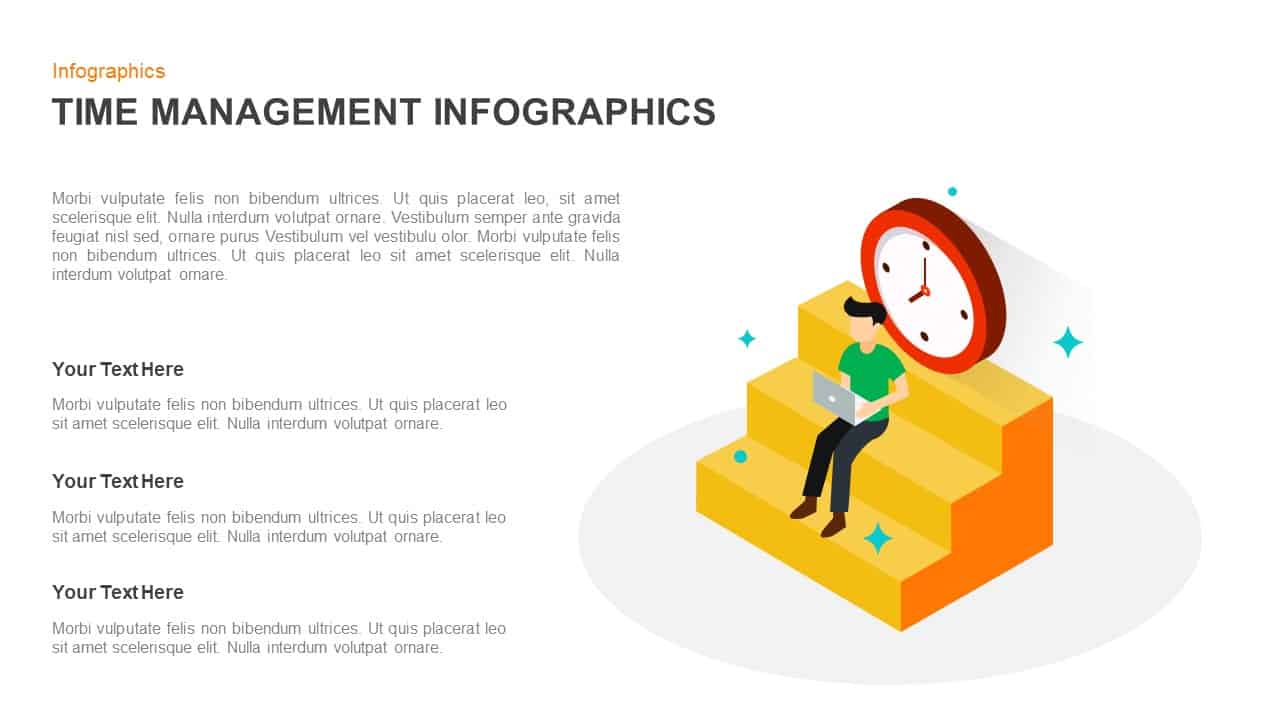
Isometric Time Management Infographic Template for PowerPoint & Google Slides
Process
Premium
Performance Review Progress Management Template for PowerPoint & Google Slides
Process
Premium
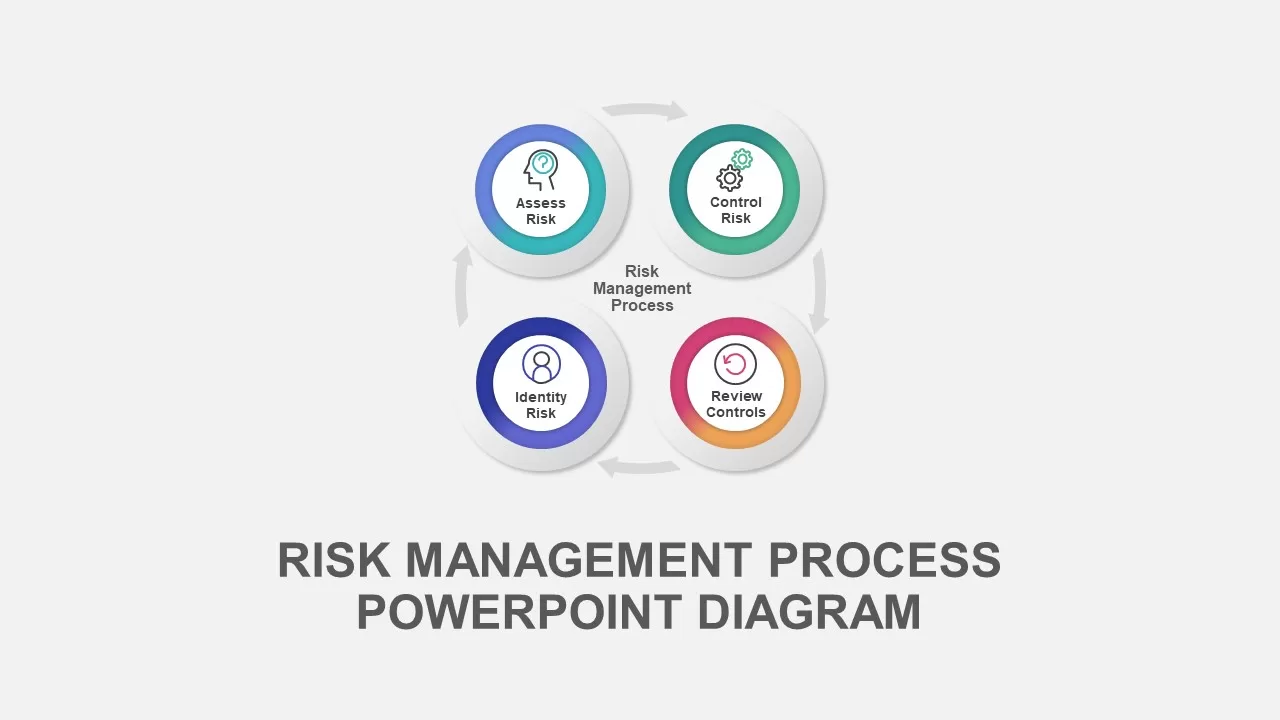
Risk Management Process Diagram Template for PowerPoint & Google Slides
Risk Management
Premium
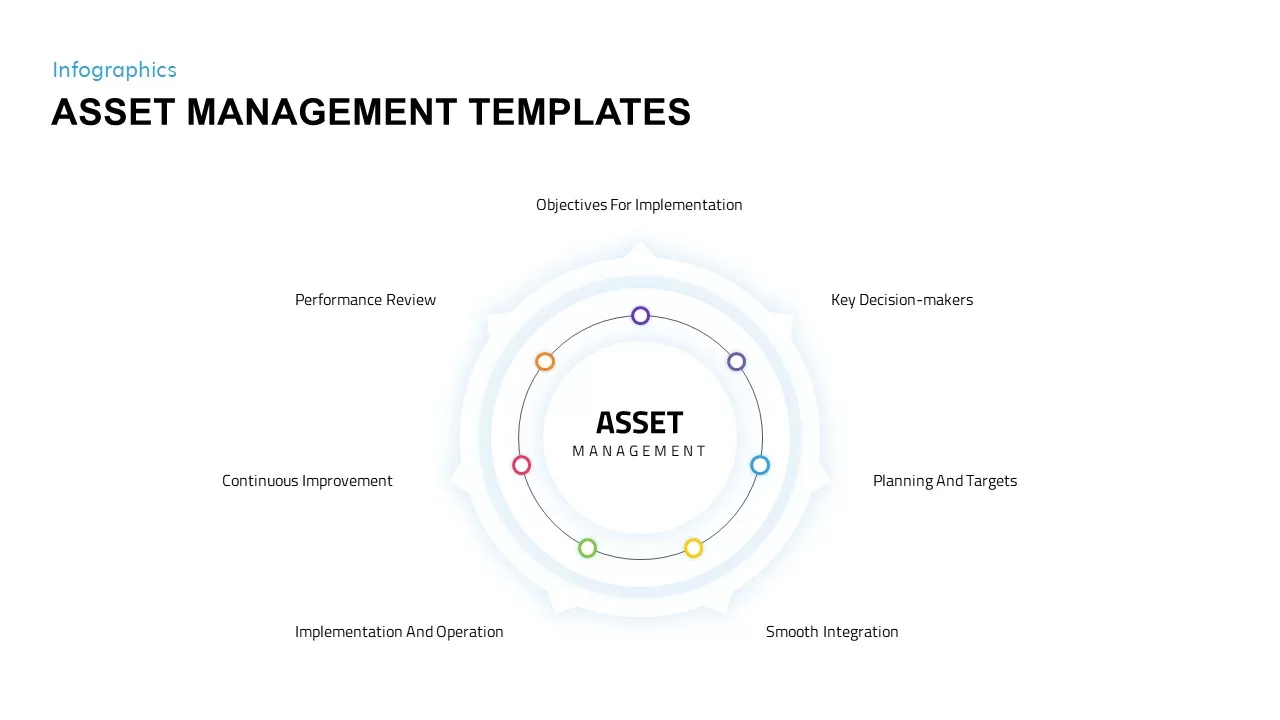
Asset Management Overview template for PowerPoint & Google Slides
Business
Premium
Clock Diagram for Time Management Template for PowerPoint & Google Slides
Circle
Premium
Value Based Management Step-by-Step Template for PowerPoint & Google Slides
Business Strategy
Premium
Product Management Presentation Template for PowerPoint & Google Slides
Project Status
Premium
Free Comprehensive Management Strategy Deck Template for PowerPoint & Google Slides
Pitch Deck
Free
Key Account Management Circular Factors Template for PowerPoint & Google Slides
Circle
Premium
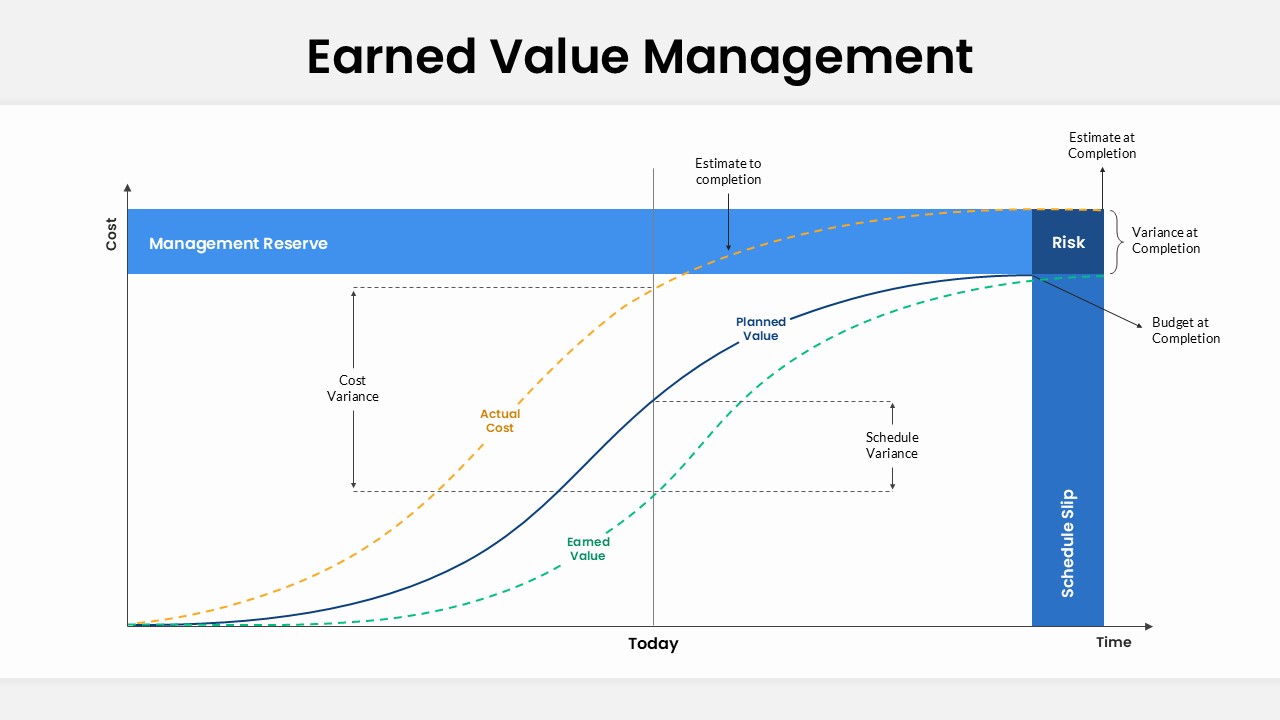
Earned Value Management (EVM) Slide Template for PowerPoint & Google Slides
Charts
Premium