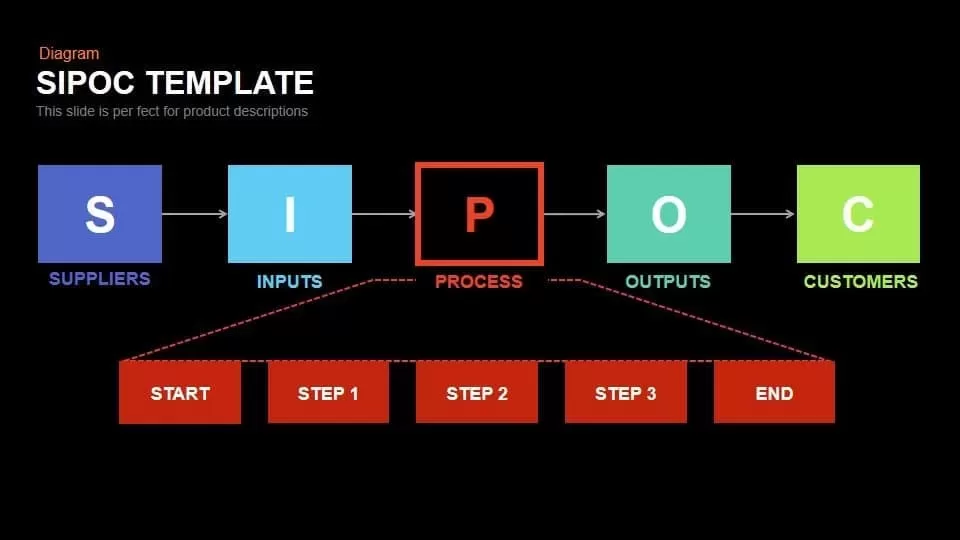
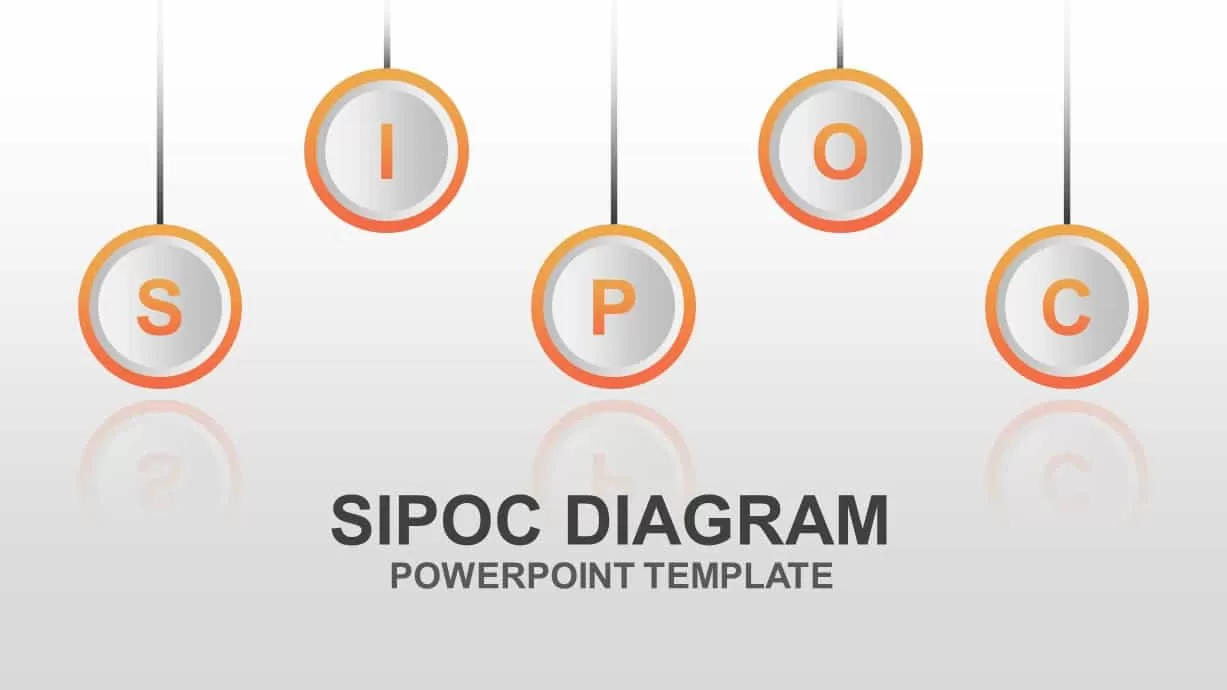
Color-Coded SIPOC Diagram with Process Flow for PowerPoint & Google Slides

Description
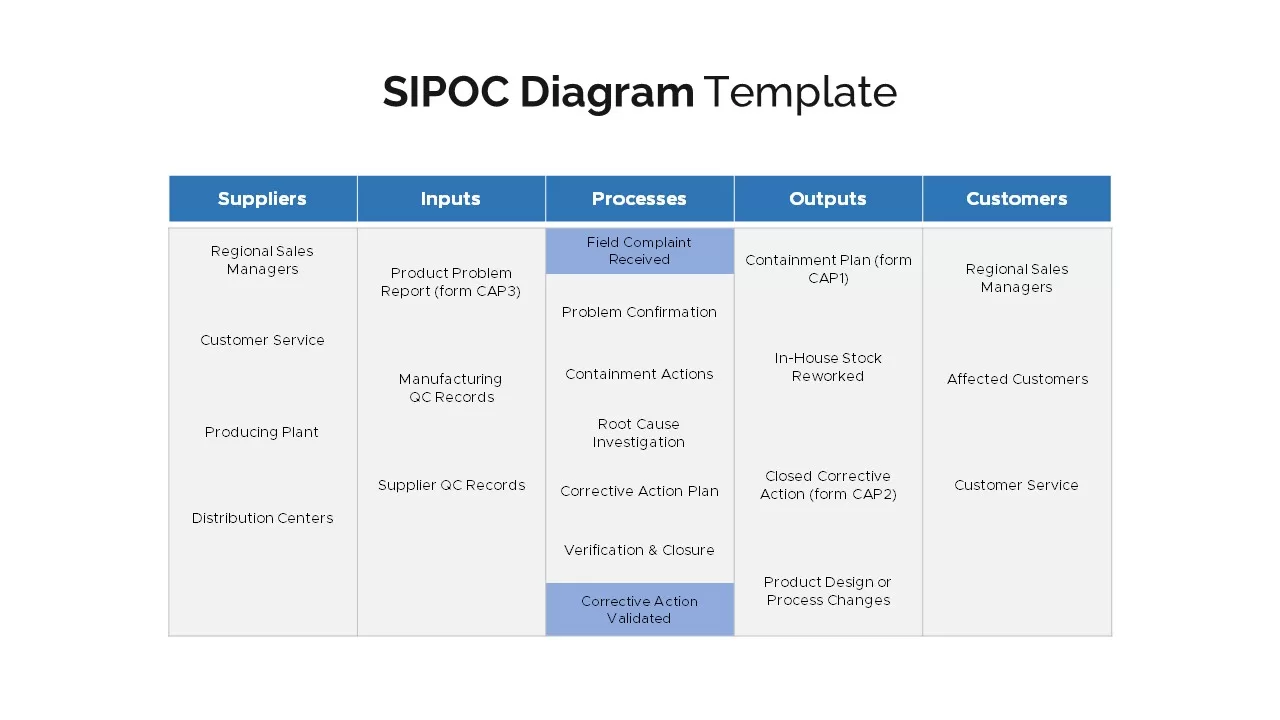
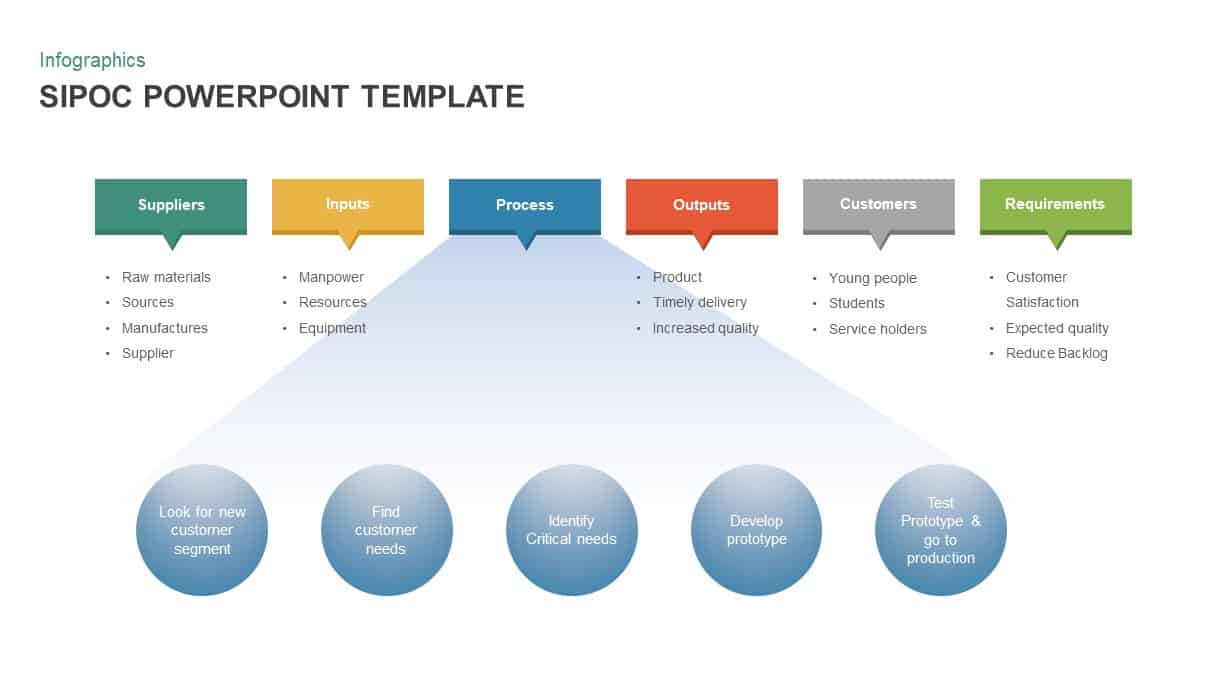
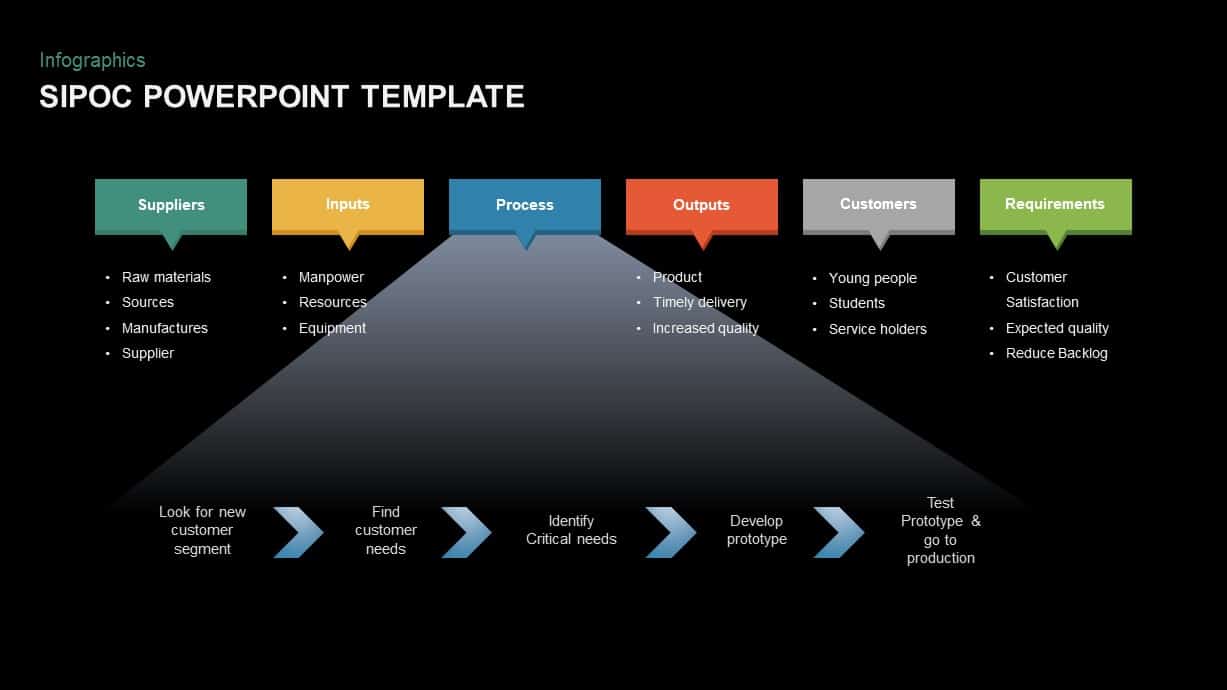
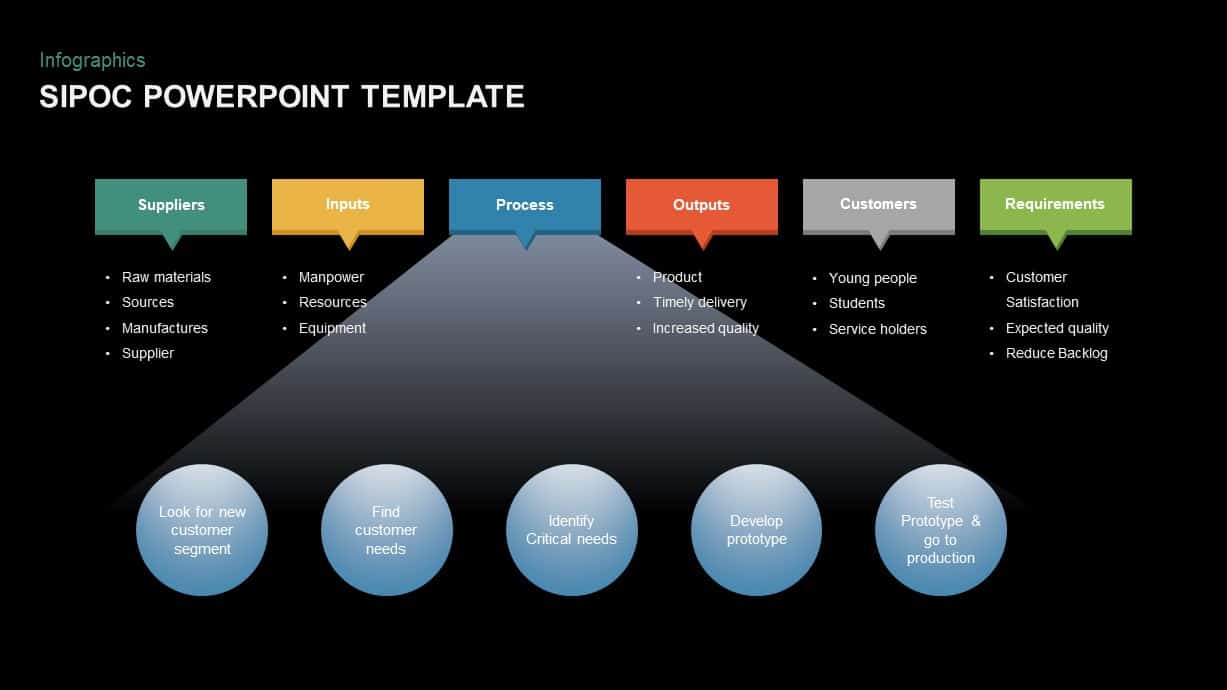
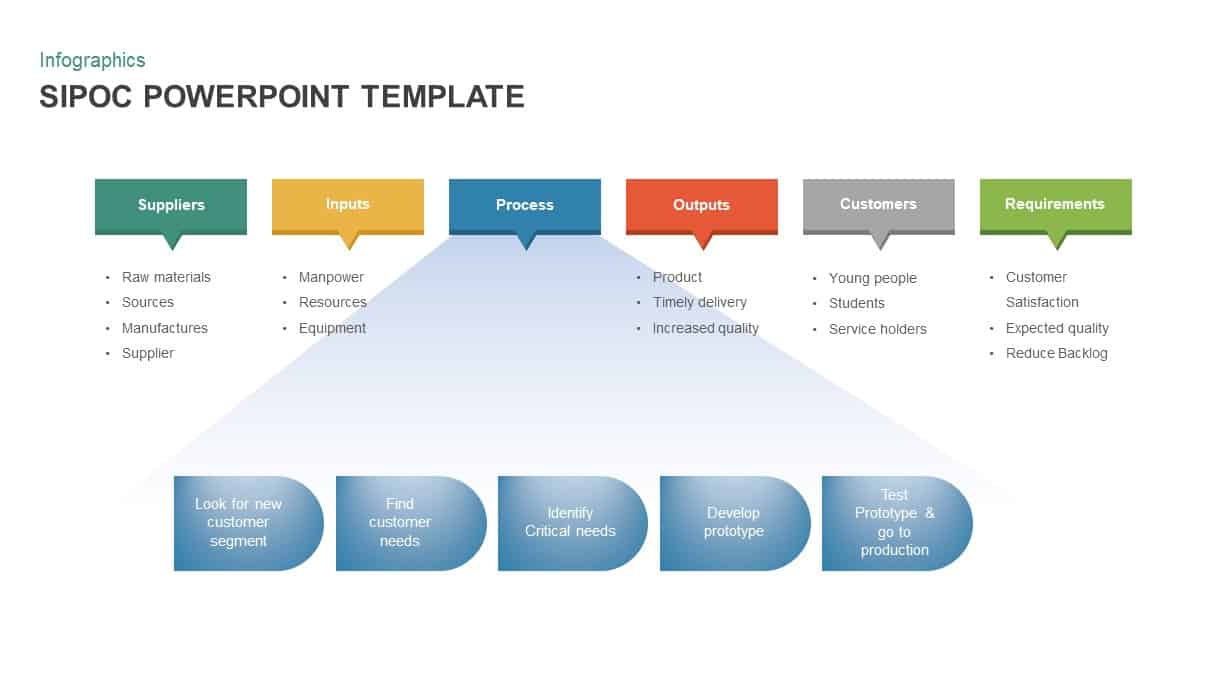
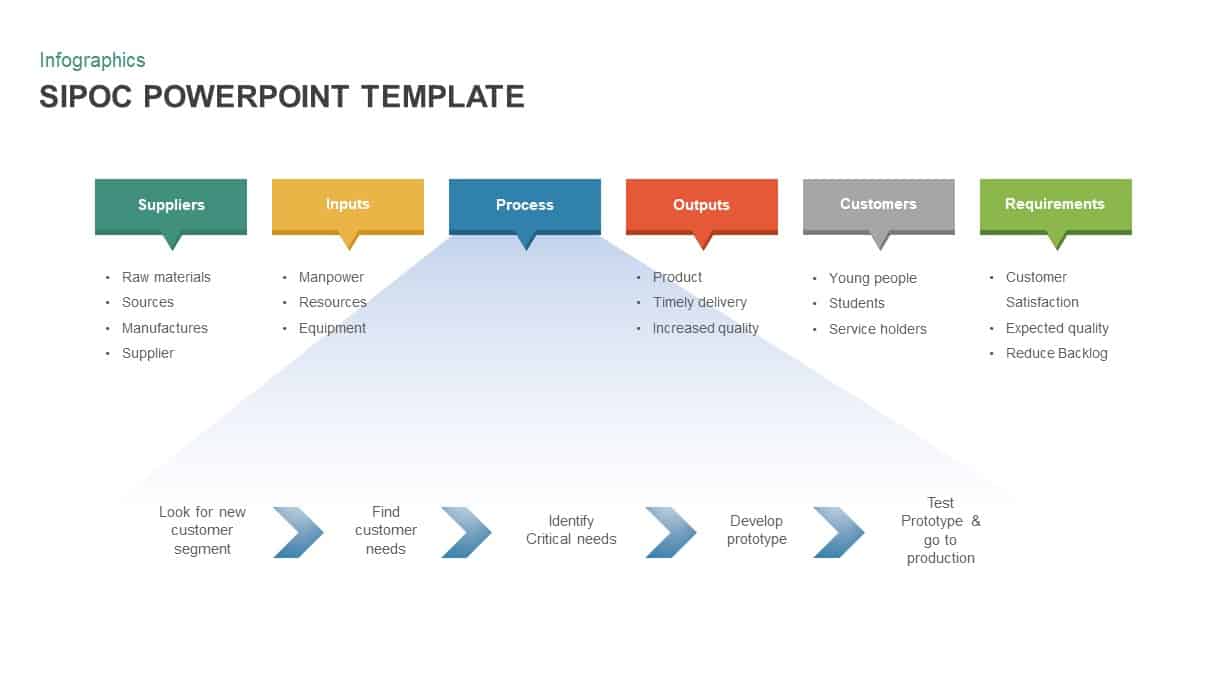
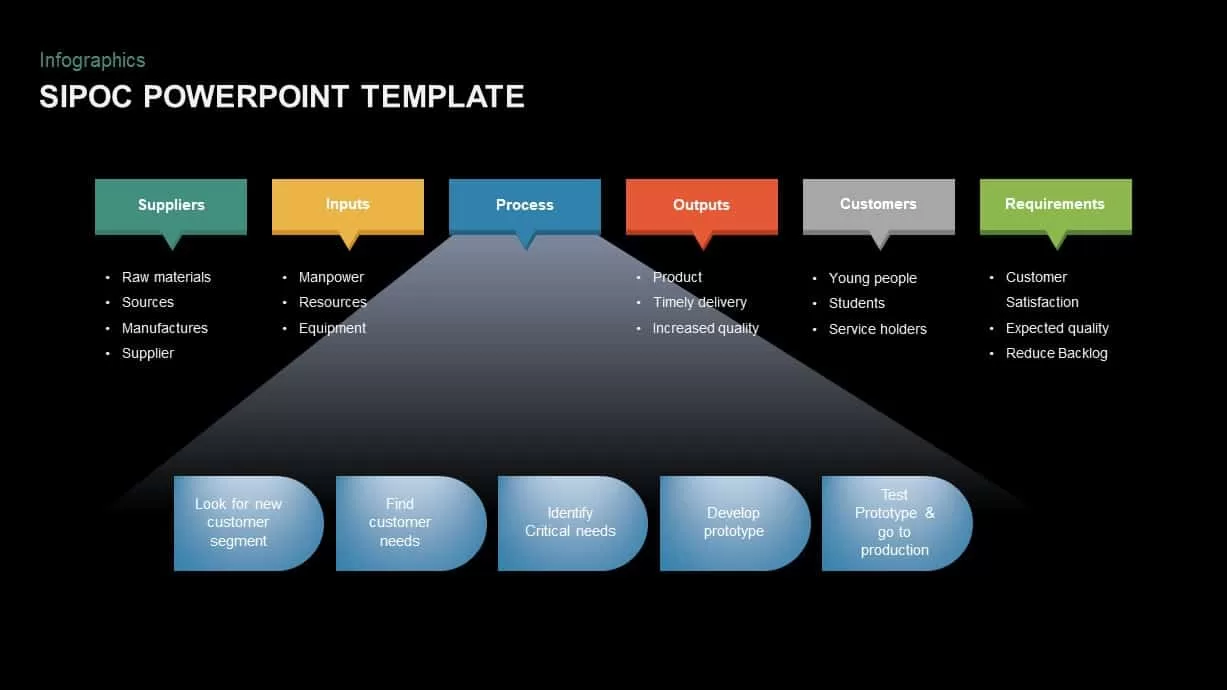
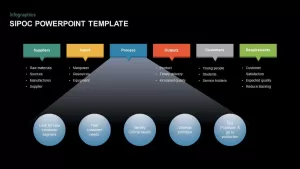
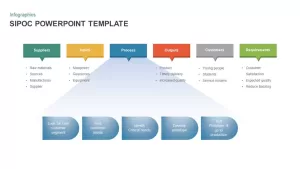
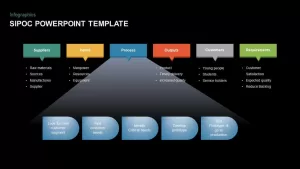
This SIPOC diagram slide presents a clear and structured overview of the core components of a process—Suppliers, Inputs, Process, Outputs, Customers, and Requirements—ideal for Lean Six Sigma, quality control, and process improvement discussions. Each SIPOC element is color-coded and positioned horizontally, supported by a corresponding flow beneath that traces actionable steps like identifying needs, developing prototypes, and launching production.
The visual clarity of this slide allows stakeholders to quickly understand upstream and downstream relationships while linking activities to customer expectations and performance metrics. The upper tier uses labeled boxes to outline critical information such as raw materials, manpower, final outputs, target customers, and quality requirements. Below, the connected process flow is visualized with circular or arrow-shaped markers that align neatly beneath each SIPOC phase, reinforcing logical continuity.
Fully editable in both PowerPoint and Google Slides, this template enables teams to modify text, update icons, or reframe the steps to suit any industry or workflow scenario. It’s especially effective for standardizing processes, onboarding teams to operational methods, or identifying improvement opportunities across business functions.
Who is it for
Designed for operations managers, quality analysts, process consultants, and project leads looking to document or present end-to-end business workflows within a structured SIPOC framework.
Other Uses
Can also be used for root cause analysis, new product development, customer journey mapping, or cross-functional collaboration meetings to clarify accountability and streamline delivery chains.
Login to download this file
Add to favorites
Add to collection

Item ID
SB01620
Related Templates

Free Color-Coded Fishbone Diagram Template for PowerPoint & Google Slides
Project
Free
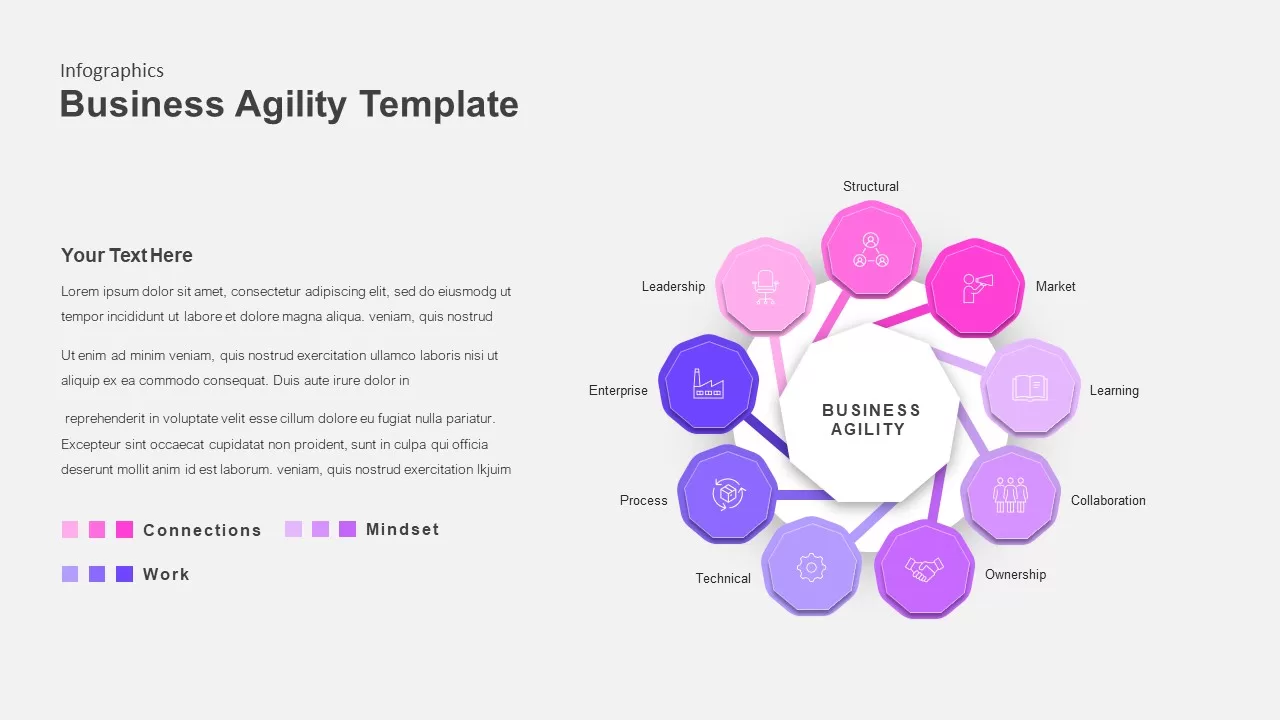
Color-Coded Business Agility Radial Template for PowerPoint & Google Slides
Business
Premium
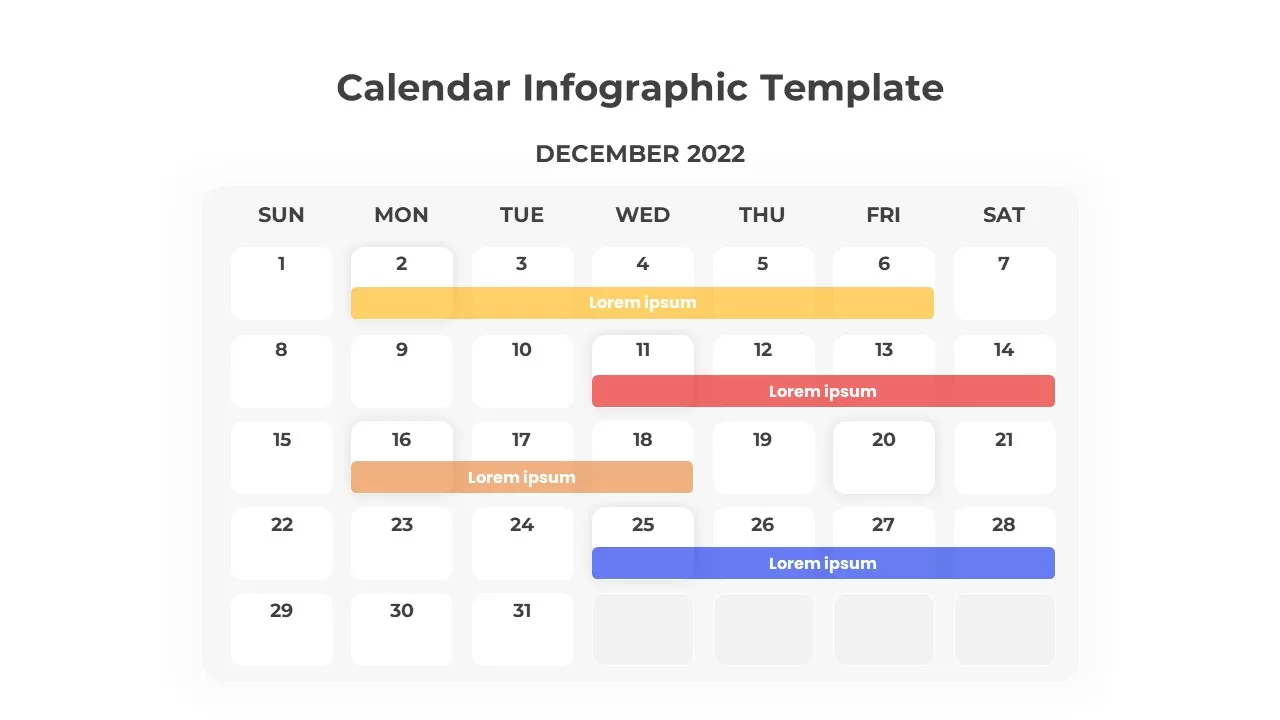
Color-Coded Calendar Infographic Template for PowerPoint & Google Slides
Infographics
Premium
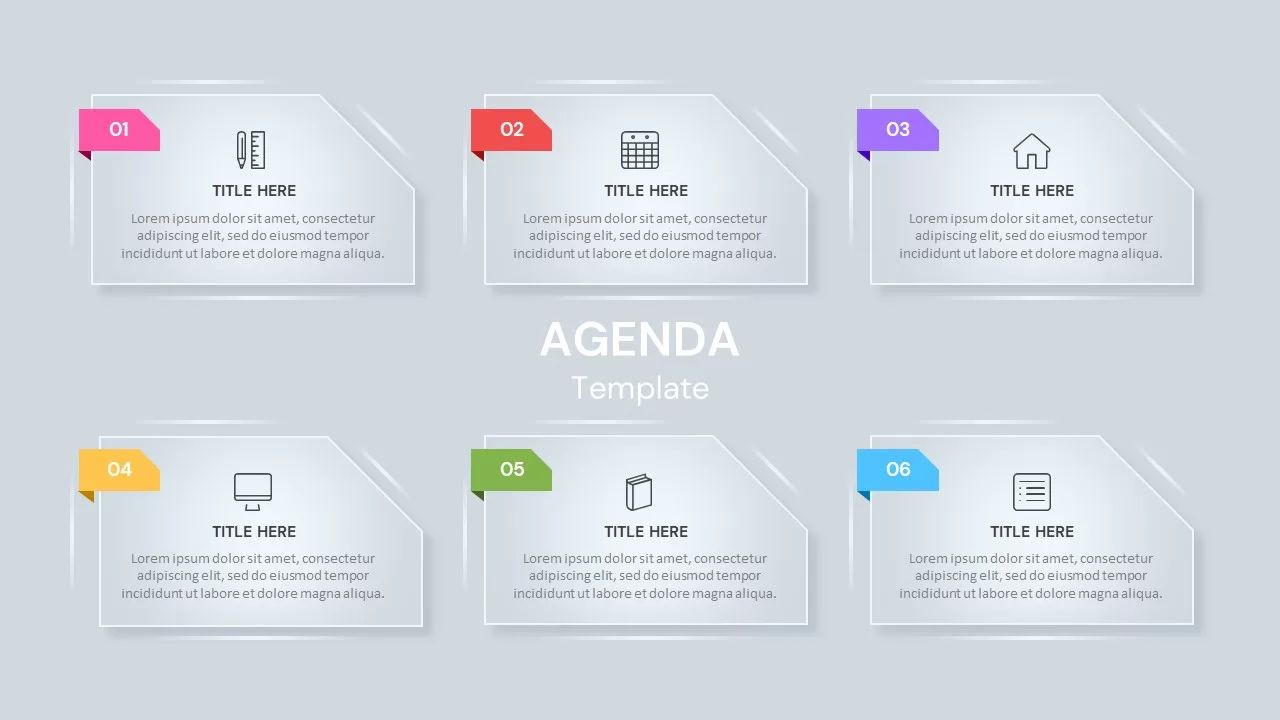
Six-Section Color-Coded Agenda Template for PowerPoint & Google Slides
Agenda
Premium
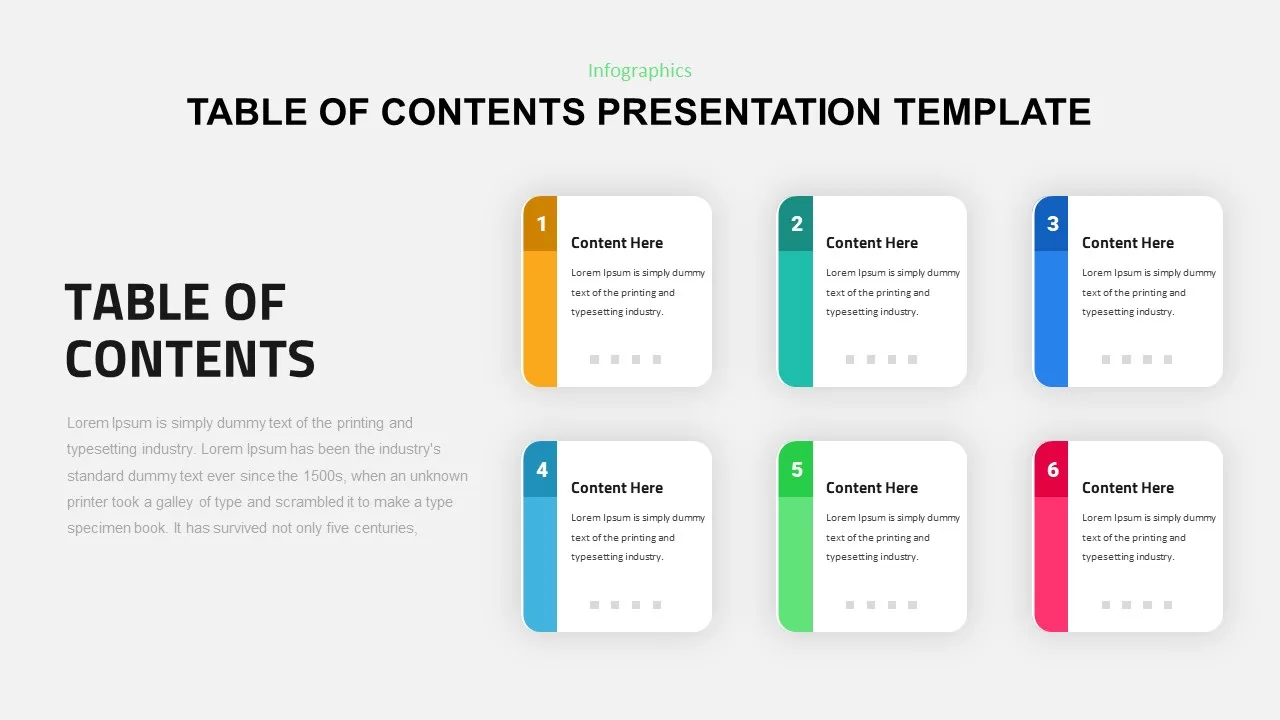
Six-Step Color-Coded Table of Contents Template for PowerPoint & Google Slides
Agenda
Premium
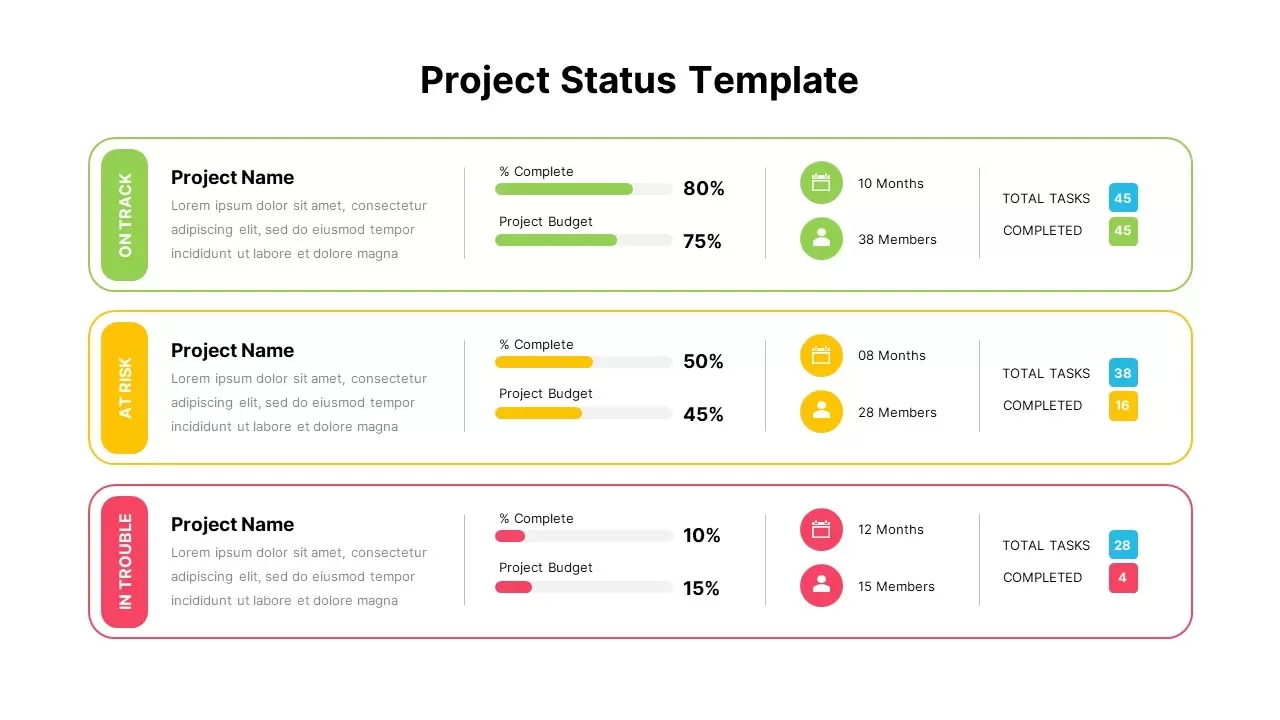
Color-Coded Project Status Template for PowerPoint & Google Slides
Project Status
Premium
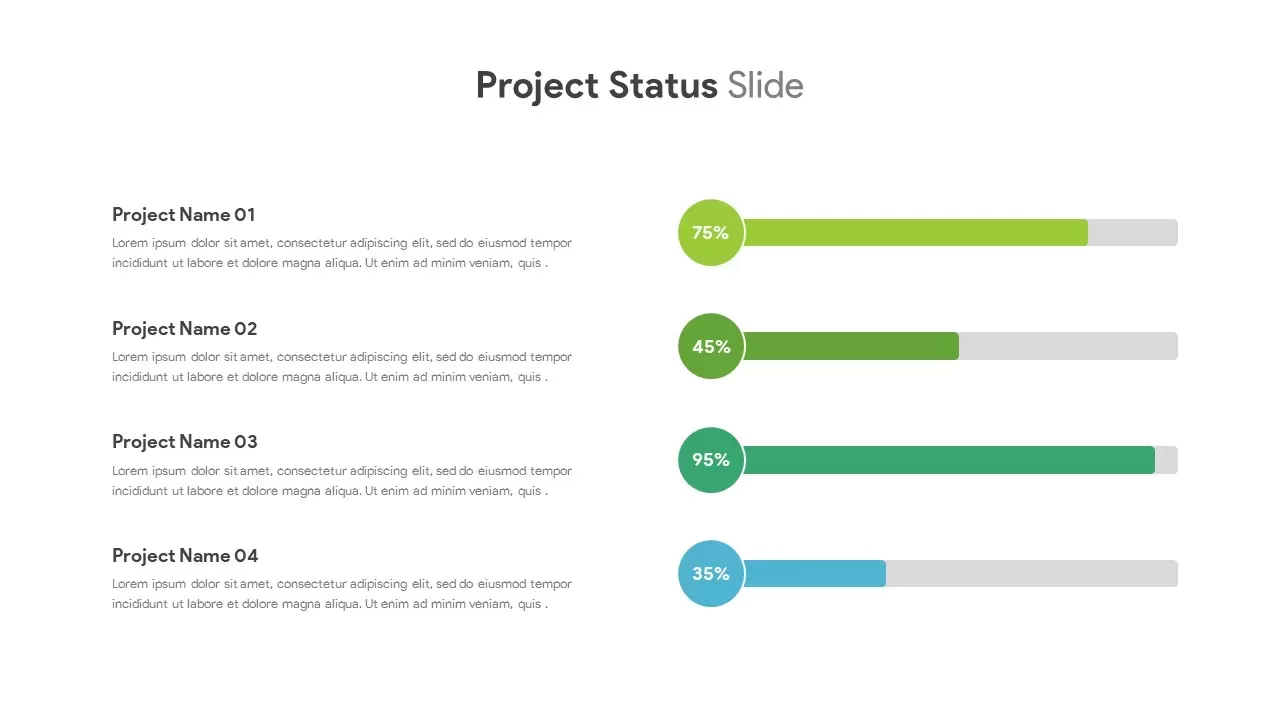
Color-Coded Project Status Slide Template for PowerPoint & Google Slides
Project Status
Premium
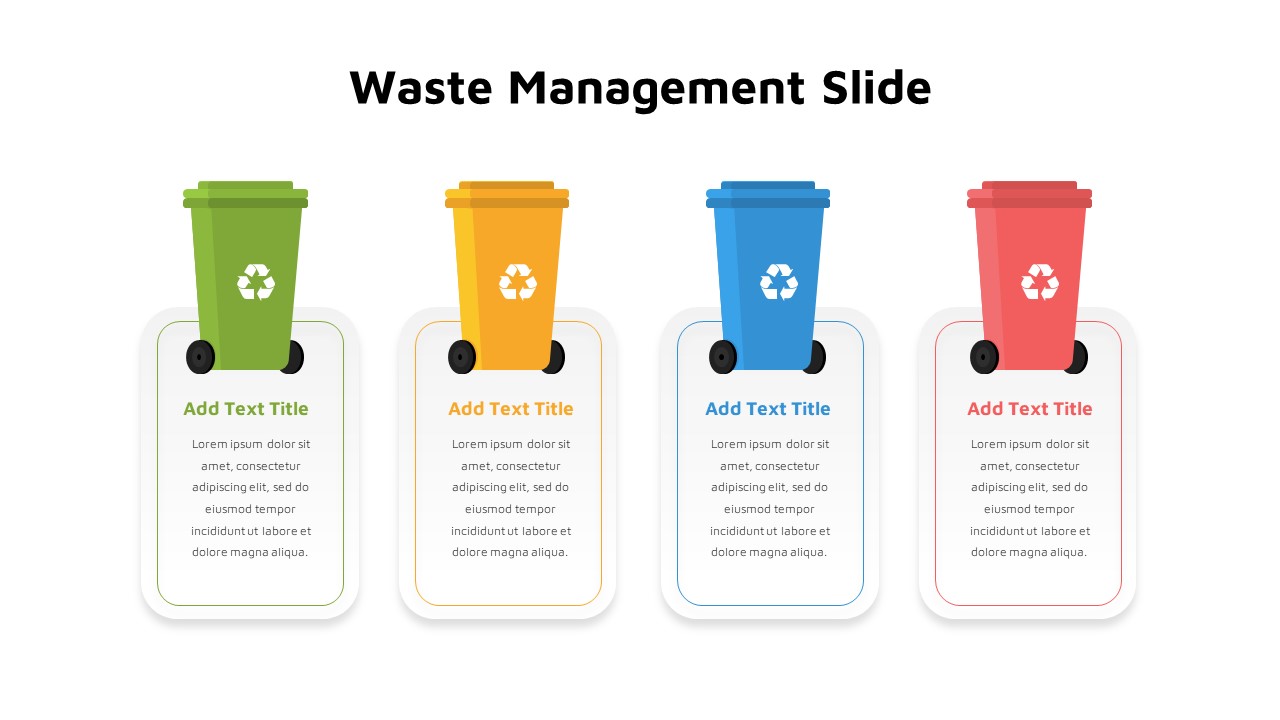
Color-Coded Waste Management Bins Template for PowerPoint & Google Slides
Comparison
Premium
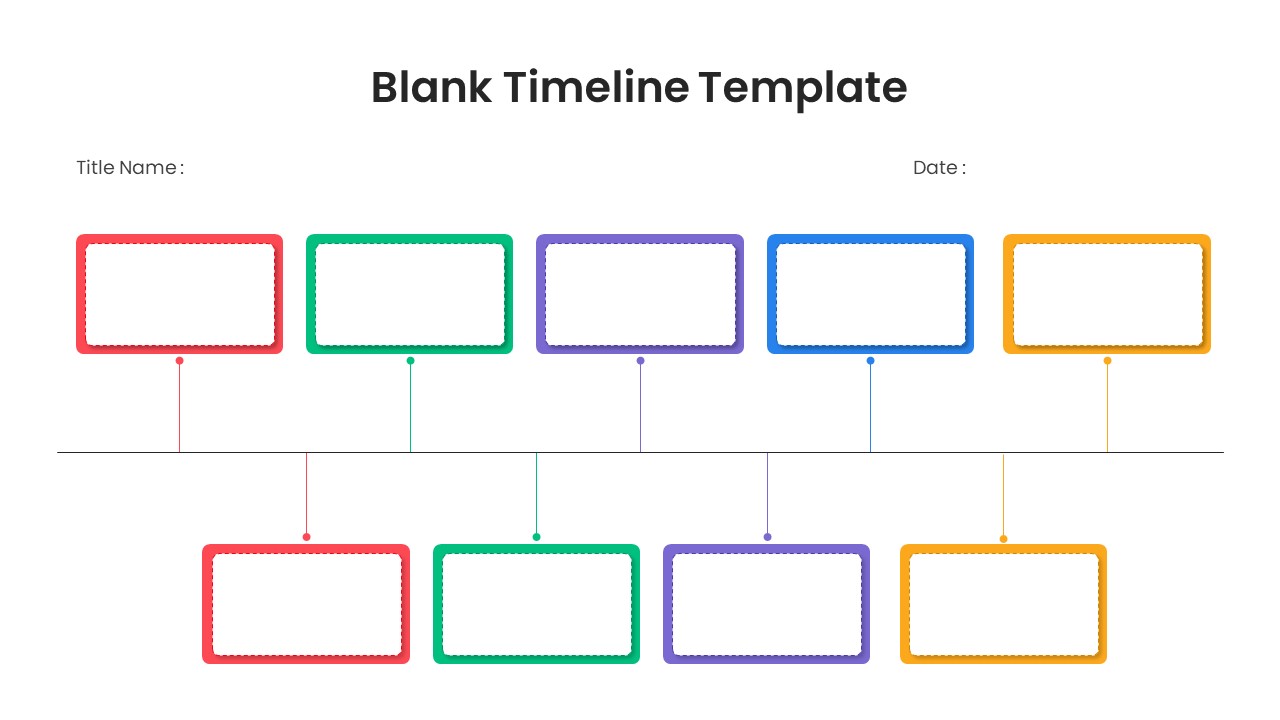
Blank Two-Tier Color-Coded Timeline Template for PowerPoint & Google Slides
Timeline
Premium
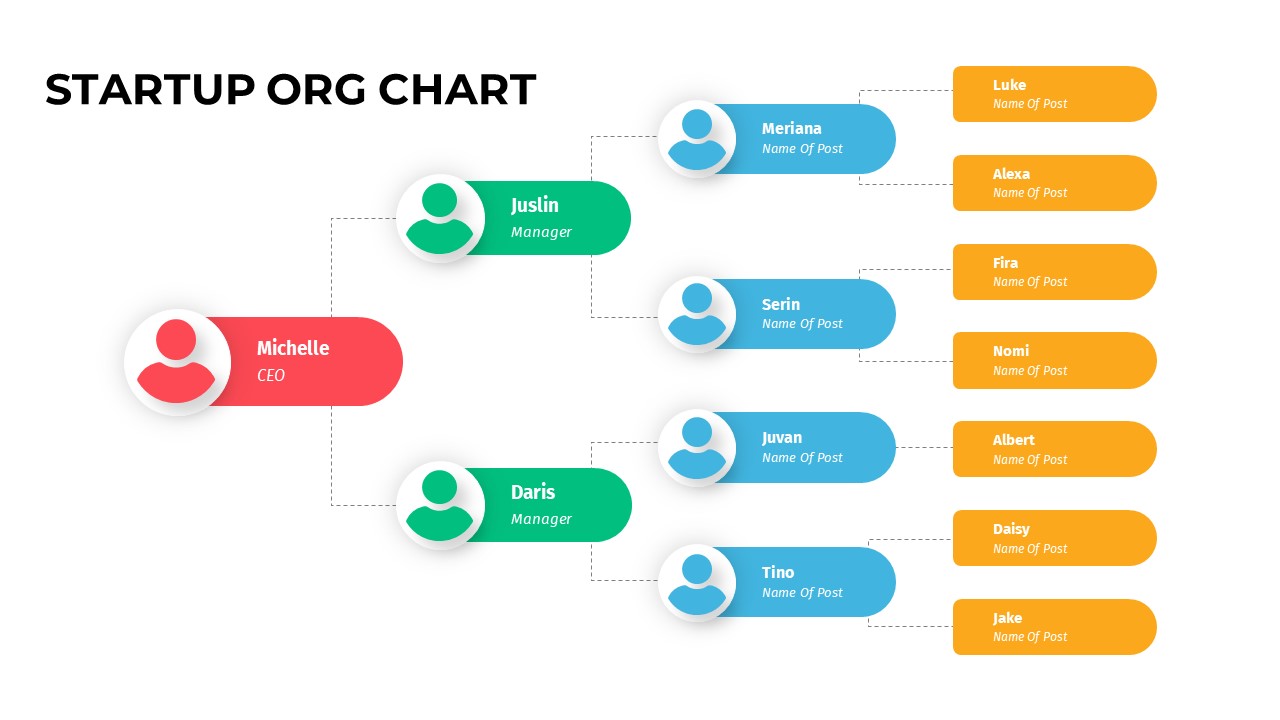
Color-Coded Startup Org Chart Slide for PowerPoint & Google Slides
Org Chart
Premium
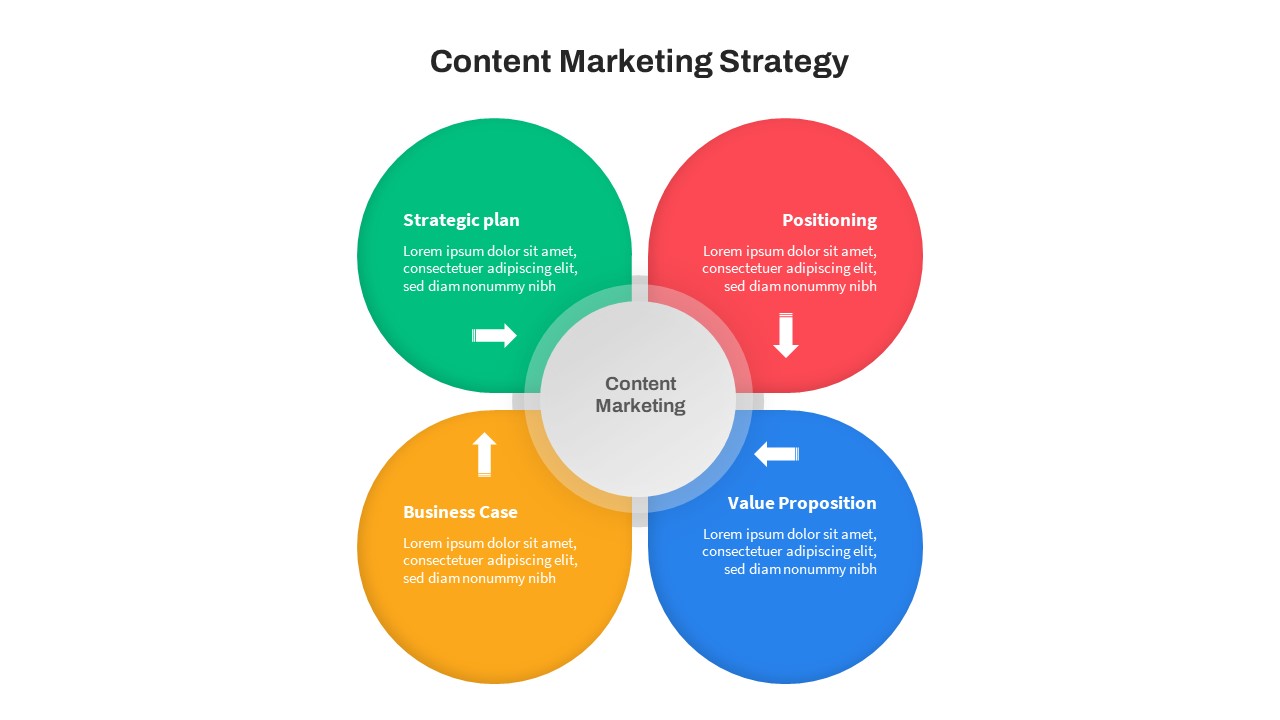
Color-Coded Content Marketing Strategy Slide for PowerPoint & Google Slides
Marketing
Premium
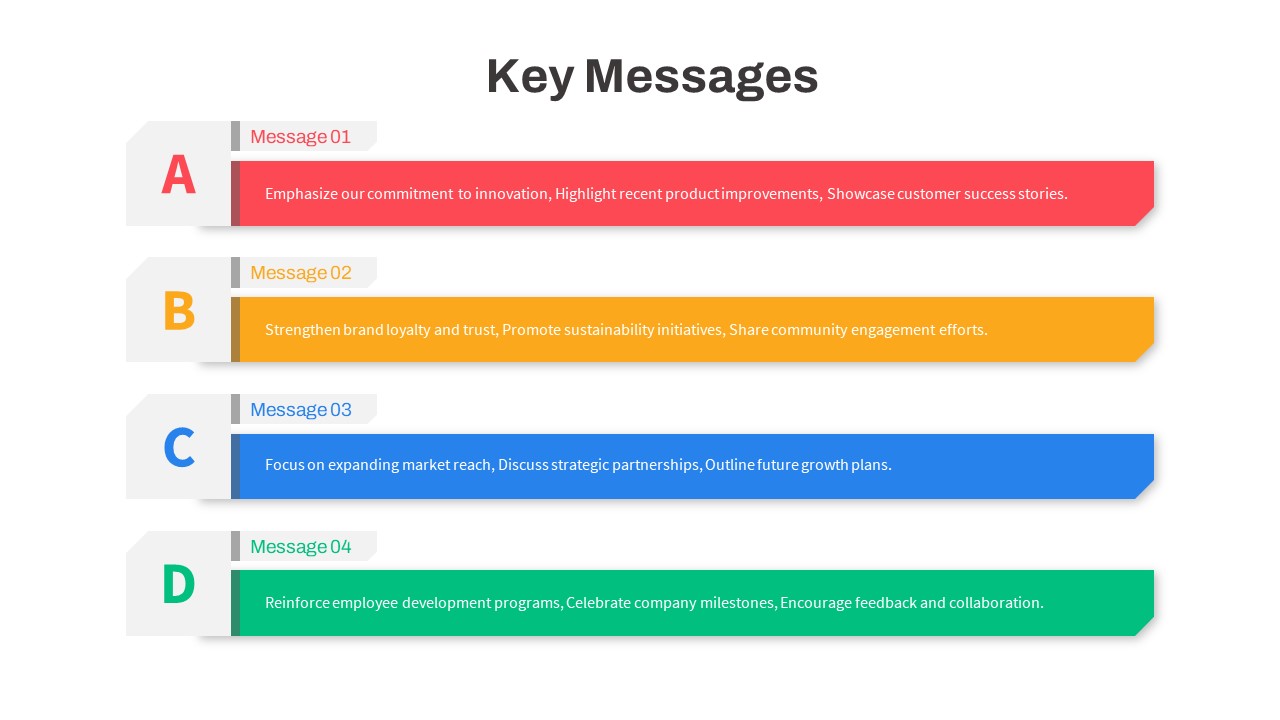
Color-Coded Corporate Key Messages Template for PowerPoint & Google Slides
Process
Premium
Color-Coded Gantt Chart template for PowerPoint & Google Slides
Business
Premium

SIPOC Diagram with Process Breakdown Template for PowerPoint & Google Slides
Process
Premium

Editable SIPOC Process Diagram Deck Template for PowerPoint & Google Slides
Pitch Deck
Premium
Four SIPOC Diagram Infographic Templates for PowerPoint & Google Slides
Business Plan
Premium
Multi-Color Eight-Step Ribbon Diagram Template for PowerPoint & Google Slides
Process
Premium
Multi-Color Enneagram Circular Diagram Template for PowerPoint & Google Slides
Circle
Premium
Modern Multi-Color Polar Chart Diagram Template for PowerPoint & Google Slides
Circle
Premium
3D Color Block Organizational Chart Slide for PowerPoint & Google Slides
Org Chart
Premium

Blured Color Duo Pitch Template for PowerPoint & Google Slides
Company Profile
Premium

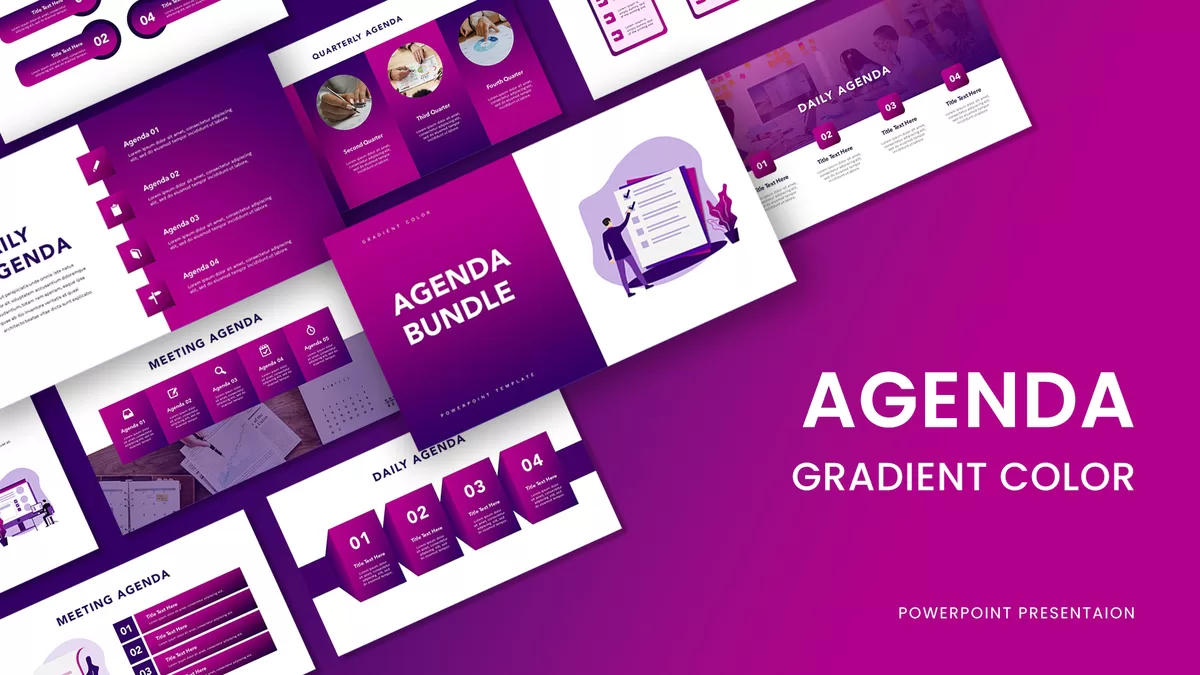
Gradient Color Agenda Slide Bundle Template for PowerPoint & Google Slides
Agenda
Premium
Multi-Color Five-Step Curved Arrow Template for PowerPoint & Google Slides
Process
Premium
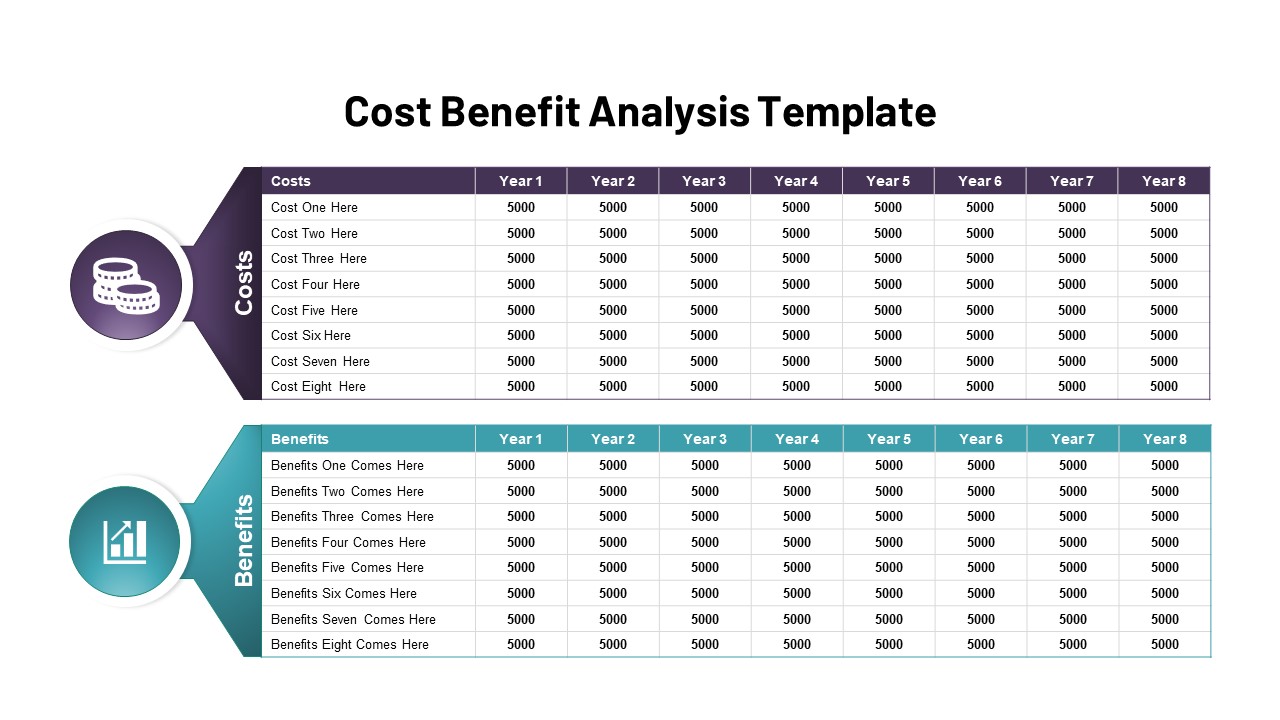
Dual-Color Cost vs Benefit Analysis Template for PowerPoint & Google Slides
Comparison
Premium
Purple Color Presentation Template for PowerPoint & Google Slides
Company Profile
Premium
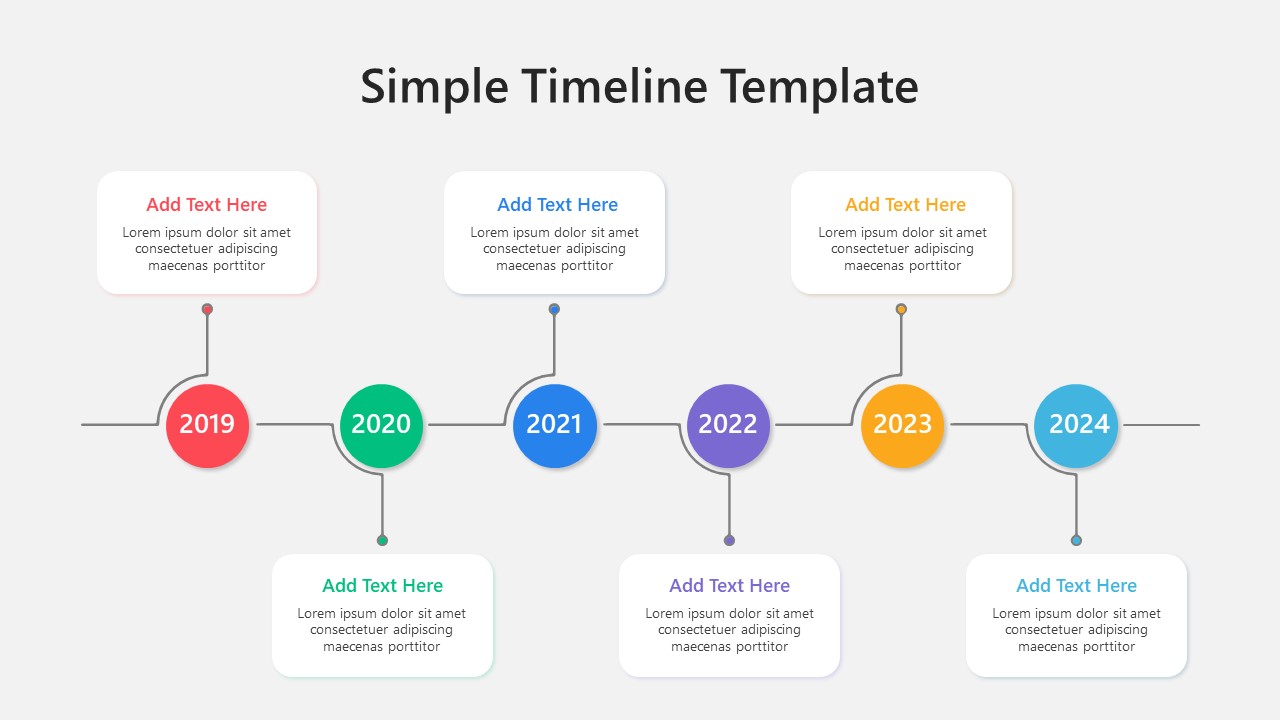
Multi-Color Milestone Timeline Layout Template for PowerPoint & Google Slides
Timeline
Premium
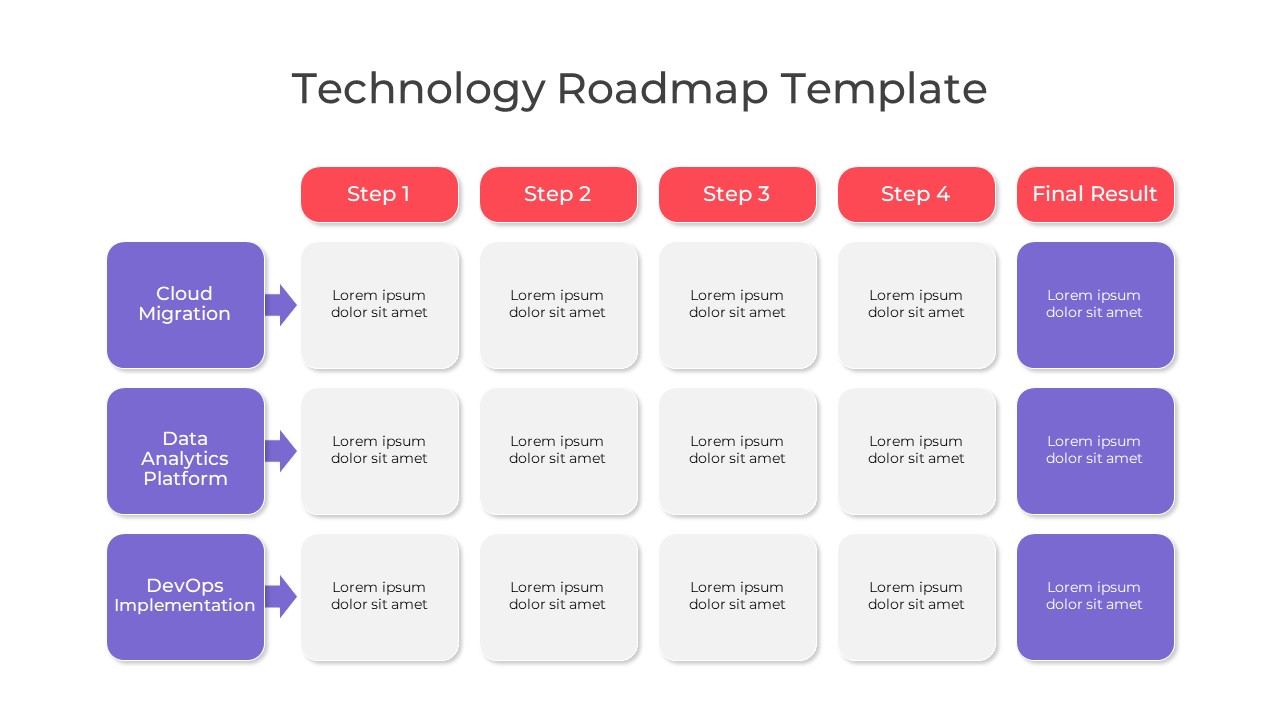
Multi-Color Technology Roadmap Template Pack for PowerPoint & Google Slides
Roadmap
Premium
Free Minimal Multi-Color Table of Contents Template for PowerPoint & Google Slides
Agenda
Free
Multi-color Curved Timeline Roadmap Template for PowerPoint & Google Slides
Timeline
Premium
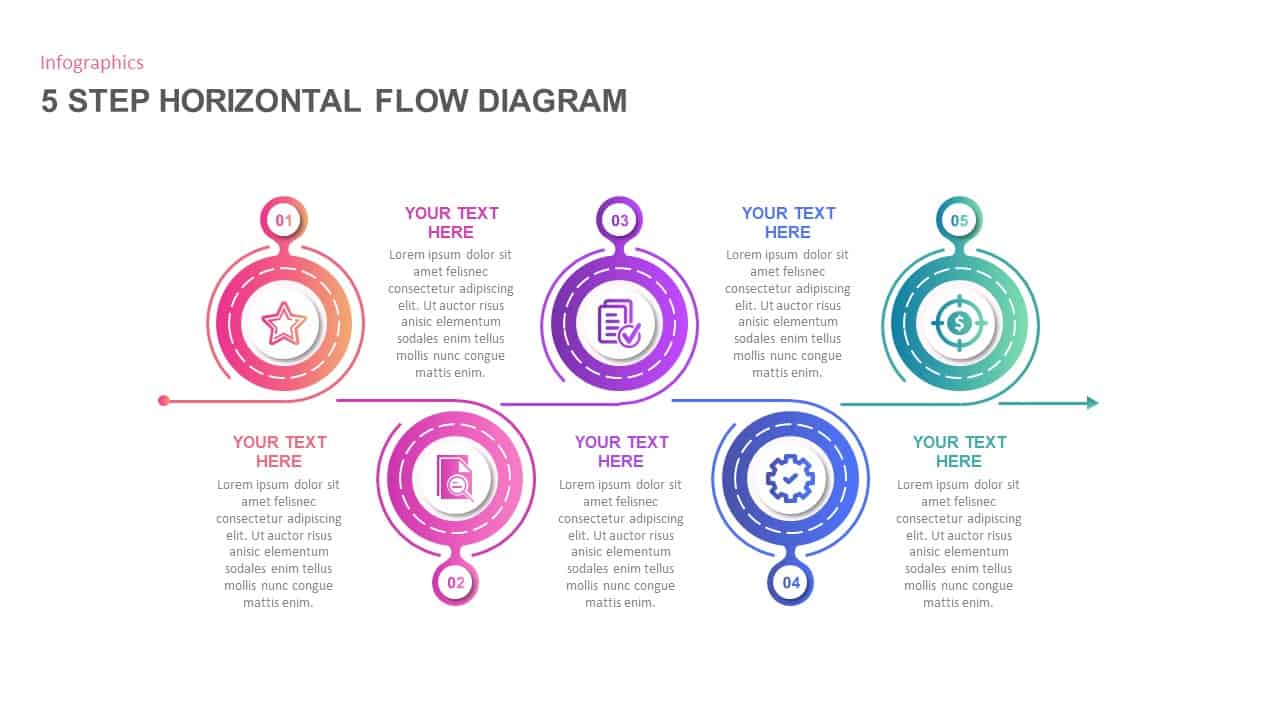
8-Stage Process Flow Flower Diagram Template for PowerPoint & Google Slides
Infographics
Premium
4 Section Pipe Diagram Process Flow Template for PowerPoint & Google Slides
Process
Premium
Dynamic Shield Process Flow Diagram template for PowerPoint & Google Slides
Process
Premium
Six Hexagon Stages Process Flow Diagram Template for PowerPoint & Google Slides
Process
Premium
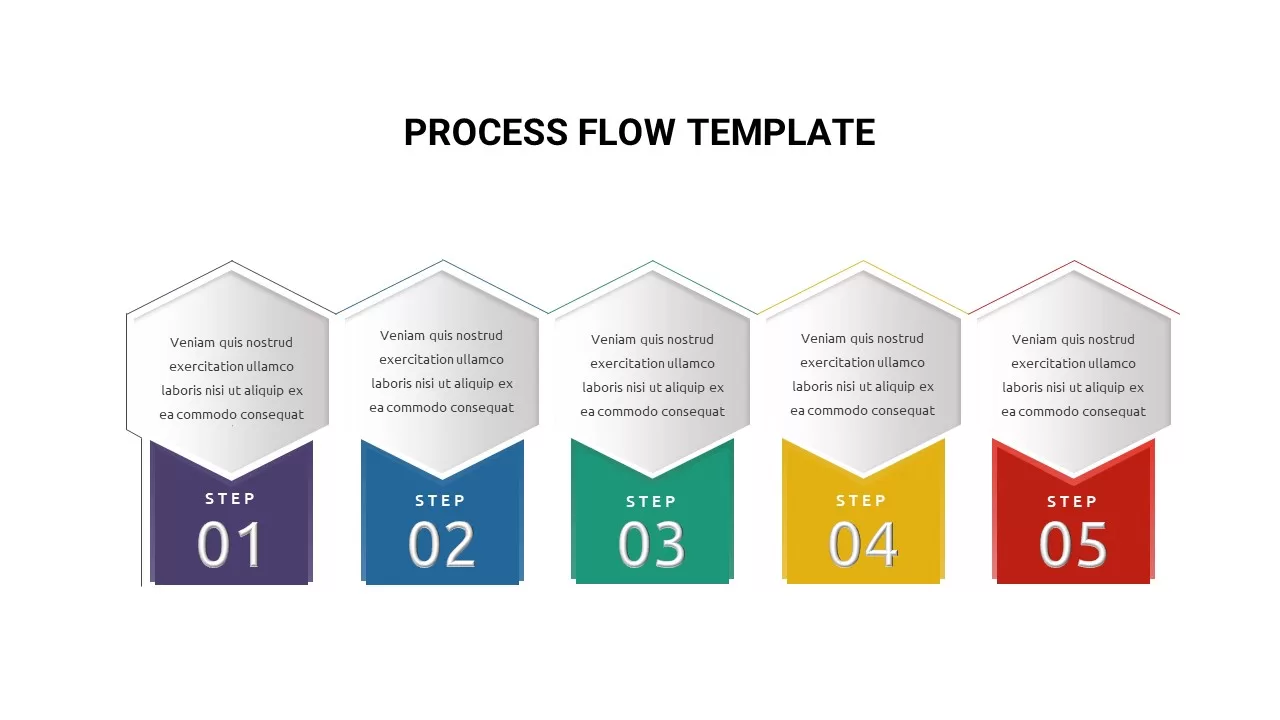
Process Flow Diagram template for PowerPoint & Google Slides
Infographics
Premium

15-Step Process Flow Diagram Template for PowerPoint & Google Slides
Process
Premium
3D Shape Linear Process Flow Diagram Template for PowerPoint & Google Slides
Process
Premium
Linear Process Flow Circles Diagram Template for PowerPoint & Google Slides
Process
Premium
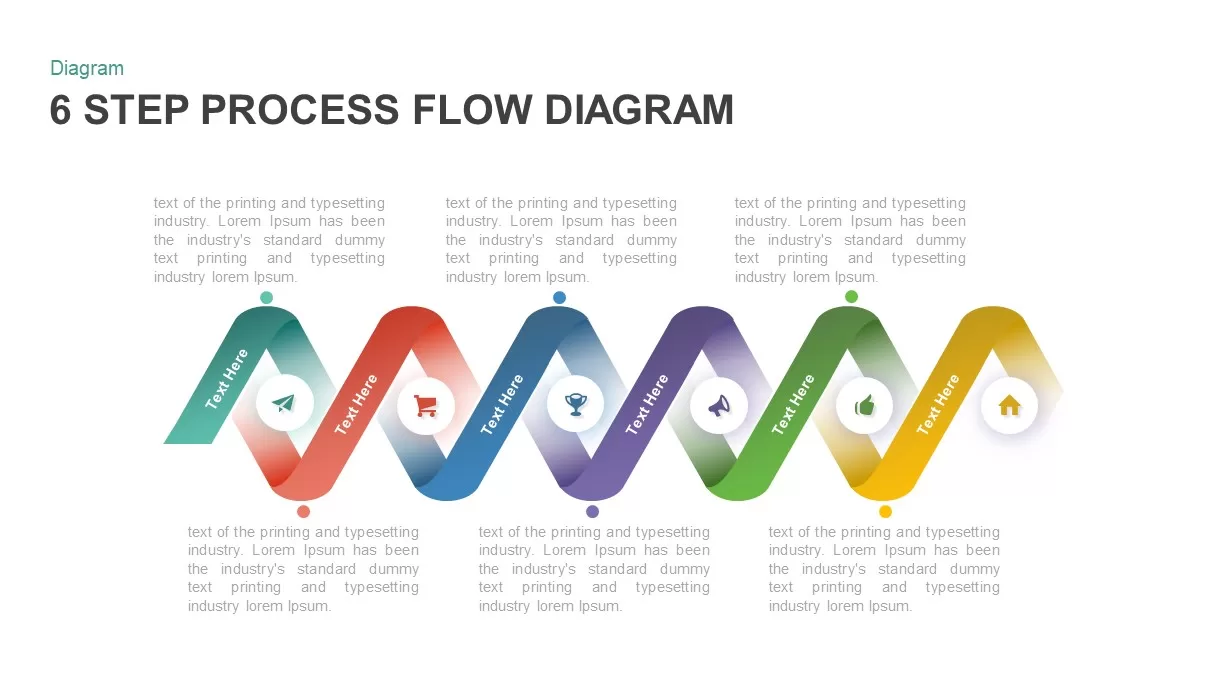
Six-Stage Zig-Zag Process Flow Diagram Template for PowerPoint & Google Slides
Process
Premium
Vertical Business Process Flow Diagram Template for PowerPoint & Google Slides
Process
Premium
Six-Sided Shutter Diagram Process Flow Template for PowerPoint & Google Slides
Process
Premium
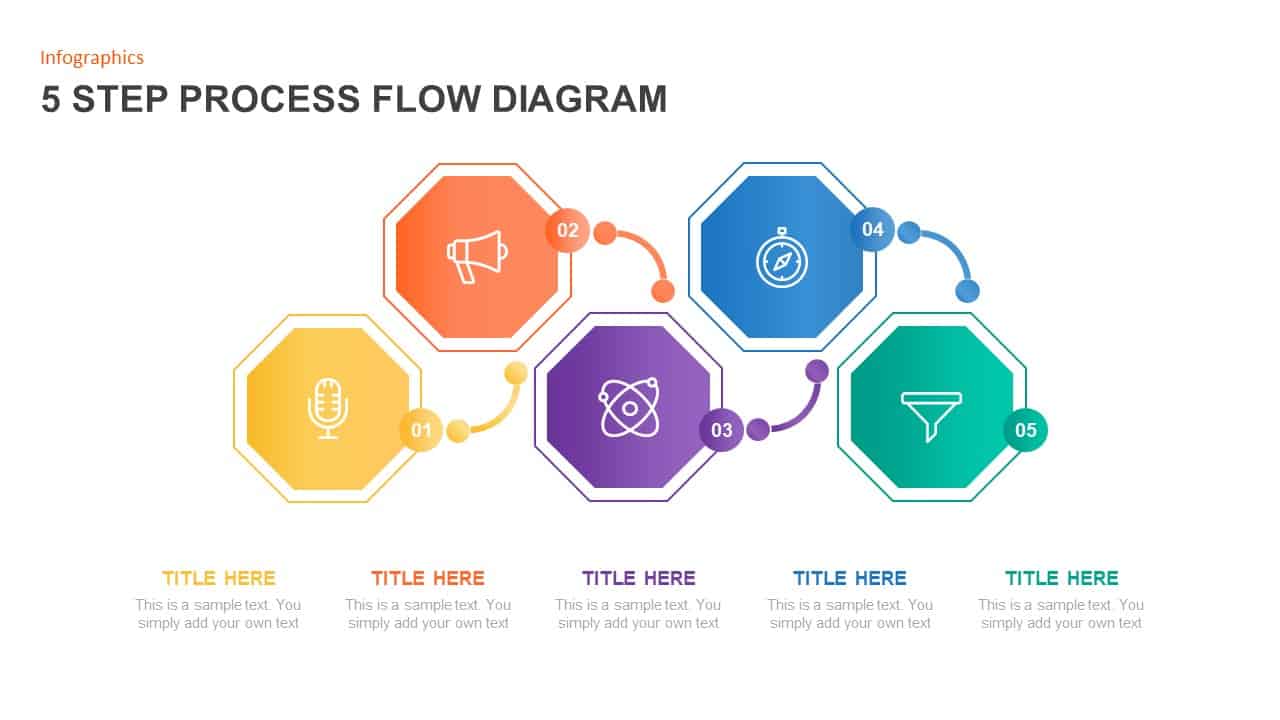
Octagon Stage Process Flow Diagram for PowerPoint & Google Slides
Process
Premium
10 Stages Business Flow Process Diagram template for PowerPoint & Google Slides
Business
Premium

Eight-Stage Radial Process Flow Diagram Template for PowerPoint & Google Slides
Process
Premium
Four-Plus Process Flow Diagram Template for PowerPoint & Google Slides
Process
Premium
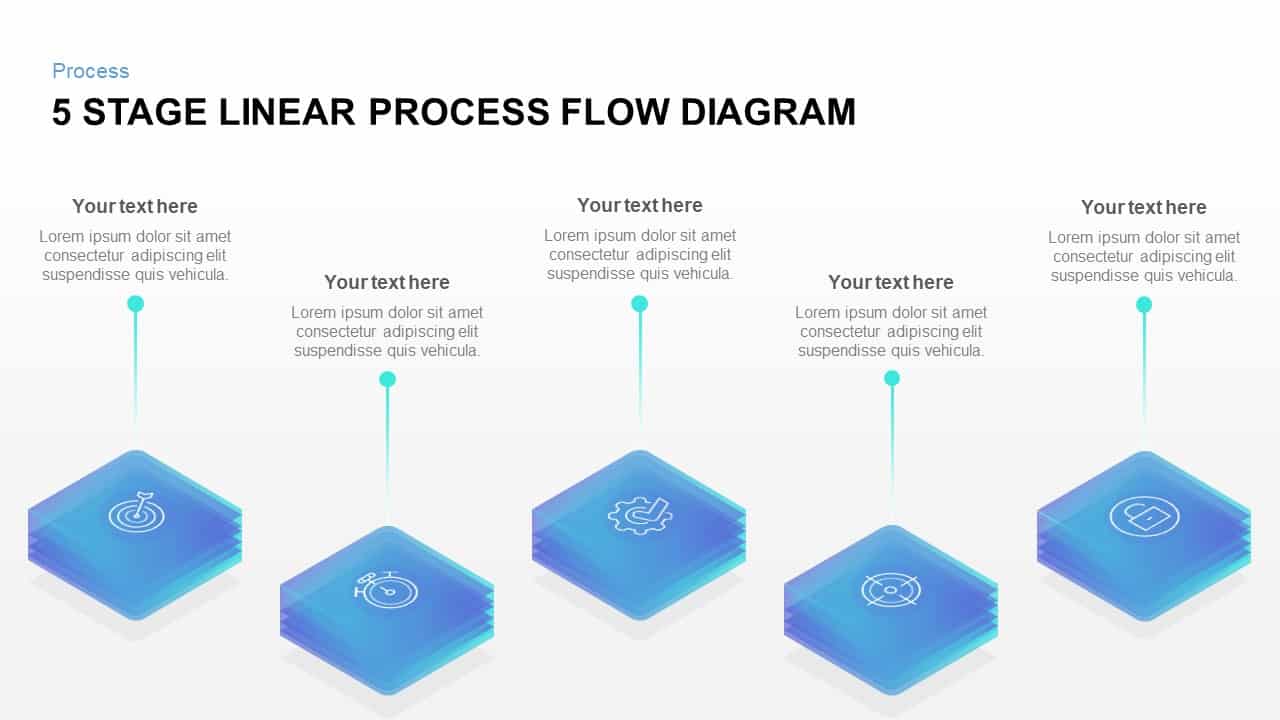
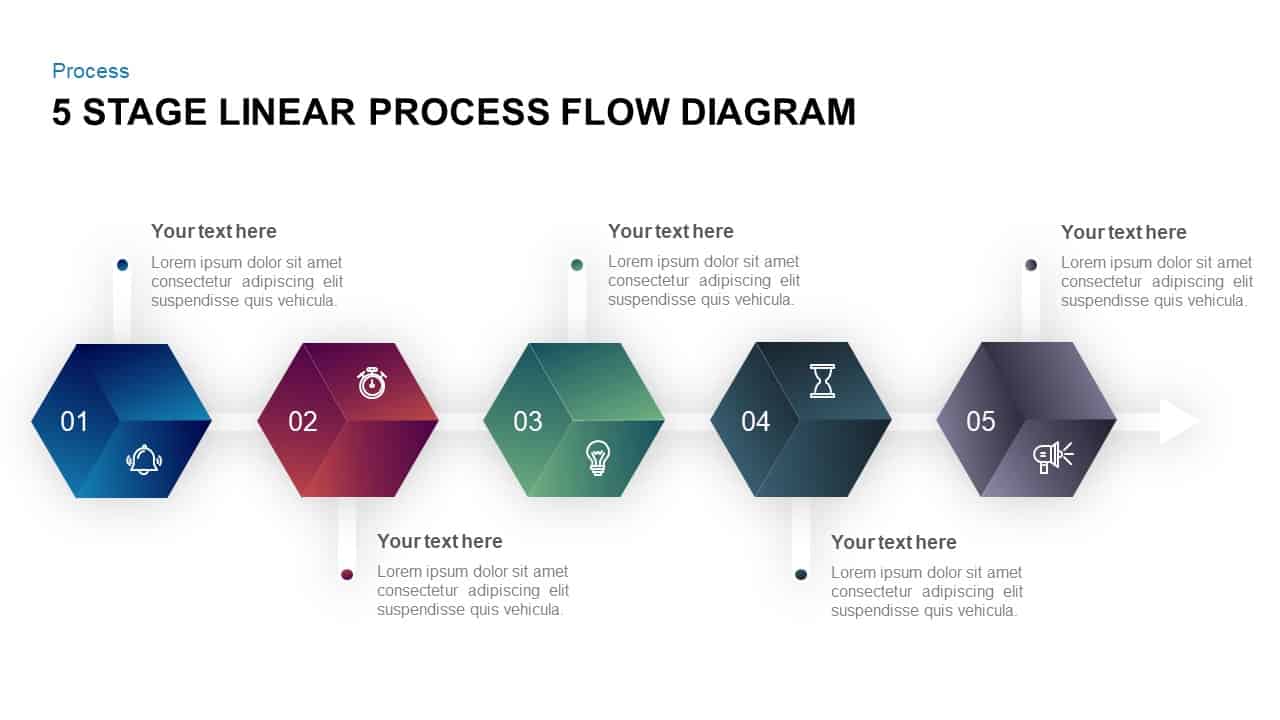
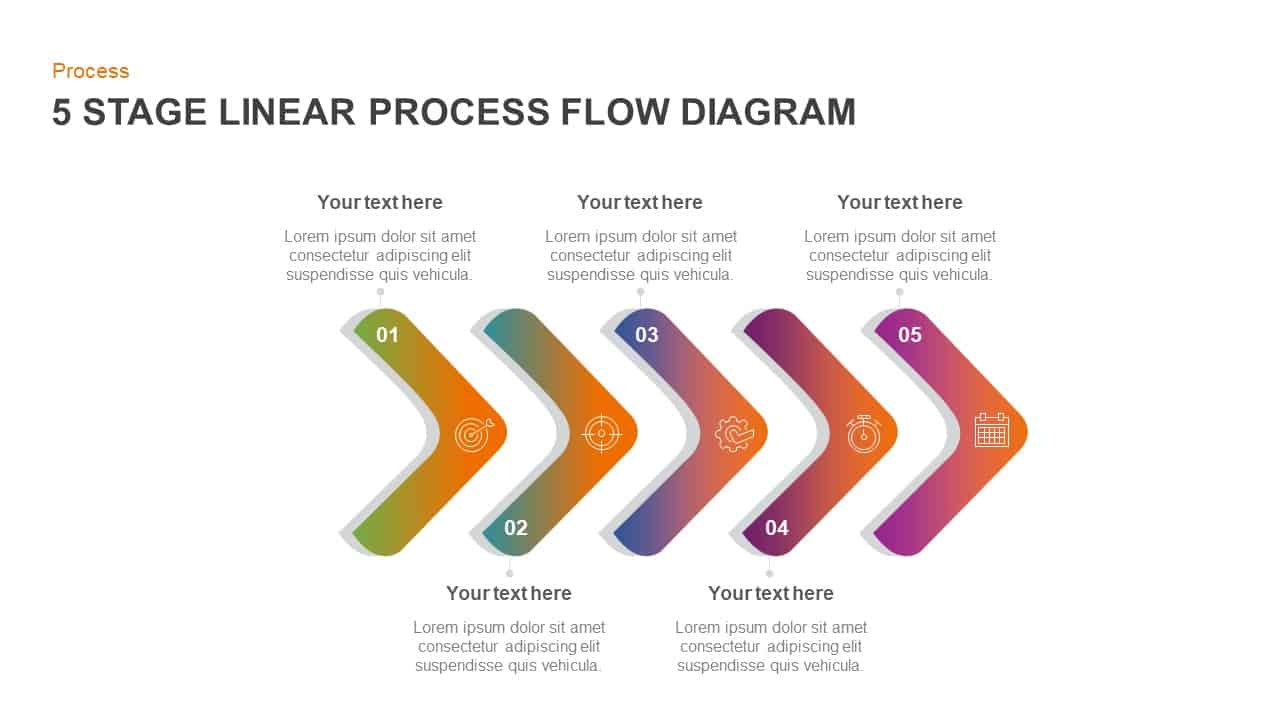
Five Stage Linear Process Flow Diagram Template for PowerPoint & Google Slides
Process
Premium
Five-Stage Linear Process Flow Diagram Template for PowerPoint & Google Slides
Process
Premium
Six-Step Hexagon Process Flow Diagram Template for PowerPoint & Google Slides
Process
Premium
Five-Stage Circular Process Flow Diagram Template for PowerPoint & Google Slides
Circle
Premium
5-Stage Gear Process Flow Diagram Template for PowerPoint & Google Slides
Process
Premium
3D Seven-Stage Process Flow Diagram Template for PowerPoint & Google Slides
Process
Premium
Four-Stage Linear Process Flow Diagram Template for PowerPoint & Google Slides
Process
Premium
5-Stage Linear Process Flow Diagram Template for PowerPoint & Google Slides
Process
Premium
5 Stage Linear Process Flow Diagram Template for PowerPoint & Google Slides
Process
Premium
Five-Stage Process Flow Diagram Template for PowerPoint & Google Slides
Process
Premium
4 Stage Linear Process Flow Diagram Template for PowerPoint & Google Slides
Process
Premium
7 Stage Linear Process Flow Diagram Template for PowerPoint & Google Slides
Process
Premium
8 Step Circular Process Flow Diagram Template for PowerPoint & Google Slides
Process
Premium
4 Stage Linear Process Flow Diagram Template for PowerPoint & Google Slides
Process
Premium
6-Step Business Process Flow Diagram Template for PowerPoint & Google Slides
Process
Premium
6-Step Circular Process Flow Diagram Template for PowerPoint & Google Slides
Process
Premium
4-Stage Linear Process Flow Diagram Template for PowerPoint & Google Slides
Process
Premium
4-Step Linear Process Flow Diagram Template for PowerPoint & Google Slides
Process
Premium
8 Step Linear Process Flow Diagram for PowerPoint & Google Slides
Process
Premium
5 Step Process Flow Diagram for PowerPoint & Google Slides
Process
Premium
Business Process Management Flow Diagram Template for PowerPoint & Google Slides
Process
Premium
Colorful 8-Stage Droplet Process Flow Diagram Template for PowerPoint & Google Slides
Process
Premium
6 Step Process Flow Diagram for PowerPoint & Google Slides
Charts
Premium
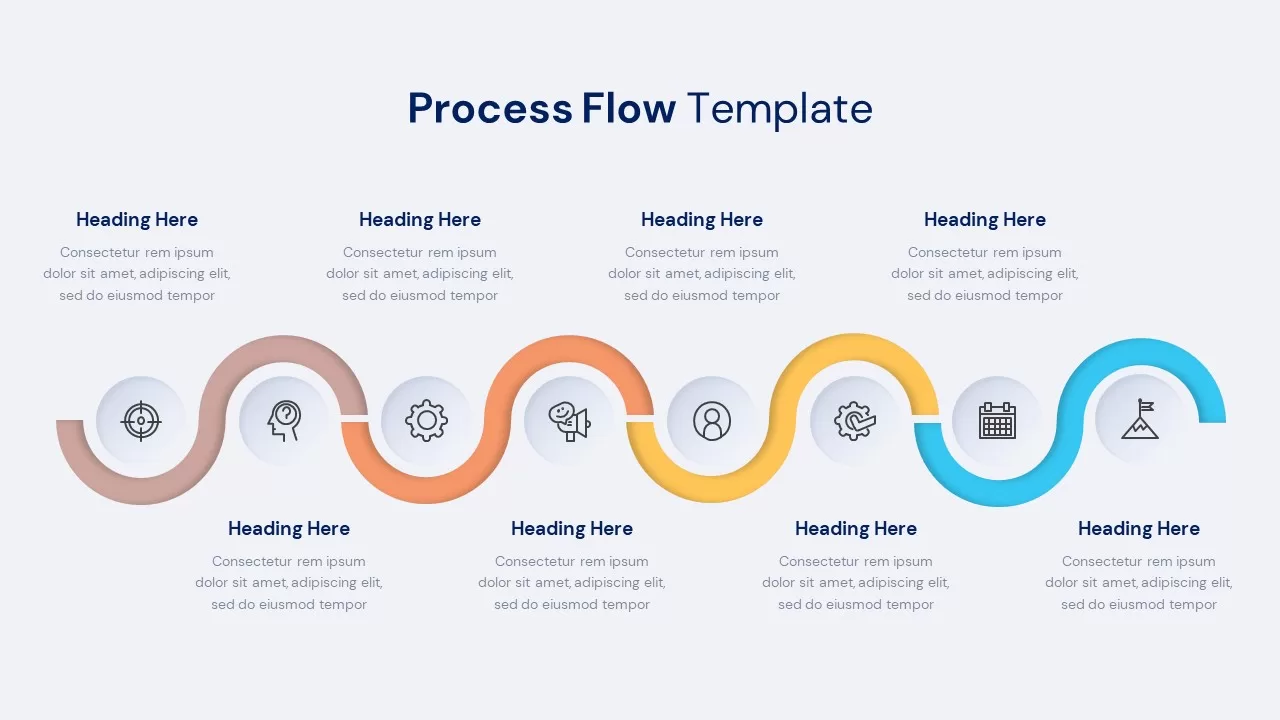
Minimal Process Flow Diagram Infographic Template for PowerPoint & Google Slides
Process
Premium
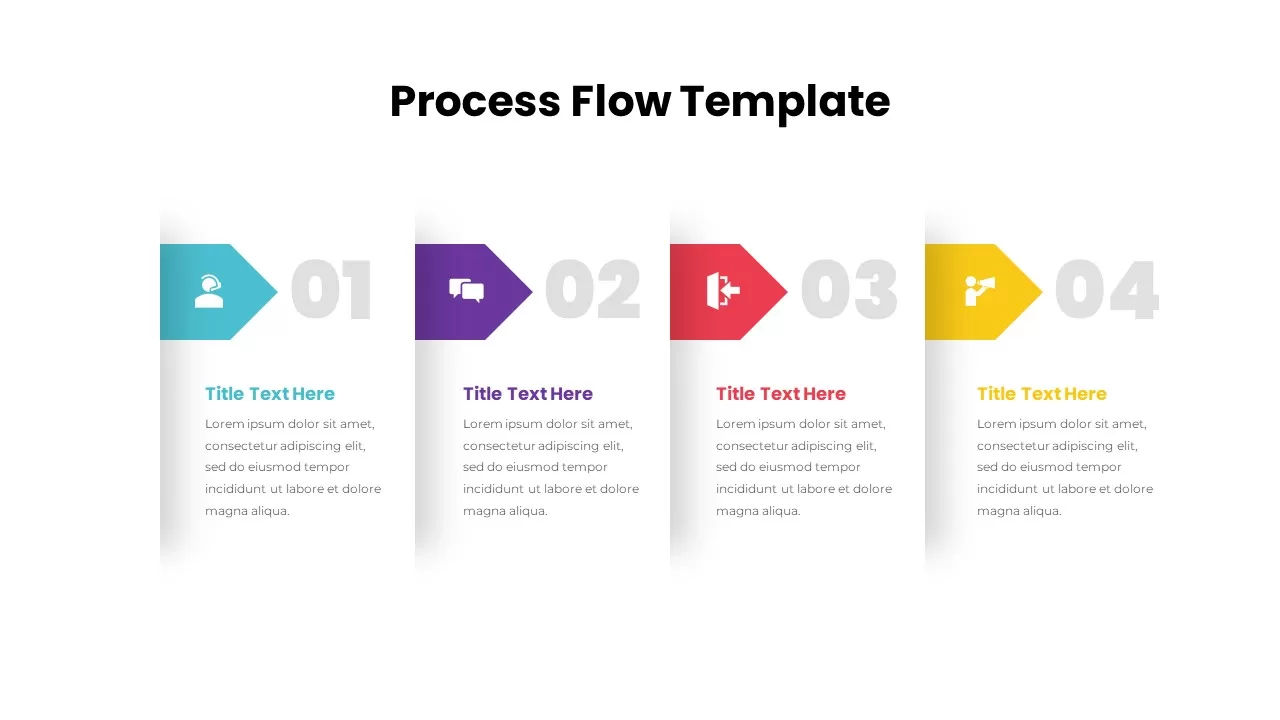
Process Flow Diagram template for PowerPoint & Google Slides
Process
Premium
Curved Arrow Process Flow Diagram Template for PowerPoint & Google Slides
Process
Premium
Curved Arrow Process Flow Diagram Template for PowerPoint & Google Slides
Arrow
Premium
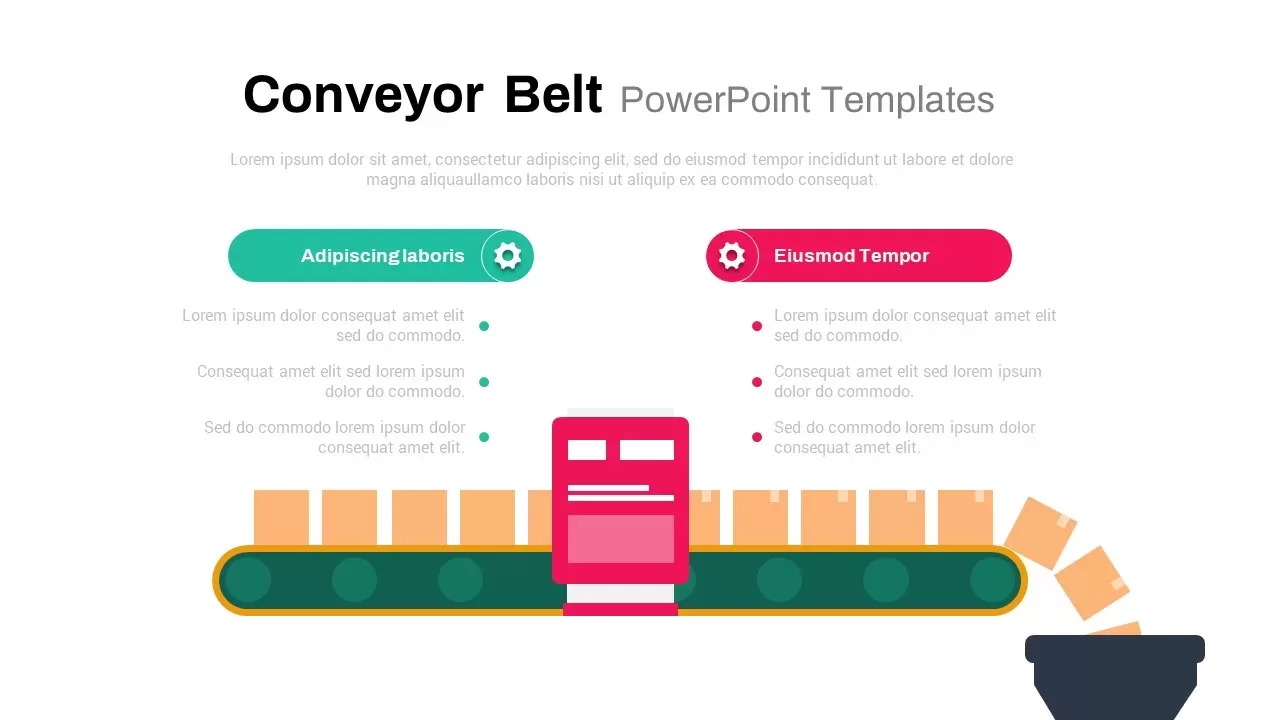
3D Conveyor Belt Process Flow Diagram Template for PowerPoint & Google Slides
Process
Premium
E-Waste Management Process Flow Diagram Template for PowerPoint & Google Slides
Process
Premium
Comprehensive Process Flow Diagram Template for PowerPoint & Google Slides
Process
Premium
Animated Gears Process Flow Diagram Template for PowerPoint & Google Slides
Process
Premium
Capital Investments Process Flow Diagram Template for PowerPoint & Google Slides
Process
Premium
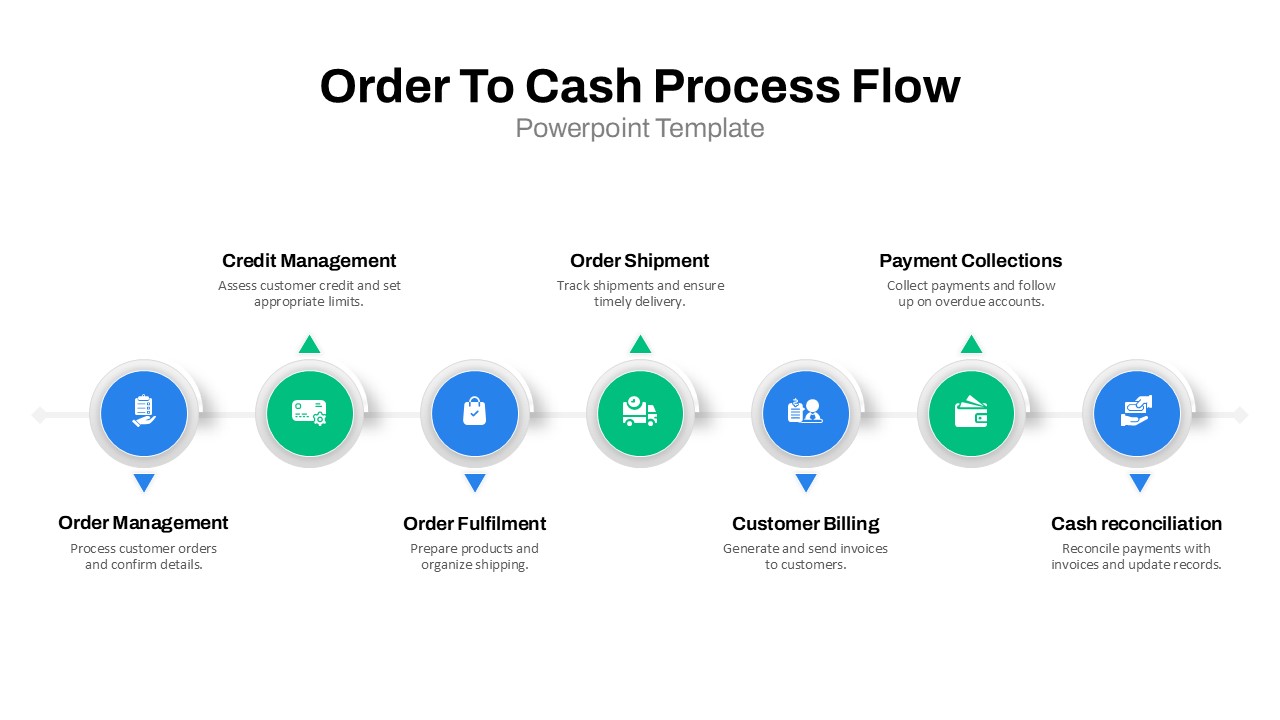
Order to Cash Process Flow Diagram Template for PowerPoint & Google Slides
Process
Premium
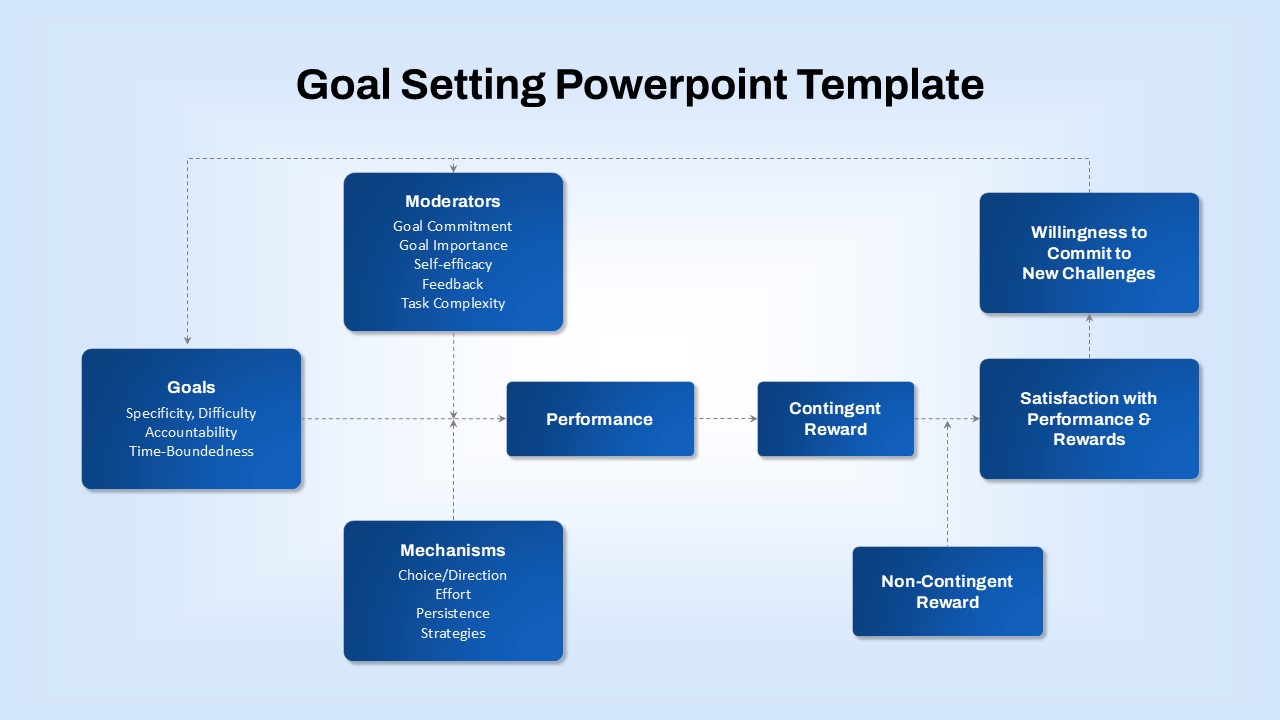
Goal-Setting Process Flow Diagram Template for PowerPoint & Google Slides
Goals
Premium
Resume Screening Process Flow Diagram Template for PowerPoint & Google Slides
Process
Premium
Q-Learning Process Flow Diagram Template for PowerPoint & Google Slides
Process
Premium
5-Stage Arrow Infographics Process Flow Template for PowerPoint & Google Slides
Arrow
Premium
Isometric Five-Stage Process Flow Template for PowerPoint & Google Slides
Process
Premium
Five-Step Hexagonal Process Flow Template for PowerPoint & Google Slides
Process
Premium
Gradient Chevron Five-Stage Process Flow Template for PowerPoint & Google Slides
Arrow
Premium
5-Step Circular Gradient Process Flow Template for PowerPoint & Google Slides
Process
Premium
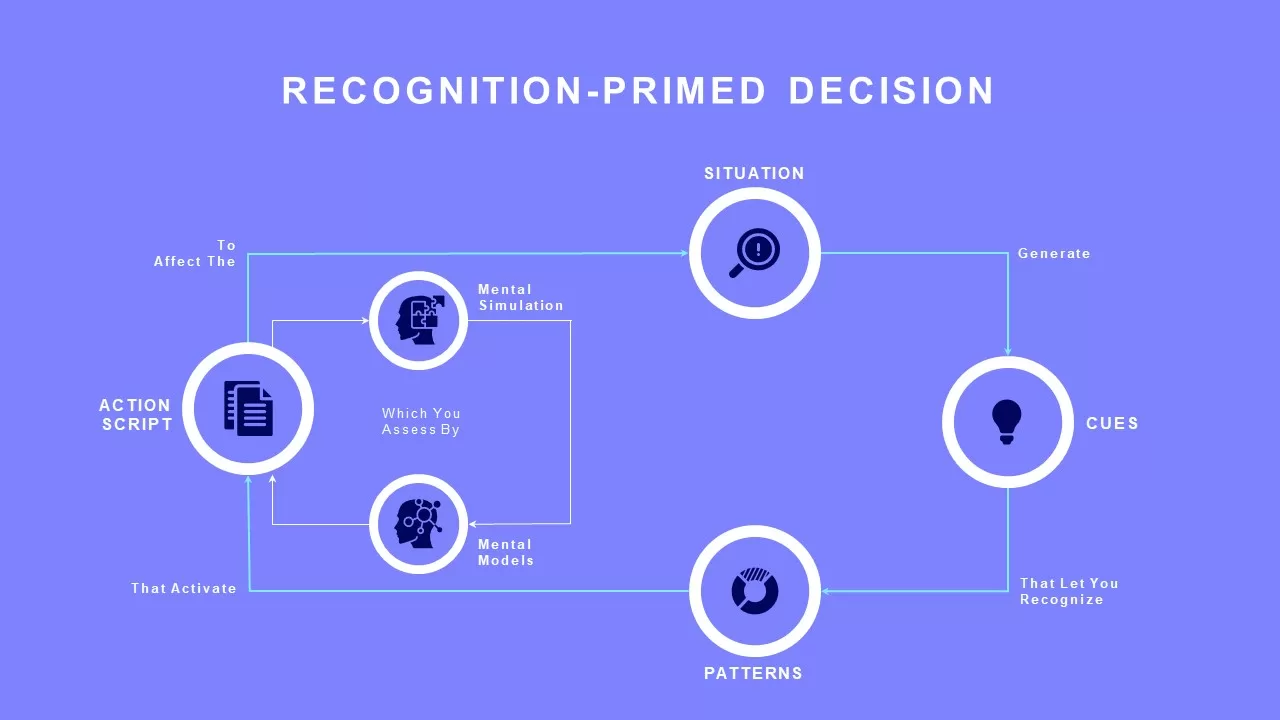
Recognition-Primed Decision Process Flow Template for PowerPoint & Google Slides
Flow Charts
Premium
Free Colorful Process Flow Infographics Template for PowerPoint & Google Slides
Process
Free
Process Flow Steps template for PowerPoint & Google Slides
Business Plan
Premium
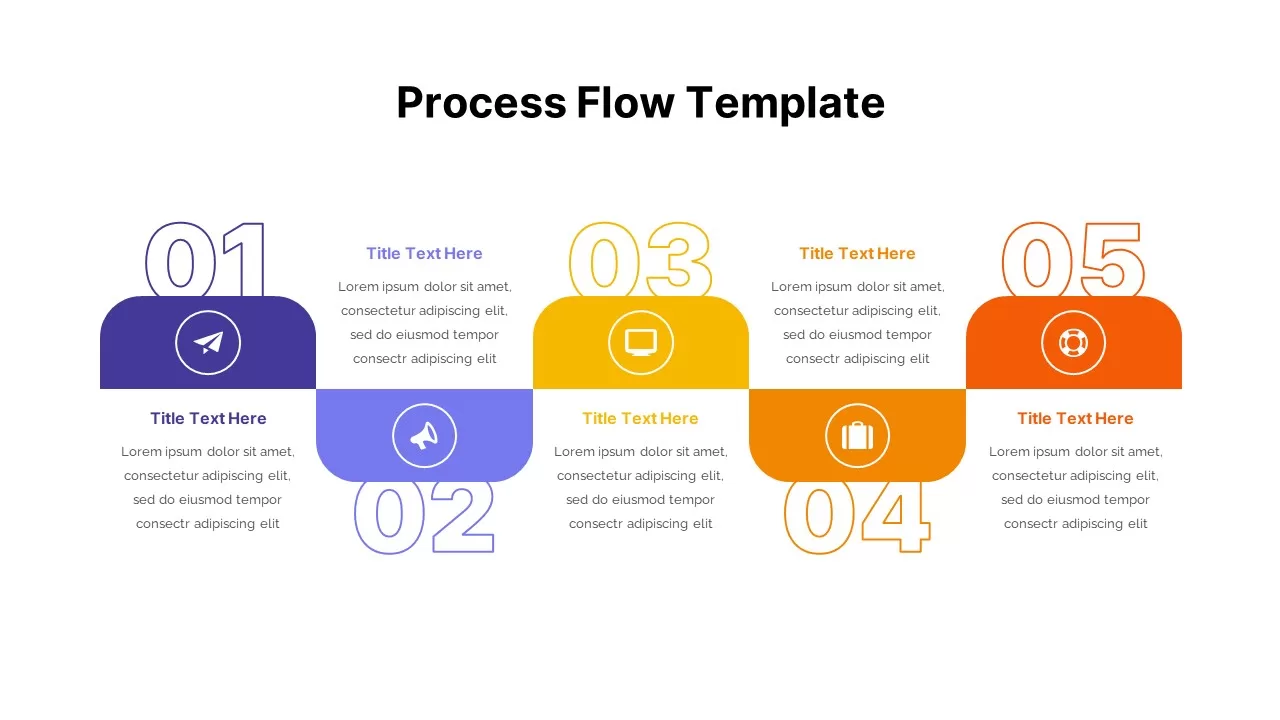
Process Flow Template for PowerPoint & Google Slides
Process
Premium
5 Stage Process Flow Overview template for PowerPoint & Google Slides
Process
Premium
Curved Arrow Process Flow Infographic Template for PowerPoint & Google Slides
Process
Premium
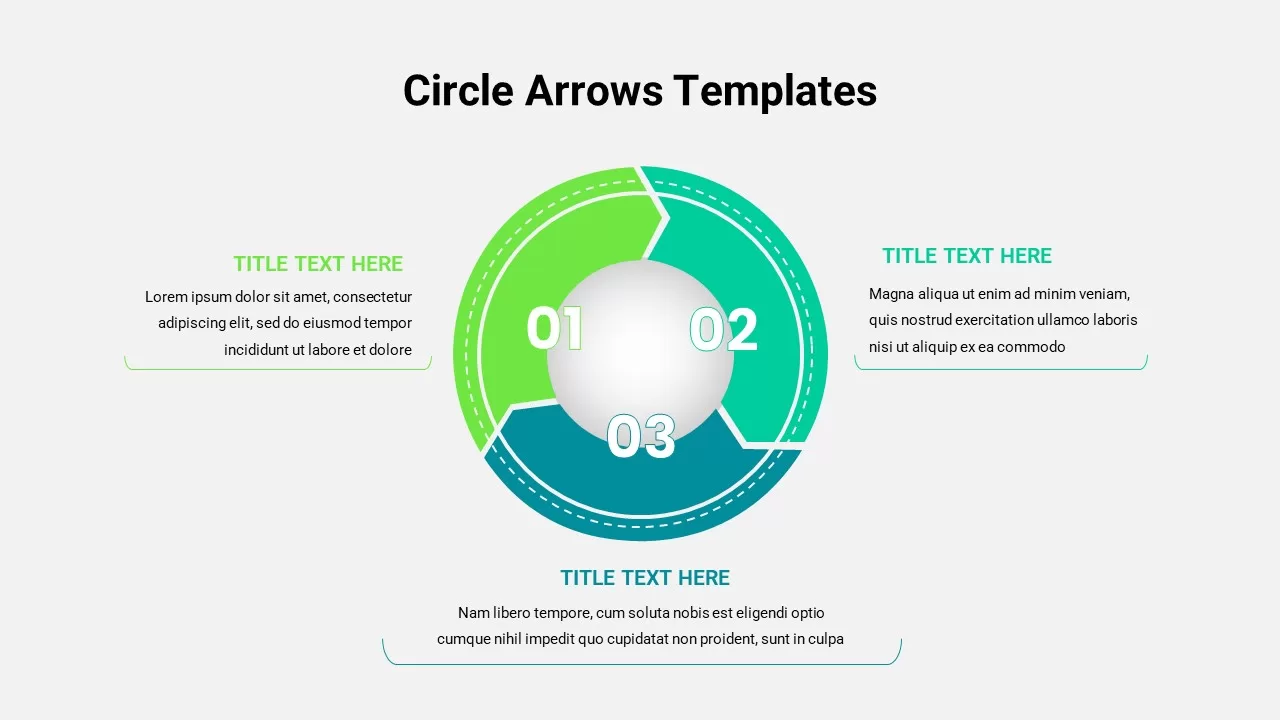
Circle Arrows Process Flow template for PowerPoint & Google Slides
Process
Premium
Circular Arrows Process Flow template for PowerPoint & Google Slides
Process
Premium
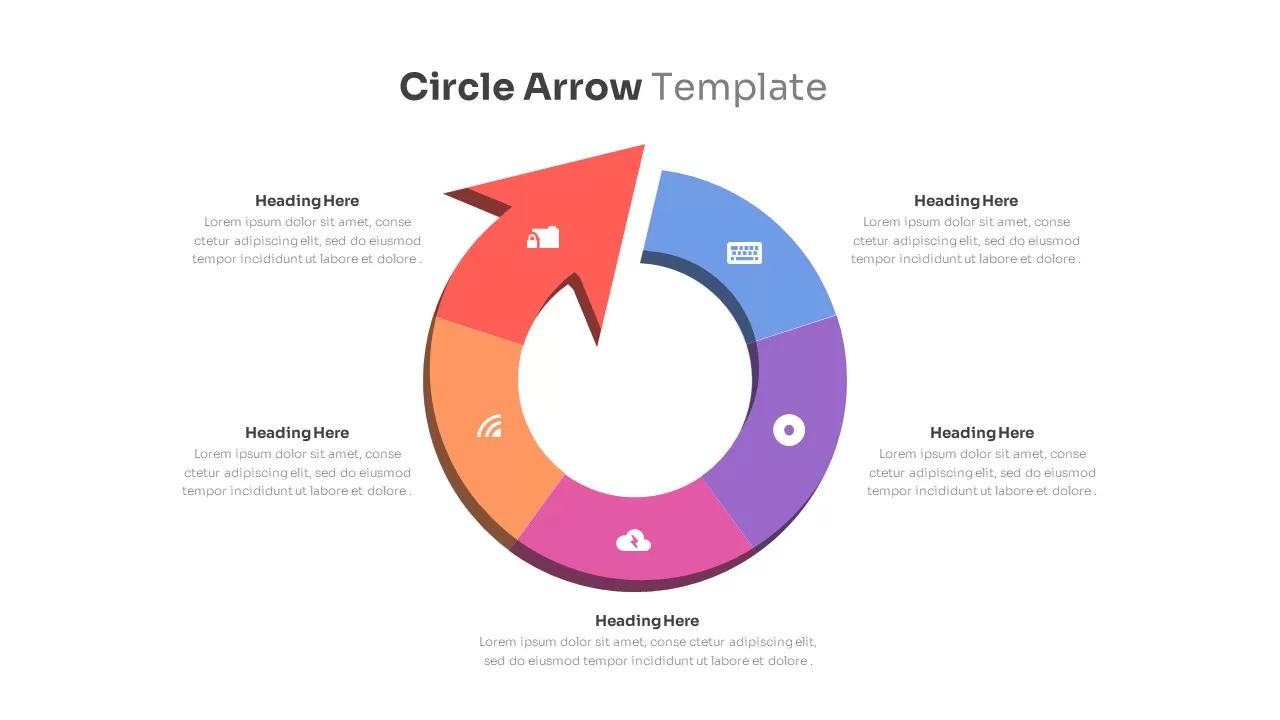
Circle Arrow Process Flow template for PowerPoint & Google Slides
Process
Premium
Hexagonal Process Flow Template for PowerPoint & Google Slides
Process
Premium
Dynamic Conveyor Belt Process Flow Template for PowerPoint & Google Slides
Process
Premium
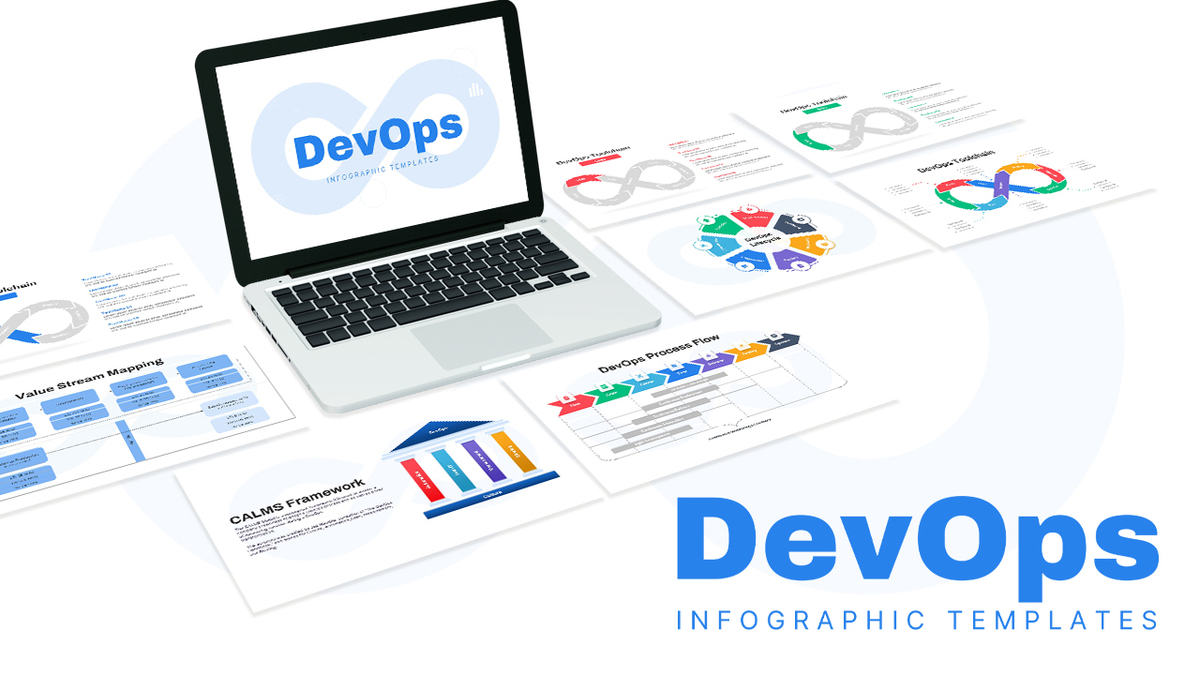
DevOps Infographics & Process Flow Template for PowerPoint & Google Slides
Information Technology
Premium
Wastewater Treatment Process Flow Chart Template for PowerPoint & Google Slides
Flow Charts
Premium
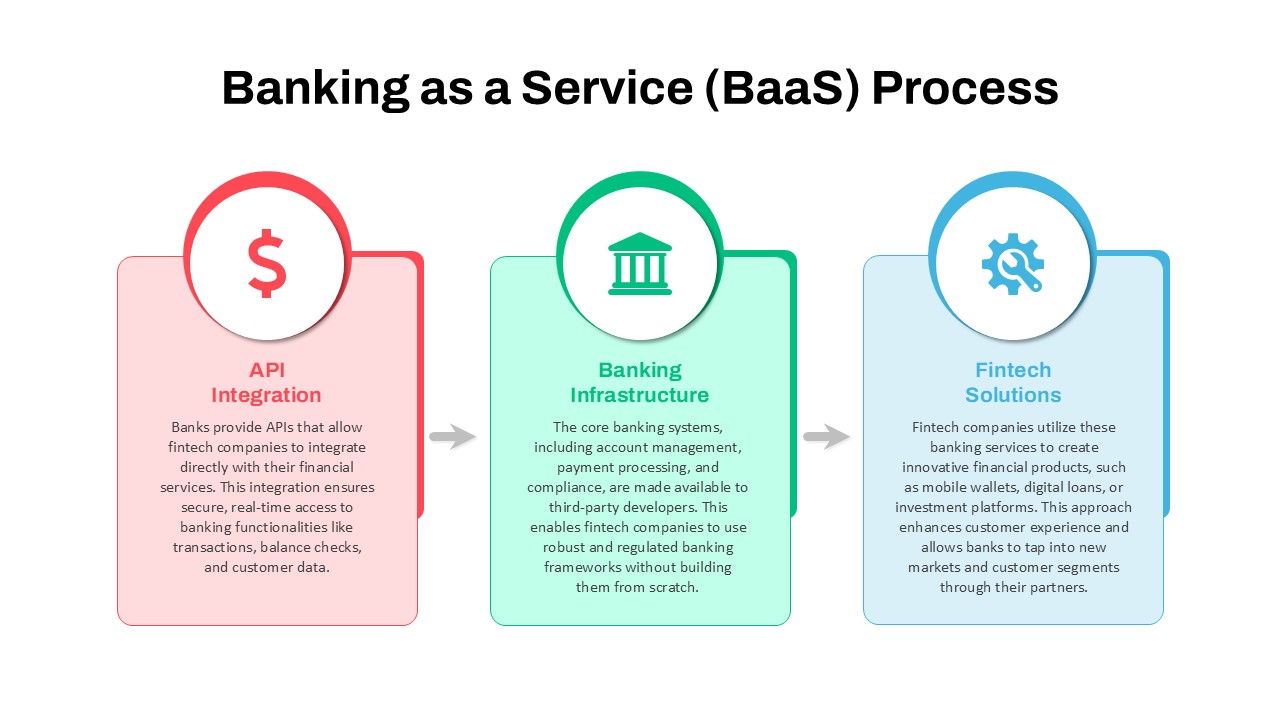
Banking as a Service (BaaS) Process Flow Template for PowerPoint & Google Slides
Process
Premium
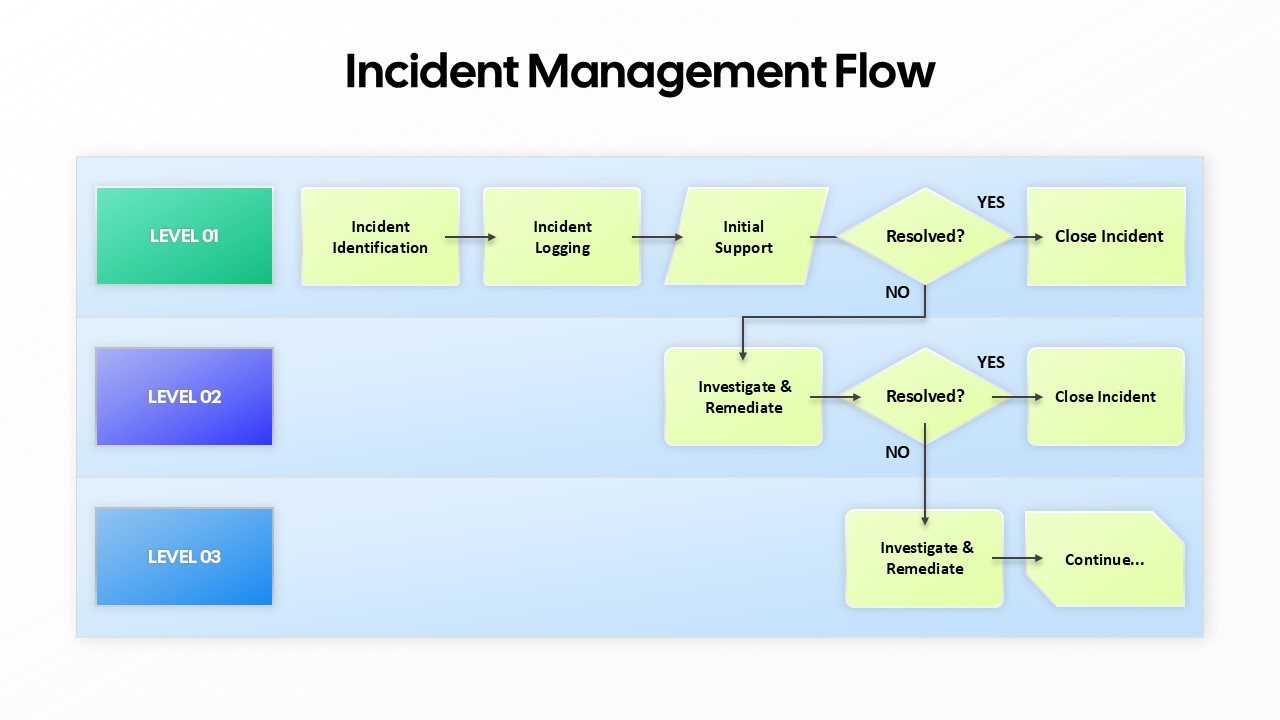
Incident Management Flow Process template for PowerPoint & Google Slides
Flow Charts
Premium