Company Growth template for PowerPoint & Google Slides


Description
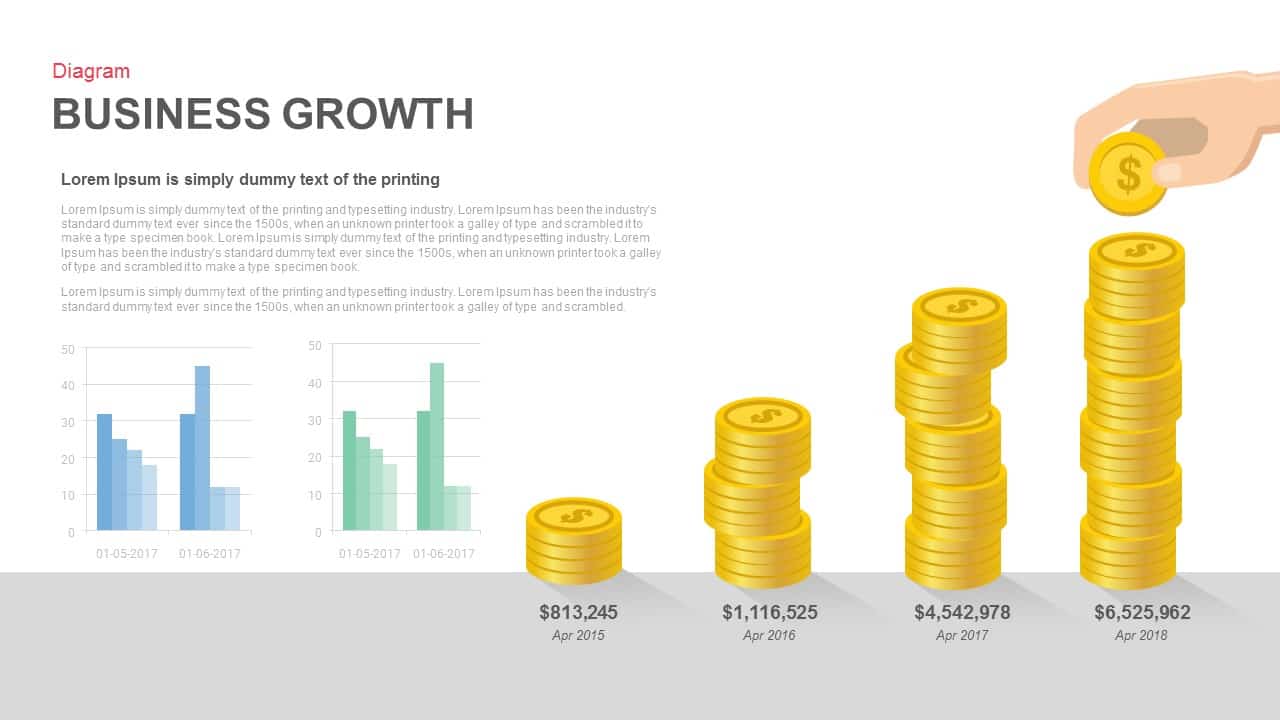
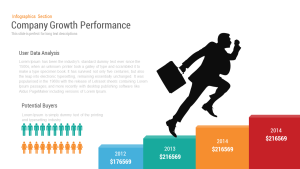
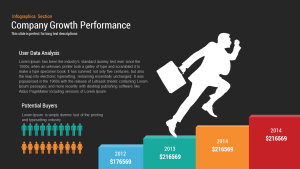
This Company Growth template presents a dynamic staircase bar chart illustrating annual revenue or performance metrics. On the right side, four ascending bars use distinct accent colors—blue, green, orange, and red—and display year and revenue placeholders (e.g., 2012 $176,569; 2013 $216,569; 2014 $216,569; 2015 $XX,XXX). A sleek silhouette of a business professional vaulting across the bars reinforces themes of upward momentum, success, and strategic progress.
On the left, a customizable content panel begins with a “User Data Analysis” headline and space for a rich text narrative, followed by a “Potential Buyers” section that features icon rows (male and female silhouettes) to convey demographic or audience breakdowns. Master slide integration enables global updates to theme colors, typography via free web fonts, and vector-based assets. Swap the professional figure for alternative graphics, adjust bar dimensions to reflect actual data, and replace demographic icons to suit any context.
The slide supports both 16:9 widescreen and 4:3 aspect ratios, ensuring clarity on HD projectors, retina displays, and virtual meeting backgrounds. Subtle drop shadows, precise alignment grids, and generous white space maintain a polished, professional aesthetic. Hidden variation slides include alternate color themes, bar count options, and layout rotations for rapid theme switches. Drag-and-drop placeholders simplify data and icon swaps, and built-in animation presets guide viewers along the growth narrative. Whether reporting financial results, sales milestones, or KPI trends, this template accelerates the creation of business-focused presentations with zero design headaches.
Who is it for
Small business owners, financial analysts, sales managers, and corporate strategists who need to showcase year-over-year growth or performance milestones. Consultants, entrepreneurs, and marketing teams can leverage the design for investor pitches, annual reviews, and stakeholder updates.
Other Uses
Repurpose this layout to illustrate project roadmaps, product launch timelines, or departmental KPIs. Swap the silhouette for icons or photos to represent team achievements, market expansions, or strategic initiatives.
Login to download this file

Item ID
SB00047
Related Templates

Growth Arrow for Progress & Growth template for PowerPoint & Google Slides
Arrow
Premium

Growth Timeline template for PowerPoint & Google Slides
Timeline
Premium
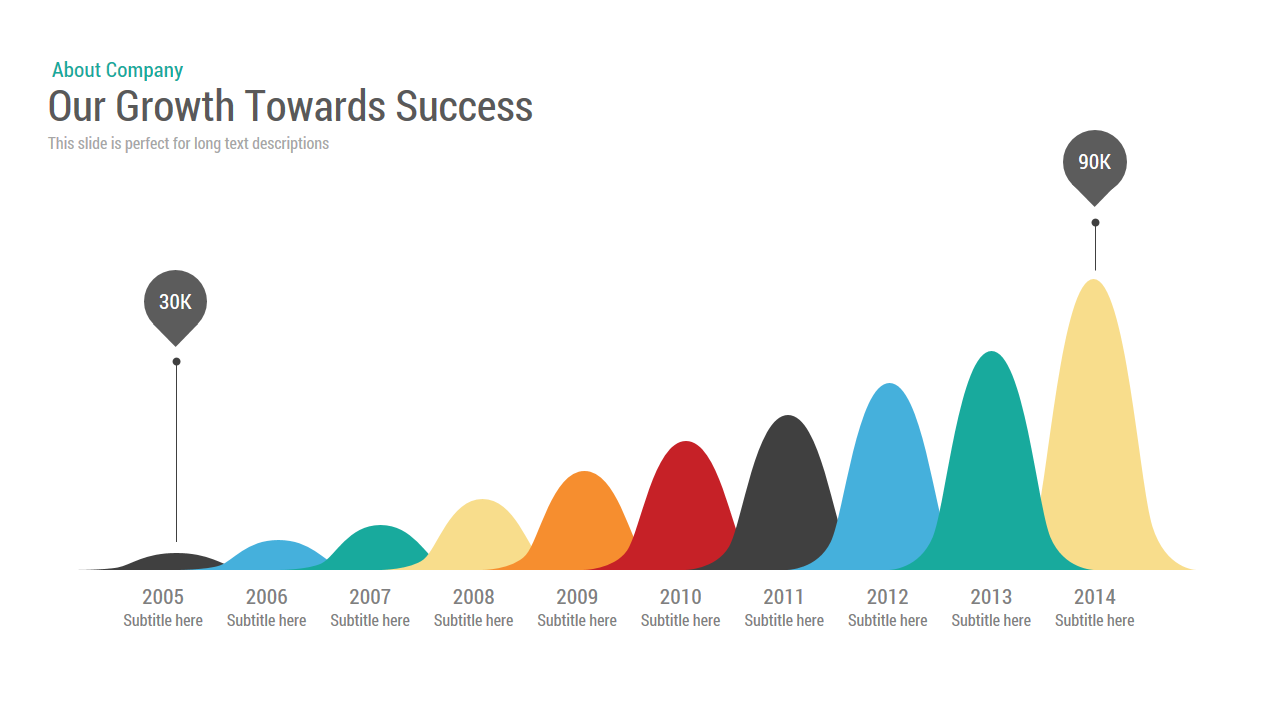
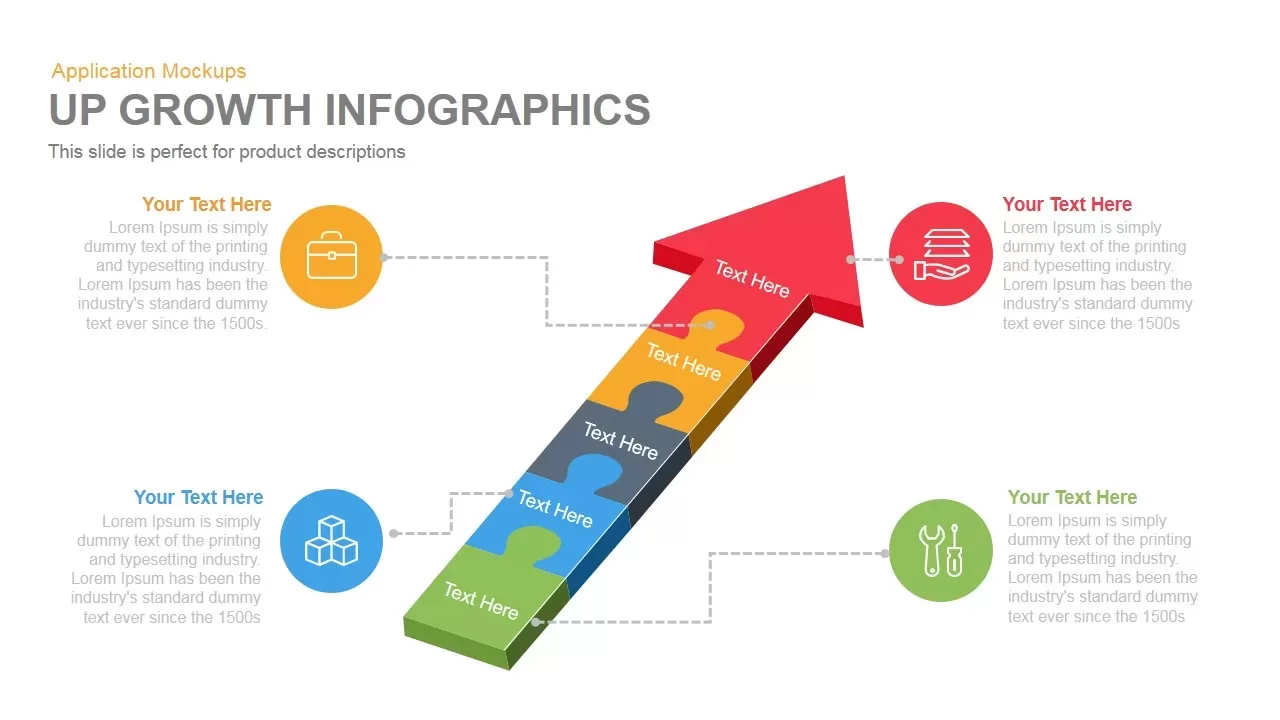
Growth Infographics template for PowerPoint & Google Slides
Arrow
Premium
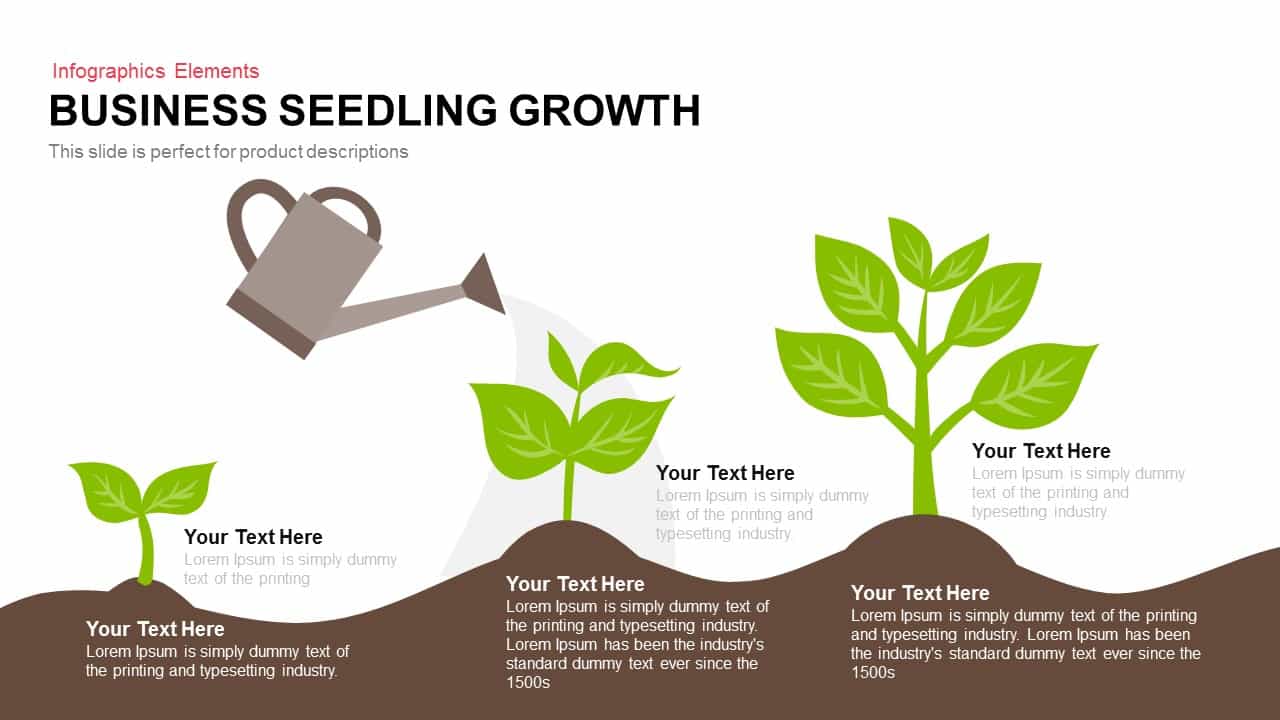
Business Seedling Growth Template for PowerPoint & Google Slides
Infographics
Premium
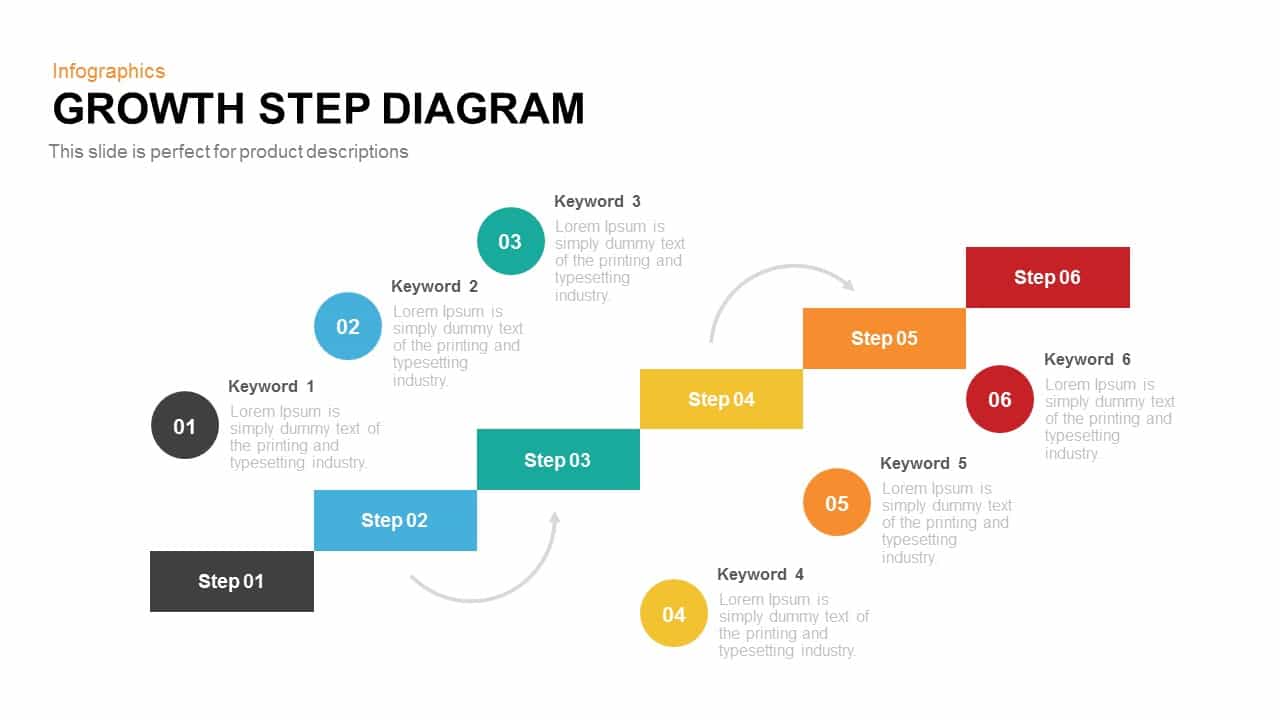
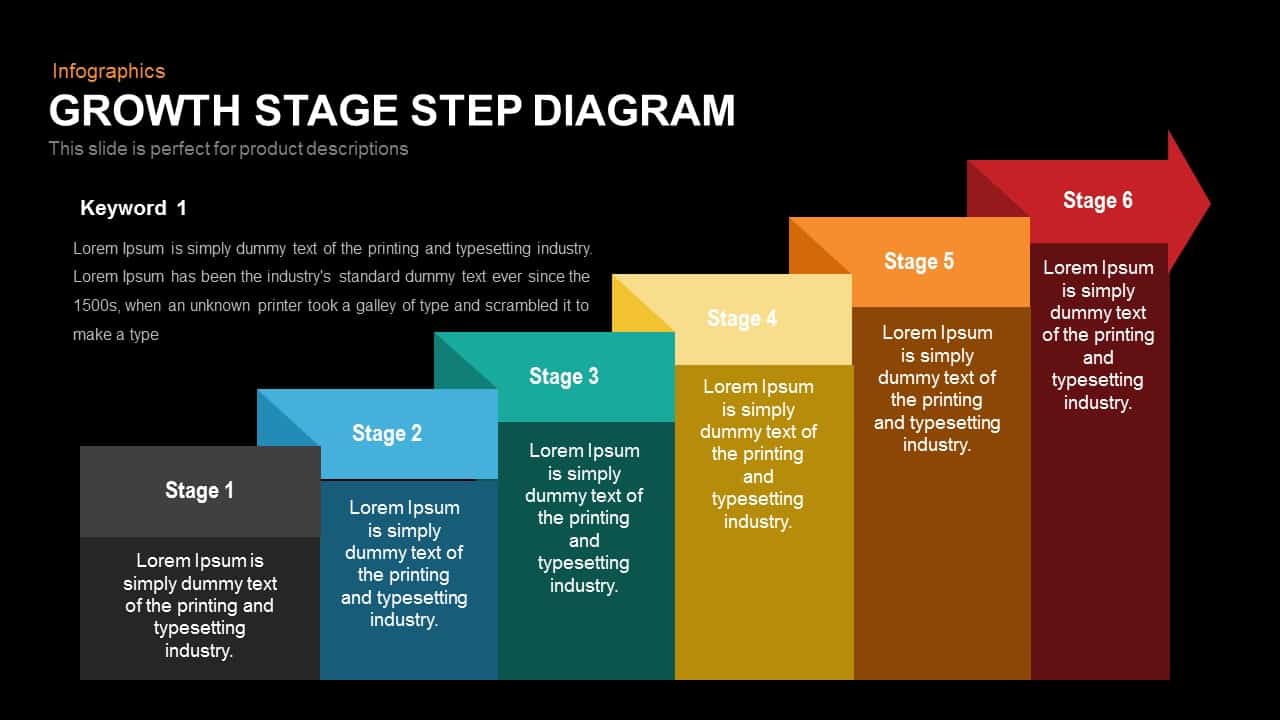
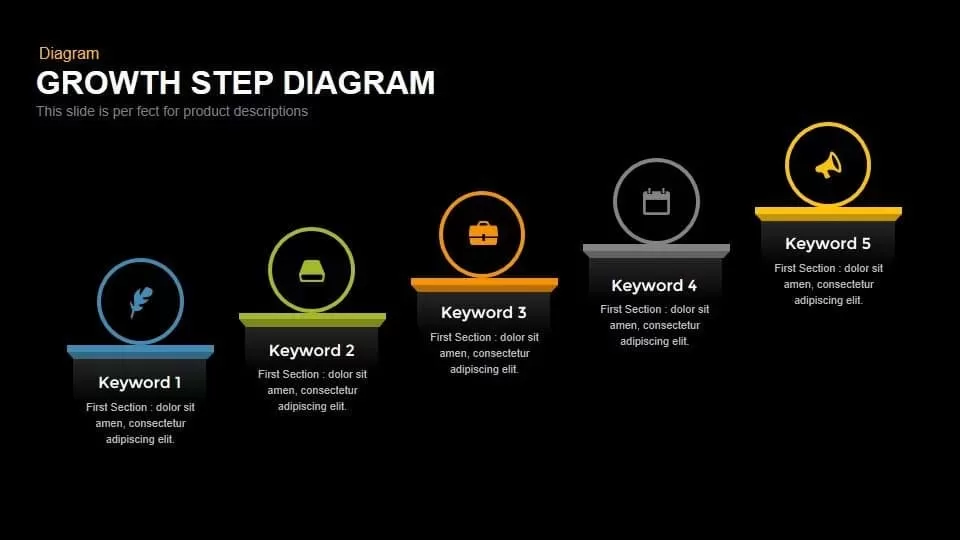
Growth Step Diagram template for PowerPoint & Google Slides
Infographics
Premium
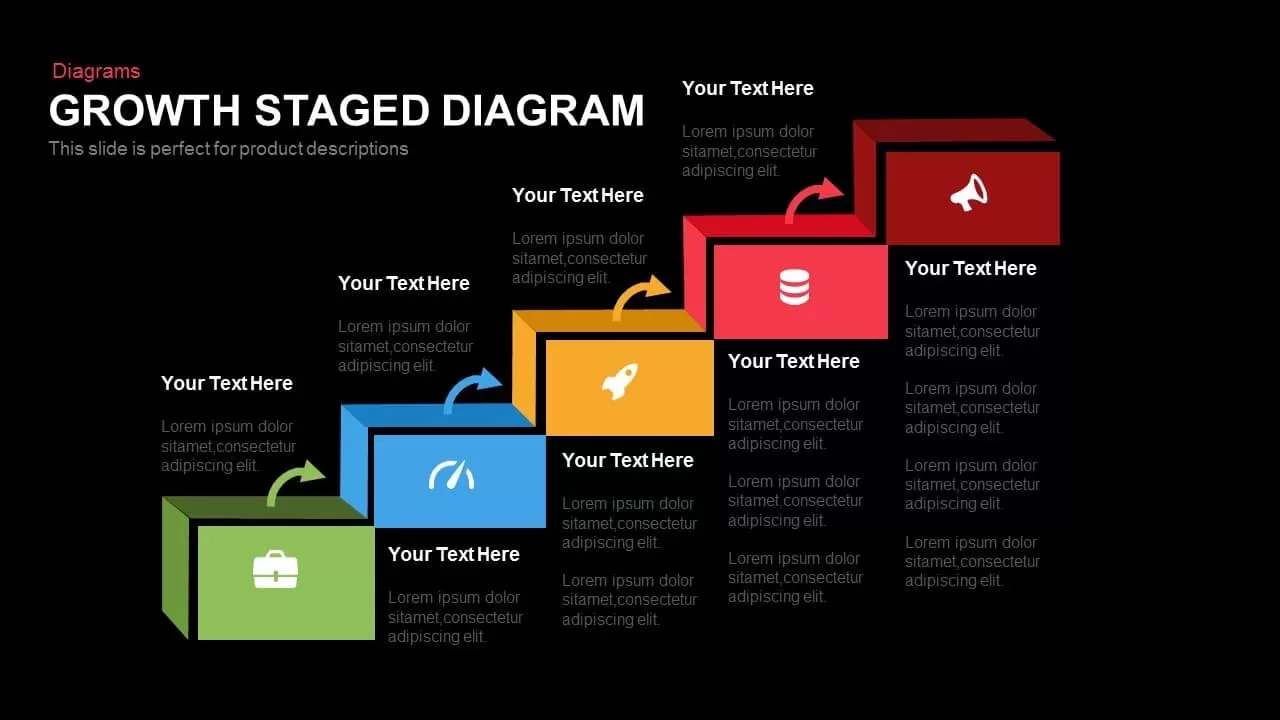
Growth Stage Diagram template for PowerPoint & Google Slides
Process
Premium
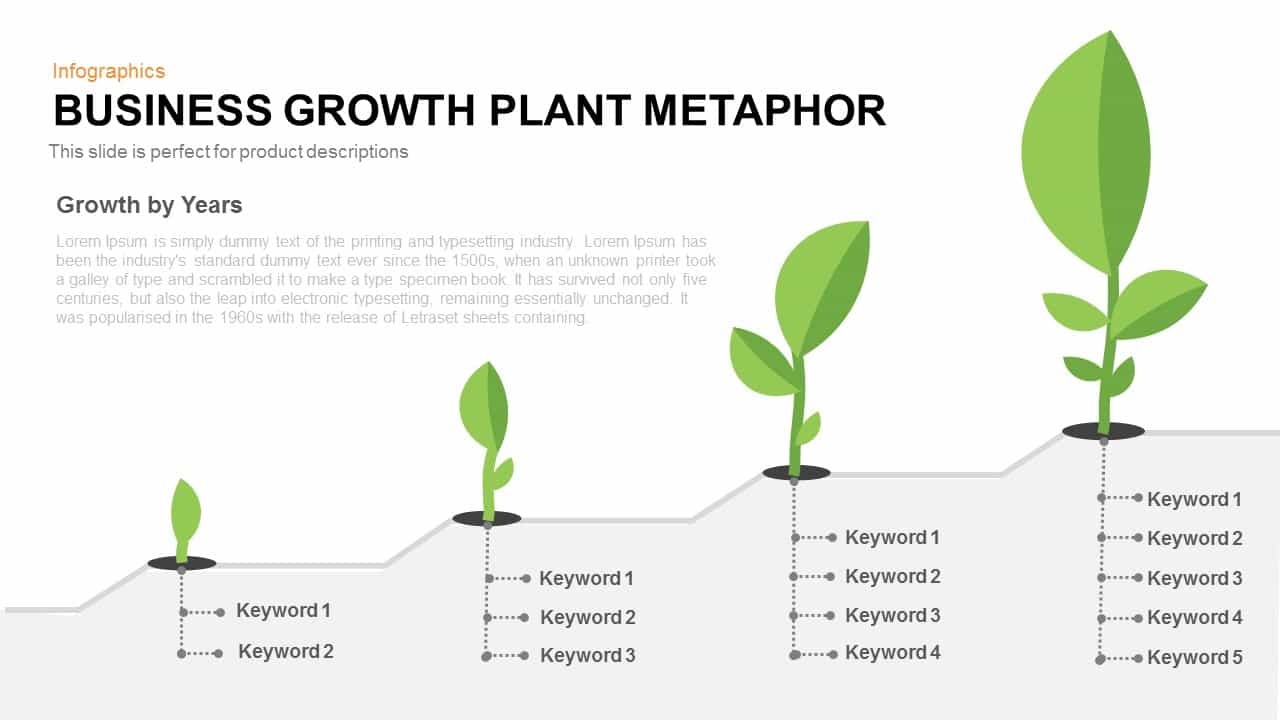
Business Growth Plant Metaphor Timeline Template for PowerPoint & Google Slides
Business Strategy
Premium
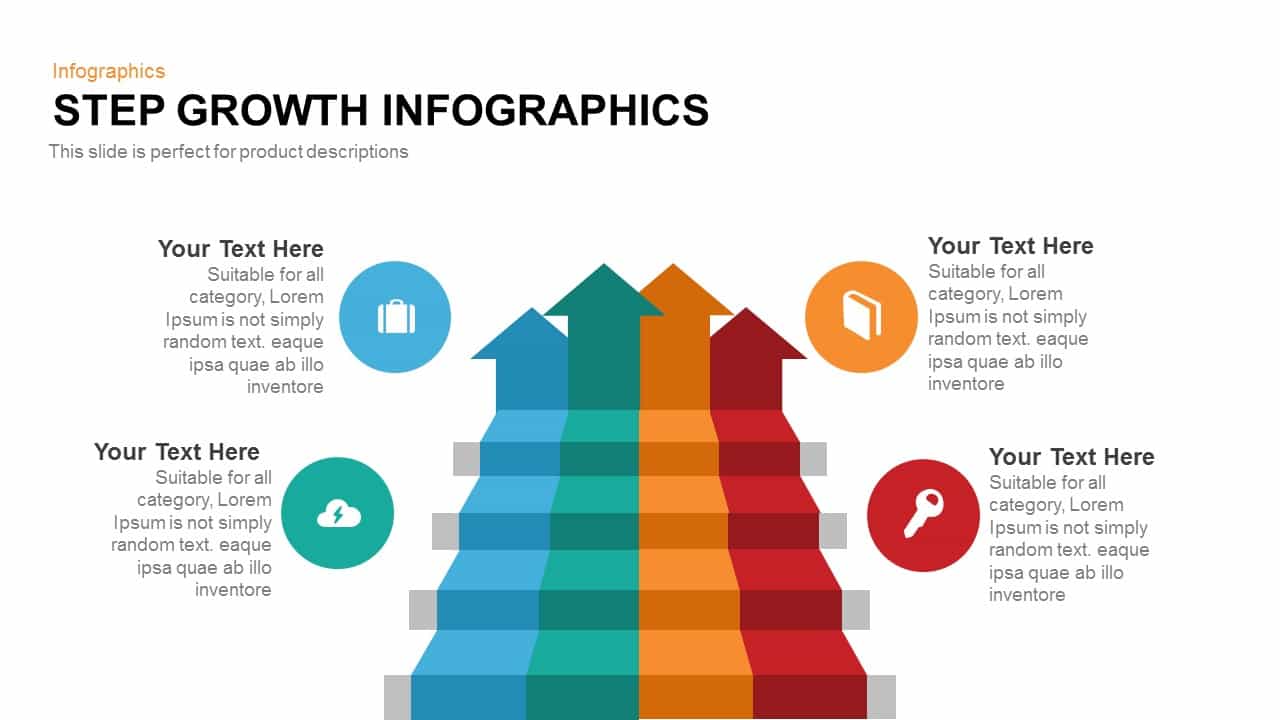
Modern Step Growth Infographics Template for PowerPoint & Google Slides
Process
Premium
Five 3D Growth Arrow Infographic Slide Template for PowerPoint & Google Slides
Arrow
Premium
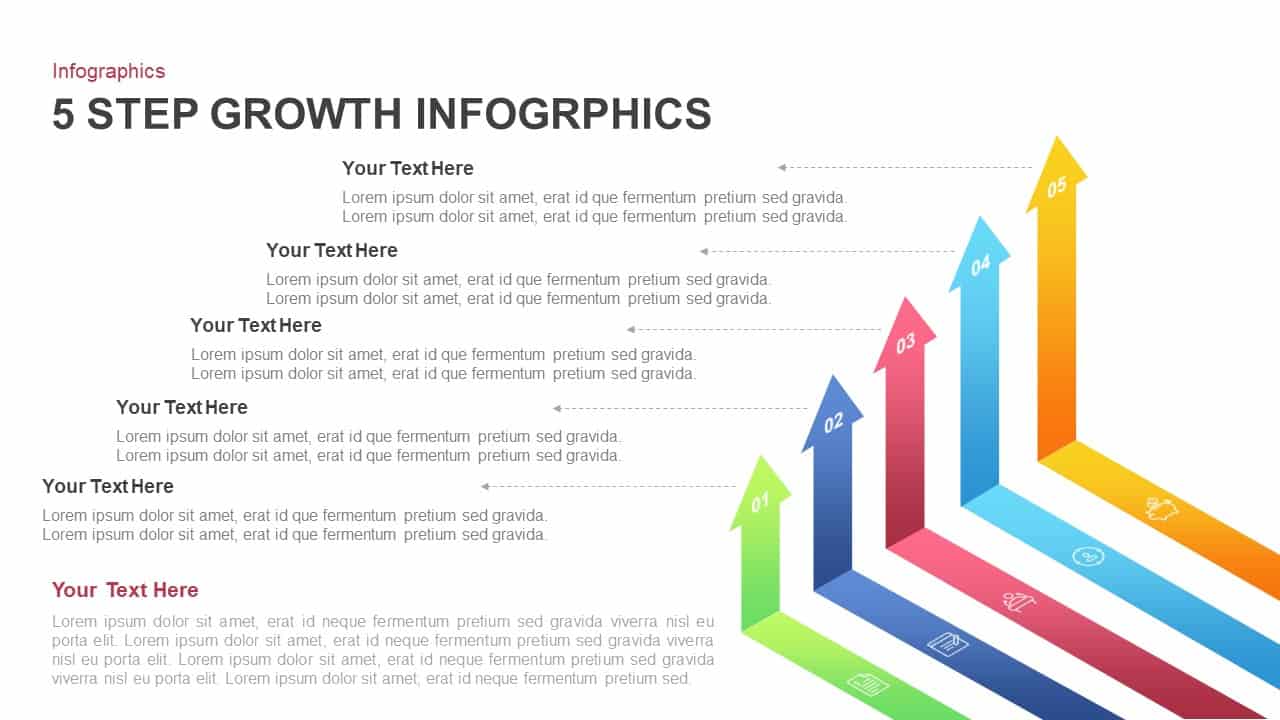
5-Step Growth Staircase Infographic Template for PowerPoint & Google Slides
Process
Premium
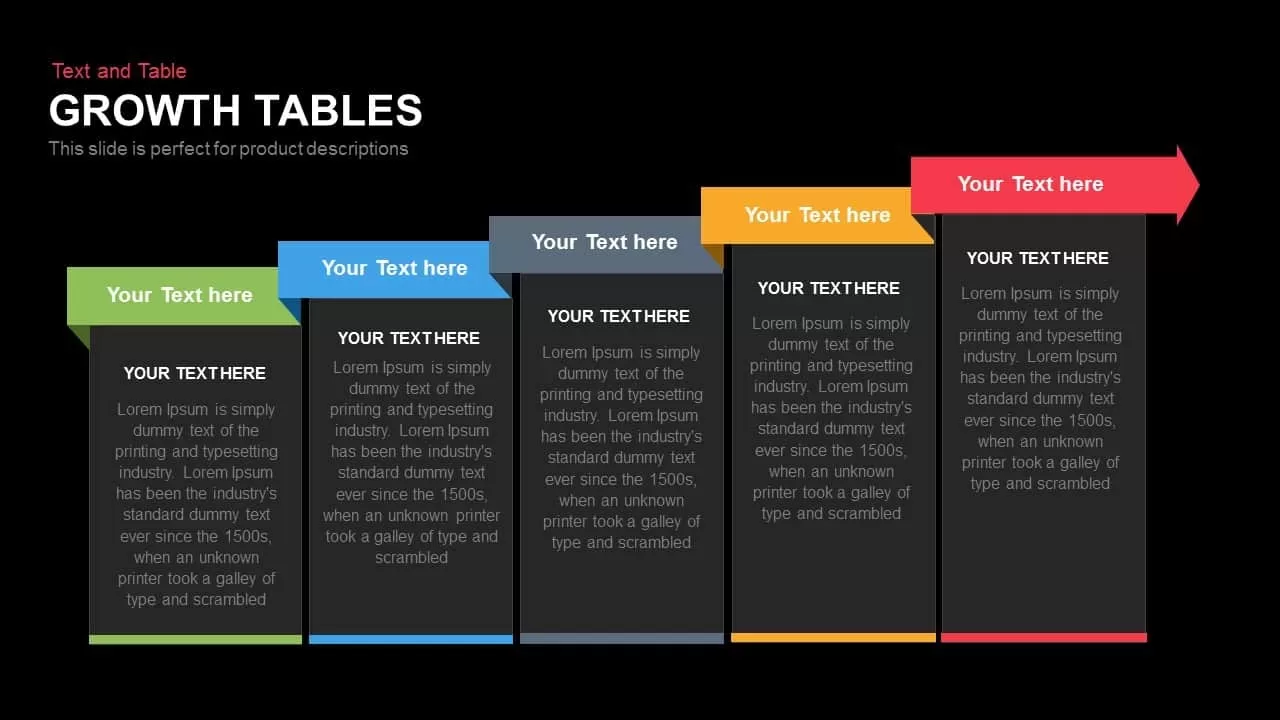
Growth Tables Slide template for PowerPoint & Google Slides
Process
Premium

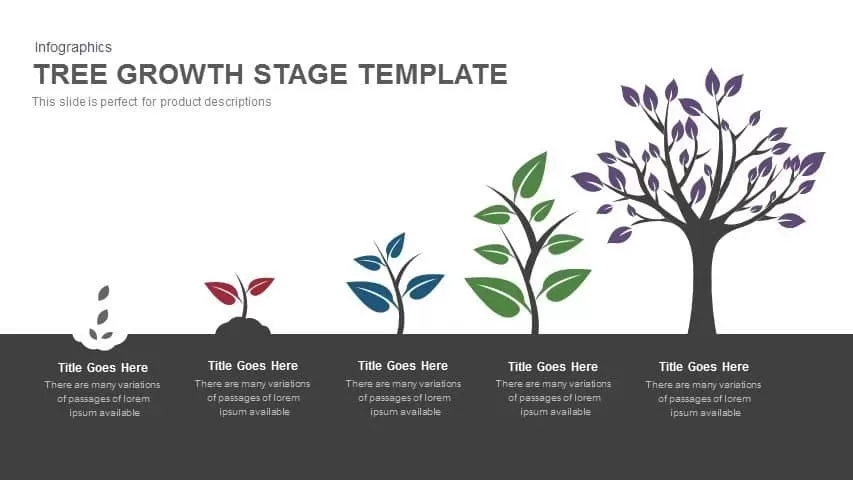
Tree Growth Stage Infographic Template for PowerPoint & Google Slides
Timeline
Premium
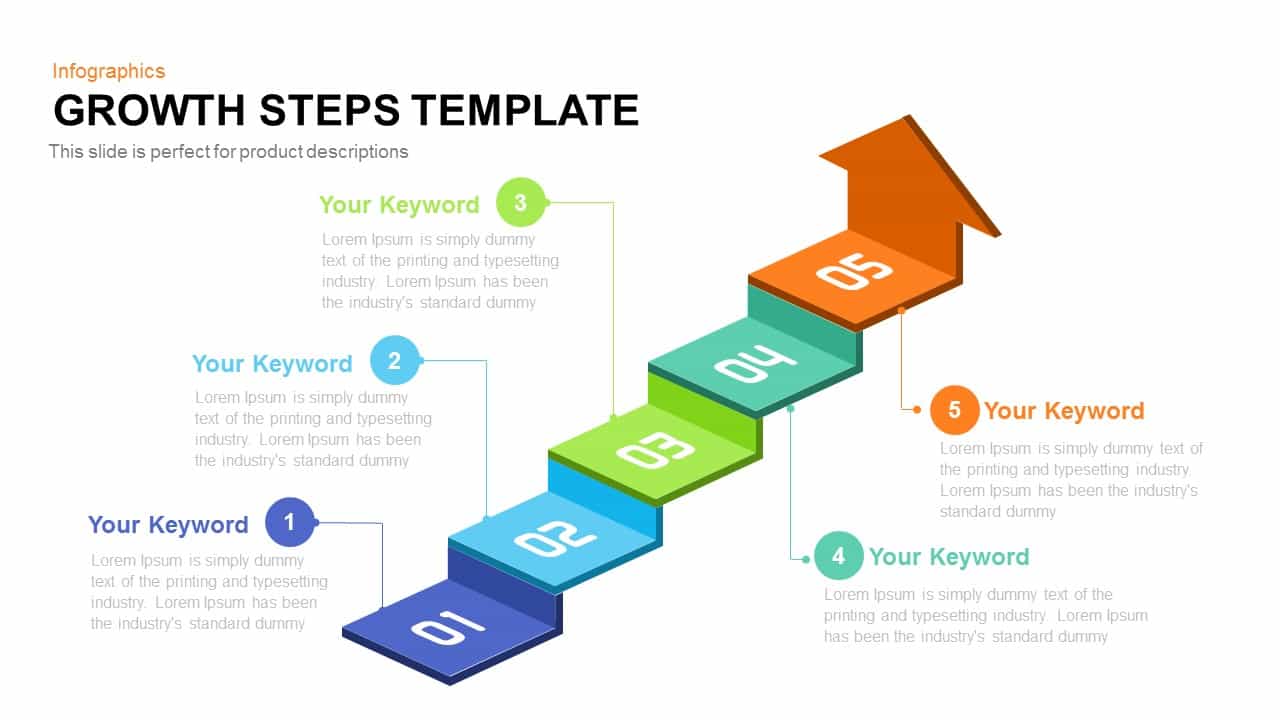
Five-Step Growth Stage Staircase Diagram Template for PowerPoint & Google Slides
Process
Premium

Modern Five-Step Growth Diagram Template for PowerPoint & Google Slides
Process
Premium
Improvement Growth Arrow Metaphor Template for PowerPoint & Google Slides
Bar/Column
Premium
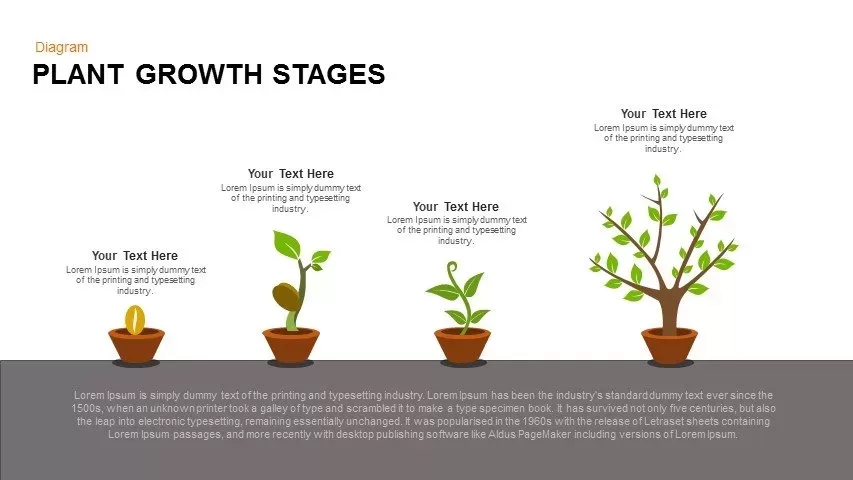
Editable Plant Growth Stages Diagram Template for PowerPoint & Google Slides
Process
Premium
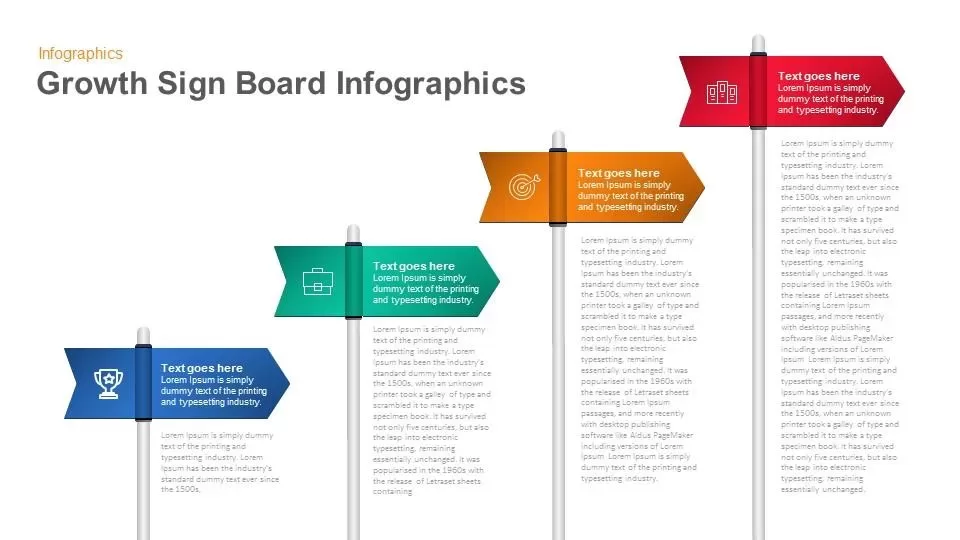
Growth Sign Board Infographics template for PowerPoint & Google Slides
Timeline
Premium
Five-Stage Growth Arrow Infographic Template for PowerPoint & Google Slides
Arrow
Premium
Ansoff Matrix Growth Strategy Model Template for PowerPoint & Google Slides
BCG
Premium
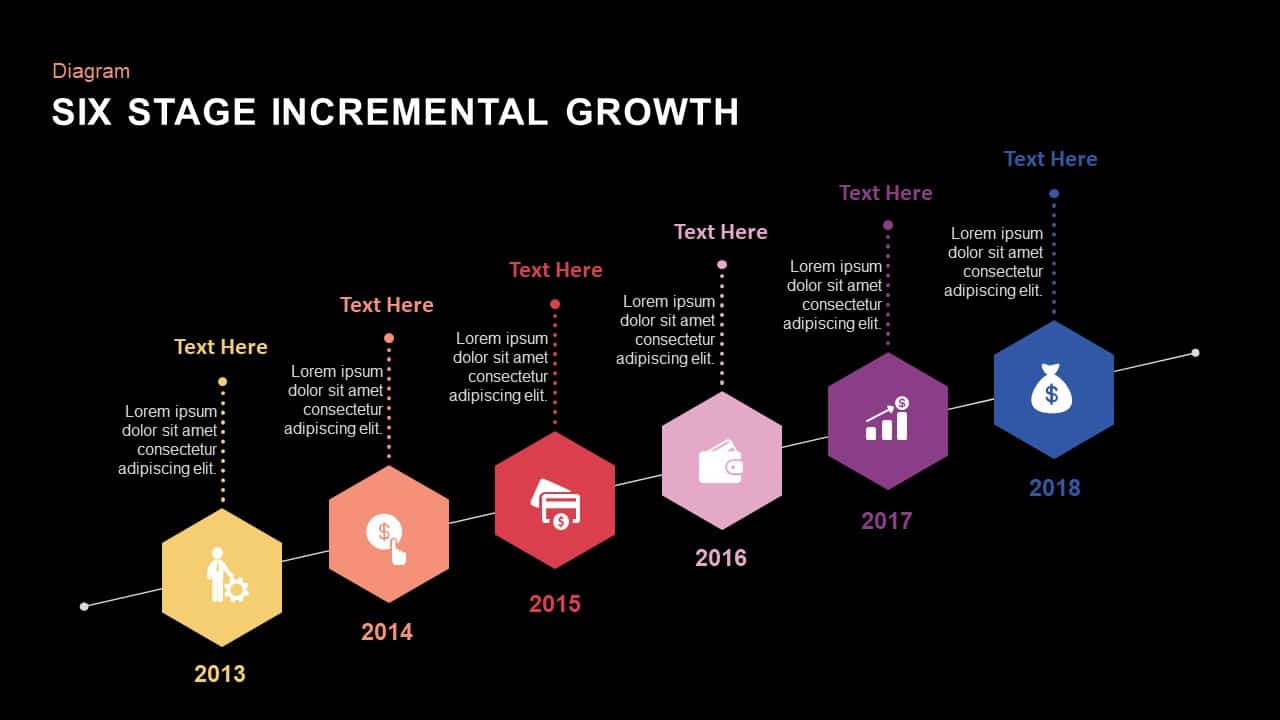
Six Stage Incremental Growth template for PowerPoint & Google Slides
Timeline
Premium
4 Step Revenue Growth Flow Diagram Template for PowerPoint & Google Slides
Process
Premium
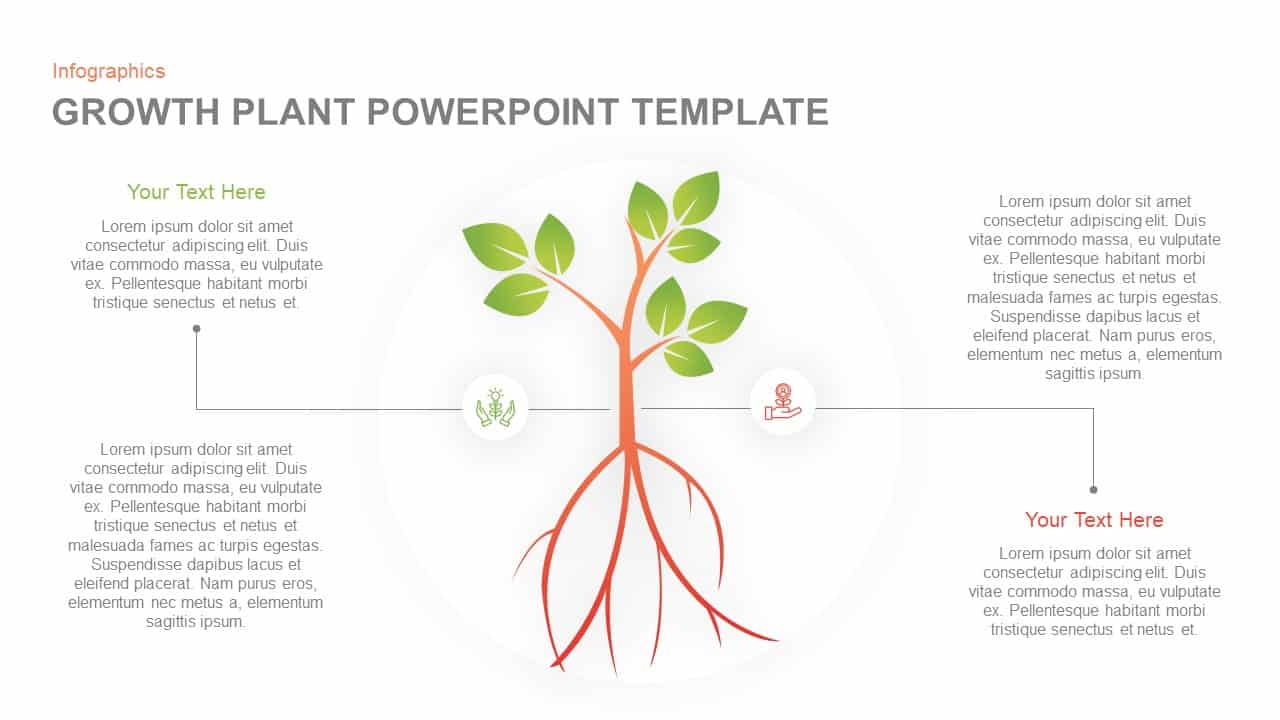
Growth Plant Infographics template for PowerPoint & Google Slides
Process
Premium
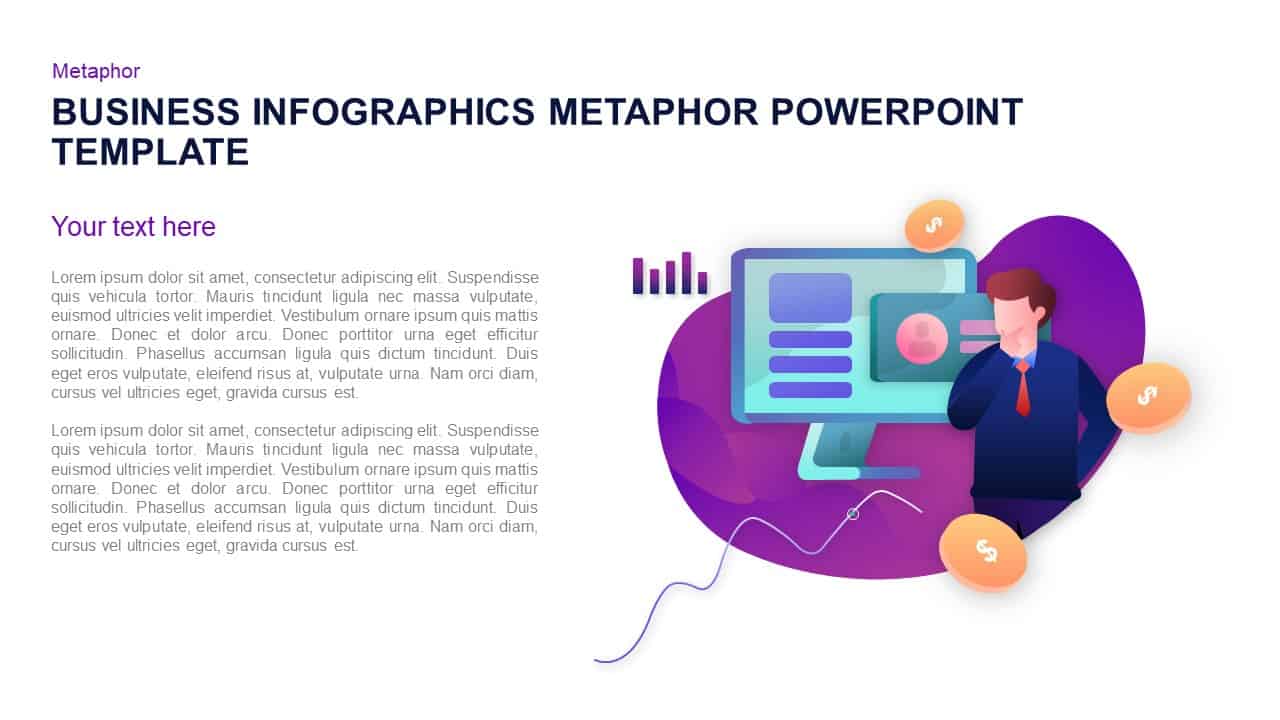
Business Growth Infographic Metaphor Template for PowerPoint & Google Slides
Revenue
Premium
Dynamic Growth Arrow Step Infographic Template for PowerPoint & Google Slides
Process
Premium
Plant Growth Lifecycle Infographic Template for PowerPoint & Google Slides
Process
Premium
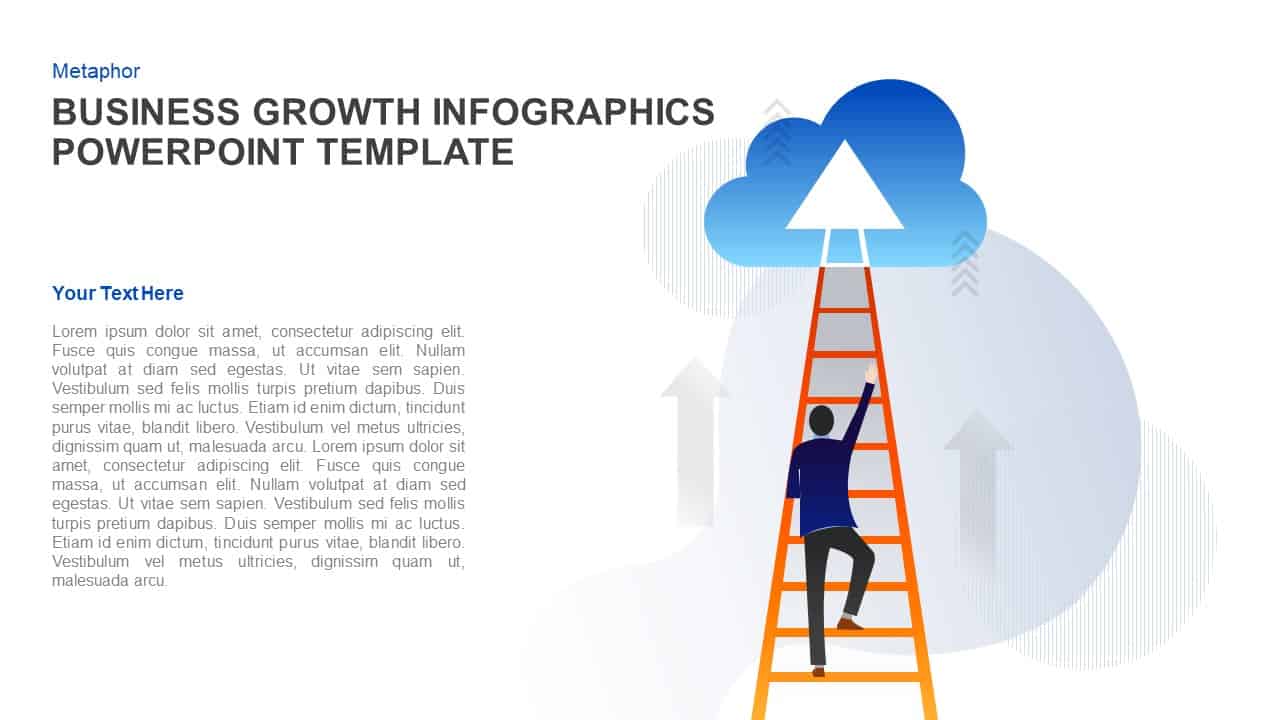
Business Growth Ladder to Cloud Metaphor Template for PowerPoint & Google Slides
Vision and Mission
Premium
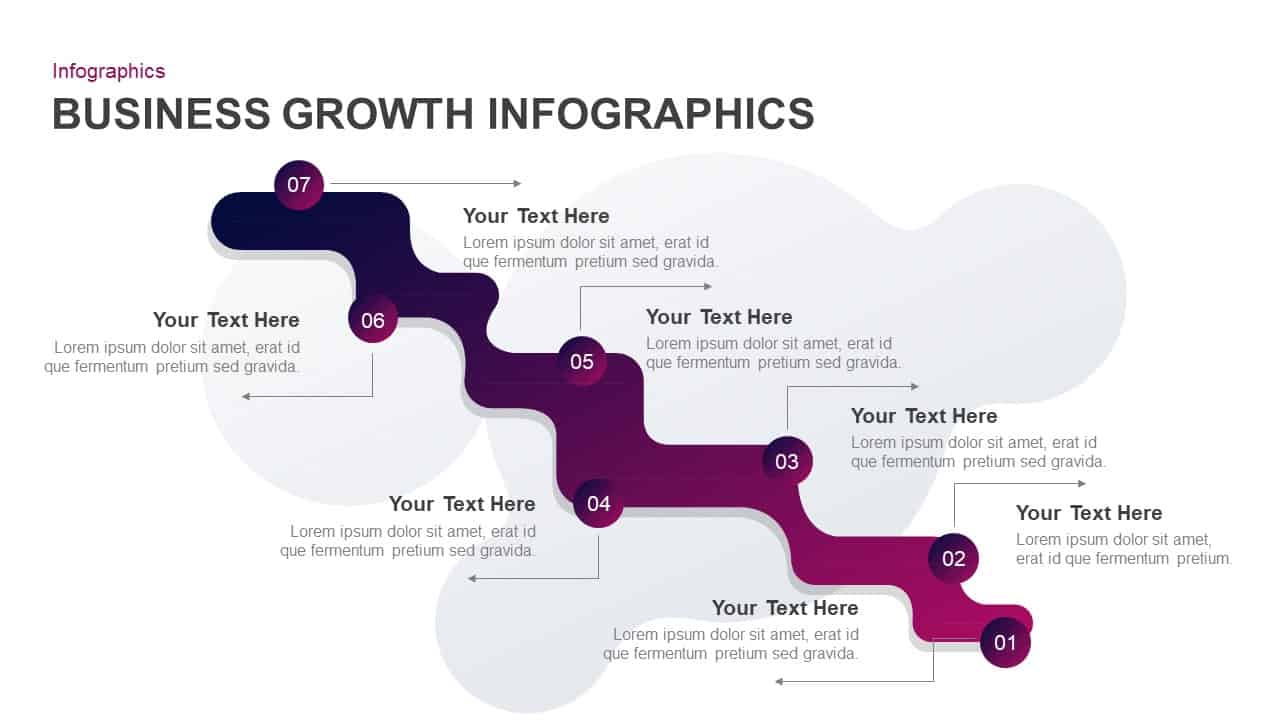
Business Growth Infographics Template for PowerPoint & Google Slides
Roadmap
Premium
Five-Step Growth Infographic Slide Template for PowerPoint & Google Slides
Process
Premium
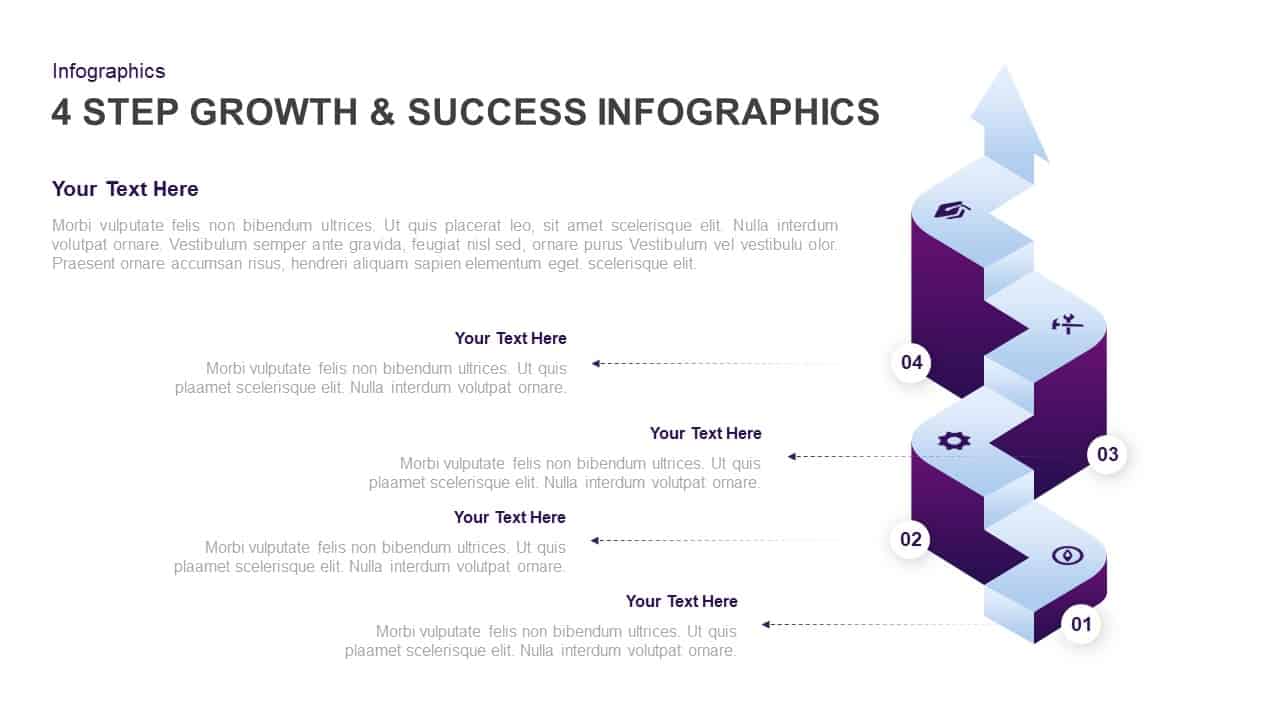
4-Step Growth & Success Infographics Template for PowerPoint & Google Slides
Accomplishment
Premium
5-Step Growth Arrow Infographics Template for PowerPoint & Google Slides
Arrow
Premium
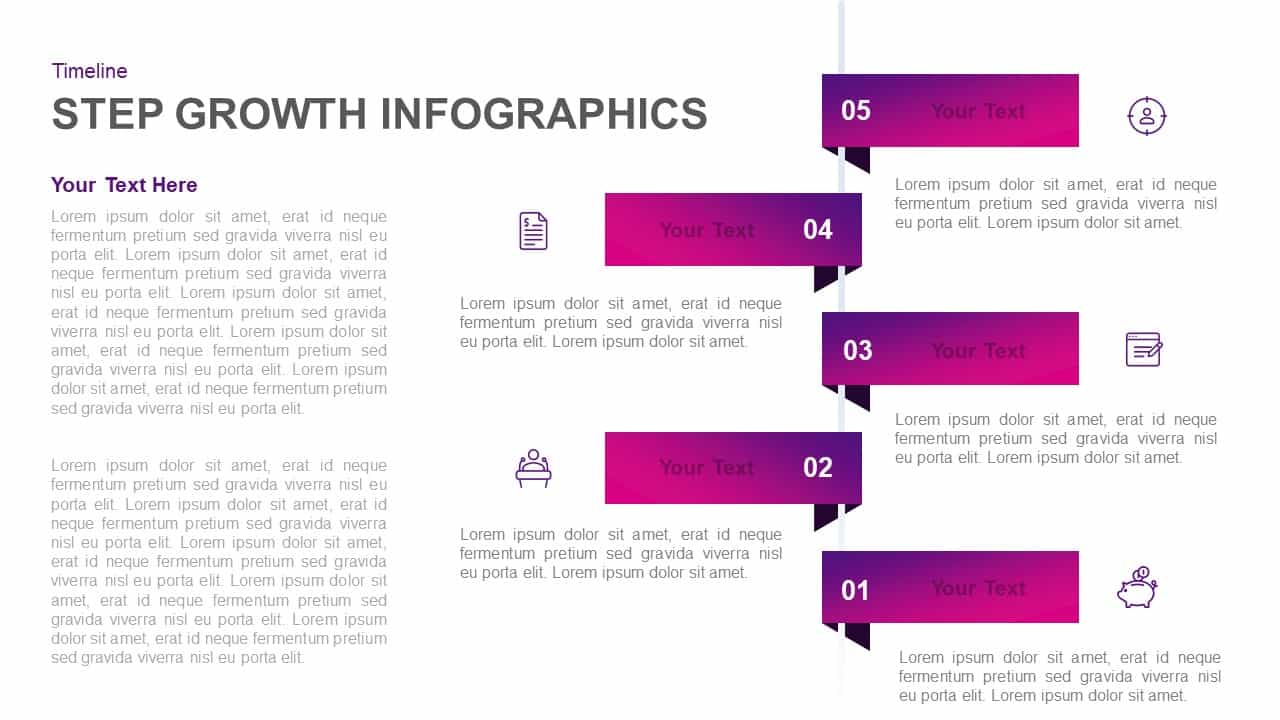
Five-Step Growth Timeline Infographic Template for PowerPoint & Google Slides
Timeline
Premium
Greiner Growth Model Six-Phase Diagram Template for PowerPoint & Google Slides
Business Models
Premium
Sales Growth Dashboard: KPI Gauge & Line Template for PowerPoint & Google Slides
Revenue
Premium
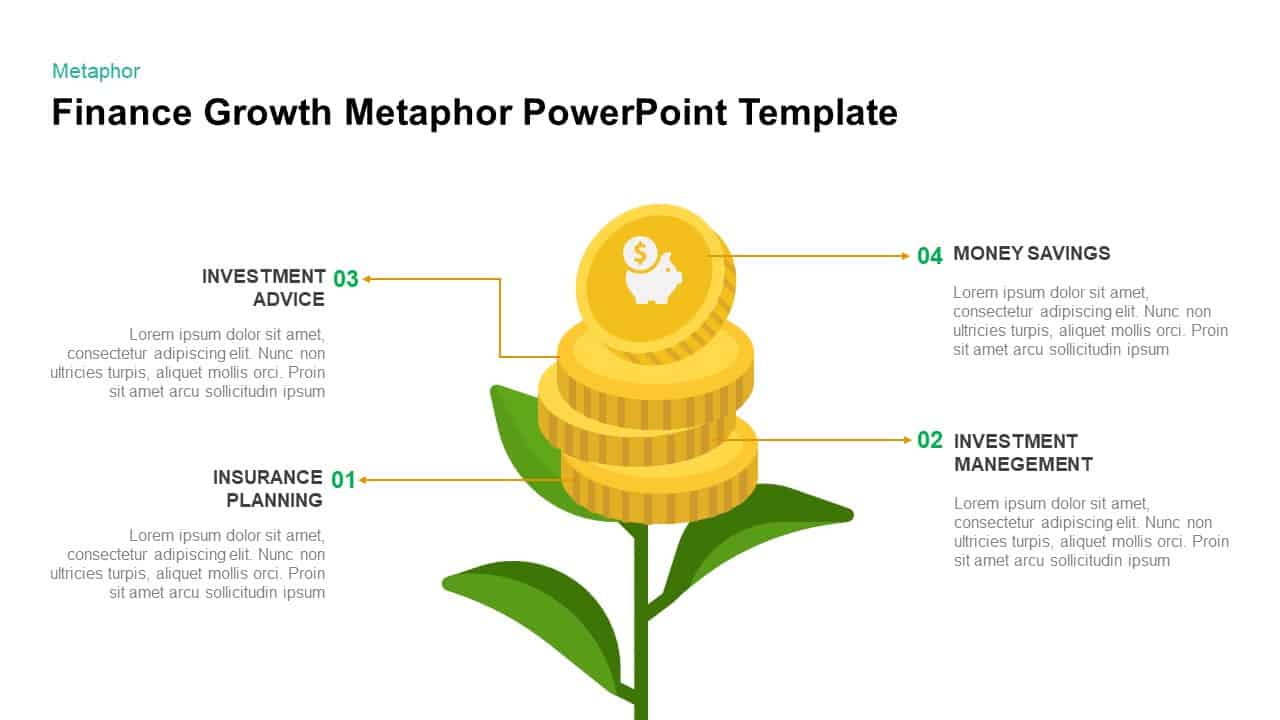
Finance Growth Plant Metaphor Slide Template for PowerPoint & Google Slides
Finance
Premium
5-Stage Financial Growth Timeline Template for PowerPoint & Google Slides
Timeline
Premium

Ansoff Growth Matrix Strategy Diagram Template for PowerPoint & Google Slides
Business Strategy
Premium
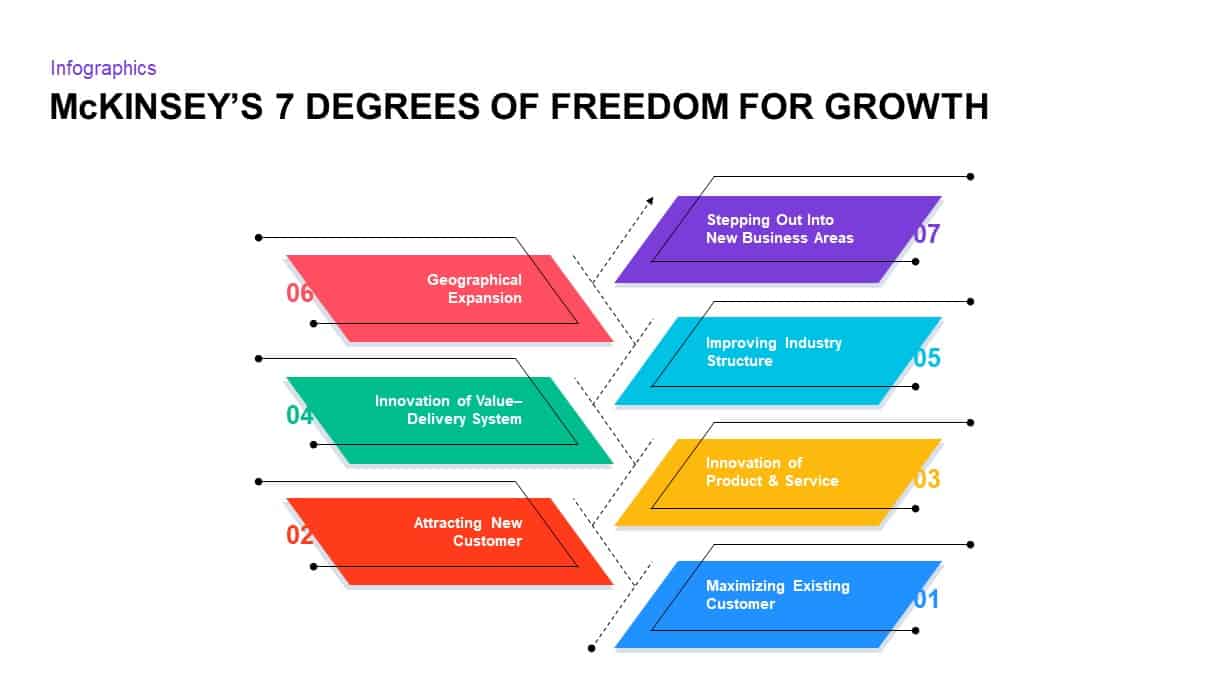
McKinsey’s 7 Degrees of Freedom Growth Template for PowerPoint & Google Slides
Process
Premium
Greiner’s Growth Model Curve template for PowerPoint & Google Slides
Infographics
Premium
Business Growth Plant Infographics Pack Template for PowerPoint & Google Slides
Process
Premium
Business Growth Metaphor Chart Template for PowerPoint & Google Slides
Business
Premium
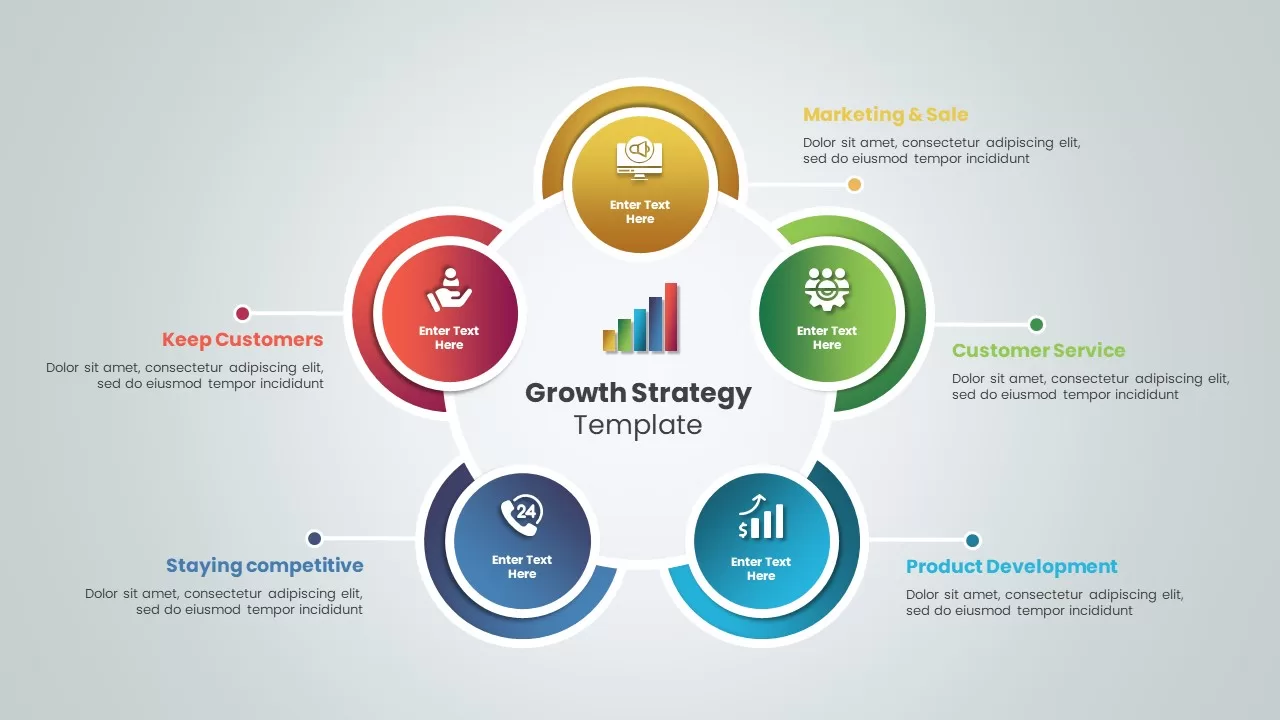
Growth Strategy Circular Diagram Template for PowerPoint & Google Slides
Circle
Premium
Data-driven GDP Growth Infographic Pack Template for PowerPoint & Google Slides
Infographics
Premium
3D Curved Arrow Growth Process Slide Template for PowerPoint & Google Slides
Process
Premium
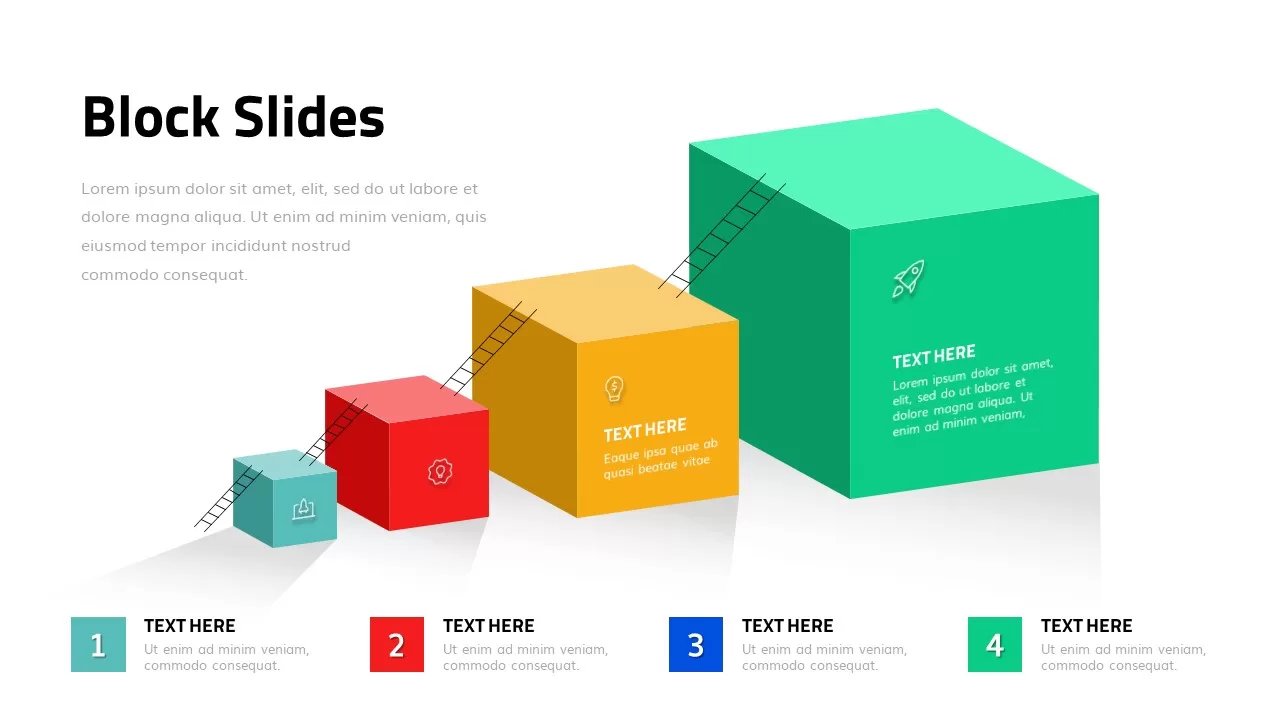
3D Growth Blocks Template for PowerPoint & Google Slides
Process
Premium
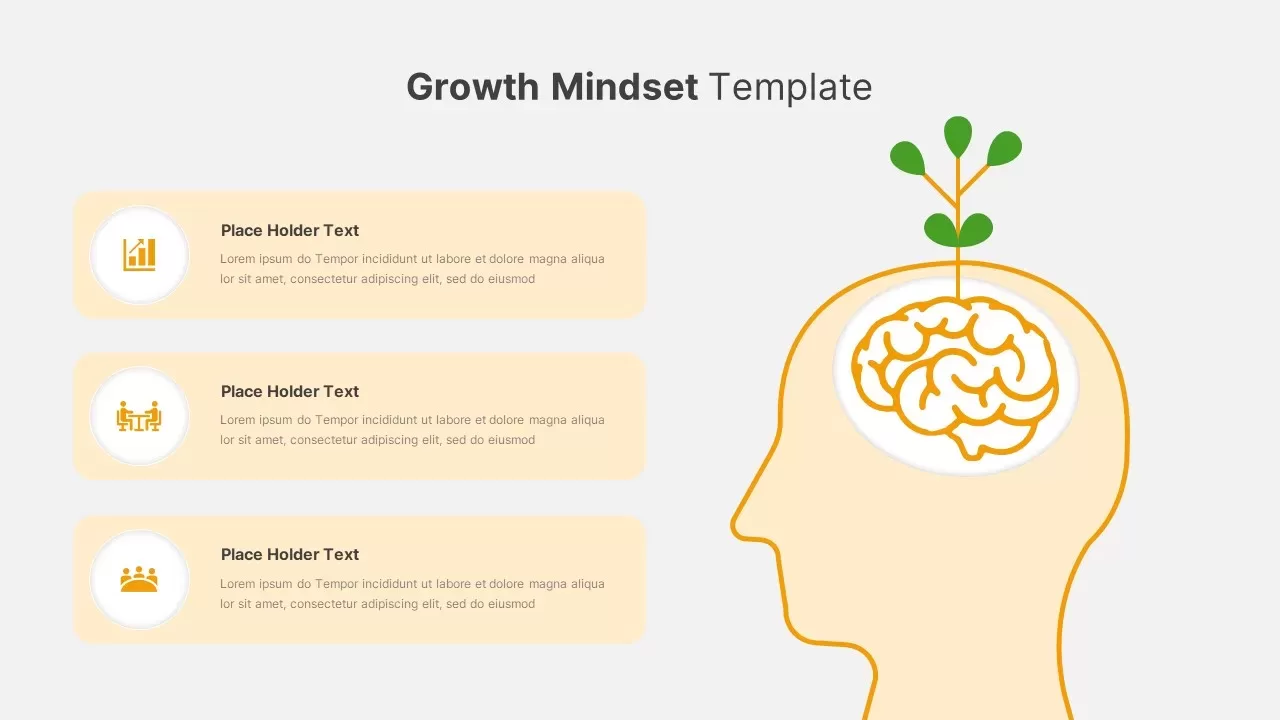
Growth Mindset Illustration Template for PowerPoint & Google Slides
Goals
Premium
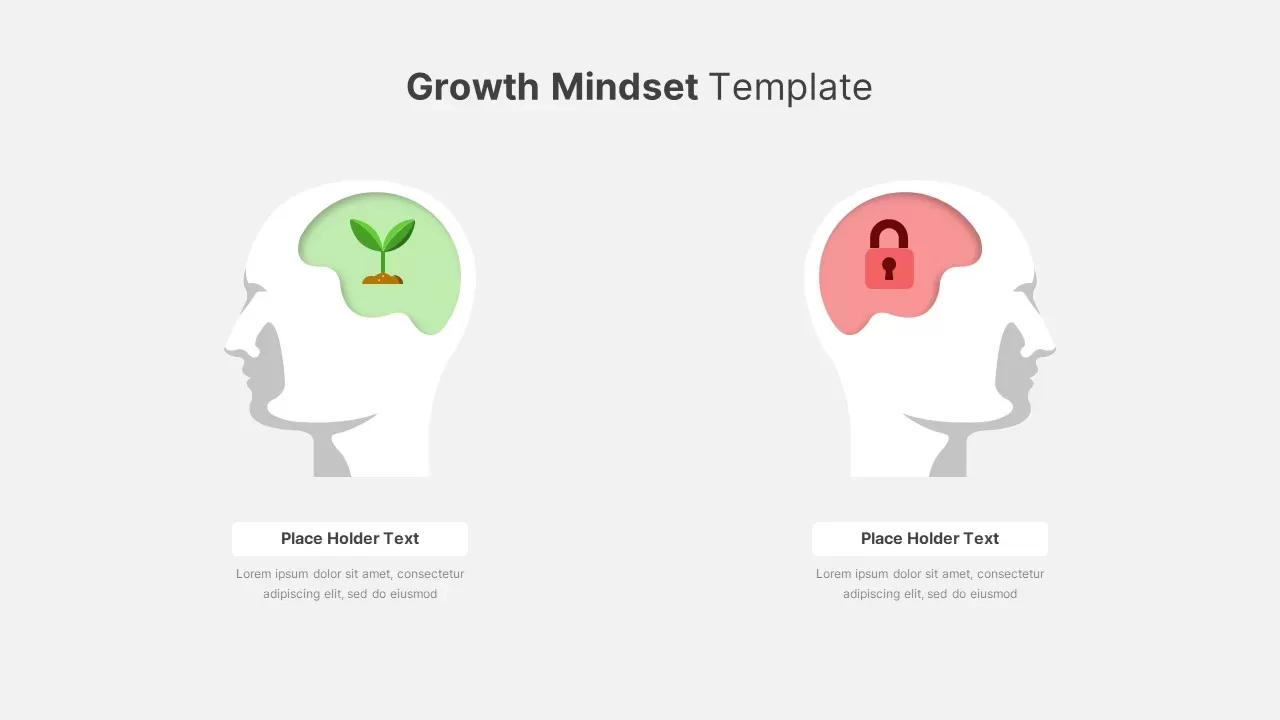
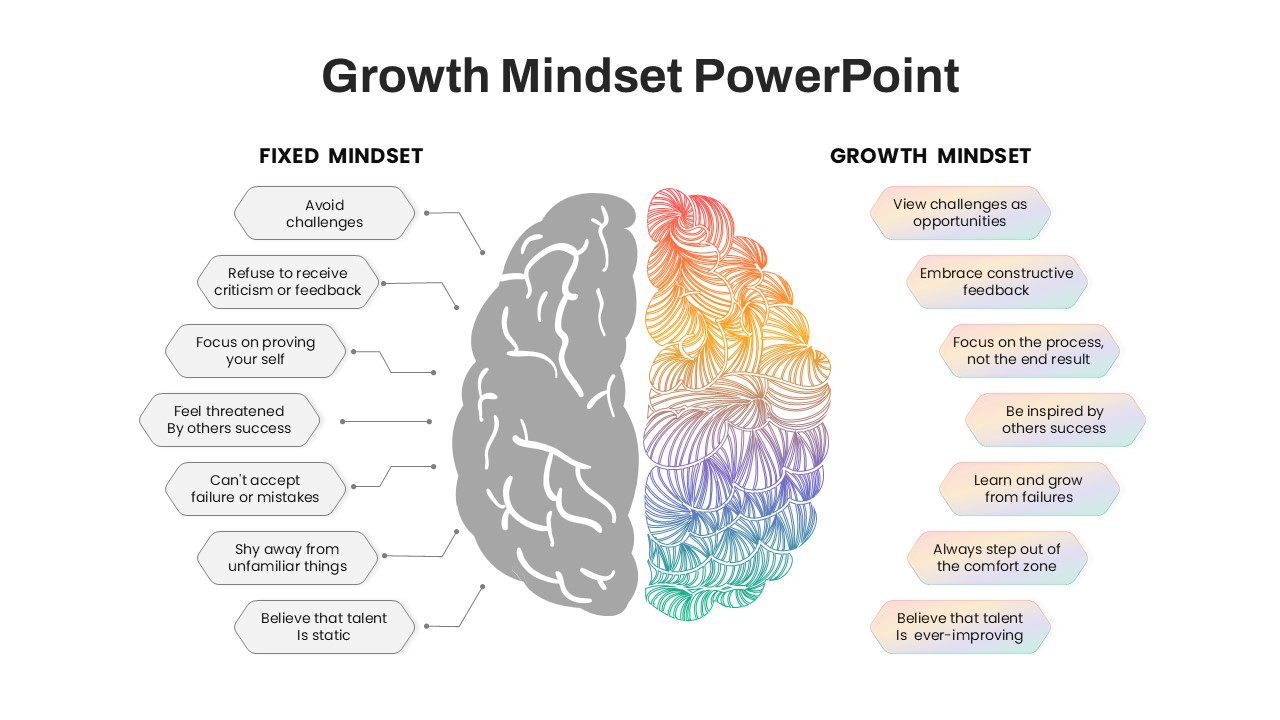
Growth vs Fixed Mindset Diagram Template for PowerPoint & Google Slides
Comparison
Premium
Abraham Maslow Growth Quote Slide Template for PowerPoint & Google Slides
Vision and Mission
Premium
Three-Stage S Curve Growth Diagram Template for PowerPoint & Google Slides
Process
Premium
Growth Curve Line Chart Visualization Template for PowerPoint & Google Slides
Charts
Premium
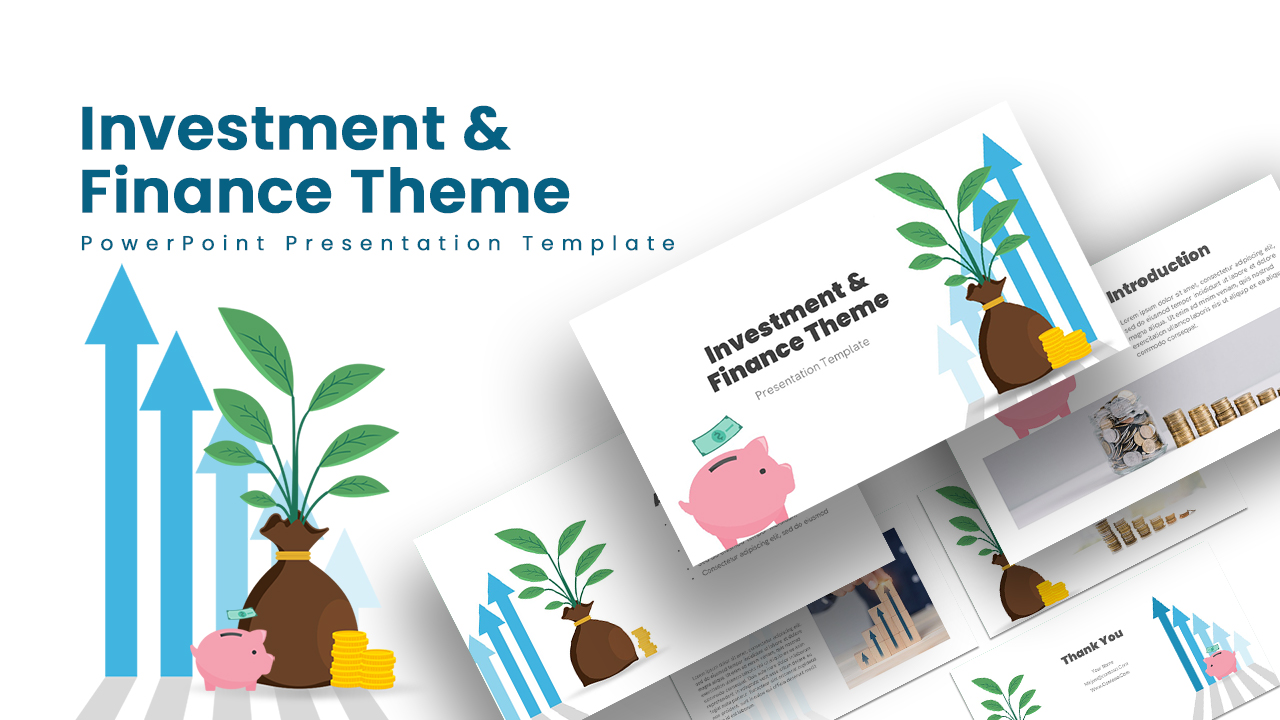
Dynamic Investment & Finance Growth Template for PowerPoint & Google Slides
Finance
Premium
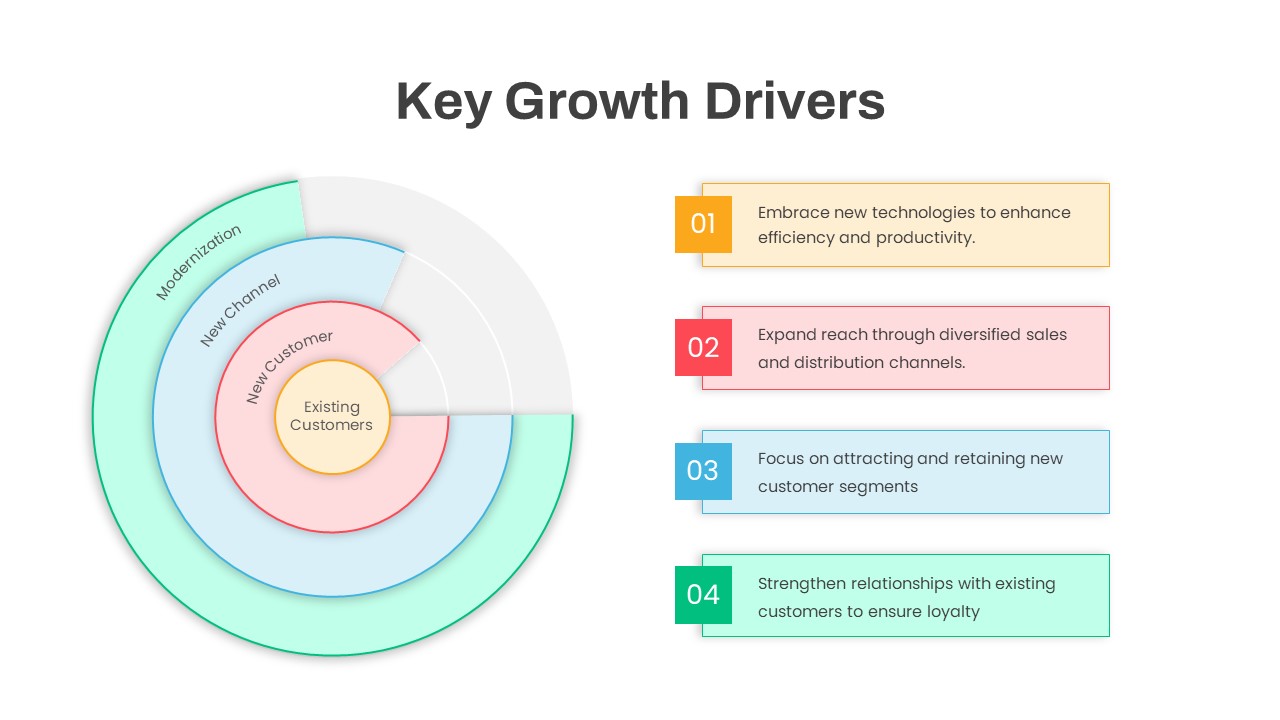
Circular Key Growth Drivers Diagram Template for PowerPoint & Google Slides
Circle
Premium
Business Growth Strategies Matrix Template for PowerPoint & Google Slides
Comparison
Premium

Growth Plant Nurture Business Development Template for PowerPoint & Google Slides
Decks
Premium
Annual Growth Trend Analysis Chart template for PowerPoint & Google Slides
Business Report
Premium
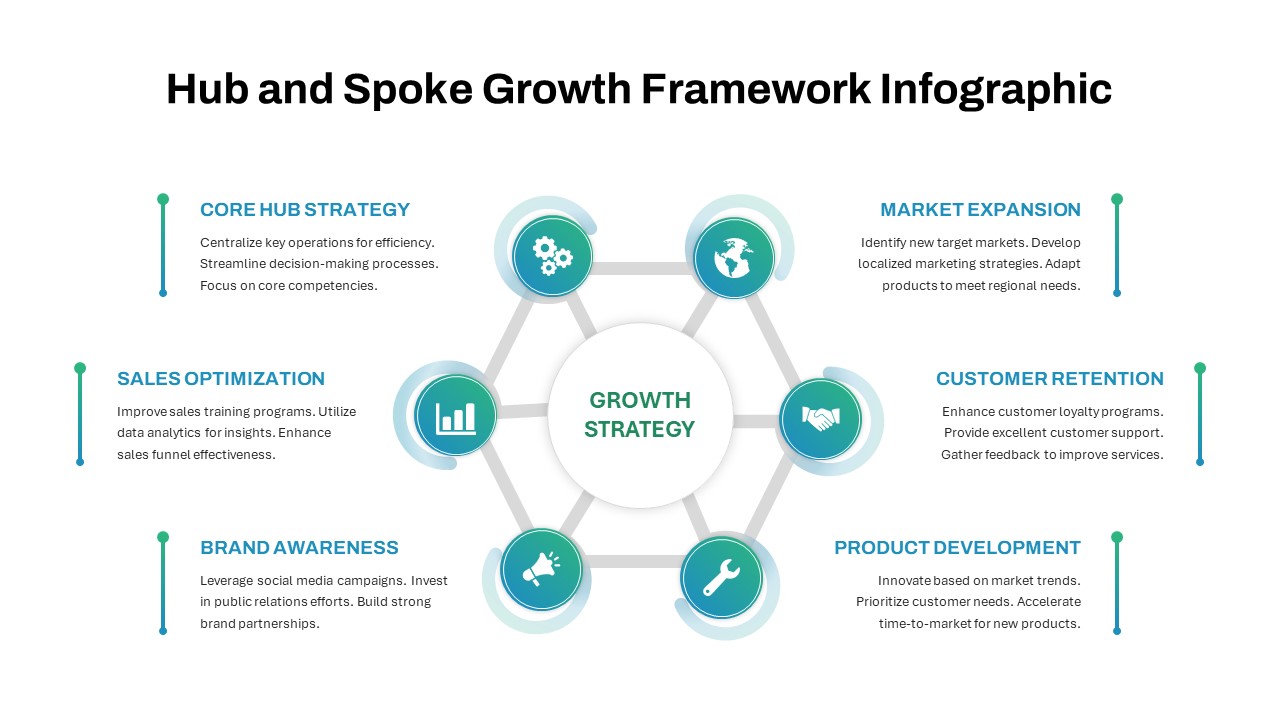
Hub and Spoke Growth Framework Template for PowerPoint & Google Slides
Circle
Premium

Quarterly Net Interest Income Growth Template for PowerPoint & Google Slides
Bar/Column
Premium
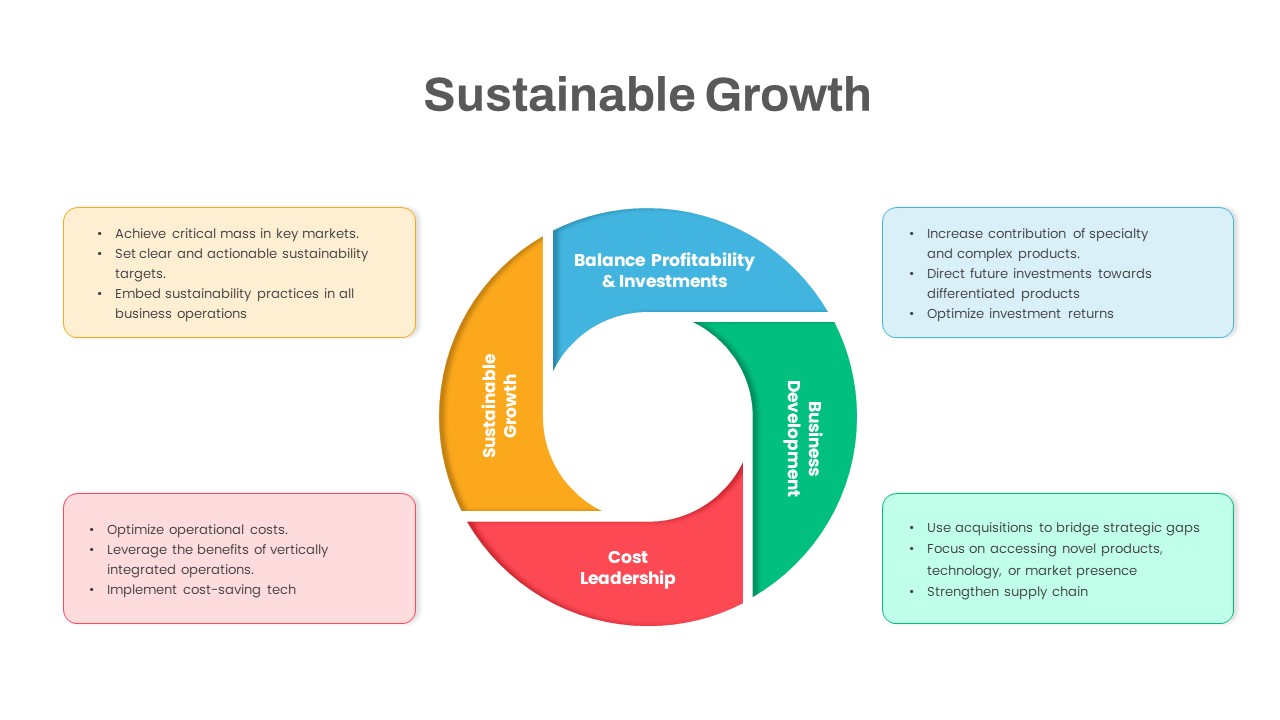
Sustainable Growth Circular Diagram Template for PowerPoint & Google Slides
Circle
Premium
Fixed vs Growth Mindset Matrix Template for PowerPoint & Google Slides
Comparison
Premium
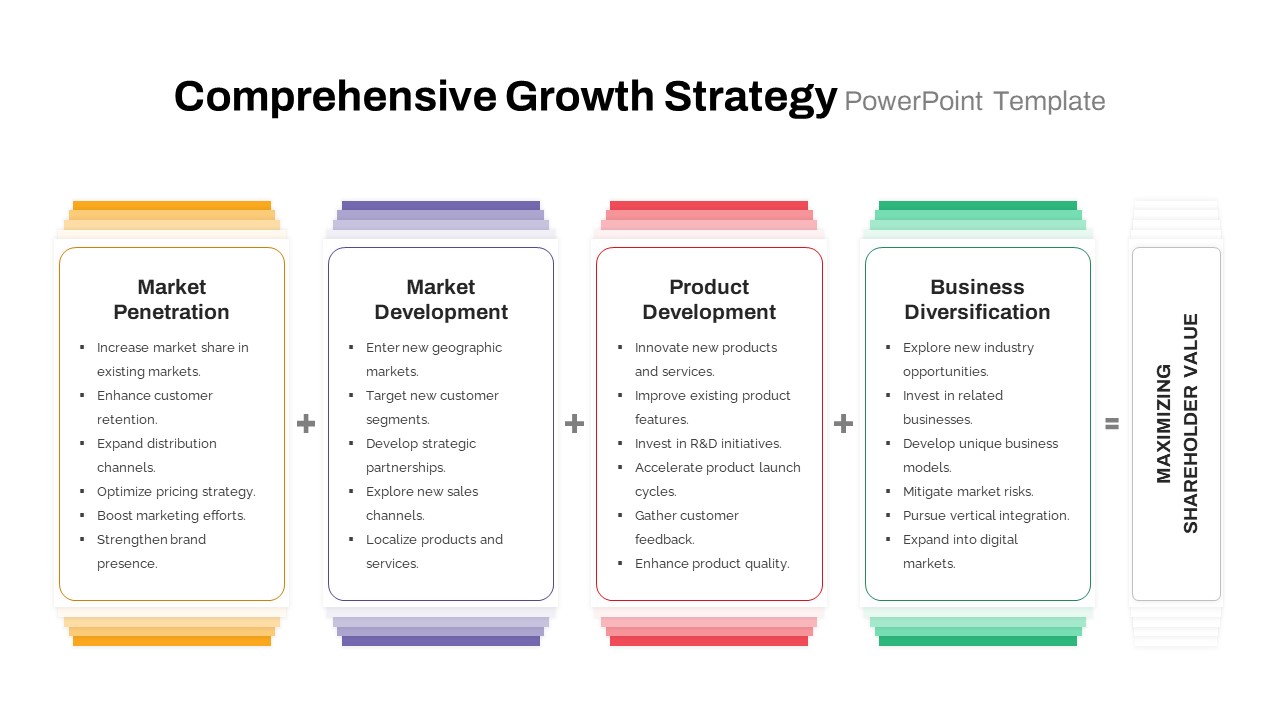
Comprehensive Growth Strategy Cards Template for PowerPoint & Google Slides
Infographics
Premium
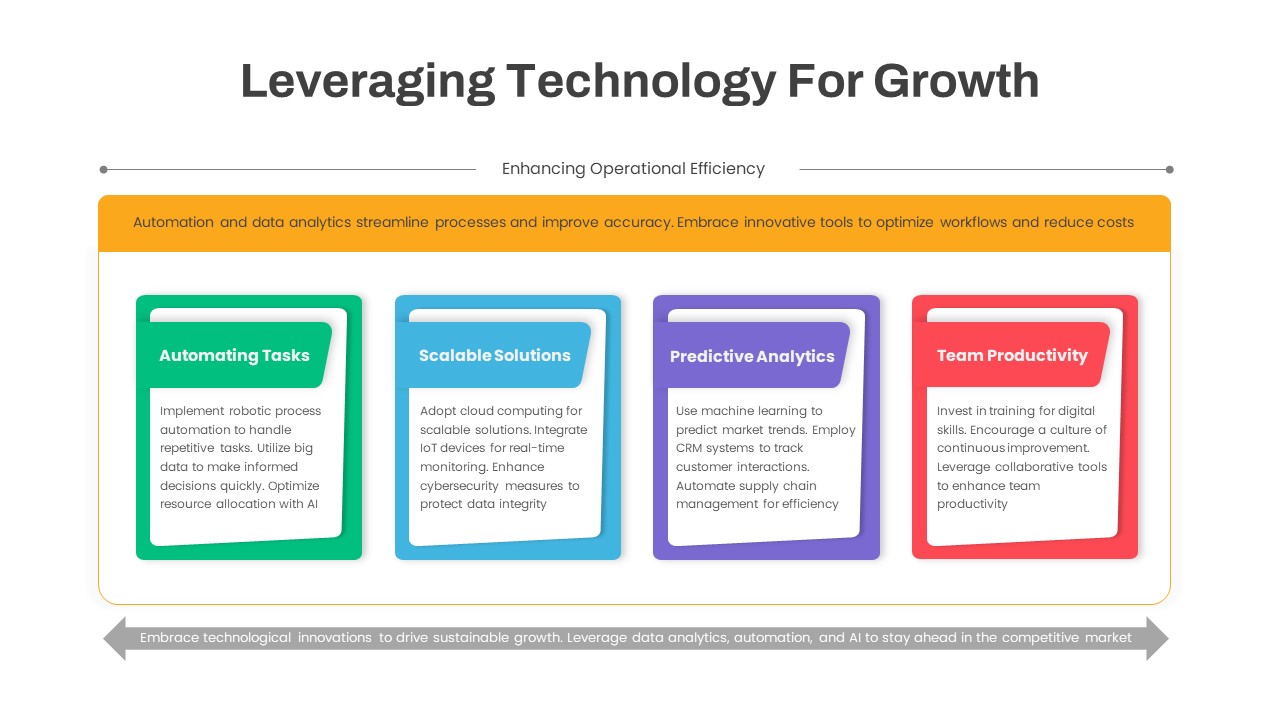
Leveraging Technology for Growth Slide Template for PowerPoint & Google Slides
Information Technology
Premium
Ansoff Growth Matrix Professional Template for PowerPoint & Google Slides
Comparison
Premium
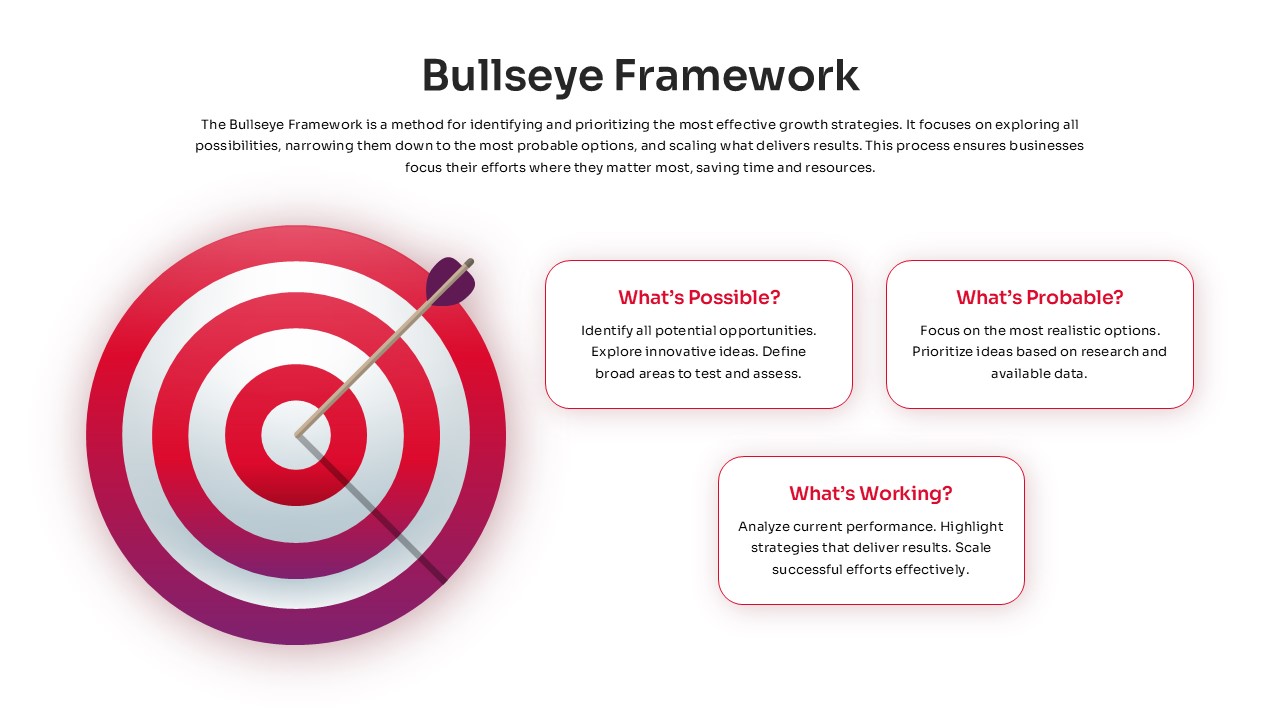
Bullseye Framework Growth Strategy Template for PowerPoint & Google Slides
Business Strategy
Premium
Modern Growth Hacking Venn Diagram Template for PowerPoint & Google Slides
Circle
Premium
Seeds Growth Cycle Business Model Template for PowerPoint & Google Slides
Process
Premium
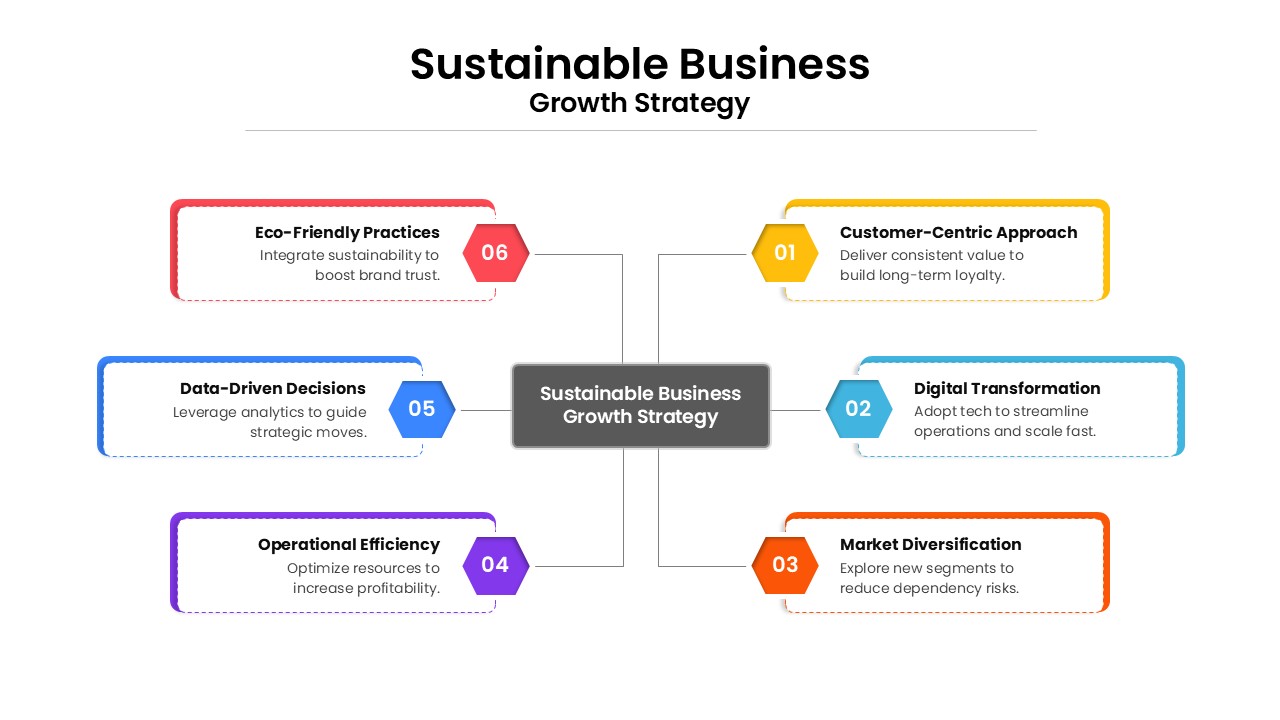
Sustainable Business Growth Strategy Template for PowerPoint & Google Slides
Process
Premium
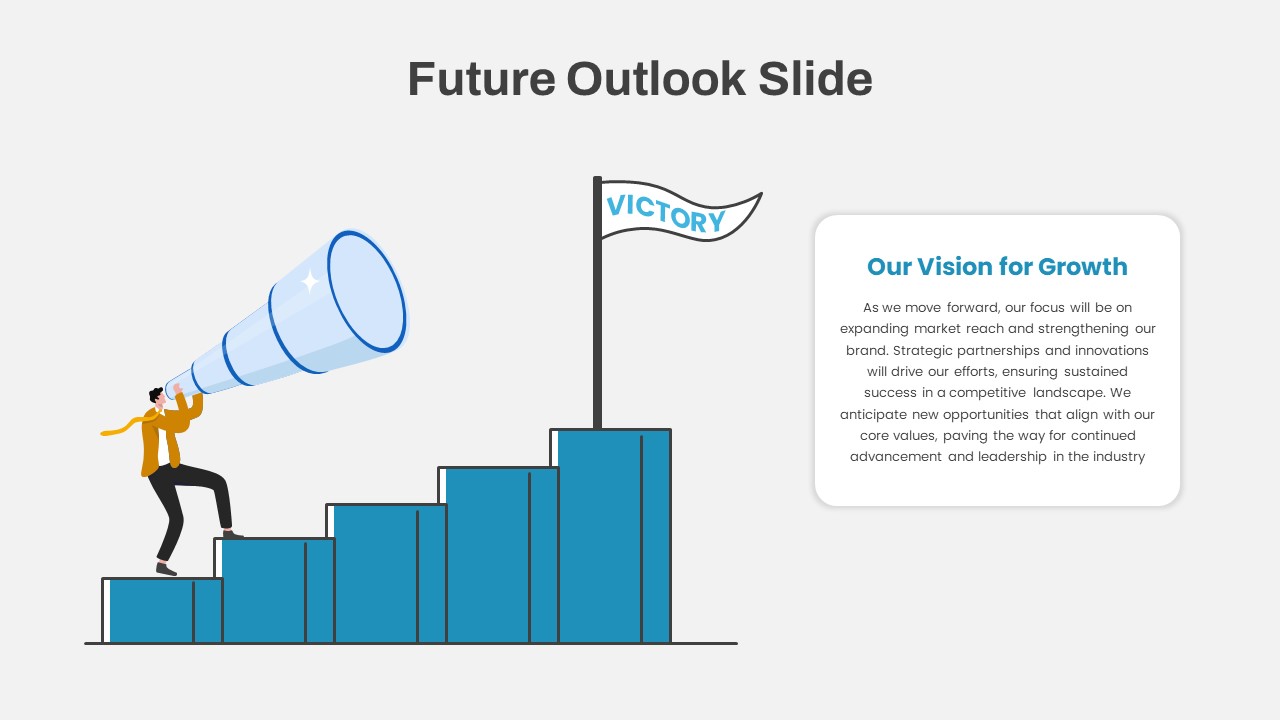
Future Outlook and Growth Strategy Slide Template for PowerPoint & Google Slides
Infographics
Premium
Sales Growth Comparison Chart & Table Template for PowerPoint & Google Slides
Bar/Column
Premium
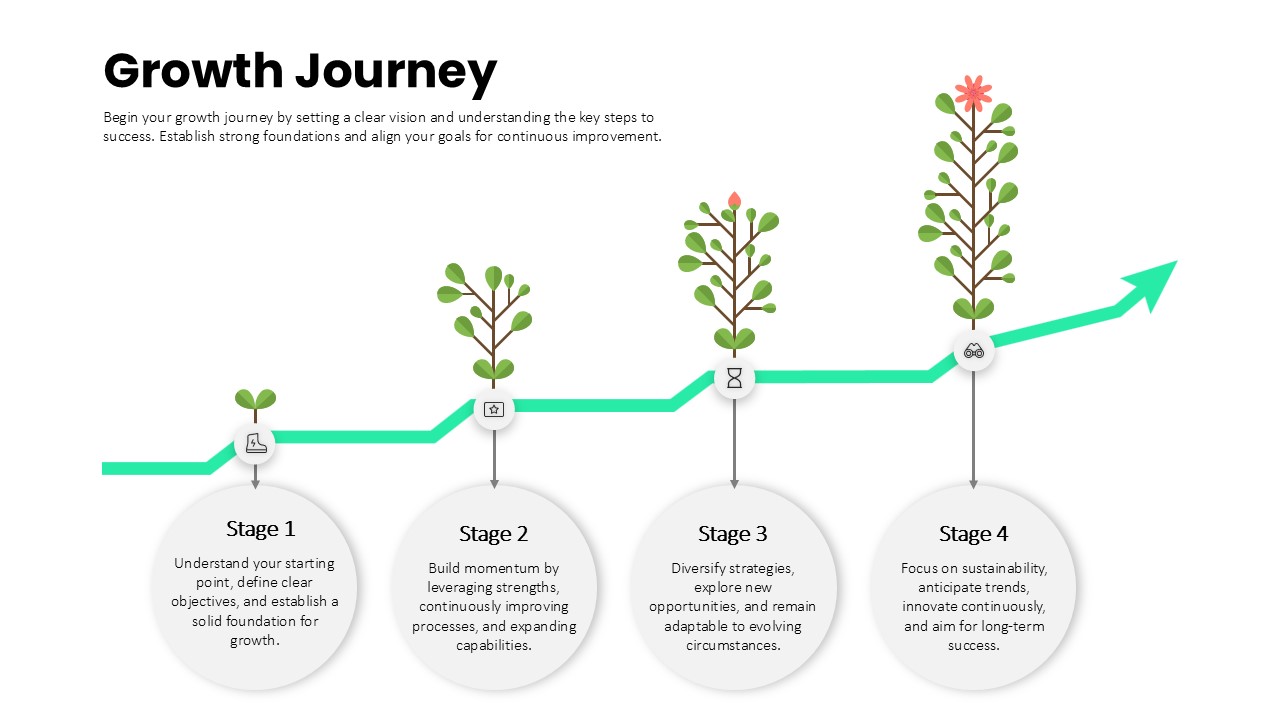
Growth Journey Stages Process template for PowerPoint & Google Slides
Business Strategy
Premium
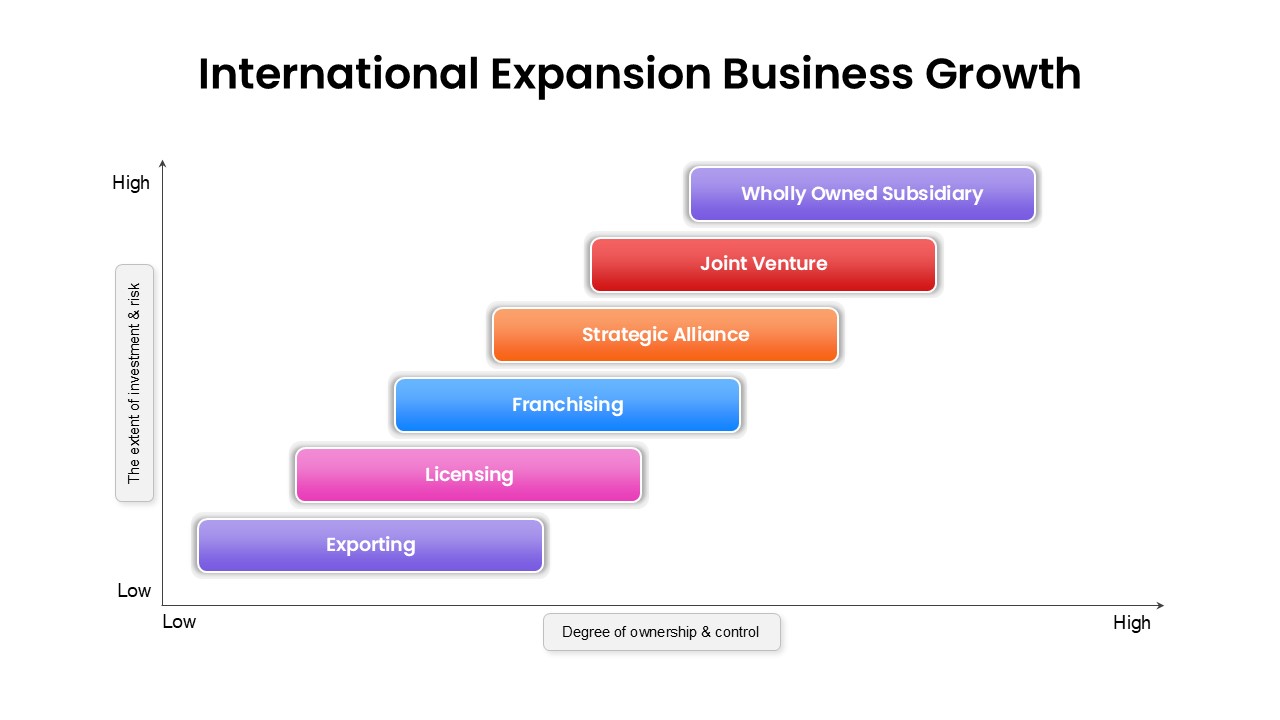
International Expansion Business Growth template for PowerPoint & Google Slides
Business Strategy
Premium
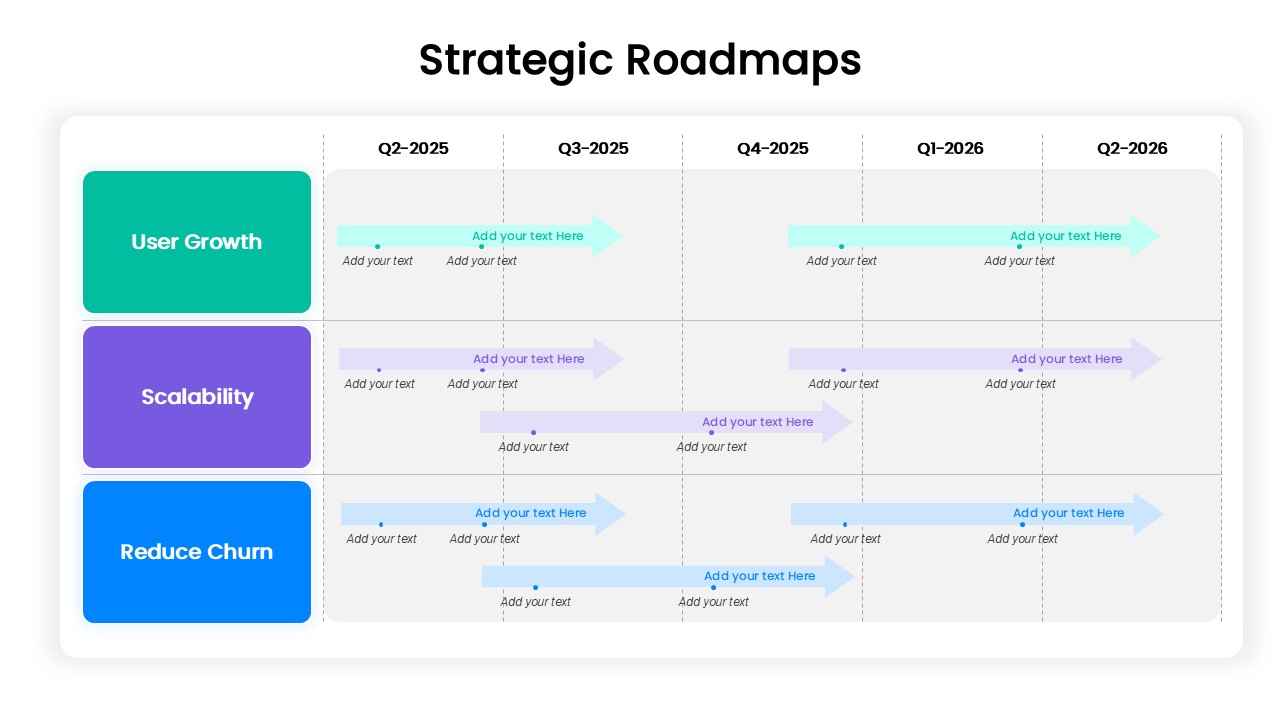
Strategic Roadmap for User Growth, Scalability, and Reducing Churn template for PowerPoint & Google Slides
Business
Premium
Flywheel Growth Cycle Diagram Template for PowerPoint & Google Slides
Circle
Premium
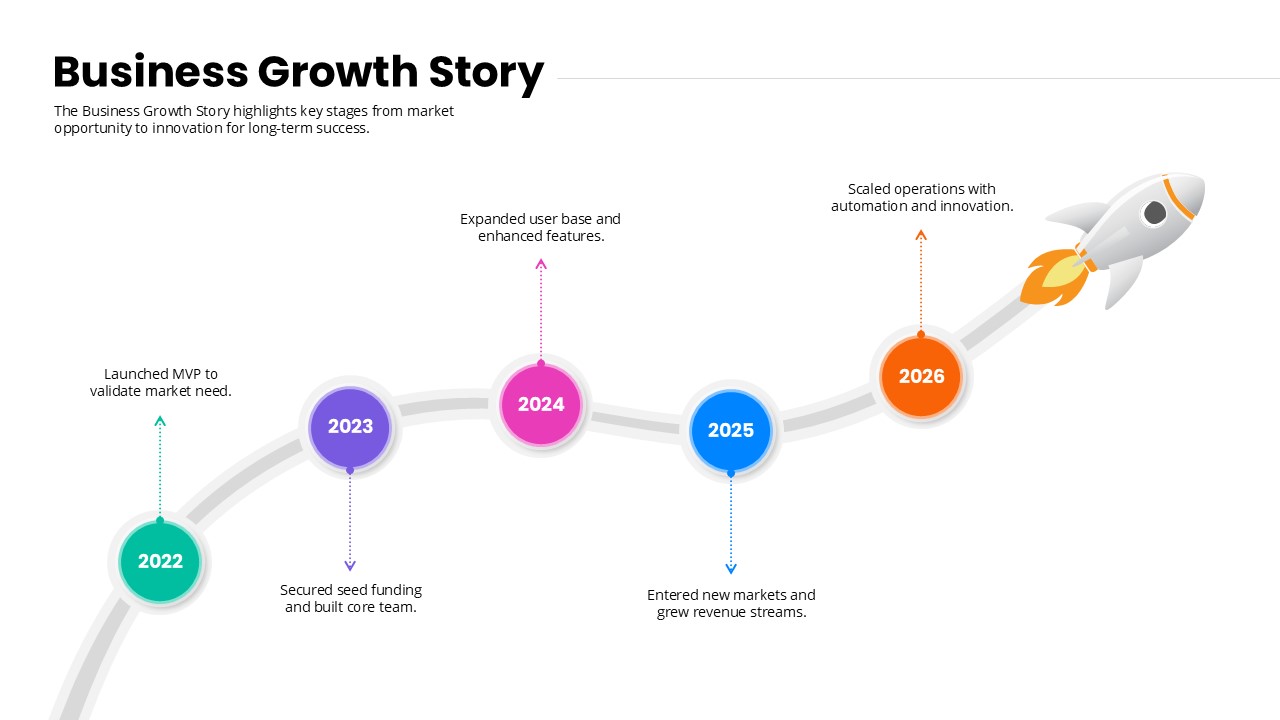
Business Growth Story timeline template for PowerPoint & Google Slides
Timeline
Premium
Success and Growth Stair Arrow Diagram for PowerPoint & Google Slides
Process
Premium
Business Growth Diagram for PowerPoint & Google Slides
Business Models
Premium
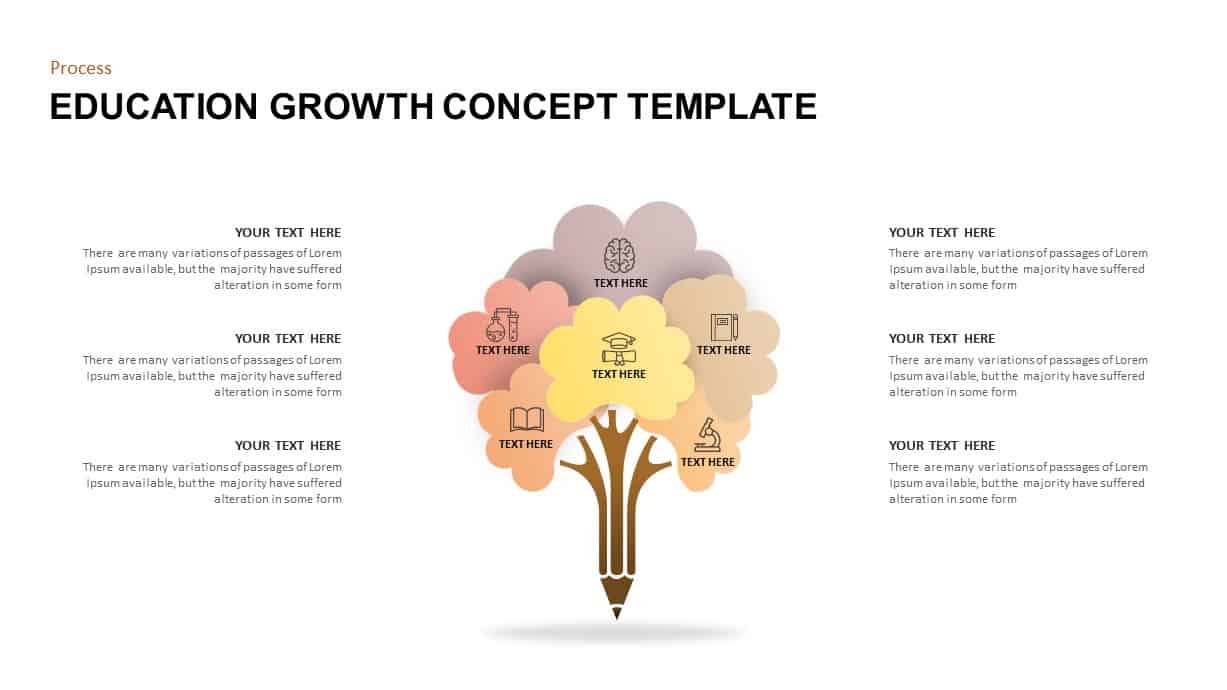
Education Growth Concept Diagram for PowerPoint & Google Slides
Process
Premium
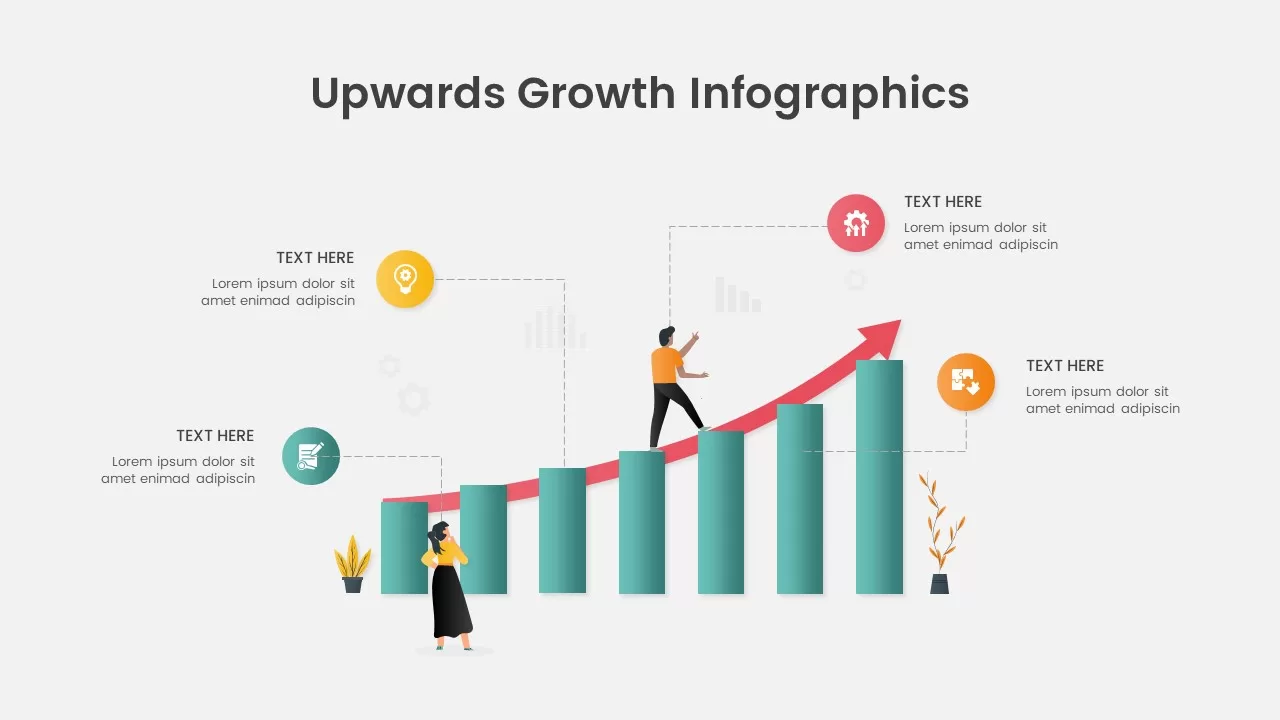
Upwards Growth Infographics for PowerPoint & Google Slides
Infographics
Premium
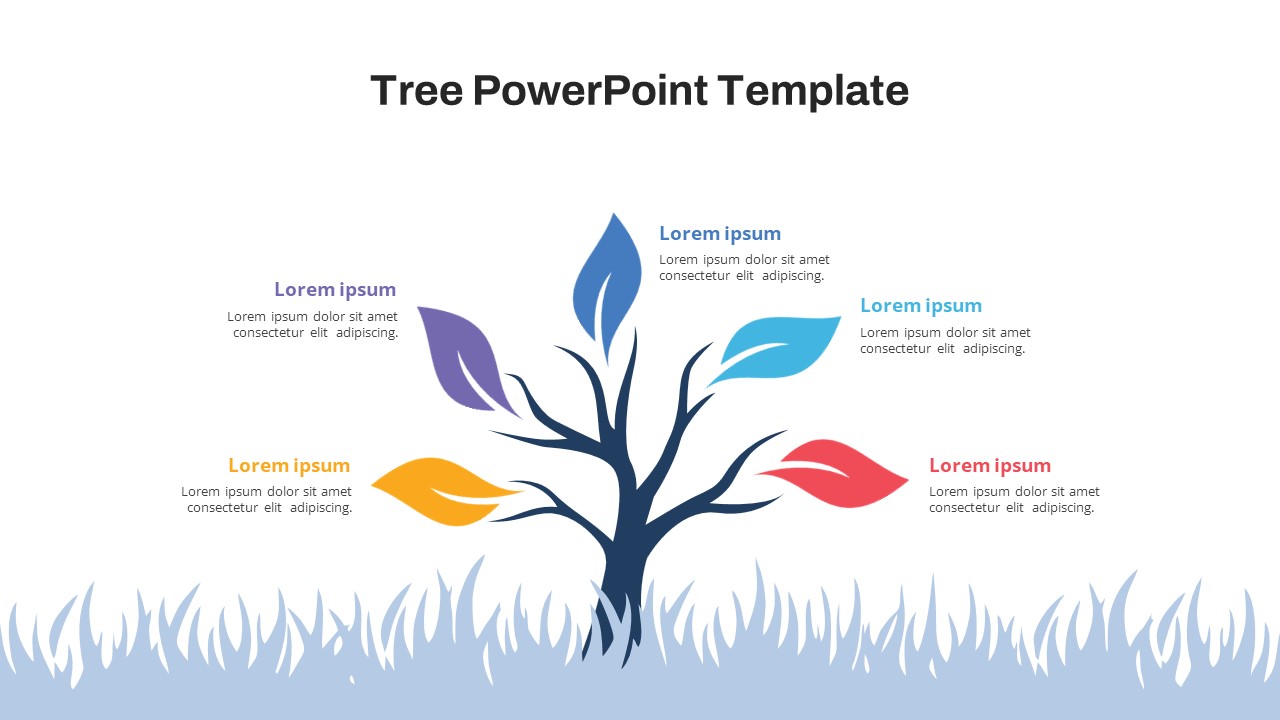
Free Colorful Tree Diagram for Growth & Strategy in PowerPoint & Google Slides
Infographics
Free
Business Growth and Partnership Background for PowerPoint & Google Slides
Business
Premium
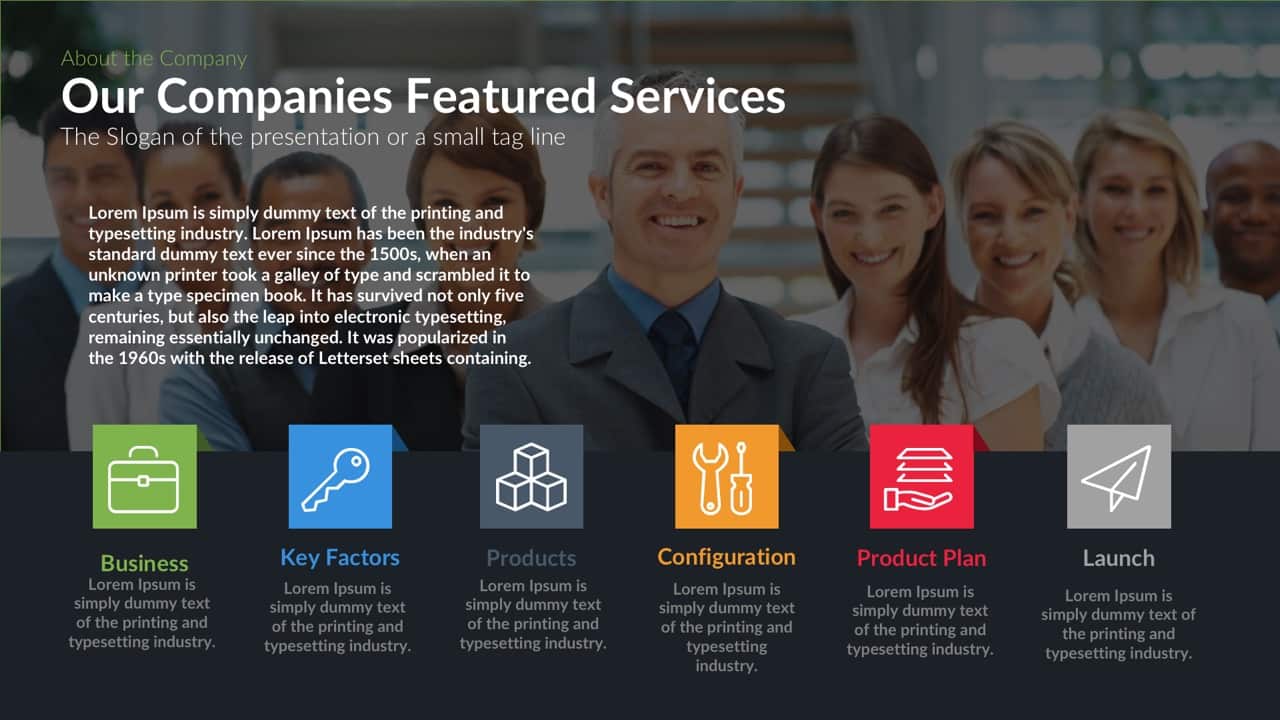
Company’s Featured Services Template for PowerPoint & Google Slides
Company Profile
Premium
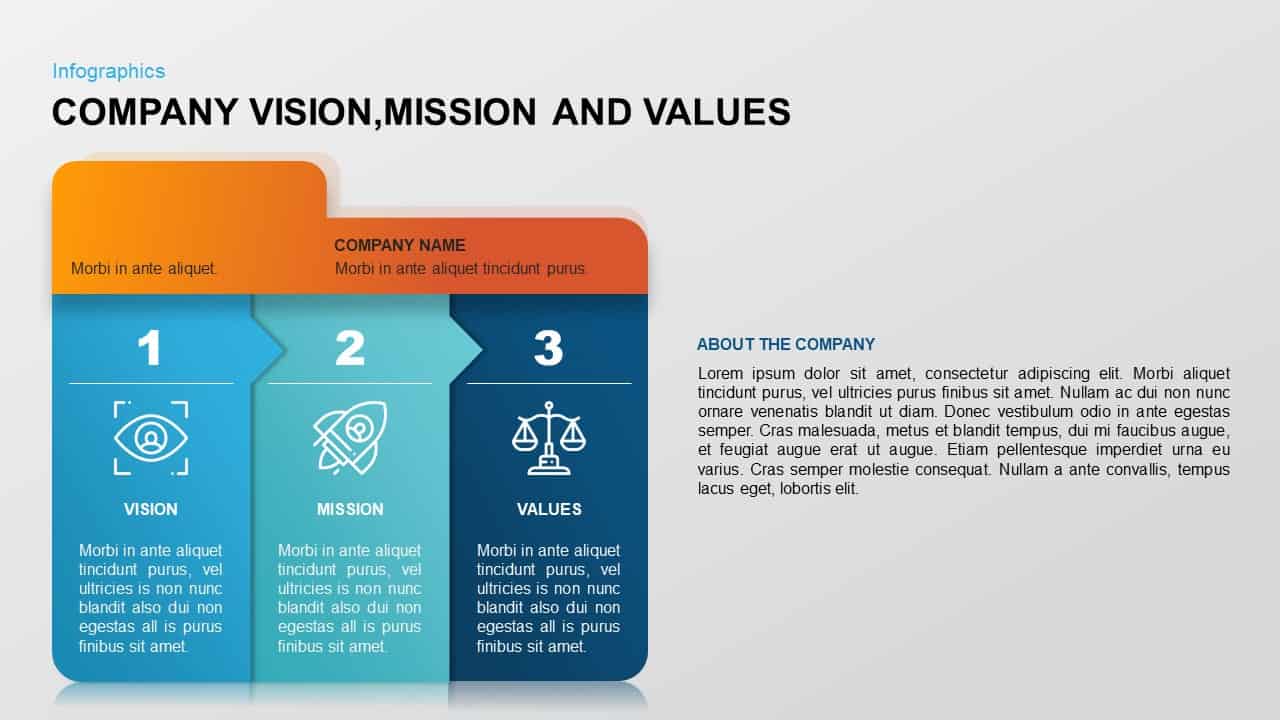
Company Vision, Mission & Values Diagram Template for PowerPoint & Google Slides
Vision and Mission
Premium
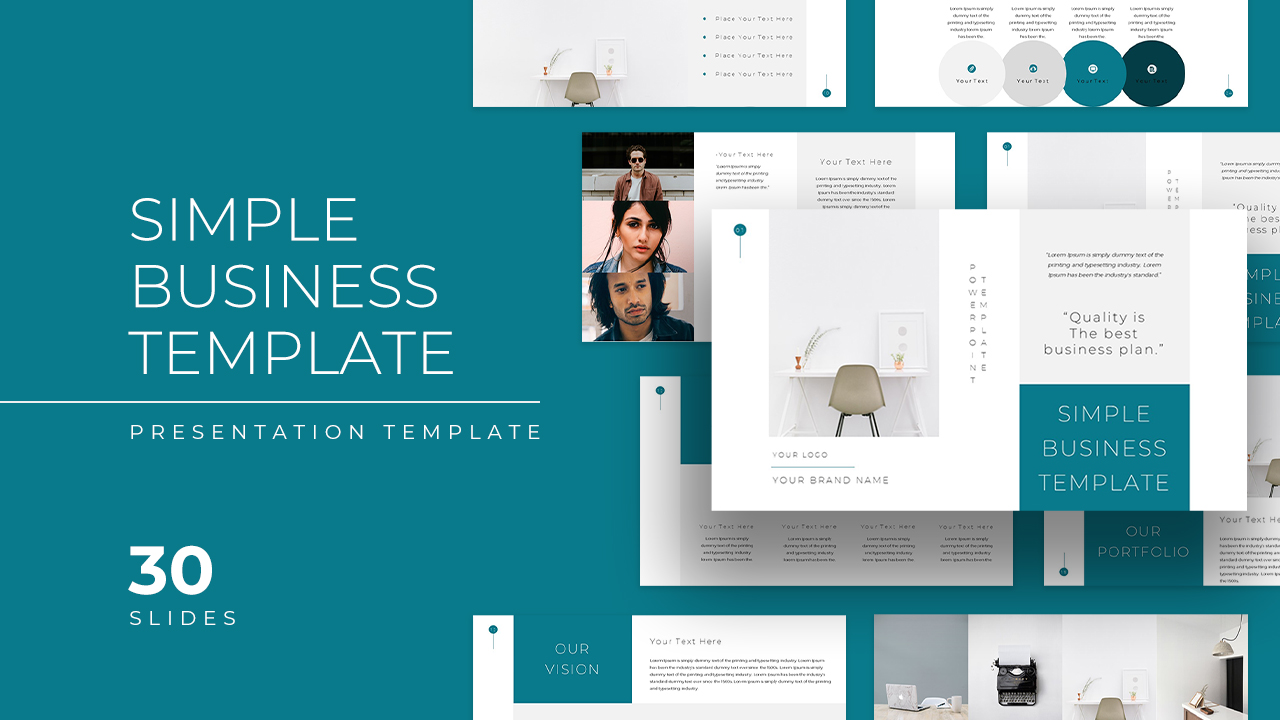
Simple Business Company Profile Deck Template for PowerPoint & Google Slides
Company Profile
Premium
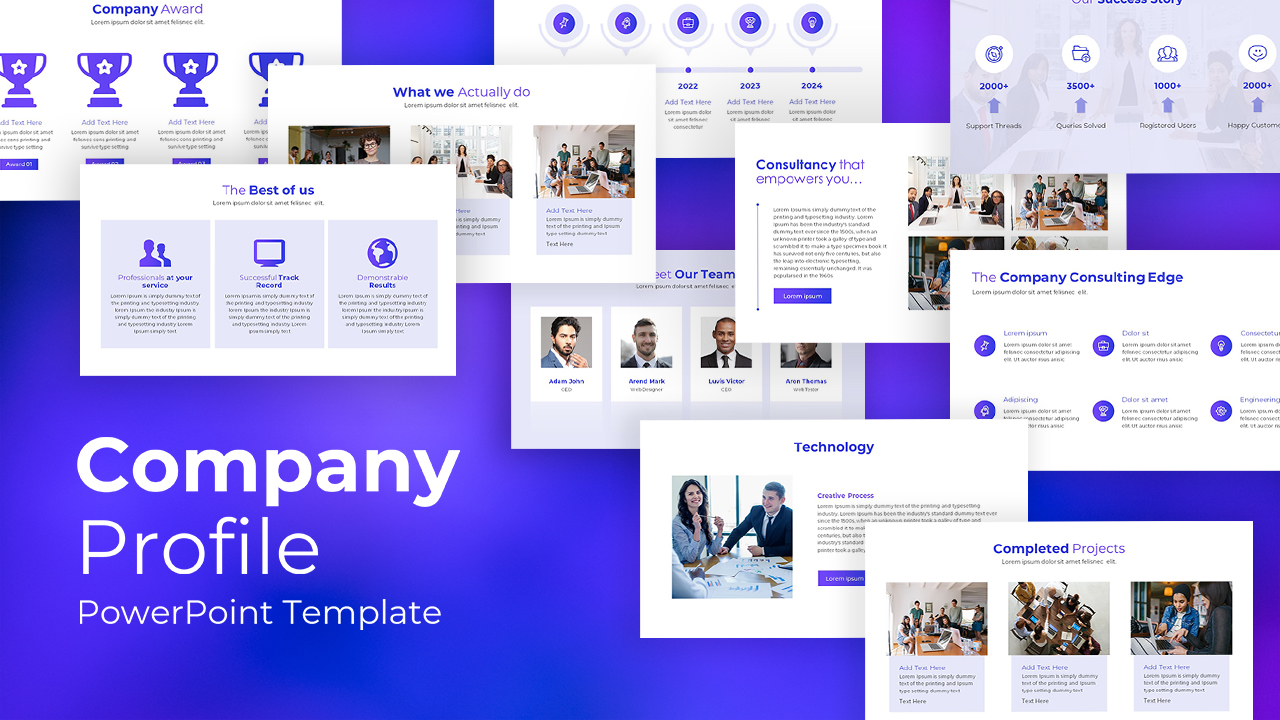
Corporate Solutions & Company Profile Template for PowerPoint & Google Slides
Company Profile
Premium
Purple Gradient Company Profile Deck Template for PowerPoint & Google Slides
Company Profile
Premium
Company Profile Overview template for PowerPoint & Google Slides
Company Profile
Premium
METCONNECT Company Profile Template for PowerPoint & Google Slides
Company Profile
Premium
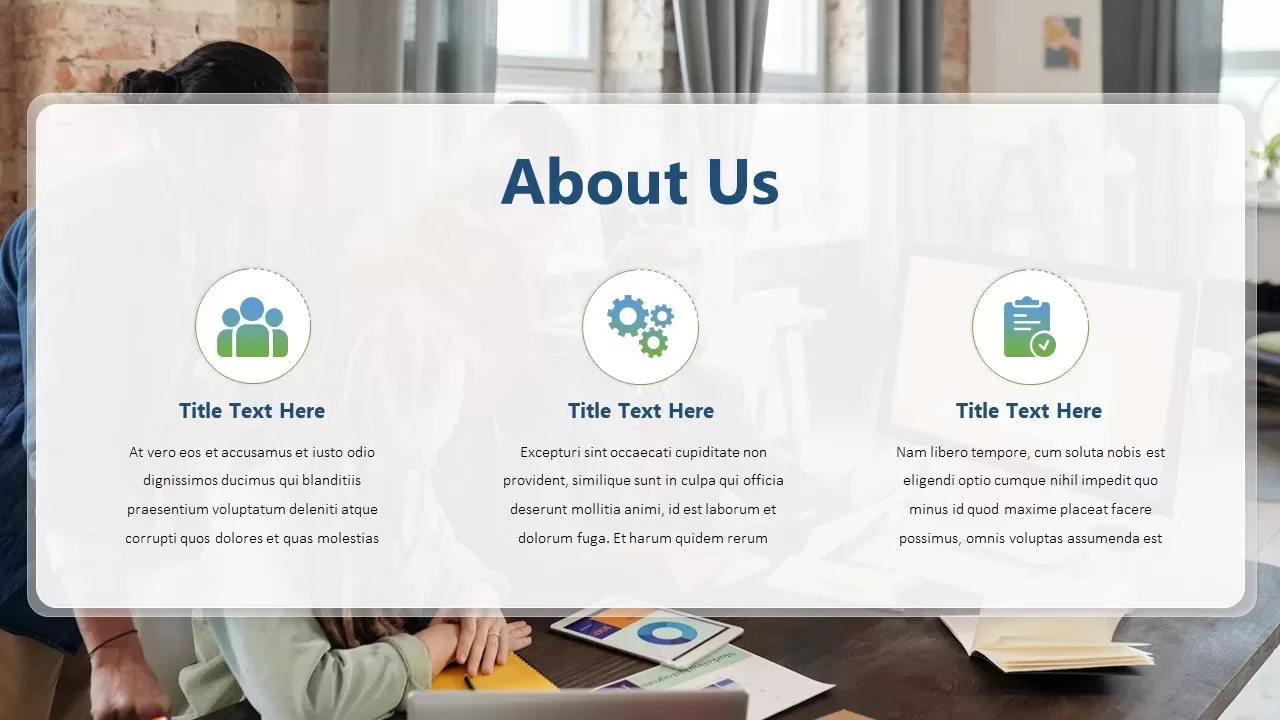
Professional Company About Us Slide Template for PowerPoint & Google Slides
Company Profile
Premium
Modern Company About Us Slide Template for PowerPoint & Google Slides
Marketing
Premium
Drone Business Company Profile Template for PowerPoint & Google Slides
Company Profile
Premium

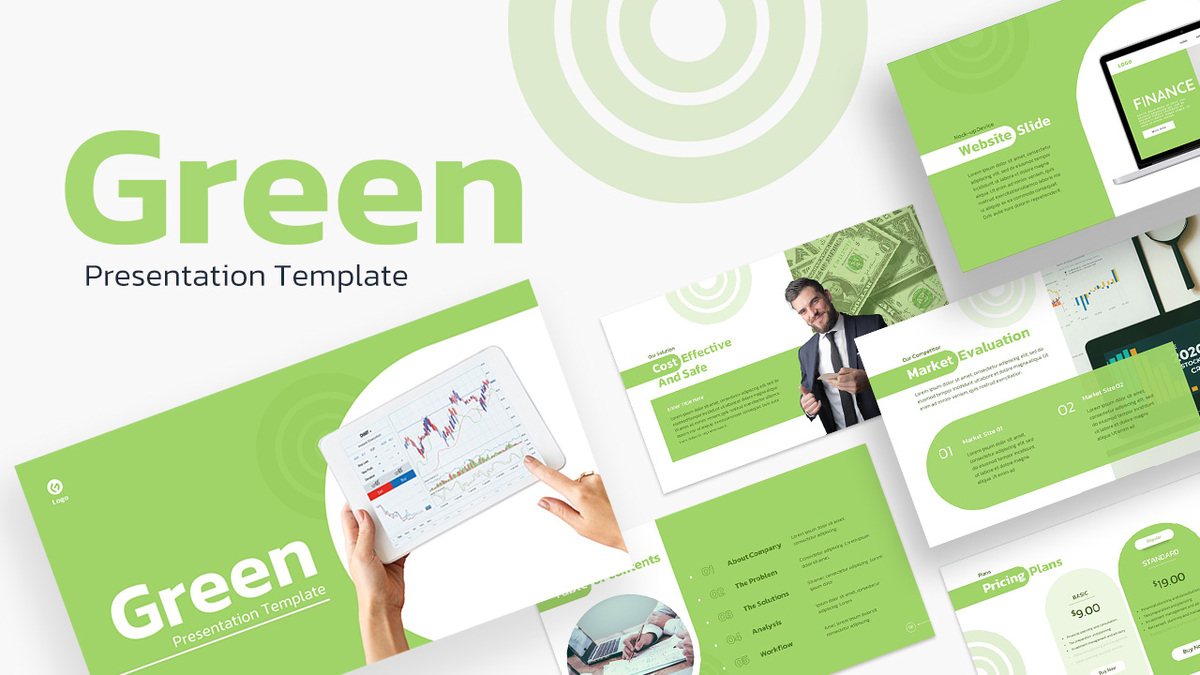
Green Company Profile Introduction Template for PowerPoint & Google Slides
Company Profile
Premium
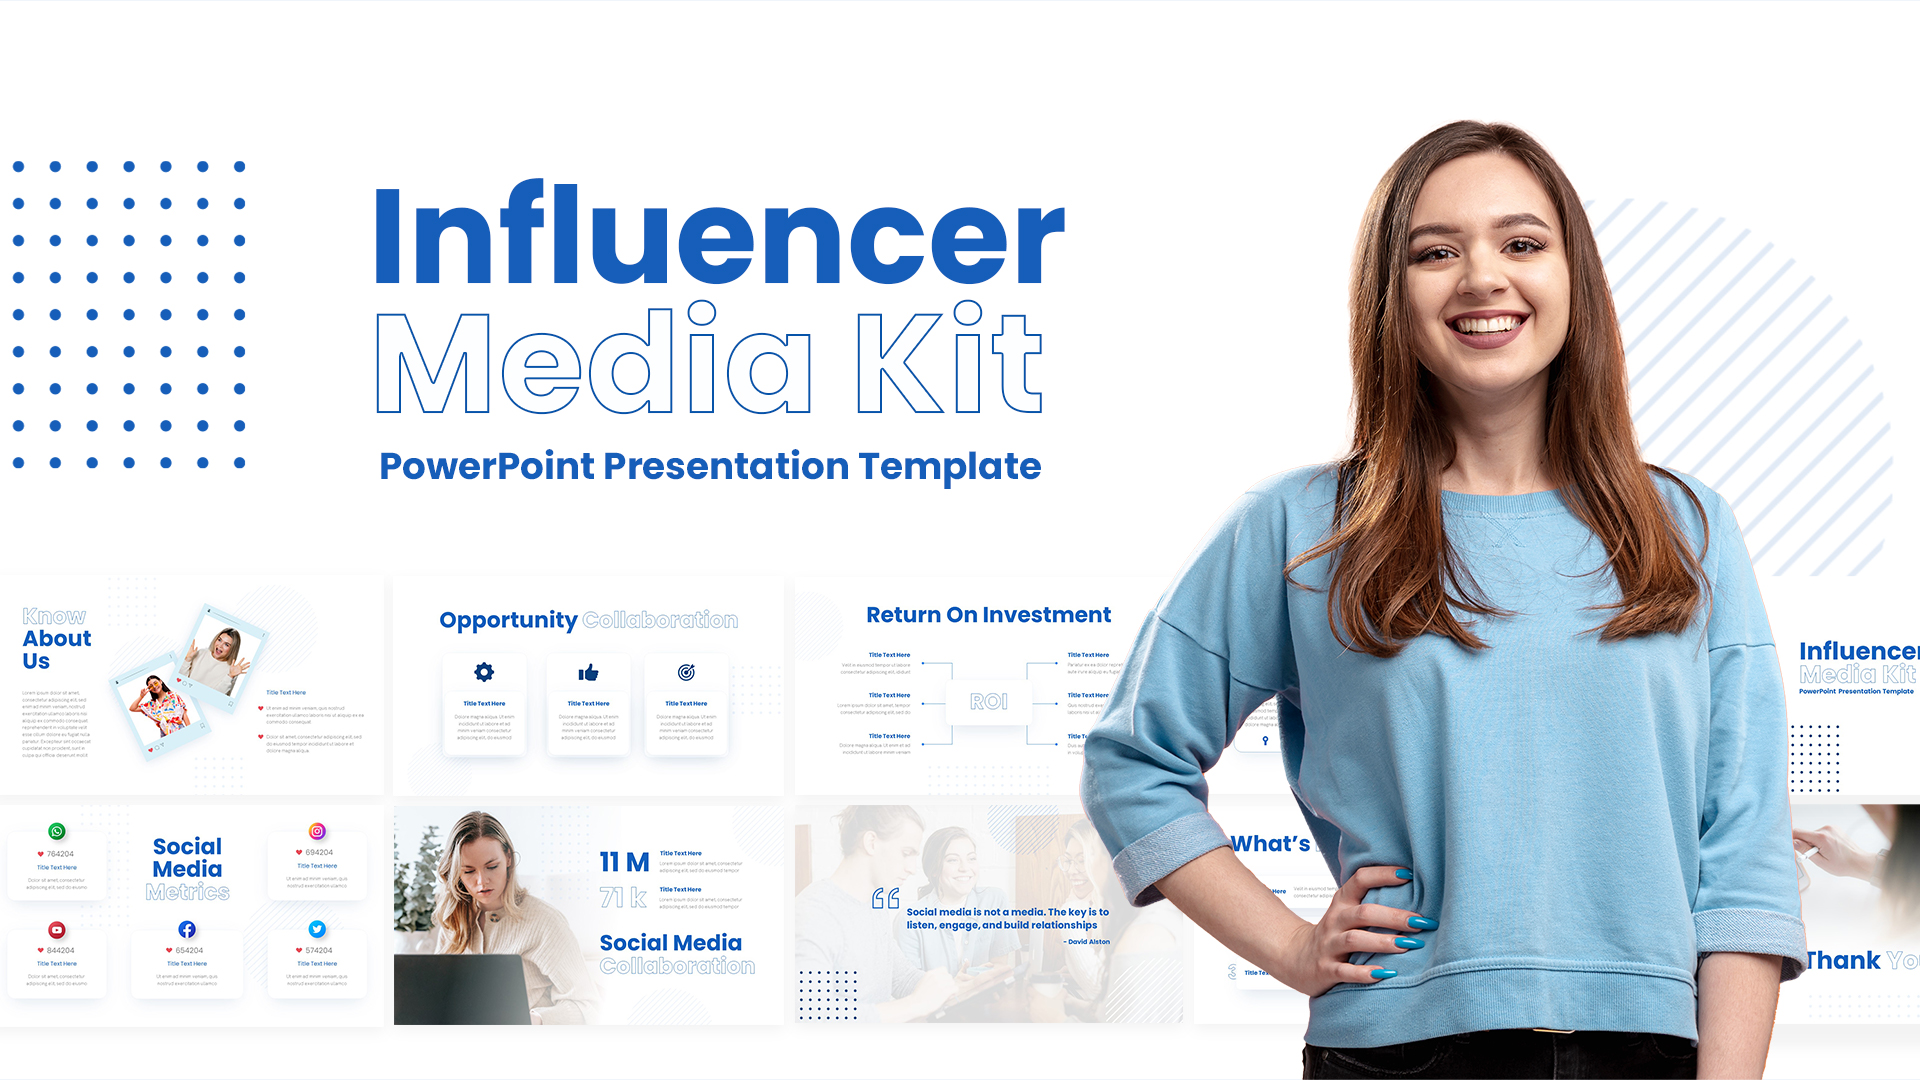
Influencer Media Kit Company Profile Template for PowerPoint & Google Slides
Company Profile
Premium
Electronics Company Profile Presentation Template for PowerPoint & Google Slides
Decks
Premium
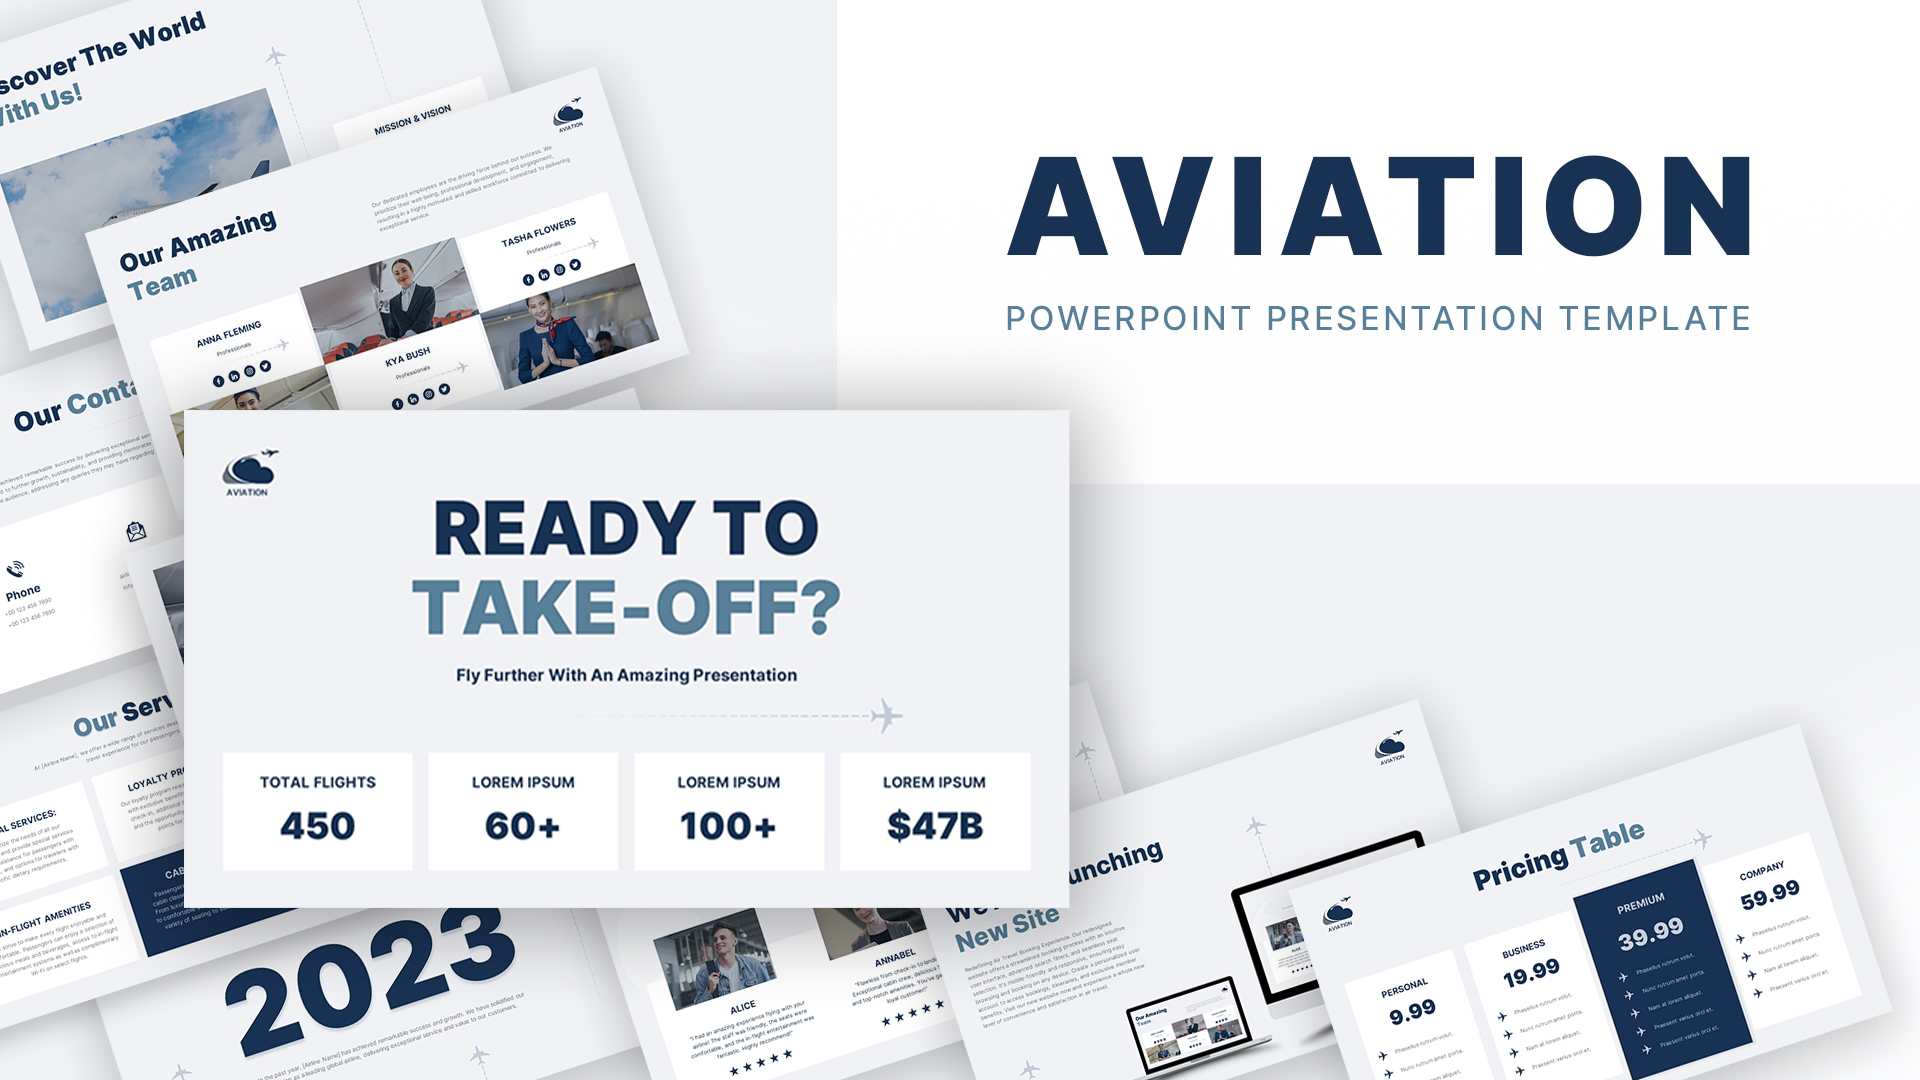
Aviation Industry Company Profile Deck Template for PowerPoint & Google Slides
Company Profile
Premium
Free Modern Company Profile About Us Slide Template for PowerPoint & Google Slides
Company Profile
Free
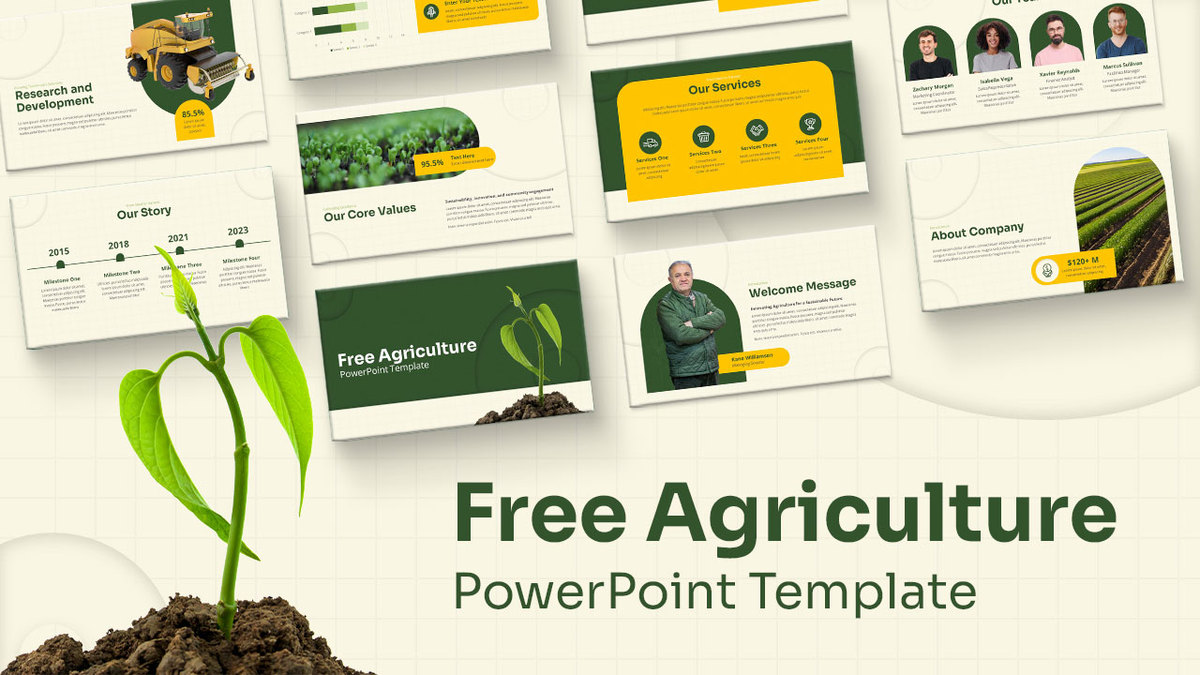
Free Agriculture Company Profile Pitch Deck template for PowerPoint & Google Slides
Company Profile
Free
AI Tech Agency Company Profile Deck Template for PowerPoint & Google Slides
Company Profile
Premium
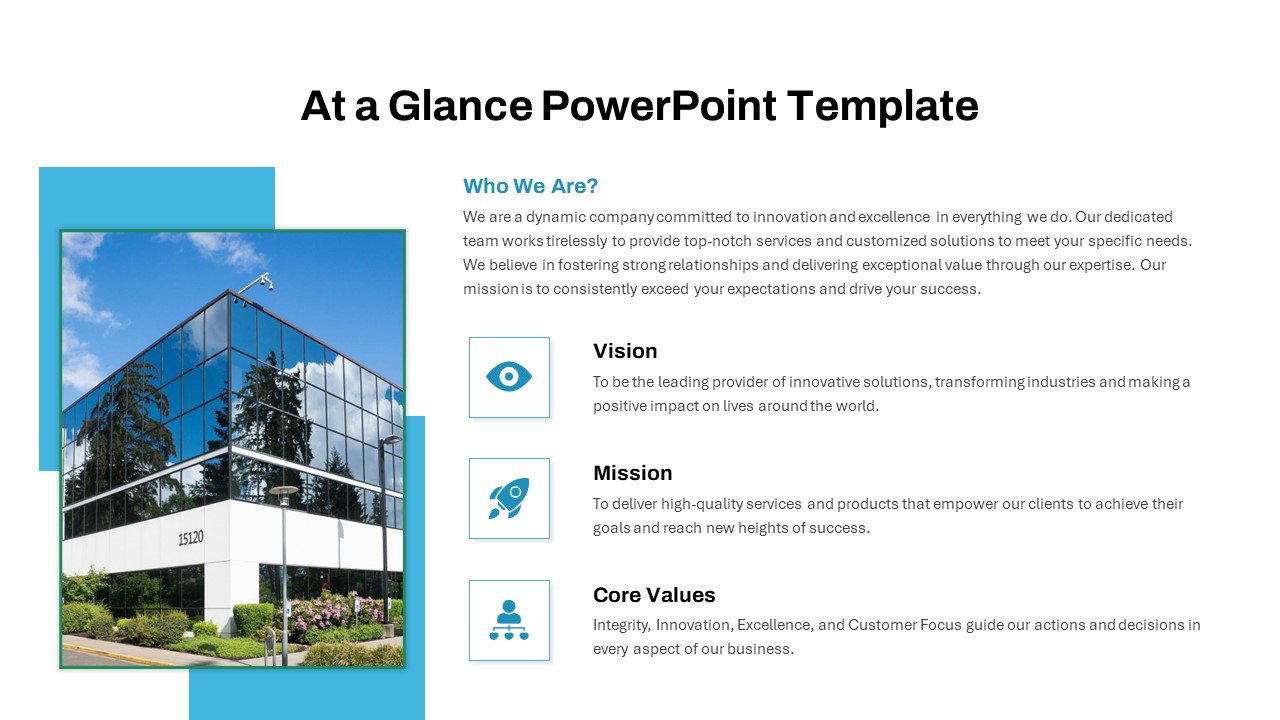
At a Glance Company Profile Overview Template for PowerPoint & Google Slides
Company Profile
Premium
Construction Company Profile Deck Template for PowerPoint & Google Slides
Company Profile
Premium
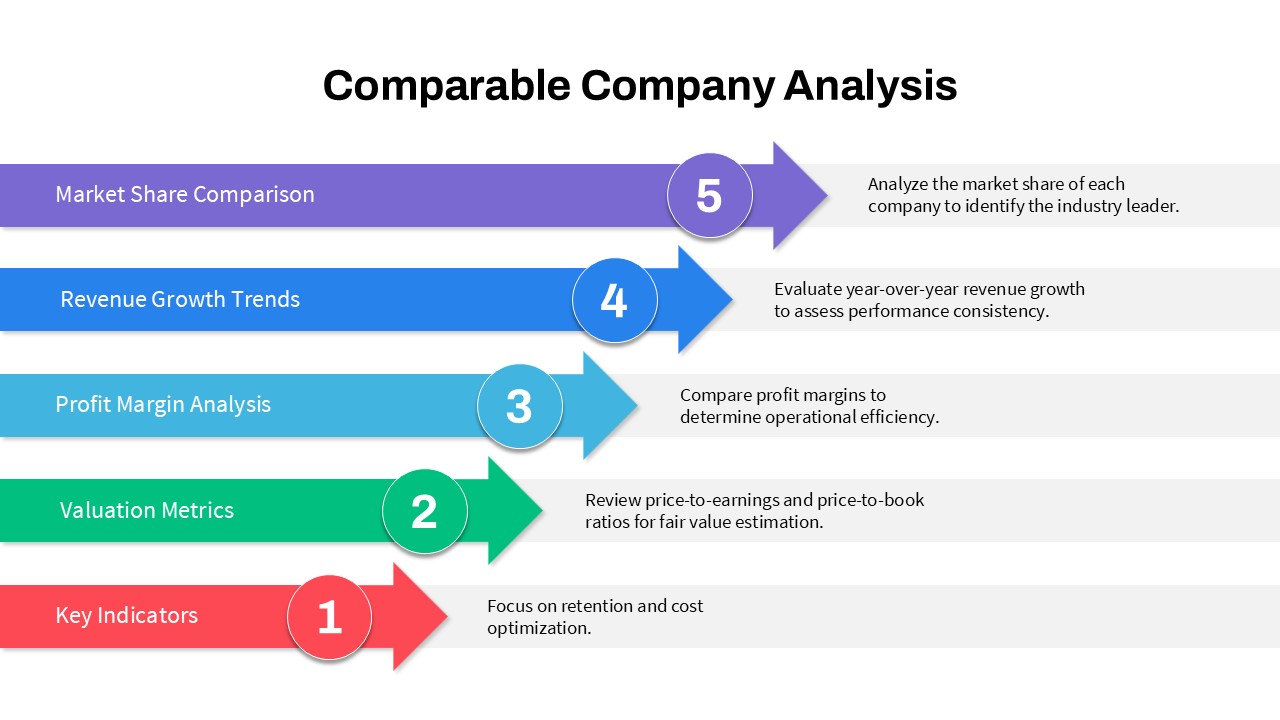
5-Step Comparable Company Analysis Template for PowerPoint & Google Slides
Arrow
Premium
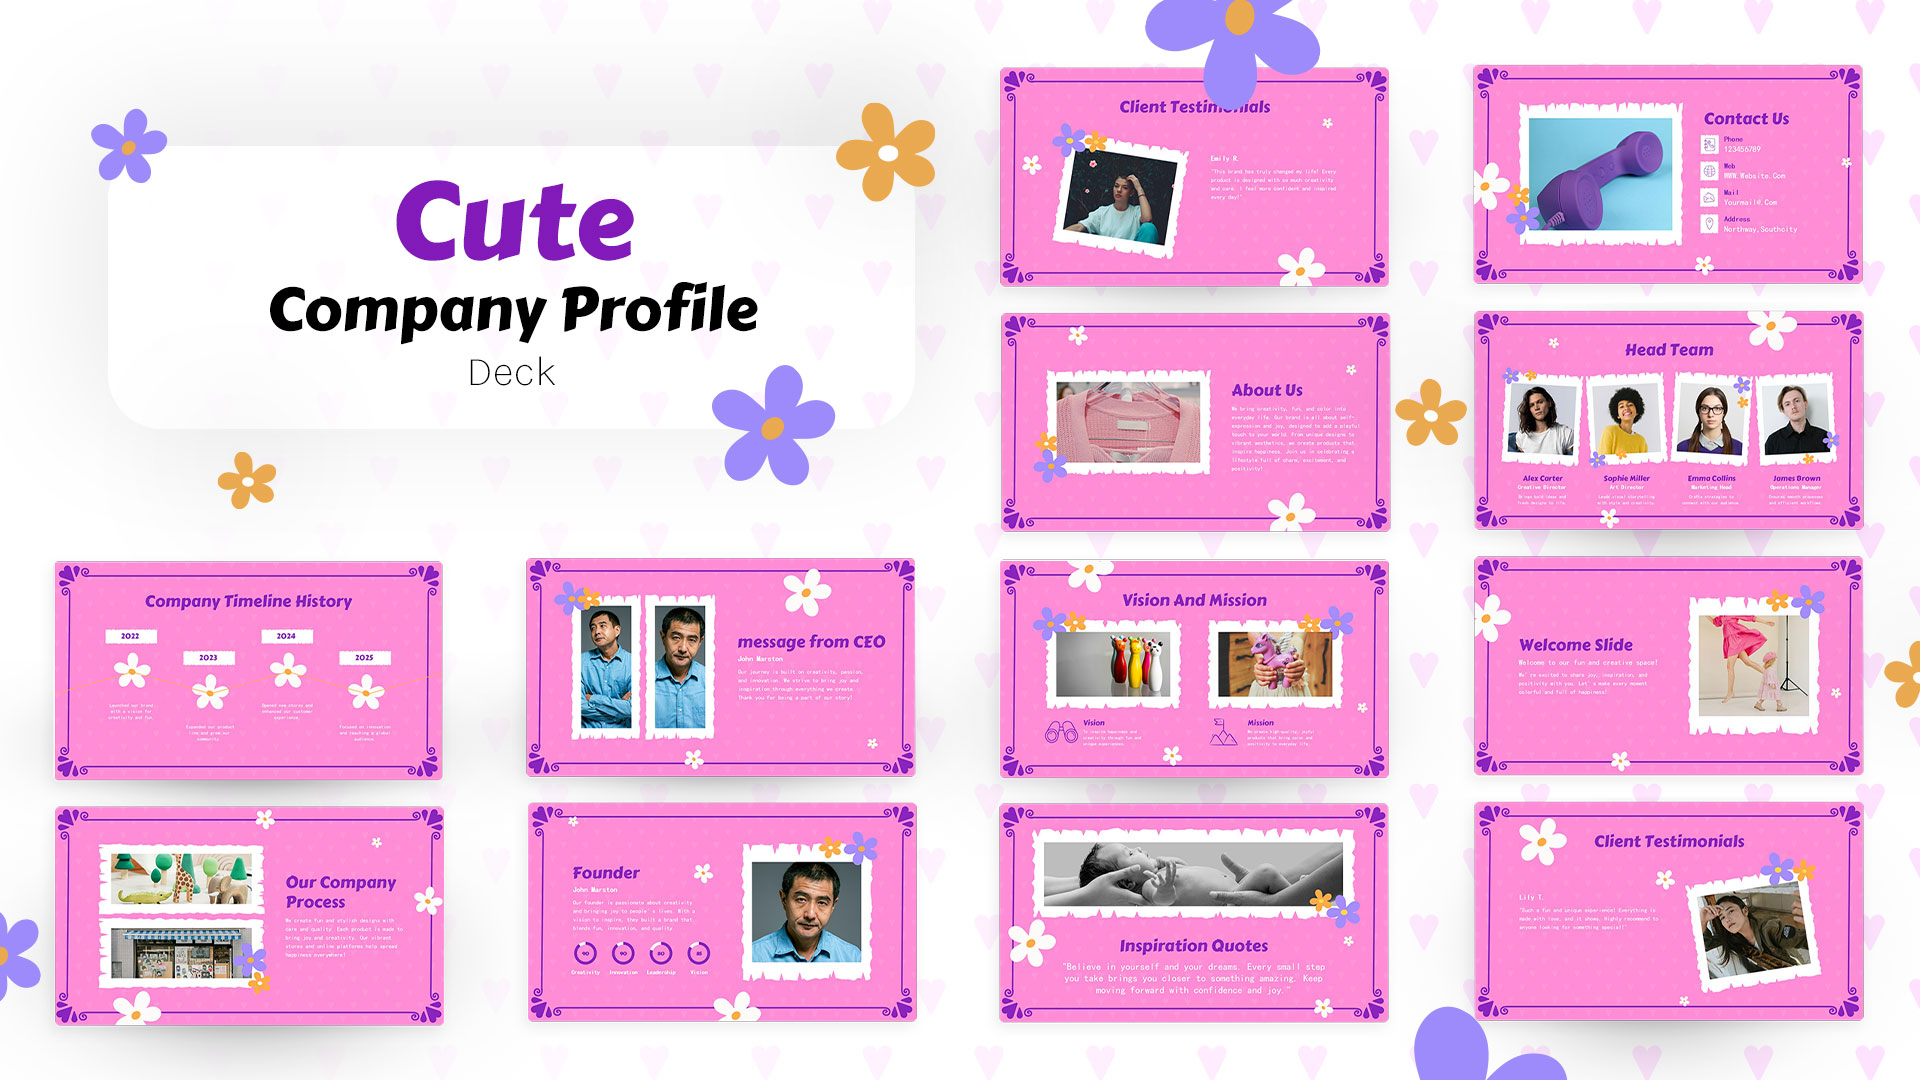
Cute Company Profile Presentation Deck Template for PowerPoint & Google Slides
Company Profile
Premium
Hospital Company Profile Presentation Template for PowerPoint & Google Slides
Decks
Premium