Vietnam Provinces Map Infographic Pack Template for PowerPoint & Google Slides


Description
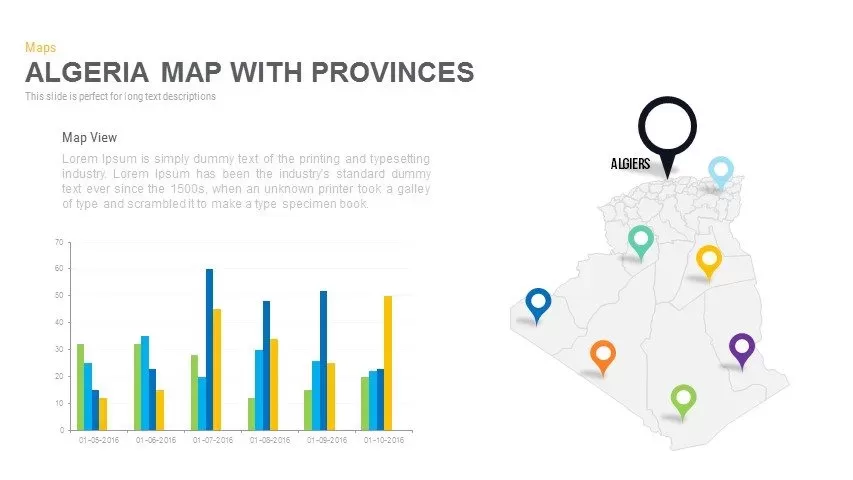
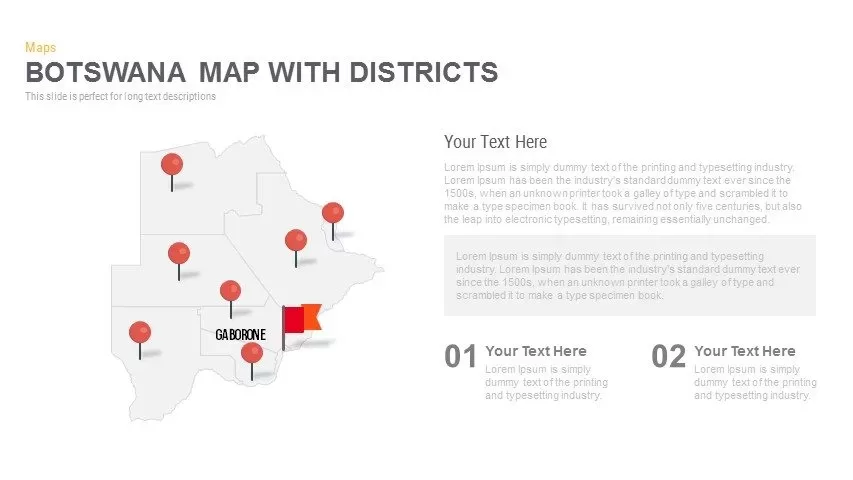
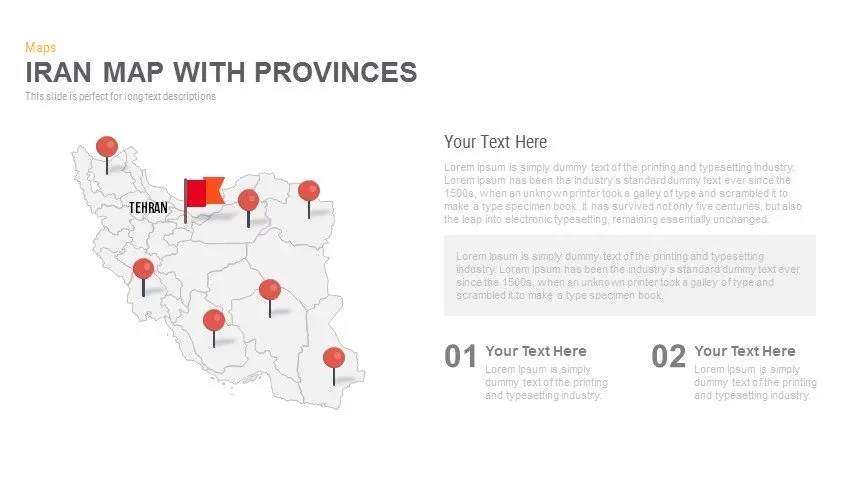
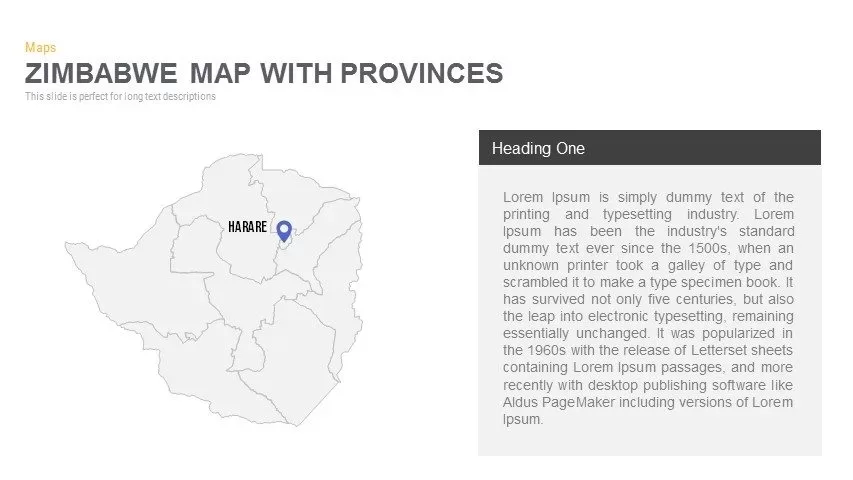
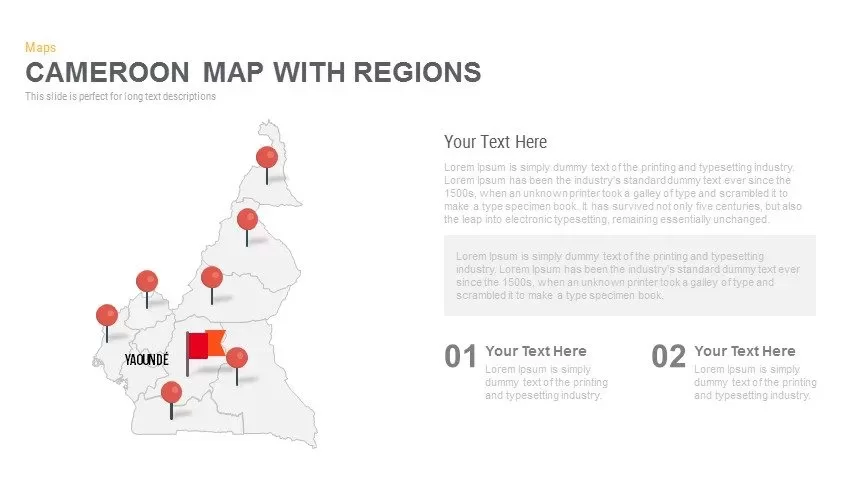
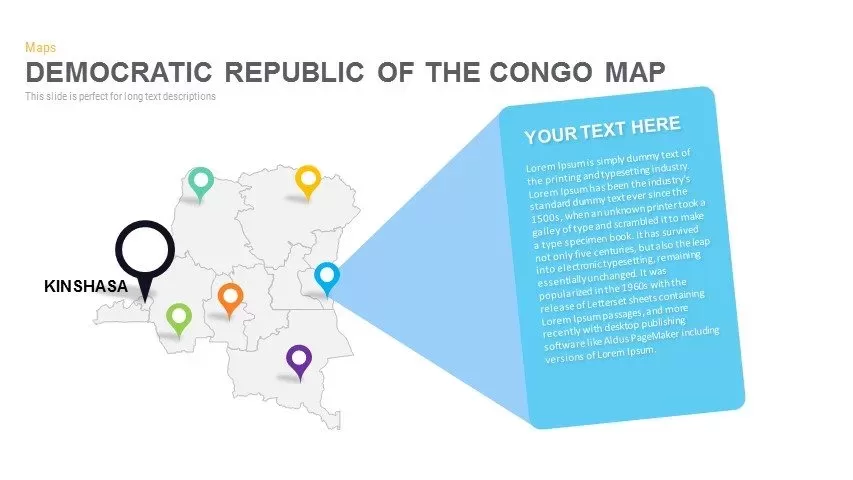
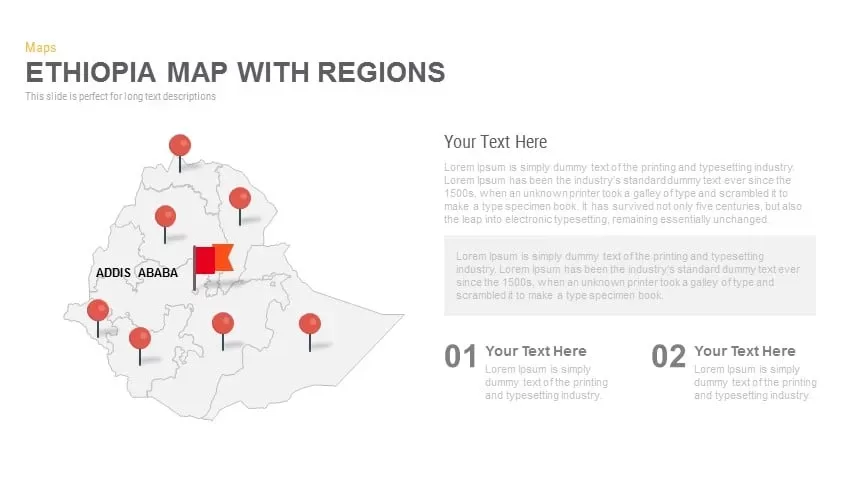
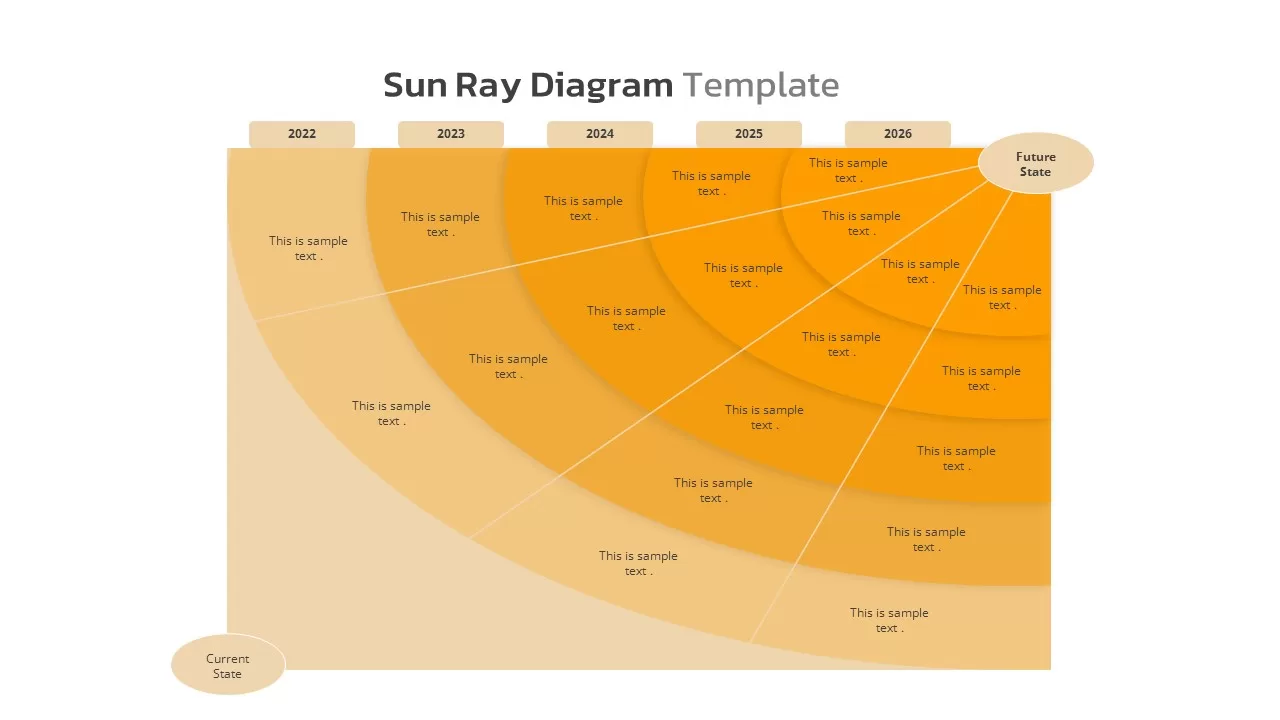
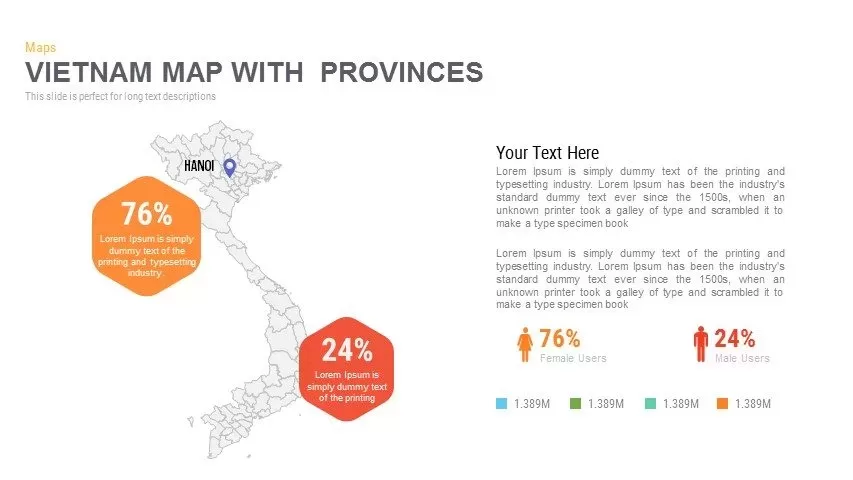
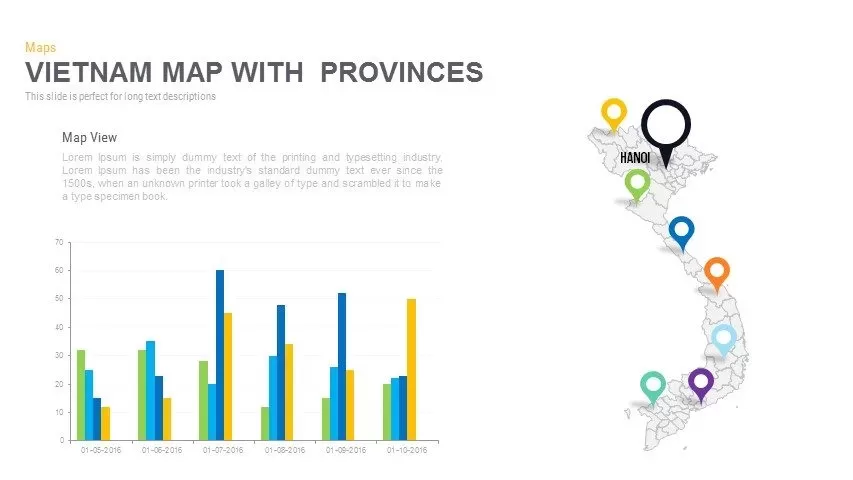
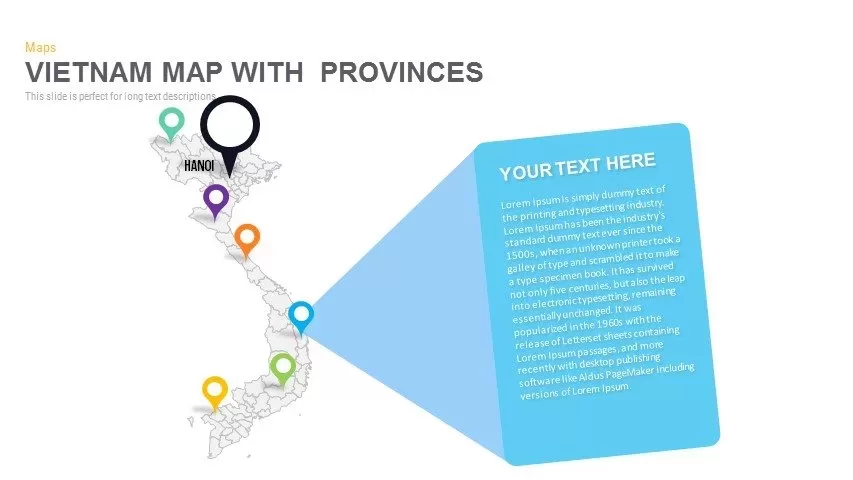
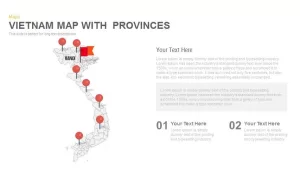
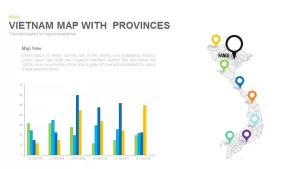
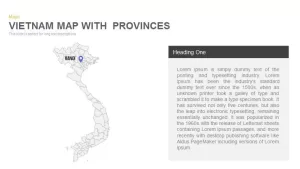
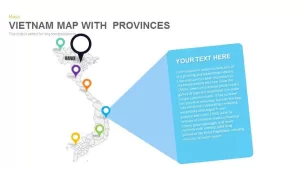
Leverage this six-slide Vietnam provinces map infographic pack to visualize regional insights, demographic trends, and strategic data with clarity and impact. Each slide features a distinct layout—from dual percentage callouts and narrative text panels to multi-pin marker maps, integrated bar charts, and magnified spotlight callouts—built around a crisp, fully editable outline of Vietnam’s provinces. Vibrant, fully customizable markers, flags, and polygon callouts in orange, green, blue, purple, yellow, and black provide instant visual differentiation, while intuitive text placeholders maintain balanced spacing and an uncluttered design. Vector-based shapes with subtle drop shadows ensure a modern, professional aesthetic that scales seamlessly across all display sizes.
Engineered for effortless customization, this infographic pack leverages built-in master slides, editable vector shapes, and intuitive grouping features to streamline your workflow. Swap marker icons, adjust color fills, or modify typography in seconds—alignment and spacing remain intact. Drag-and-drop layering, shape locking, and slide zoom enable precise edits without disrupting composition. Transparent backgrounds and resolution-independent assets guarantee crisp visuals in any theme or context. Optimized for both PowerPoint and Google Slides, this template pack eliminates cross-platform formatting issues, accelerates collaborative editing, and empowers you to craft data-driven presentations with professional polish.
Whether mapping market segments, outlining sales territories, or coordinating event locations across provinces, this Vietnam map pack empowers you to communicate complex geospatial insights clearly and memorably. Pre-defined color schemes aligned to each marker make maintaining brand consistency—or experimenting with thematic palettes—effortless.
Who is it for
Market researchers, regional planners, and development consultants will find this pack ideal for presenting province-level analyses, user distributions, or demographic studies. NGOs, government agencies, and educators can also leverage its diverse layouts to communicate project narratives, resource allocations, or event locations across Vietnam.
Other Uses
Repurpose these layouts for sales territory mapping, risk-assessment matrices, conference agendas, or project status updates. Combine callout styles and charts to highlight KPIs, stakeholder feedback, or milestone achievements across any region or context.
Login to download this file

Item ID
SB00694
Related Templates

North Korea Map with Provinces Infographic Pack Template for PowerPoint & Google Slides
Maps
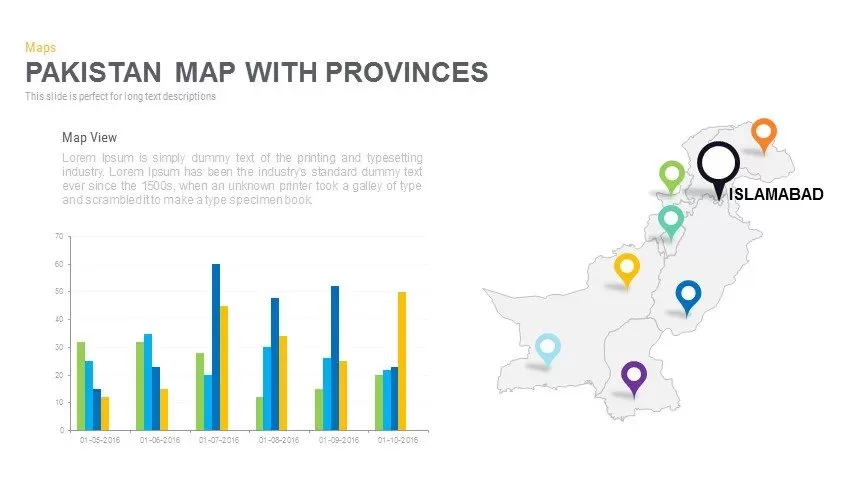
Pakistan Provinces Map Infographic Pack Template for PowerPoint & Google Slides
Maps
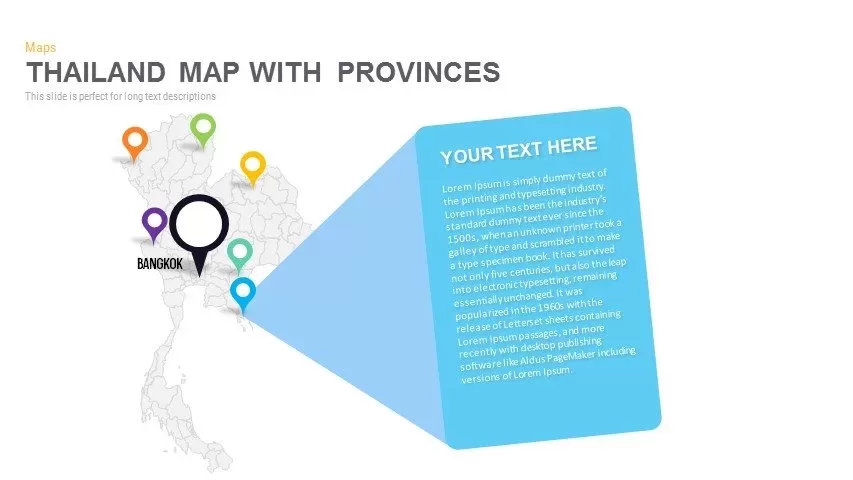
Thailand Provinces Map Infographic Pack Template for PowerPoint & Google Slides
Maps
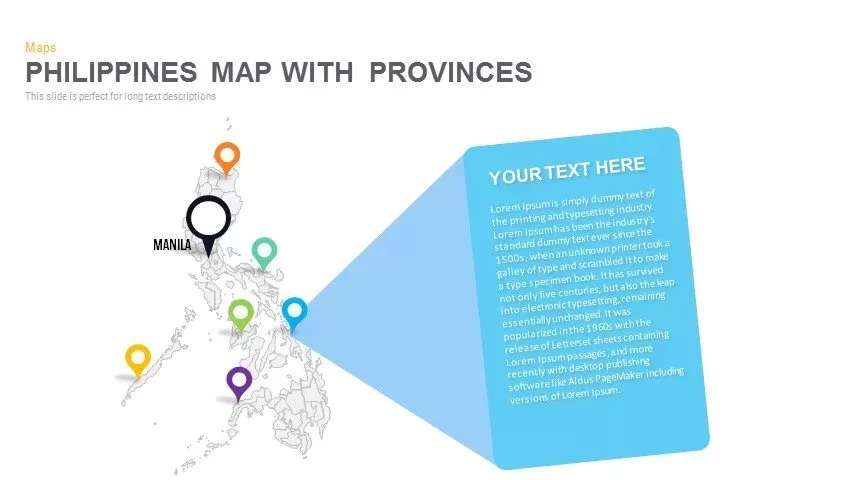
Philippines Map with Provinces Pack Template for PowerPoint & Google Slides
Maps
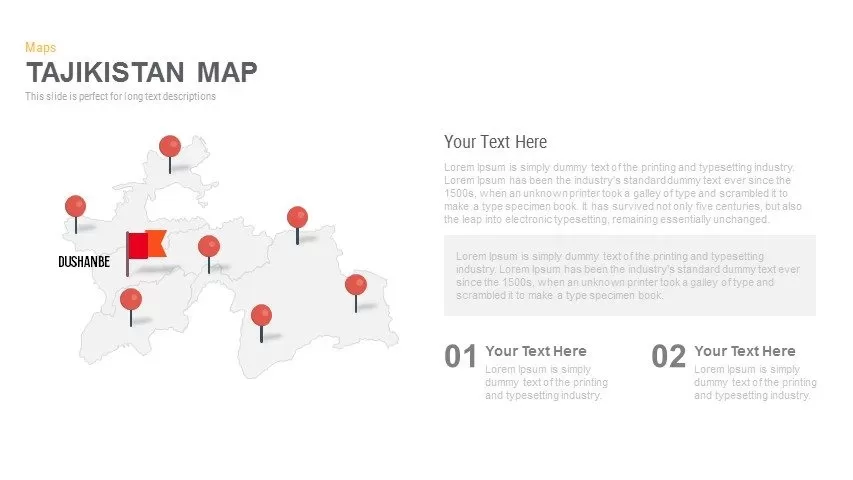
Editable Tajikistan Provinces Map Pack Template for PowerPoint & Google Slides
Maps
Algeria Map with Provinces Pack Template for PowerPoint & Google Slides
Maps
Angola Provinces Map Slide Pack Template for PowerPoint & Google Slides
World Maps
Angola Map with Provinces Slide Pack Template for PowerPoint & Google Slides
World Maps
Iran Map with Provinces Slide Pack Template for PowerPoint & Google Slides
World Maps
Zimbabwe Map with Provinces Slide Pack Template for PowerPoint & Google Slides
World Maps
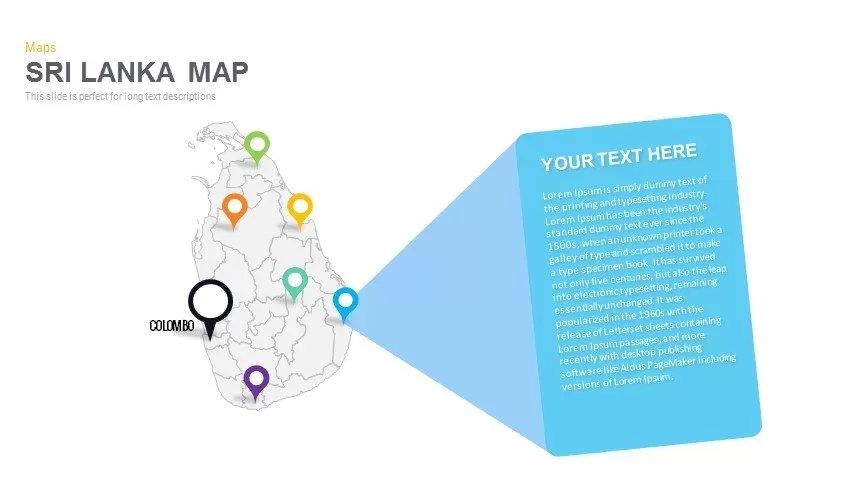
Sri Lanka Map Infographic Pack Template for PowerPoint & Google Slides
Maps

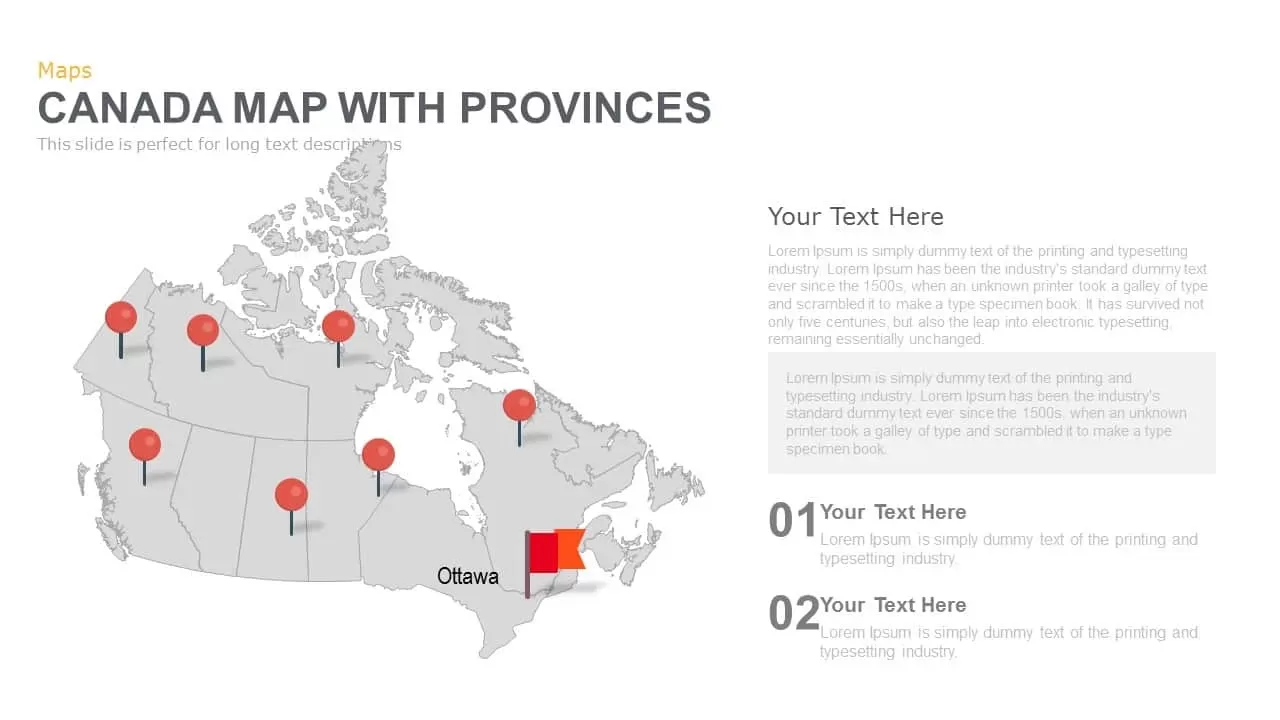
Canada Provinces Map Multi-Layout Template for PowerPoint & Google Slides
World Maps
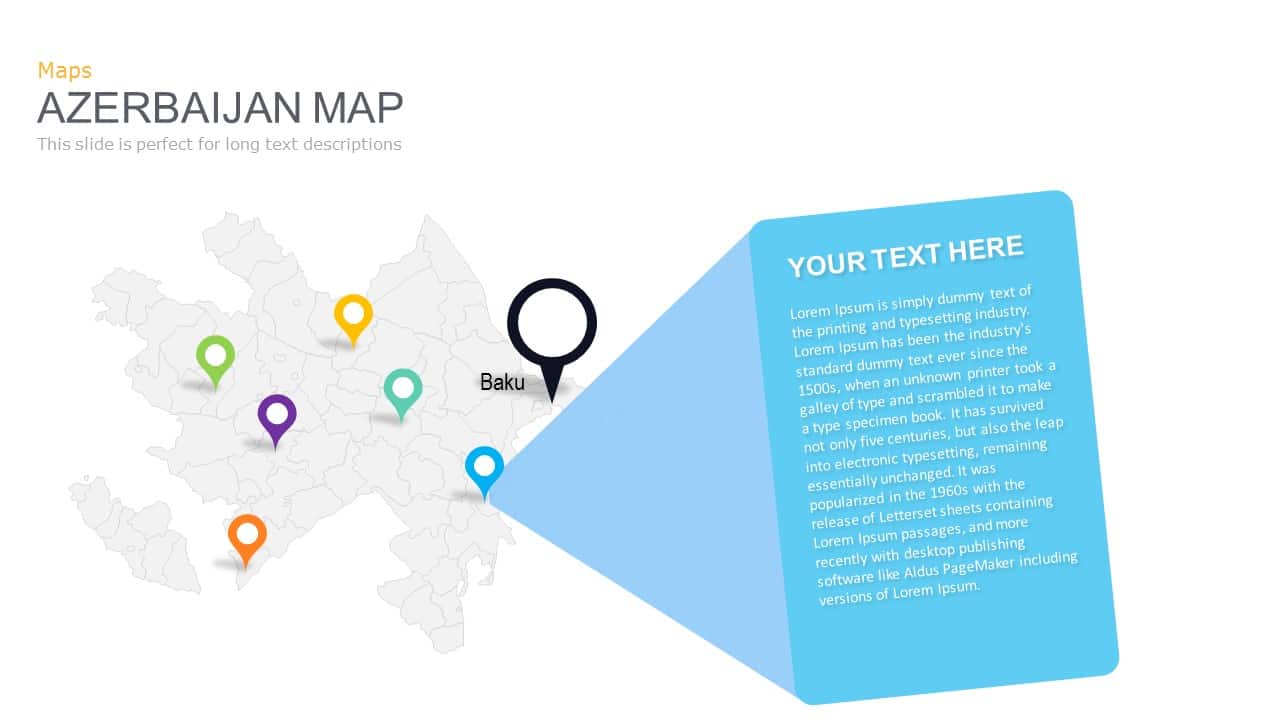
Azerbaijan Map with Provinces & Callouts Template for PowerPoint & Google Slides
World Maps
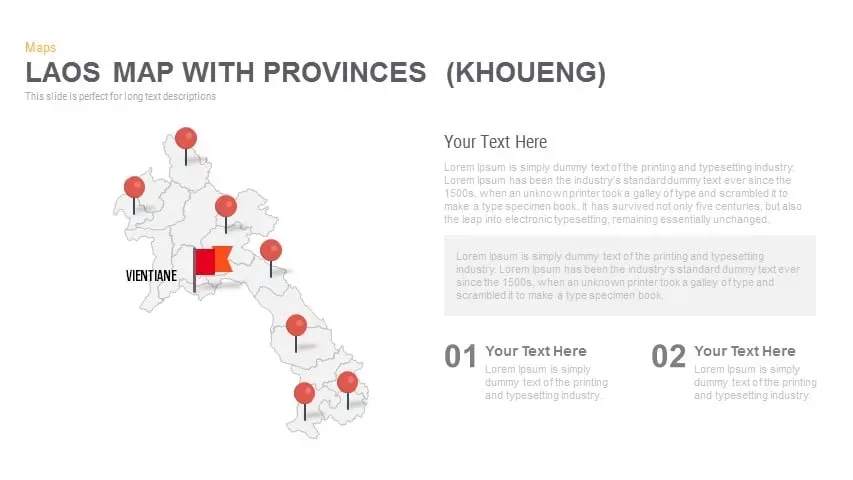
Laos Map with Provinces (Khoueng) Overview for PowerPoint & Google Slides
World Maps
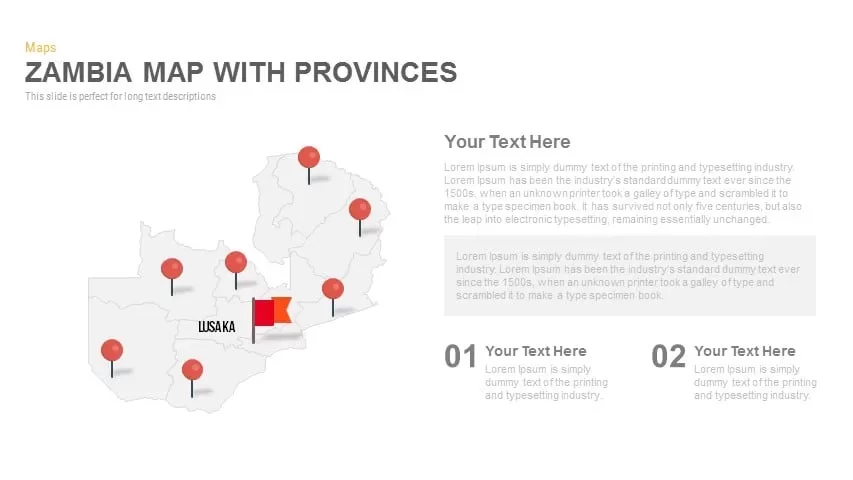
Zambia Map with Provinces Overview for PowerPoint & Google Slides
World Maps
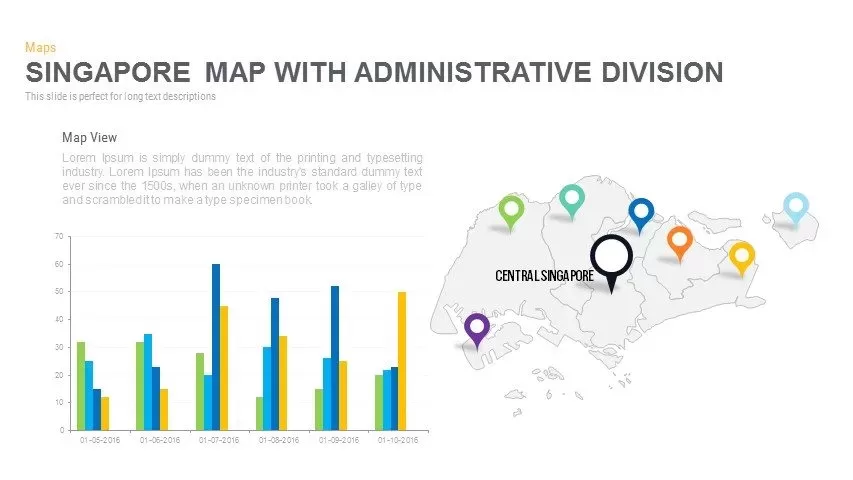
Singapore Map Pack Template for PowerPoint & Google Slides
Maps
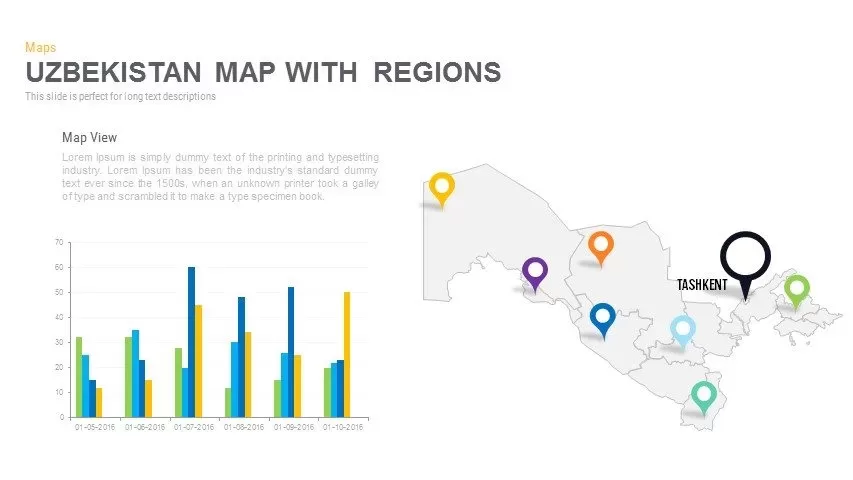
Uzbekistan Map with Regions Pack Template for PowerPoint & Google Slides
Maps
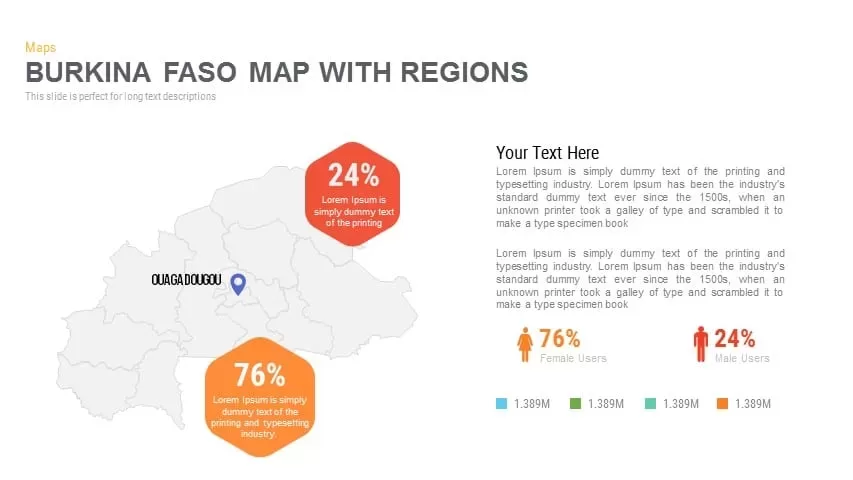
Burkina Faso Map with Regions Slide Pack Template for PowerPoint & Google Slides
World Maps
Cameroon Map with Regions Slide Pack Template for PowerPoint & Google Slides
World Maps
Chad Map with Regions Slide Pack Template for PowerPoint & Google Slides
World Maps
DR Congo Prefecture Map Slide Pack Template for PowerPoint & Google Slides
World Maps
Egypt Regional Map Slide Pack Template for PowerPoint & Google Slides
World Maps
Ethiopia Map with Regions Slide Pack Template for PowerPoint & Google Slides
World Maps
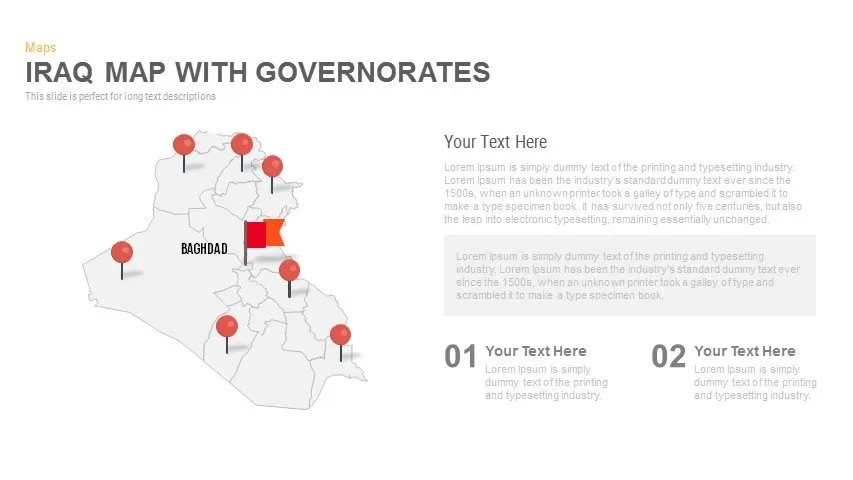
Interactive Iraq Map with Governorates Slide Pack for PowerPoint & Google Slides
World Maps
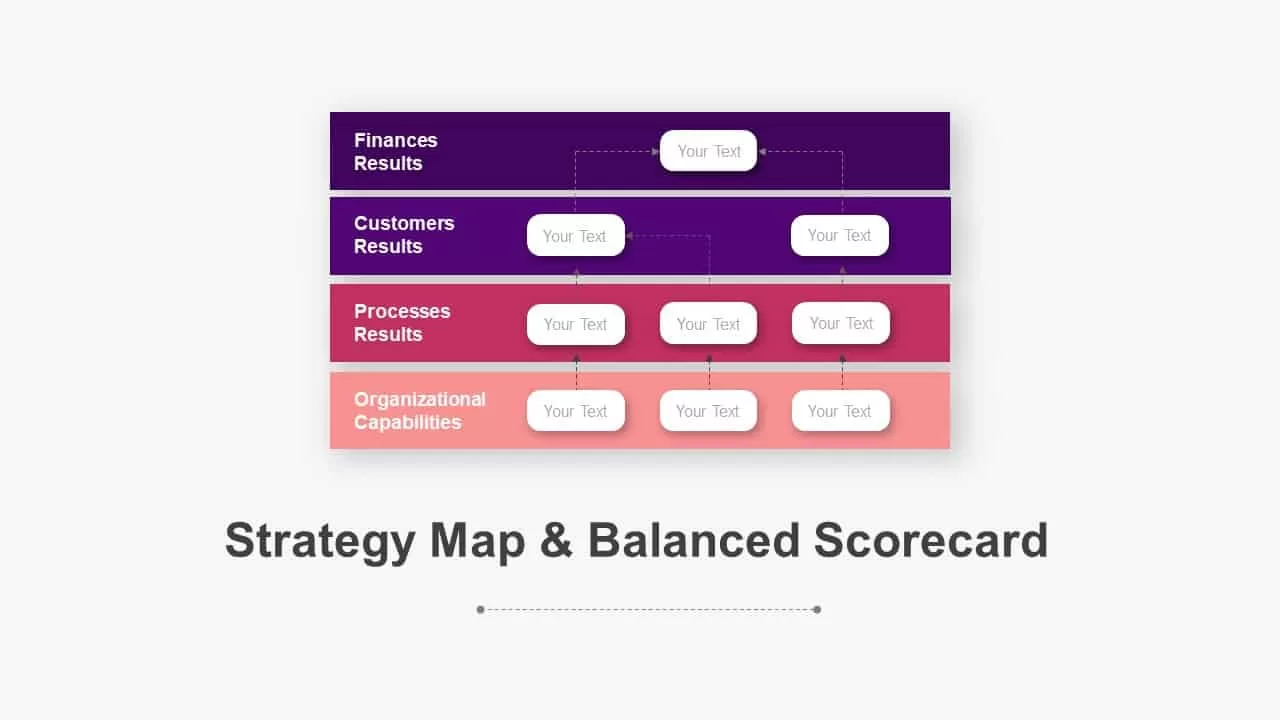
Balanced Scorecard Strategy Map Diagram Pack for PowerPoint & Google Slides
Business Strategy
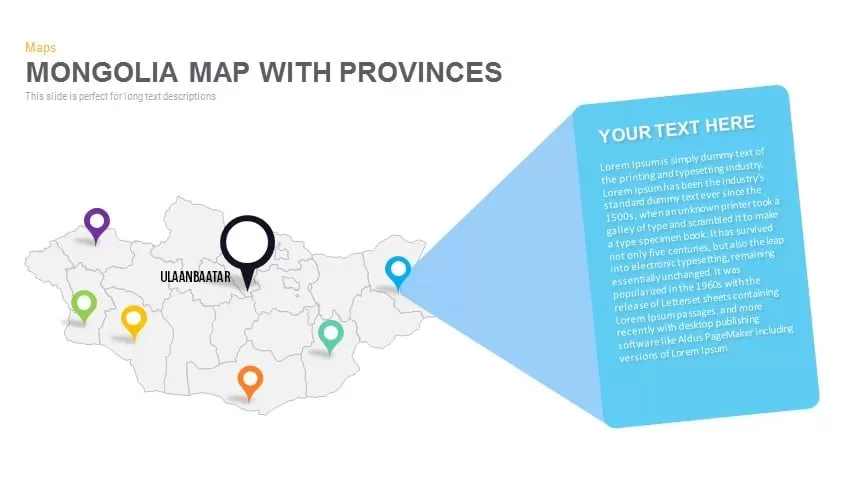
Mongolia Map With provinces PowerPoint and Keynote template
Maps

Sales Process Infographic Slides Pack Template for PowerPoint & Google Slides
Process
Agenda Infographic Pack of 2 Slides Template for PowerPoint & Google Slides
Agenda
Quad Chart Infographic Pack of 8 Slides Template for PowerPoint & Google Slides
Comparison Chart
Game Plan Infographic Slides Pack Template for PowerPoint & Google Slides
Infographics
Free Infographic Deck PowerPoint Pack for PowerPoint & Google Slides
Infographics
Free
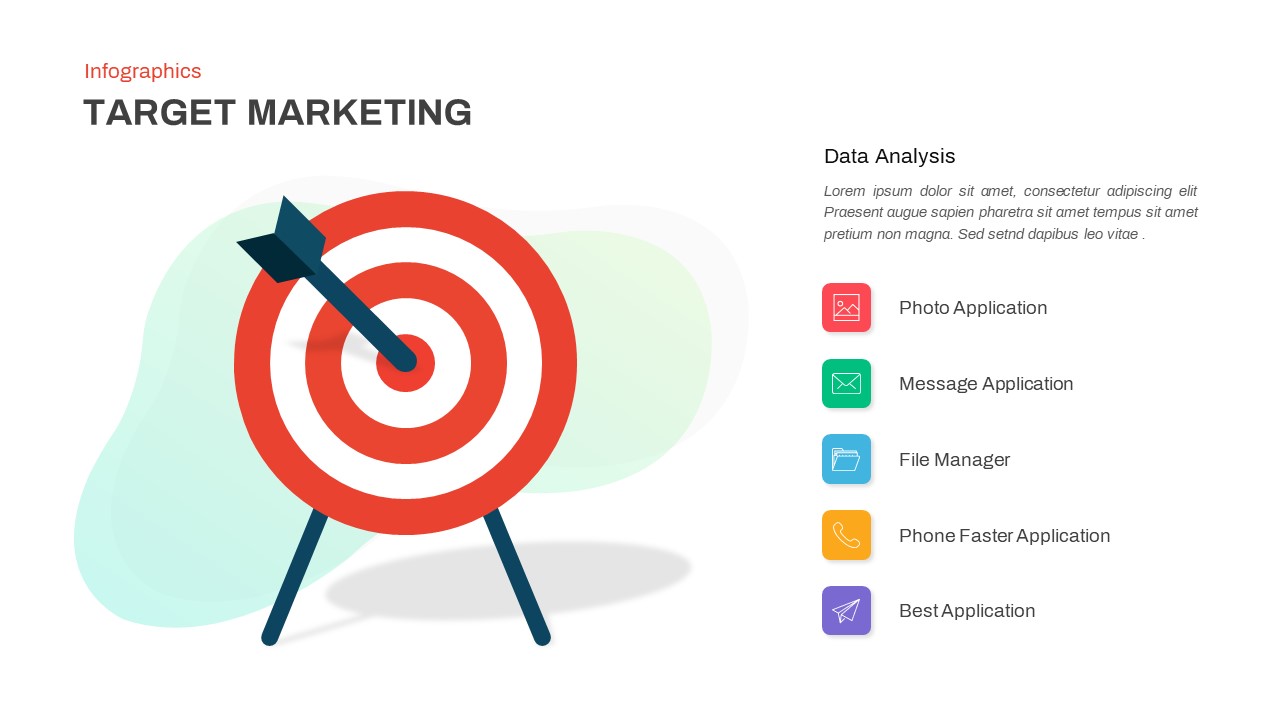
Target Marketing Infographic Slide Pack Template for PowerPoint & Google Slides
Infographics
Four-Step Funnel Infographic Pack Template for PowerPoint & Google Slides
Funnel

IT Strategic Diagram Infographic Pack Template for PowerPoint & Google Slides
Business Strategy
Overcoming Challenges Infographic Pack Template for PowerPoint & Google Slides
Opportunities Challenges
Three-Year Plan Infographic Pack Template for PowerPoint & Google Slides
Timeline
Now Next Later Infographic Pack Template for PowerPoint & Google Slides
Process
Animated Spinning Wheel Infographic Pack Template for PowerPoint & Google Slides
Circular
Root Cause Analysis Infographic Pack Template for PowerPoint & Google Slides
Process
Traffic Light Infographic Pack Template for PowerPoint & Google Slides
Pitch Deck
Types of Budget Infographic Pack Template for PowerPoint & Google Slides
Comparison
Data-driven GDP Growth Infographic Pack Template for PowerPoint & Google Slides
Infographics
Transformation Roadmap Infographic Pack Template for PowerPoint & Google Slides
Timeline
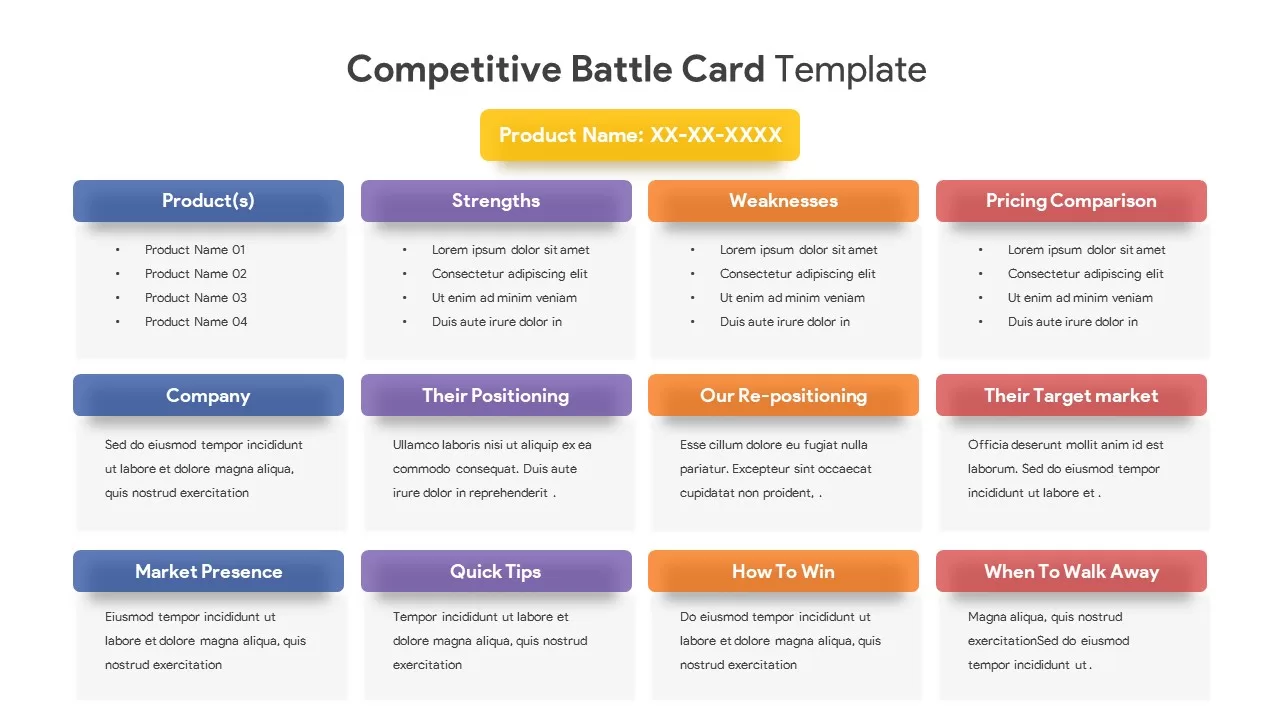
Competitive Battle Card Infographic Pack Template for PowerPoint & Google Slides
Competitor Analysis

Free Colorful Infographic Slide Pack Template for PowerPoint & Google Slides
Roadmap
Free
Free Multi-Step Funnel Infographic Slide Pack Template for PowerPoint & Google Slides
Funnel
Free
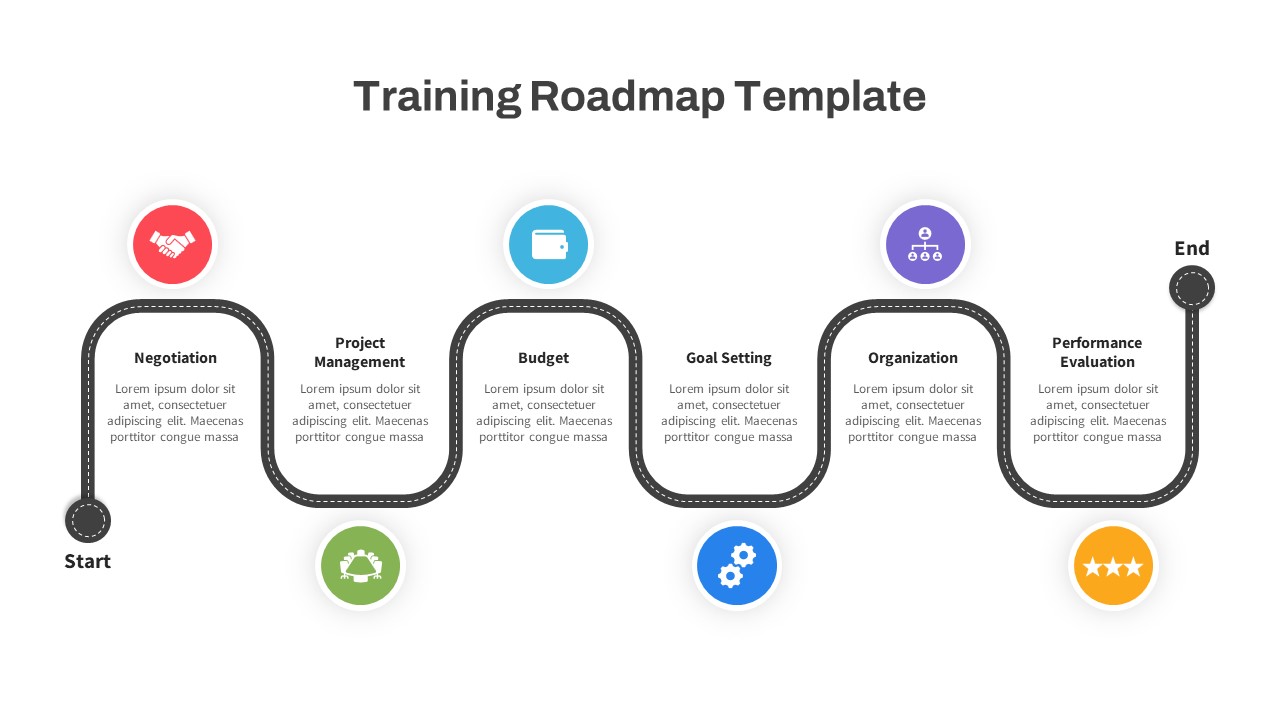
Training Roadmap Infographic Pack Template for PowerPoint & Google Slides
Roadmap
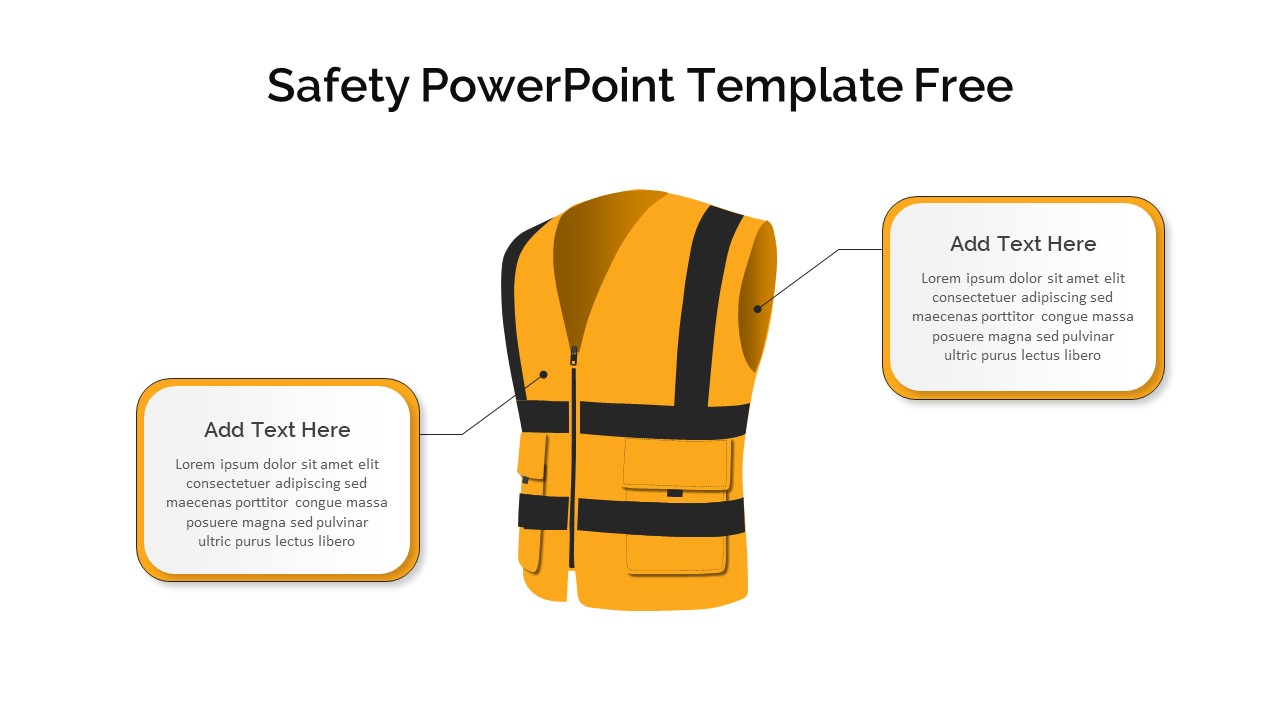
Free 4 Safety Equipment Infographic Pack Template for PowerPoint & Google Slides
Pitch Deck
Free
Free Three and Four Pillar Infographic Pack Template for PowerPoint & Google Slides
Process
Free
3D Building Blocks Infographic Pack Template for PowerPoint & Google Slides
Infographics
Vision & Strategy Infographic Pack Template for PowerPoint & Google Slides
Vision and Mission
Three Options Infographic Pack Template for PowerPoint & Google Slides
Process
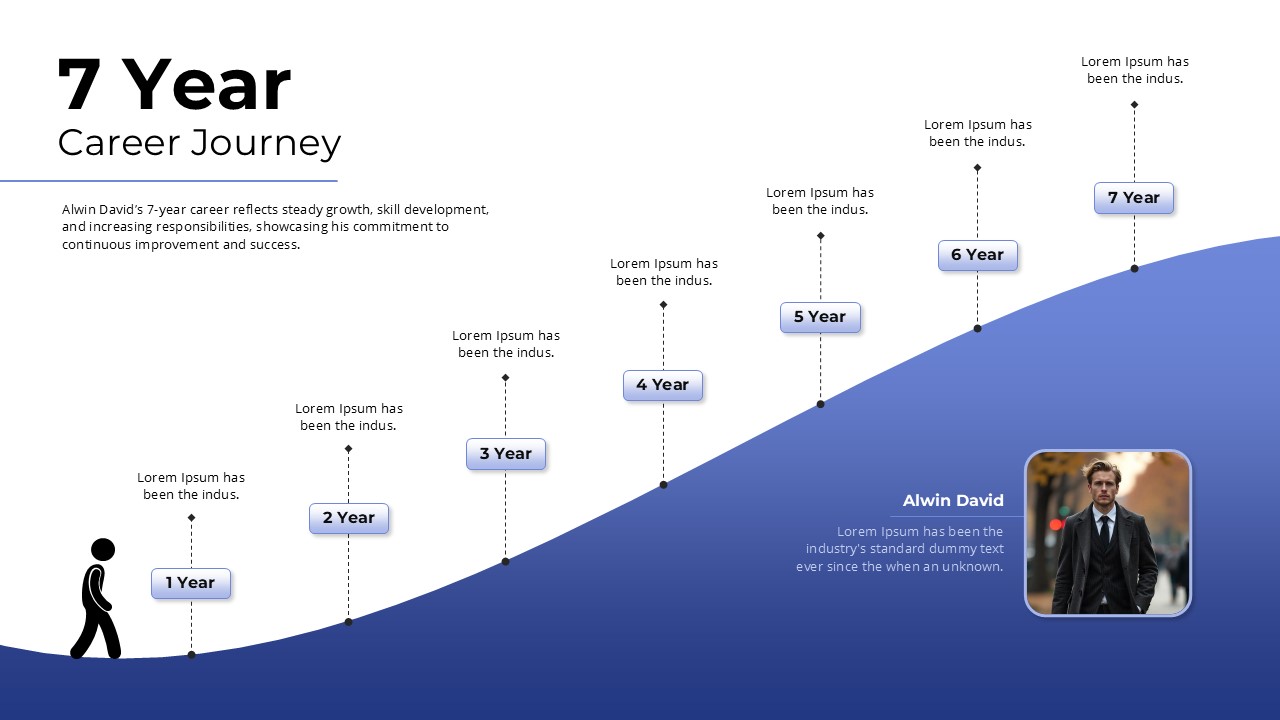
Career Journey Infographic Pack Template for PowerPoint & Google Slides
Timeline
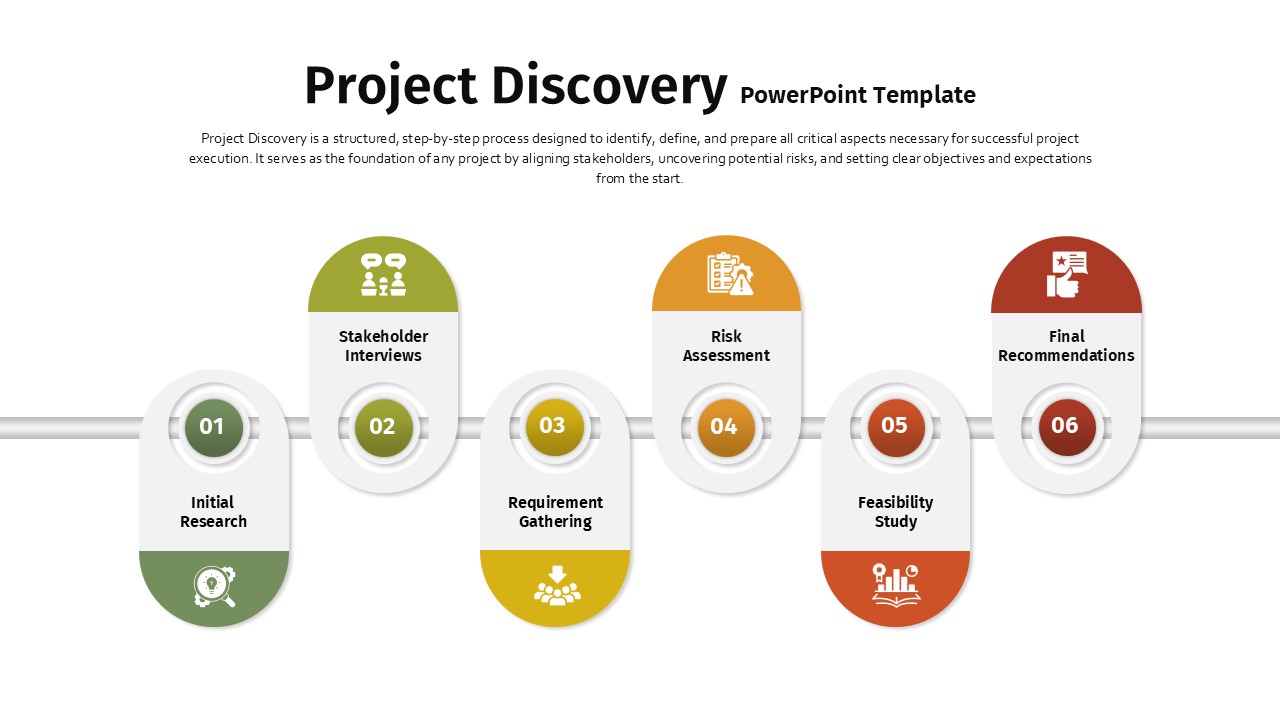
Project Discovery Infographic Pack Template for PowerPoint & Google Slides
Timeline
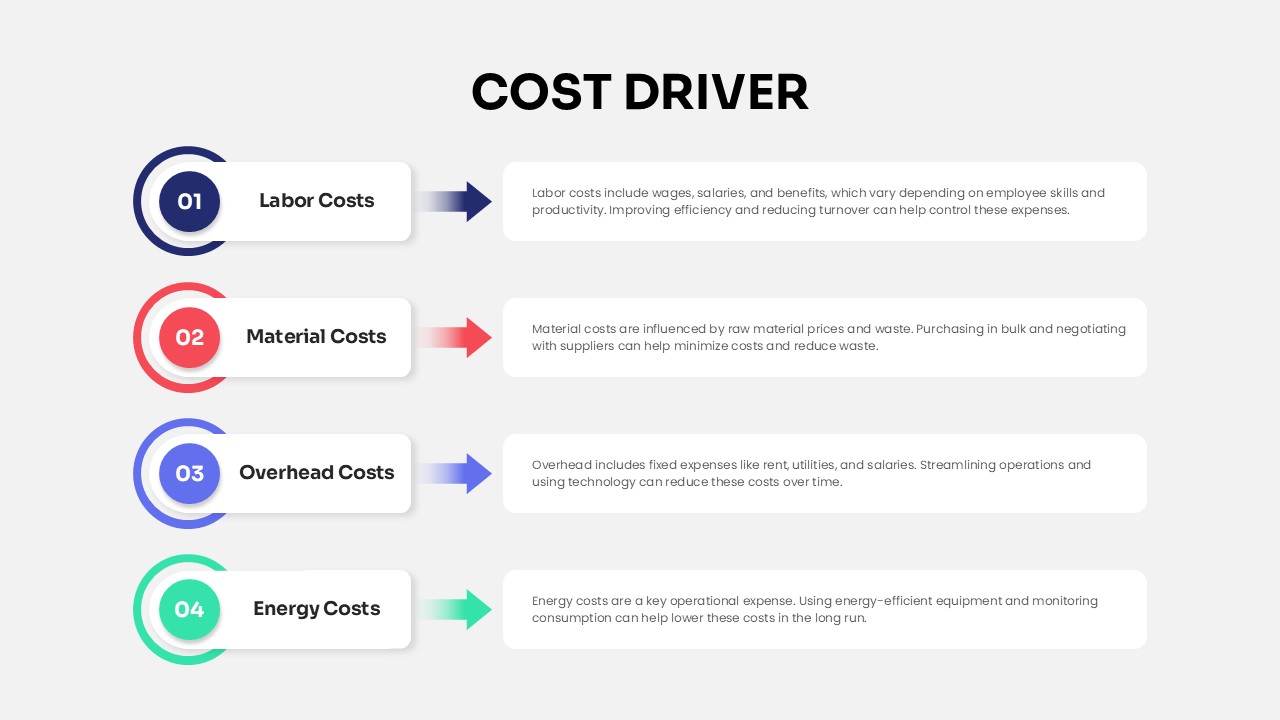
Cost Driver Infographic Slide Pack Template for PowerPoint & Google Slides
Process
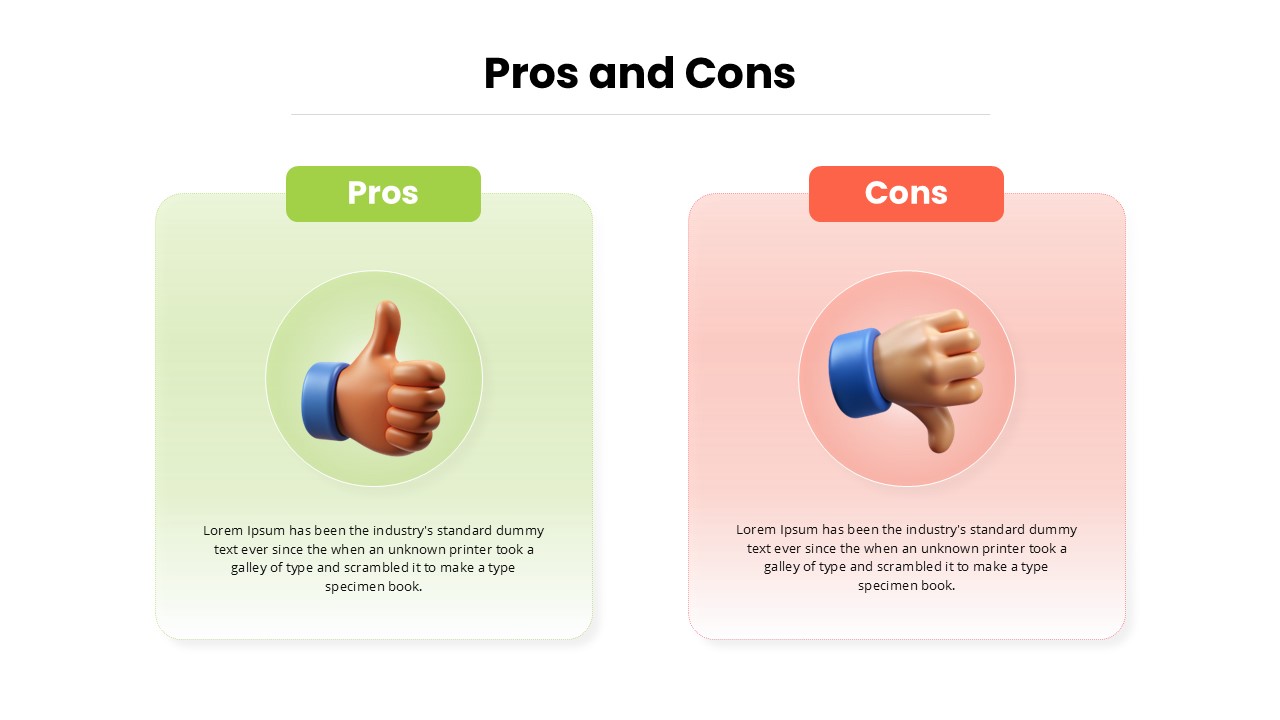
Pros and Cons Infographic Slide Pack Template for PowerPoint & Google Slides
Comparison
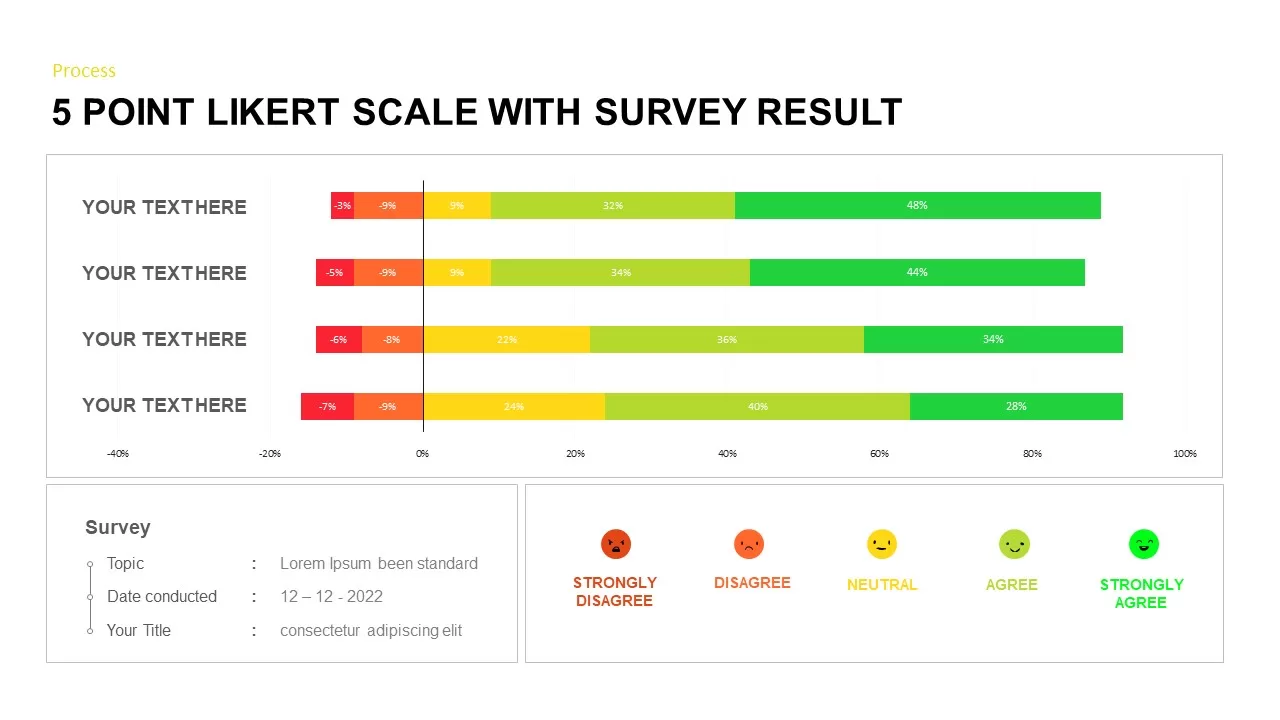
Likert Scale Survey Results infographic pack for PowerPoint & Google Slides
Business
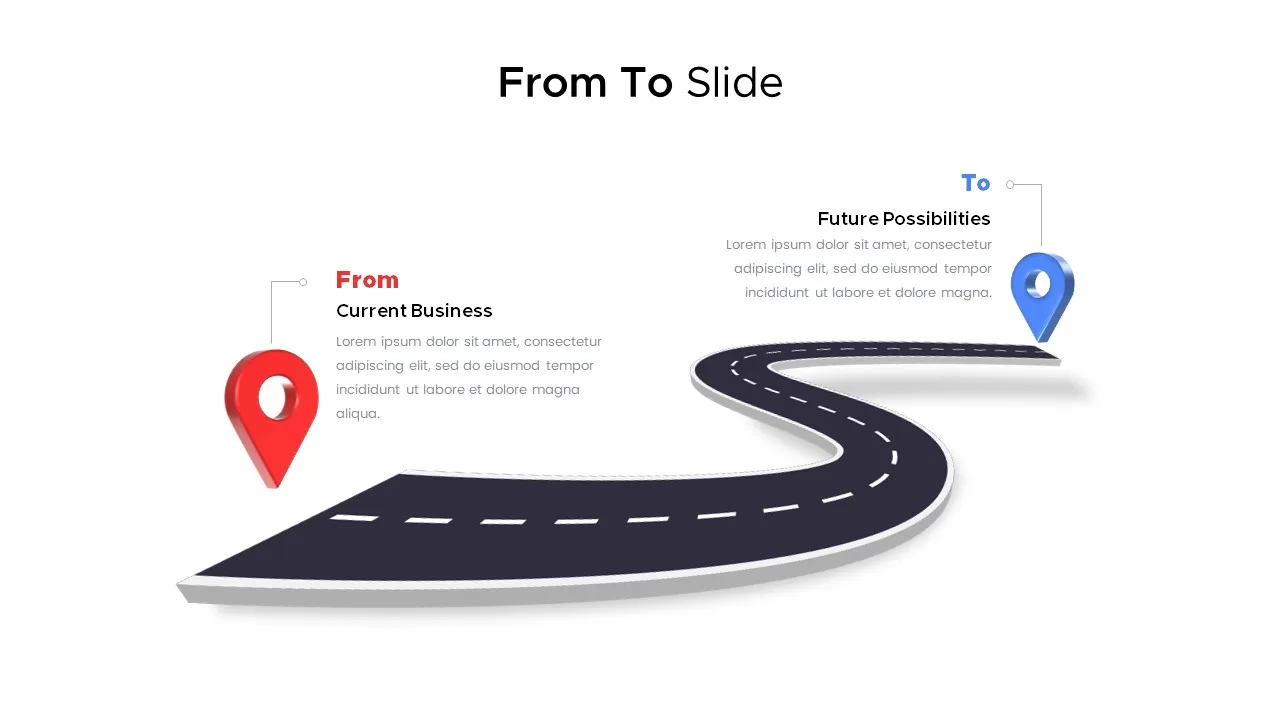
From To infographic pack for PowerPoint & Google Slides
Business Plan
1 to 5 Column infographic pack for PowerPoint & Google Slides
Business
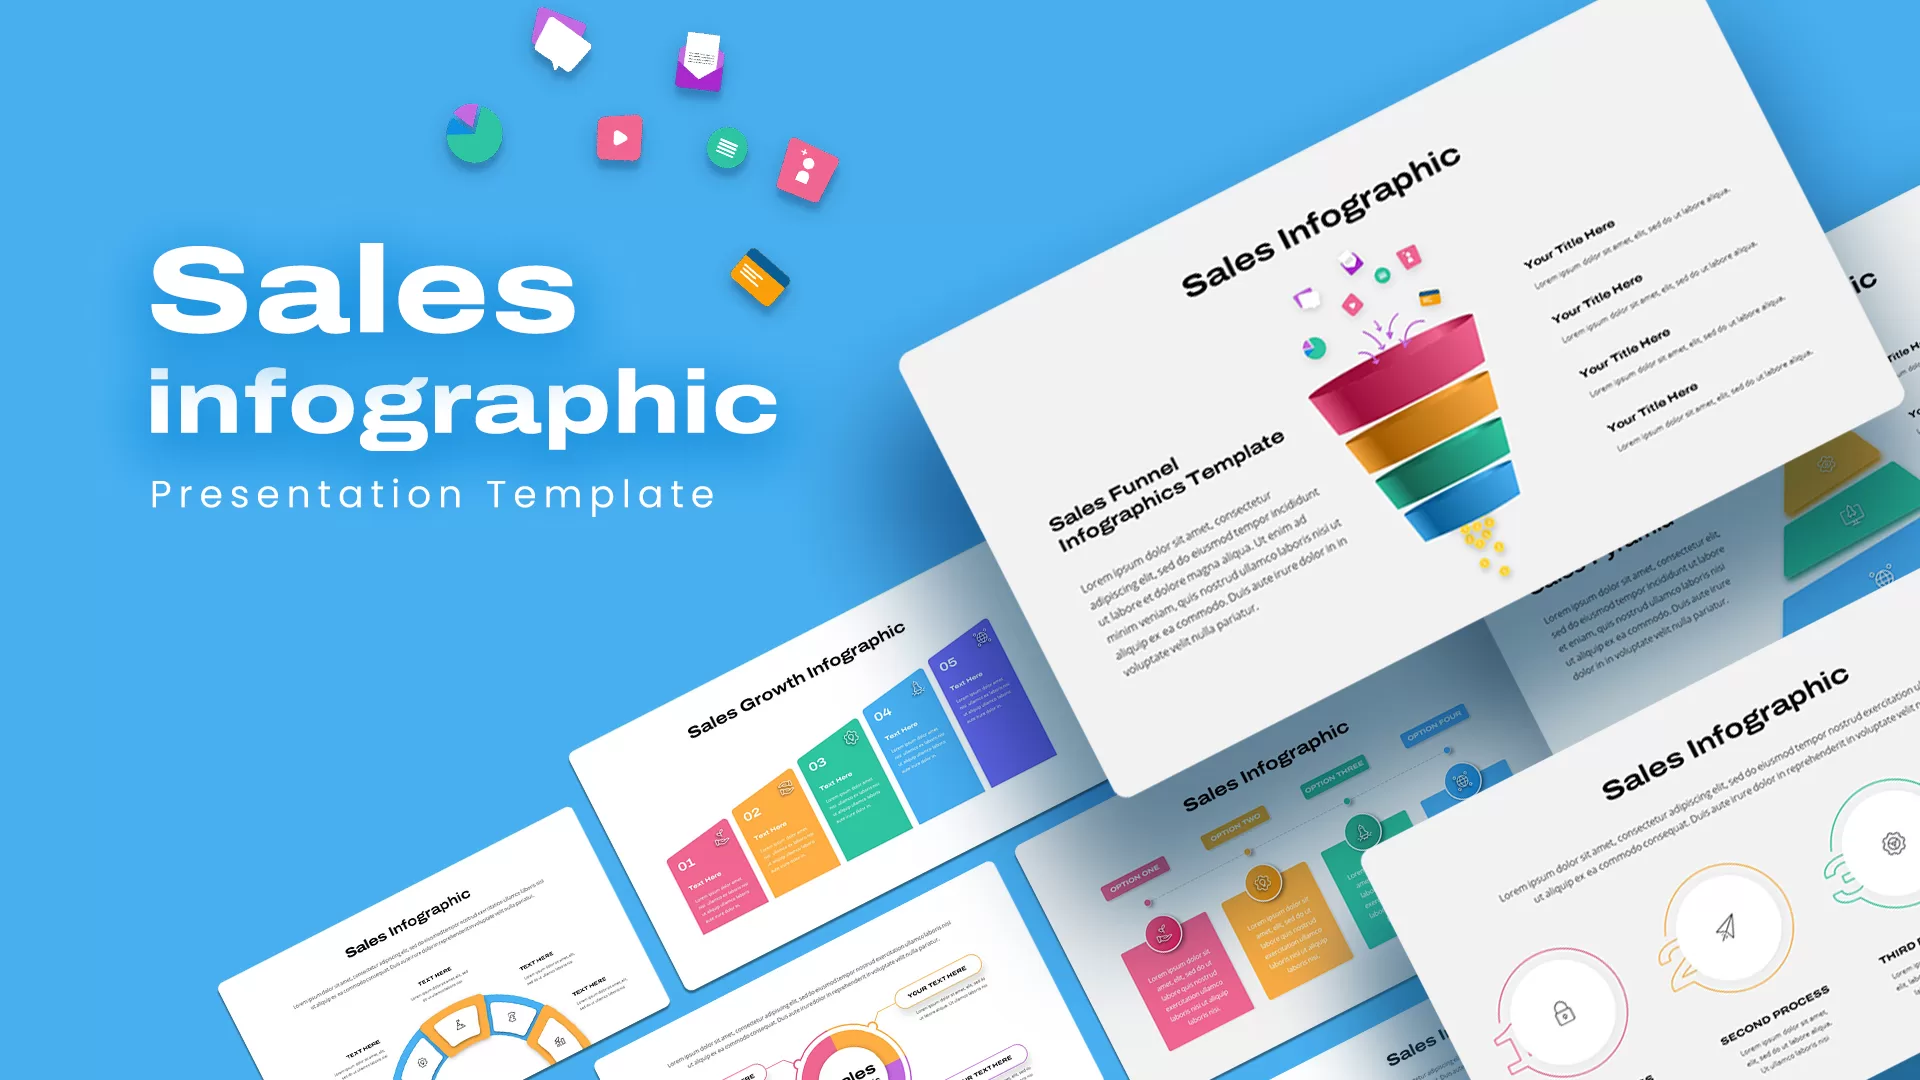
Sales Infographic pack for PowerPoint & Google Slides
Business
Progress Bar infographic pack for PowerPoint & Google Slides
Business
Snake Diagram Pack of 8 Slides template for PowerPoint & Google Slides
Process
Acknowledgement Slides Pack Template for PowerPoint & Google Slides
Our Team
Free Professional Gantt Chart Pack – 4 Slides Template for PowerPoint & Google Slides
Gantt Chart
Free
Value Proposition Slides Pack for PowerPoint & Google Slides
Infographics
Free New Year’s Resolution Slides Pack for PowerPoint & Google Slides 2023
Graphics
Free
Human Resource Strategy Model Pack Template for PowerPoint & Google Slides
HR
Venn Diagram Infographics Pack Template for PowerPoint & Google Slides
Circular
Comprehensive Scrum Infographics Pack Template for PowerPoint & Google Slides
Scrum
Four-Stage Process Cycle Variations Pack Template for PowerPoint & Google Slides
Process
Editable Pillars Infographics Pack Template for PowerPoint & Google Slides
Infographics
4-Stage Agenda Slide Pack Template for PowerPoint & Google Slides
Agenda
Communication Plan Outline Template Pack for PowerPoint & Google Slides
Infographics
Opposing Ideas Infographics Pack Template for PowerPoint & Google Slides
Comparison
Market Segmentation & STP Infographics Pack Template for PowerPoint & Google Slides
Marketing
Business Growth Plant Infographics Pack Template for PowerPoint & Google Slides
Process
Theory of Change Infographics Pack Template for PowerPoint & Google Slides
Process
Competitive Landscape Comparison Template Pack for PowerPoint & Google Slides
Comparison
Free Career Path Multipurpose Slide Pack Template for PowerPoint & Google Slides
Roadmap
Free
Newspaper Template Pack for PowerPoint & Google Slides
Business Proposal
Network Diagram Elements and Icons Pack Template for PowerPoint & Google Slides
Information Technology

Free 30-60-90 Day Plan Slide Pack Template for PowerPoint & Google Slides
Project Status
Free
Free Veterans Day Patriotic Slide Pack Template for PowerPoint & Google Slides
Graphics
Free
Business Icon Pack Template for PowerPoint & Google Slides
Graphics
Dynamic 3D Rubik’s Cube Diagram Pack Template for PowerPoint & Google Slides
Infographics
Sprint Review Process Infographics Pack Template for PowerPoint & Google Slides
Infographics
Flywheel Infographics Pack Template for PowerPoint & Google Slides
Circular
Free Stick Figure Icon Pack Slide Template for PowerPoint & Google Slides
Graphics
Free
Free Roadmap Infographics Pack Template for PowerPoint & Google Slides
Pitch Deck
Free
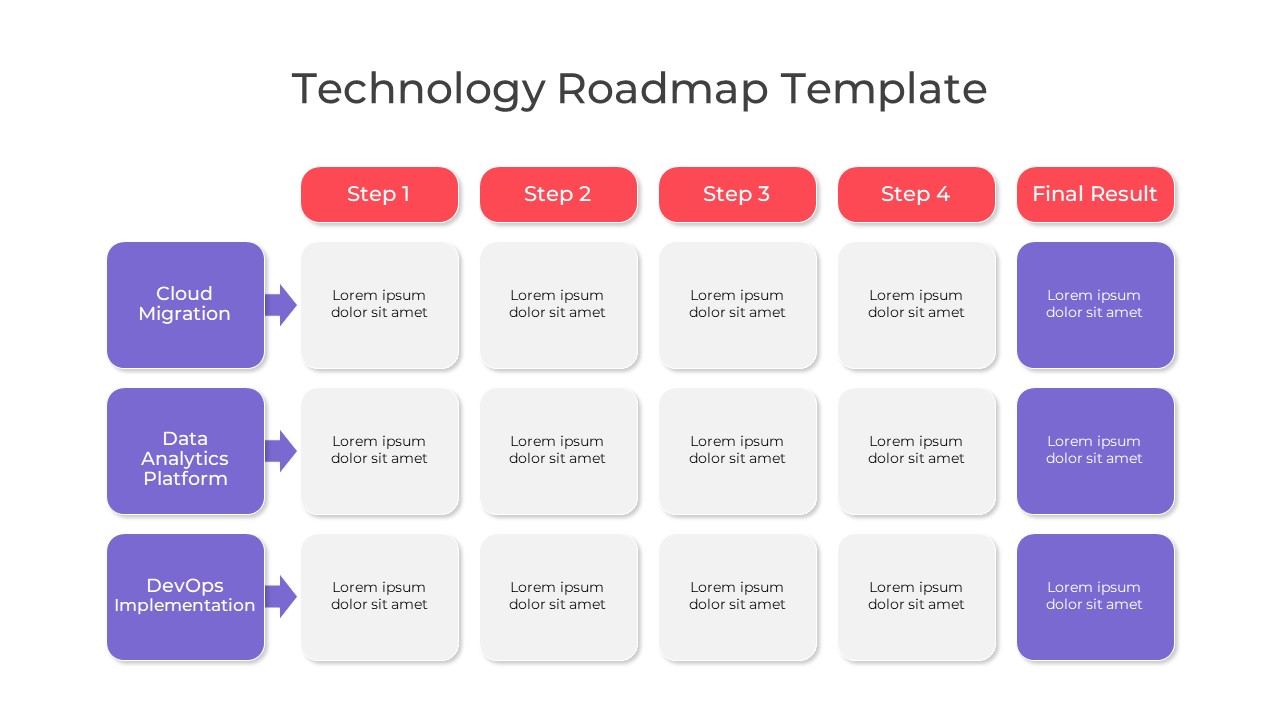
Multi-Color Technology Roadmap Template Pack for PowerPoint & Google Slides
Roadmap
Free Colorful Animal 2024 Calendar Slide Pack Template for PowerPoint & Google Slides
Infographics
Free
Agile Project Roadmap Timeline Template Pack for PowerPoint & Google Slides
Scrum
Agile Transformation Roadmap Slide Pack Template for PowerPoint & Google Slides
Roadmap
Advanced Data Flow Diagram Pack Template for PowerPoint & Google Slides
Flow Charts
Free Law Infographics Slide Pack Collection Template for PowerPoint & Google Slides
Infographics
Free
Versatile Startup Roadmap Slide Pack Template for PowerPoint & Google Slides
Timeline
Comprehensive RAID Log Slide Pack Template for PowerPoint & Google Slides
Project
5 Styles Key Outcomes Infographics Pack Template for PowerPoint & Google Slides
Infographics
Looking Ahead 3-Slide Infographics Pack Template for PowerPoint & Google Slides
Business
Business Development Framework Pack Template for PowerPoint & Google Slides
Business Strategy