Cone of Uncertainty Process Diagram Template for PowerPoint & Google Slides


Description
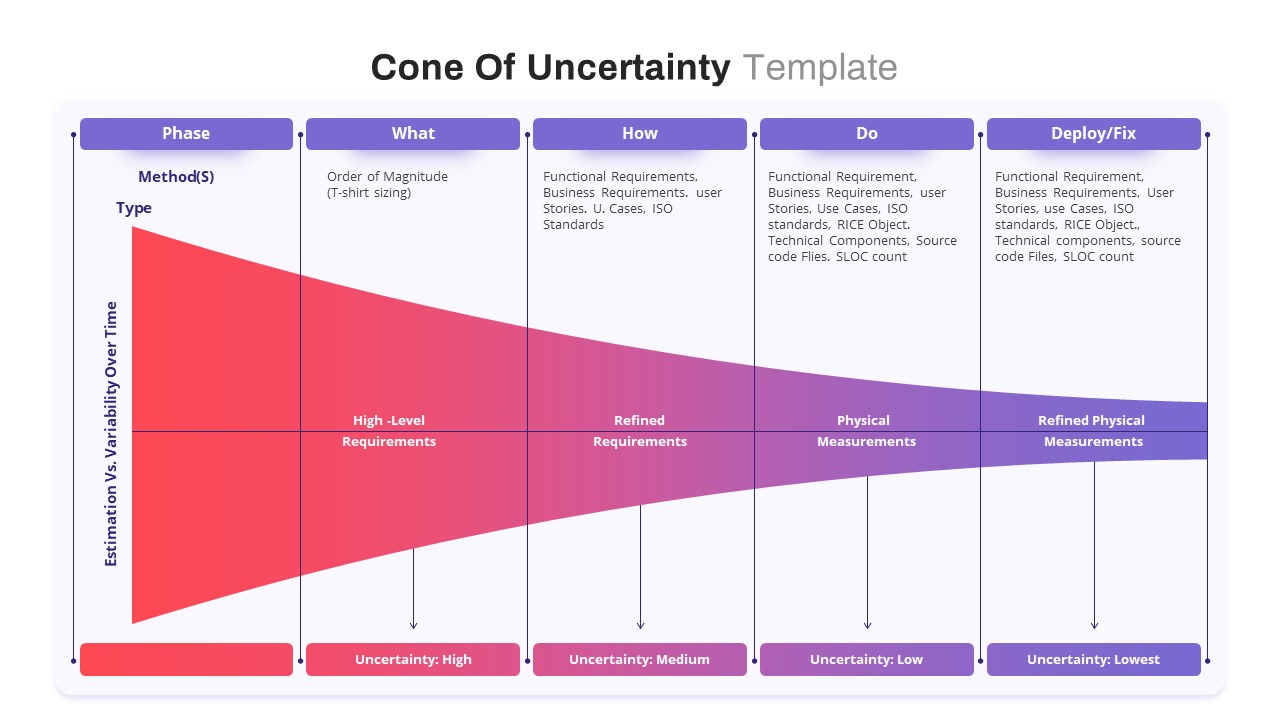
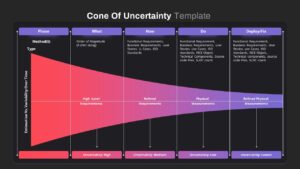
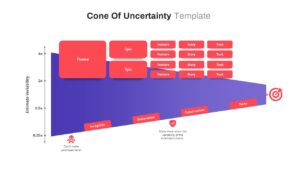
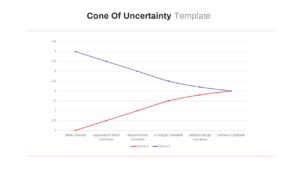
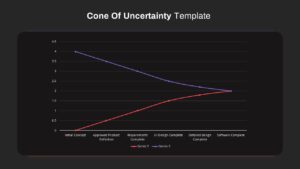
This editable infographic presents a gradient “cone of uncertainty” that tapers from wide (high variability) to narrow (low variability) across five project estimation phases: Phase, What, How, Do, and Deploy/Fix. Each vertical segment houses customizable text placeholders for methods and deliverables—ranging from T-shirt sizing and business requirements to source-code metrics—while a smooth red-to-purple gradient cone illustrates the shrinking estimation range over time. Color-coded bottom bars label four uncertainty levels (High, Medium, Low, Lowest) aligned beneath the corresponding columns. Built on master slides in PowerPoint and Google Slides, all shapes, connectors, and text blocks are vector-based and fully scalable. Hidden guide layers simplify adding or removing phases, swapping fills, or toggling flat vs. gradient styles. Consistent sans-serif fonts, subtle drop shadows, and ample white space ensure readability on any device, and grouped animations can introduce each phase sequentially during live presentations.
Who is it for
Project managers, scrum masters, and software estimators will leverage this template to communicate how estimation accuracy improves over development phases. Agile coaches, product owners, and stakeholders can use it to set expectations around scope definition and risk throughout a project lifecycle.
Other Uses
Repurpose this cone diagram for sales-pipeline funnels, risk-reduction roadmaps, learning-curve curves, or any scenario where variability diminishes over staged processes. Adjust labels, colors, and gradient stops to suit your narrative.
Login to download this file

Item ID
SB03733
Related Templates

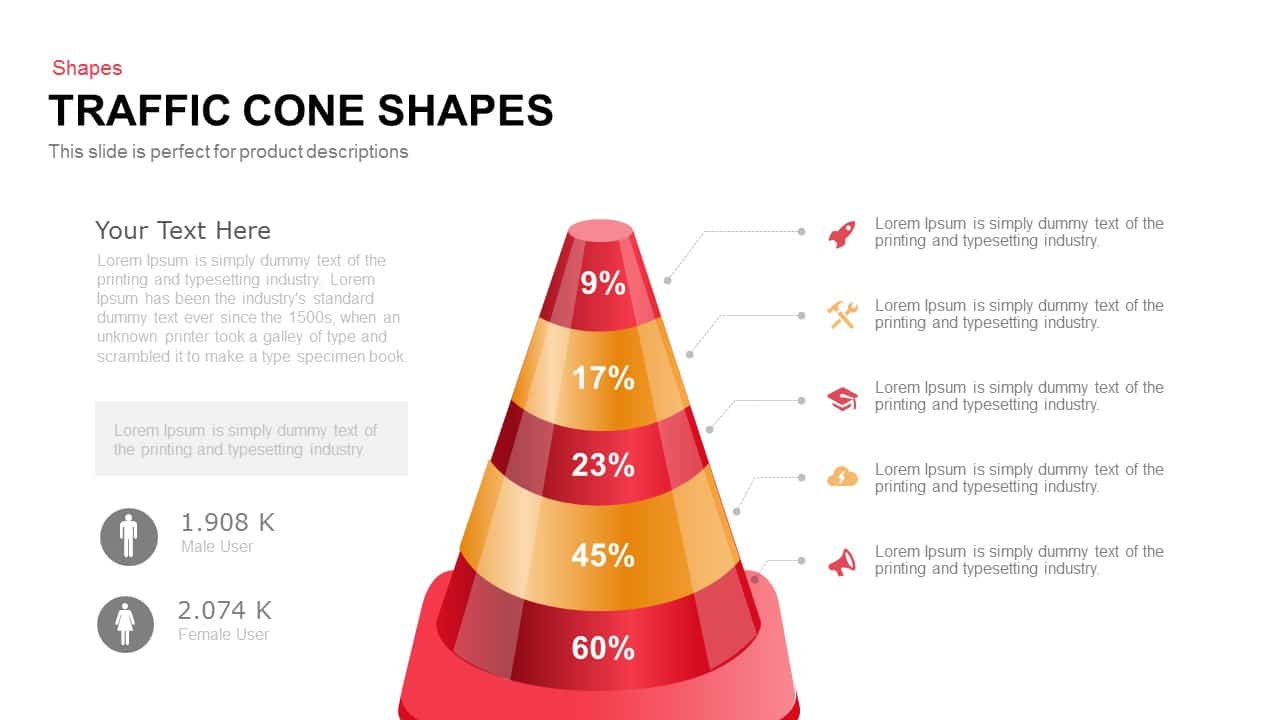
Traffic Cone Funnel Diagram Slide Template for PowerPoint & Google Slides
Funnel

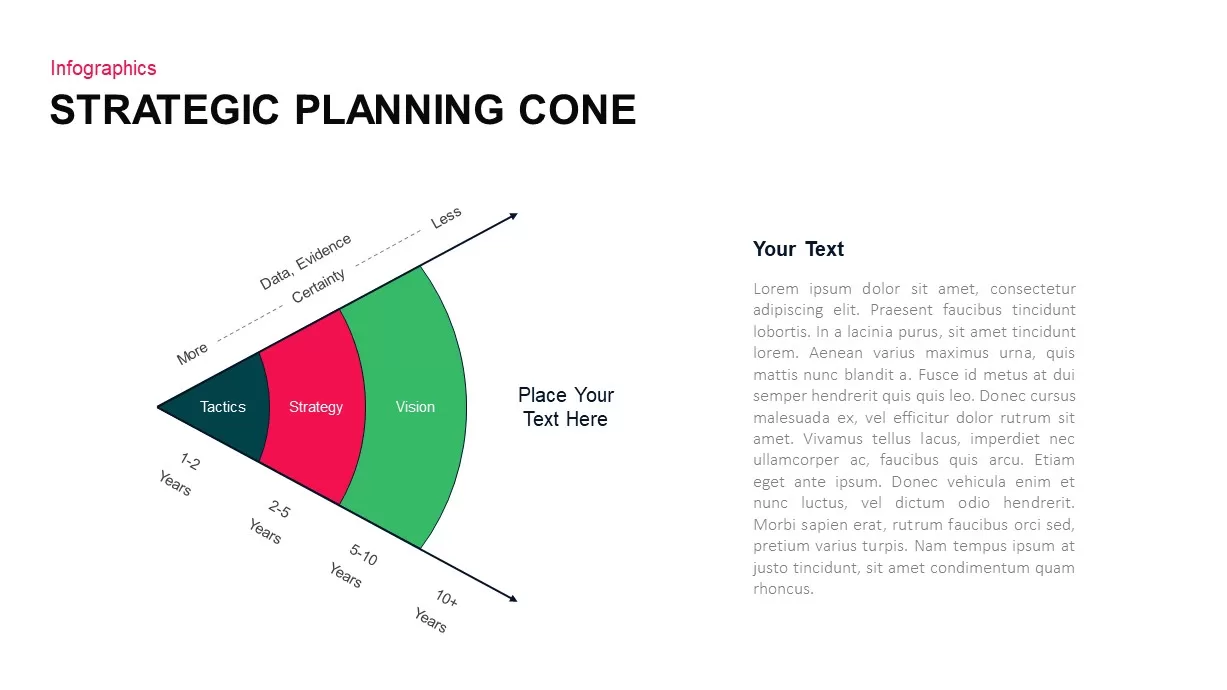
3-Part Strategic Planning Cone Diagram Template for PowerPoint & Google Slides
Process
3D Cone Chart Data Visualization template for PowerPoint & Google Slides
Bar/Column
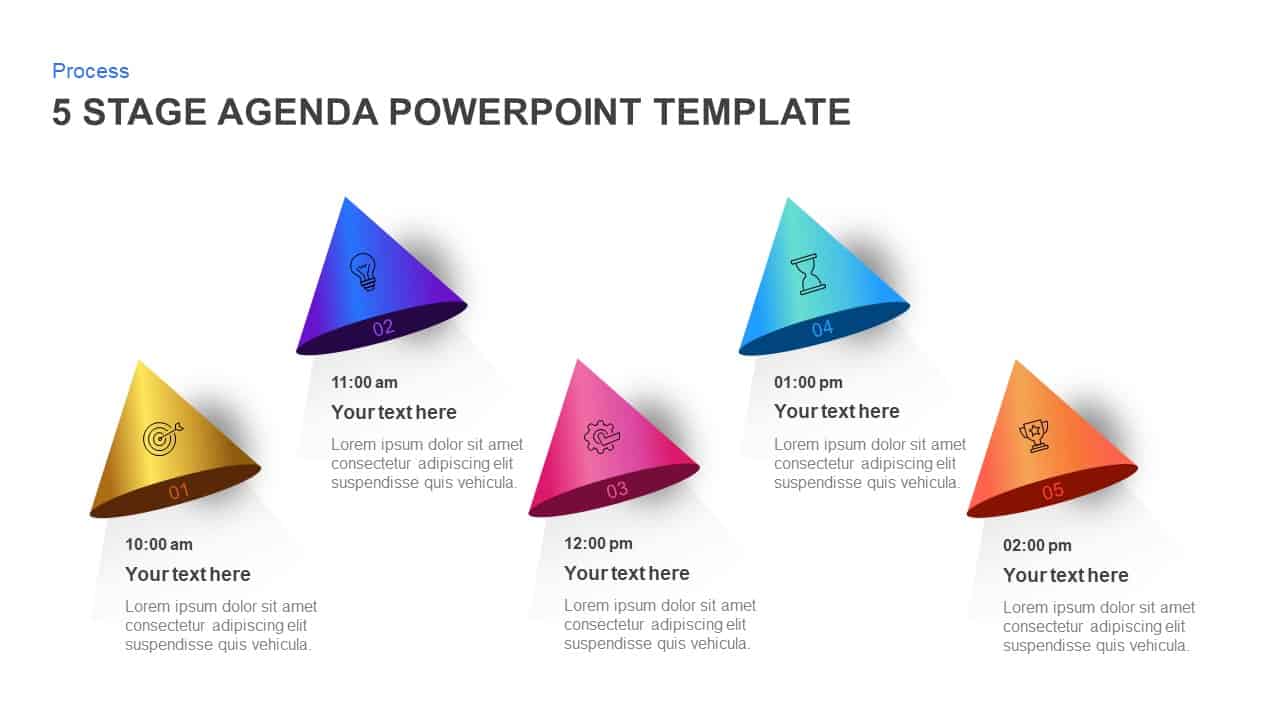
5 Stage Cone Agenda Infographic Template for PowerPoint & Google Slides
Agenda

Cone Data Chart for PowerPoint & Google Slides
Charts
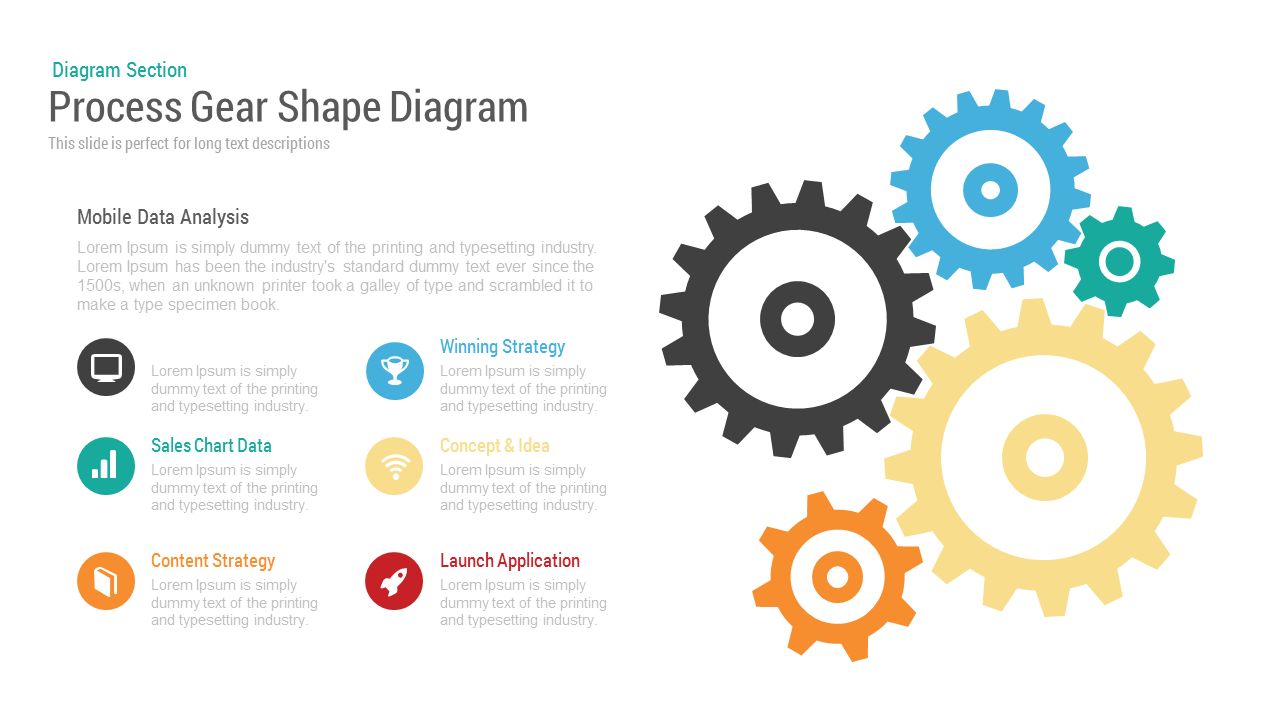
Gear Process Diagram PowerPoint Template for PowerPoint & Google Slides
Process
Sales Process Workflow Funnel Diagram PowerPoint Template for PowerPoint & Google Slides
Funnel
Gear Process Diagram template for PowerPoint & Google Slides
Process
5 Arrow Process Diagram Template for PowerPoint & Google Slides
Infographics
Six Hexagon Stages Process Flow Diagram Template for PowerPoint & Google Slides
Process
6-Step Arrow Process Diagram Template for PowerPoint & Google Slides
Process
Modern 4-Step Cyclic Process Diagram Template for PowerPoint & Google Slides
Circular
Three Circle Arrow Process Diagram template for PowerPoint & Google Slides
Circular
Process Flow Diagram template for PowerPoint & Google Slides
Infographics
Gear Process Phase Diagram template for PowerPoint & Google Slides
Process

Five-Step Gear Process Diagram Template for PowerPoint & Google Slides
Process
Three Stage 3D Arrow Process Diagram Template for PowerPoint & Google Slides
Process
Arrow Stage Process Diagram template for PowerPoint & Google Slides
Arrow

Dynamic 4 Gear Process Diagram Template for PowerPoint & Google Slides
Process
Roadmap with Milestones Process Diagram Template for PowerPoint & Google Slides
Roadmap
Pie Segment Diagram Four-Step Process Template for PowerPoint & Google Slides
Pie/Donut
Editable Twin Circle Process Diagram Template for PowerPoint & Google Slides
Process
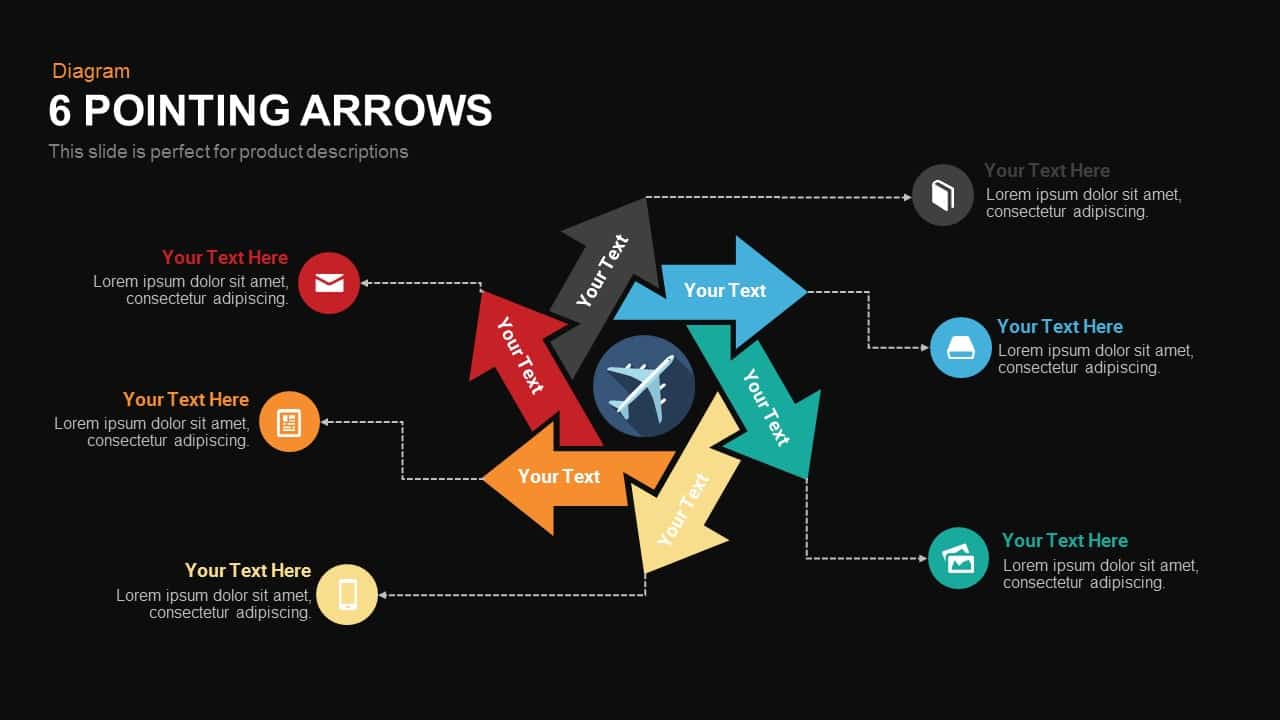
Six Pointing Arrow Process Diagram Template for PowerPoint & Google Slides
Arrow
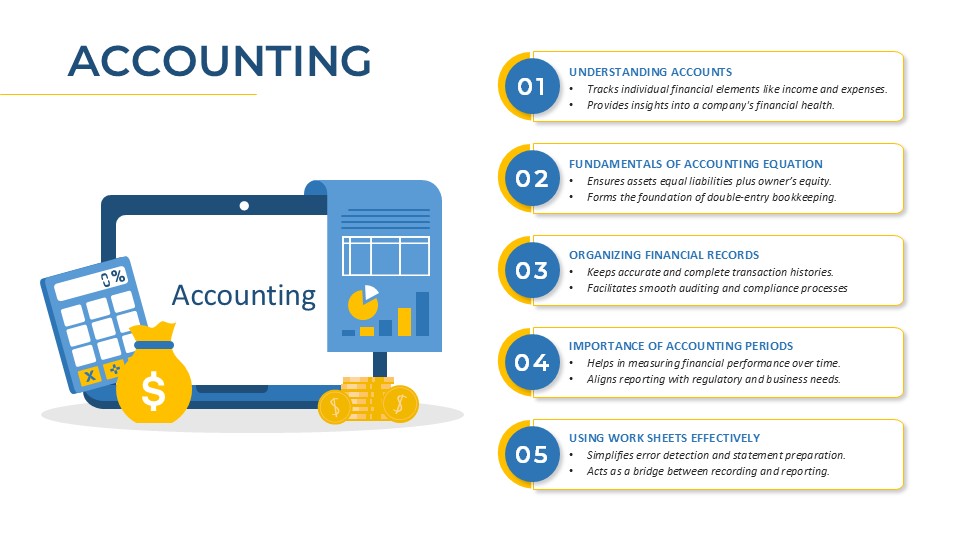
Accounting Process Metaphor Diagram Template for PowerPoint & Google Slides
Accounting
Modern Five-Stage Cycle Process Diagram Template for PowerPoint & Google Slides
Process
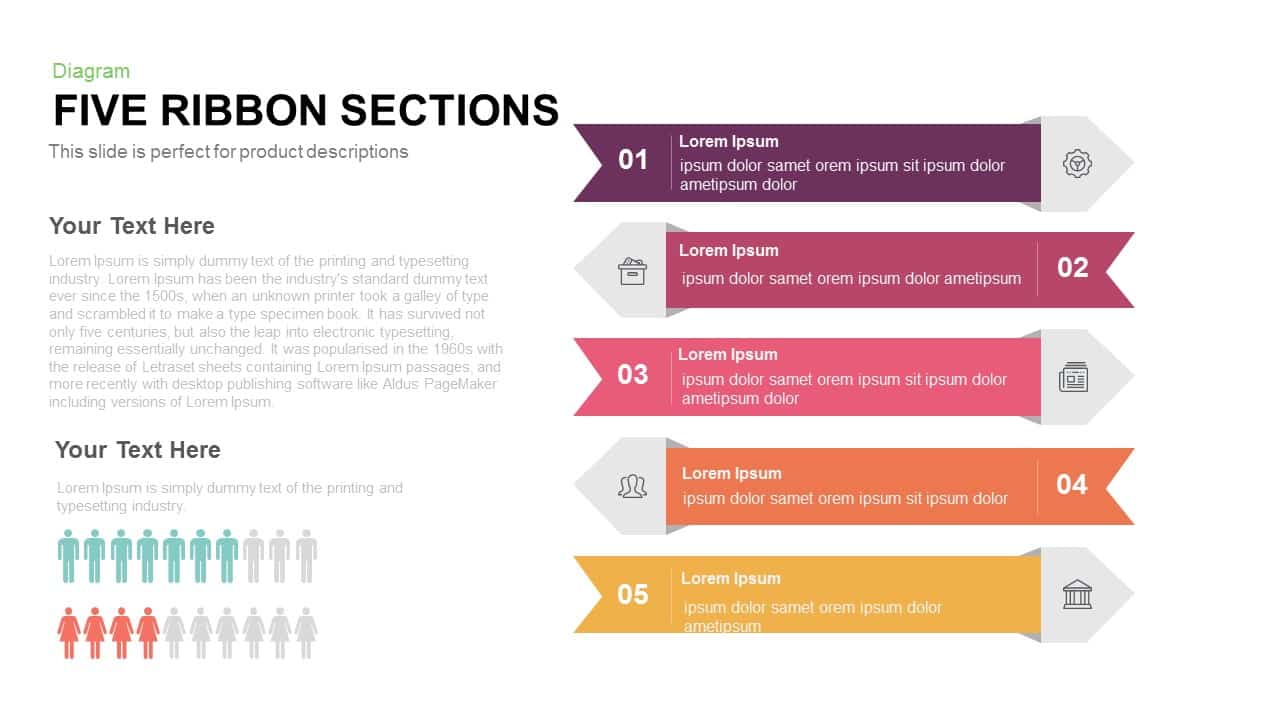
Five Ribbon Sections Process Diagram Template for PowerPoint & Google Slides
Process
Five Stage Process Diagram Infographic Template for PowerPoint & Google Slides
Process

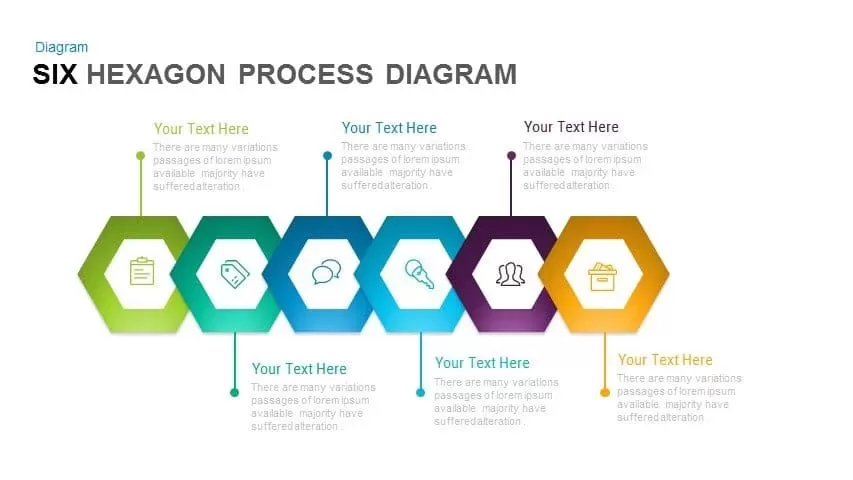
Six-Step Hexagon Process Diagram Template for PowerPoint & Google Slides
Process
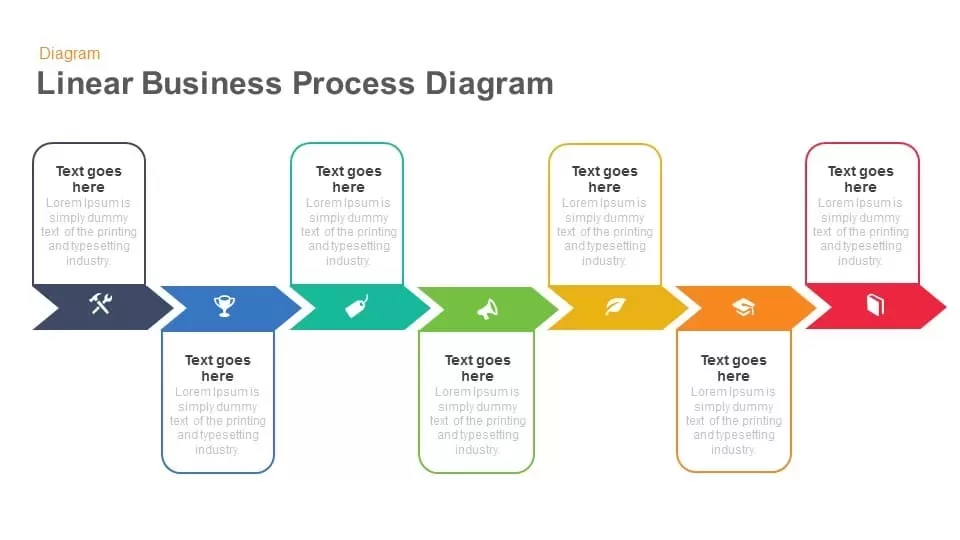
Linear Business Process Diagram template for PowerPoint & Google Slides
Process
10 Stages Business Flow Process Diagram template for PowerPoint & Google Slides
Business
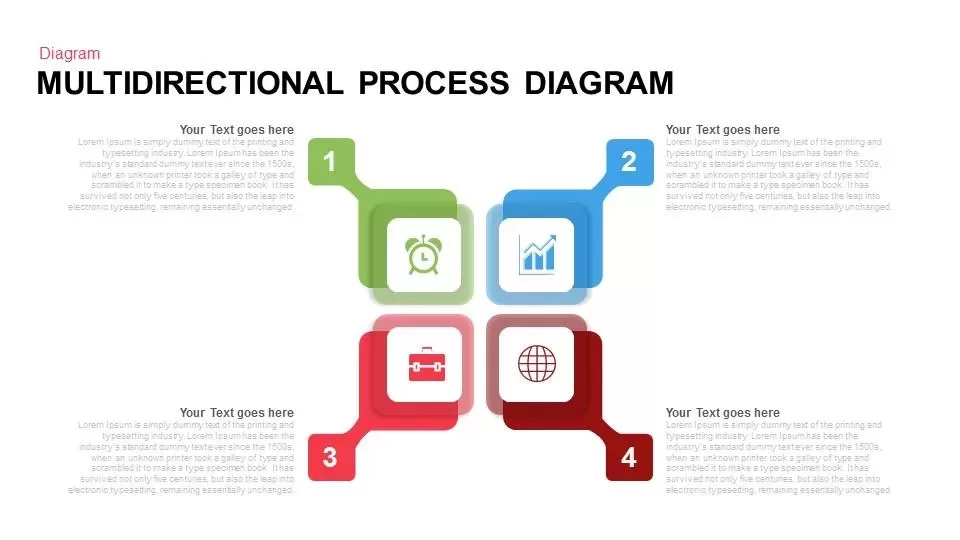
Multidirectional Process Diagram template for PowerPoint & Google Slides
Process
Elegant Process Support Arrow Diagram Template for PowerPoint & Google Slides
Arrow
Free Six Stage Bubble Process Diagram template for PowerPoint & Google Slides
Process
Free
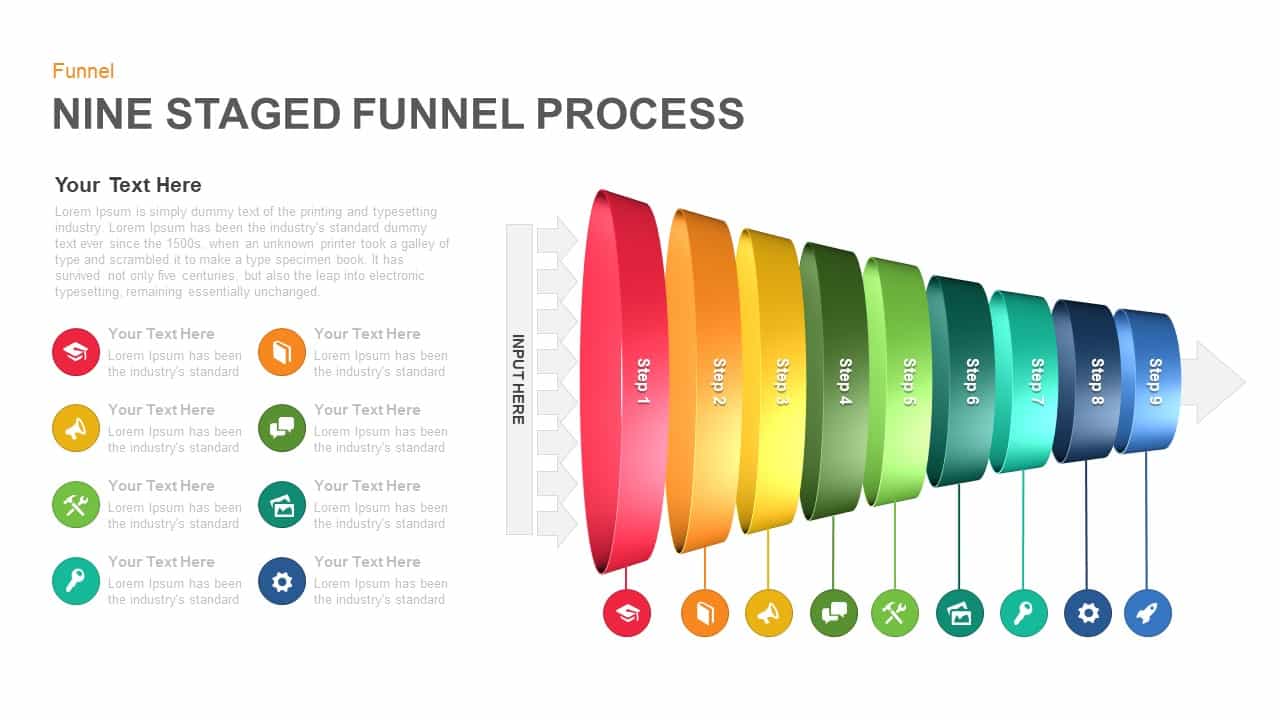
Nine-Stage 3D Funnel Process Diagram Template for PowerPoint & Google Slides
Funnel
Eight-Stage Radial Process Flow Diagram Template for PowerPoint & Google Slides
Process
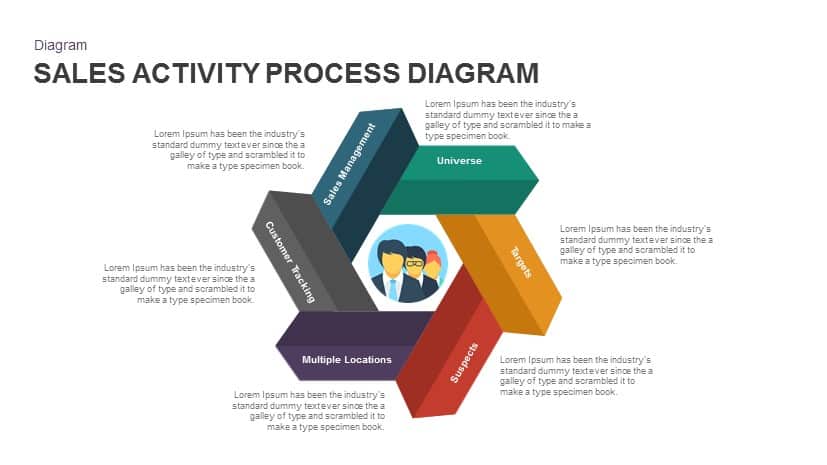
Sales Activity Hexagon Process Diagram Template for PowerPoint & Google Slides
Process

Modern Five-Step Circles Process Diagram Template for PowerPoint & Google Slides
Circular
Ten-Stage Business Process Diagram Template for PowerPoint & Google Slides
Process
Supply Chain Process Gear Diagram Template for PowerPoint & Google Slides
Process
Six-Step Vertical Process Diagram Template for PowerPoint & Google Slides
Process
Infinity Process Diagram template for PowerPoint & Google Slides
Process
4 Staged Circular Business Process Diagram template for PowerPoint & Google Slides
Process
Business Process Automation Diagram Template for PowerPoint & Google Slides
Process
Free Six-Stage Arrow Process Diagram Template for PowerPoint & Google Slides
Process
Free
Six-Step Linear Arrow Process Diagram Template for PowerPoint & Google Slides
Process
Five-Step Diamond Process Diagram Template for PowerPoint & Google Slides
Process
Five-Stage Eco Tree Process Diagram Template for PowerPoint & Google Slides
Process
Six-Stage Circular Diagram Process Template for PowerPoint & Google Slides
Circular
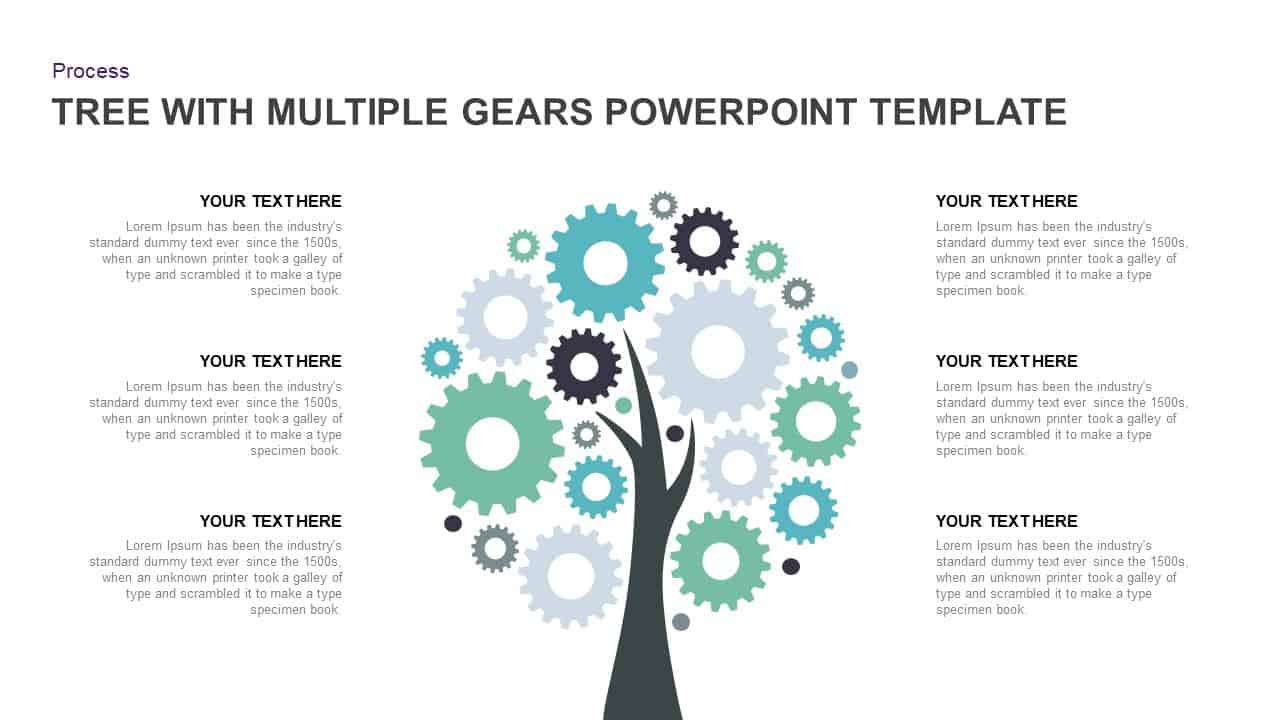
Tree Diagram with Gears Process Template for PowerPoint & Google Slides
Process
Three-Way Decision Process Arrow Diagram Template for PowerPoint & Google Slides
Arrow
Six-Step Hexagon Process Flow Diagram Template for PowerPoint & Google Slides
Process
Five-Step Circular Process Diagram Template for PowerPoint & Google Slides
Circular
3D Seven-Stage Process Flow Diagram Template for PowerPoint & Google Slides
Process
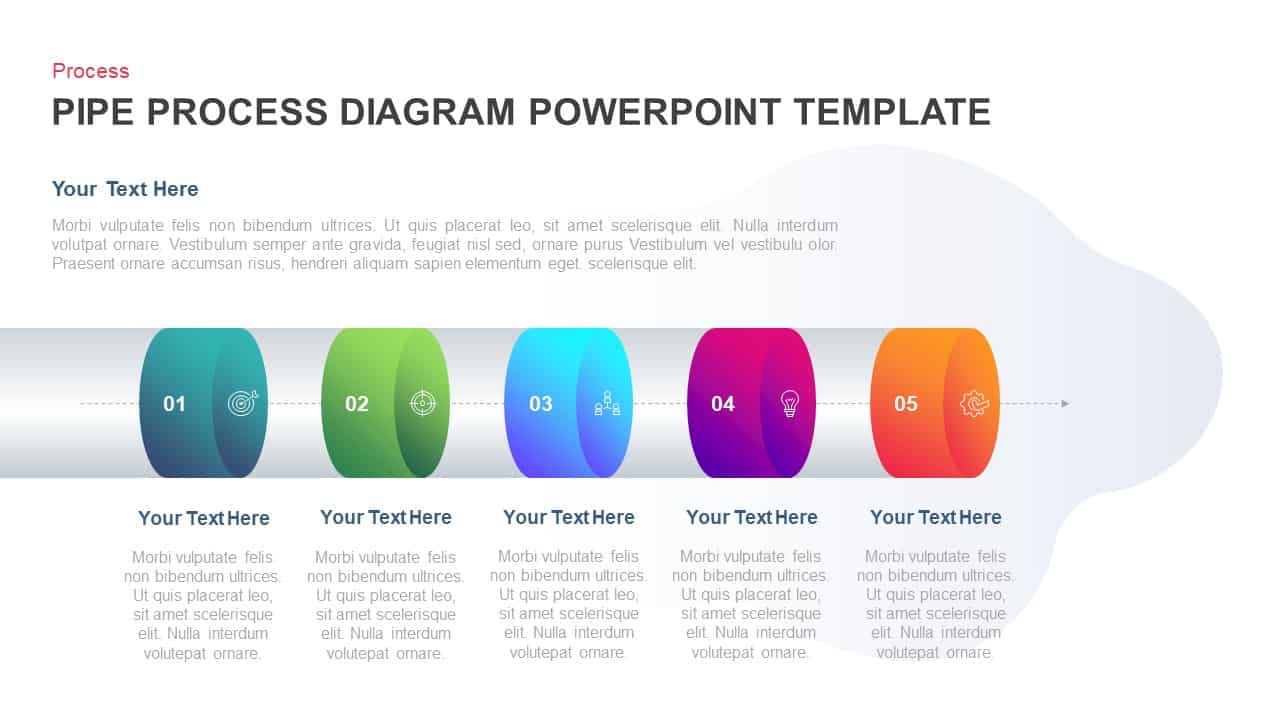
Five-Stage Pipe Process Diagram Template for PowerPoint & Google Slides
Process
Circular CRM Process Diagram Infographic Template for PowerPoint & Google Slides
Circular
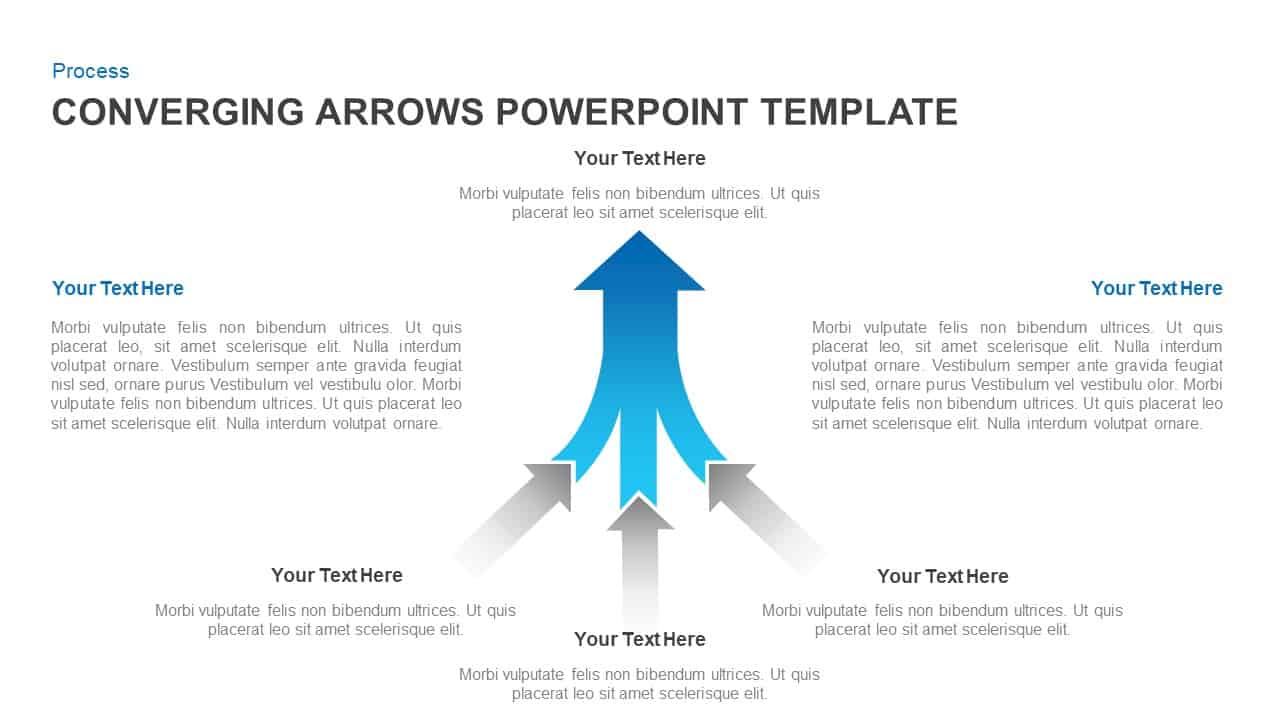
Converging Arrows Process Diagram Template for PowerPoint & Google Slides
Arrow
5 Stage Linear Process Flow Diagram Template for PowerPoint & Google Slides
Process
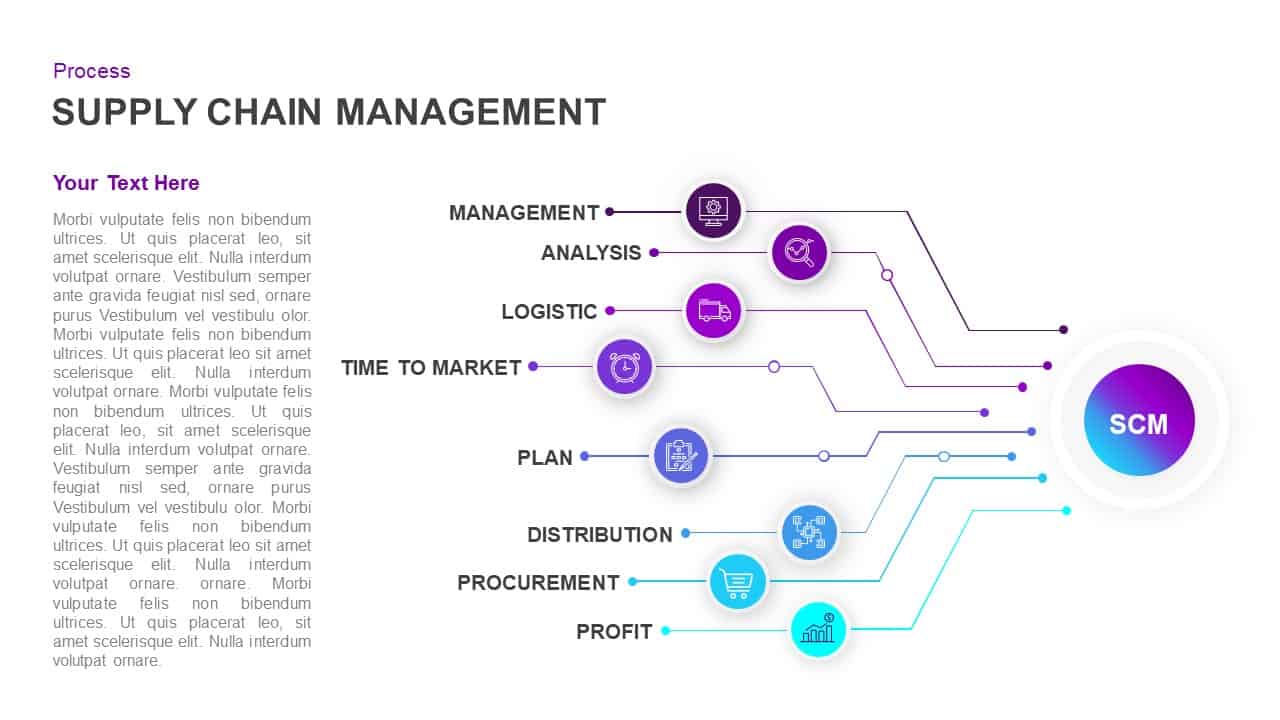
Supply Chain Management Process Diagram Template for PowerPoint & Google Slides
Process
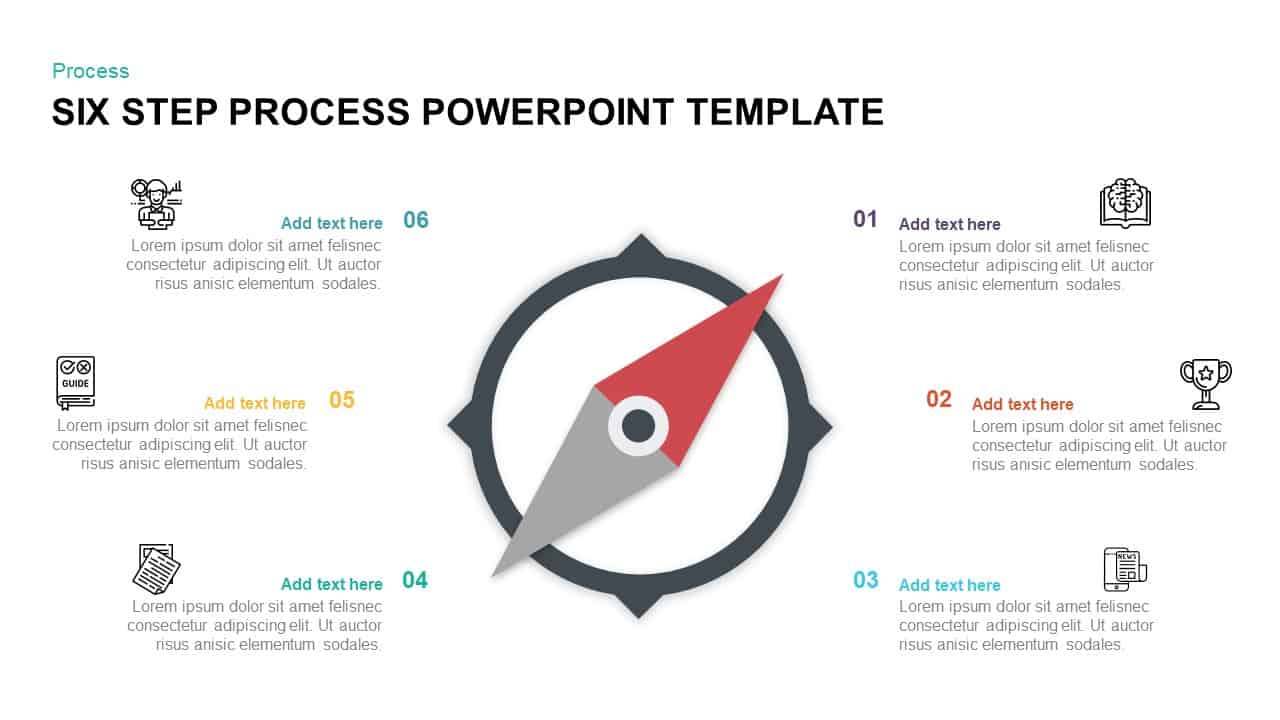
Compass-Themed Six-Step Process Diagram Template for PowerPoint & Google Slides
Process
4 Stage Linear Process Flow Diagram Template for PowerPoint & Google Slides
Process
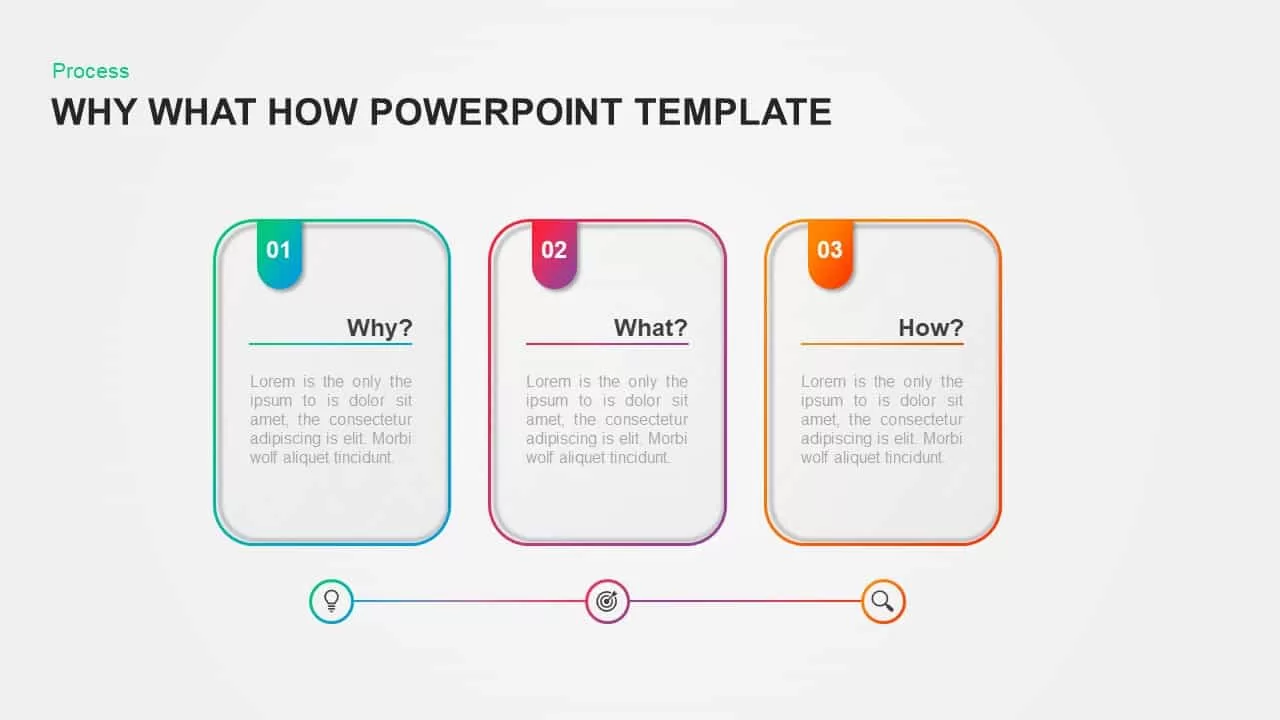
Why What How Process Diagram Template for PowerPoint & Google Slides
Process
4 Stage Linear Process Flow Diagram Template for PowerPoint & Google Slides
Process
6-Step Business Process Flow Diagram Template for PowerPoint & Google Slides
Process
Three-Step Flowchart Process Diagram Template for PowerPoint & Google Slides
Flow Charts
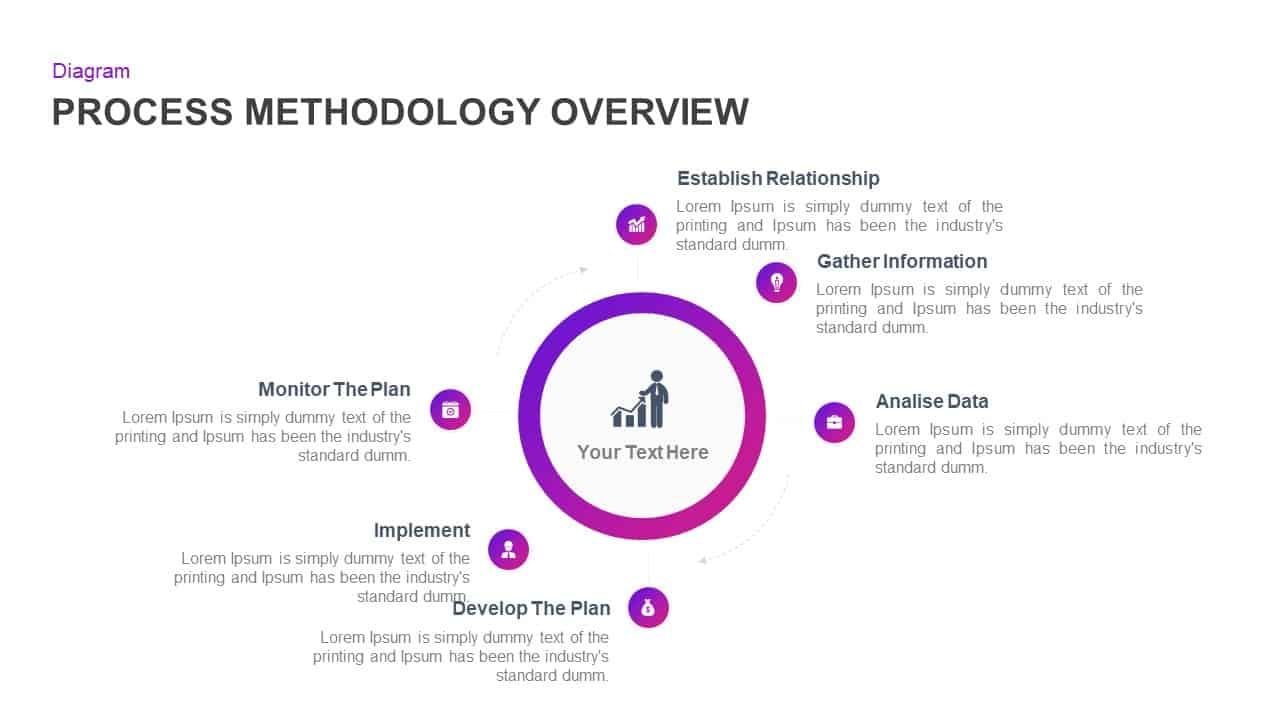
Process Methodology Overview Diagram Template for PowerPoint & Google Slides
Process
Value Chain Circular Process Diagram Template for PowerPoint & Google Slides
Business Models
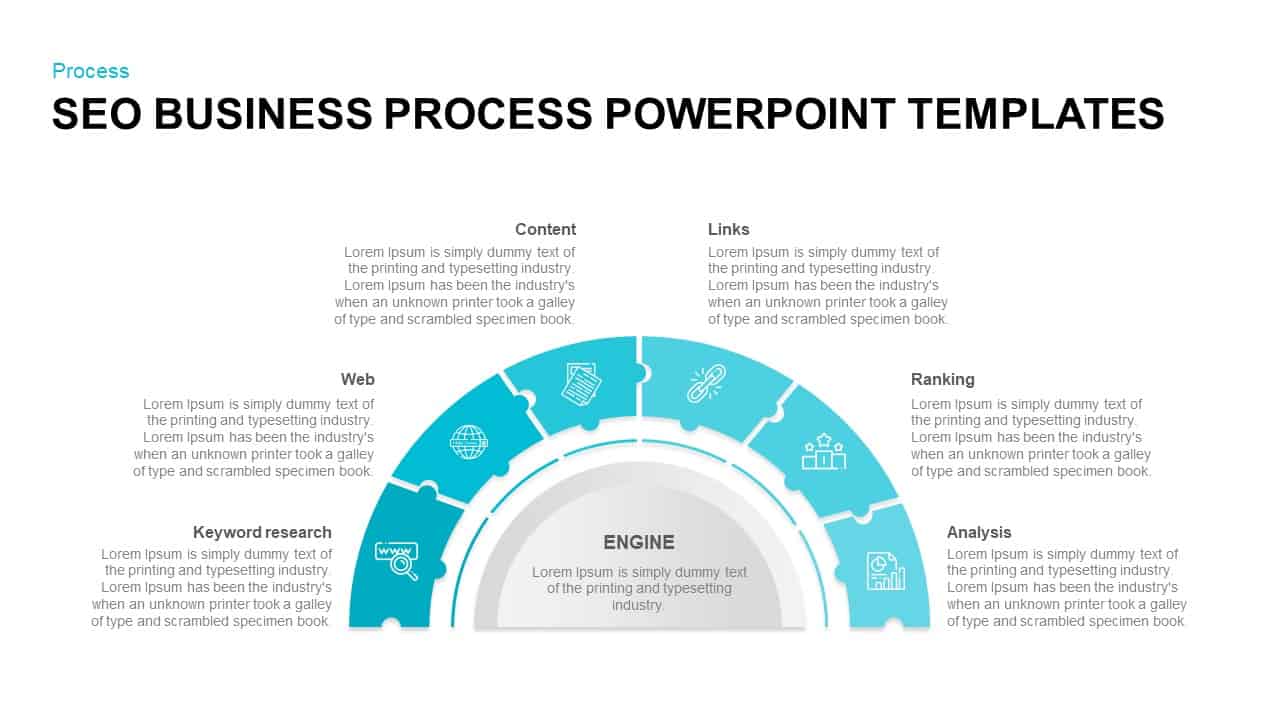
SEO Business Process Puzzle Diagram Template for PowerPoint & Google Slides
Process
Six Sigma 6S Process Infographic Diagram Template for PowerPoint & Google Slides
Process
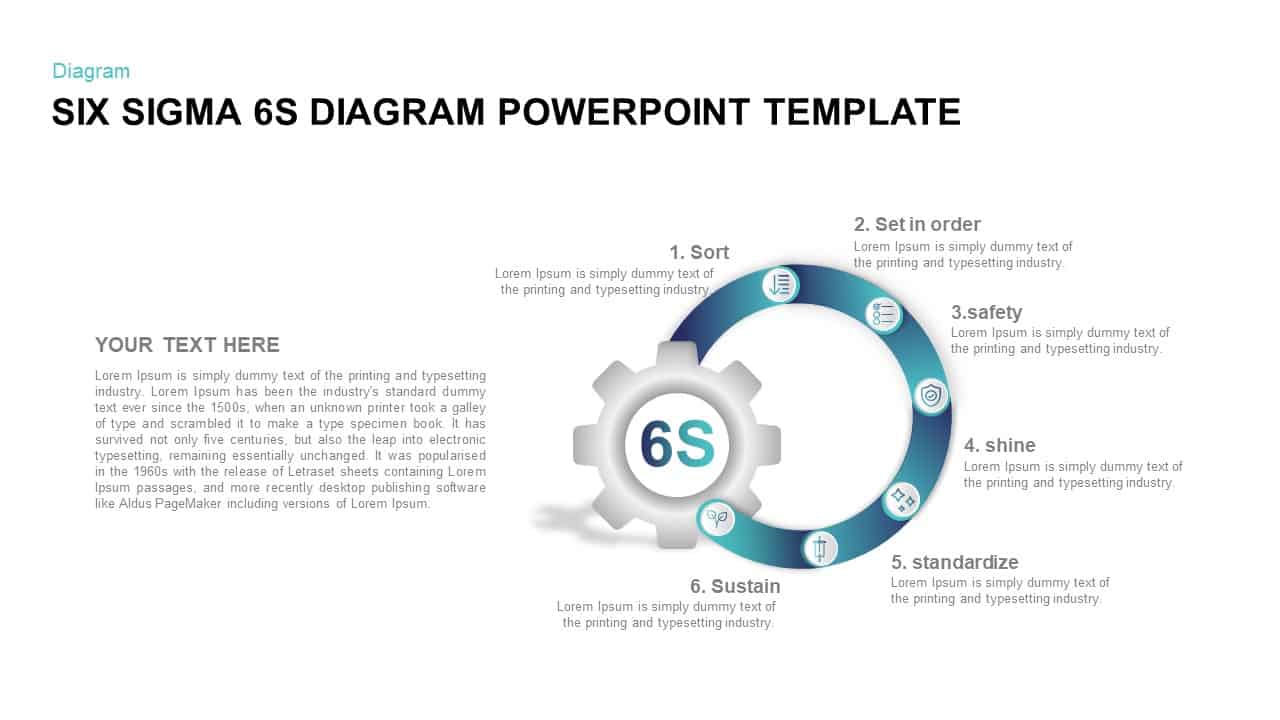
Six Sigma 6S Process Diagram Template for PowerPoint & Google Slides
Process
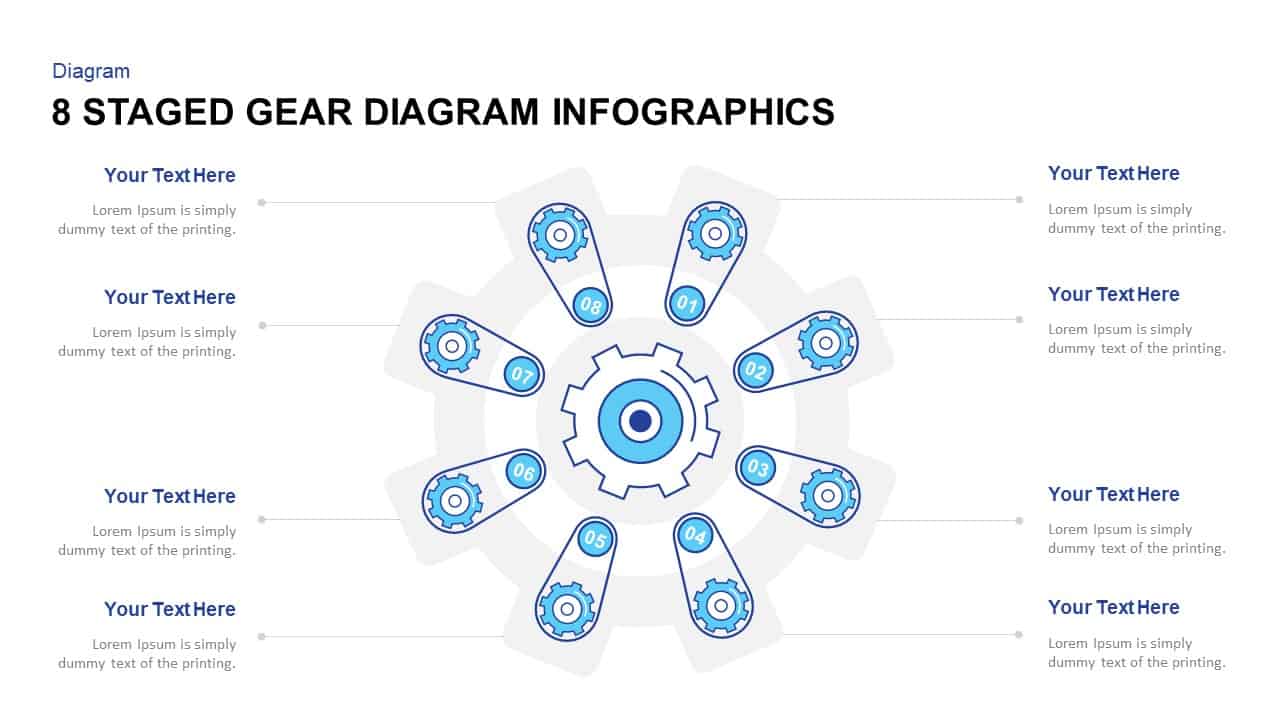
Eight-Stage Gear Diagram Process Template for PowerPoint & Google Slides
Process
Business Process Management Flow Diagram Template for PowerPoint & Google Slides
Process
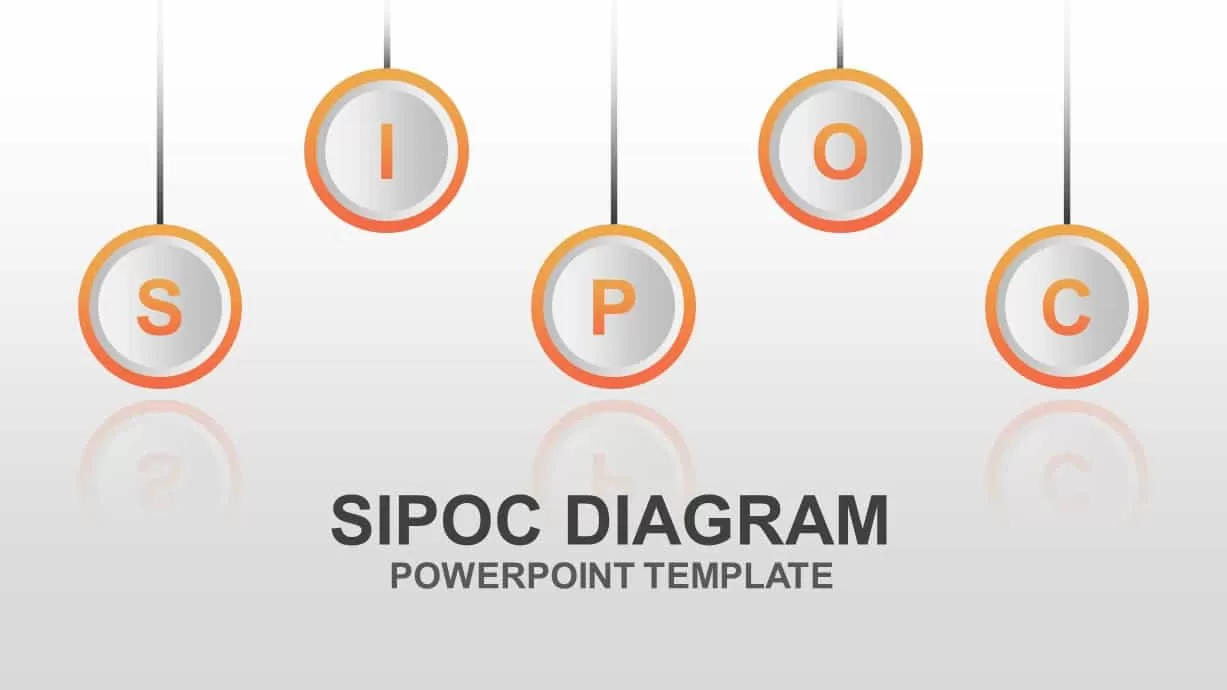
Editable SIPOC Process Diagram Deck Template for PowerPoint & Google Slides
Pitch Deck
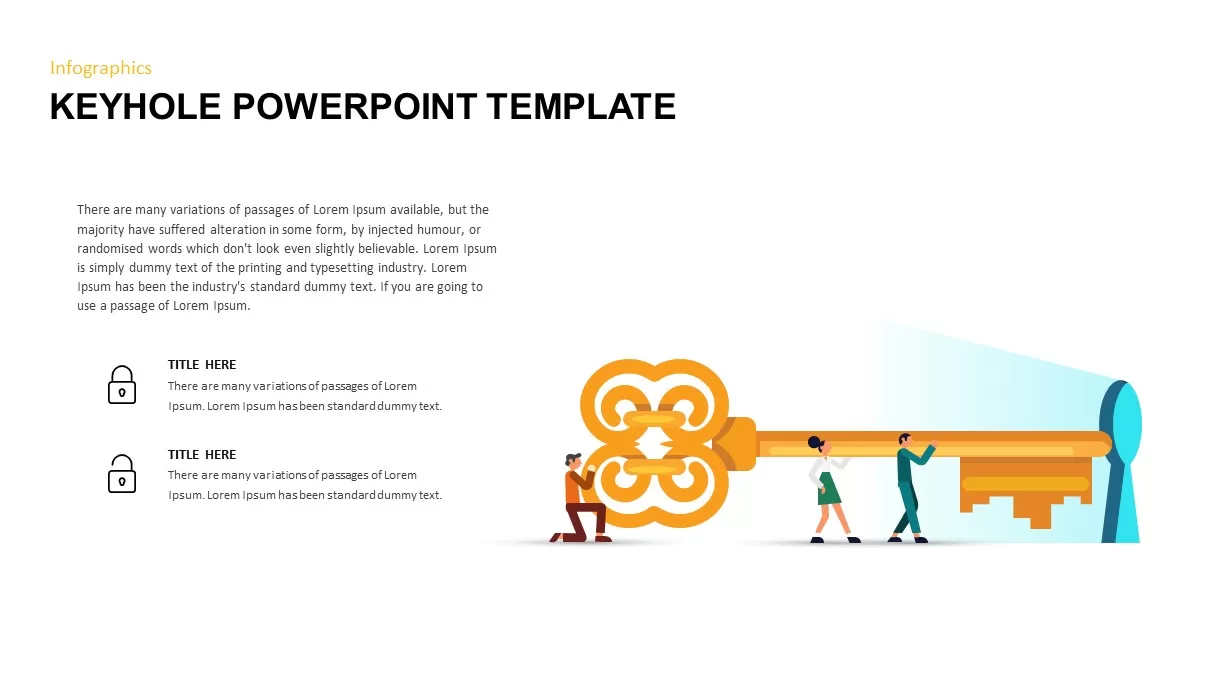
Keyhole Infographic Process Diagram Template for PowerPoint & Google Slides
Process
Six-Step Output Process Diagram Template for PowerPoint & Google Slides
Process
Modern 4 Section Process Diagram Template for PowerPoint & Google Slides
Process
Creative Infinity Loop Process Diagram Template for PowerPoint & Google Slides
Process
Snowball Effect Process Diagram Template for PowerPoint & Google Slides
Process
Five-Node Hub & Spoke Diagram Process Template for PowerPoint & Google Slides
Business Models
Chain Link Process Infographic Diagram Template for PowerPoint & Google Slides
Process
10 Step Circular Process Diagram Template for PowerPoint & Google Slides
Circular
3D Conveyor Belt Process Flow Diagram Template for PowerPoint & Google Slides
Process
Gear Process Diagram Template for PowerPoint & Google Slides
Process
E-Waste Management Process Flow Diagram Template for PowerPoint & Google Slides
Process
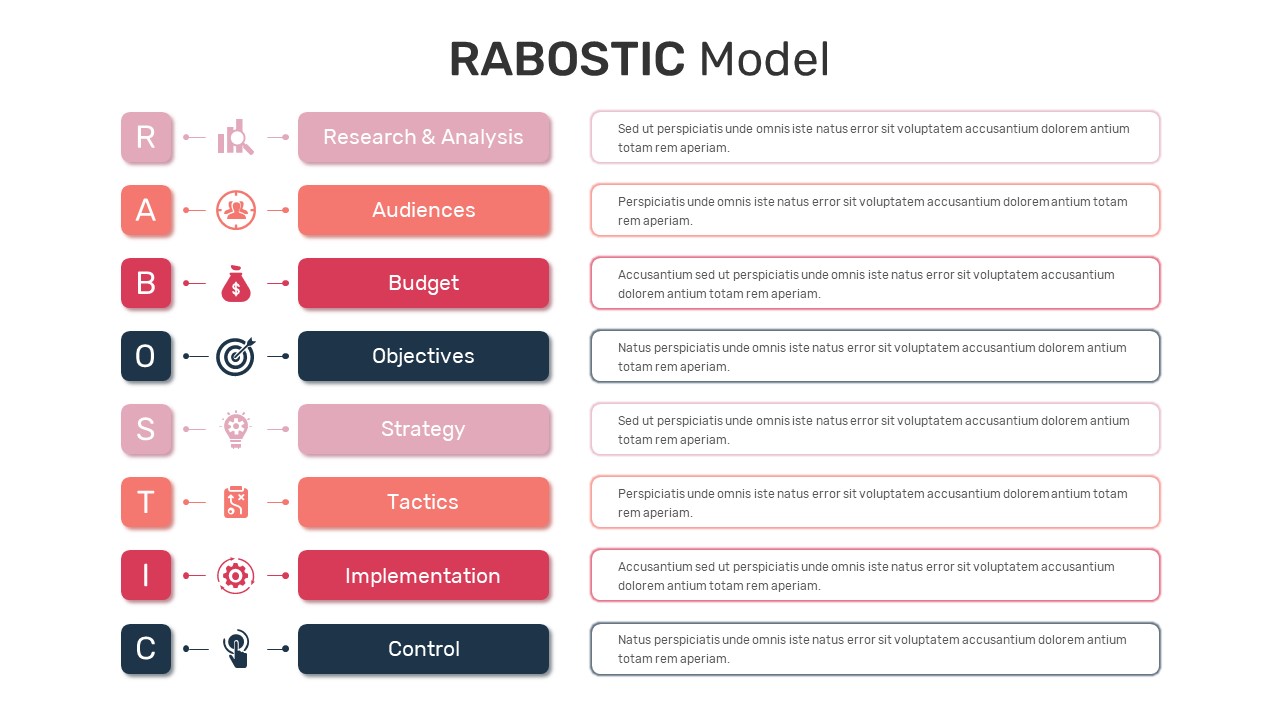
RABOSTIC Marketing Model Process Diagram Template for PowerPoint & Google Slides
Process
Cloud Kitchen Business Process Diagram Template for PowerPoint & Google Slides
Process
Negotiation Process Circular Diagram Template for PowerPoint & Google Slides
Circular
Business Process Analysis Cycle Diagram Template for PowerPoint & Google Slides
Business Strategy
Comprehensive Process Flow Diagram Template for PowerPoint & Google Slides
Process
Repeating Overlapping Process Diagram Template for PowerPoint & Google Slides
Process
Animated Gears Process Flow Diagram Template for PowerPoint & Google Slides
Process
Free UI/UX Process Timeline Diagram Template for PowerPoint & Google Slides
Process
Free
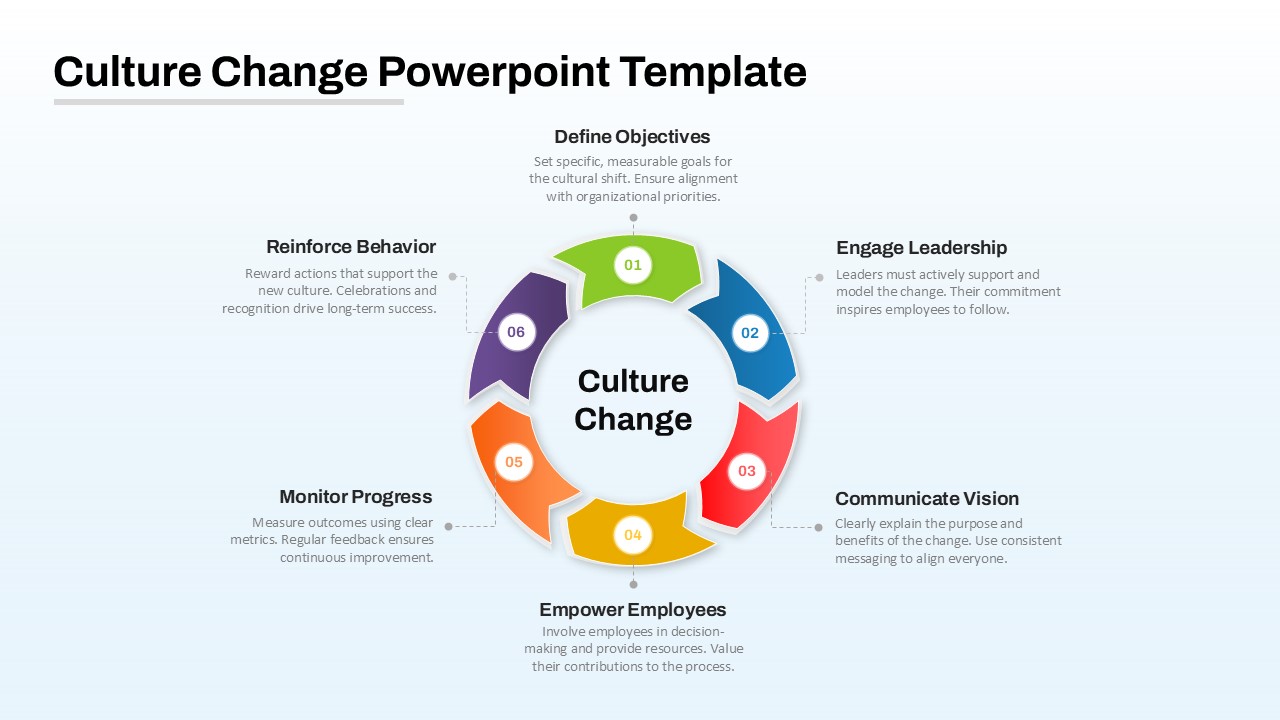
Culture Change Circular Process Diagram Template for PowerPoint & Google Slides
Process
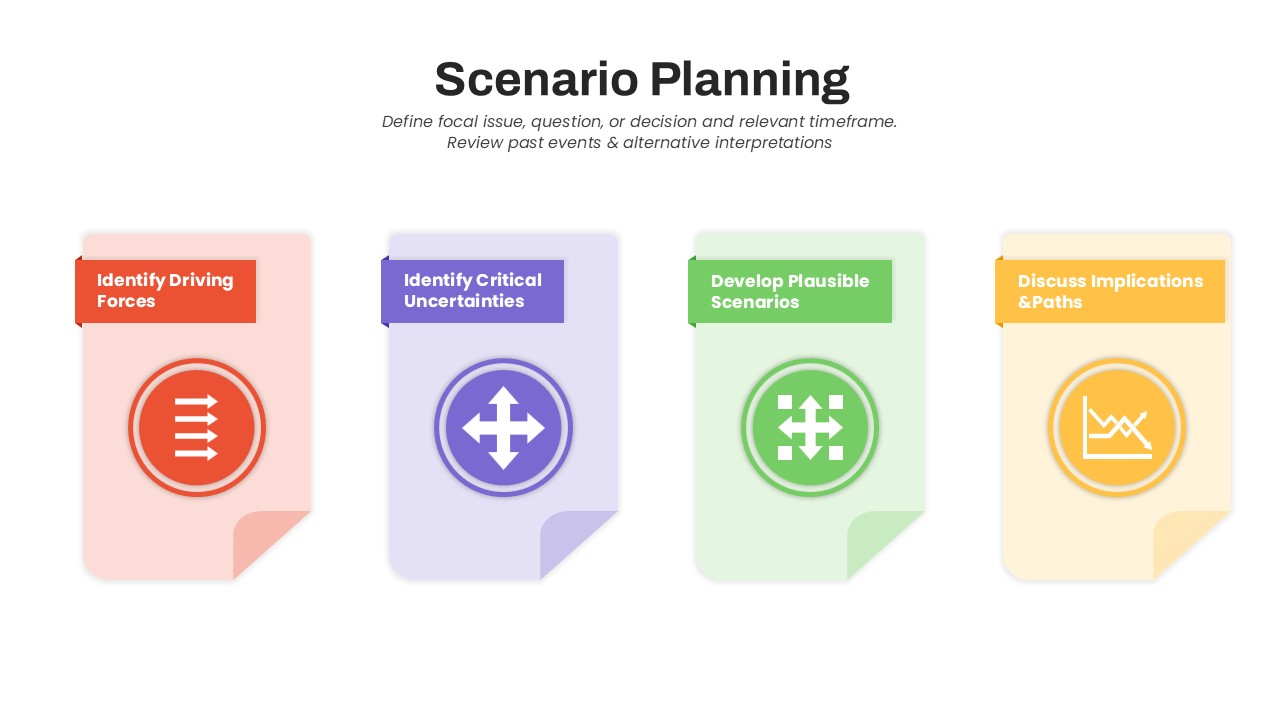
Scenario Planning Process Diagram Template for PowerPoint & Google Slides
Process
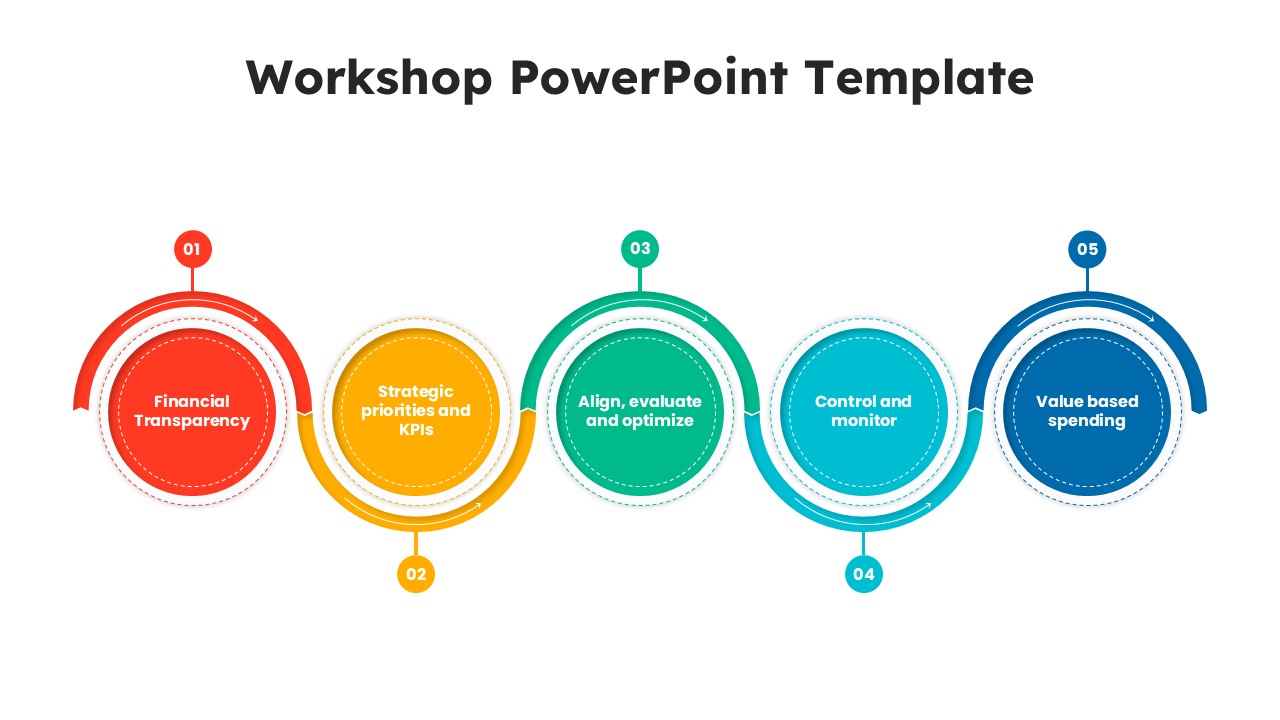
Workshop 5-Step Circular Process Diagram Template for PowerPoint & Google Slides
Circular
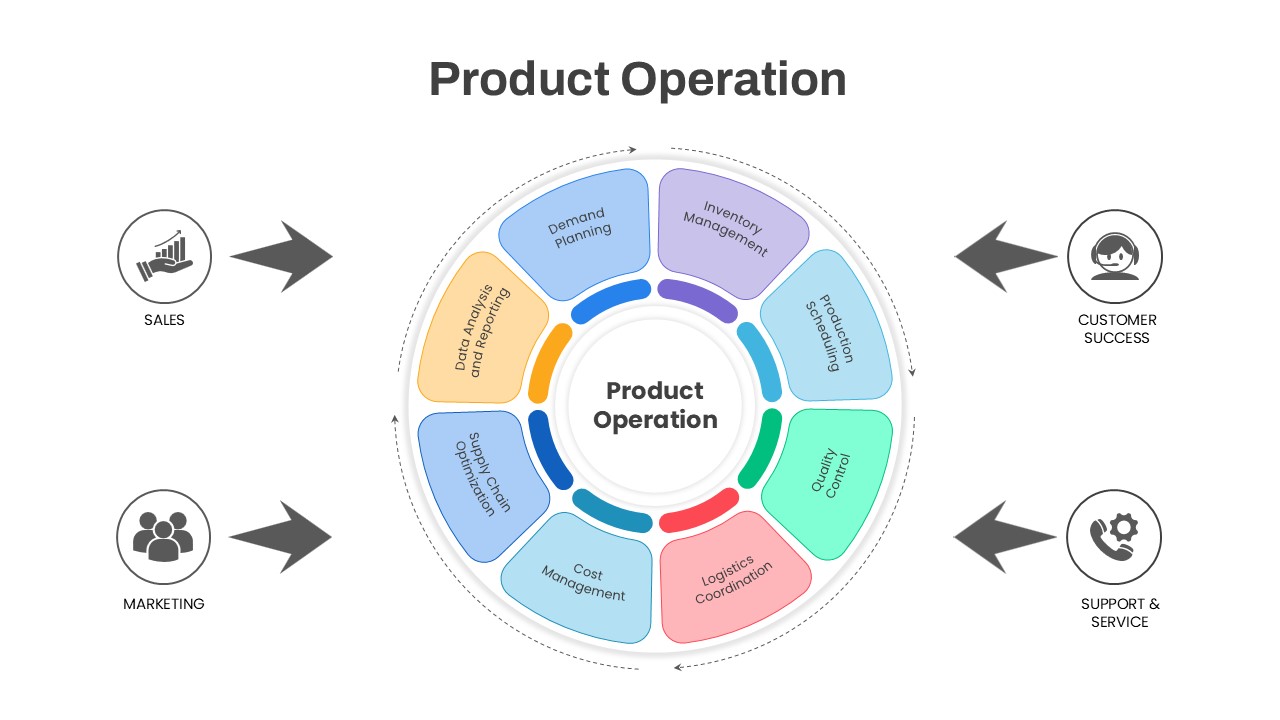
Product Operation Process Diagram Template for PowerPoint & Google Slides
Process
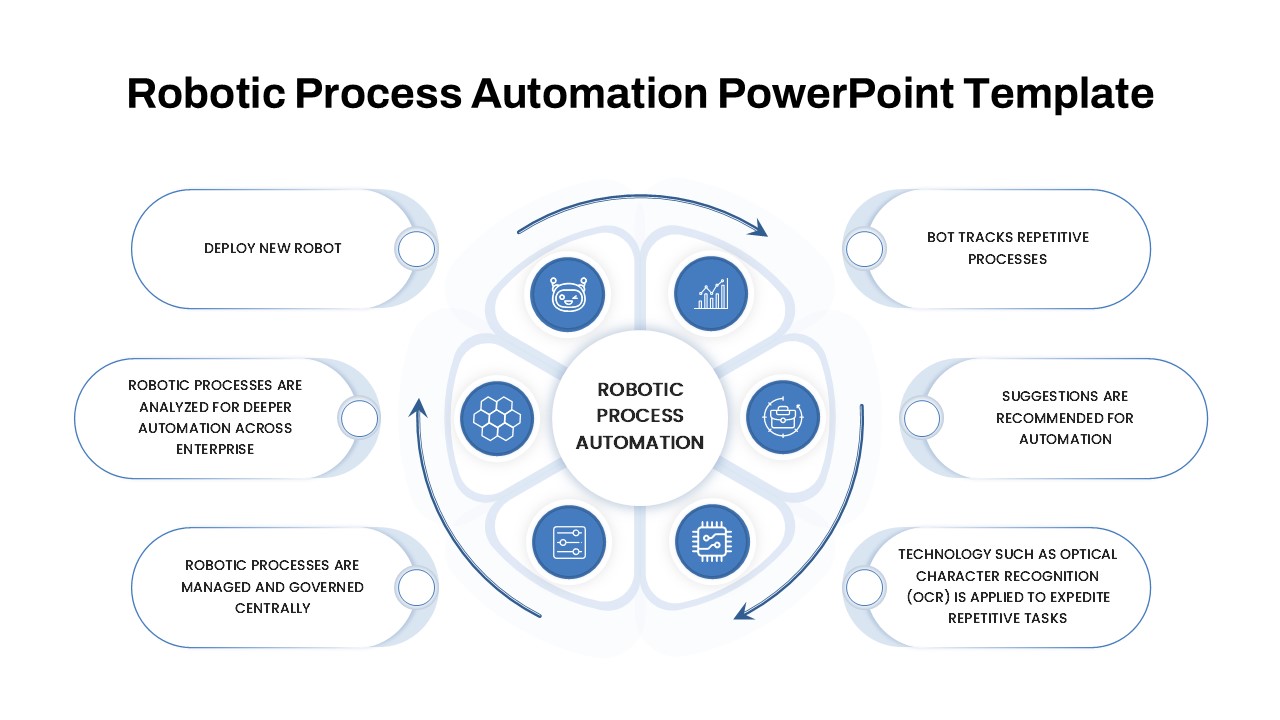
Robotic Process Automation Diagram Template for PowerPoint & Google Slides
Process
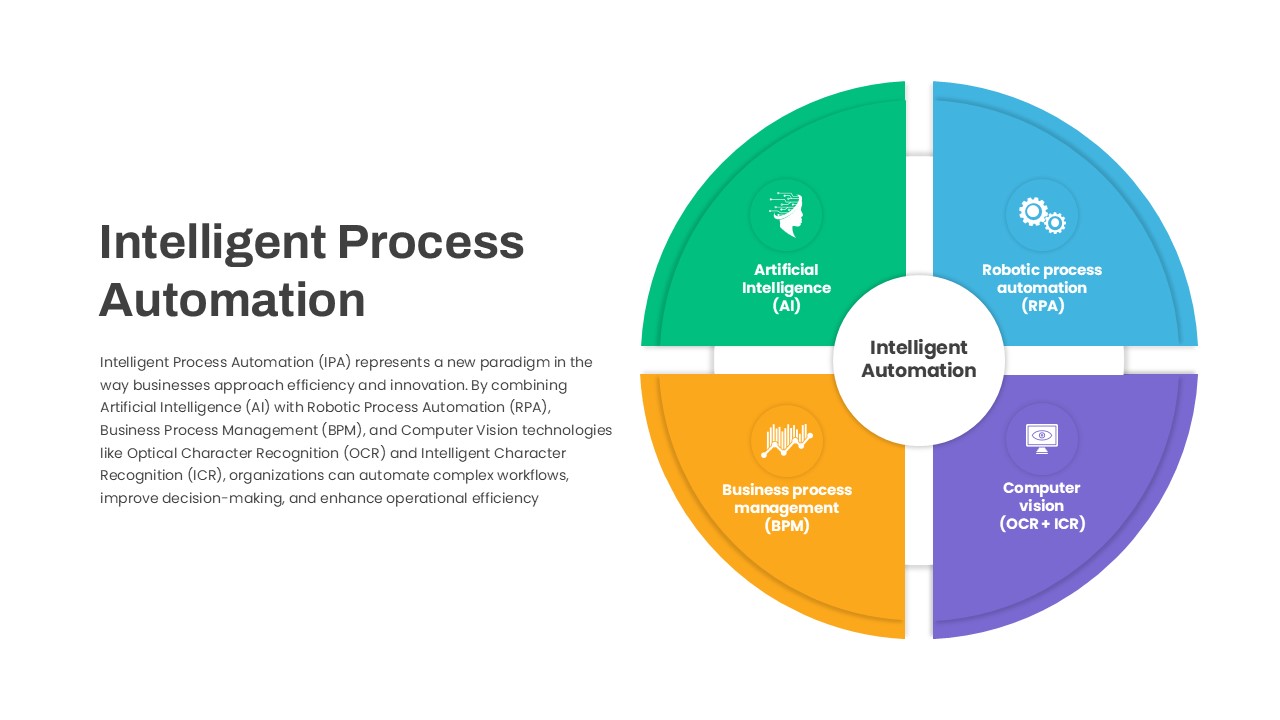
Intelligent Process Automation Diagram Template for PowerPoint & Google Slides
Circular
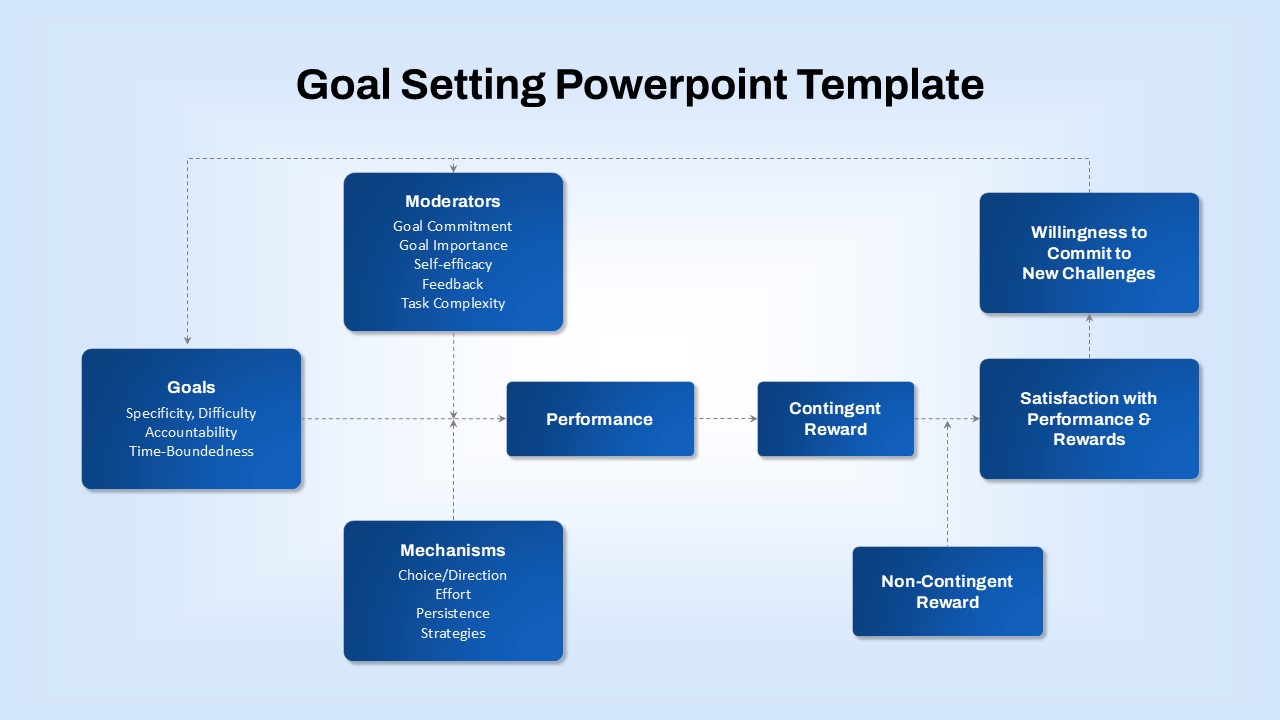
Goal-Setting Process Flow Diagram Template for PowerPoint & Google Slides
Goals
Change Management Process Cycle Diagram Template for PowerPoint & Google Slides
Process
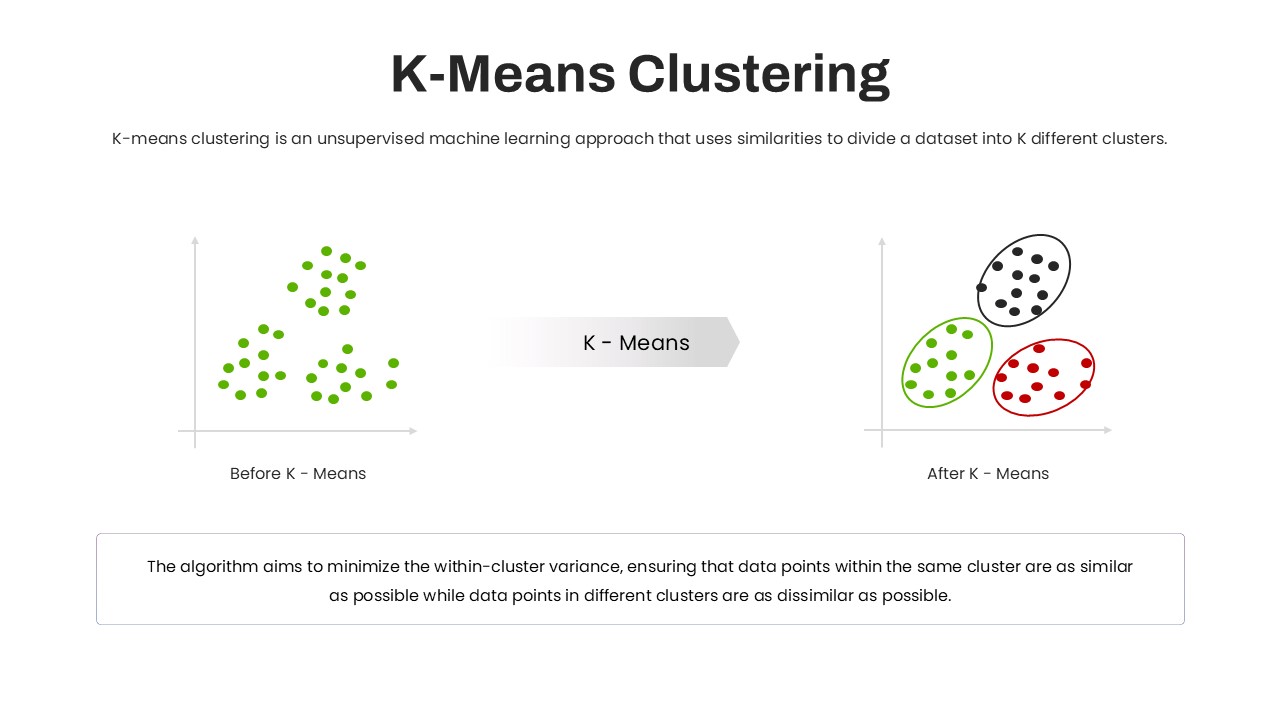
K-Means Clustering Process Diagram Template for PowerPoint & Google Slides
Machine Learning