Bridging the Gap Infographic Process template for PowerPoint & Google Slides
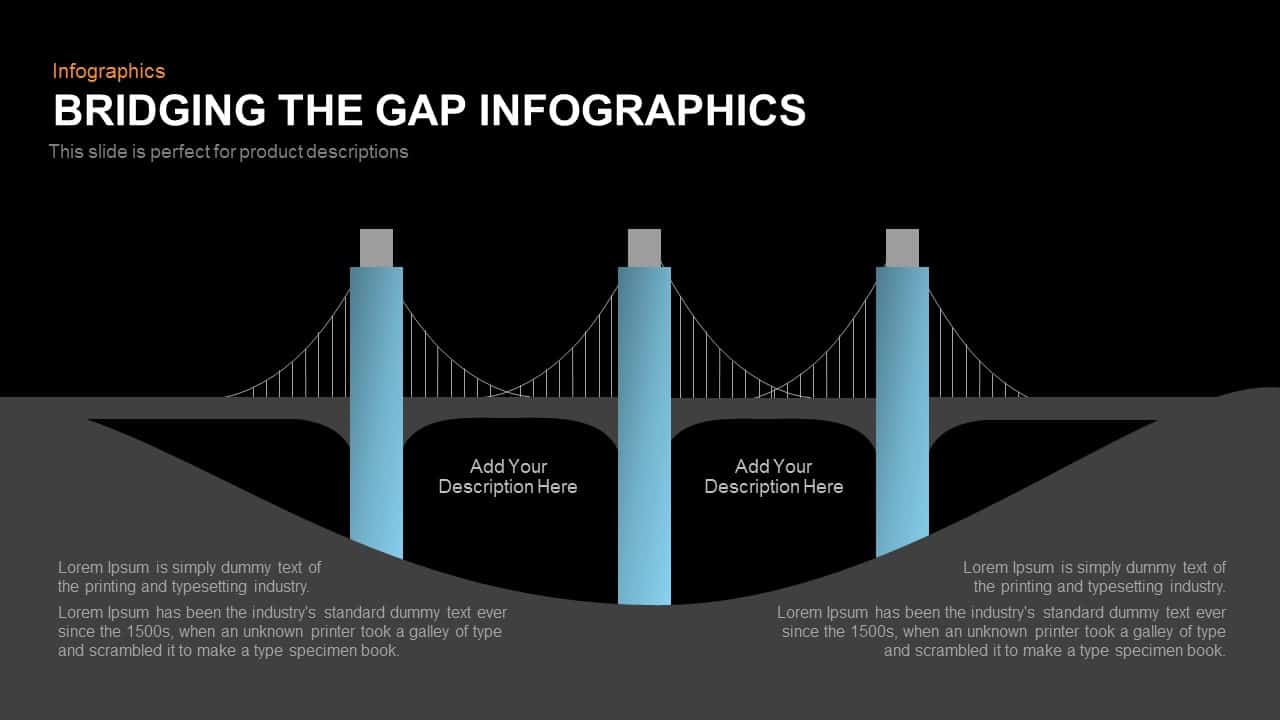
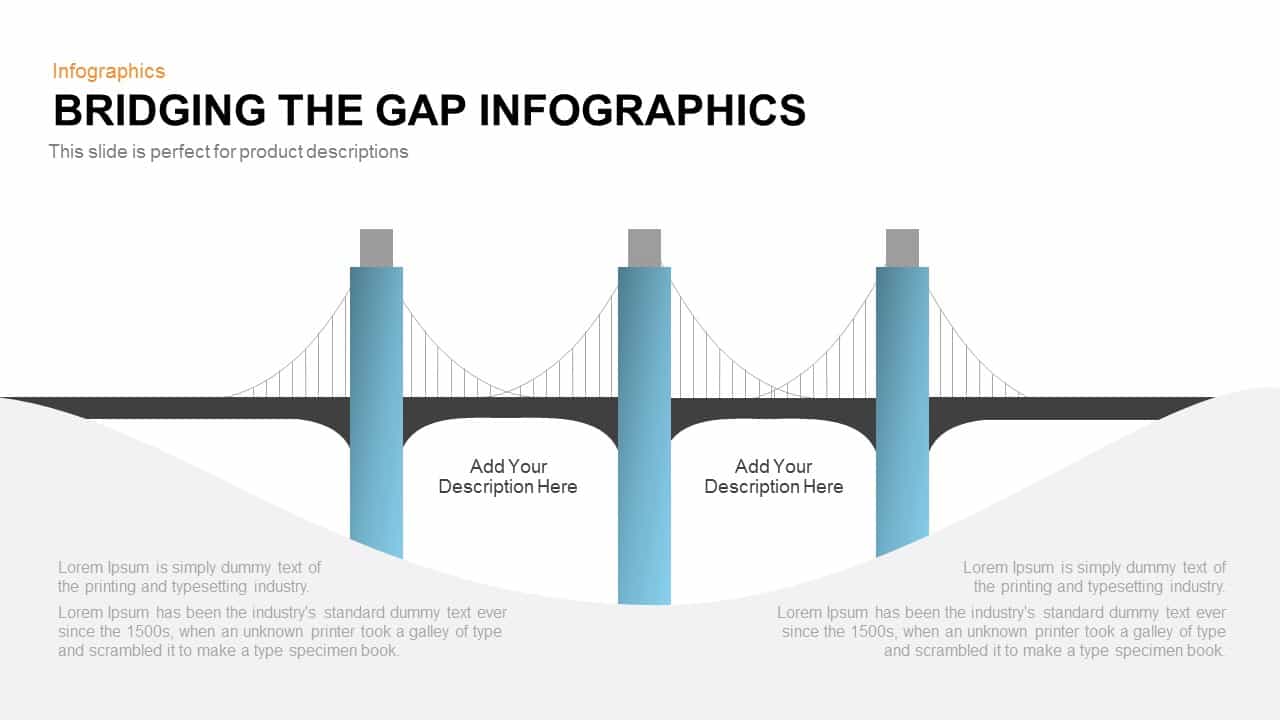
Leverage this dynamic Bridging the Gap Infographics slide to visually connect distinct process stages with clarity and professional style. Featuring three gradient-filled pillar elements supporting a stylized bridge silhouette, this template highlights up to three key steps or milestones across two contrasting environments. Each pillar includes a placeholder for concise descriptions, while subtle background waves and refined line art maintain an uncluttered layout.
Personalize every element with ease: adjust the gradient hues to align with your brand palette, modify pillar heights to represent proportional data, and reposition text boxes or icons in seconds. Edit vector shapes directly on the master slide to ensure consistency throughout your deck. Use the intuitive navigation arrows to guide viewers through sequenced workflows or step-by-step explanations.
Ideal for illustrating strategic initiatives—such as bridging organizational silos, mapping transition phases, or showcasing multi-phase roadmaps—this infographic enhances comprehension by visually linking concepts. Its minimalist typography, balanced whitespace, and cohesive color scheme keep audience attention focused on your narrative.
This slide excels in diverse scenarios: present a three-stage product adoption cycle, outline key milestones in a change management plan, or compare pre- and post-implementation metrics side by side. Simply replace placeholder content with project objectives, performance indicators, or training highlights to adapt to your specific context.
Designed for both Microsoft PowerPoint and Google Slides, this asset maintains full-resolution clarity across devices and platforms. Utilize built-in master layouts and editable placeholders to streamline collaboration, reduce version-control headaches, and accelerate slide production. With seamless compatibility and flexible customization, this template empowers you to deliver polished presentations that resonate with stakeholders.
Whether you’re preparing a boardroom briefing, executive overview, or educational workshop, this Bridging the Gap slide ensures complex information is presented with maximum impact and minimal effort.
Who is it for
Product managers, marketing analysts, regional sales teams, and business consultants will benefit from this infographic when outlining multi-phase strategies or illustrating transition workflows. Educators, trainers, and project leads can also leverage this slide to streamline complex explanations and foster audience engagement during workshops or lectures.
Other Uses
Beyond process mapping, repurpose this slide to compare pre- and post-implementation results, highlight project milestones, showcase phased rollouts, visualize workflow handoffs, or depict cross-departmental collaborations. Adjust colors and text to adapt the layout for risk assessments, training modules, stakeholder updates, or academic lectures.
Login to download this file

Item ID
SB00304
Related Templates

Interactive Gap Analysis Puzzle Diagram Template for PowerPoint & Google Slides
Gap

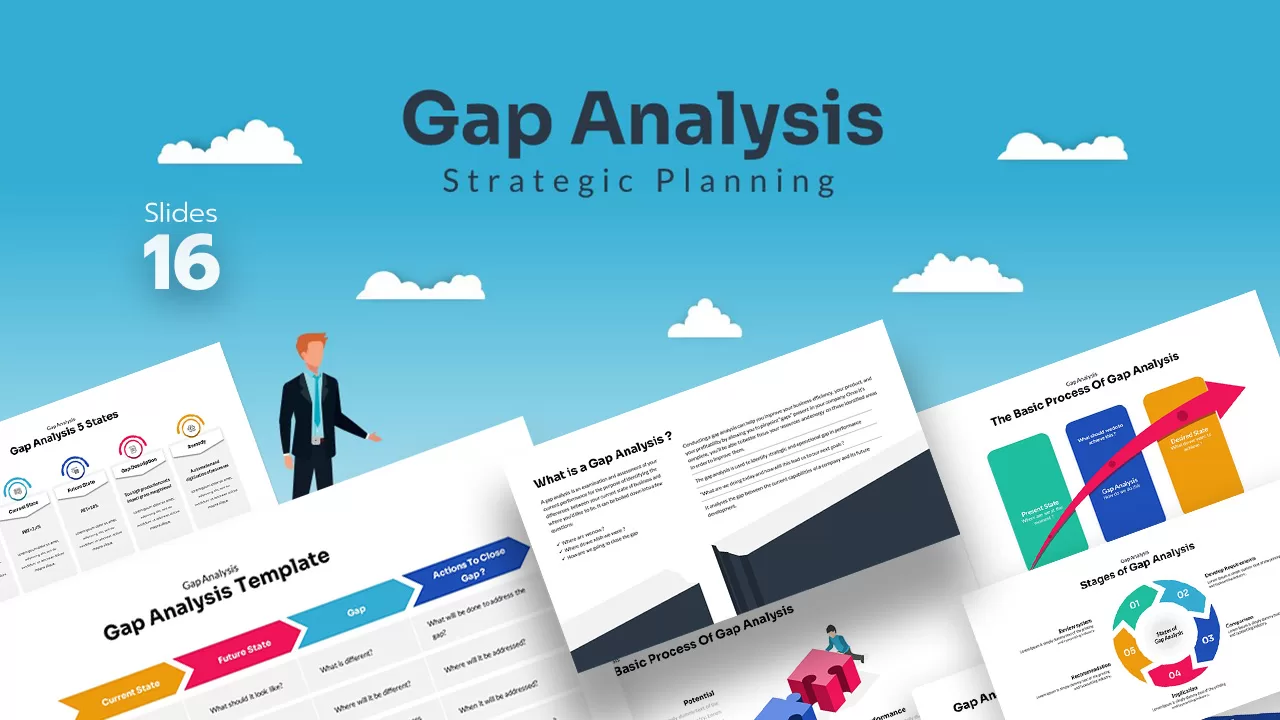
Gap Analysis Strategic Planning Template for PowerPoint & Google Slides
Gap
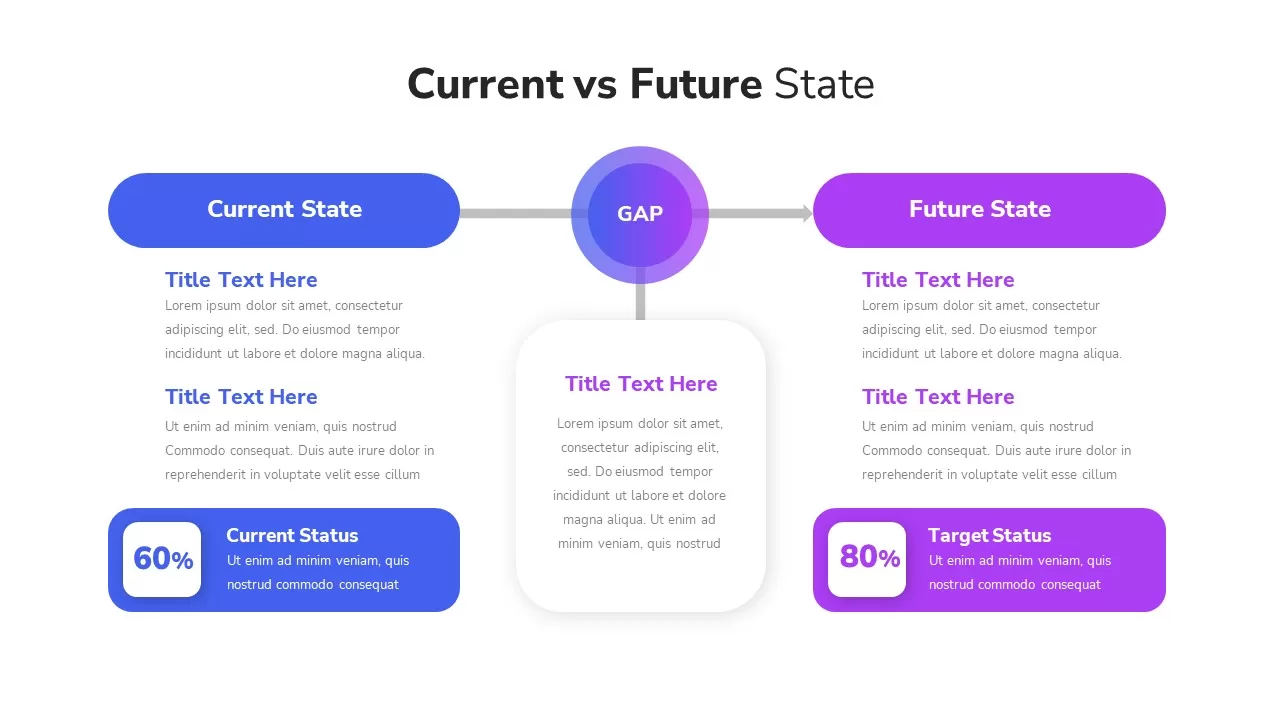
Current vs Future State Gap Analysis template for PowerPoint & Google Slides
Comparison
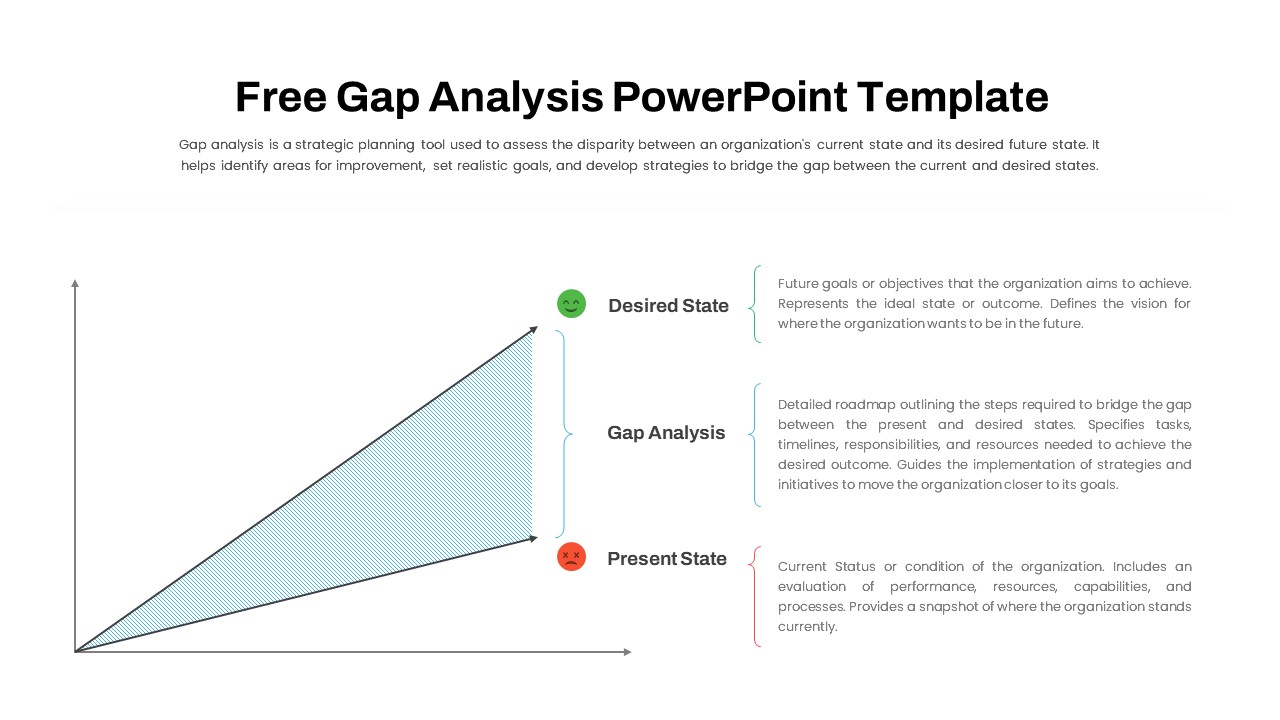
Free Comprehensive Gap Analysis Framework Template for PowerPoint & Google Slides
Opportunities Challenges
Free
Skills Gap Analysis Comparison Chart Template for PowerPoint & Google Slides
Gap
Data Gap Analysis Template for PowerPoint & Google Slides
Business
Financial Gap Analysis Framework Template for PowerPoint & Google Slides
Finance
Gap Analysis Strategic Planning for PowerPoint & Google Slides
Business

Sales Process Infographic Slides Pack Template for PowerPoint & Google Slides
Process
Workflow PowerPoint Process infographic for PowerPoint & Google Slides
Process
6 Stage Process Diagram Infographic Template for PowerPoint & Google Slides
Process
7-Step 3D Process Infographic Model template for PowerPoint & Google Slides
Process
Four-Circle Business Process Infographic Template for PowerPoint & Google Slides
Circular

Hexagon Process Infographic Template for PowerPoint & Google Slides
Process
Process Gears with Elements Infographic Template for PowerPoint & Google Slides
Process
Eight-Stage Circular Process Infographic Template for PowerPoint & Google Slides
Circular
Colorful Four-Stage Infographic Process Template for PowerPoint & Google Slides
Process
Five Stage Process Diagram Infographic Template for PowerPoint & Google Slides
Process

Three-Circle Process Infographic Template for PowerPoint & Google Slides
Circular
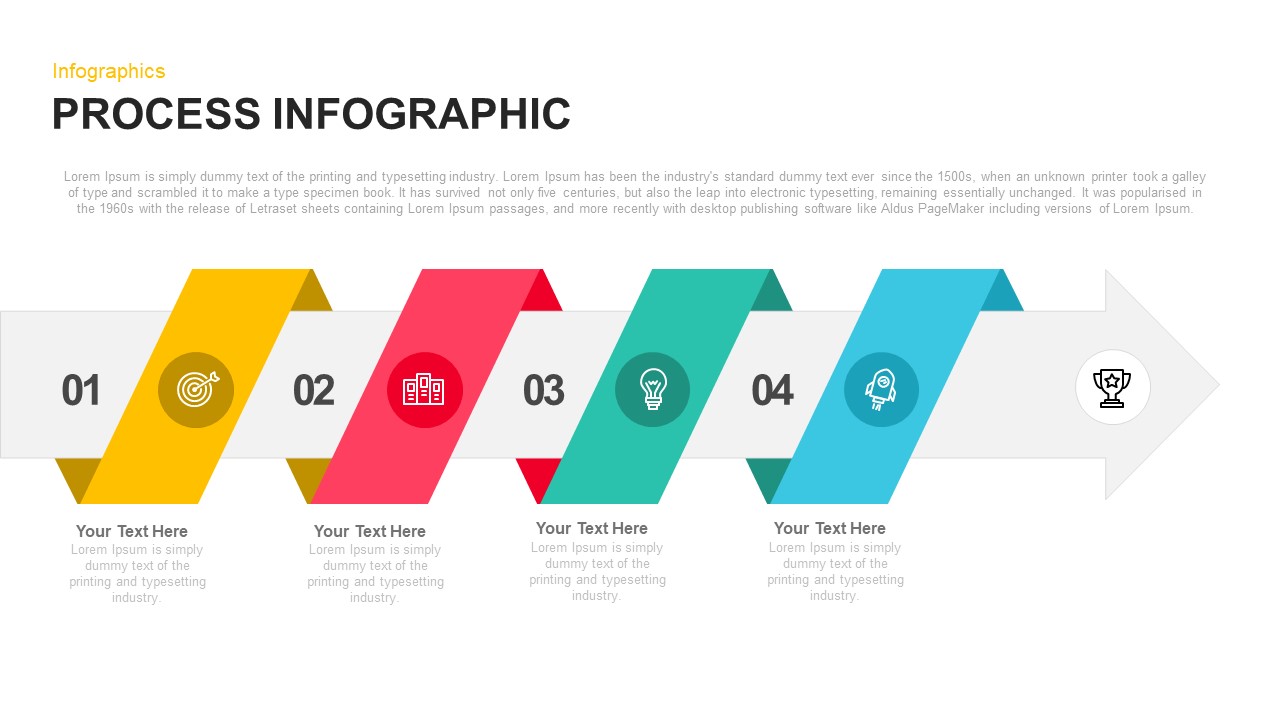
Four-Step Arrow Process Infographic Template for PowerPoint & Google Slides
Arrow
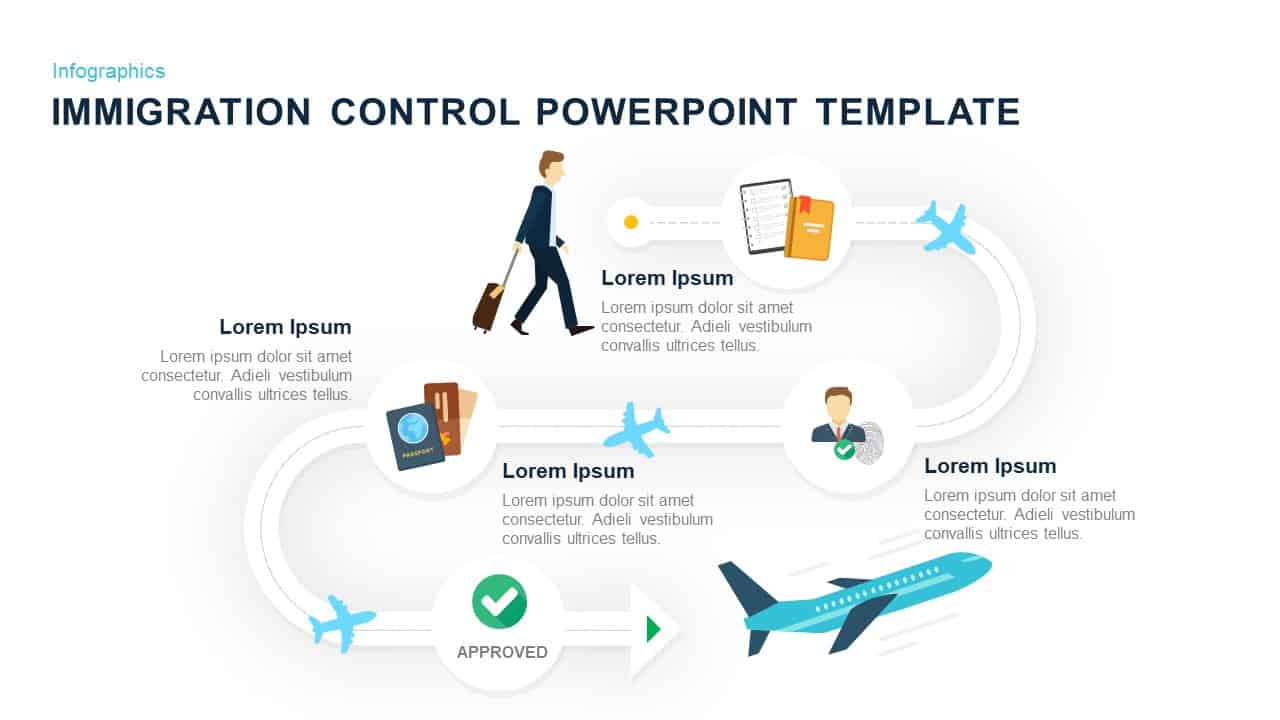
Immigration Control Process Infographic Template for PowerPoint & Google Slides
Process
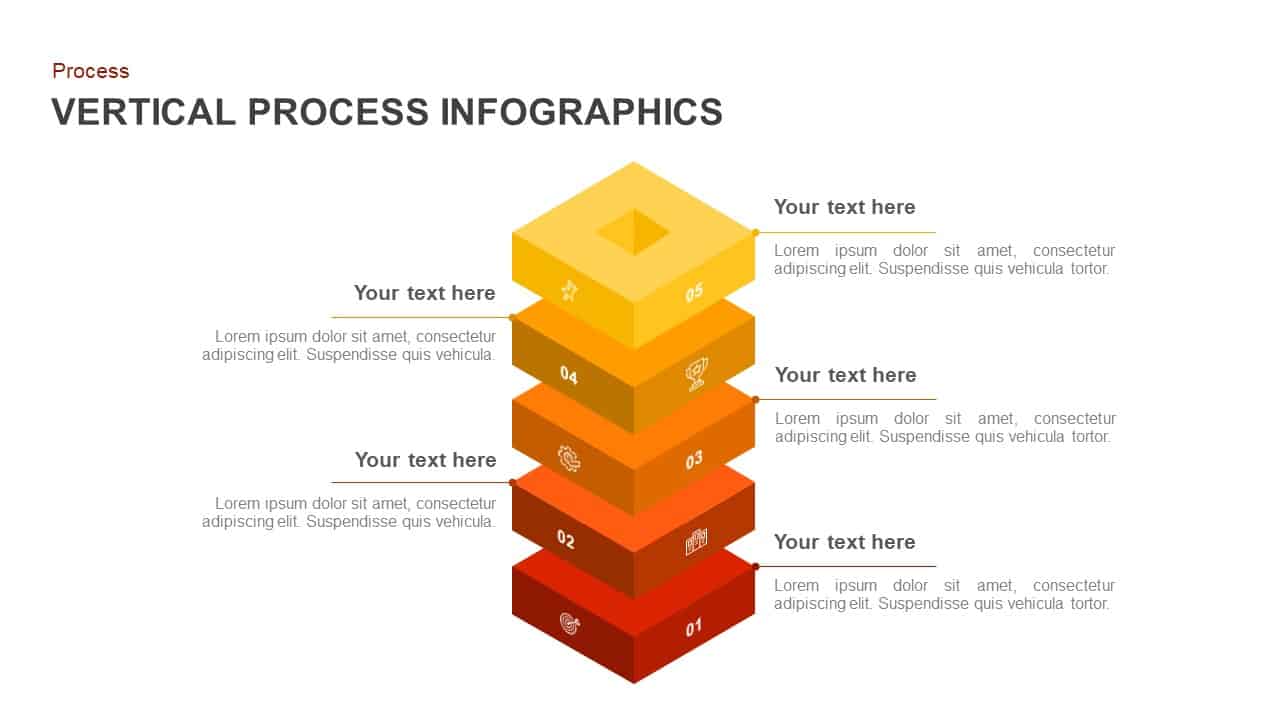
Vertical Stacked Process Infographic Template for PowerPoint & Google Slides
Process
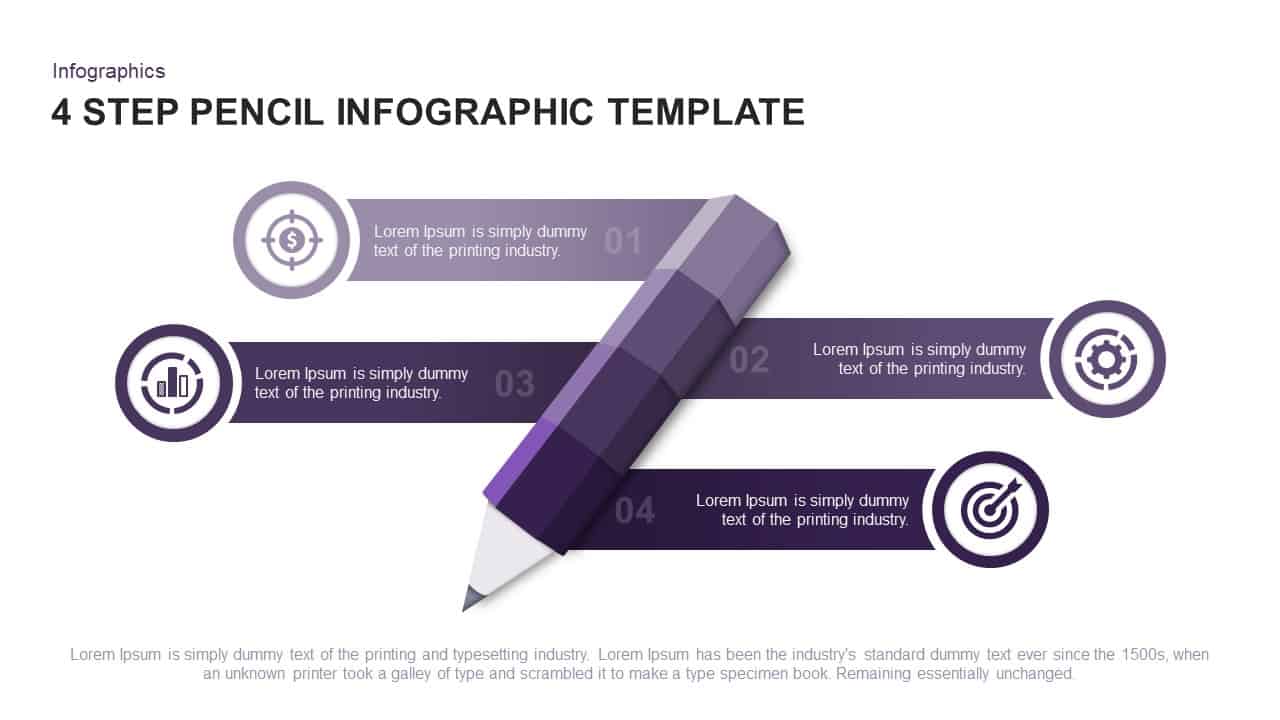
Four-Step Pencil Infographic Process Template for PowerPoint & Google Slides
Process
Water Cycle Process Infographic Template for PowerPoint & Google Slides
Process
Circular CRM Process Diagram Infographic Template for PowerPoint & Google Slides
Circular
Vertical Four-Step Process Infographic Template for PowerPoint & Google Slides
Process
Gradient 5-Step Infographic Process Template for PowerPoint & Google Slides
Process
Five-Step Vertical Process Infographic Template for PowerPoint & Google Slides
Process
Marketing Process Channels Infographic template for PowerPoint & Google Slides
Process
Four Step Process Infographic Slide Template for PowerPoint & Google Slides
Process
Four-Step Hexagon Process Infographic Template for PowerPoint & Google Slides
Process
Goal Planning Ribbon Process Infographic Template for PowerPoint & Google Slides
Goals
Six Sigma 6S Process Infographic Diagram Template for PowerPoint & Google Slides
Process
Six-Circle Process Infographic Diagram Template for PowerPoint & Google Slides
Circular
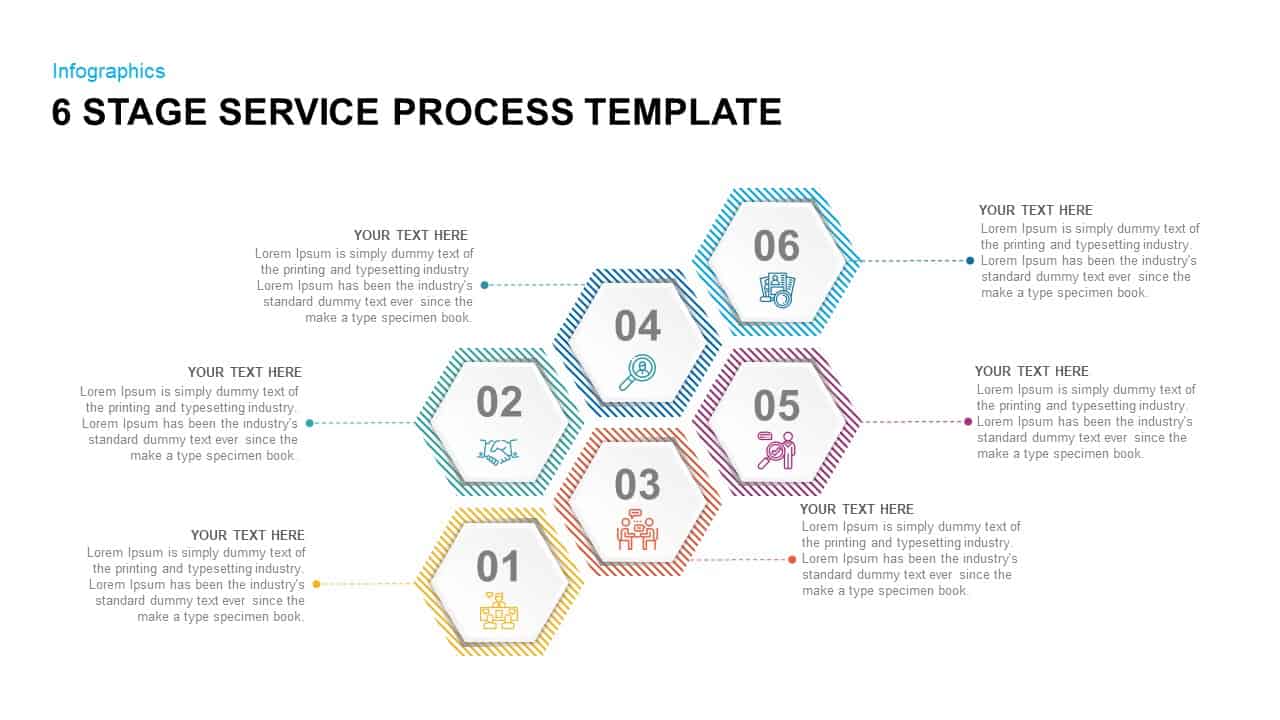
6 Stage Service Process Infographic Template for PowerPoint & Google Slides
Process

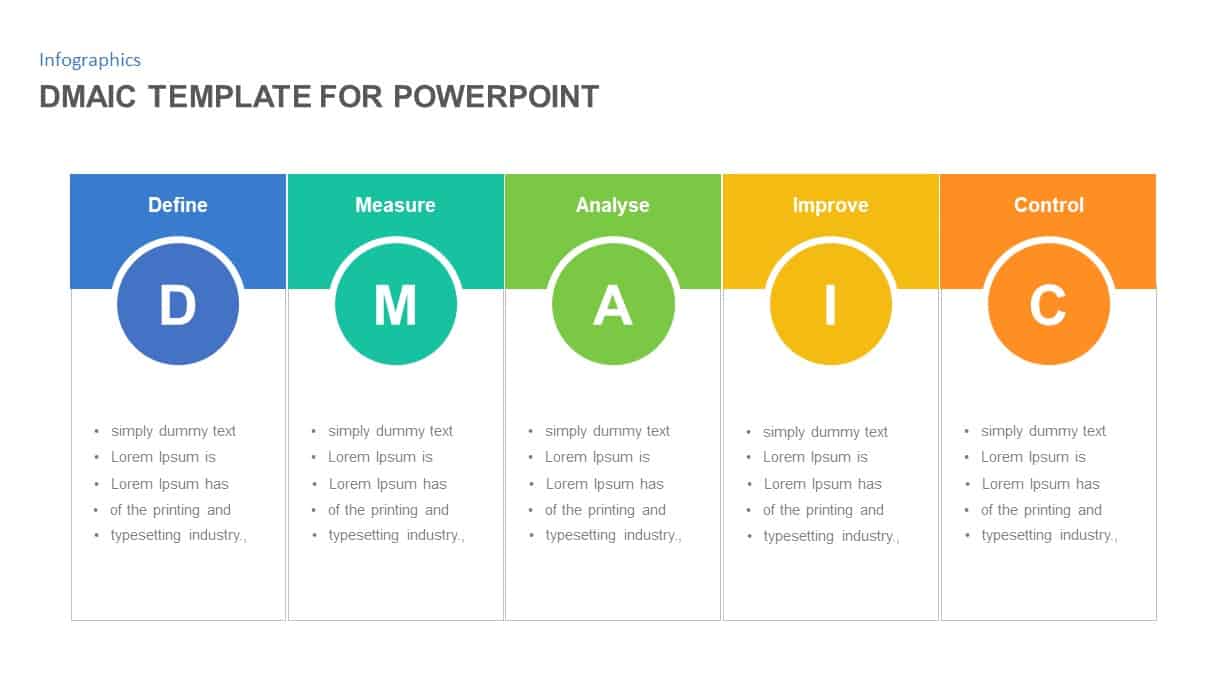
DMAIC Process Improvement Infographic Template for PowerPoint & Google Slides
Process
Five-Step Infographic Process and Agenda Template for PowerPoint & Google Slides
Process
Circular CRM Process Infographic Diagram Template for PowerPoint & Google Slides
Circular
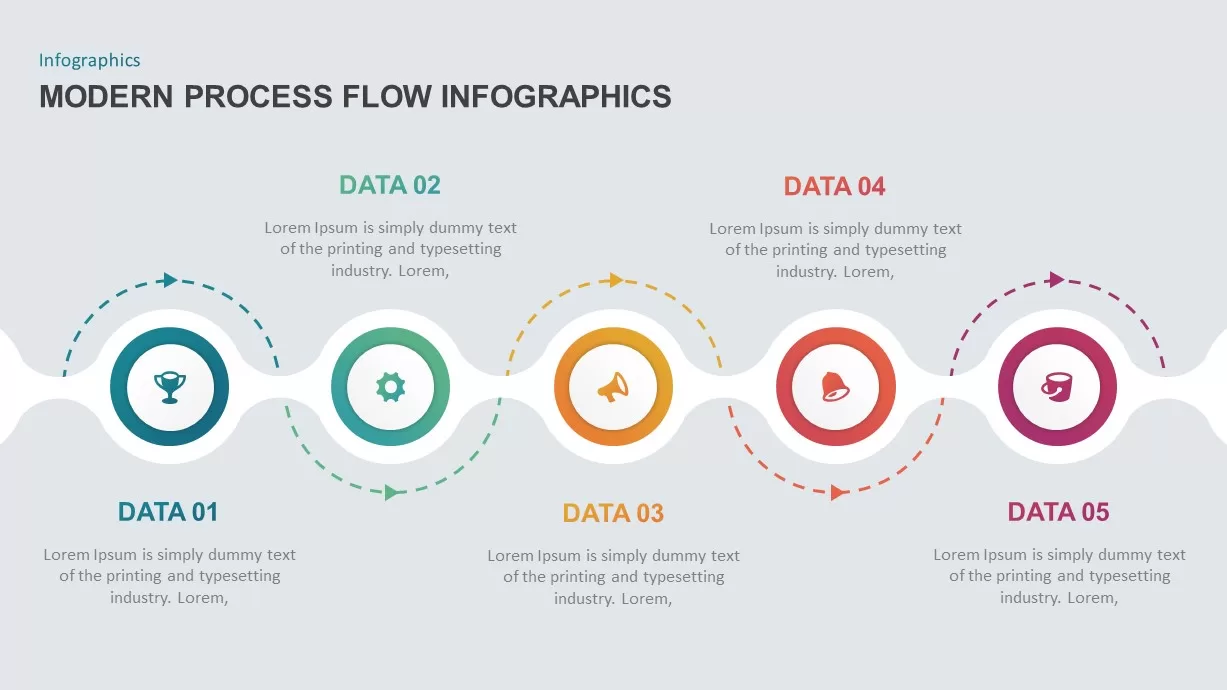
Modern 5-Step Process Flow Infographic Template for PowerPoint & Google Slides
Process
Keyhole Infographic Process Diagram Template for PowerPoint & Google Slides
Process
Five-Step Process Flow Infographic Template for PowerPoint & Google Slides
Process
Four-Step Isometric Process Infographic Template for PowerPoint & Google Slides
Process
Five-Step Marketing Process Infographic Template for PowerPoint & Google Slides
Process
3 & 4 Step Circular Process Infographic Template for PowerPoint & Google Slides
Process
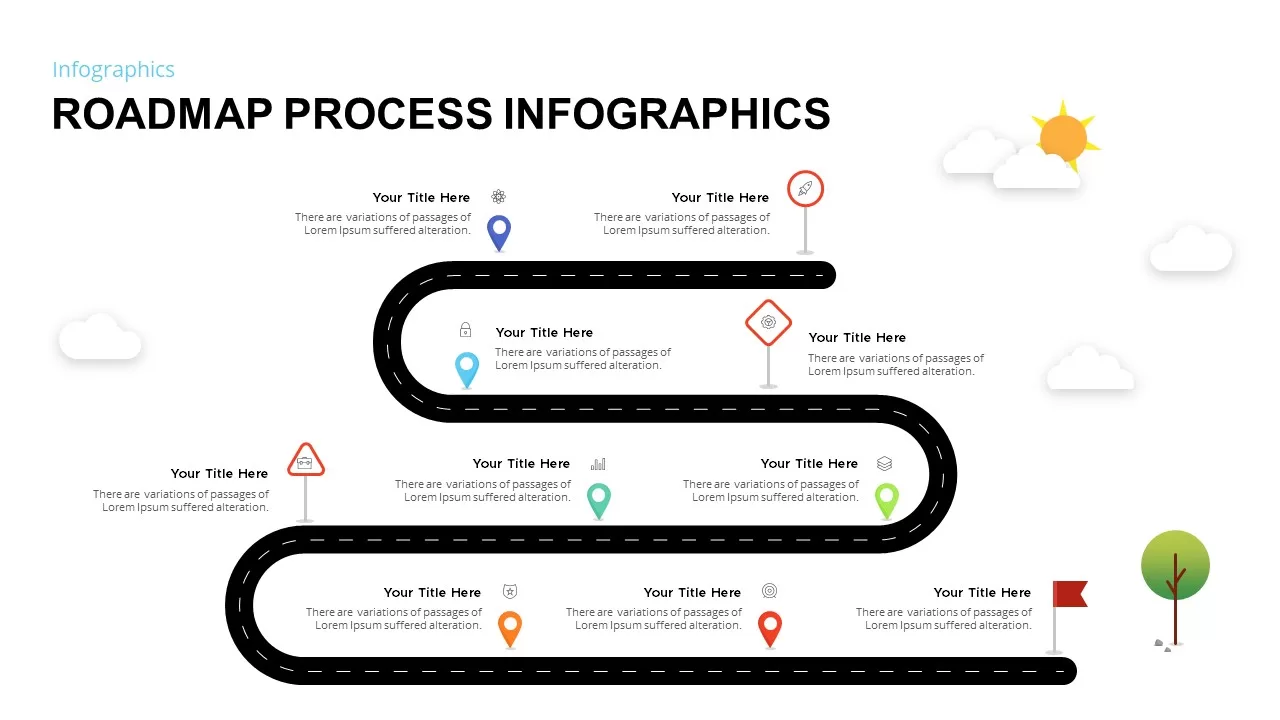
Roadmap Process Infographic Template for PowerPoint & Google Slides
Roadmap
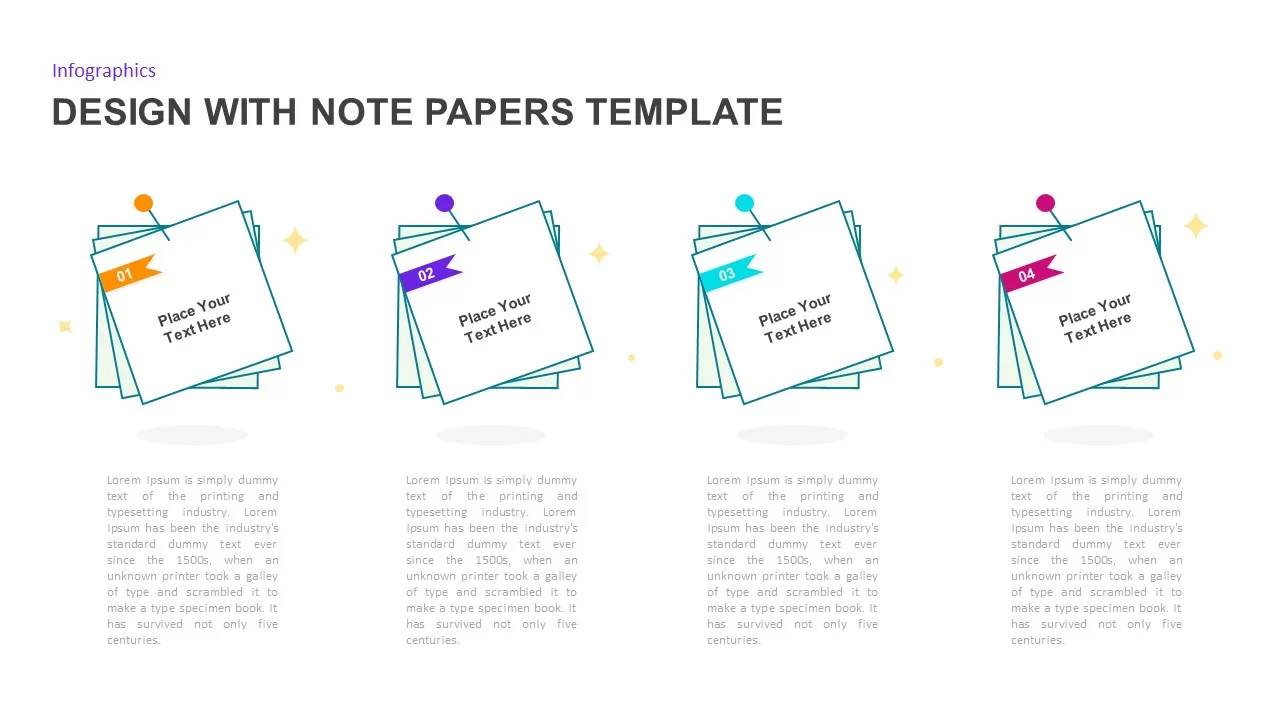
Pinnable Note-Paper Process Infographic Template for PowerPoint & Google Slides
Process
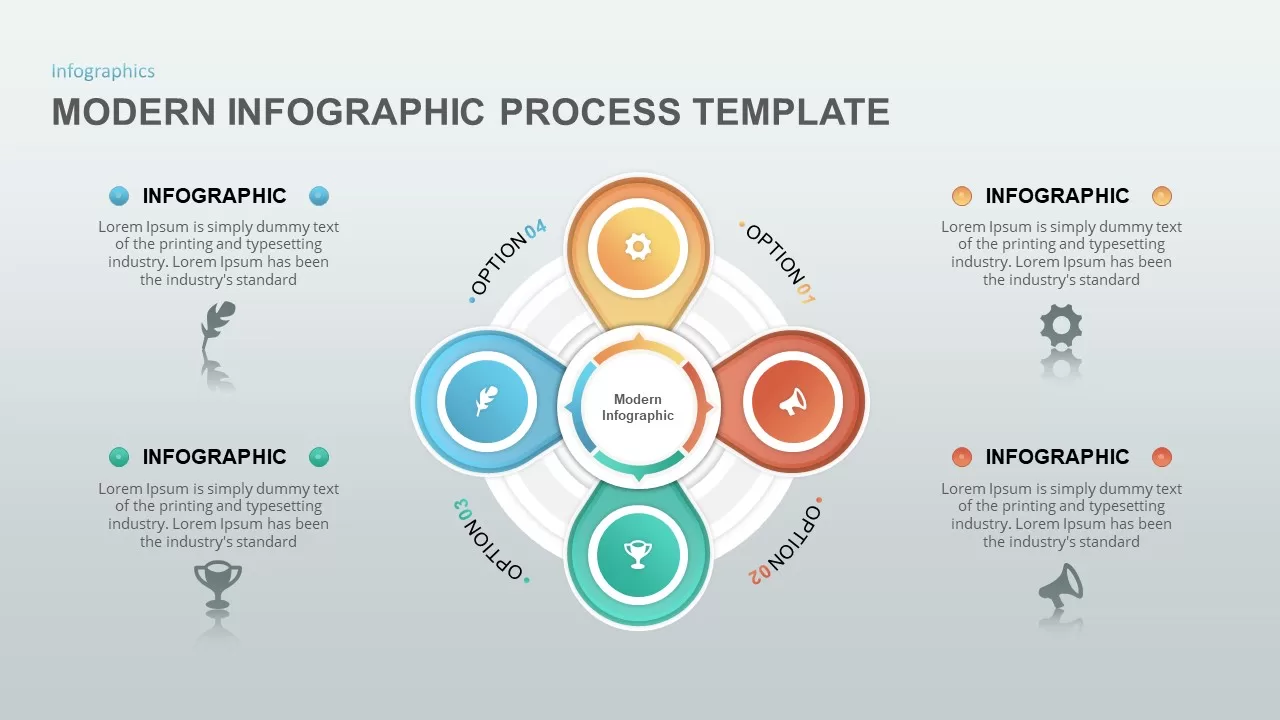
Modern Infographic Process template for PowerPoint & Google Slides
Infographics
Minimal Process Flow Diagram Infographic Template for PowerPoint & Google Slides
Process
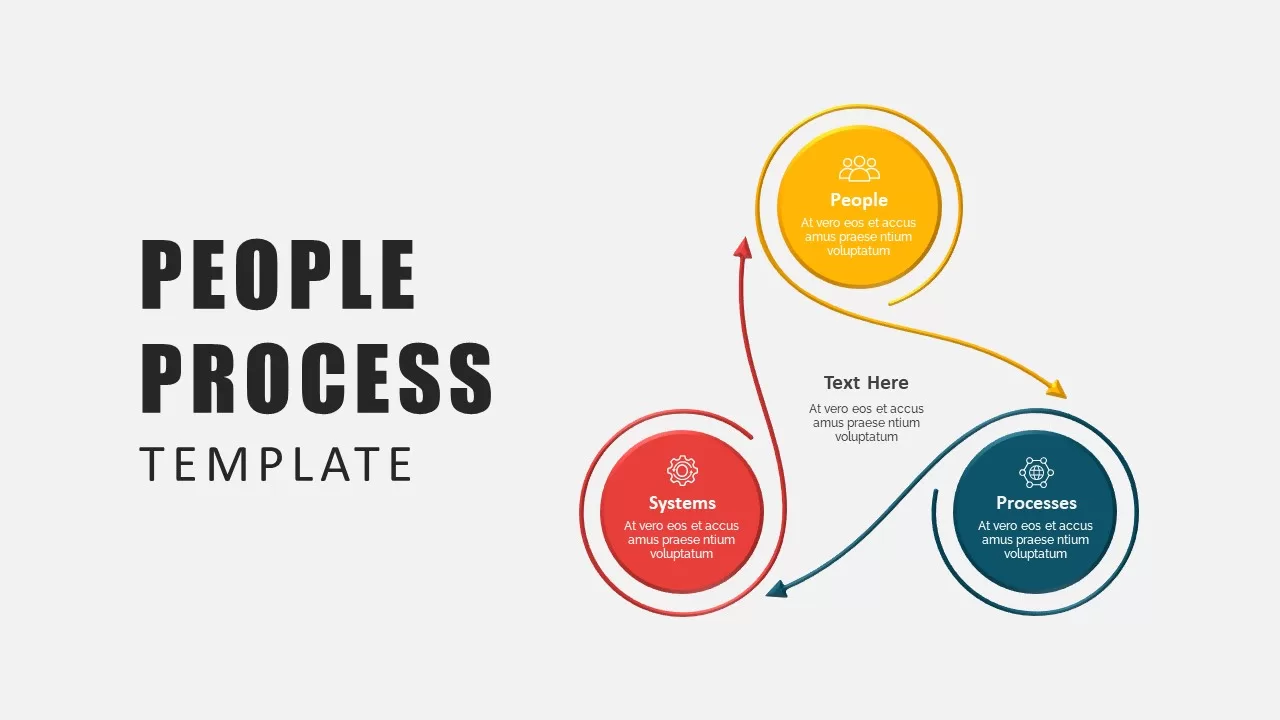
People-Process-Technology Infographic Template for PowerPoint & Google Slides
Process
Multi-Step Infographic Process Layout Template for PowerPoint & Google Slides
Process
Curved Arrow Process Flow Infographic Template for PowerPoint & Google Slides
Process
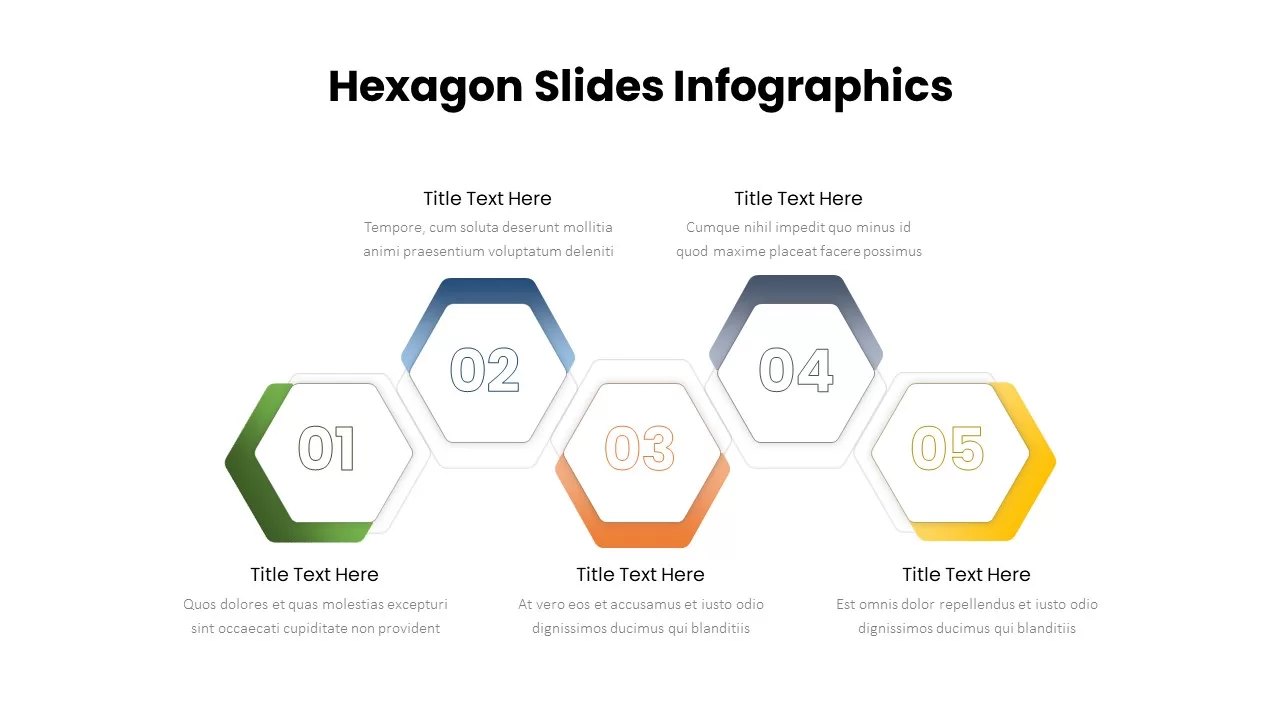
Five-Step Hexagon Infographic Process Template for PowerPoint & Google Slides
Process
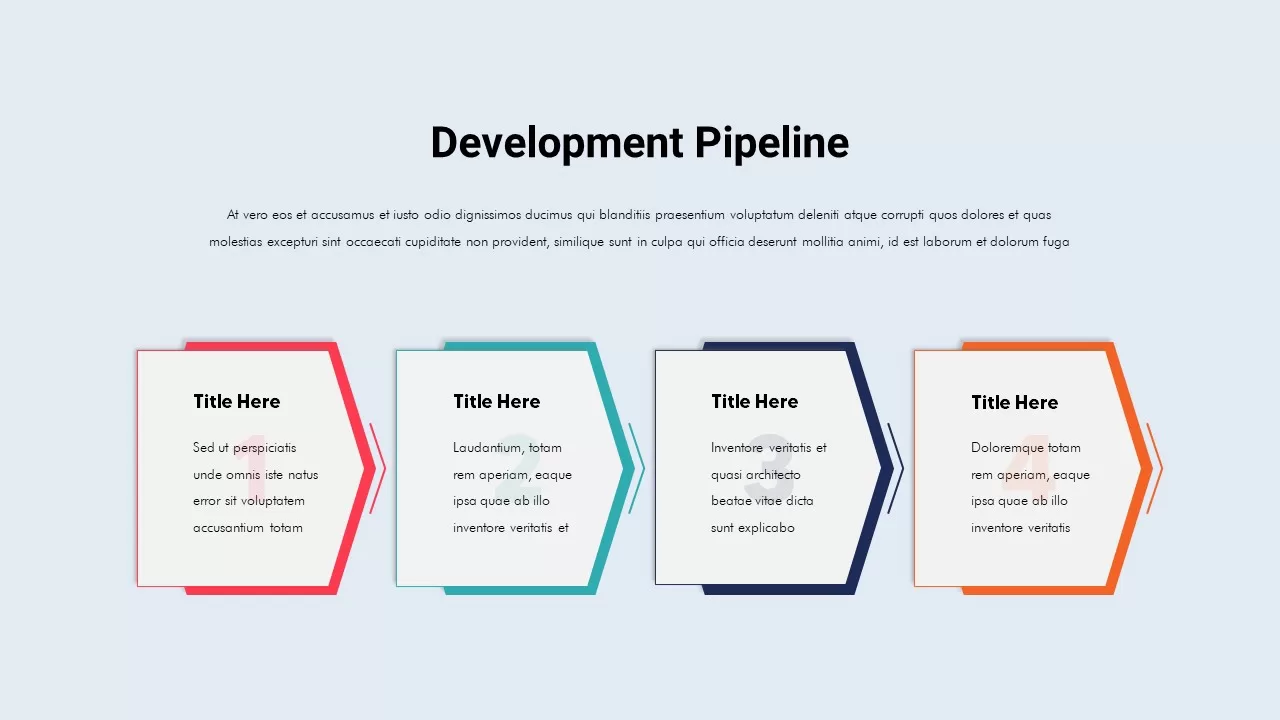
Development Pipeline Process Infographic Template for PowerPoint & Google Slides
Process
Three-Step Hexagon Infographic Process Template for PowerPoint & Google Slides
Process
Nursing Process Infographic Template for PowerPoint & Google Slides
Nursing
Ten Step Circular Process Infographic Template for PowerPoint & Google Slides
Process
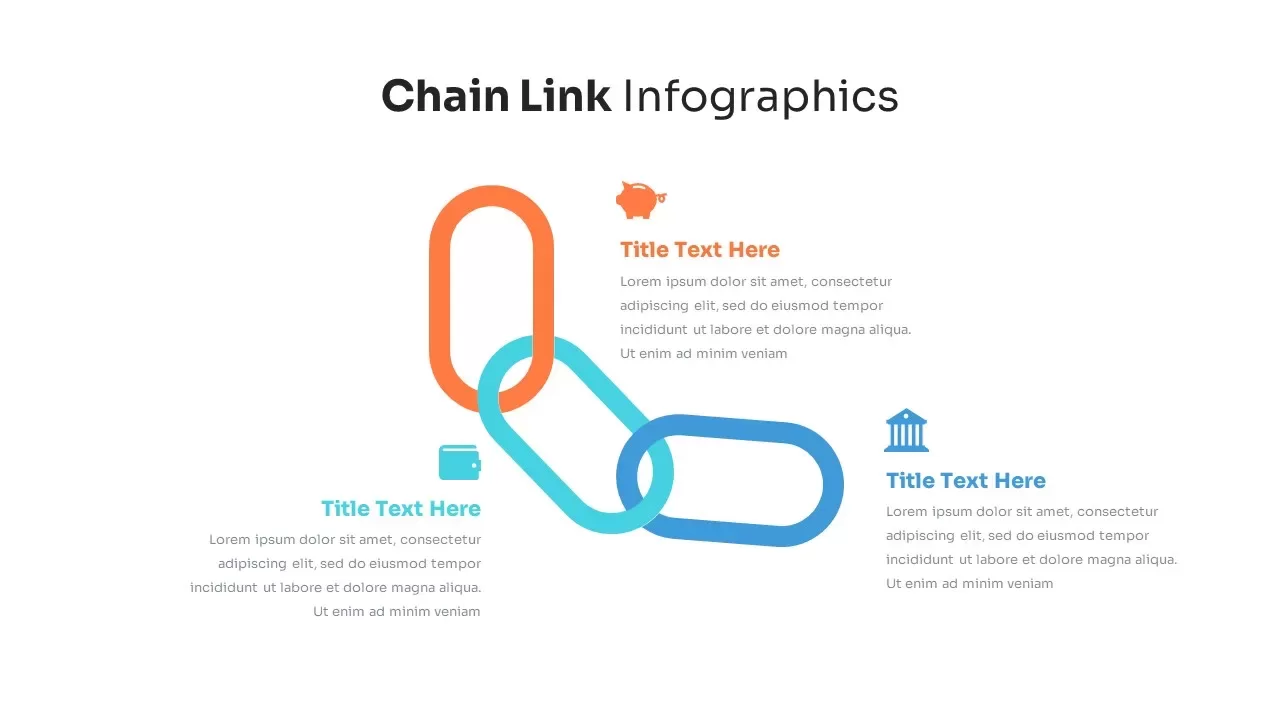
Chain Link Process Infographic Diagram Template for PowerPoint & Google Slides
Process
Chain Link Process Infographic Diagram Template for PowerPoint & Google Slides
Process
Chain Link Process Infographic Diagram Template for PowerPoint & Google Slides
Process
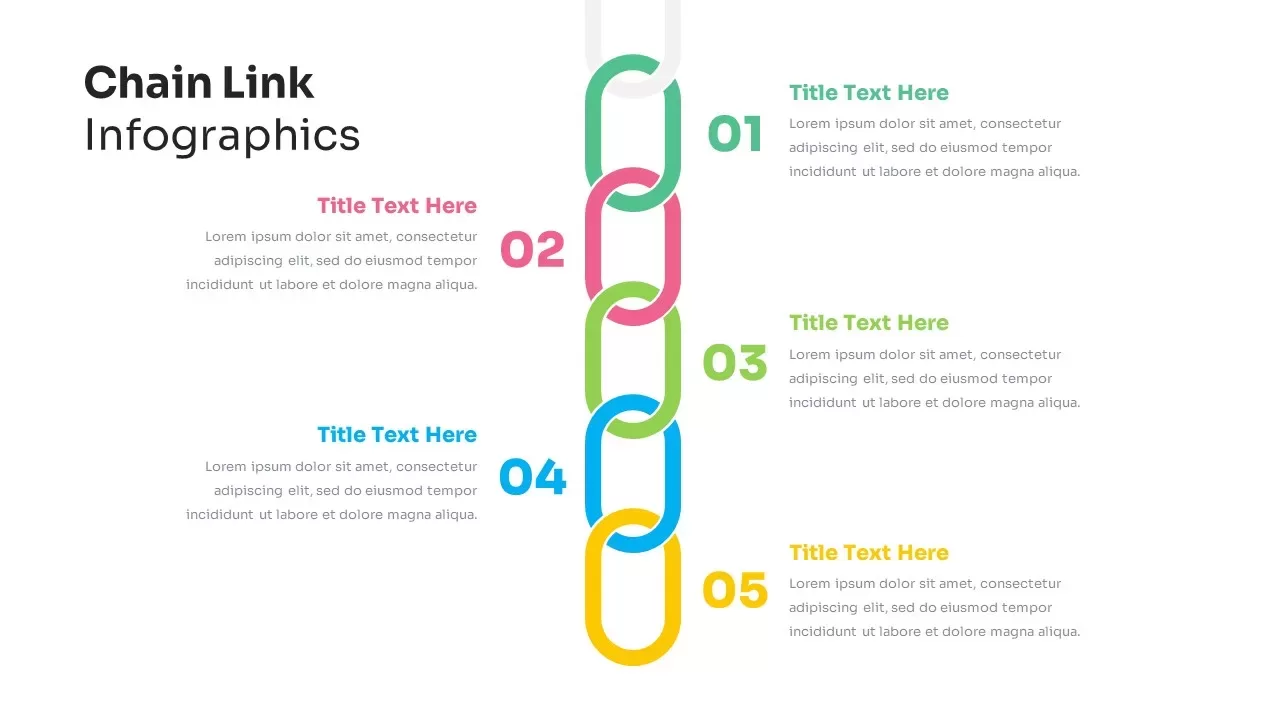
Five-Step Chain Link Process Infographic Template for PowerPoint & Google Slides
Process
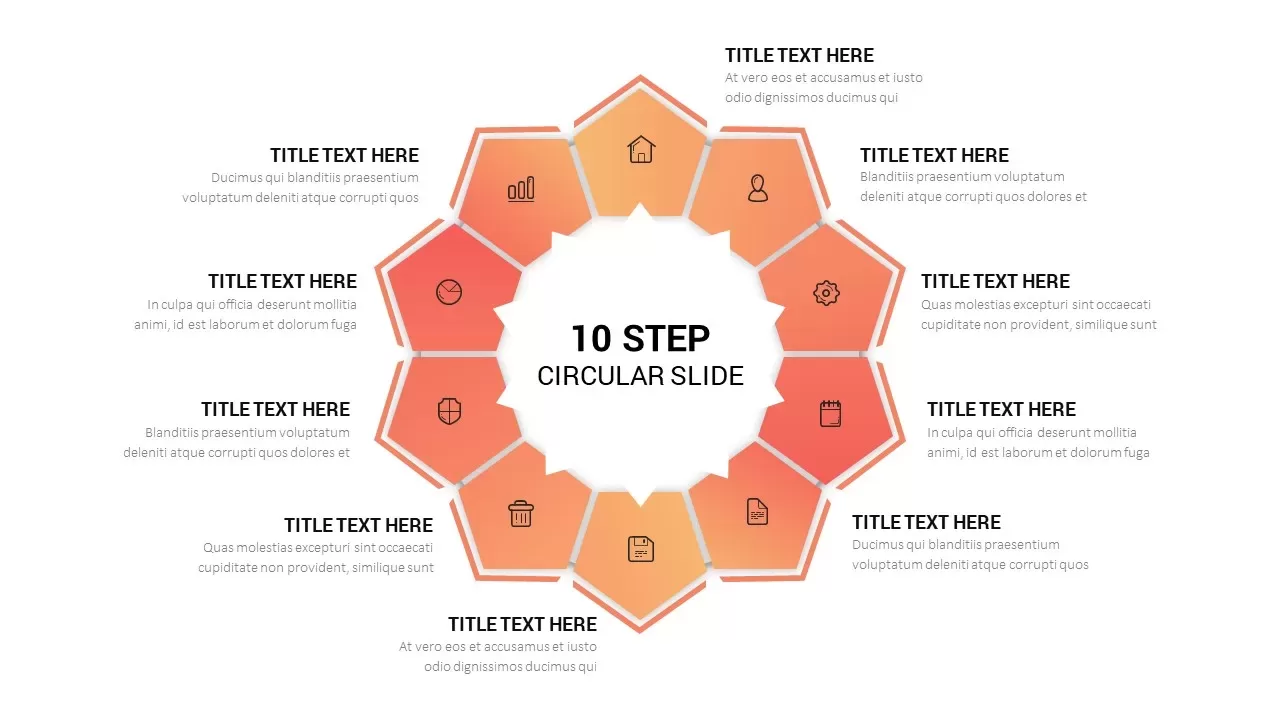
Ten-Step Circular Process Infographic Template for PowerPoint & Google Slides
Circular
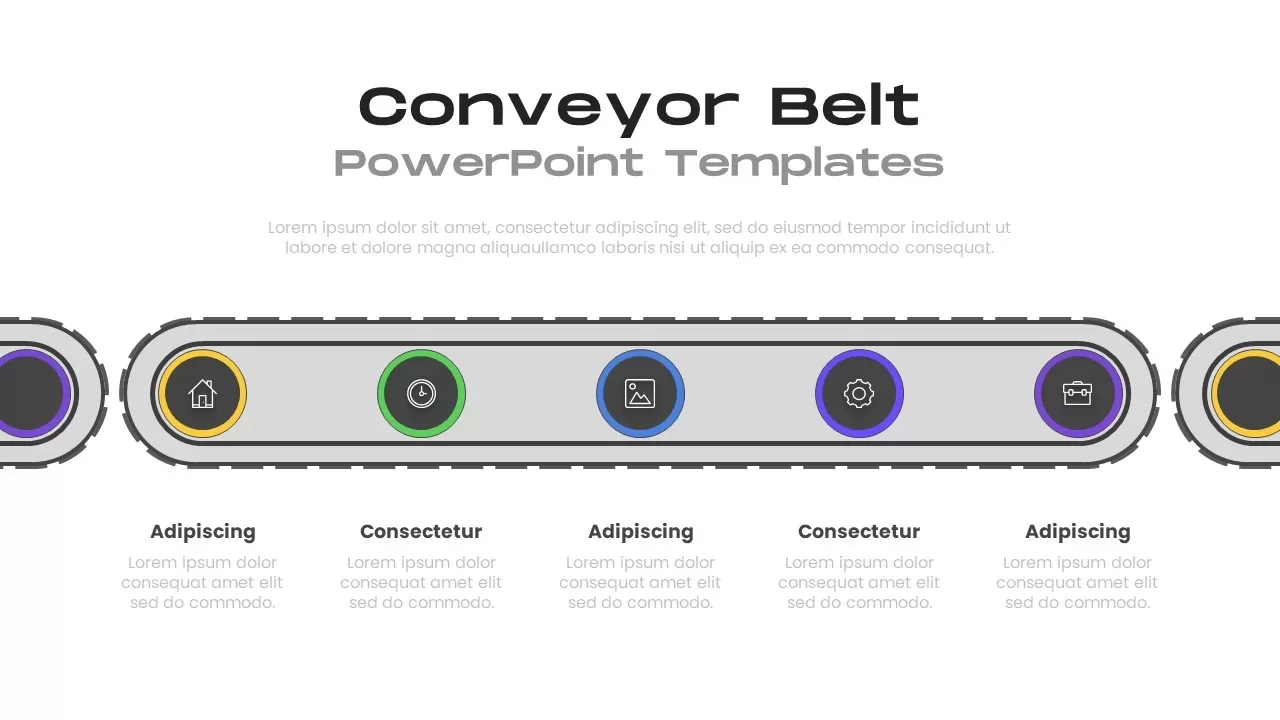
Conveyor Belt Infographic Process Flow Template for PowerPoint & Google Slides
Process
Robotics Process Cycle Infographic Template for PowerPoint & Google Slides
Process
Apple Four-Step Process Infographic Template for PowerPoint & Google Slides
Process
Shooting Target Process Infographic Template for PowerPoint & Google Slides
Process
5S Lean Process Improvement Infographic Template for PowerPoint & Google Slides
Business Strategy
Automation Process Roadmap Infographic Template for PowerPoint & Google Slides
Roadmap
Pesticide Four-Step Process Infographic Template for PowerPoint & Google Slides
Process
CPR Training Process Infographic Template for PowerPoint & Google Slides
Process
Employee Promotion Process Infographic Template for PowerPoint & Google Slides
Employee Performance
Customer Journey Process Map Infographic Template for PowerPoint & Google Slides
Customer Journey
Mortgage Process Infographic Template for PowerPoint & Google Slides
Finance
CMMI Process Maturity Model Infographic Template for PowerPoint & Google Slides
Process
Process Gears Infographic for PowerPoint & Google Slides
Process
Chain Process Infographic for PowerPoint & Google Slides
Process
Modern Wave Infographic Process for PowerPoint & Google Slides
Infographics
Training Need Analysis Process infographic for PowerPoint & Google Slides
Employee Performance
Robotics Process Overview Infographic for PowerPoint & Google Slides
AI
4 Step Process PowerPoint & Google Slides Template for PowerPoint & Google Slides
Process
Google Ads Optimization & Performance Infographic Template for PowerPoint & Google Slides
Digital Marketing
SQ3R Study Strategy Infographic Slides Template for PowerPoint & Google Slides
Business Strategy
Six Double Diamond Infographic Slides Template for PowerPoint & Google Slides
Process
Casino/Poker Chips Infographic Slides template for PowerPoint & Google Slides
Business Strategy
Agenda Infographic Pack of 2 Slides Template for PowerPoint & Google Slides
Agenda
Quad Chart Infographic Pack of 8 Slides Template for PowerPoint & Google Slides
Comparison Chart
Four Options Infographic Slides Template for PowerPoint & Google Slides
Comparison
Game Plan Infographic Slides Pack Template for PowerPoint & Google Slides
Infographics
Teamwork PowerPoint Infographic Template for PowerPoint & Google Slides
Leadership
Kite Infographic PowerPoint Template for PowerPoint & Google Slides
Process
Cladogram Infographic Di Template for PowerPoint & Google Slides Template
Decision Tree
Free Infographic Deck PowerPoint Pack for PowerPoint & Google Slides
Infographics
Free
Curved Road Map Timeline Infographic Template for PowerPoint & Google Slides
Roadmap
Dual-Side Three-Step Ribbon Infographic Template for PowerPoint & Google Slides
Comparison
Free Application Mockup Screens Infographic Template for PowerPoint & Google Slides
Comparison
Free
Social Media Mind Network Infographic Template for PowerPoint & Google Slides
Digital Marketing
Team Achievements Infographic Slide Template for PowerPoint & Google Slides
Accomplishment
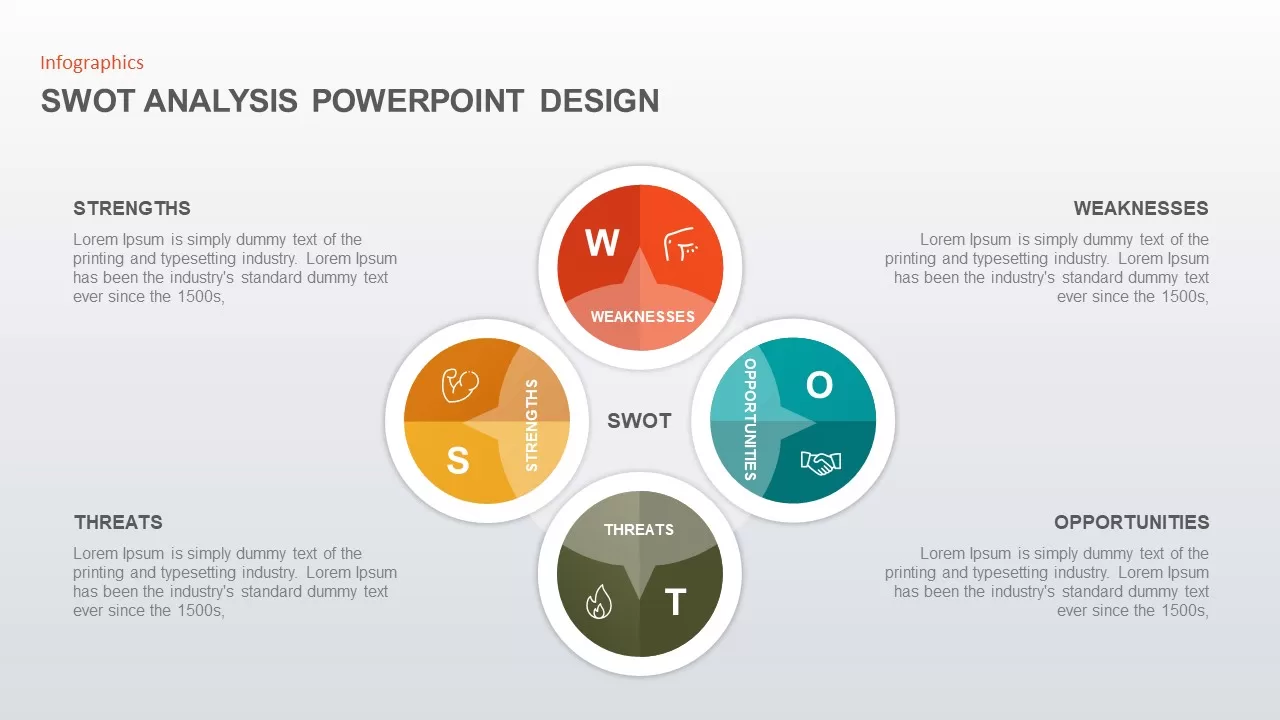
SWOT Analysis Circular Infographic Template for PowerPoint & Google Slides
SWOT
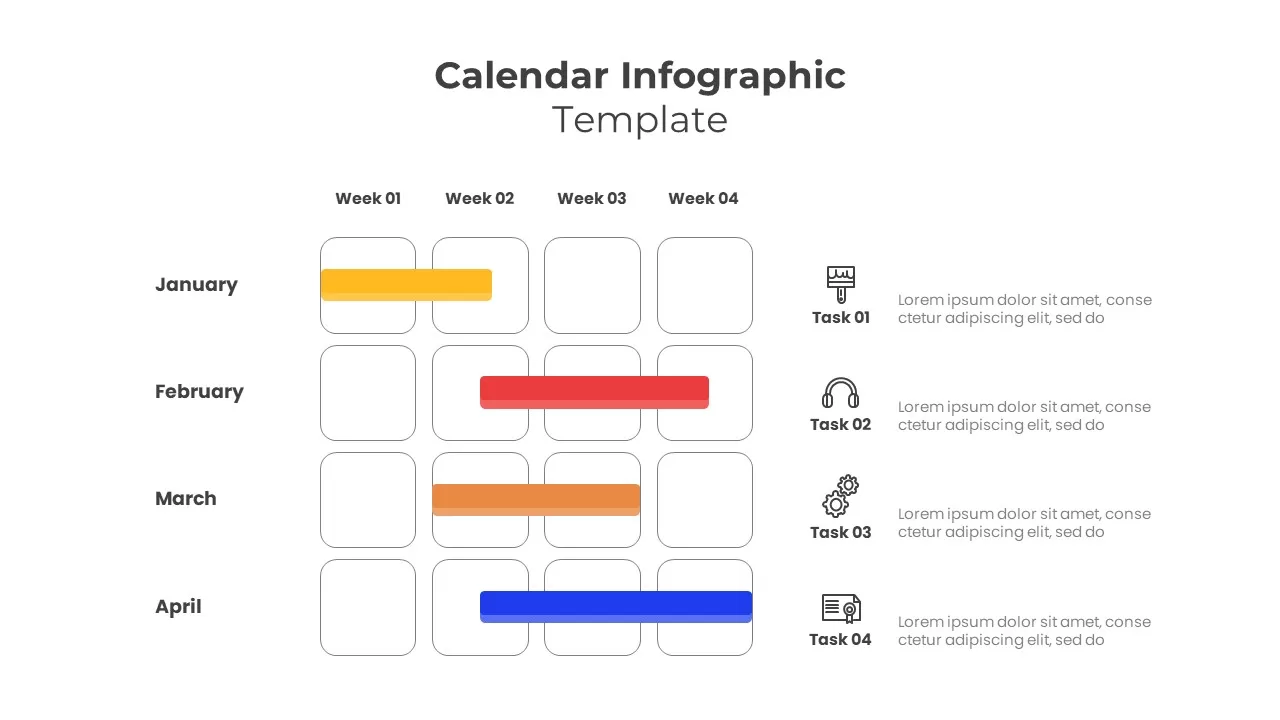
Task Scheduling Calendar Infographic Template for PowerPoint & Google Slides
Agenda
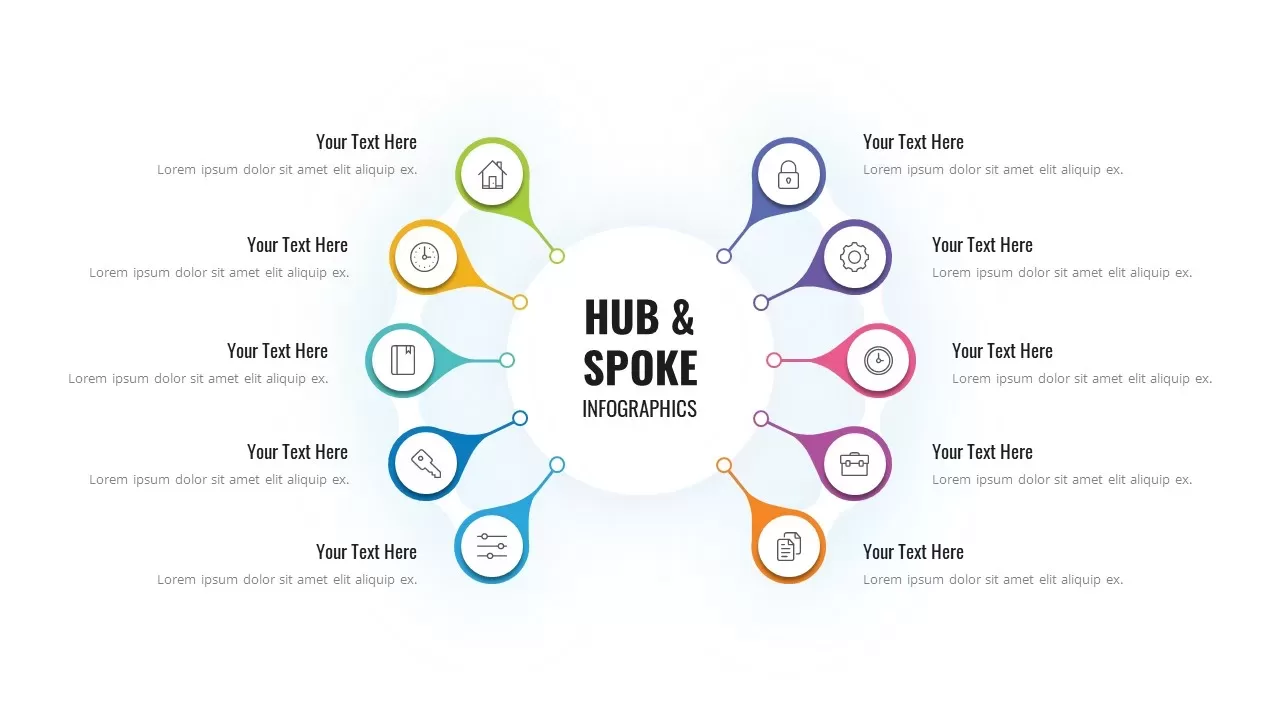
Colorful Hub-and-Spoke Infographic Template for PowerPoint & Google Slides
Circular
VUCA vs BANI Comparison Infographic Template for PowerPoint & Google Slides
Comparison