Sustainable Business Model Circular Infographic Template for PowerPoint & Google Slides

Description
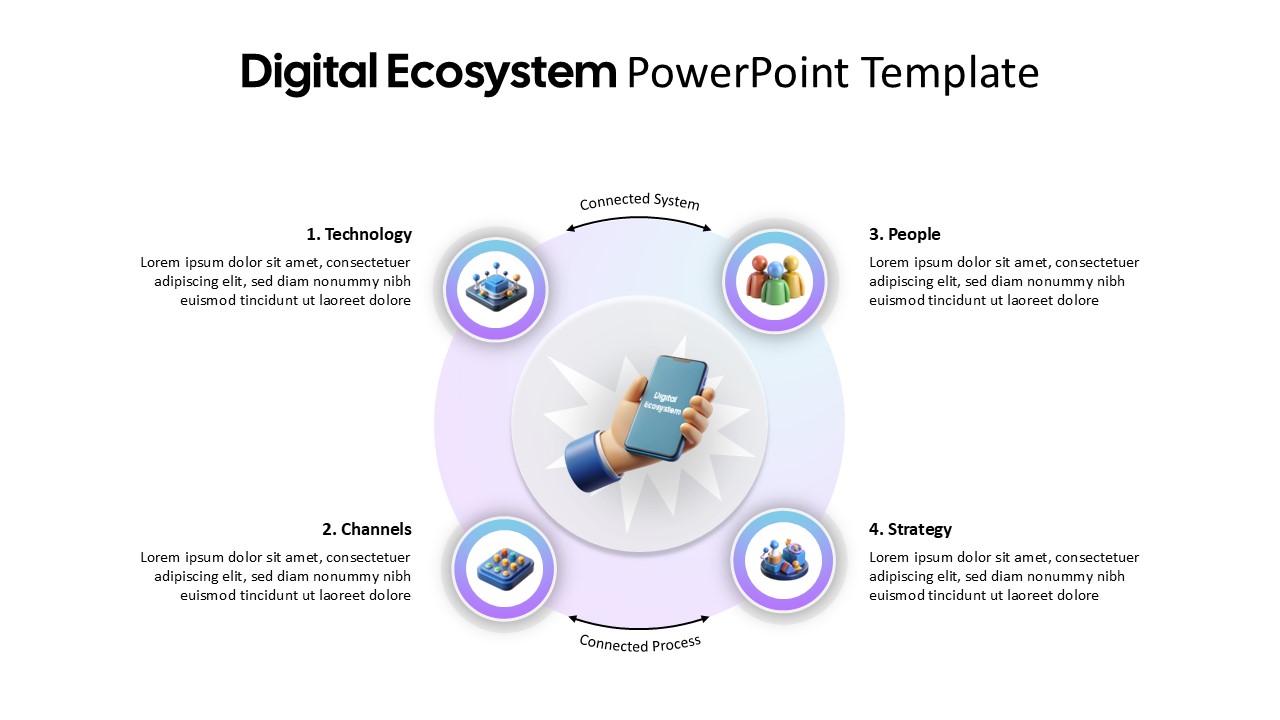
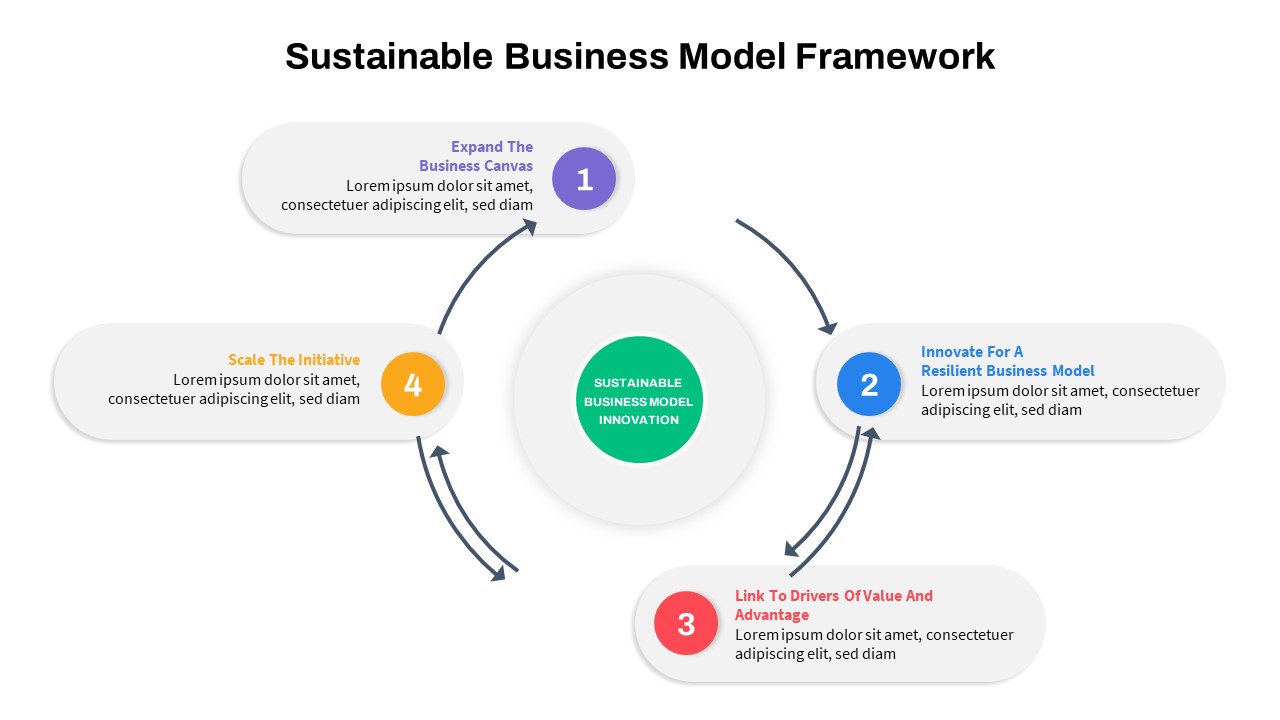
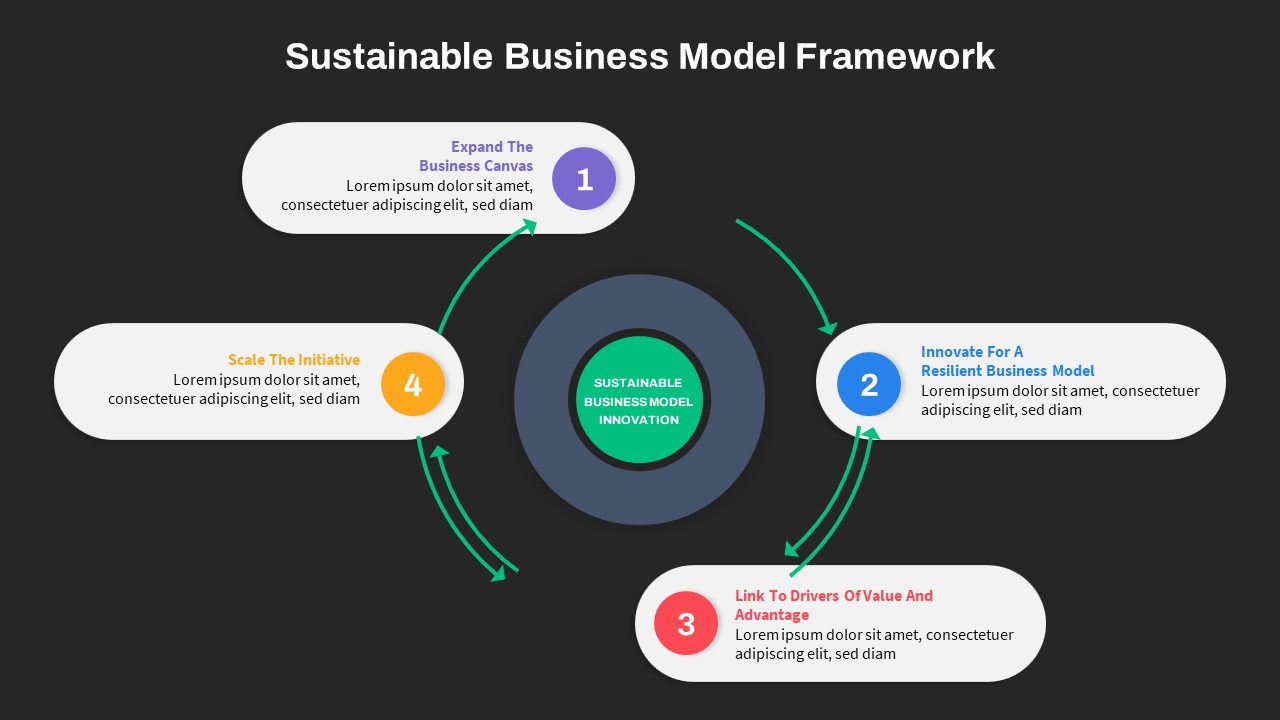
Highlight sustainable business innovation strategies with this engaging circular infographic template for PowerPoint and Google Slides. The slide presents a central focus area labeled “Sustainable Business Model Innovation,” connected to four key strategic steps: expanding the business canvas, innovating for resilience, linking to value drivers, and scaling initiatives. Each of these steps is distinctly numbered and color-coded for clarity—purple, blue, red, and yellow—to allow easy differentiation and retention by the audience. The layout features neatly arranged, rounded rectangles, complemented by directional arrows that visually represent the cyclical and interconnected nature of sustainability efforts.
With its balanced and straightforward design, this infographic simplifies complex information into digestible insights, ensuring clear communication during presentations. The minimalist style supports seamless customization, making it easy to adapt to corporate branding guidelines, project specifics, or strategic details.
Who is it for
Ideal for sustainability consultants, corporate strategists, business analysts, and environmental managers looking to communicate complex sustainable business models clearly and effectively. Startup founders, educators, and policy-makers can also use this template for educational purposes or strategic discussions.
Other Uses
This versatile slide can also illustrate other circular processes such as continuous improvement models, innovation loops, project management cycles, or strategic frameworks. Utilize it for internal training sessions, workshops, educational seminars, or boardroom presentations emphasizing cyclical strategies.
Login to download this file

Item ID
SB03903
Related Templates

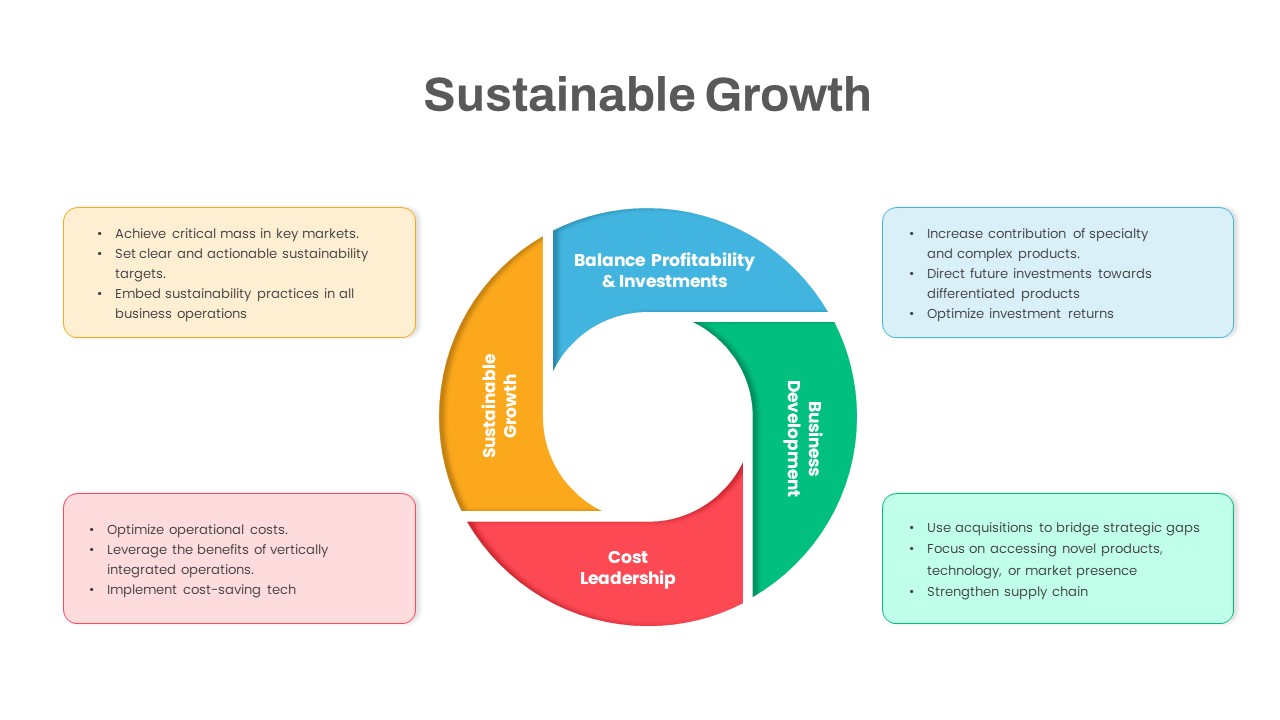
Sustainable Growth Circular Diagram Template for PowerPoint & Google Slides
Circular
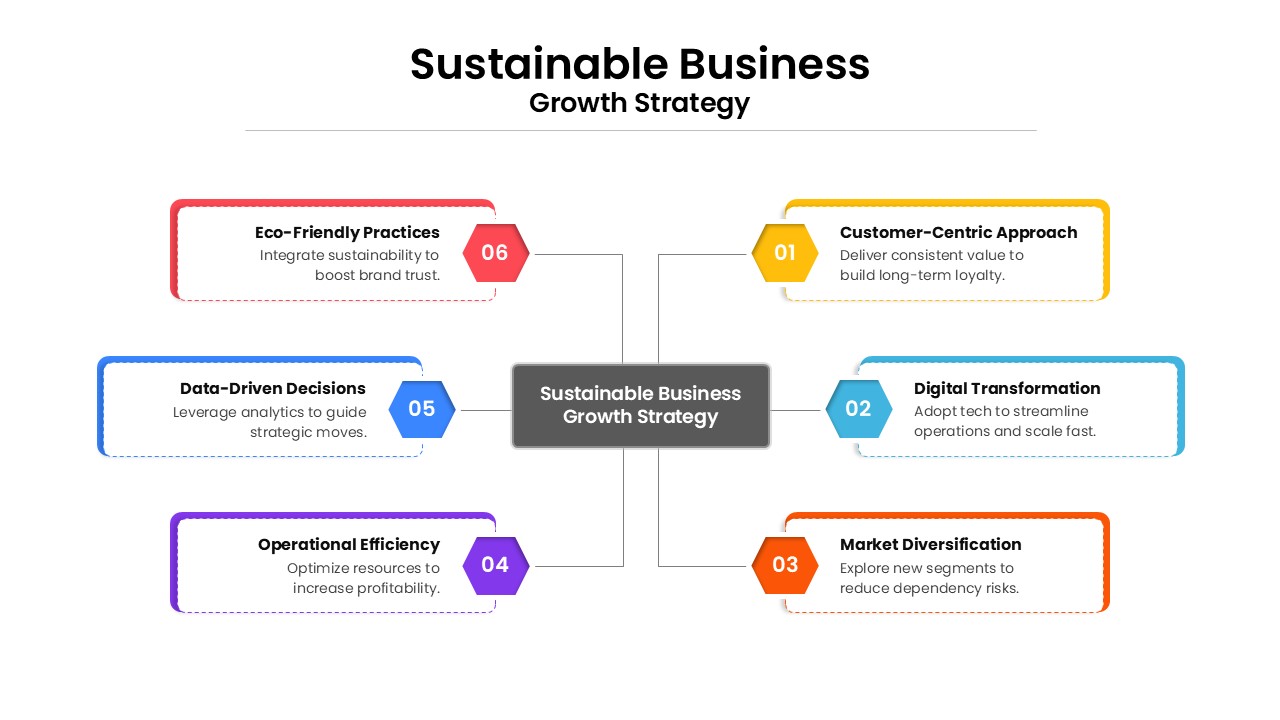
Sustainable Business Growth Strategy Template for PowerPoint & Google Slides
Process
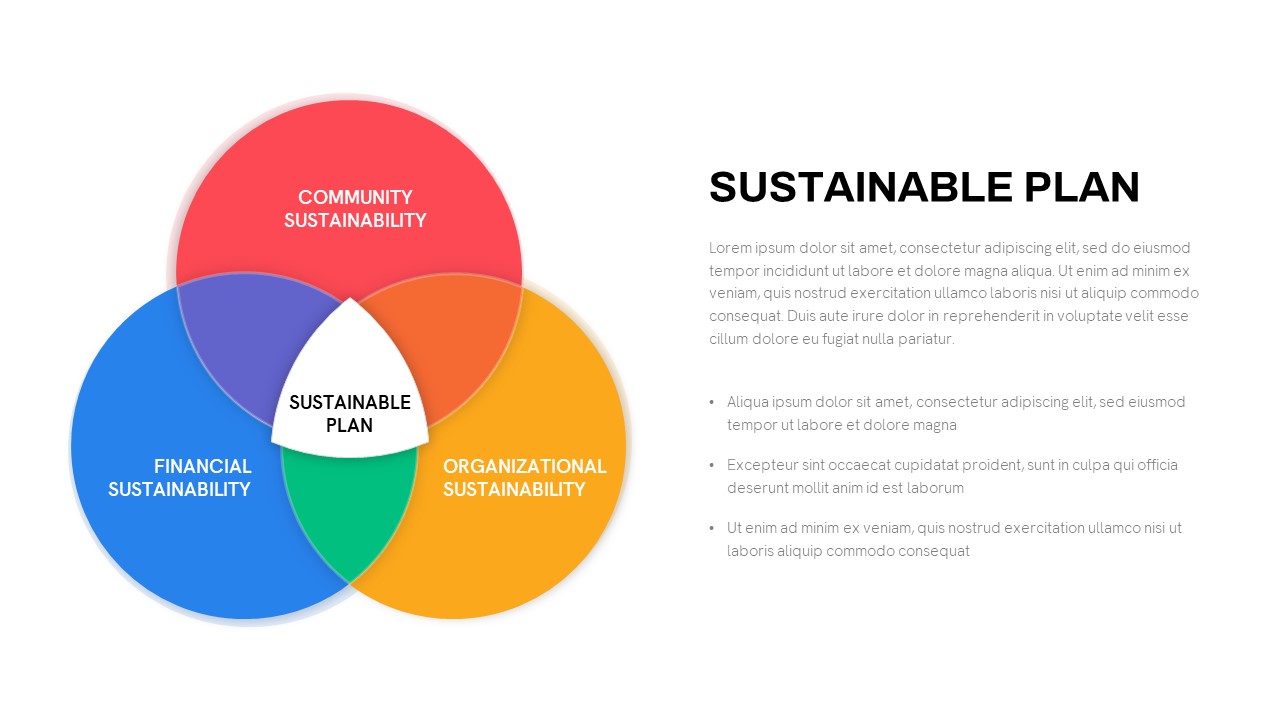
Sustainable Plan Strategy Framework Template for PowerPoint & Google Slides
Business
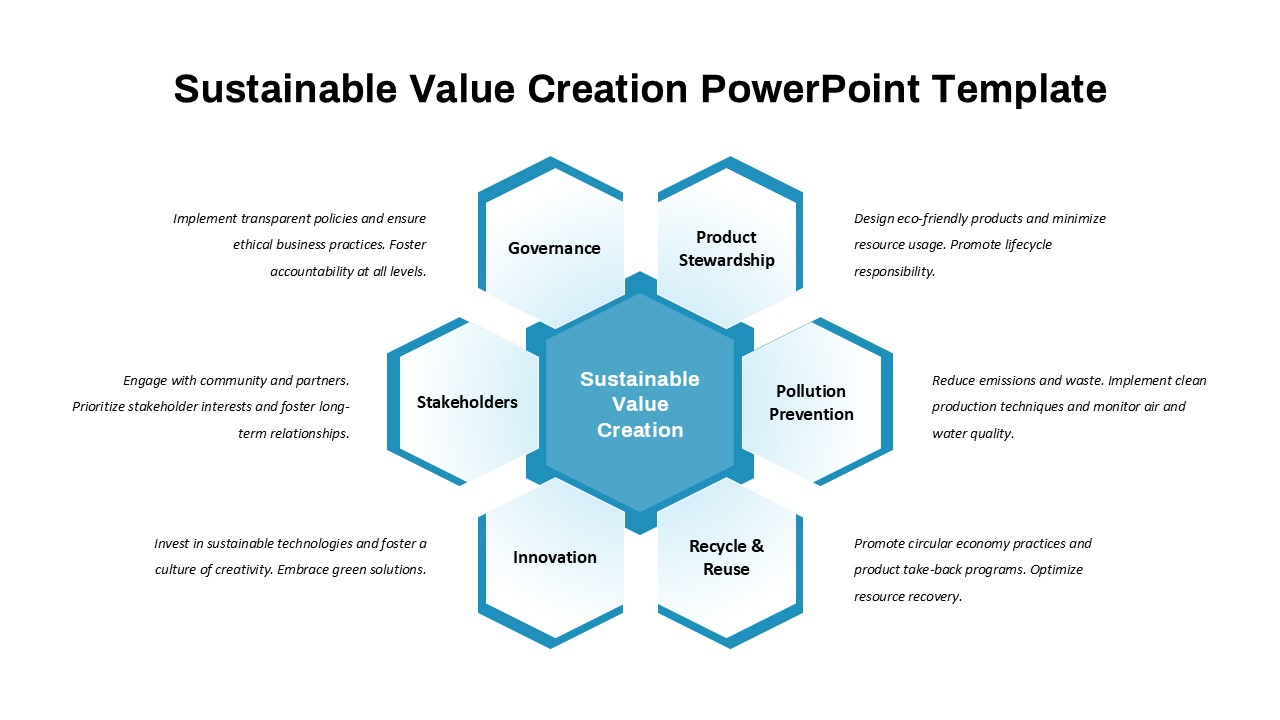
Sustainable Value Creation Framework Template for PowerPoint & Google Slides
Process
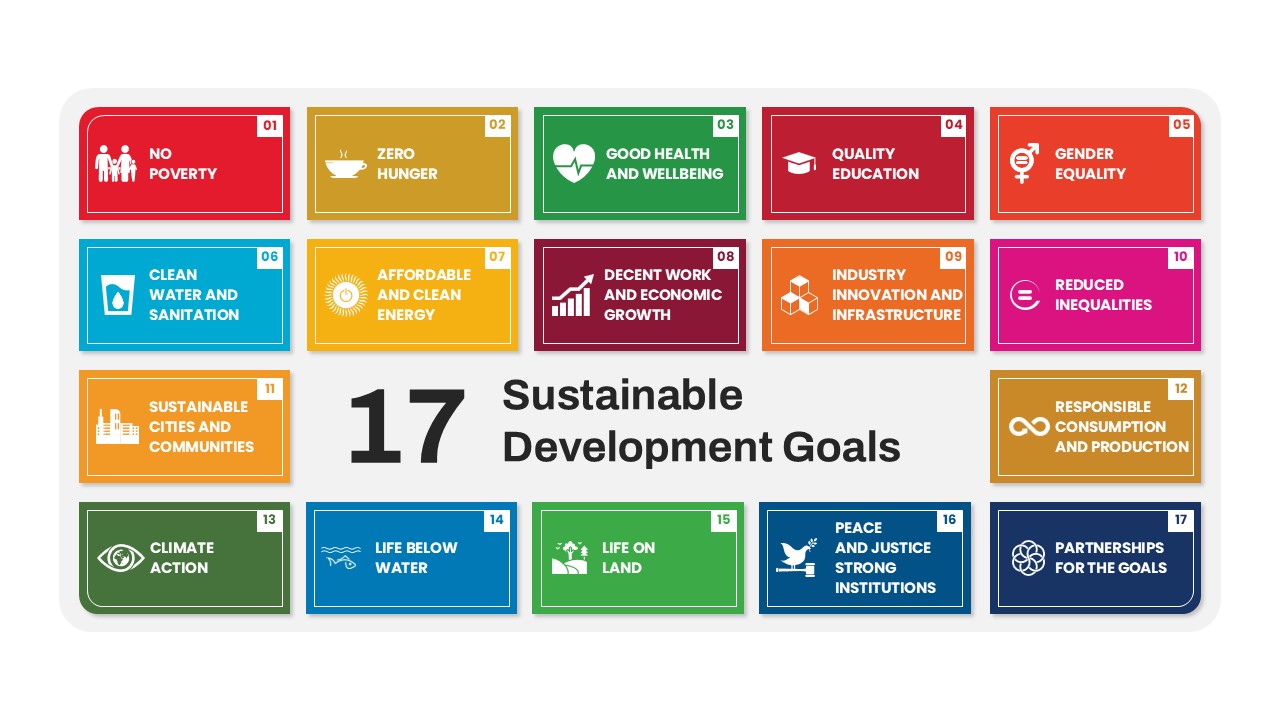
17 Sustainable Development Goals List Template for PowerPoint & Google Slides
Goals
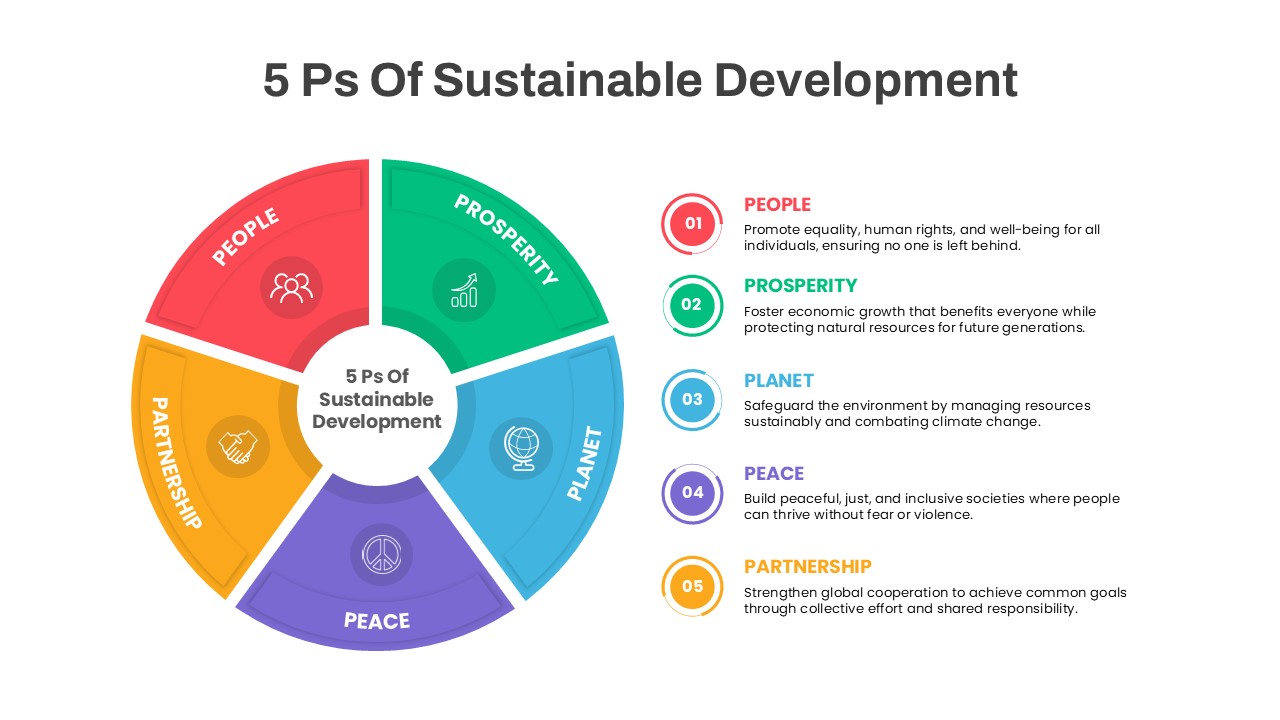
5 Ps Sustainable Development Diagram Template for PowerPoint & Google Slides
Circular
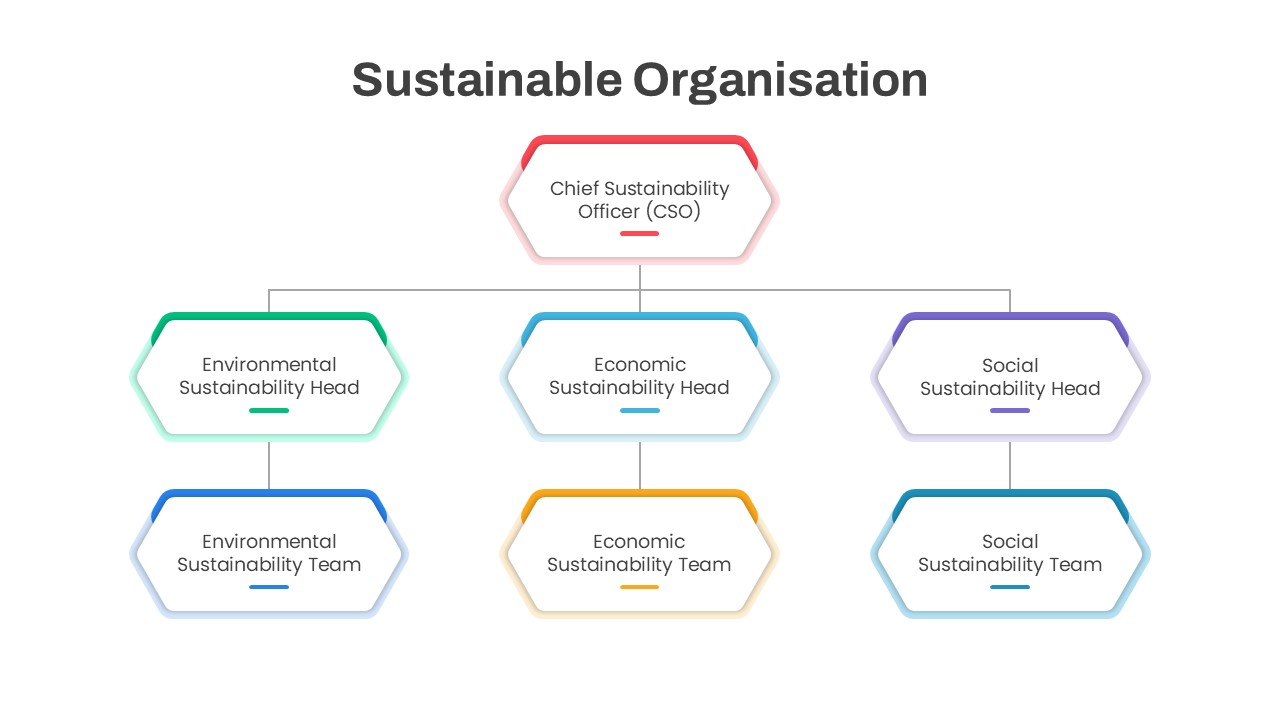
Sustainable Organisation Structure template for PowerPoint & Google Slides
Business
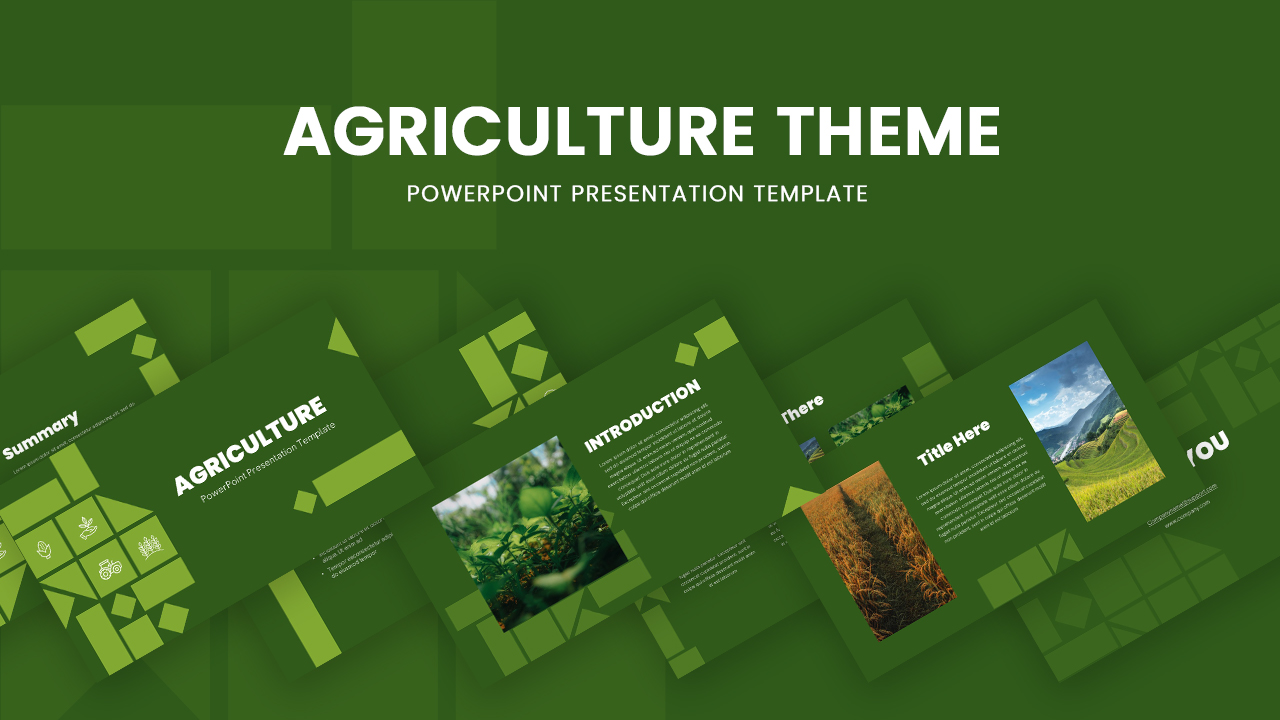
Sustainable Agriculture Theme Deck for PowerPoint & Google Slides
Business Proposal
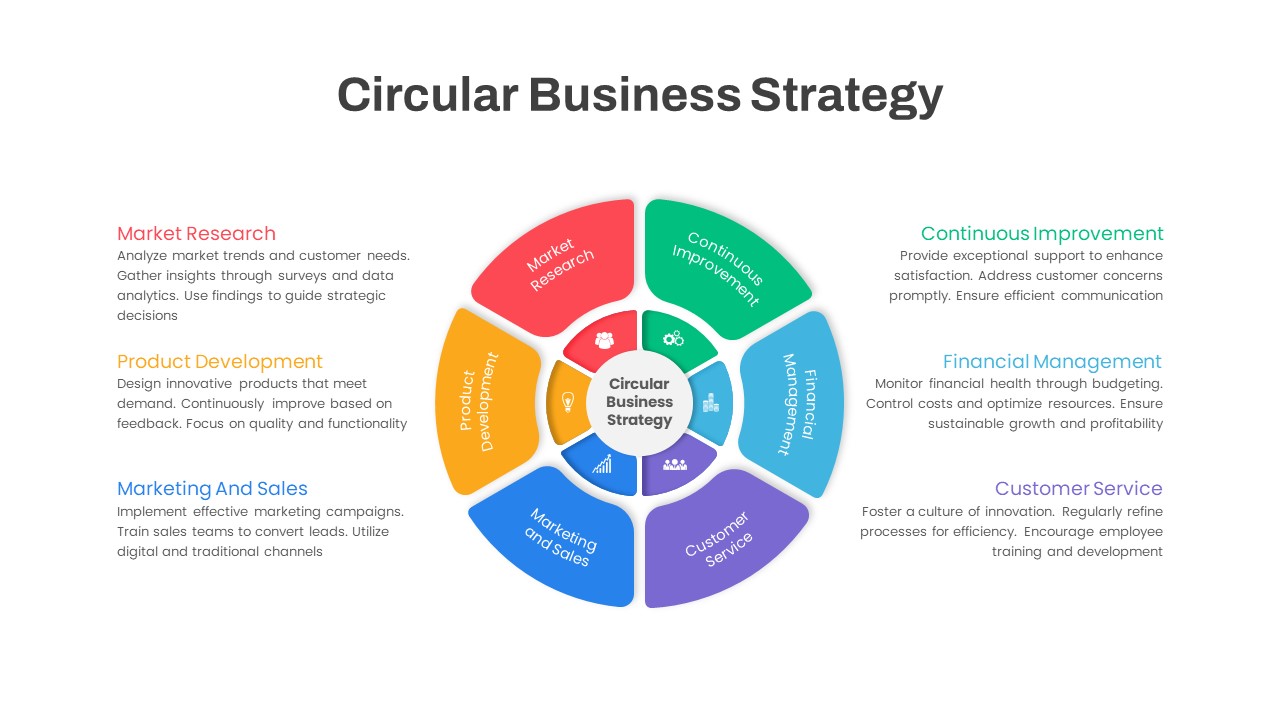
Circular Business Strategy Infographic Template for PowerPoint & Google Slides
Circular

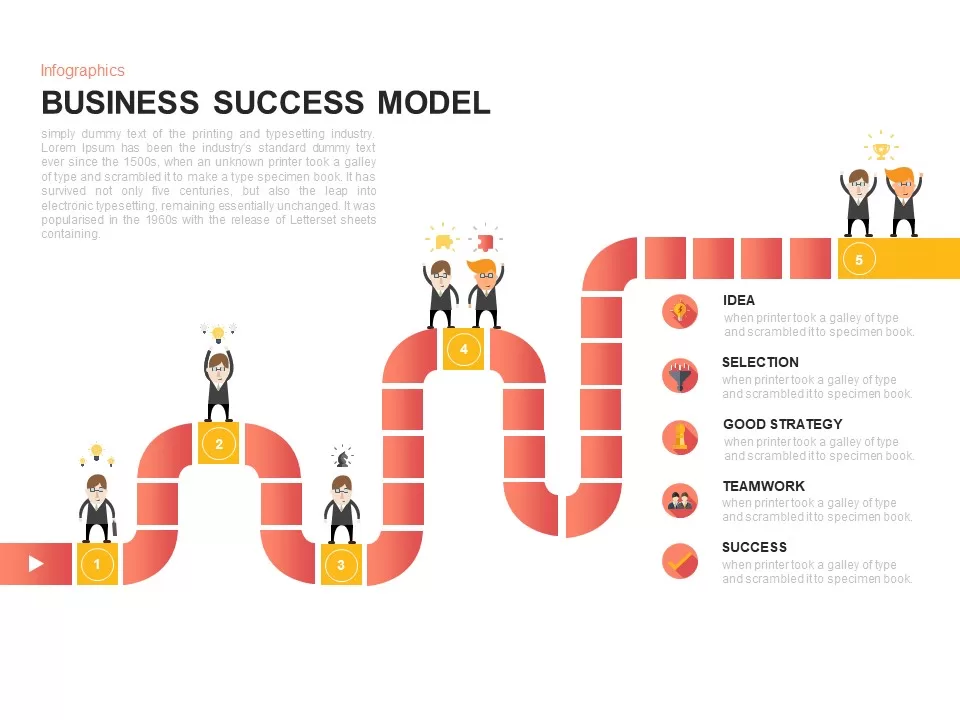
Business Success Model Infographic Template for PowerPoint & Google Slides
Roadmap
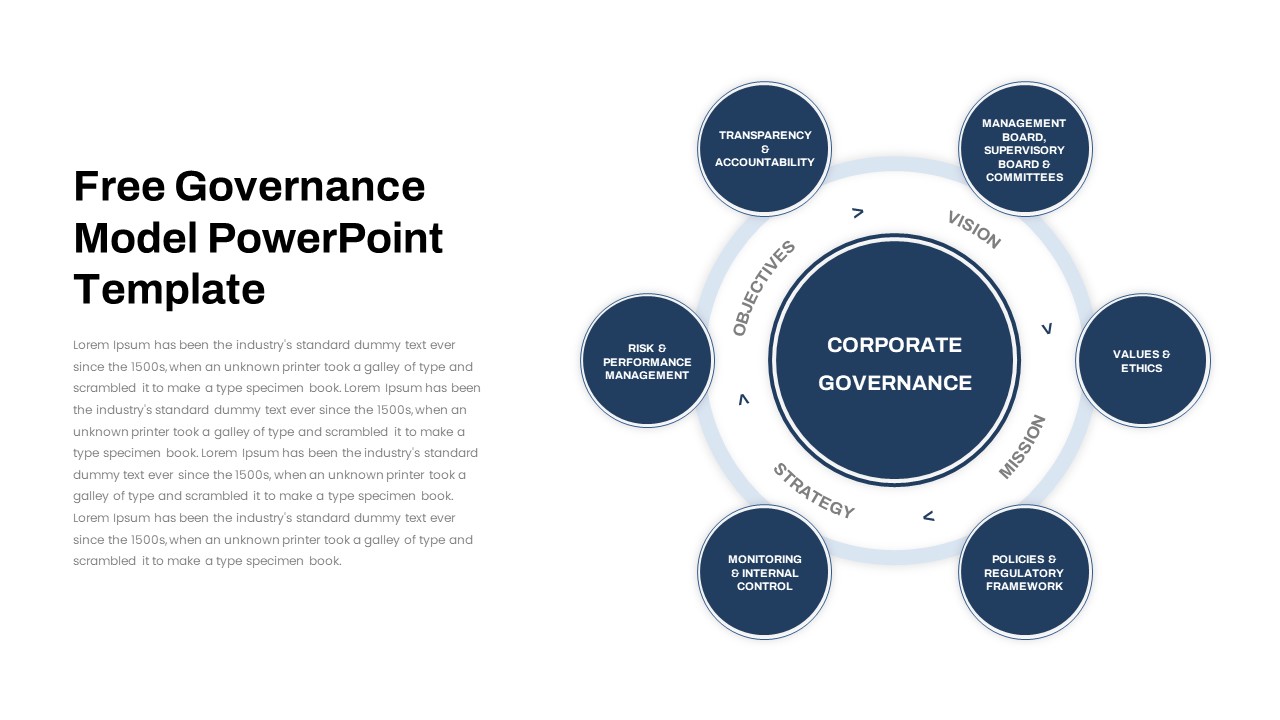
Free Corporate Governance Circular Model Template for PowerPoint & Google Slides
Circular
Free
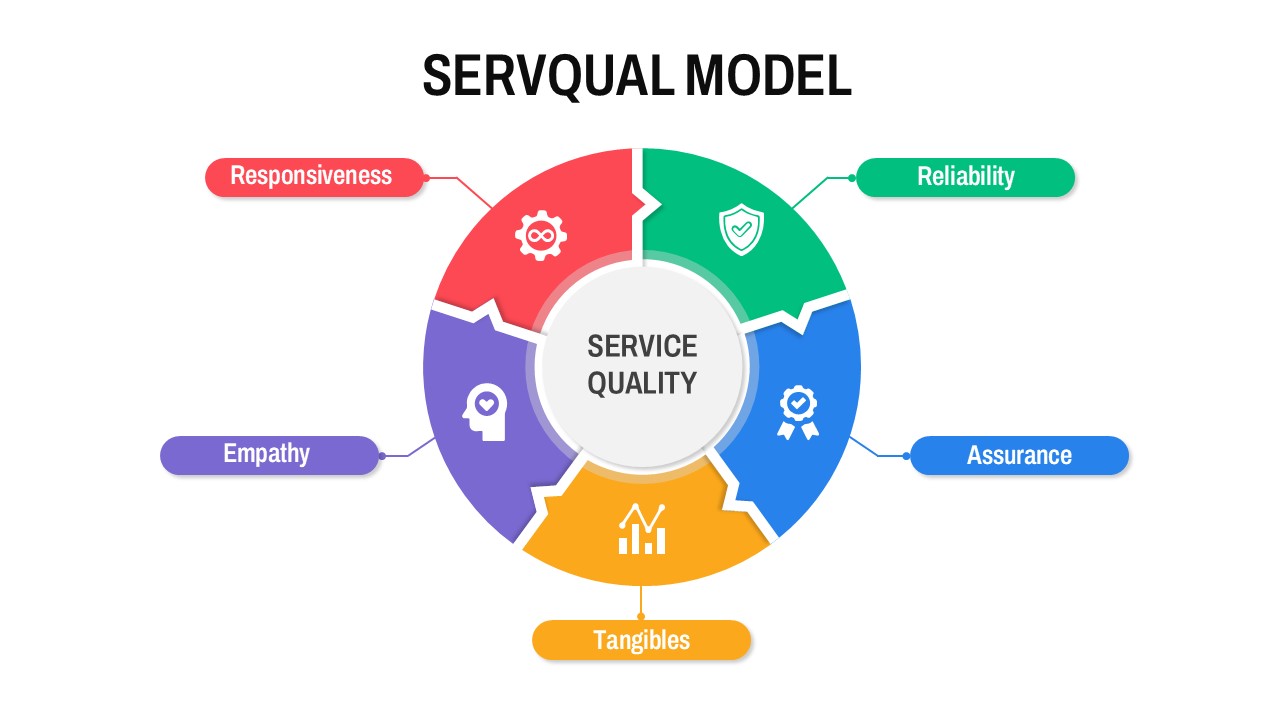
Circular SERVQUAL Model Diagram Template for PowerPoint & Google Slides
Business Strategy
Digital Ecosystem Circular Model Template for PowerPoint & Google Slides
Information Technology
Six Section Circular Infographic Diagram Template for PowerPoint & Google Slides
Circular
Eight-Stage Circular Process Infographic Template for PowerPoint & Google Slides
Circular
Seven-Stage Circular Infographic Template for PowerPoint & Google Slides
Circular
Six-Segment Circular Hub Infographic Template for PowerPoint & Google Slides
Circular
Eight-Step Circular Diagram Infographic Template for PowerPoint & Google Slides
Circular
Five-Stage Circular Infographic Diagram Template for PowerPoint & Google Slides
Process
Four-Stage Circular Diagram Infographic Template for PowerPoint & Google Slides
Circular
5 Stage Circular Timeline Infographic Template for PowerPoint & Google Slides
Timeline
4 Factors Circular Diagram Infographic Template for PowerPoint & Google Slides
Circular
Circular CRM Process Diagram Infographic Template for PowerPoint & Google Slides
Circular
Circular Three-Step Infographic Diagram Template for PowerPoint & Google Slides
Circular
Circular Market Drivers Infographic Template for PowerPoint & Google Slides
Circular
4-Step Circular Roadmap Infographic Template for PowerPoint & Google Slides
Roadmap
Circular Core Values Infographic List Template for PowerPoint & Google Slides
Circular
6-Step Circular Diagram Infographic Template for PowerPoint & Google Slides
Circular
8-Step Circular Gear Infographic Diagram Template for PowerPoint & Google Slides
Circular
6-Part Circular Gear Infographic Diagram Template for PowerPoint & Google Slides
Process

Circular CRM Process Infographic Diagram Template for PowerPoint & Google Slides
Circular
4-Step Circular Infographic Diagram Template for PowerPoint & Google Slides
Circular
SWOT Analysis Circular Infographic Template for PowerPoint & Google Slides
SWOT
3 & 4 Step Circular Process Infographic Template for PowerPoint & Google Slides
Process
Modern Circular OODA Loop Infographic Template for PowerPoint & Google Slides
Circular
Circular Balanced Scorecard Infographic Template for PowerPoint & Google Slides
Business Strategy
Circular Arrows Infographic Template for PowerPoint & Google Slides
Business
Circular SWOT Analysis Infographic Template for PowerPoint & Google Slides
SWOT

Free Five-Step Circular Timeline Infographic Template for PowerPoint & Google Slides
Timeline
Free
Five-Stage Circular Arrow Infographic Template for PowerPoint & Google Slides
Circular
Accomplishment Circular Infographic Template for PowerPoint & Google Slides
Accomplishment
Six-Segment Circular Arrow Infographic Template for PowerPoint & Google Slides
Circular
Healthcare Nursing Circular Infographic Template for PowerPoint & Google Slides
Nursing
Ten Step Circular Process Infographic Template for PowerPoint & Google Slides
Process
Ten-Step Circular Process Infographic Template for PowerPoint & Google Slides
Circular
Dynamic Circular Hub-and-Spoke Infographic Template for PowerPoint & Google Slides
Circular
Circular Sustainability Infographic Template for PowerPoint & Google Slides
Process
Circular Timeline Infographic Template for PowerPoint & Google Slides
Timeline
Circular Financial Ratios Infographic Template for PowerPoint & Google Slides
Finance
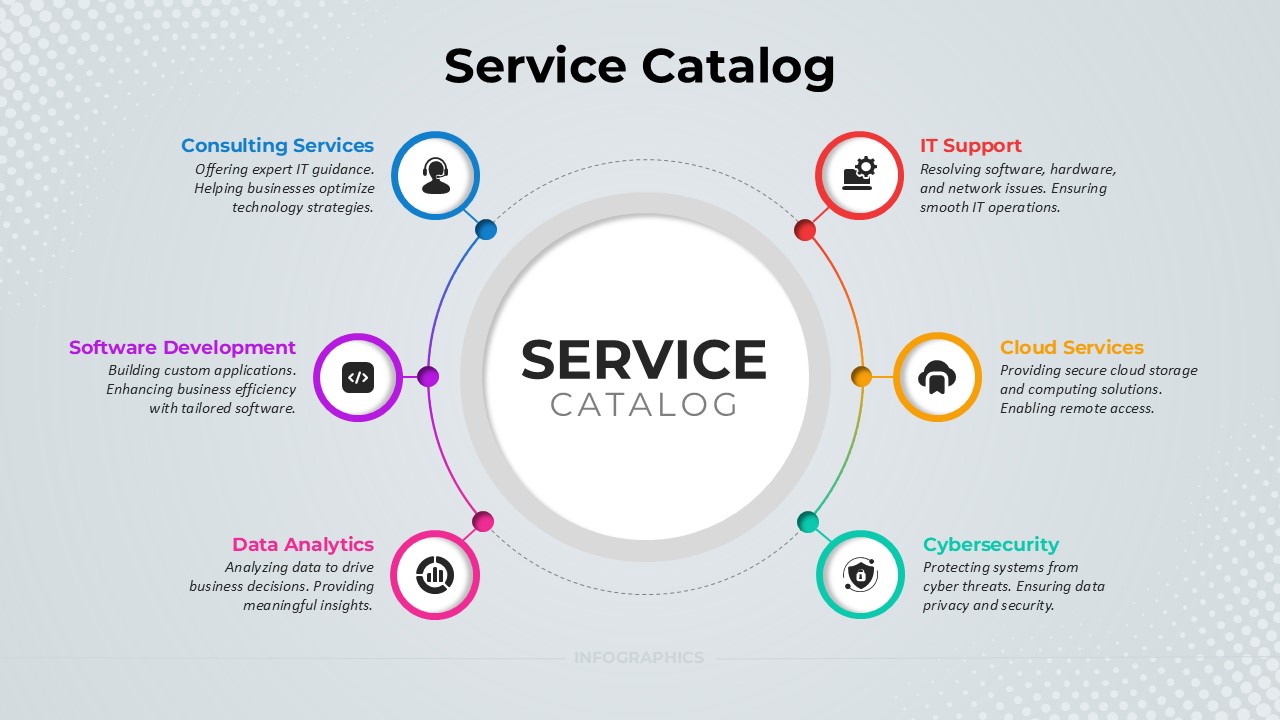
Service Catalog Circular Infographic Template for PowerPoint & Google Slides
Circular
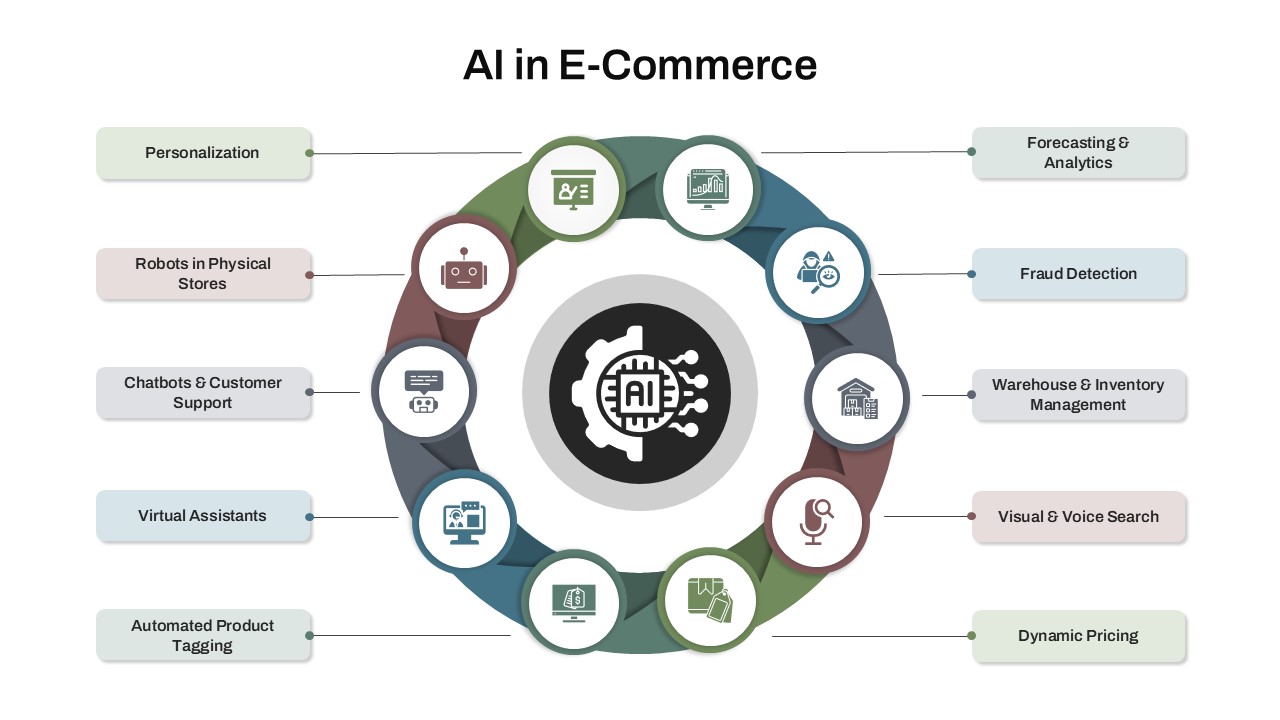
AI in E-Commerce Circular Infographic Template for PowerPoint & Google Slides
AI
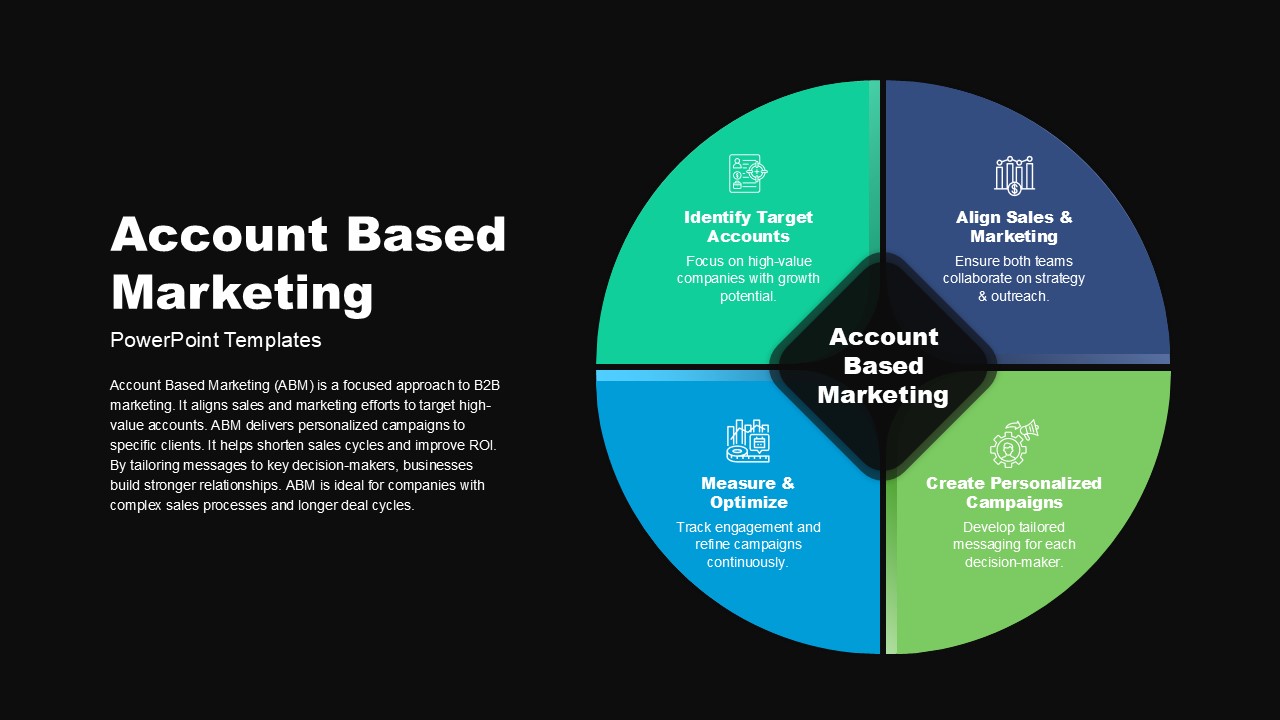
Account Based Marketing Circular Infographic Template for PowerPoint & Google Slides
Marketing
SWOT Analysis Infographic with Circular Icons Template for PowerPoint & Google Slides
SWOT
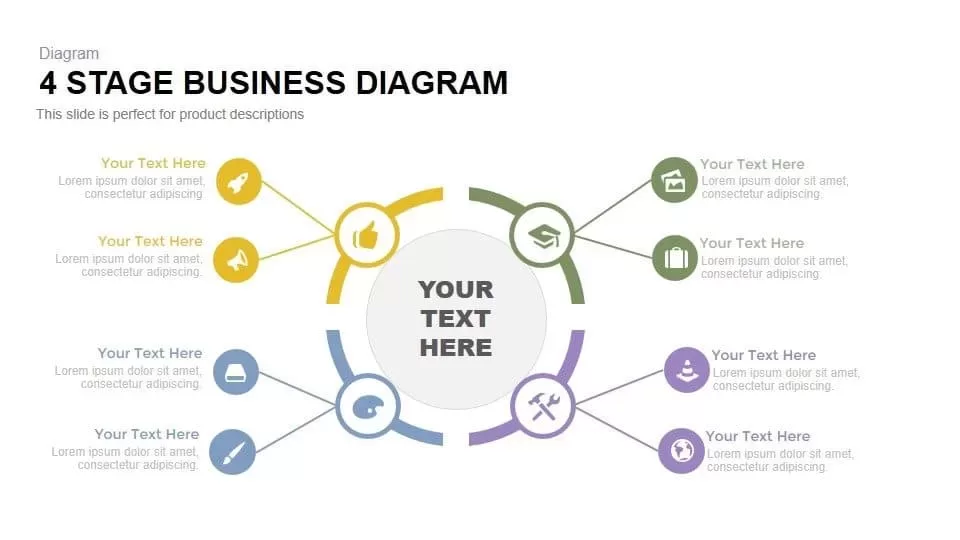
Four-Stage Business Circular Diagram Template for PowerPoint & Google Slides
Process
4 Staged Circular Business Process Diagram template for PowerPoint & Google Slides
Process
Circular Business Ecosystem Diagram Template for PowerPoint & Google Slides
Business Strategy
Linking Business HR Strategy Circular Diagram Template for PowerPoint & Google Slides
Business Strategy
Circular Business Development Process Template for PowerPoint & Google Slides
Process
4 Staged Circular Business Process Diagram for PowerPoint & Google Slides
Process
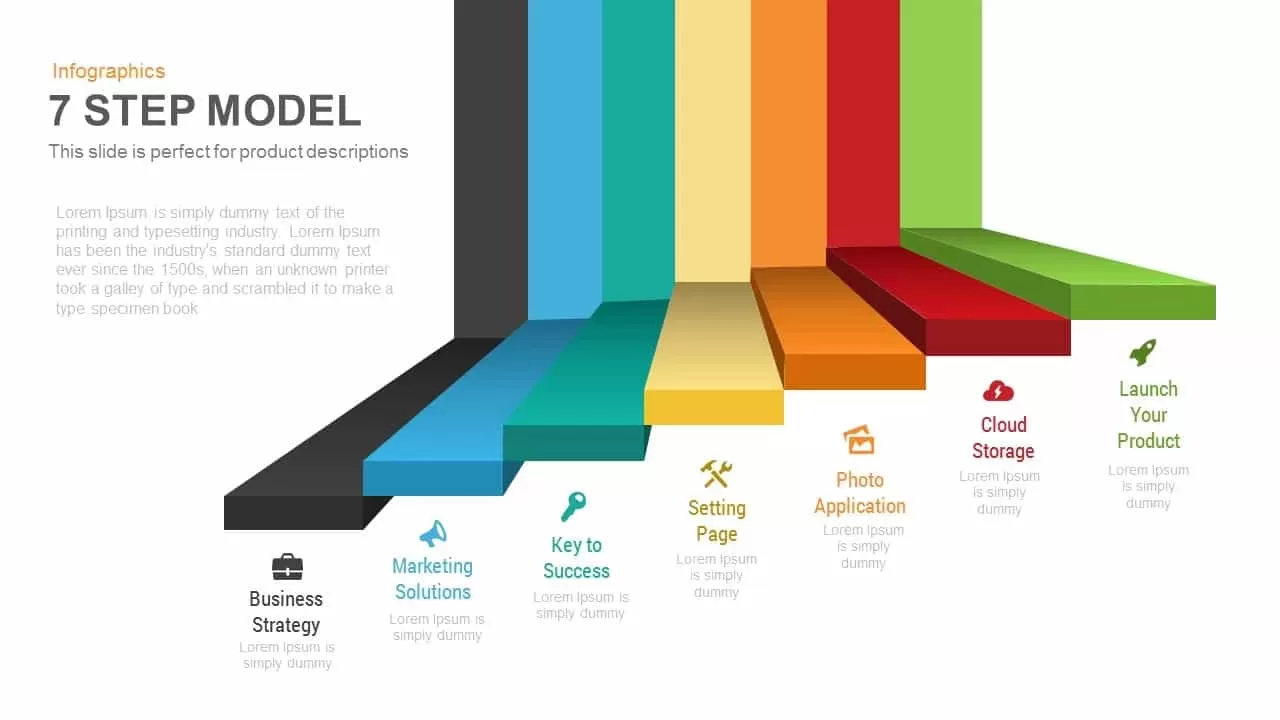
7-Step 3D Process Infographic Model template for PowerPoint & Google Slides
Process
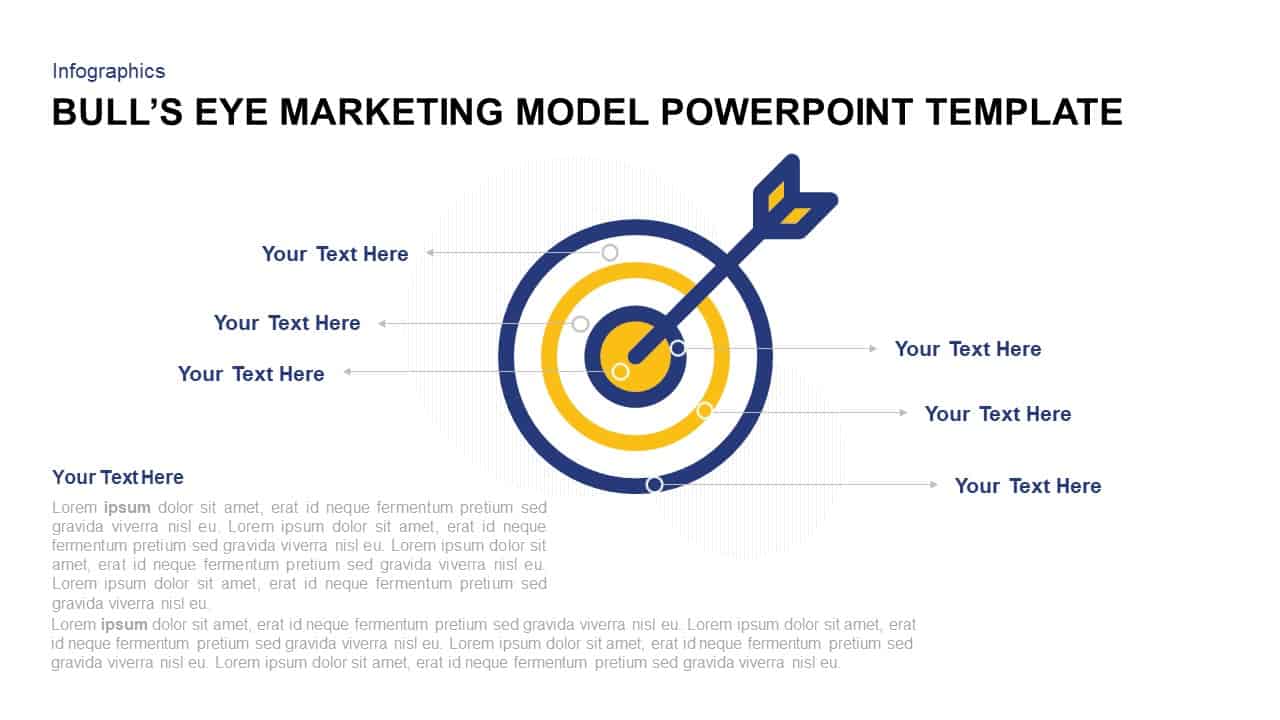
Bull’s Eye Marketing Model Infographic Template for PowerPoint & Google Slides
Circular
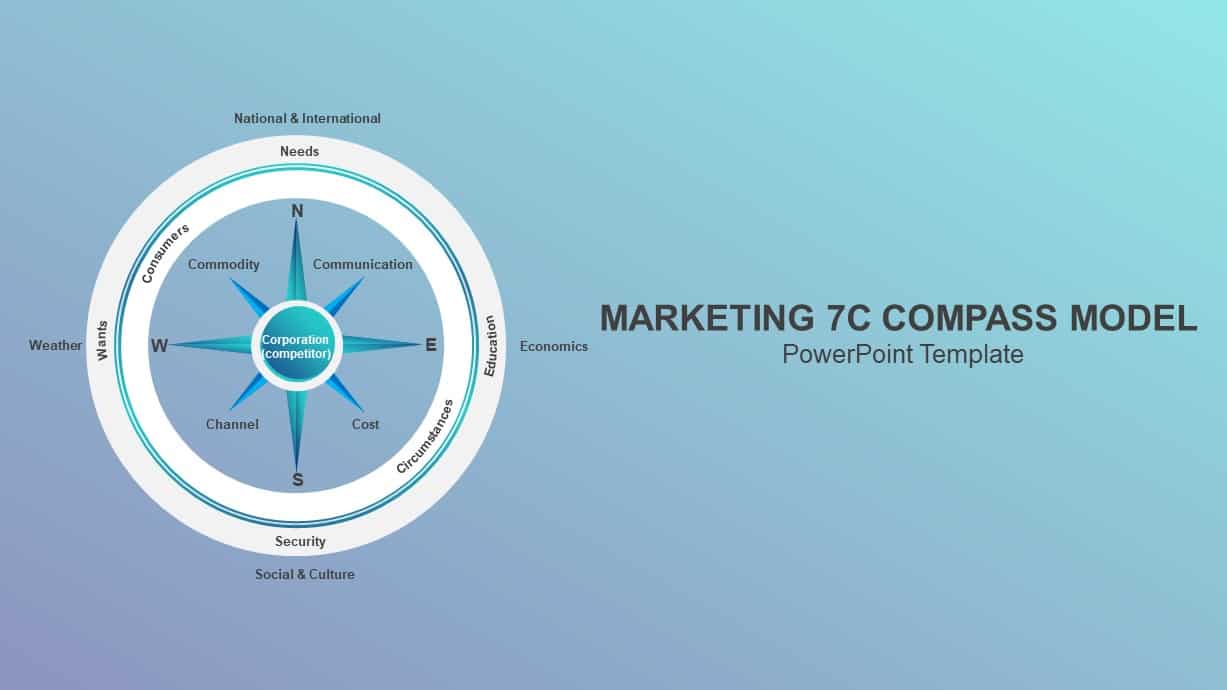
Marketing 7C Compass Model Infographic Template for PowerPoint & Google Slides
Circular
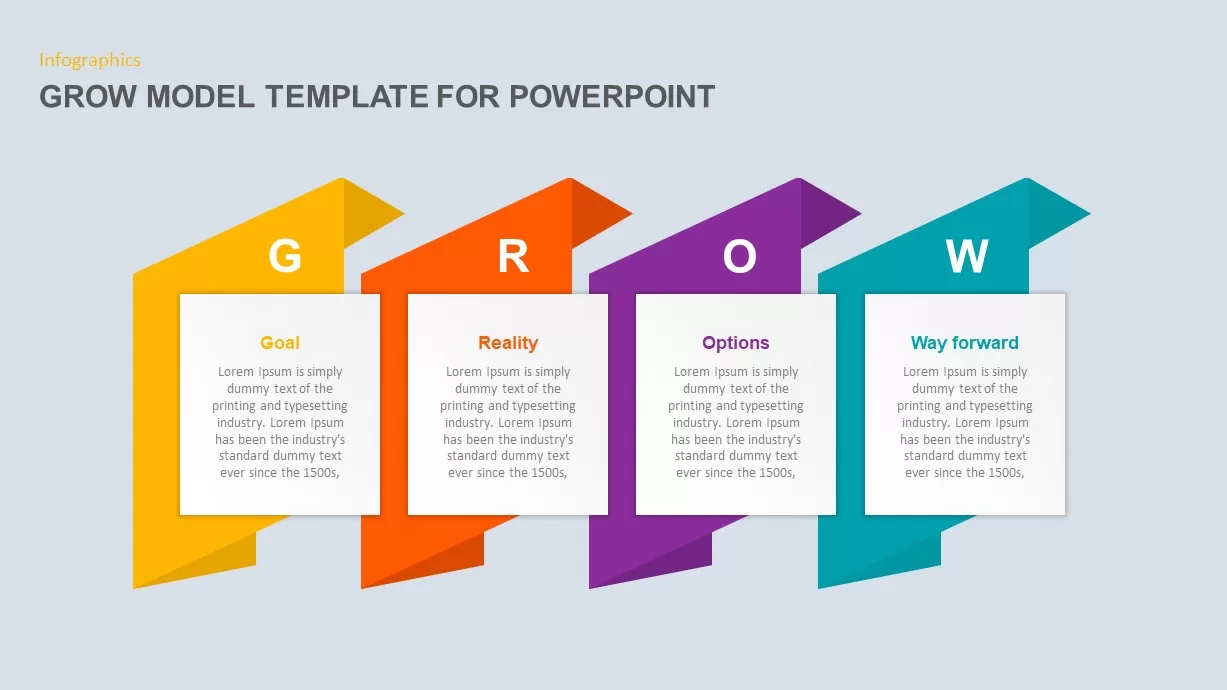
GROW Model Coaching Infographic Template for PowerPoint & Google Slides
Process
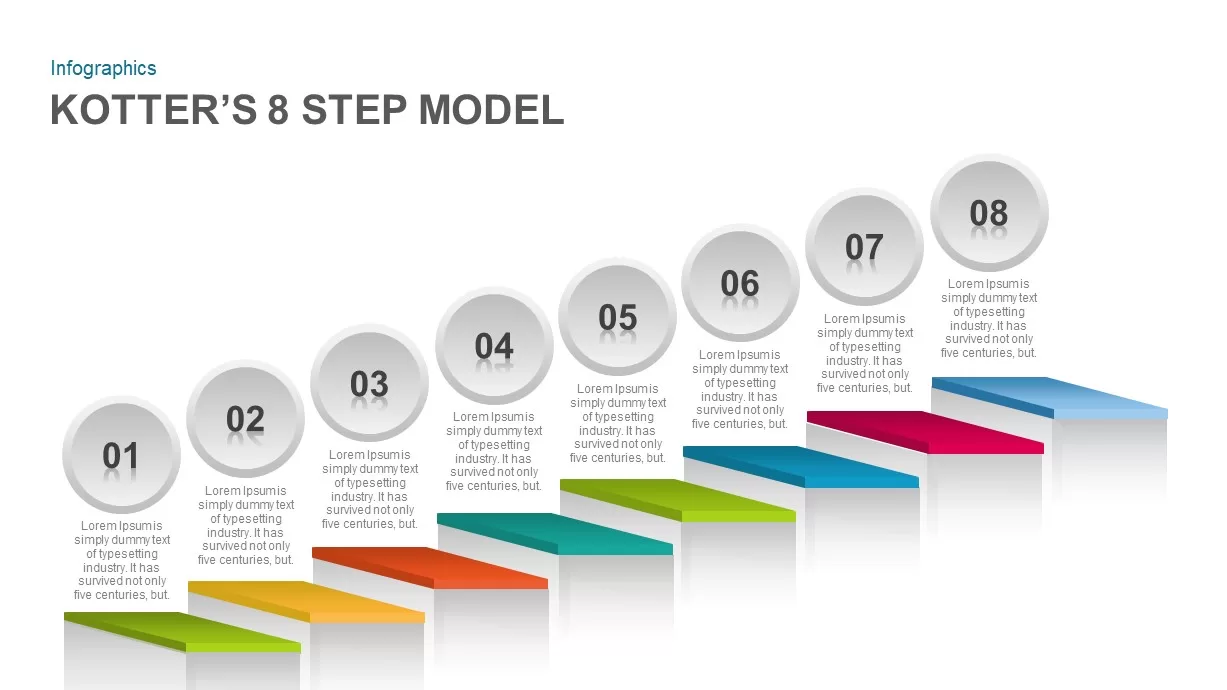
Kotter’s 8-Step Model Infographic Template for PowerPoint & Google Slides
Process
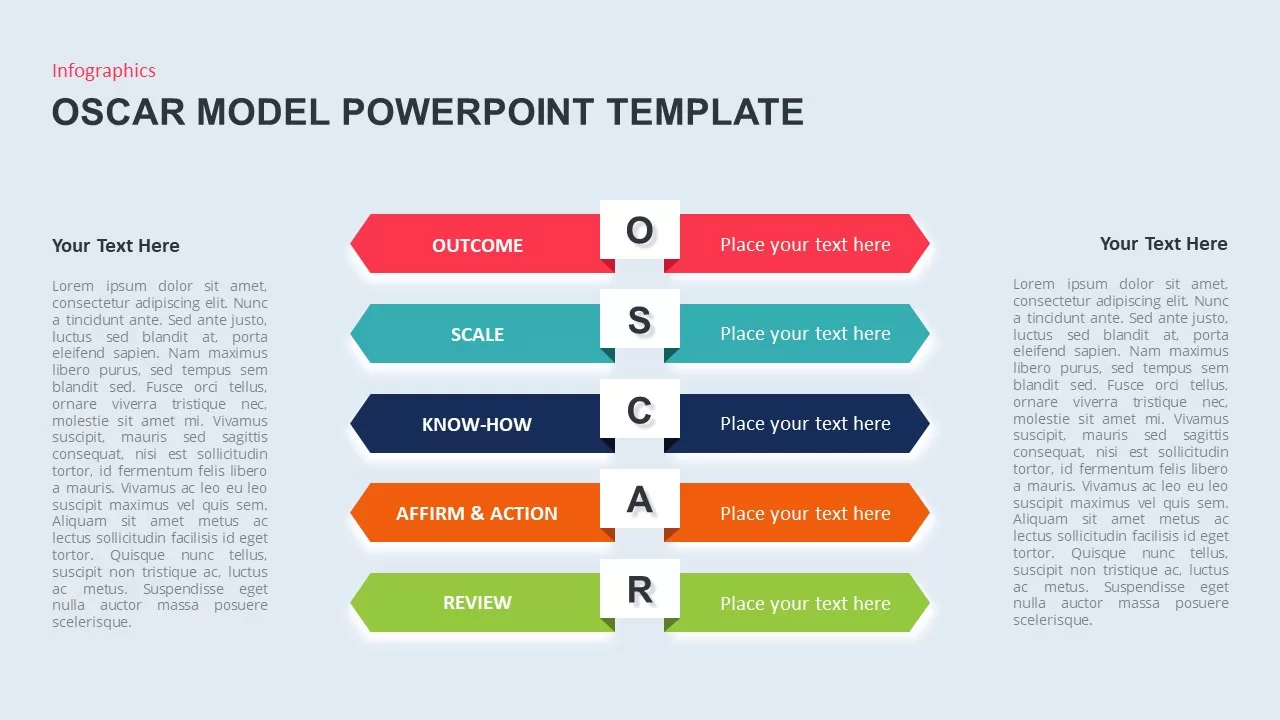
OSCAR Behavior Model Infographic Template for PowerPoint & Google Slides
HR
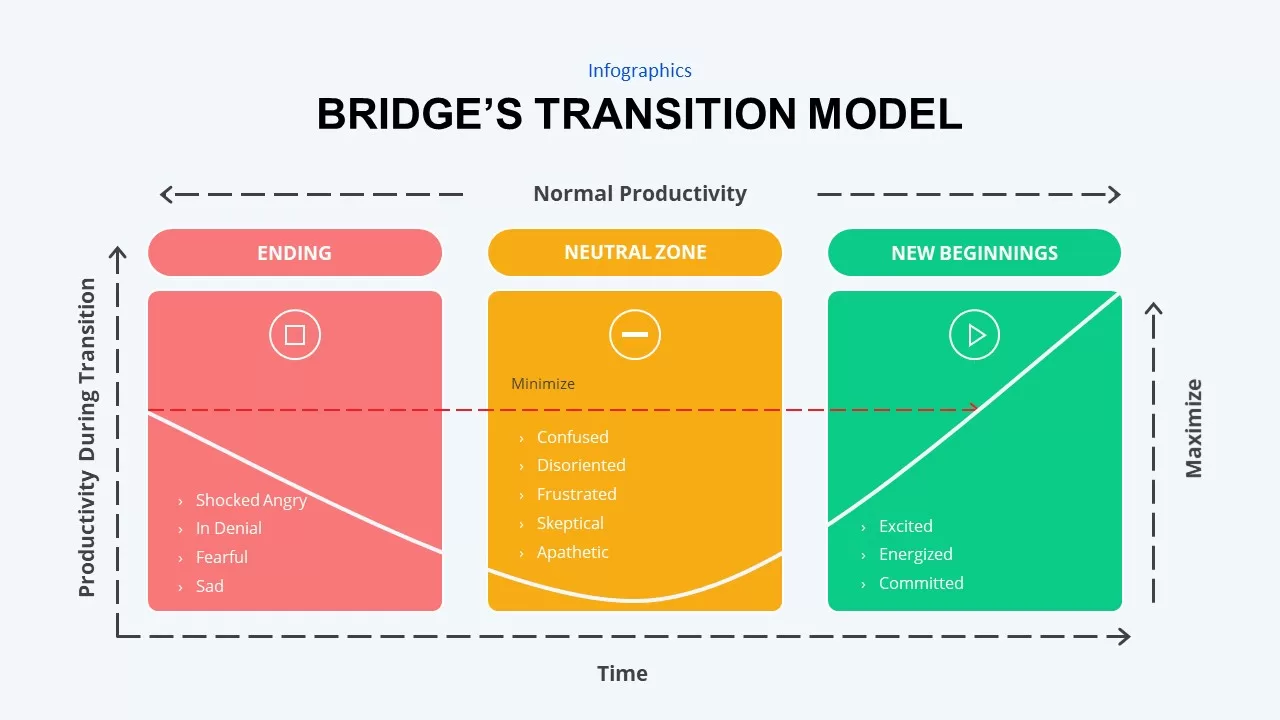
Bridge’s Transition Model Infographic Template for PowerPoint & Google Slides
HR
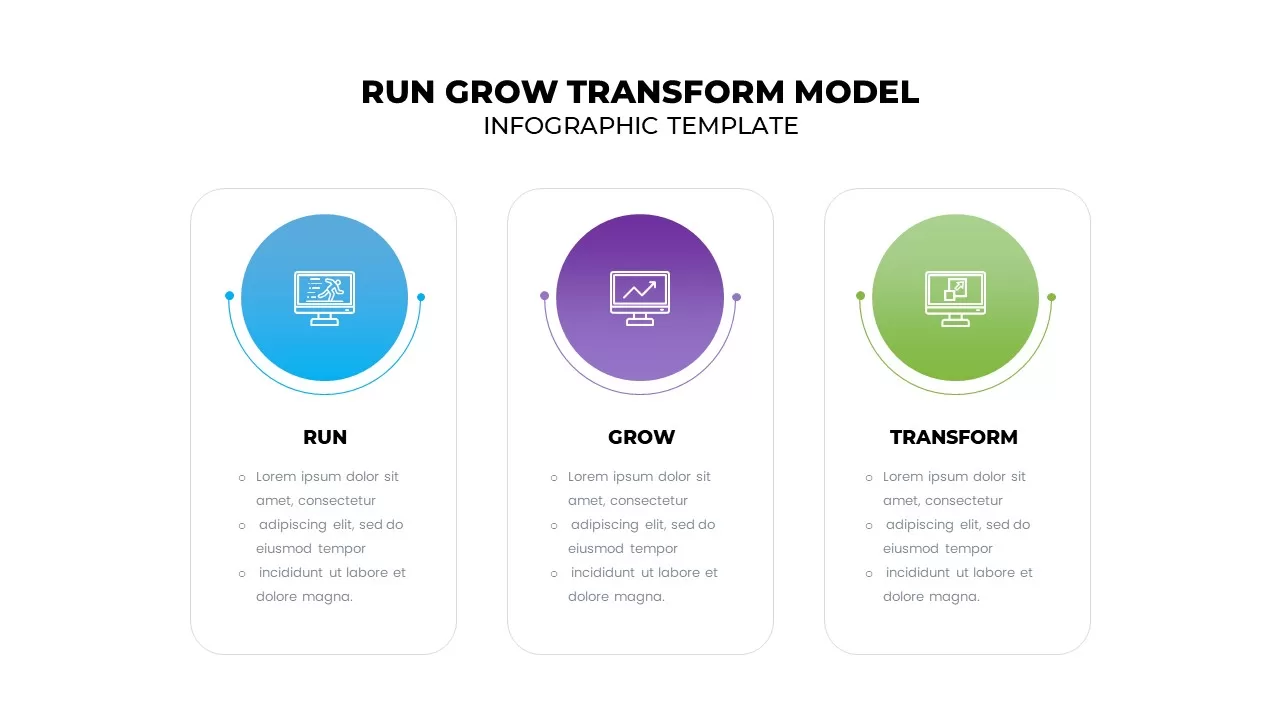
Run Grow Transform Model Infographic Template for PowerPoint & Google Slides
Business
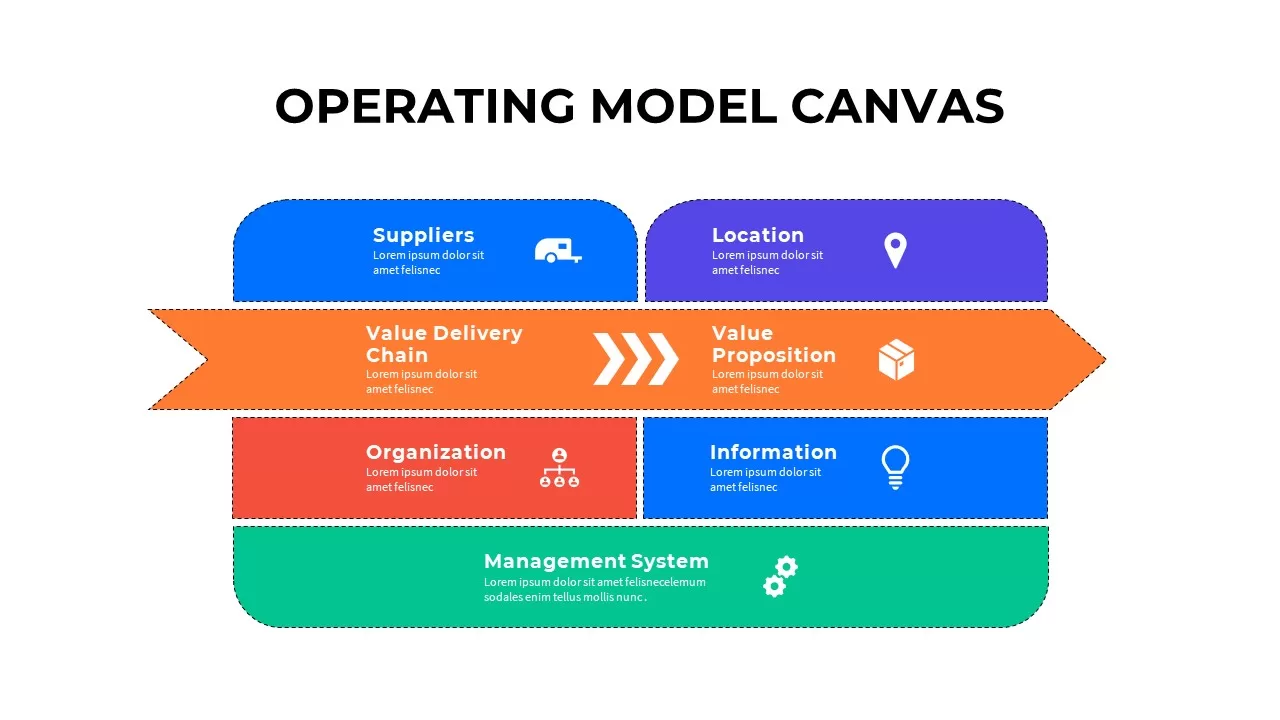
Operating Model Canvas Infographic Template for PowerPoint & Google Slides
Business Models
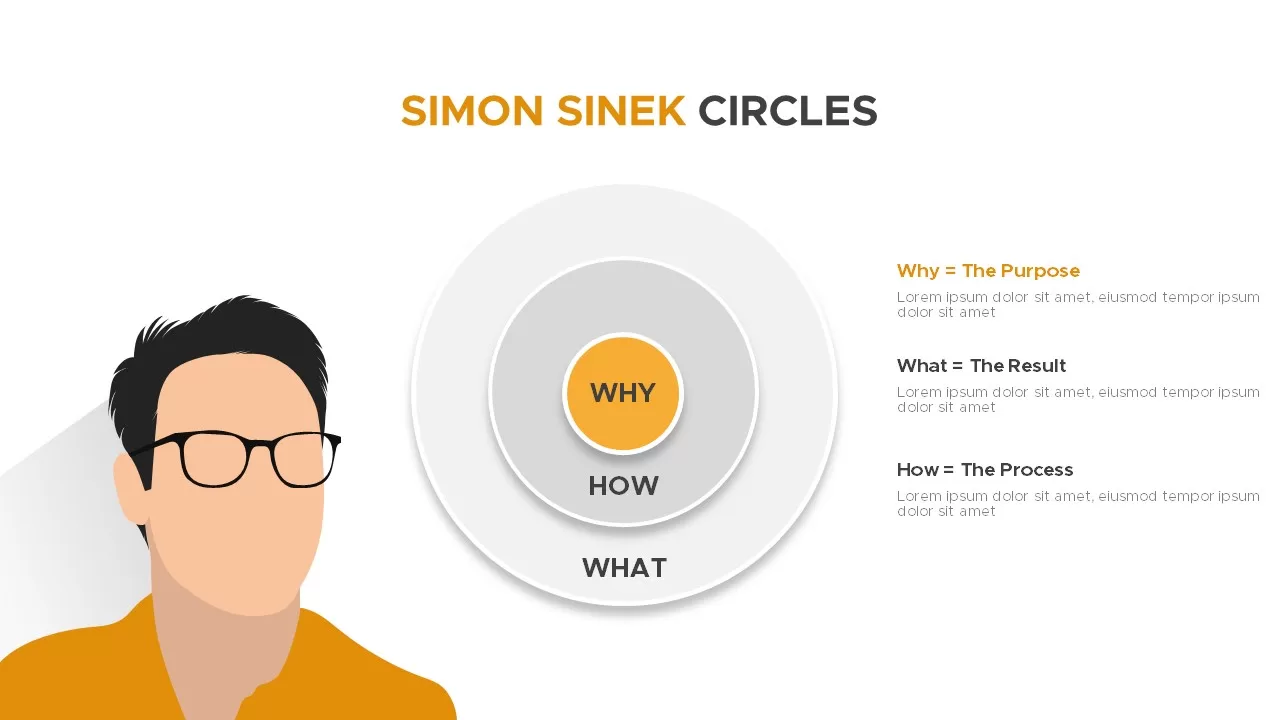
Simon Sinek Circles Model Infographic template for PowerPoint & Google Slides
Business Strategy
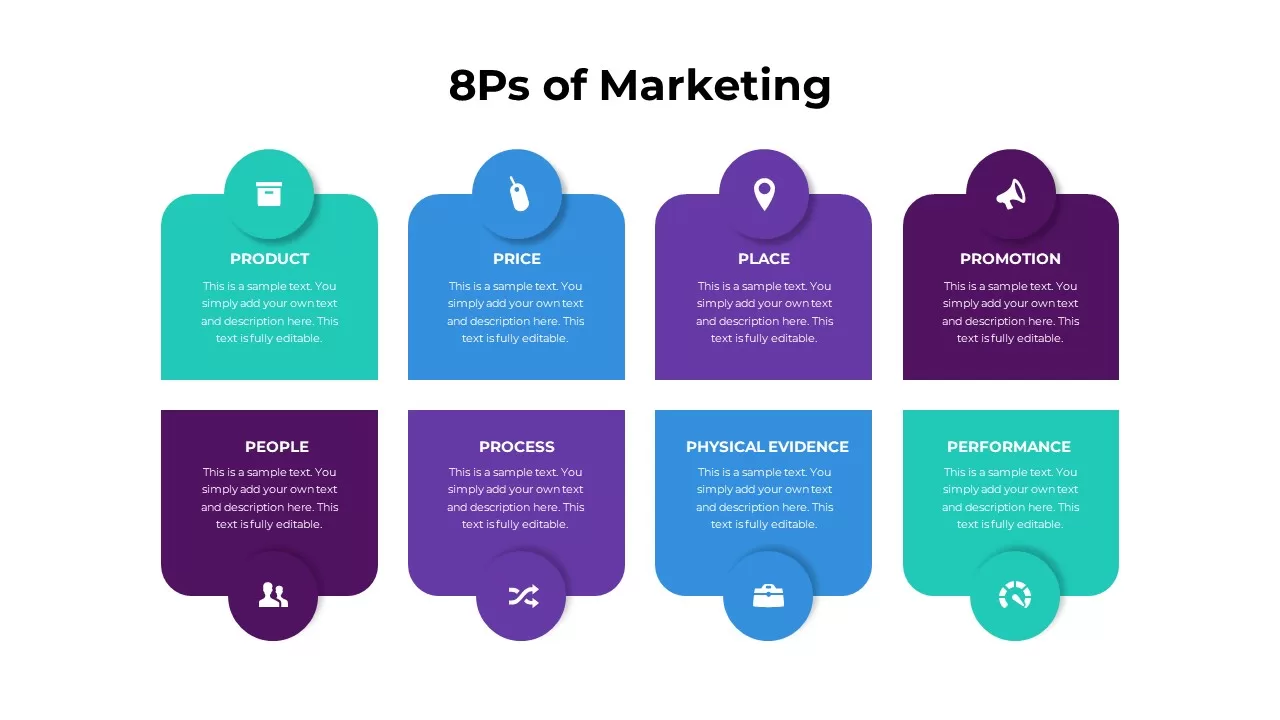
8Ps of Marketing Model Infographic Template for PowerPoint & Google Slides
Marketing
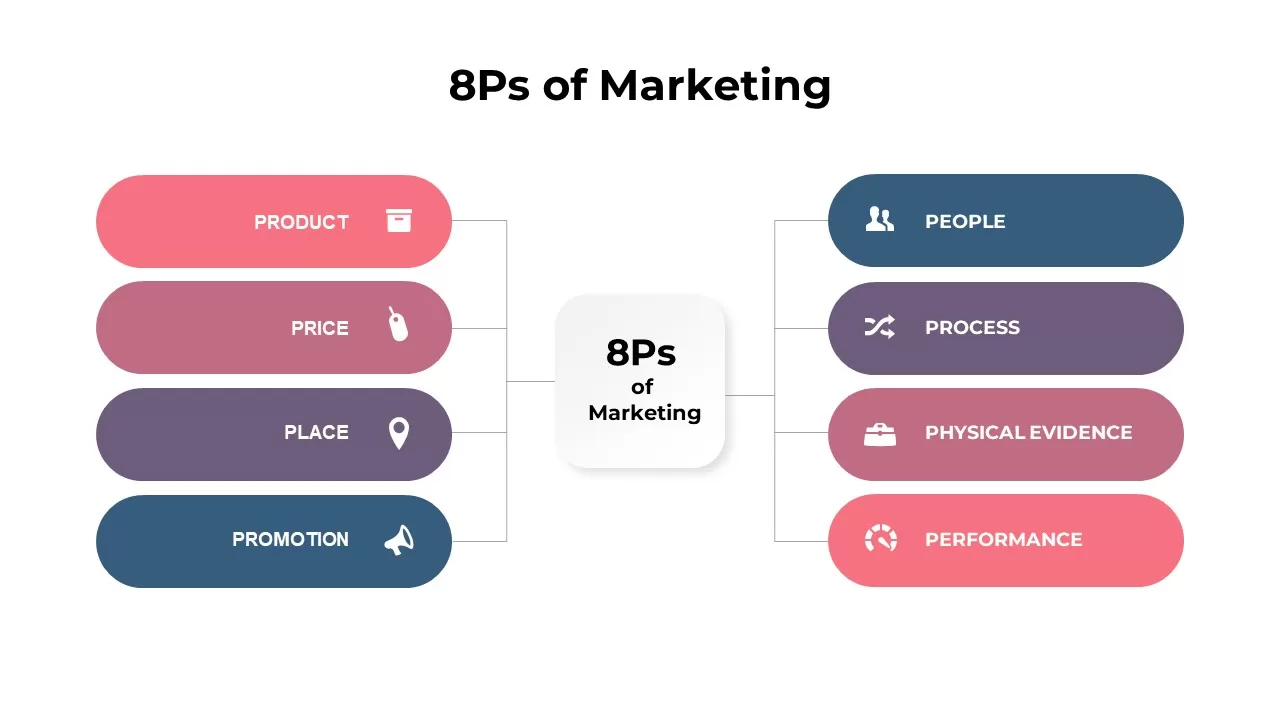
8Ps of Marketing Infographic Model Template for PowerPoint & Google Slides
Comparison
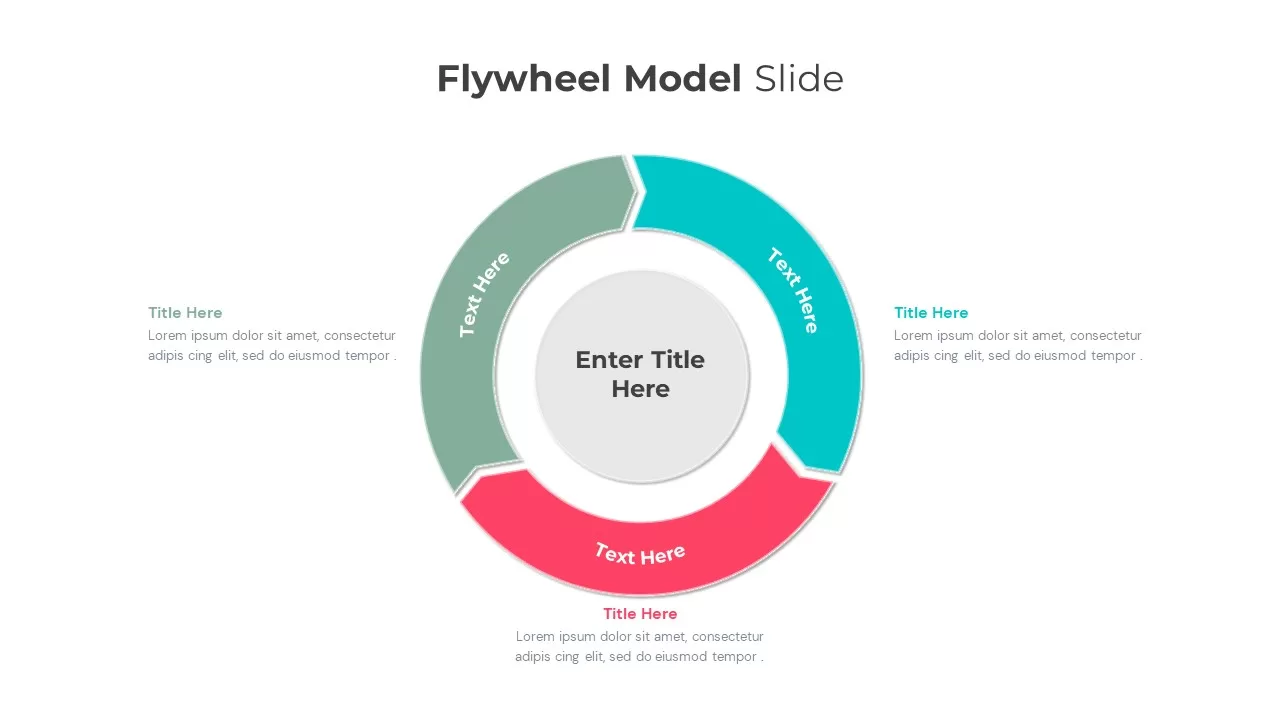
Flywheel Model Infographic Template for PowerPoint & Google Slides
Process
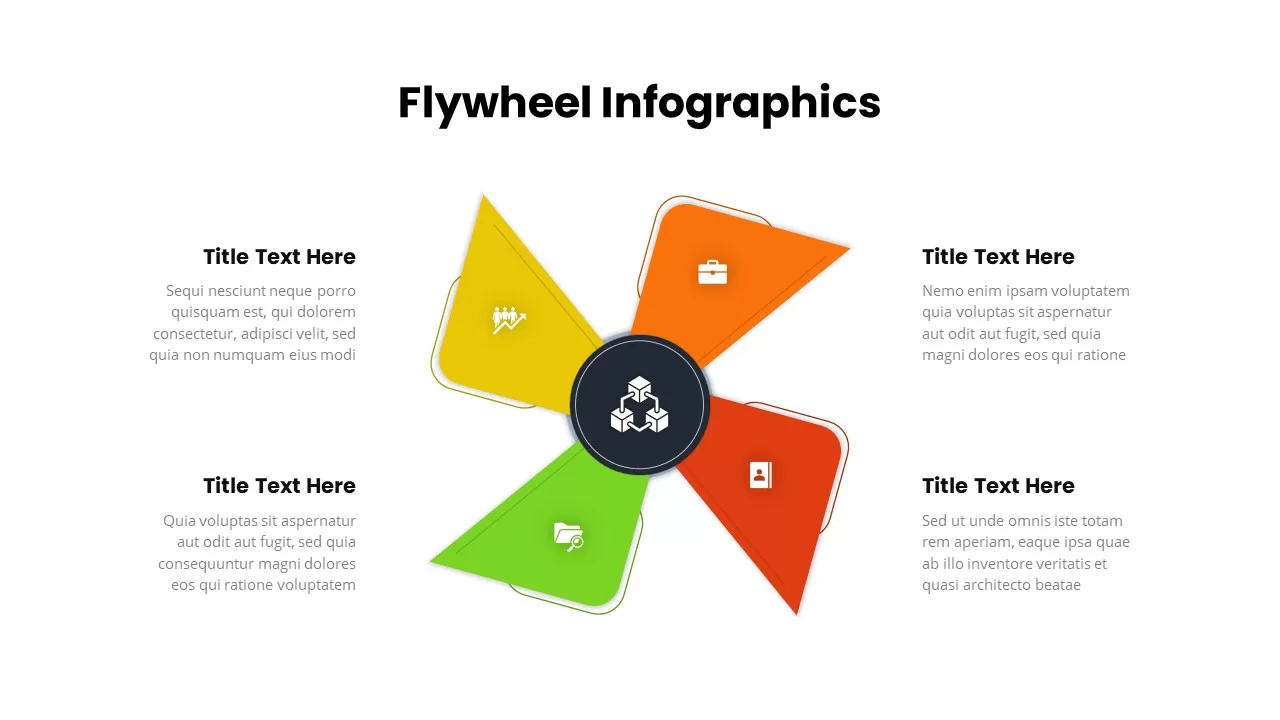
Four-Segment Flywheel Infographic Model Template for PowerPoint & Google Slides
Process
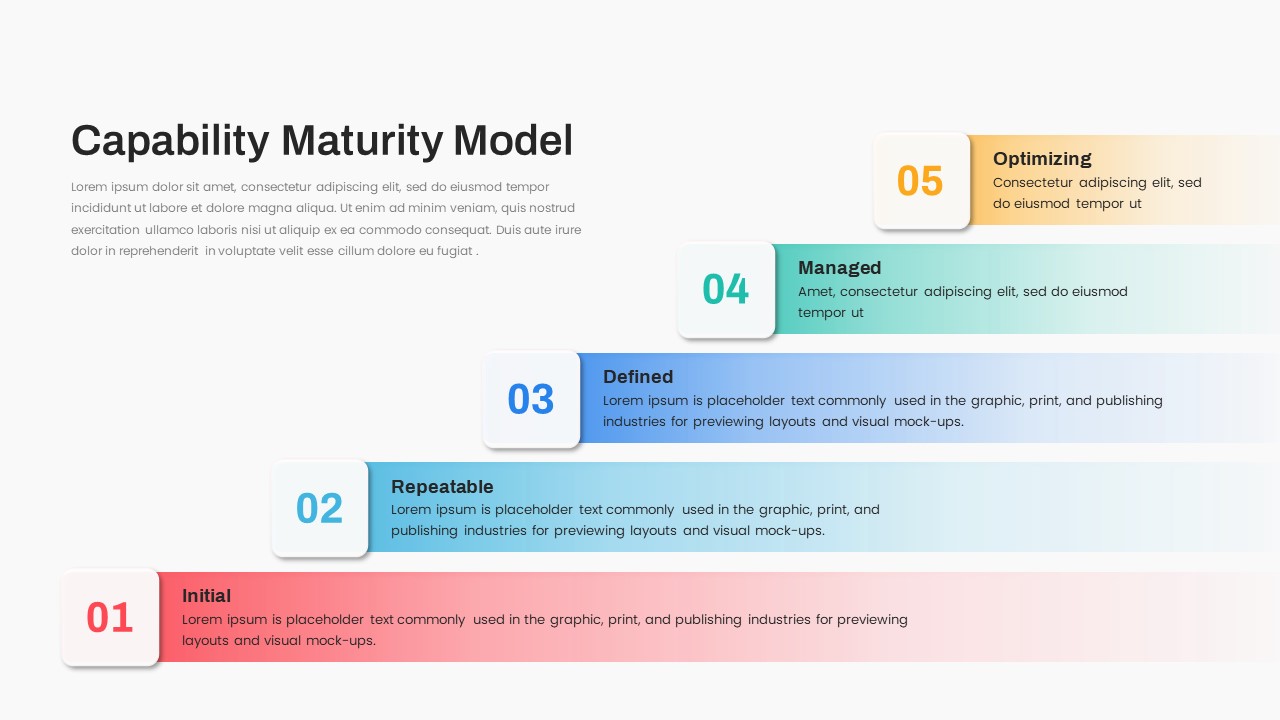
Capability Maturity Model Infographic Template for PowerPoint & Google Slides
Software Development
Salience Model Venn Diagram Infographic Template for PowerPoint & Google Slides
Circular
Pricing Model Types Comparison Infographic Template for PowerPoint & Google Slides
Pitch Deck
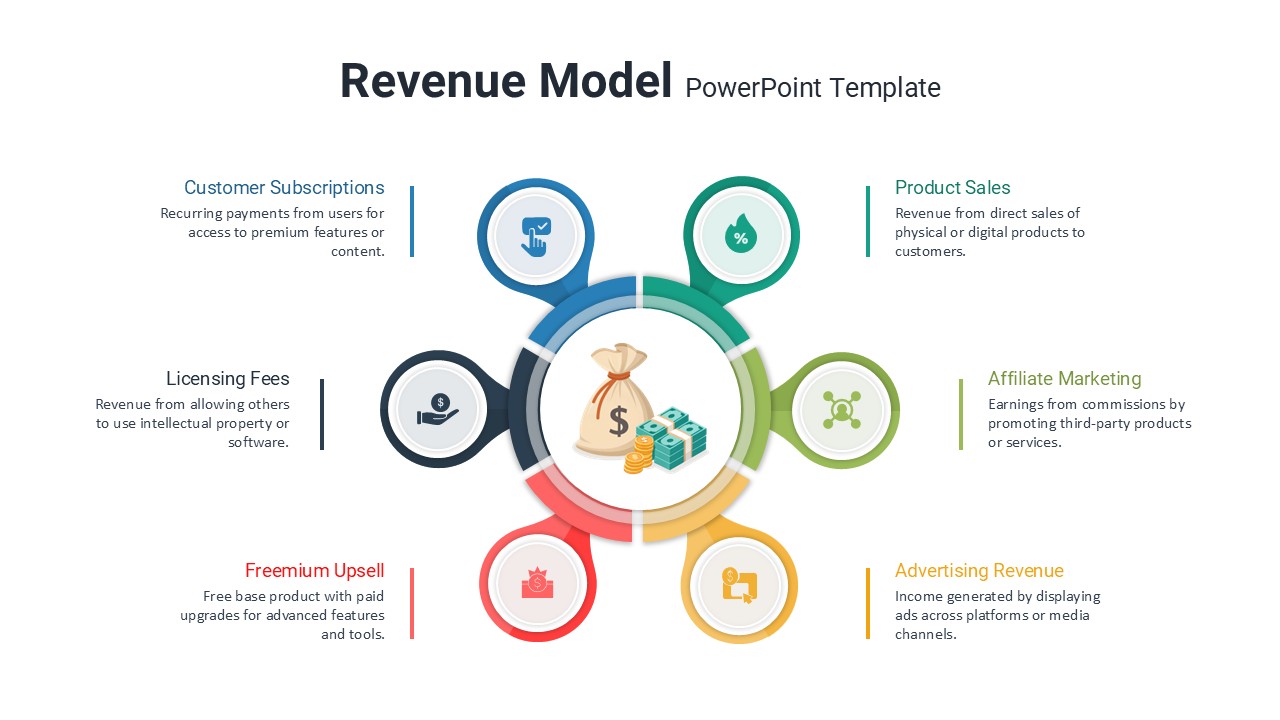
Six Revenue Stream Model Infographic Template for PowerPoint & Google Slides
Circular
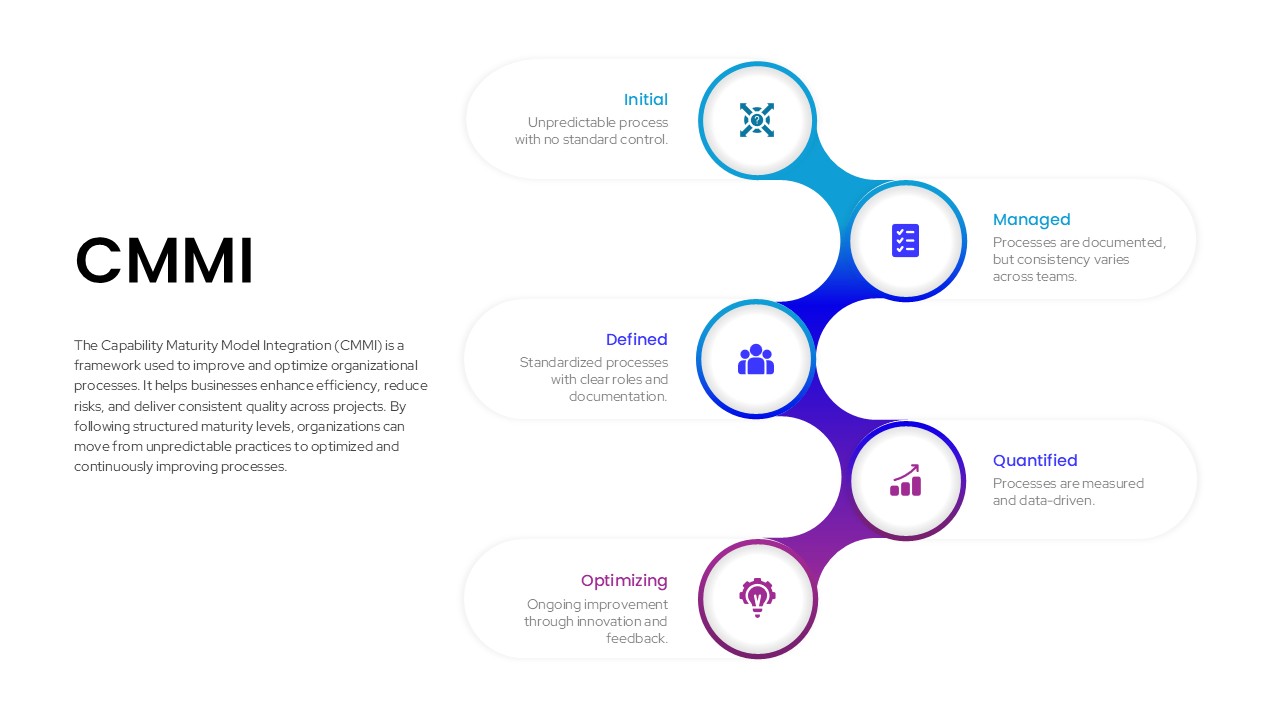
CMMI Process Maturity Model Infographic Template for PowerPoint & Google Slides
Process
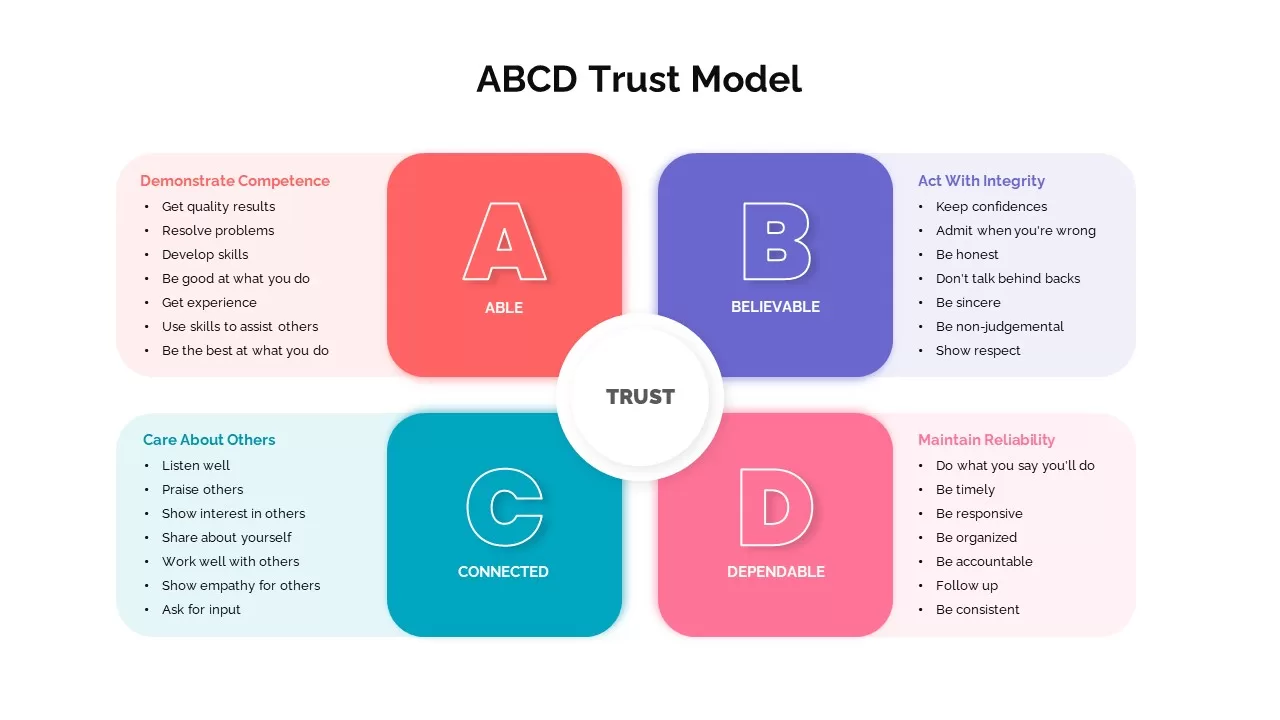
ABCD Trust Model Infographic for PowerPoint & Google Slides
Infographics
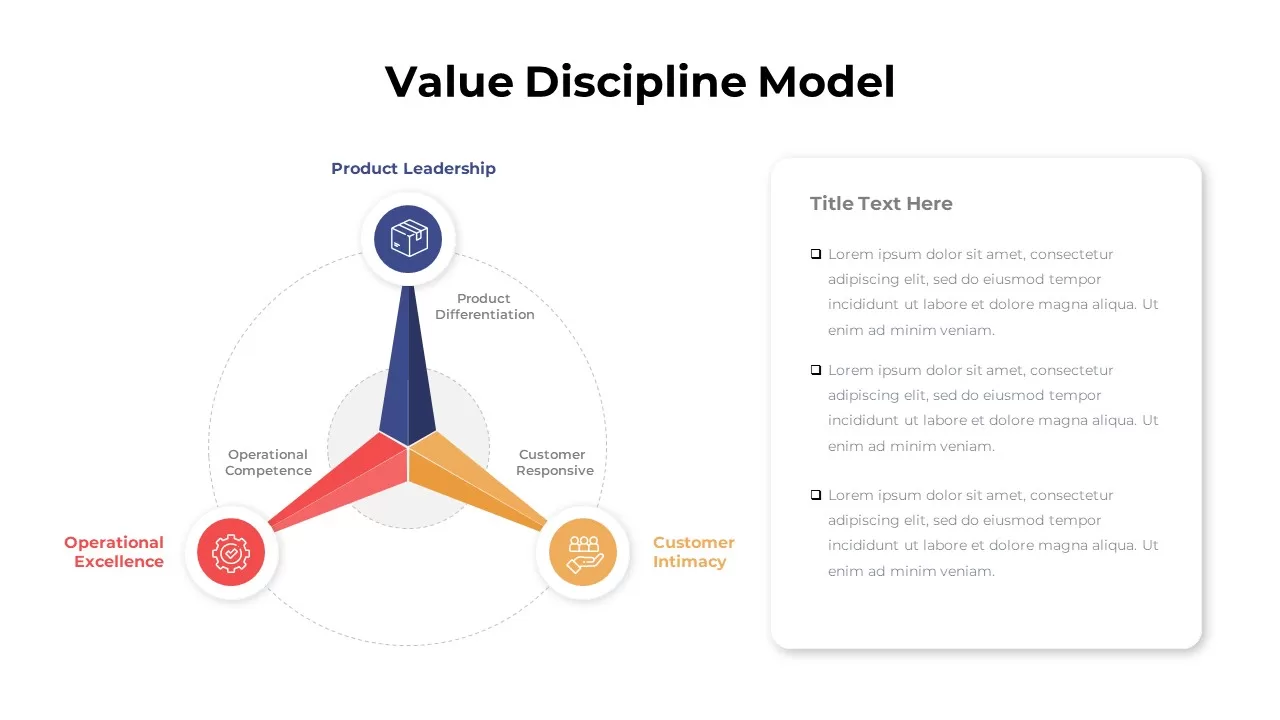
Value Discipline Model infographic for PowerPoint & Google Slides
Marketing
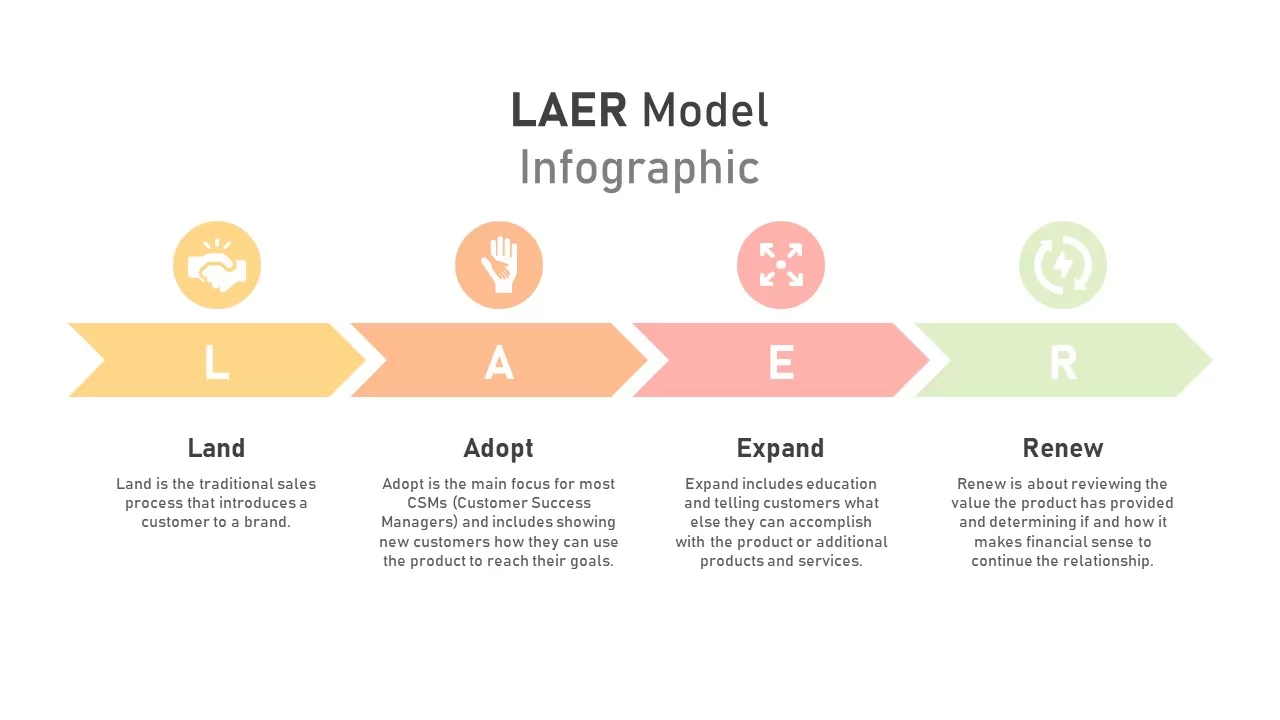
LAER Model Infographic for PowerPoint & Google Slides
Business Strategy
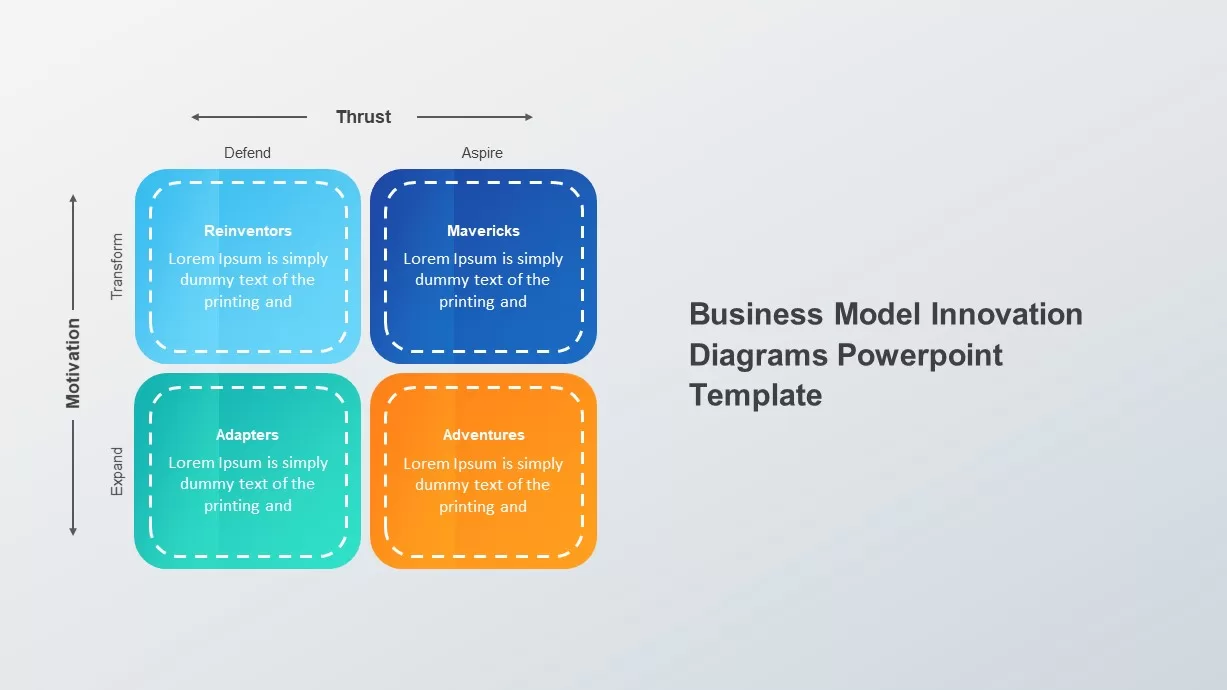
Business Model Innovation Diagrams template for PowerPoint & Google Slides
Process

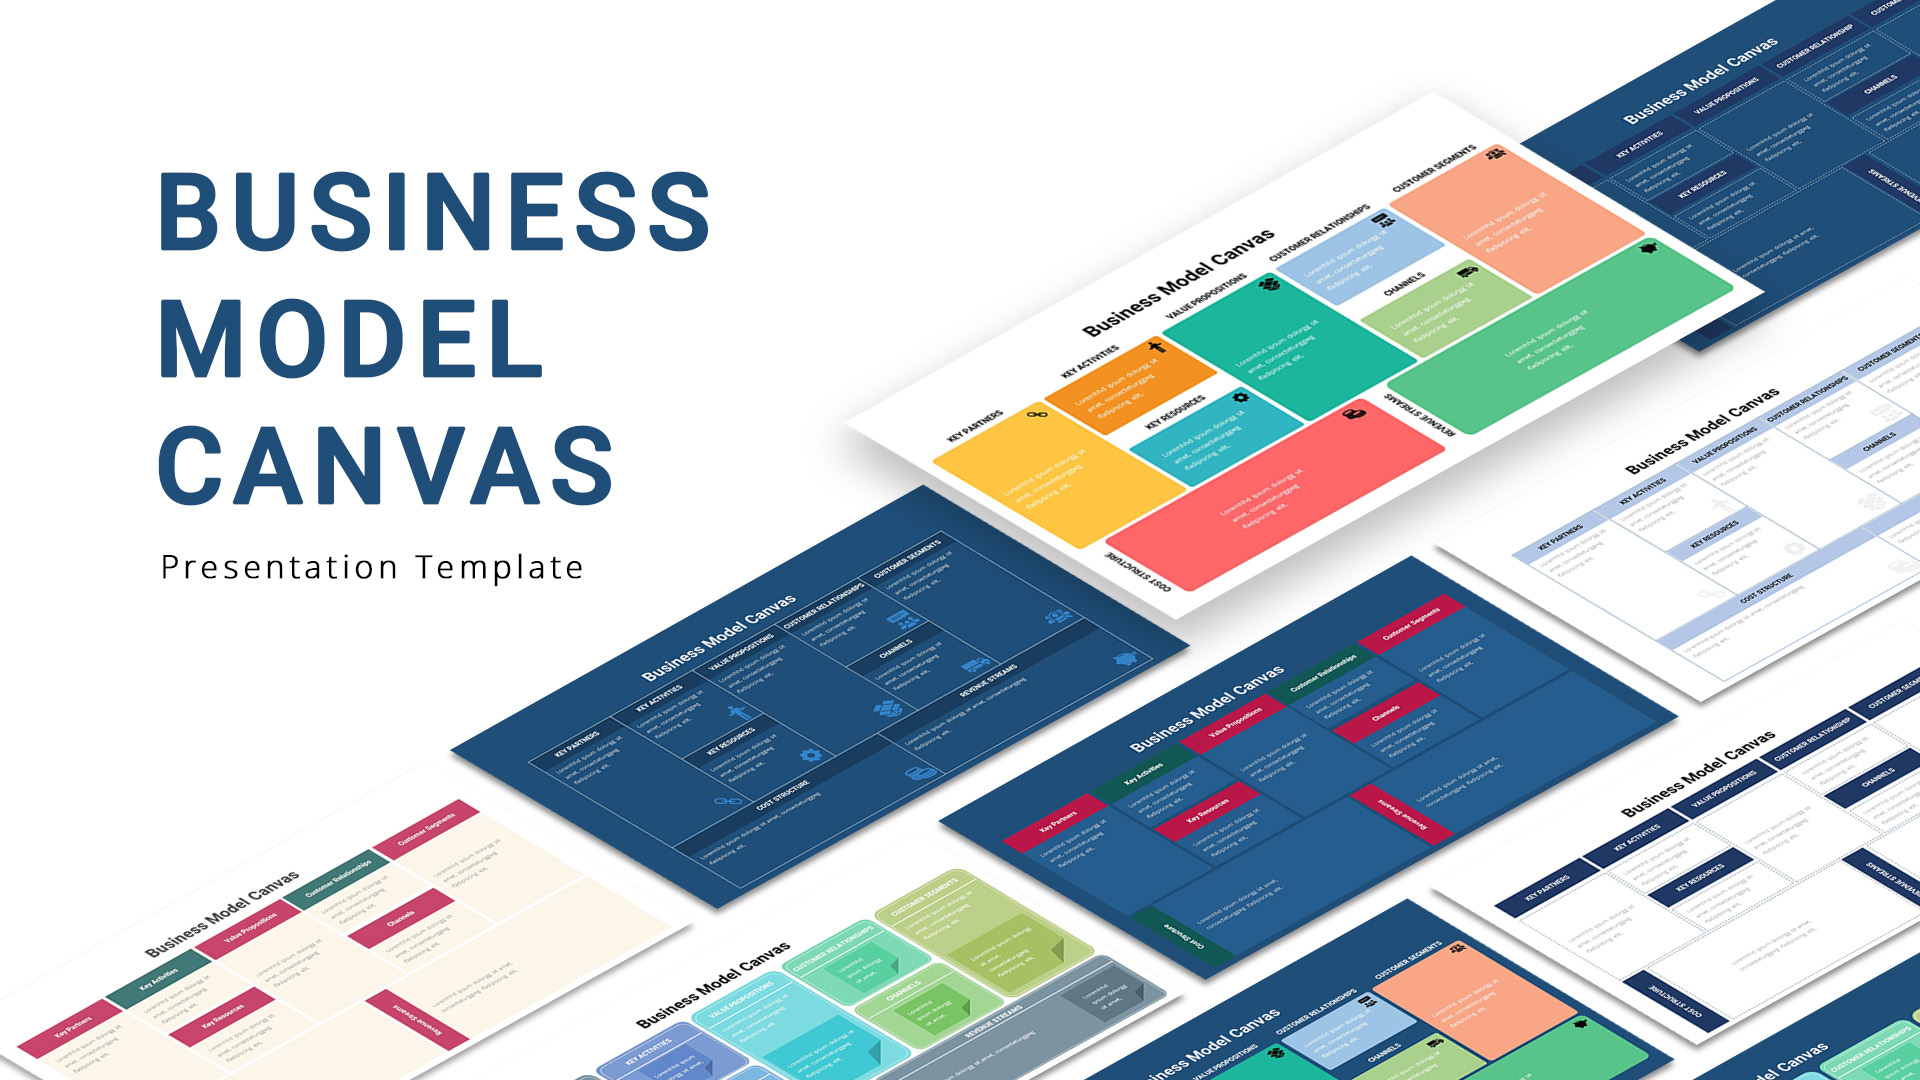
Business Model Canvas Diagram Template for PowerPoint & Google Slides
Business Models
Business Strategy House Model Diagram Template for PowerPoint & Google Slides
Business Strategy
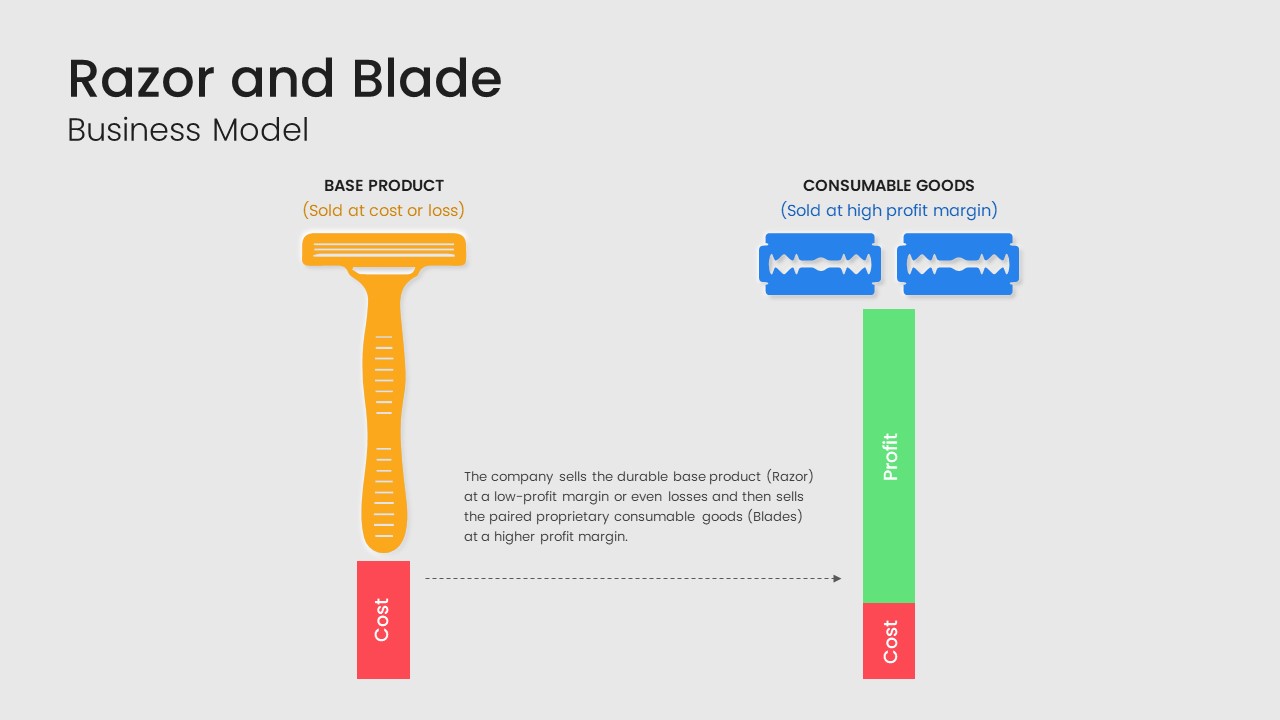
Razor and Blade Business Model Diagram Template for PowerPoint & Google Slides
Business Models
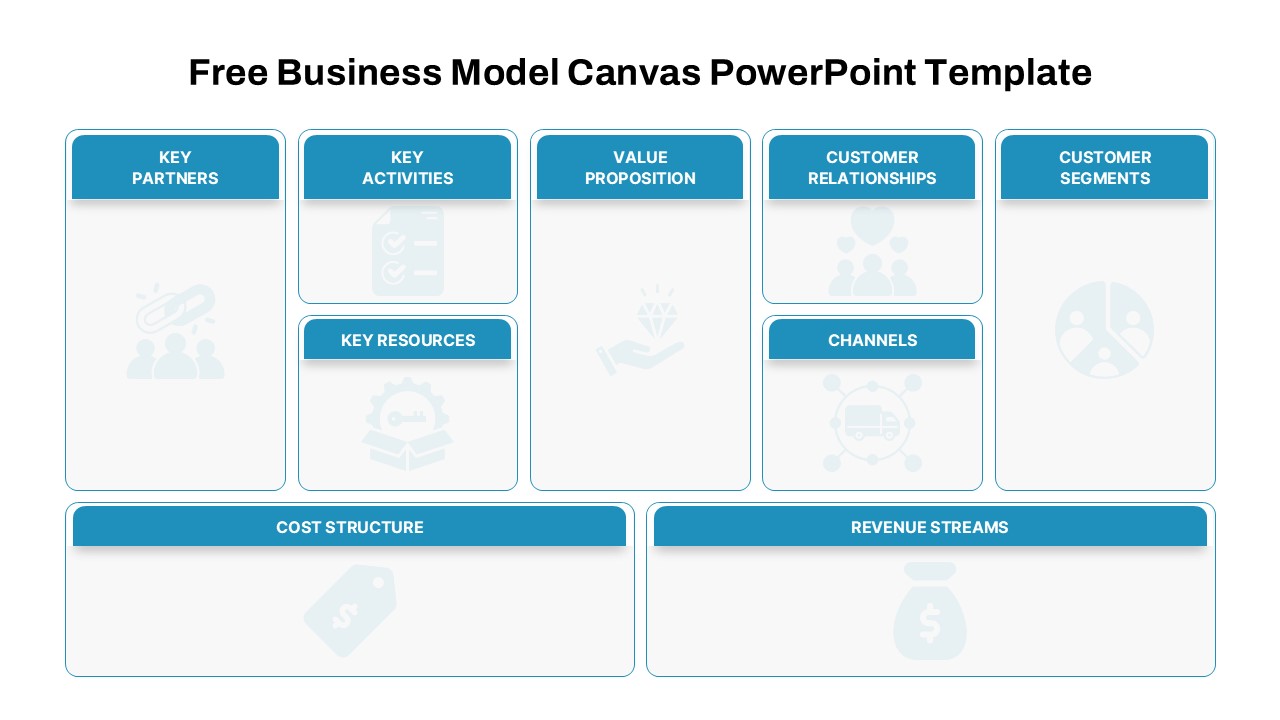
Free Business Model Canvas Diagram Slide Template for PowerPoint & Google Slides
Business Models
Free
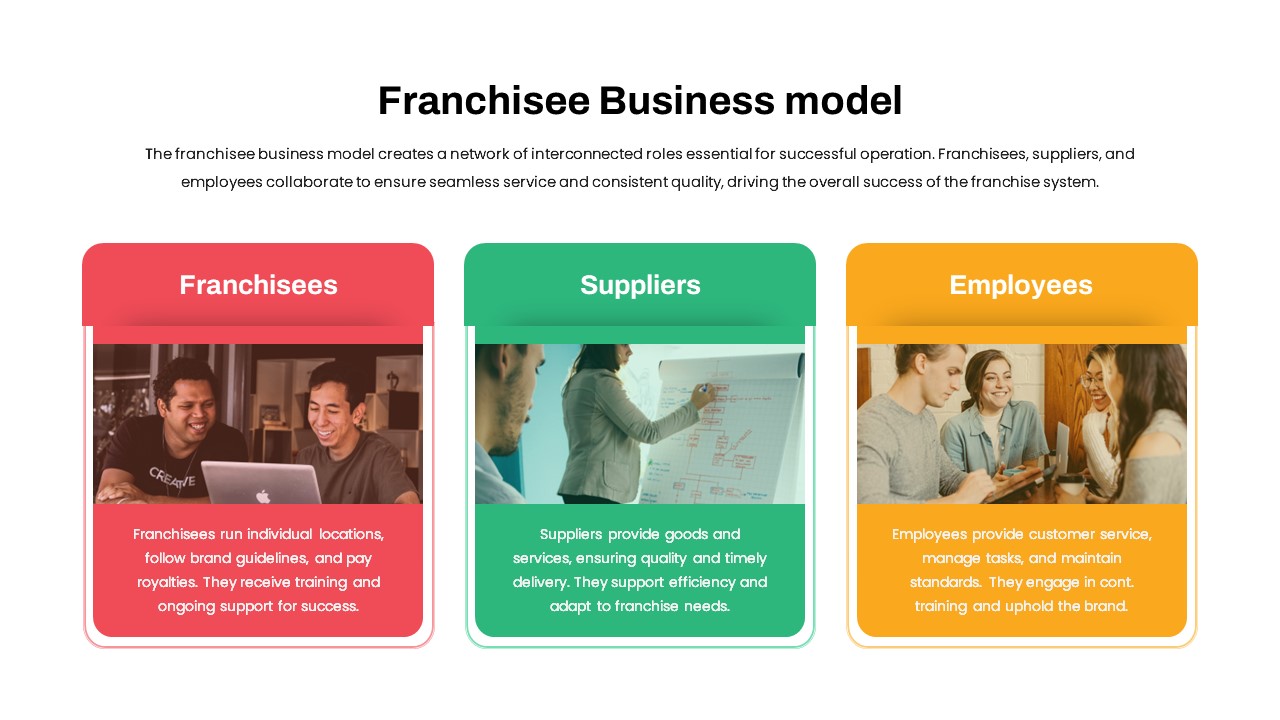
Franchisee Business Model Overview Template for PowerPoint & Google Slides
Business Models
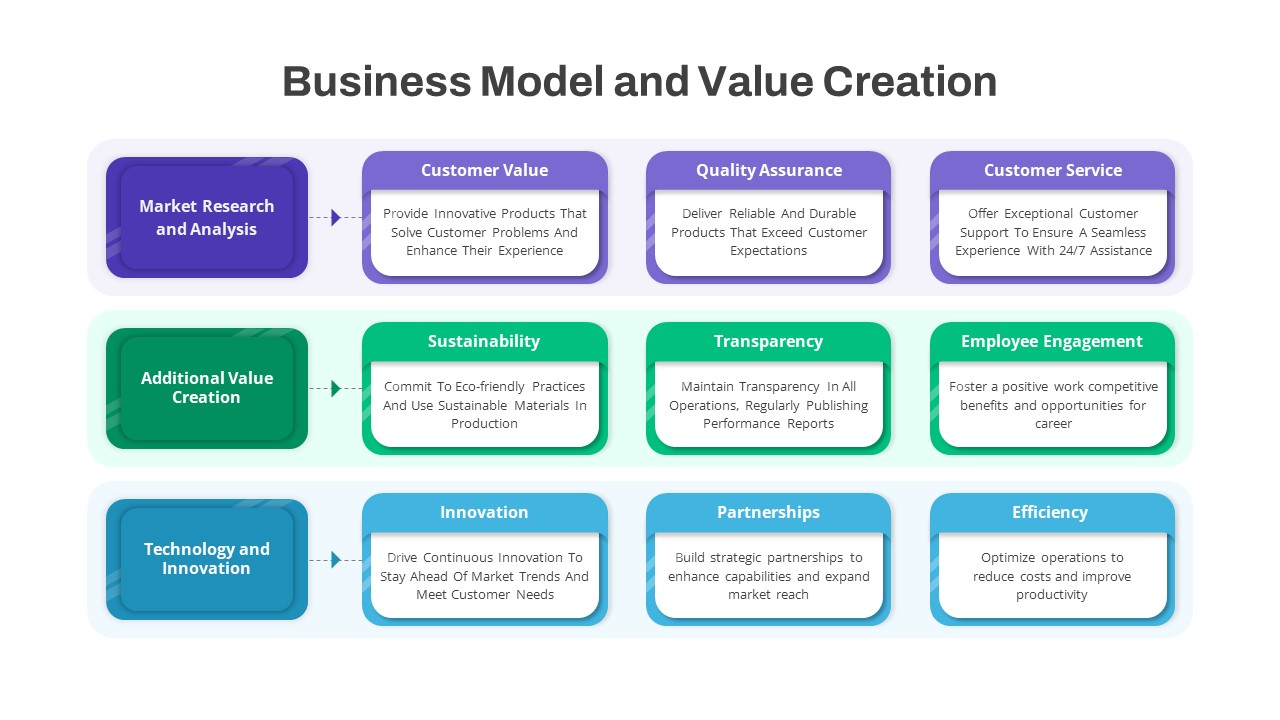
Business Model & Value Creation Template for PowerPoint & Google Slides
Process
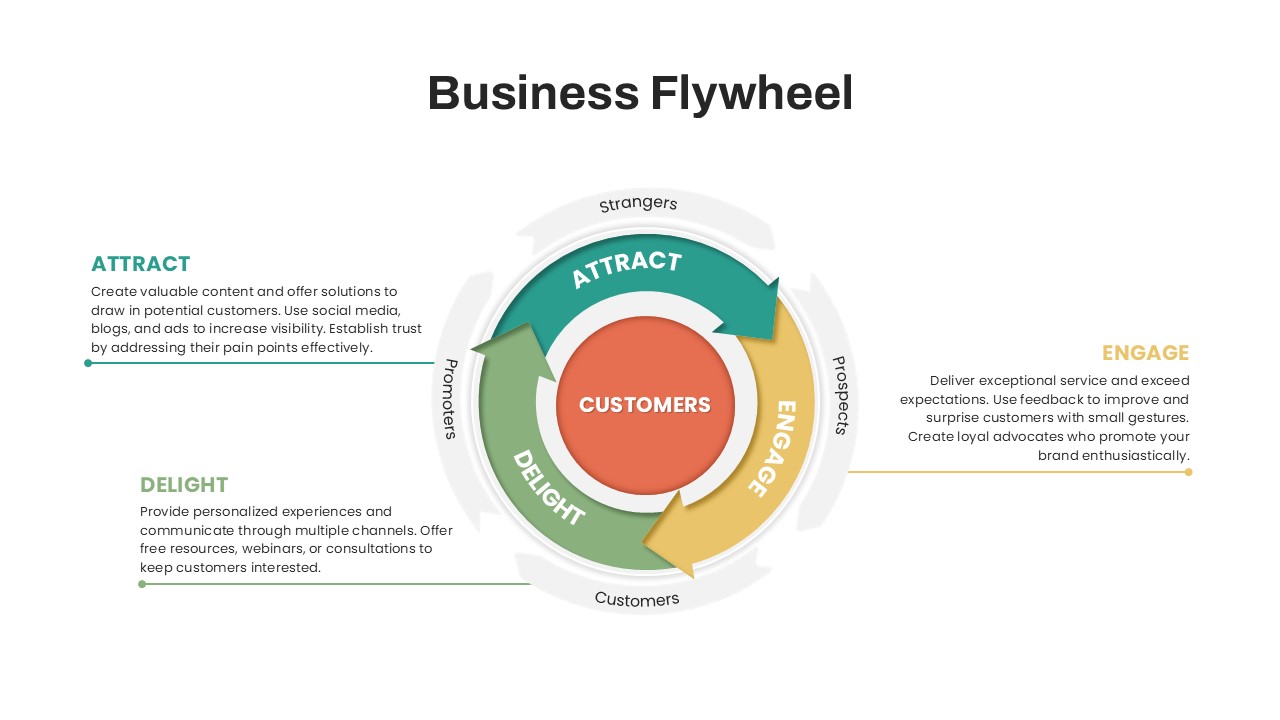
Business Flywheel Lifecycle Model Template for PowerPoint & Google Slides
Circular
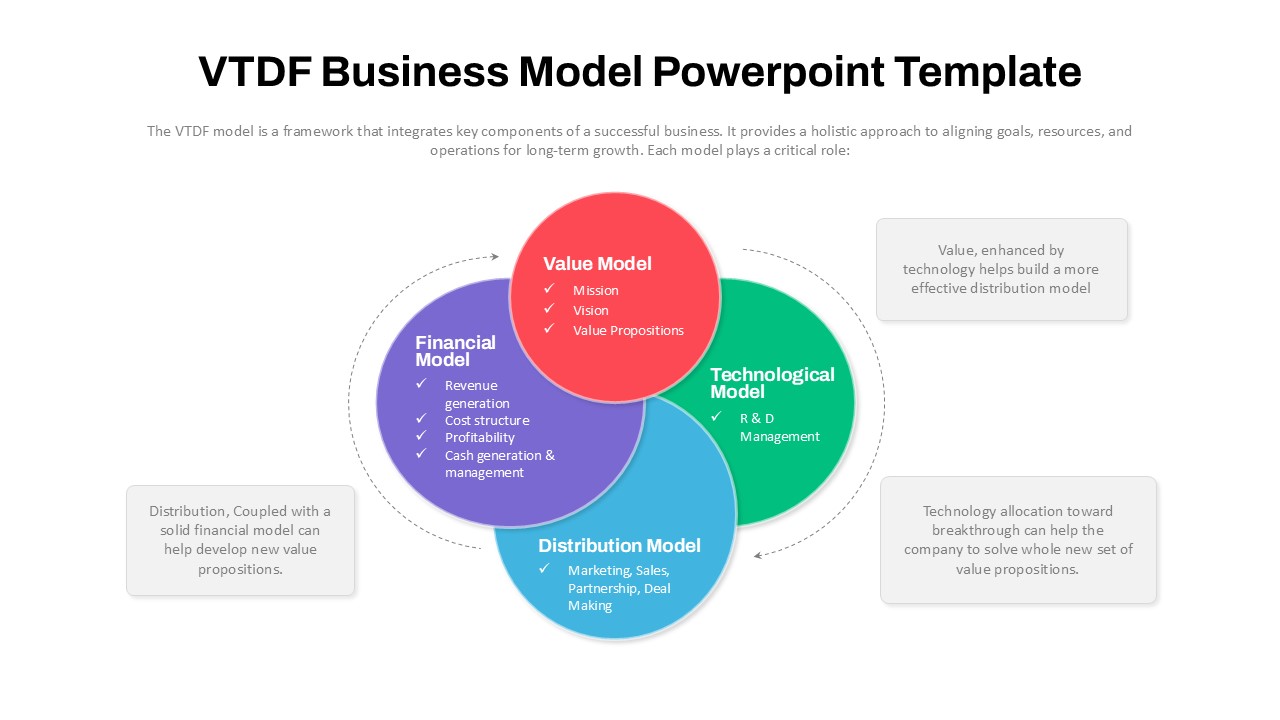
VTDF Business Model Framework Diagram Template for PowerPoint & Google Slides
Business Models
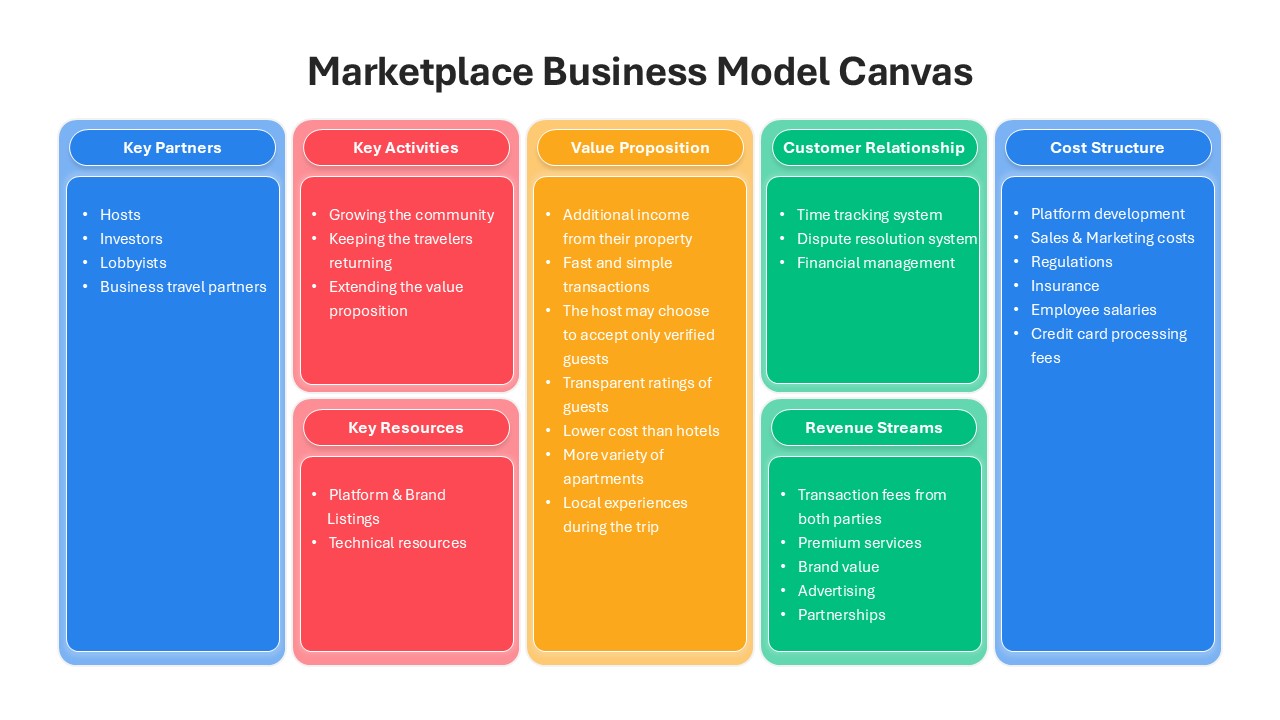
Marketplace Business Model Canvas Slide Template for PowerPoint & Google Slides
Business Models
Seeds Growth Cycle Business Model Template for PowerPoint & Google Slides
Process
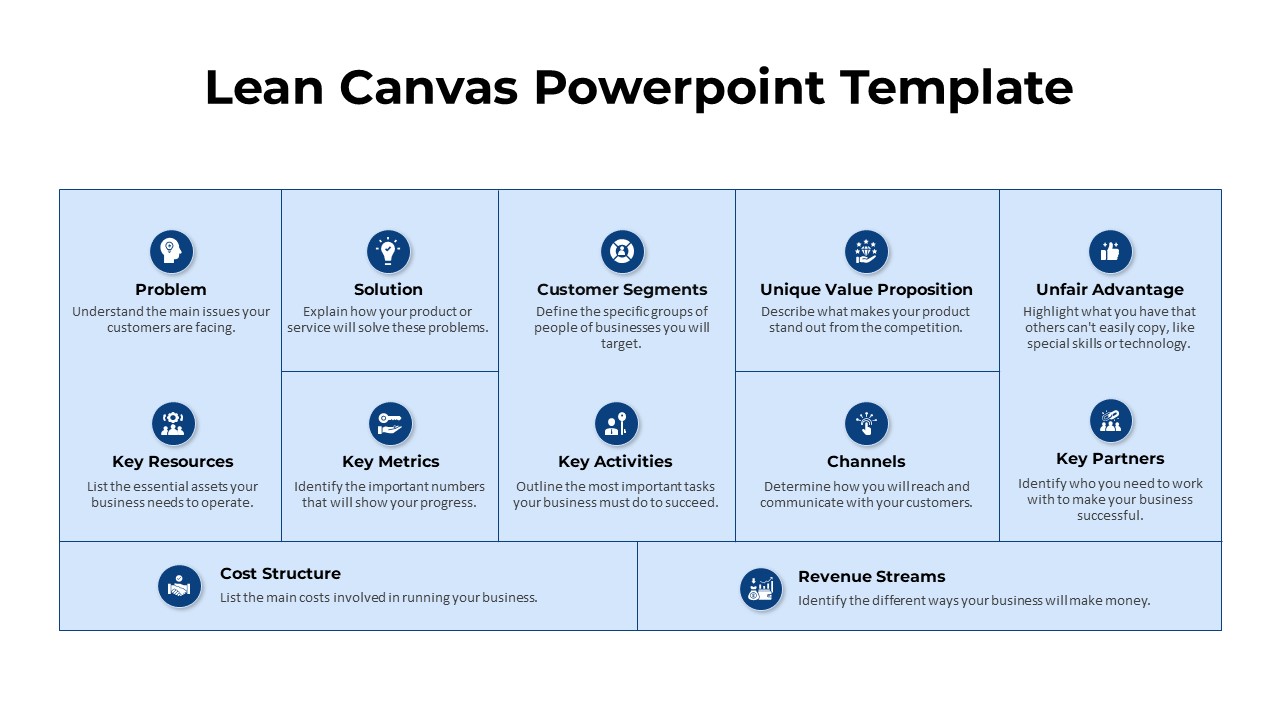
Strategic Lean Canvas Business Model Template for PowerPoint & Google Slides
Business Models
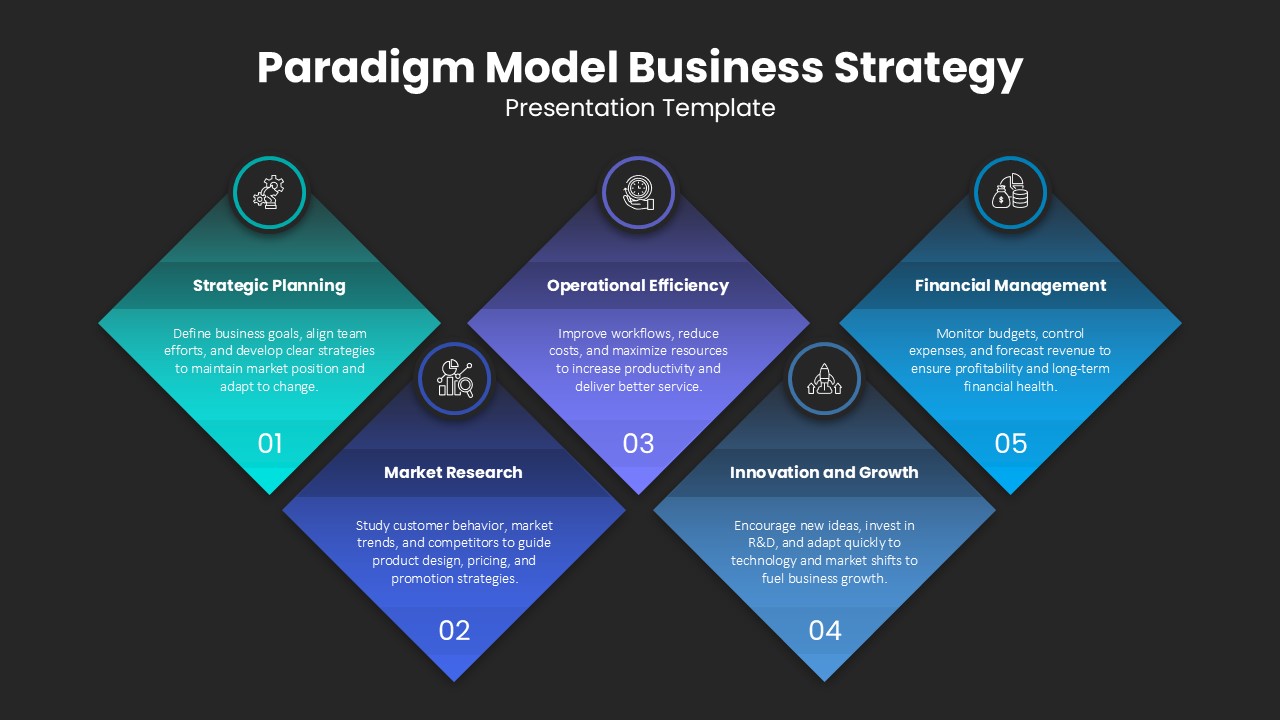
Paradigm Model Business Strategy Template for PowerPoint & Google Slides
Business Strategy
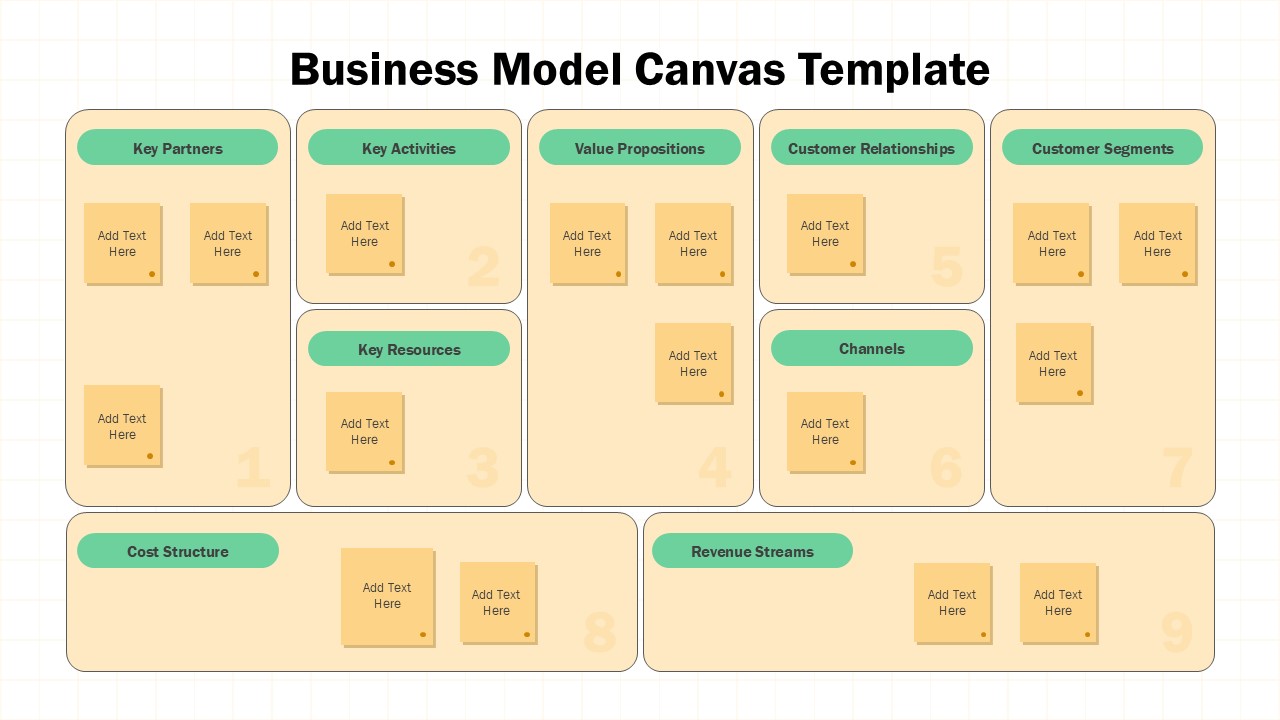
Business Model Canvas Sticky Notes Template for PowerPoint & Google Slides
Business Models
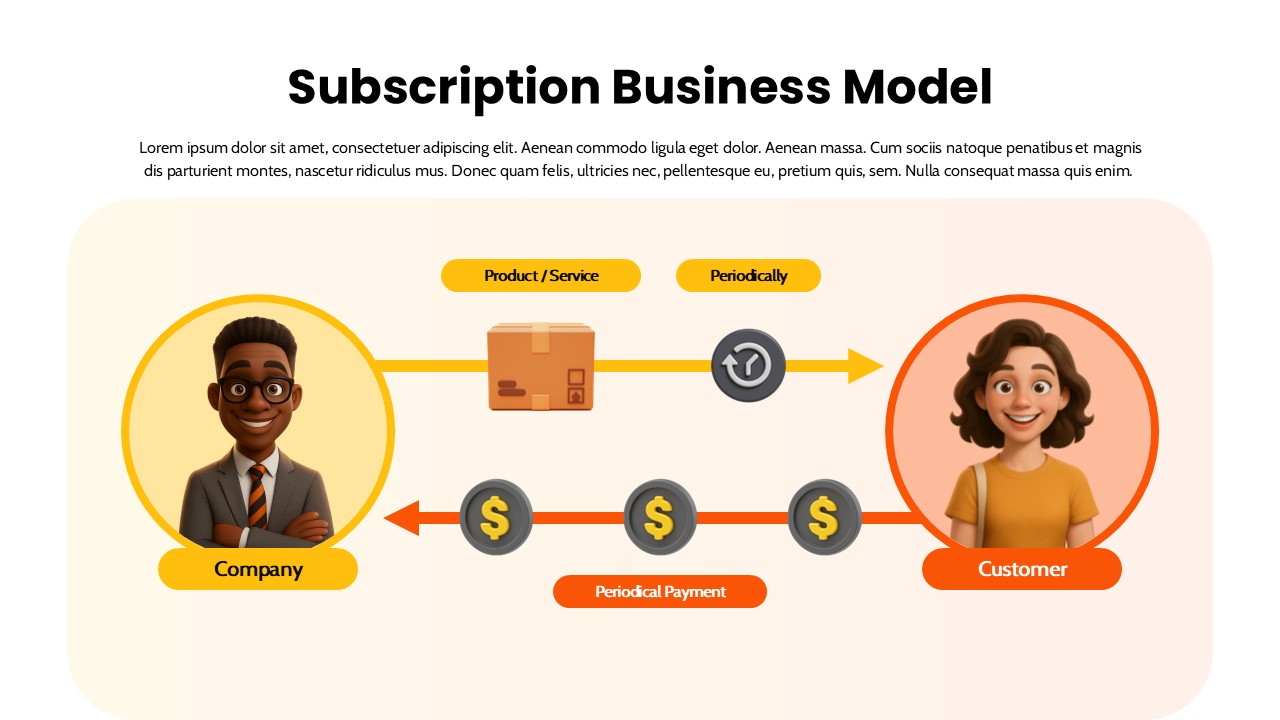
Subscription Business Model Flow Diagram Template for PowerPoint & Google Slides
Business Models
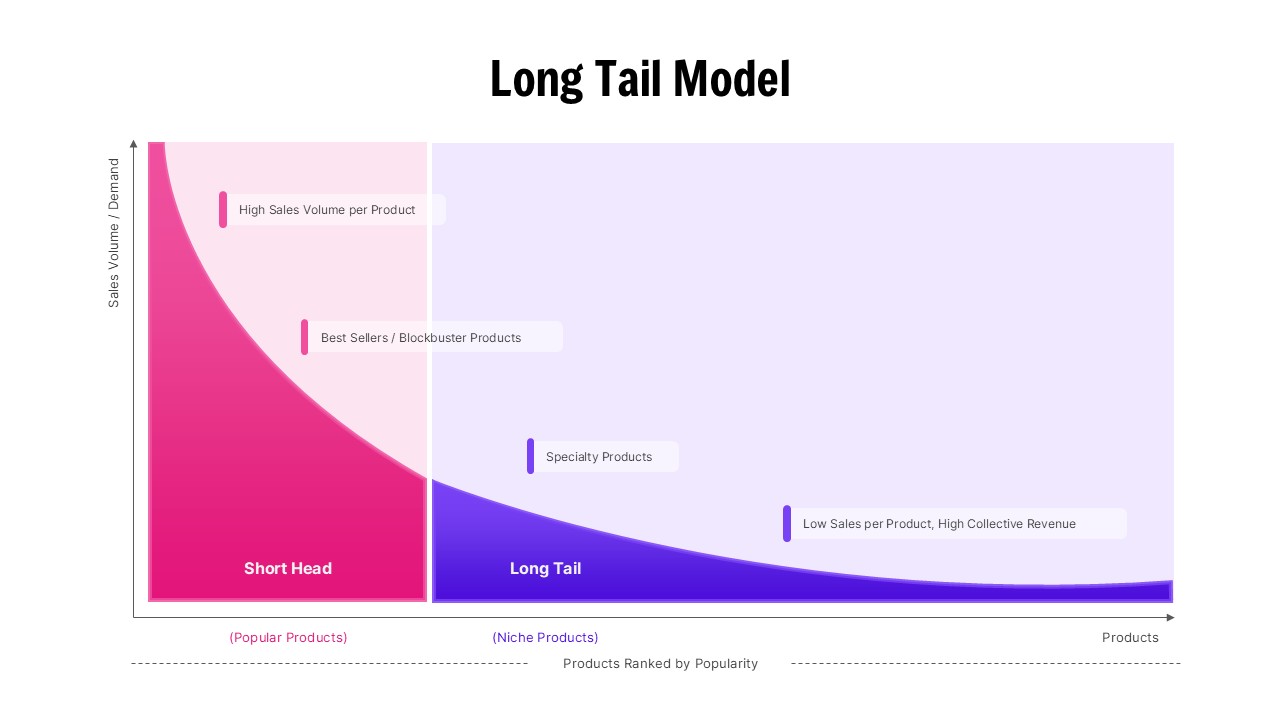
Long Tail Model Business Strategy Diagram Template for PowerPoint & Google Slides
Business
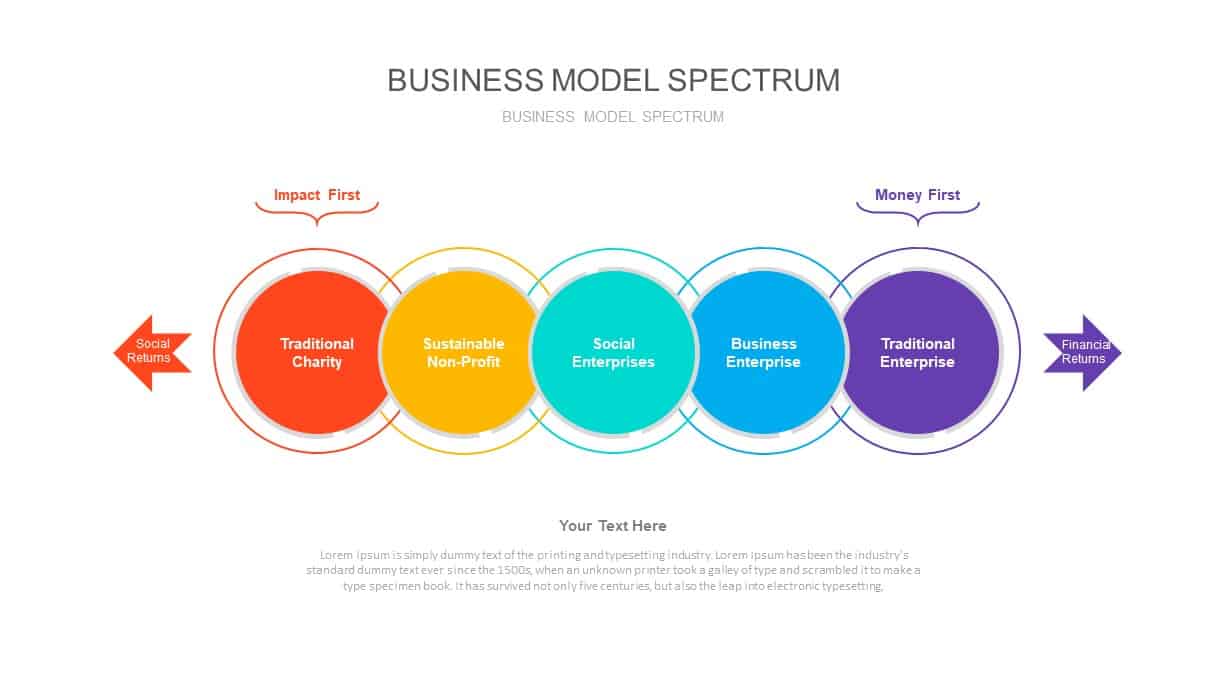
Business Model Spectrum Diagram Pack for PowerPoint & Google Slides
Business Models
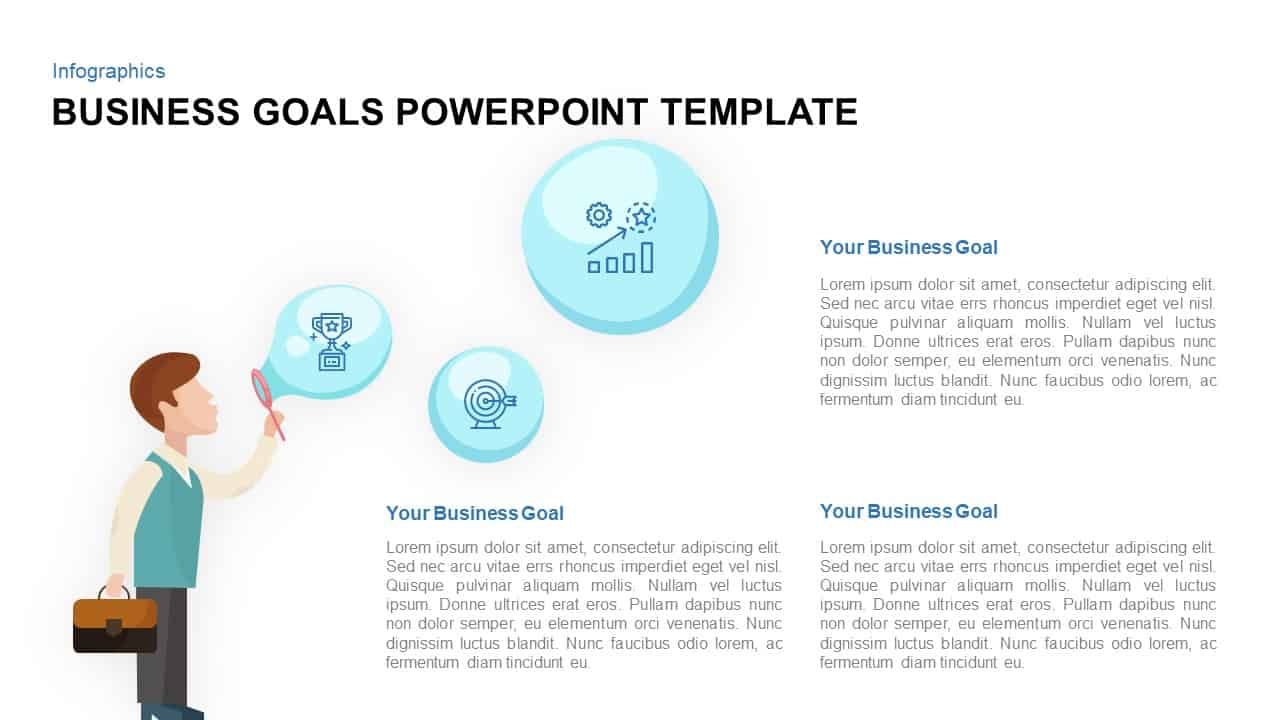
Business Goals Bubble Infographic Template for PowerPoint & Google Slides
Infographics
Five-Step Business Plan Infographic Template for PowerPoint & Google Slides
Business Plan