Speedometer Infographic for PowerPoint & Google Slides

Description
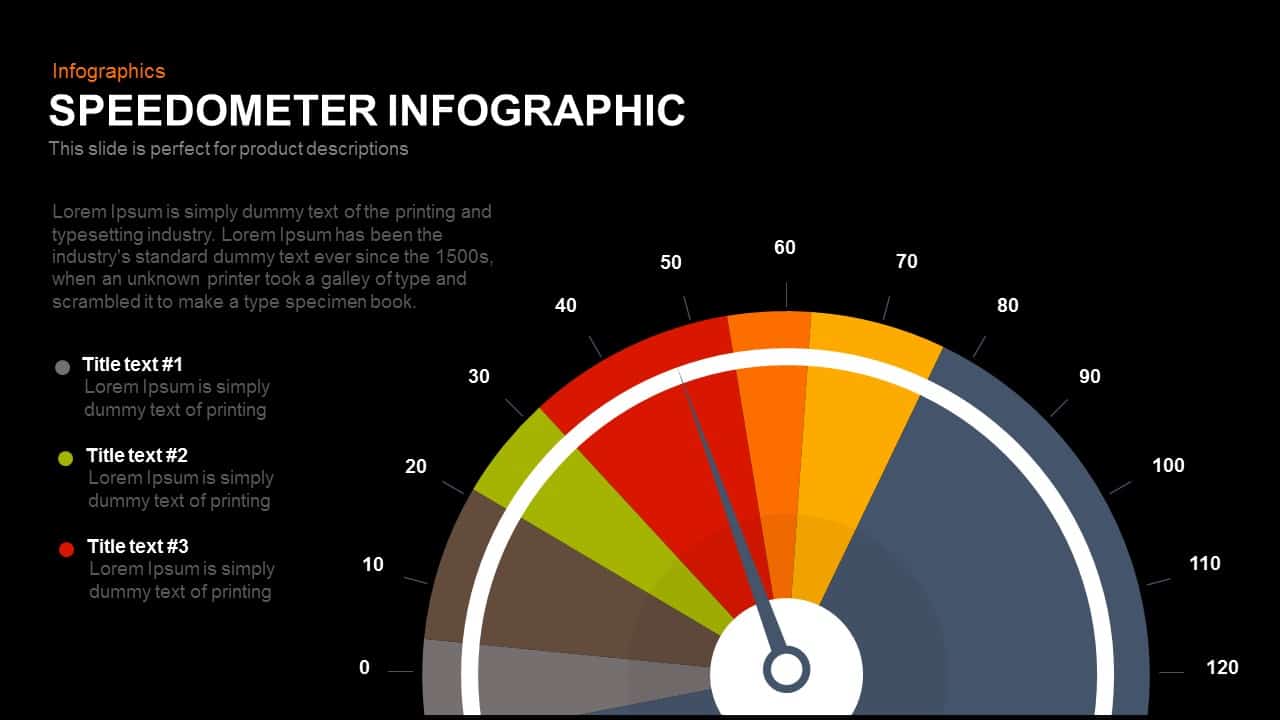
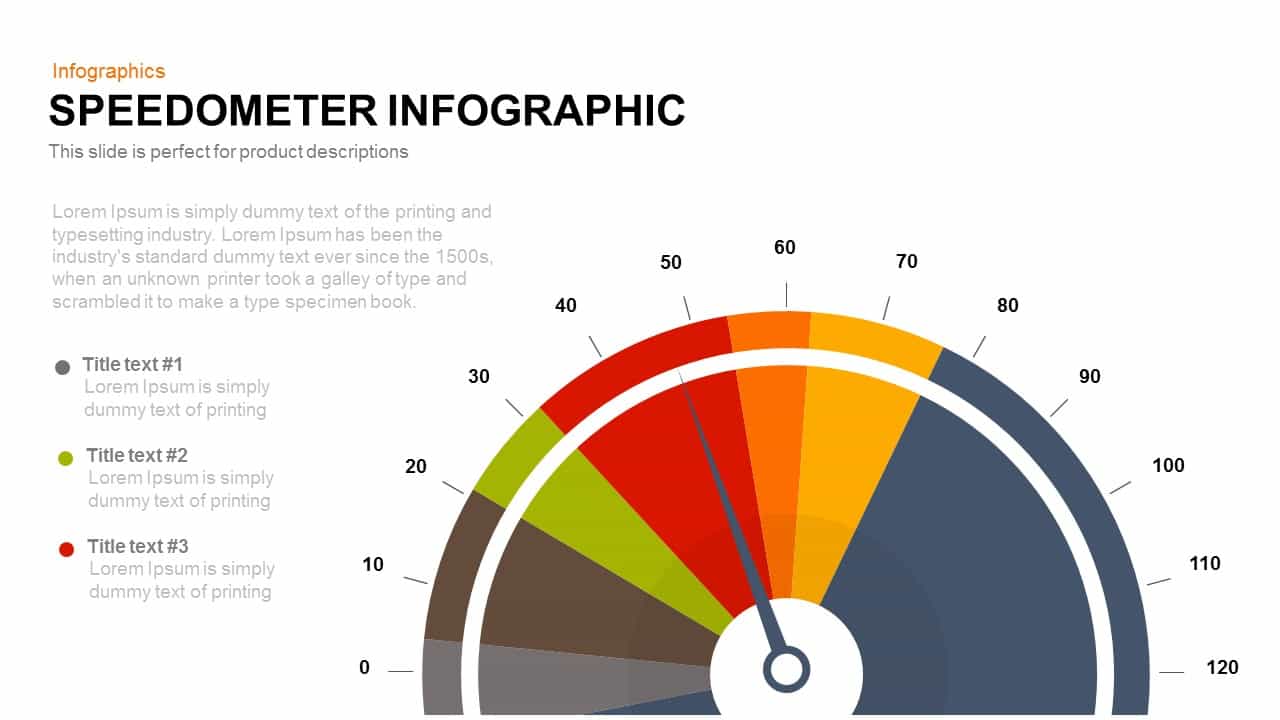
This Speedometer Infographic is an engaging and effective way to represent performance metrics or key data points. With its vibrant color scheme, the infographic uses the classic speedometer design to illustrate a range of values, making it easy for audiences to grasp key statistics or trends at a glance. The dynamic, multi-colored gradient (from gray to red) indicates varying levels of performance, from low to high, which can be customized with your specific data or target goals. This infographic is perfect for showcasing progress, growth, or performance comparisons in a visually striking format.
Who is it for
Ideal for business professionals, project managers, marketers, and financial analysts, this infographic is particularly helpful for presentations involving KPI tracking, sales progress, budget tracking, or performance evaluations. It can be used in quarterly reports, team meetings, and executive briefings, providing a quick visual summary of critical data.
Other Uses
In addition to performance tracking, the speedometer can be adapted to various other metrics, including customer satisfaction, market share growth, or even project completion percentages. Use it to show comparative data, track team goals, or monitor campaign performance. This flexible design can be utilized across industries, from marketing and sales to project management and HR.
Login to download this file

Item ID
SB00388
Related Templates

Speedometer Infographic Gauge Comparison Template for PowerPoint & Google Slides
Comparison
Google Ads Optimization & Performance Infographic Template for PowerPoint & Google Slides
Digital Marketing
SQ3R Study Strategy Infographic Slides Template for PowerPoint & Google Slides
Business Strategy
Six Double Diamond Infographic Slides Template for PowerPoint & Google Slides
Process

Sales Process Infographic Slides Pack Template for PowerPoint & Google Slides
Process
Casino/Poker Chips Infographic Slides template for PowerPoint & Google Slides
Business Strategy
Agenda Infographic Pack of 2 Slides Template for PowerPoint & Google Slides
Agenda
Quad Chart Infographic Pack of 8 Slides Template for PowerPoint & Google Slides
Comparison Chart
Four Options Infographic Slides Template for PowerPoint & Google Slides
Comparison
Game Plan Infographic Slides Pack Template for PowerPoint & Google Slides
Infographics
Teamwork PowerPoint Infographic Template for PowerPoint & Google Slides
Leadership
Kite Infographic PowerPoint Template for PowerPoint & Google Slides
Process
Workflow PowerPoint Process infographic for PowerPoint & Google Slides
Process
Free Infographic Deck PowerPoint Pack for PowerPoint & Google Slides
Infographics
Free
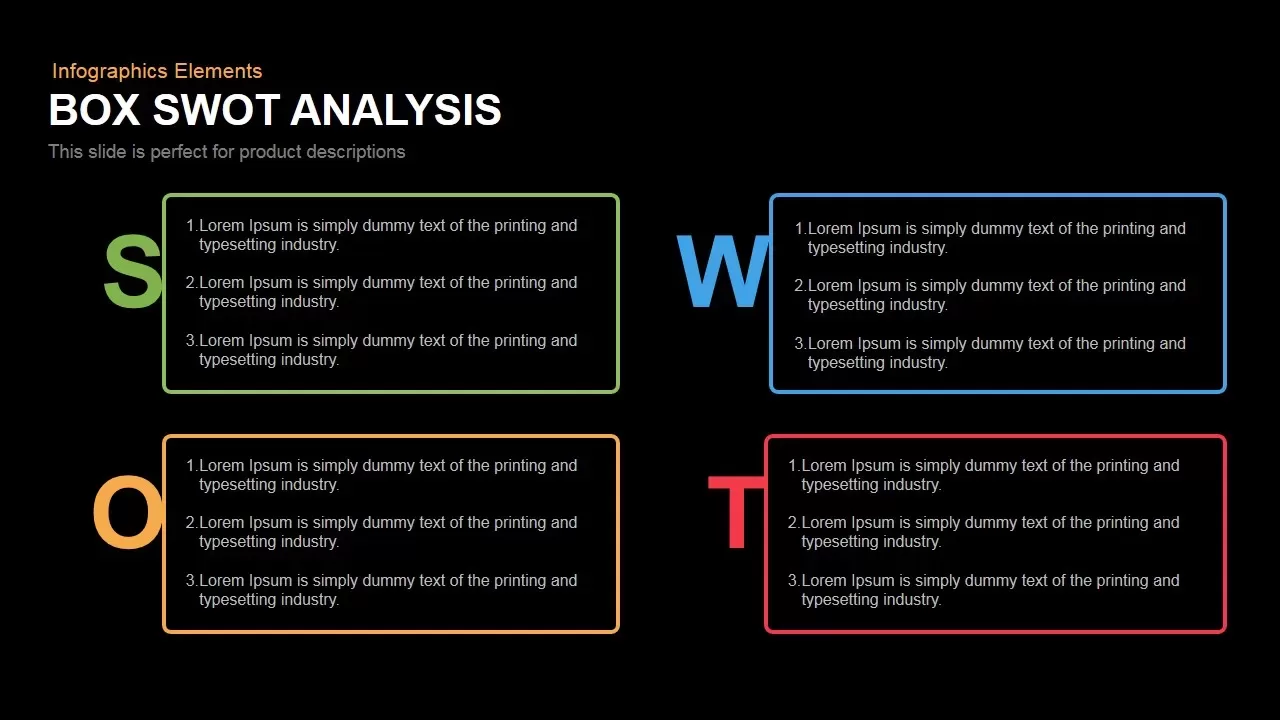
Box SWOT Analysis Infographic Template for PowerPoint & Google Slides
SWOT
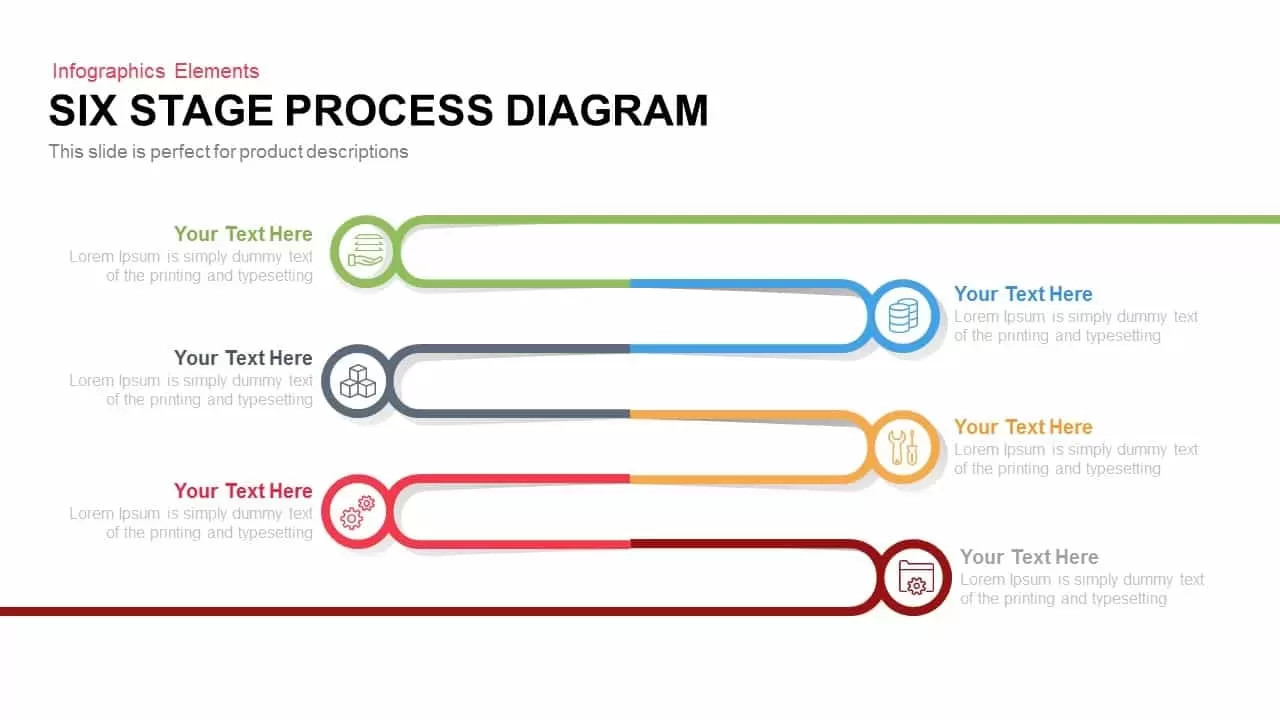
6 Stage Process Diagram Infographic Template for PowerPoint & Google Slides
Process
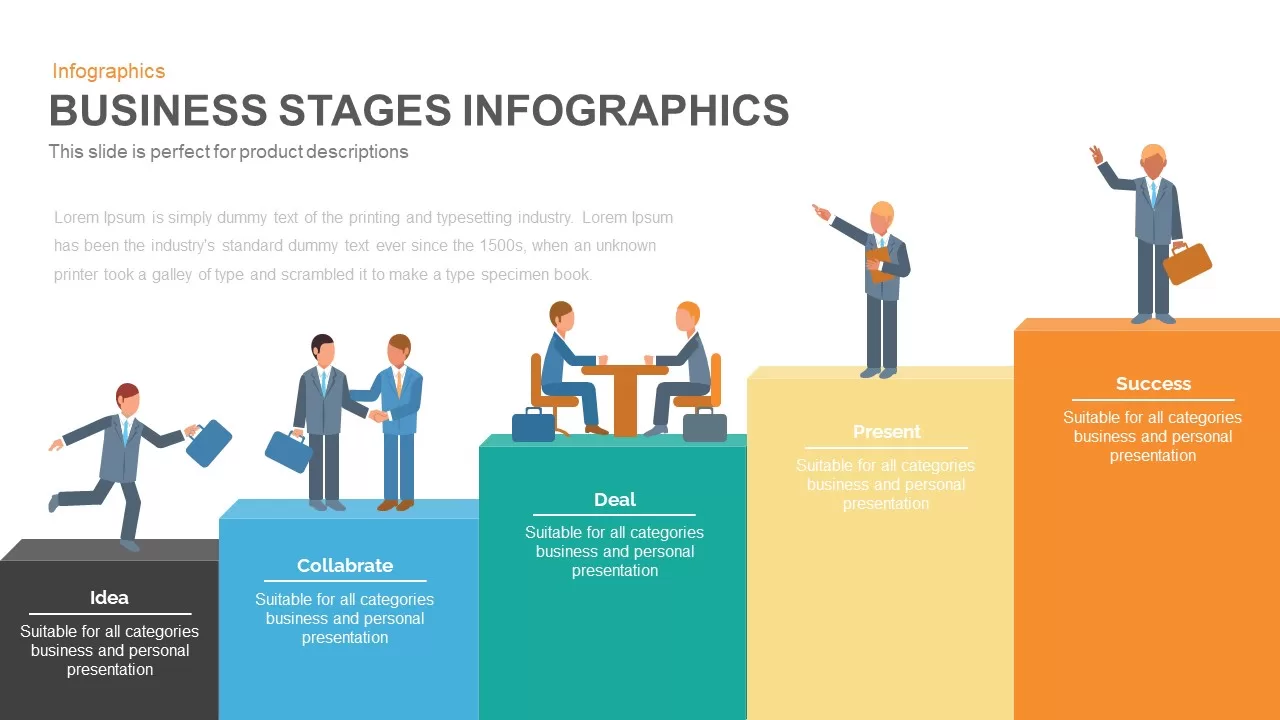
Business Stages Progression Infographic template for PowerPoint & Google Slides
Process
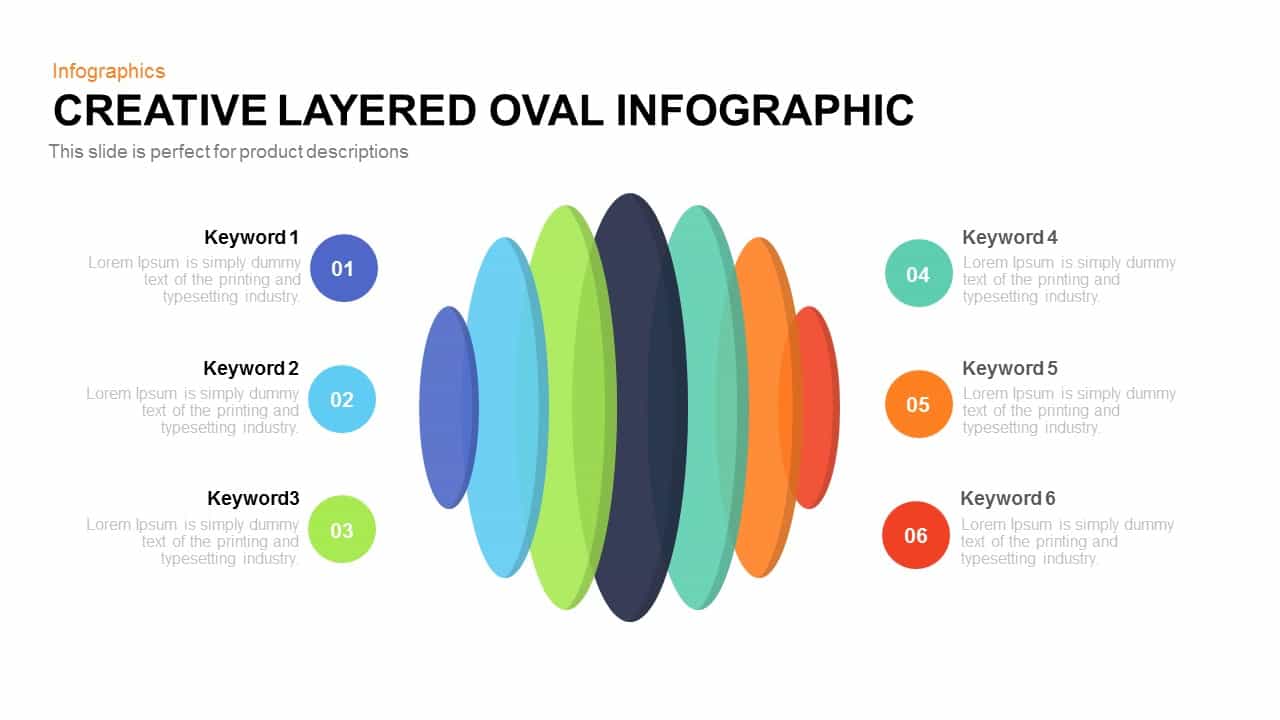
Creative Layered Oval Infographic Diagram Template for PowerPoint & Google Slides
Process
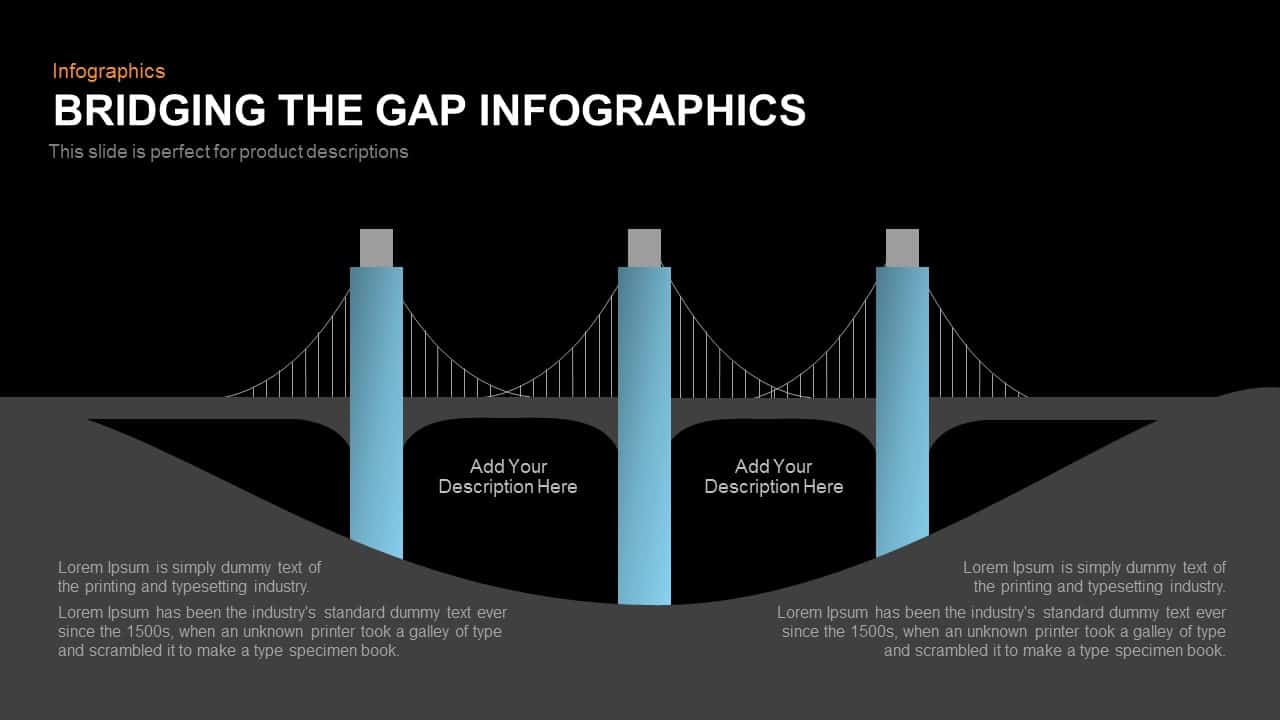
Bridging the Gap Infographic Process template for PowerPoint & Google Slides
Process
Four-Stage Linear Infographic Diagram Template for PowerPoint & Google Slides
Process
Three-Circle Diagram Infographic Template for PowerPoint & Google Slides
Circular
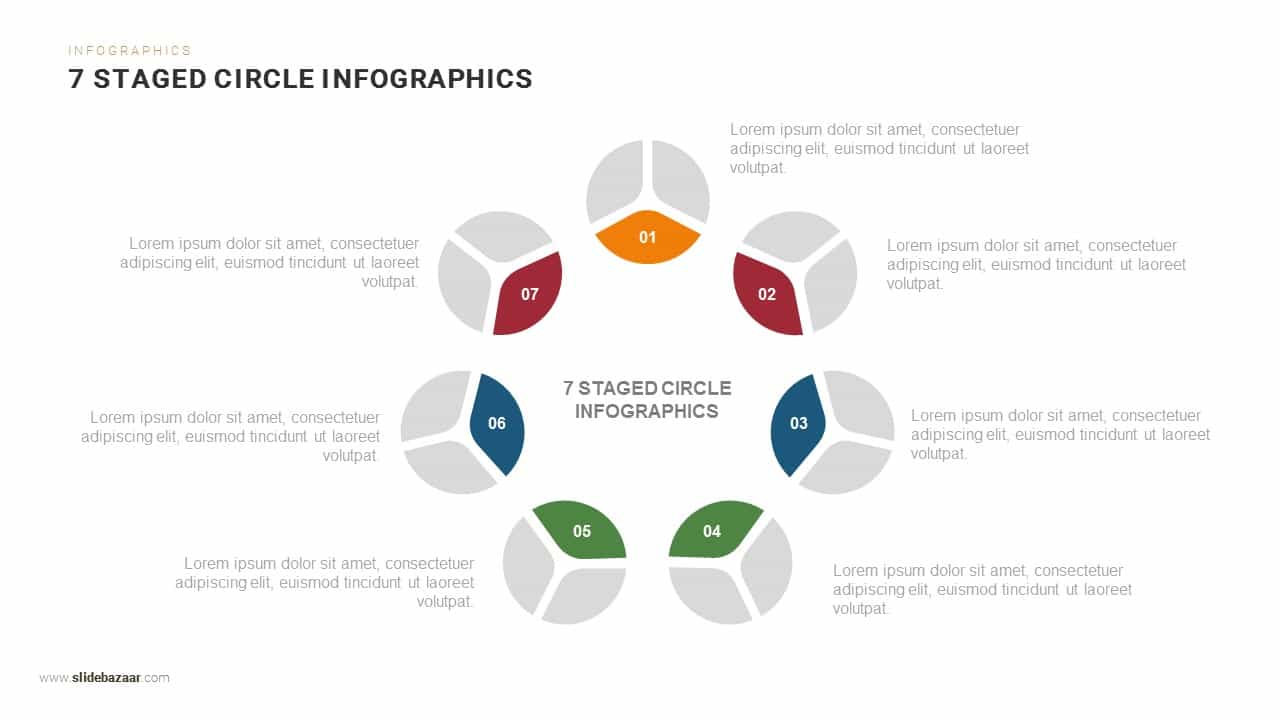
Seven-Stage Circular Infographic Template for PowerPoint & Google Slides
Circular
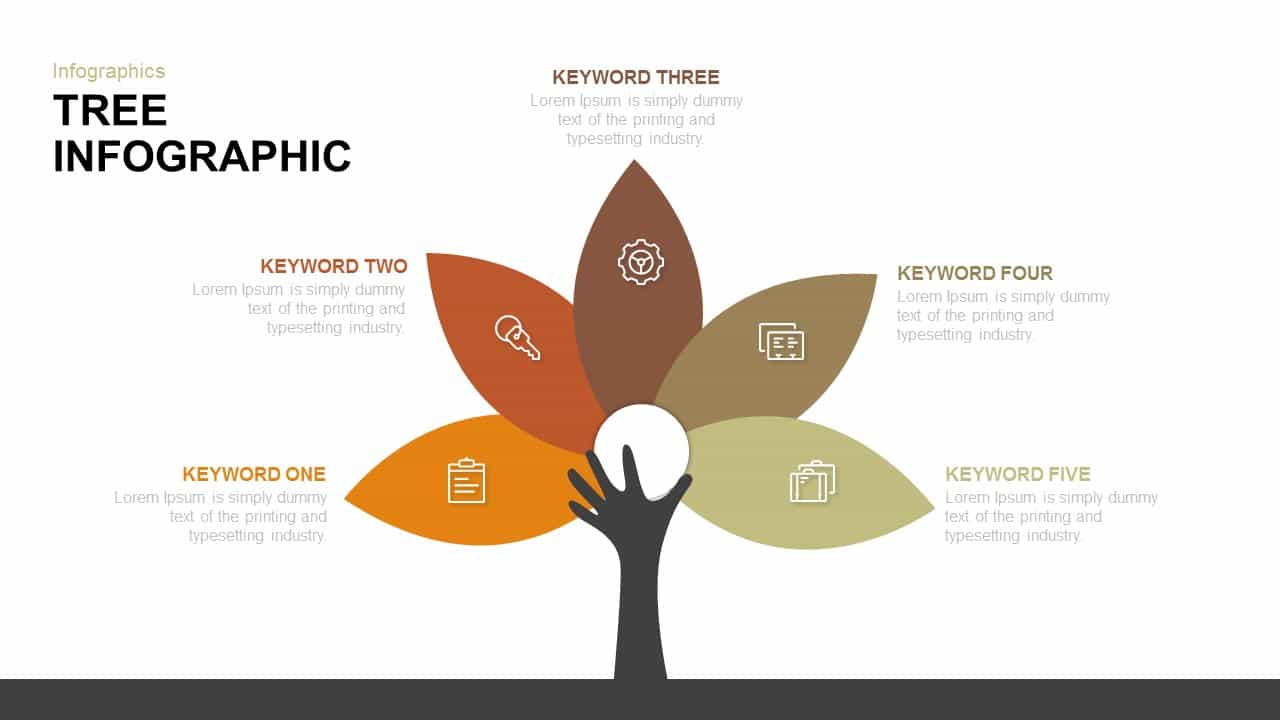
Tree Keyword Petals Infographic Template for PowerPoint & Google Slides
Process
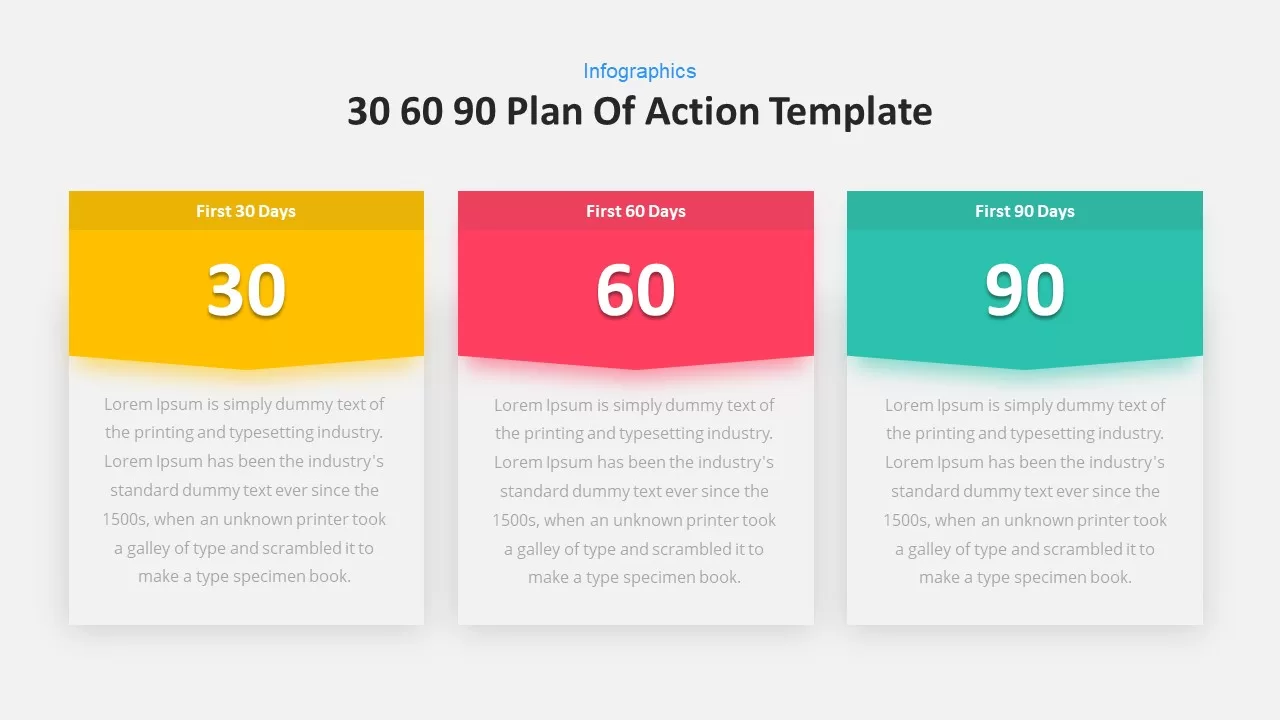
30 60 90-Day Plan Infographic Slide Template for PowerPoint & Google Slides
Business

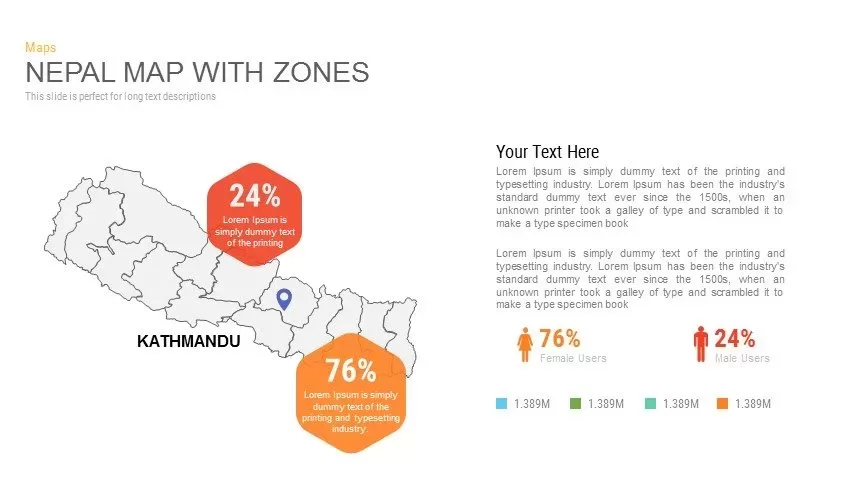
Nepal Map with Zones Infographic Template for PowerPoint & Google Slides
Maps
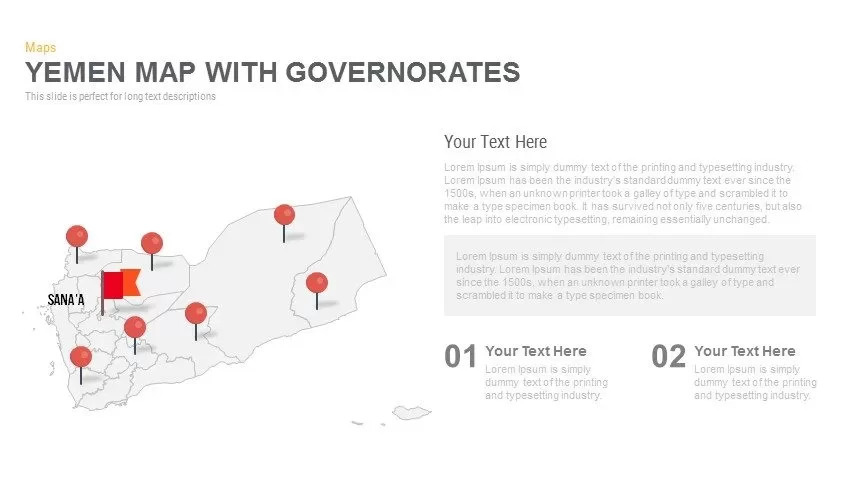
Yemen Governorates Infographic Map Template for PowerPoint & Google Slides
Maps
Four-Section Arrow Infographic Diagram Template for PowerPoint & Google Slides
Arrow
Five-Stage Growth Arrow Infographic Template for PowerPoint & Google Slides
Arrow
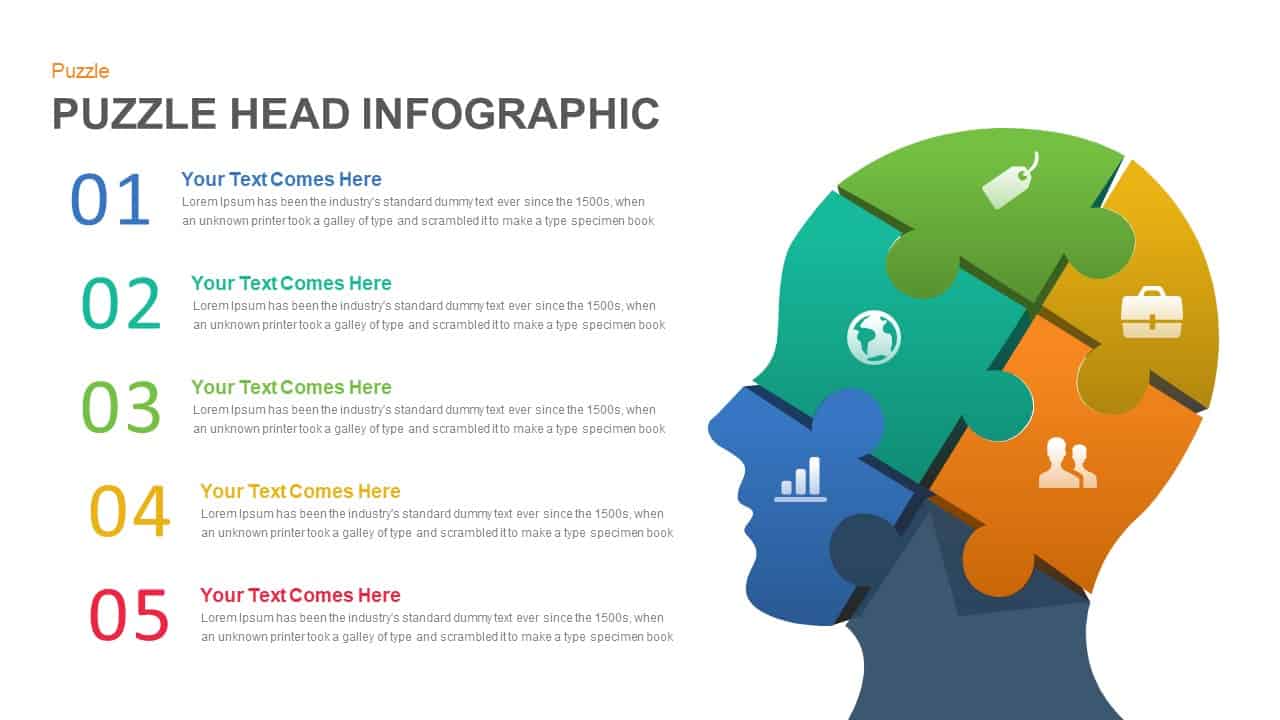
Five-Step Puzzle Head Infographic Template for PowerPoint & Google Slides
Process
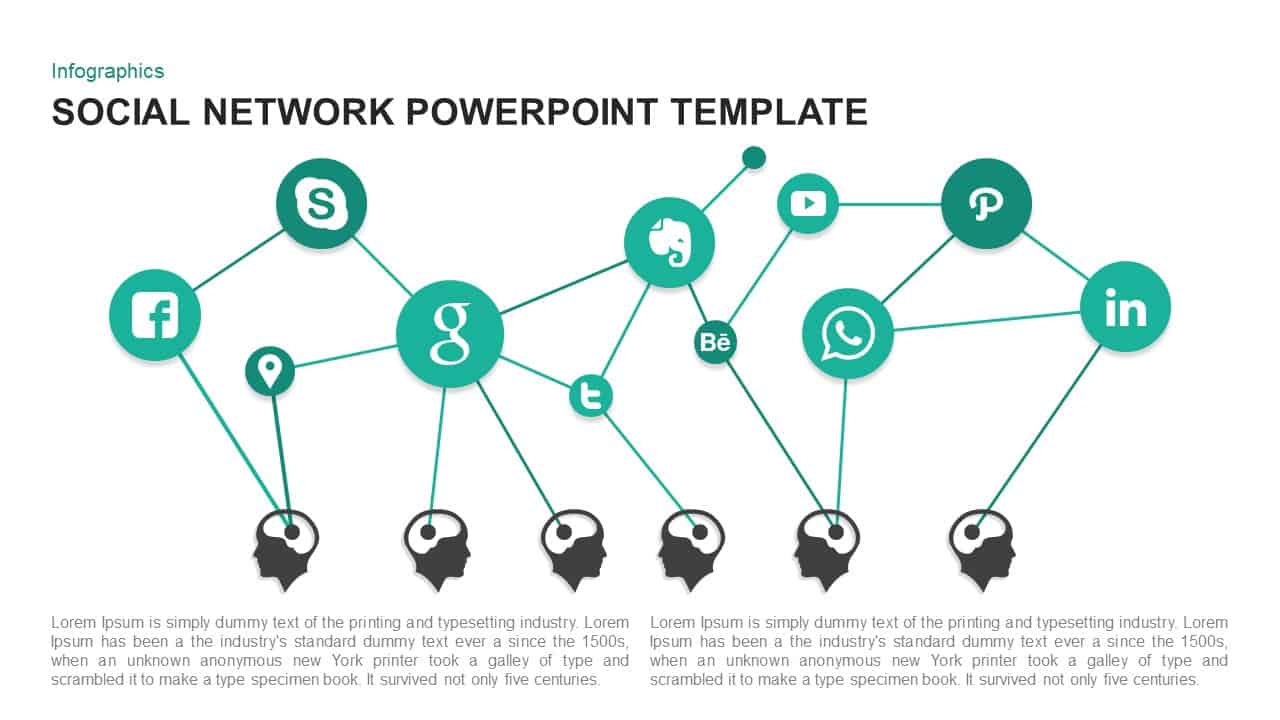
Social Network Infographic Diagram Template for PowerPoint & Google Slides
Digital Marketing
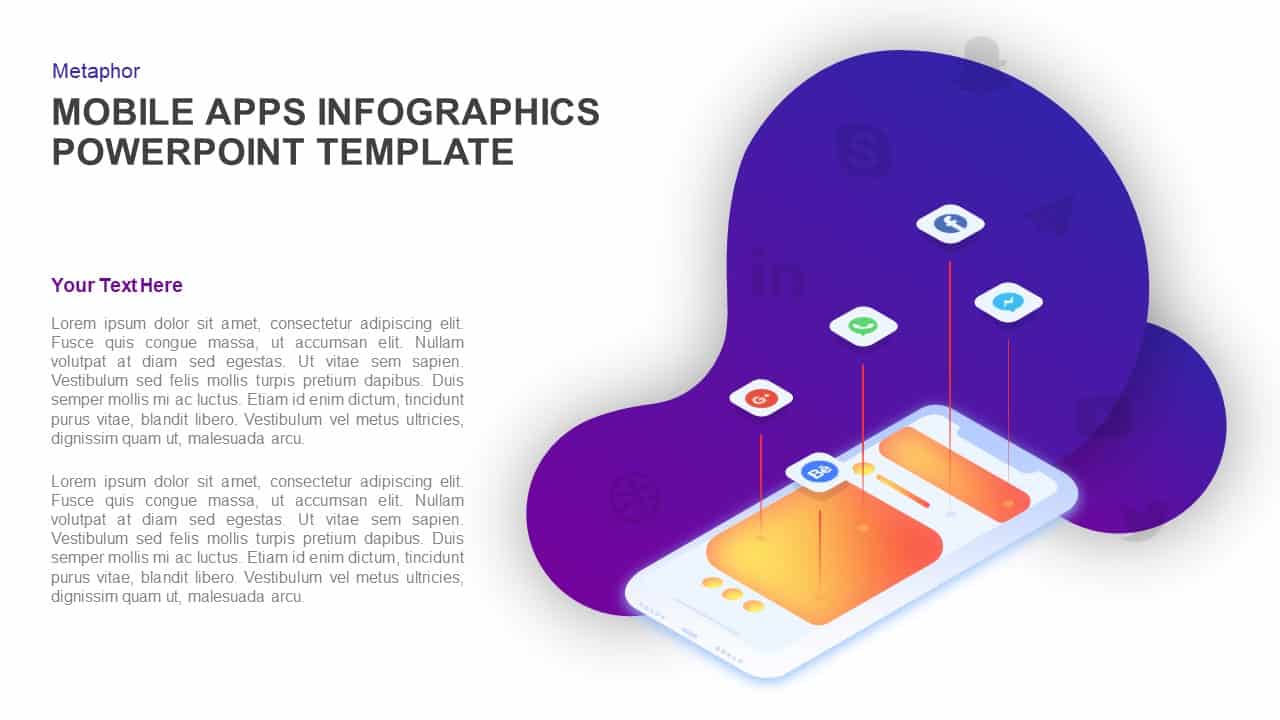
Mobile Apps Infographic Interface Template for PowerPoint & Google Slides
Software Development
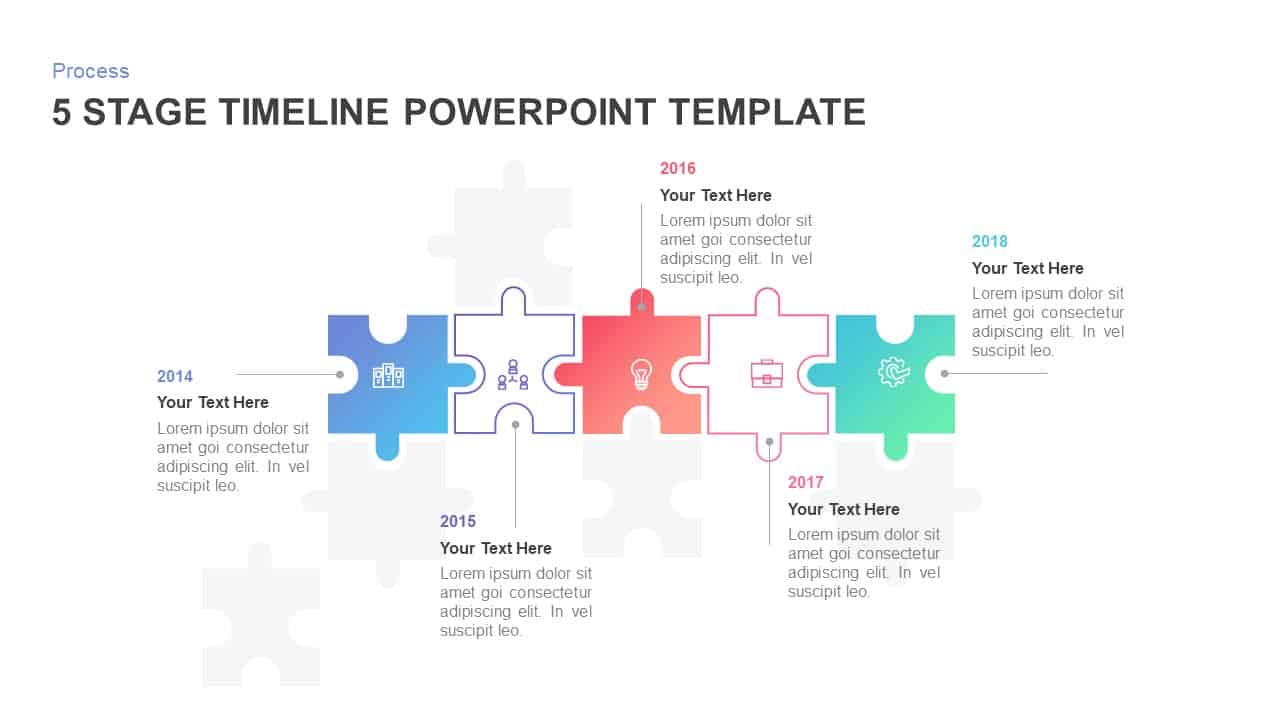
Animated 5-Stage Puzzle Timeline Infographic Template for PowerPoint & Google Slides
Timeline
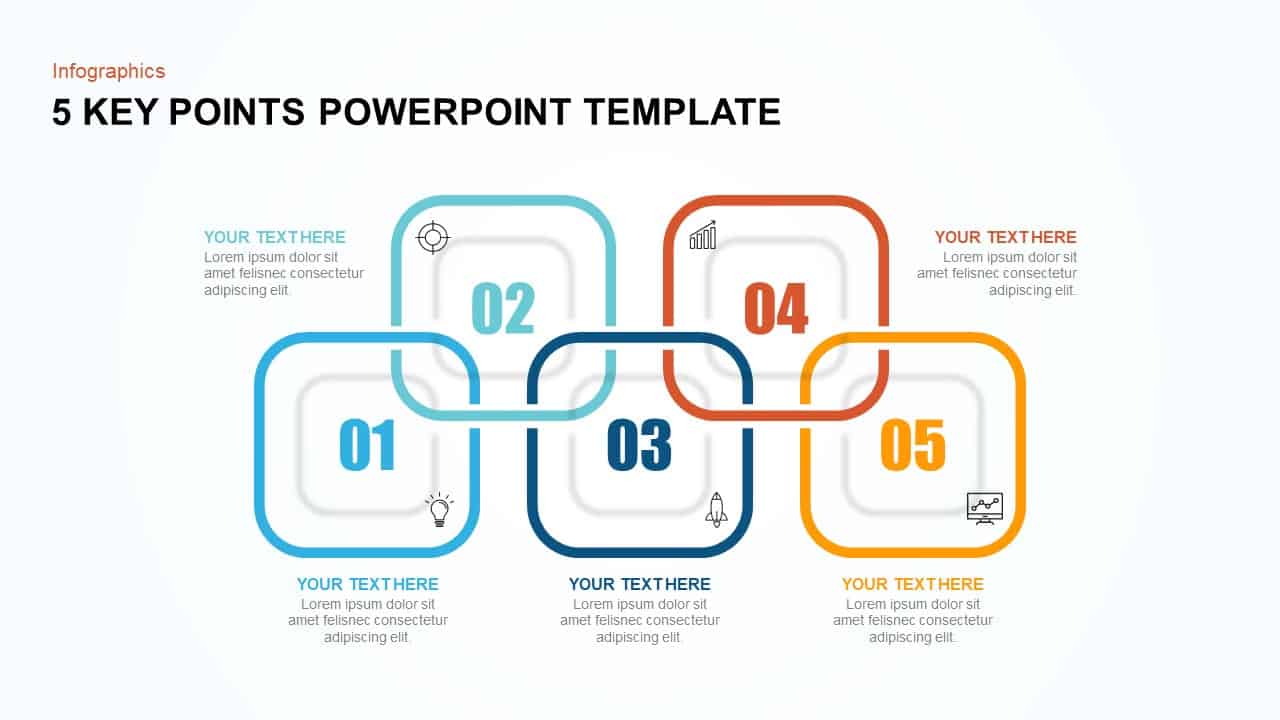
5 Key Points Infographic Diagram Template for PowerPoint & Google Slides
Process
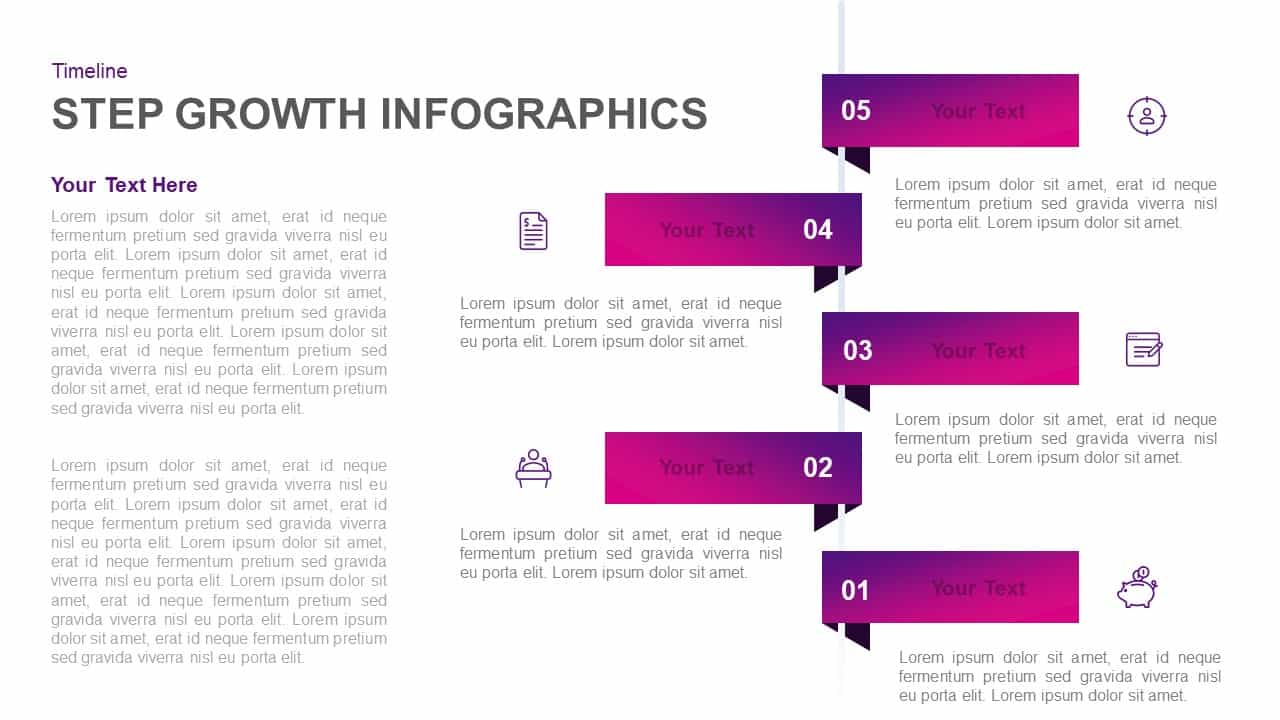
Five-Step Growth Timeline Infographic Template for PowerPoint & Google Slides
Timeline
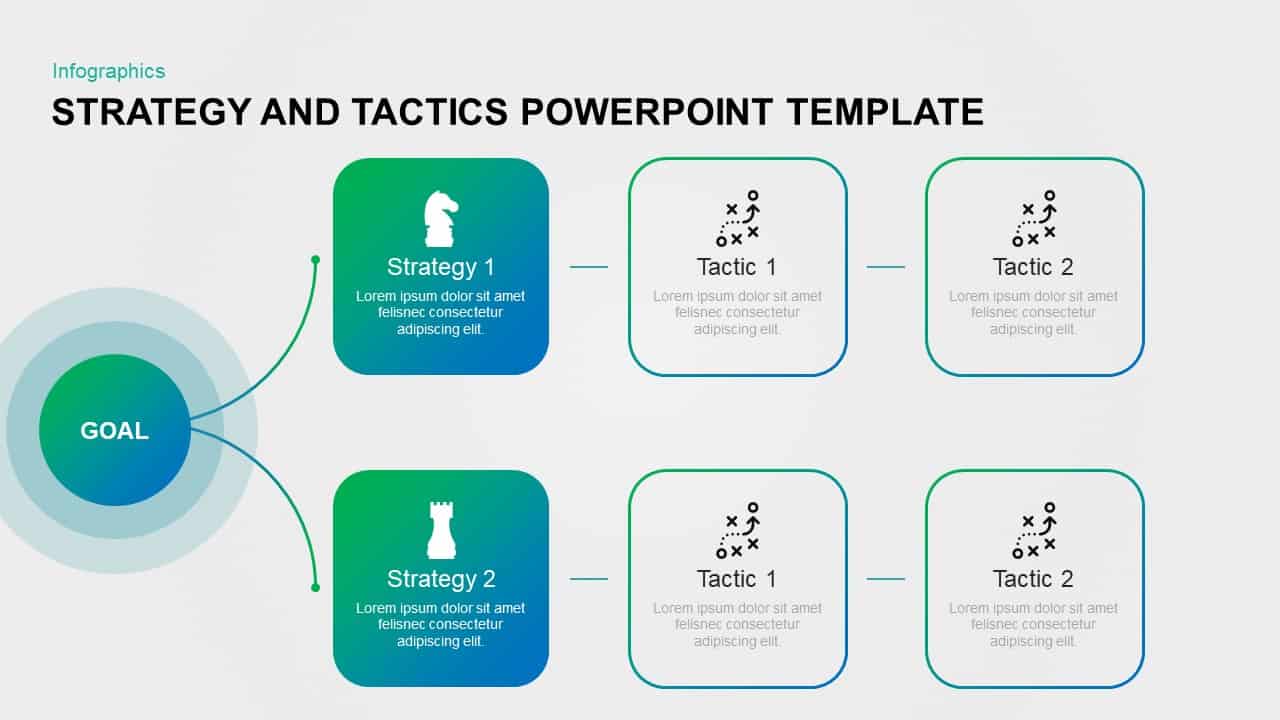
Strategy and Tactics Infographic Template for PowerPoint & Google Slides
Process
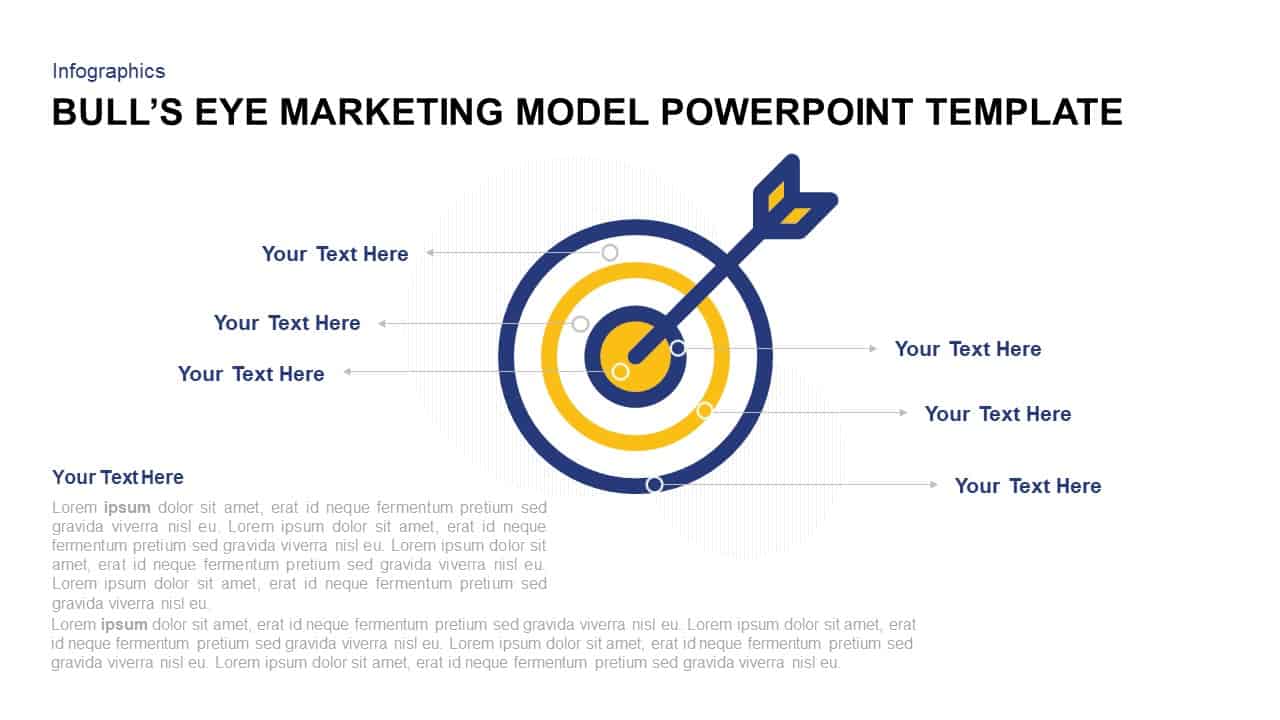
Bull’s Eye Marketing Model Infographic Template for PowerPoint & Google Slides
Circular
Two-Column Comparison Infographic Slide Template for PowerPoint & Google Slides
Comparison
Four-Stage Funnel Diagram Infographic Template for PowerPoint & Google Slides
Funnel
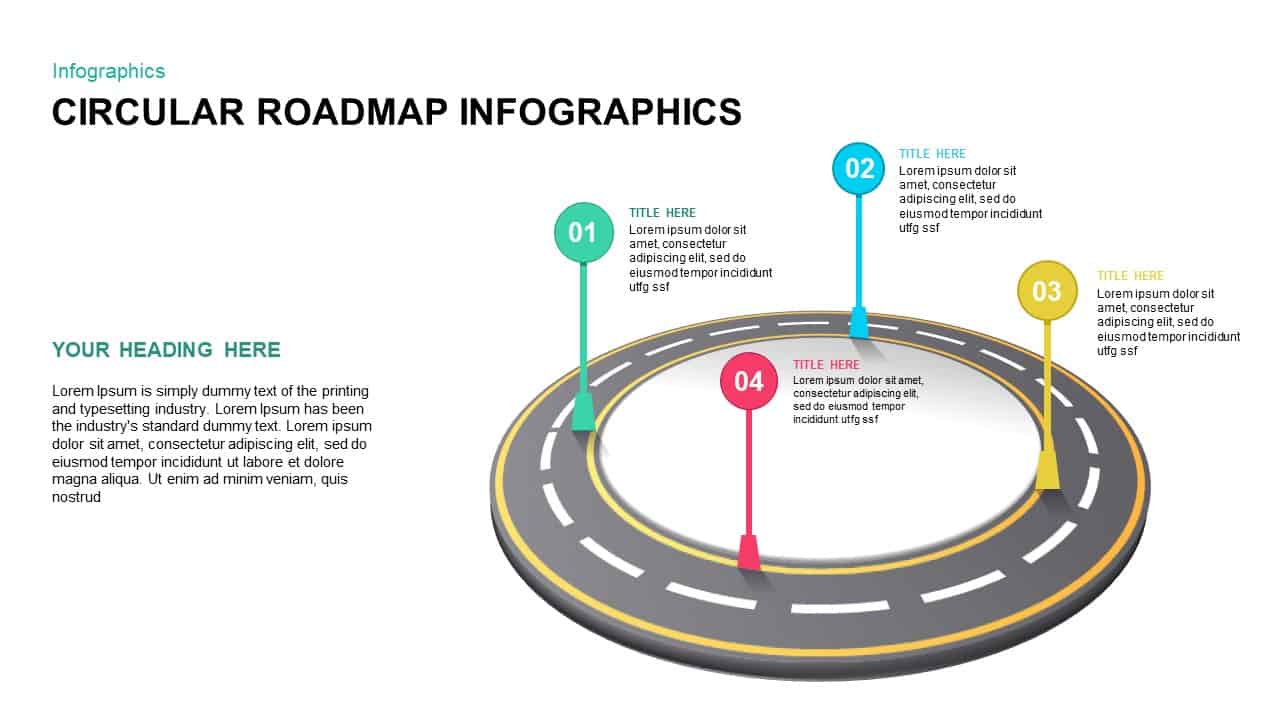
4-Step Circular Roadmap Infographic Template for PowerPoint & Google Slides
Roadmap
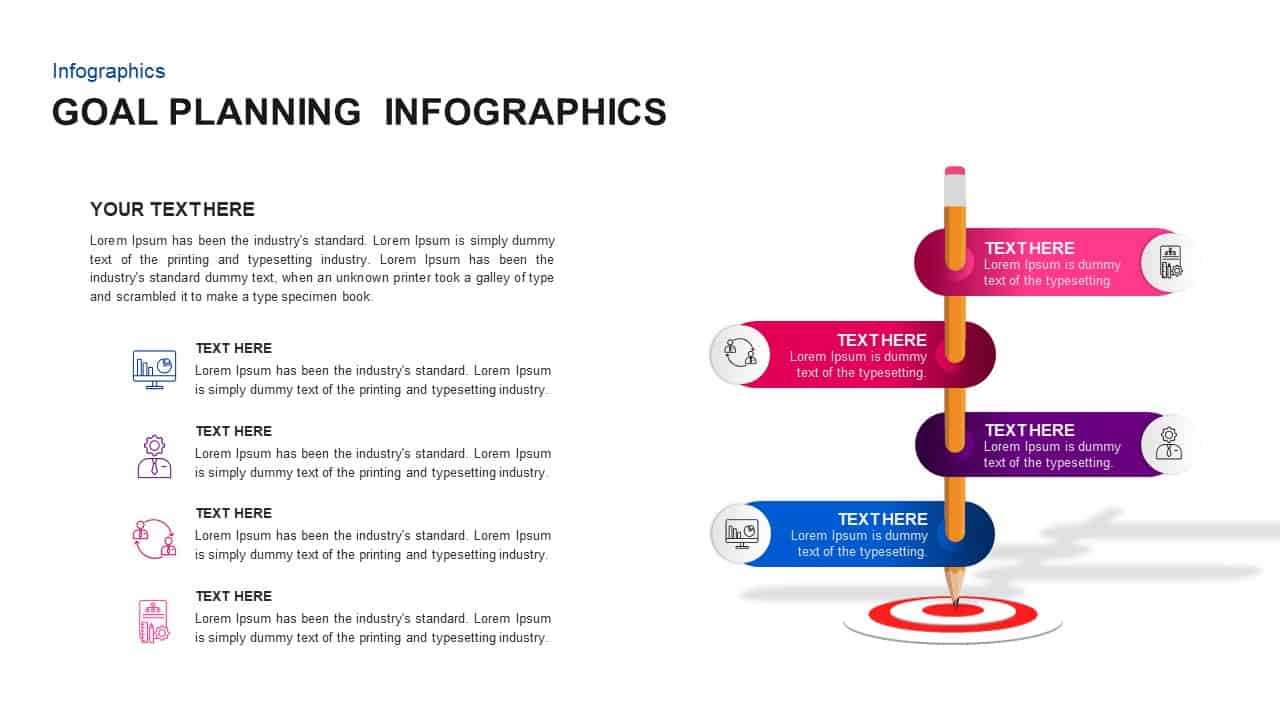
Goal Planning Ribbon Process Infographic Template for PowerPoint & Google Slides
Goals
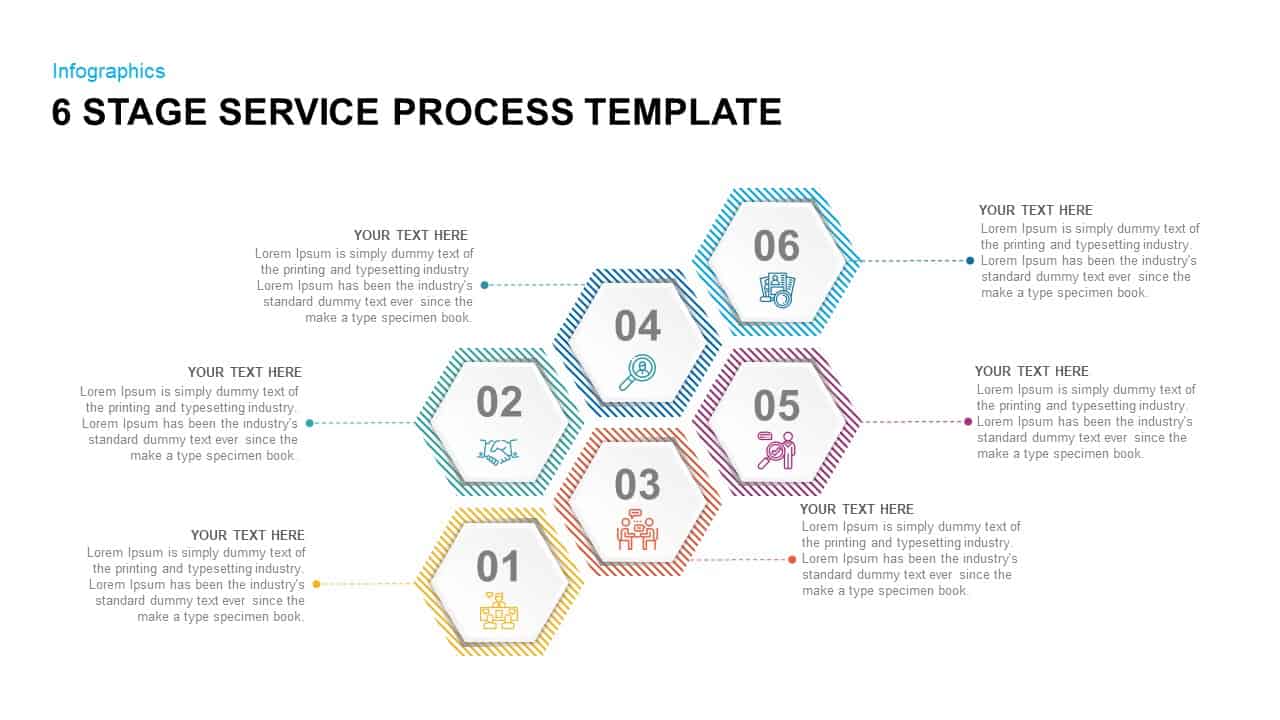
6 Stage Service Process Infographic Template for PowerPoint & Google Slides
Process
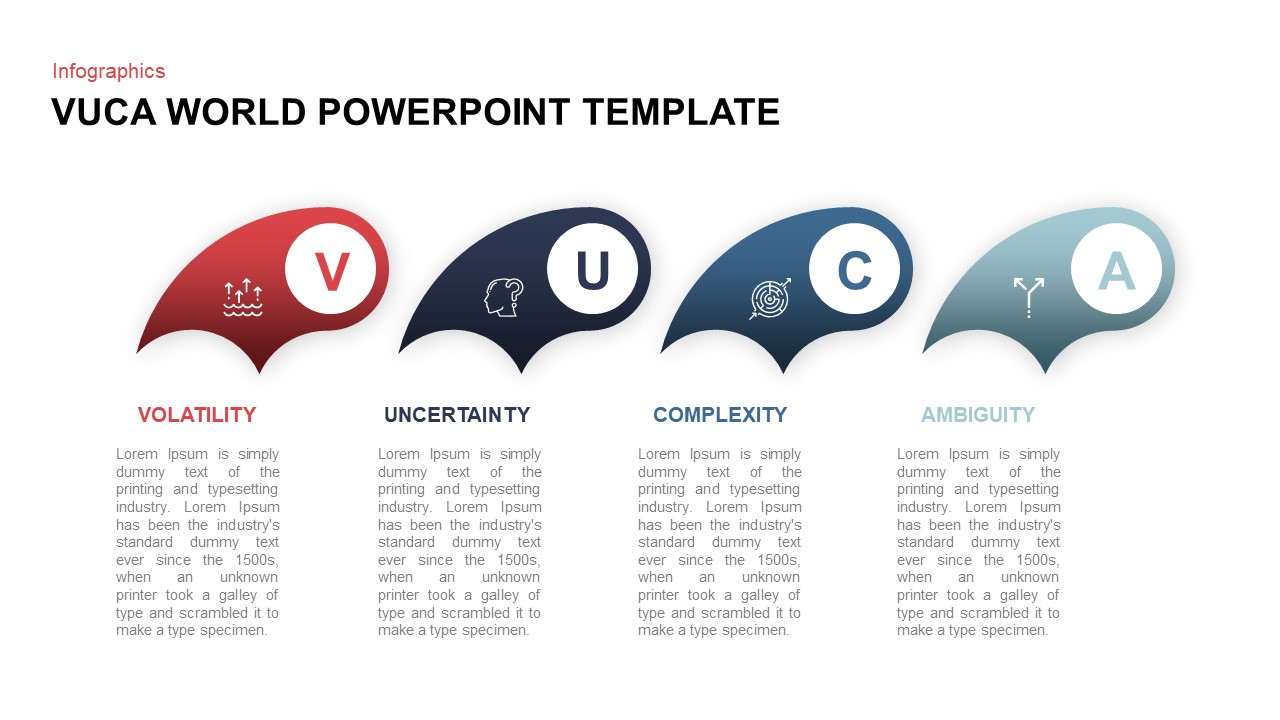
VUCA World Infographic Presentation Template for PowerPoint & Google Slides
Pitch Deck

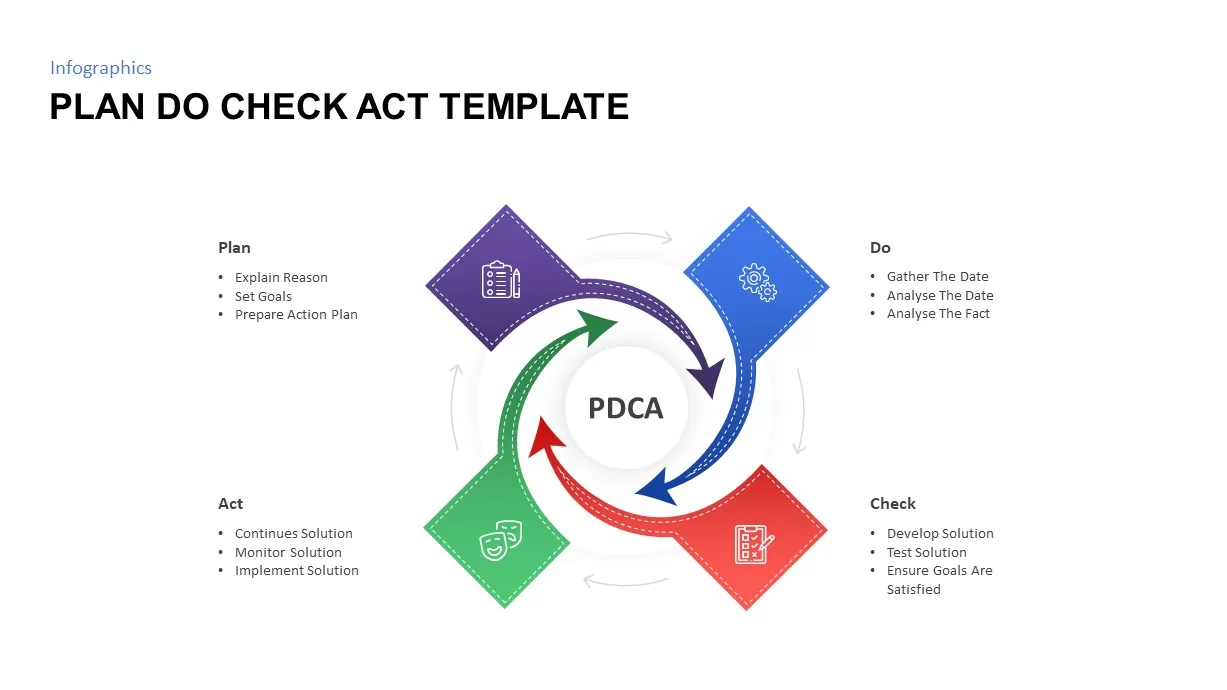
Plan Do Check Act PDCA Cycle Infographic Template for PowerPoint & Google Slides
Process
3, 4, 5 Step Infographic Template for PowerPoint & Google Slides
Business Proposal
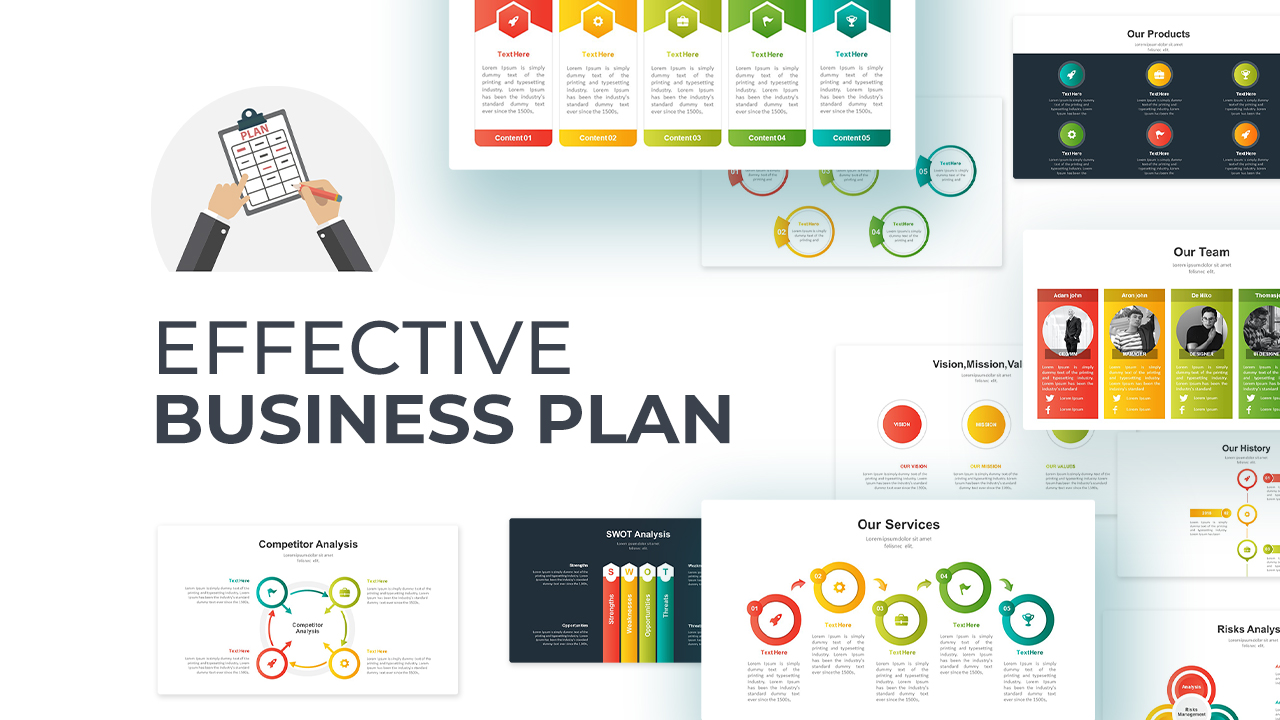
Effective Business Plan Infographic Template for PowerPoint & Google Slides
Pitch Deck
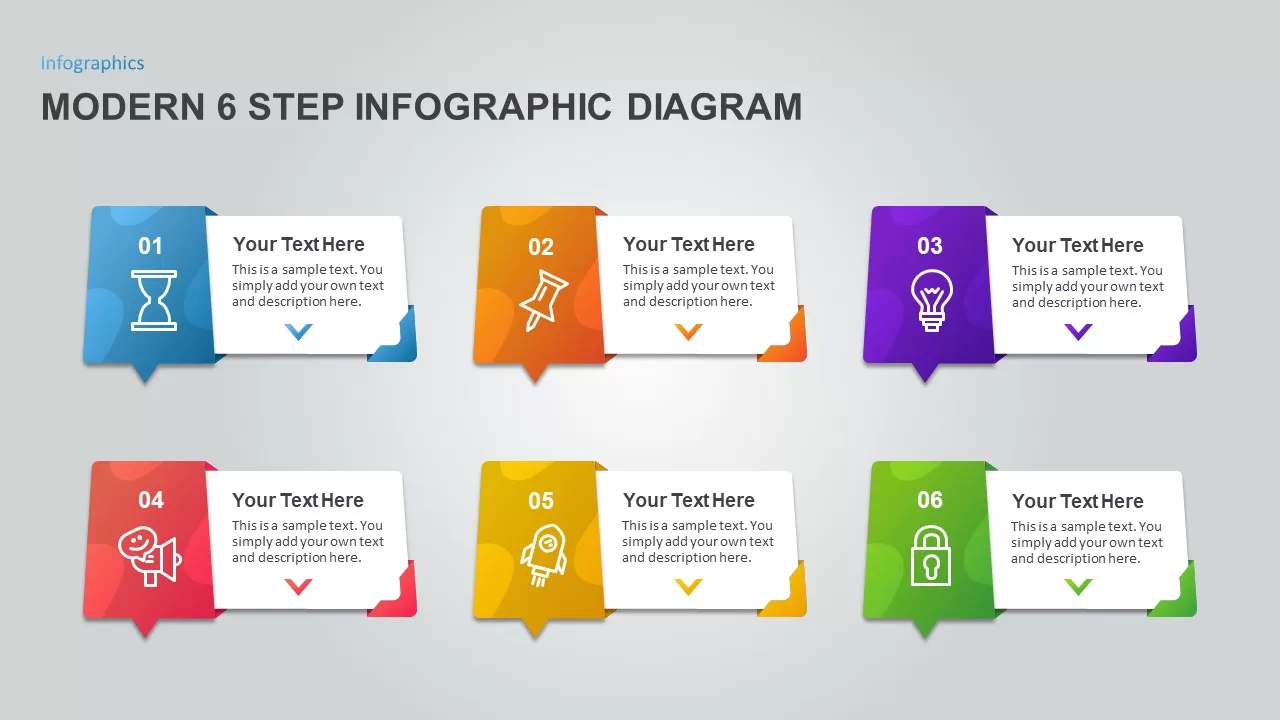
Modern 6 Step Infographic Diagram template for PowerPoint & Google Slides
Process
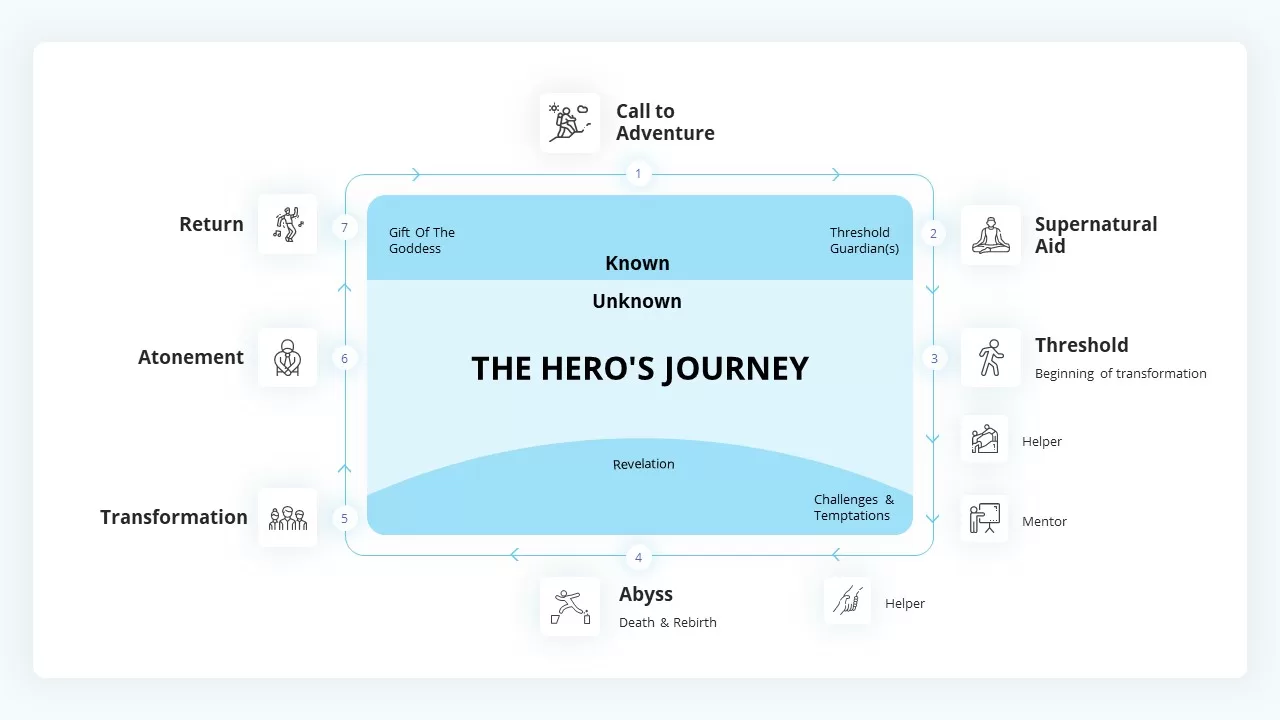
The Hero’s Journey Infographic Framework Template for PowerPoint & Google Slides
Customer Journey
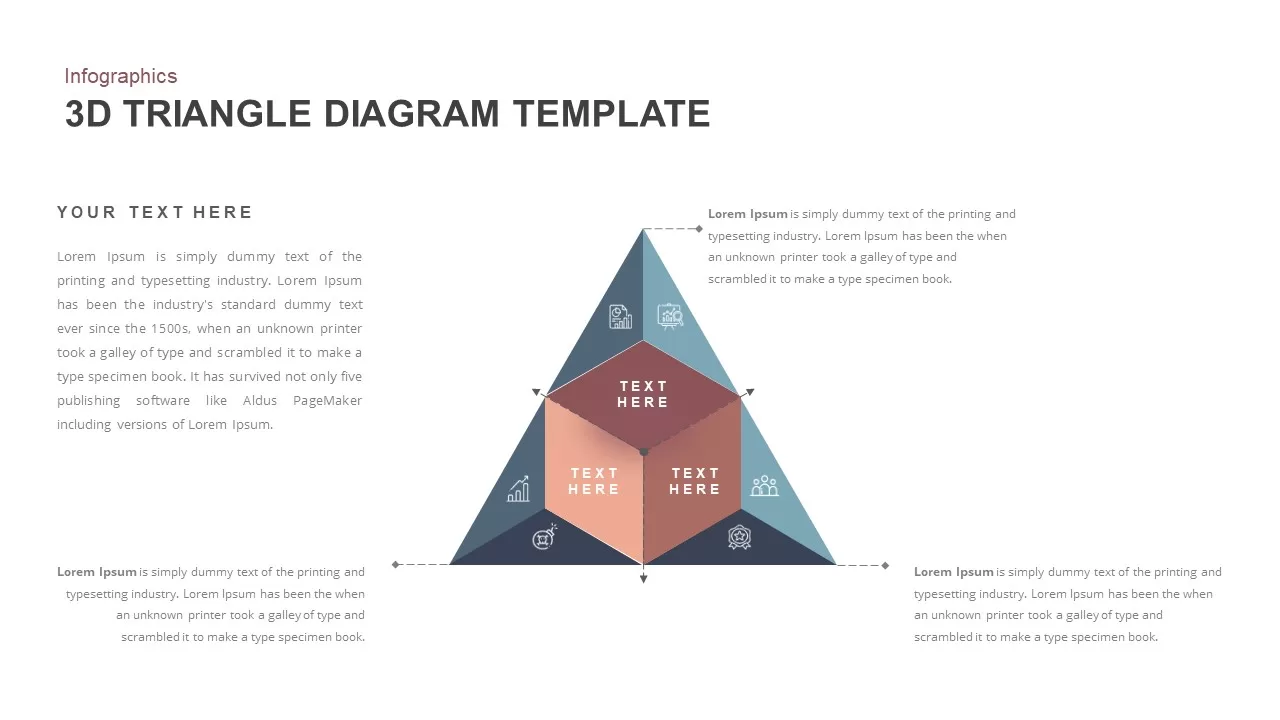
3D Triangle Diagram Infographic Template for PowerPoint & Google Slides
Pyramid
Upward Arrow infographic template for PowerPoint & Google Slides
Infographics
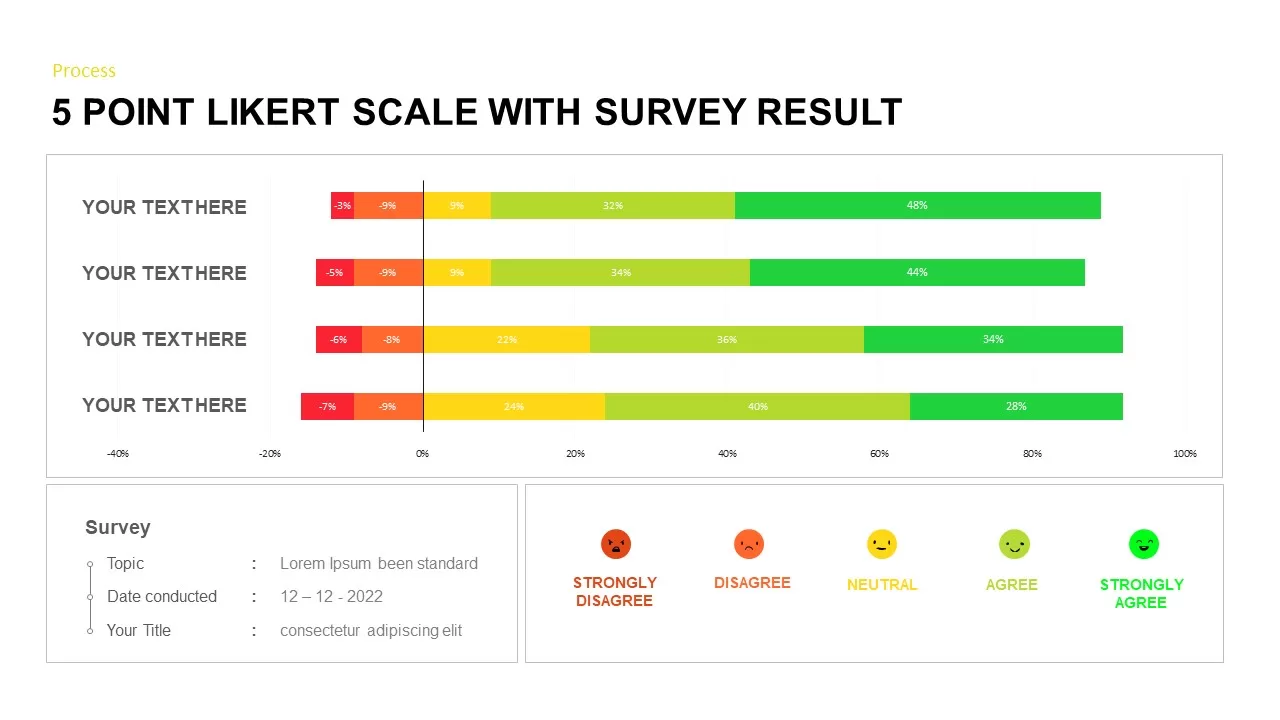
Likert Scale Survey Results infographic pack for PowerPoint & Google Slides
Business
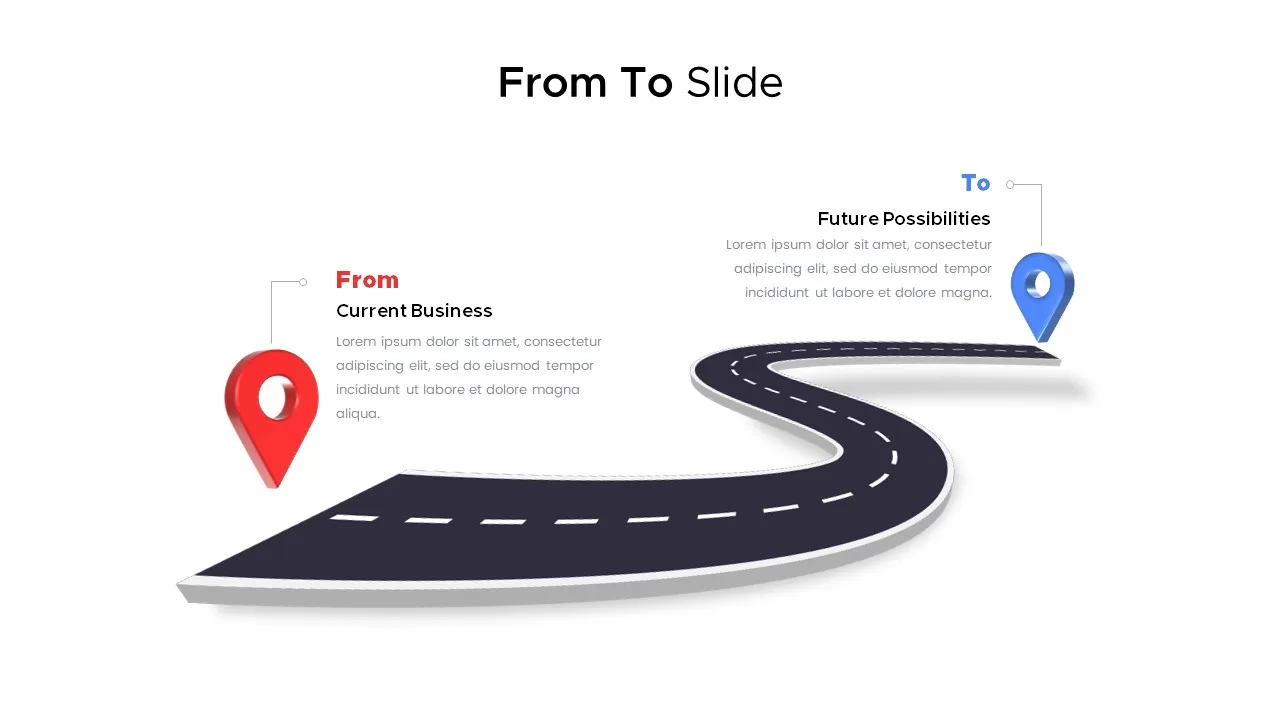
From To infographic pack for PowerPoint & Google Slides
Business Plan
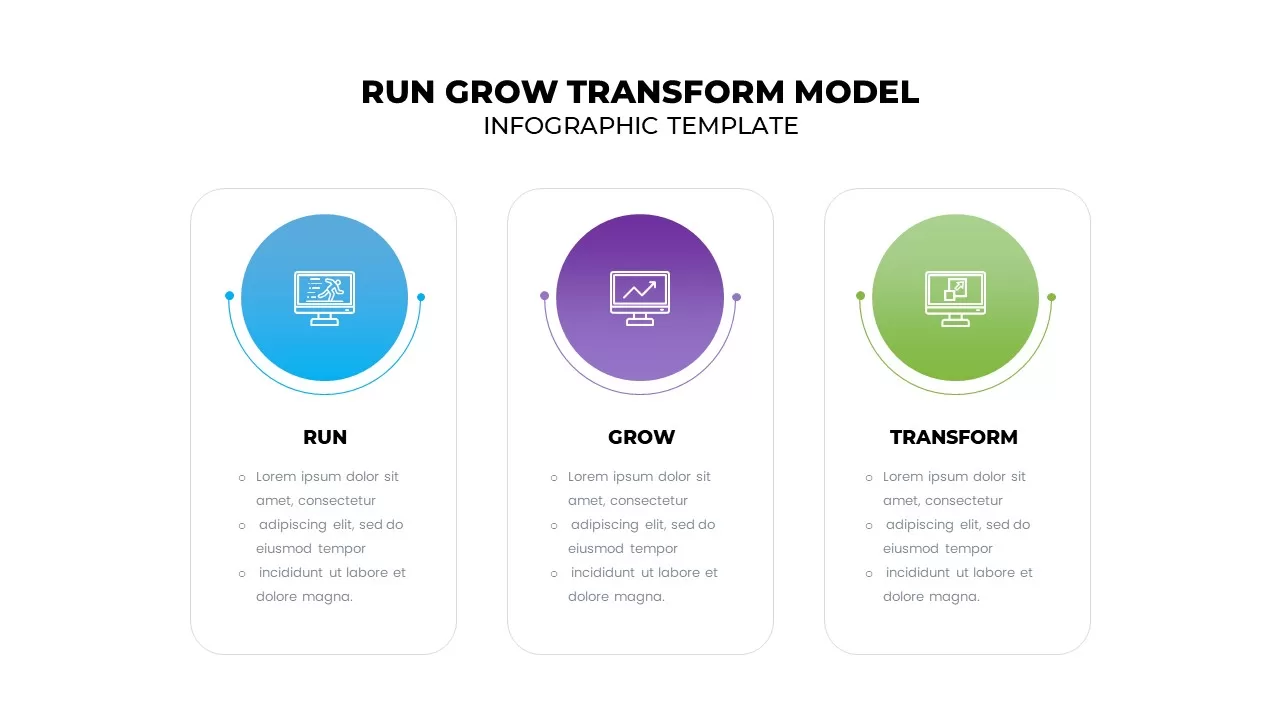
Run Grow Transform Model Infographic Template for PowerPoint & Google Slides
Business
30-60-90 Day Donut Chart Plan Infographic Template for PowerPoint & Google Slides
Timeline
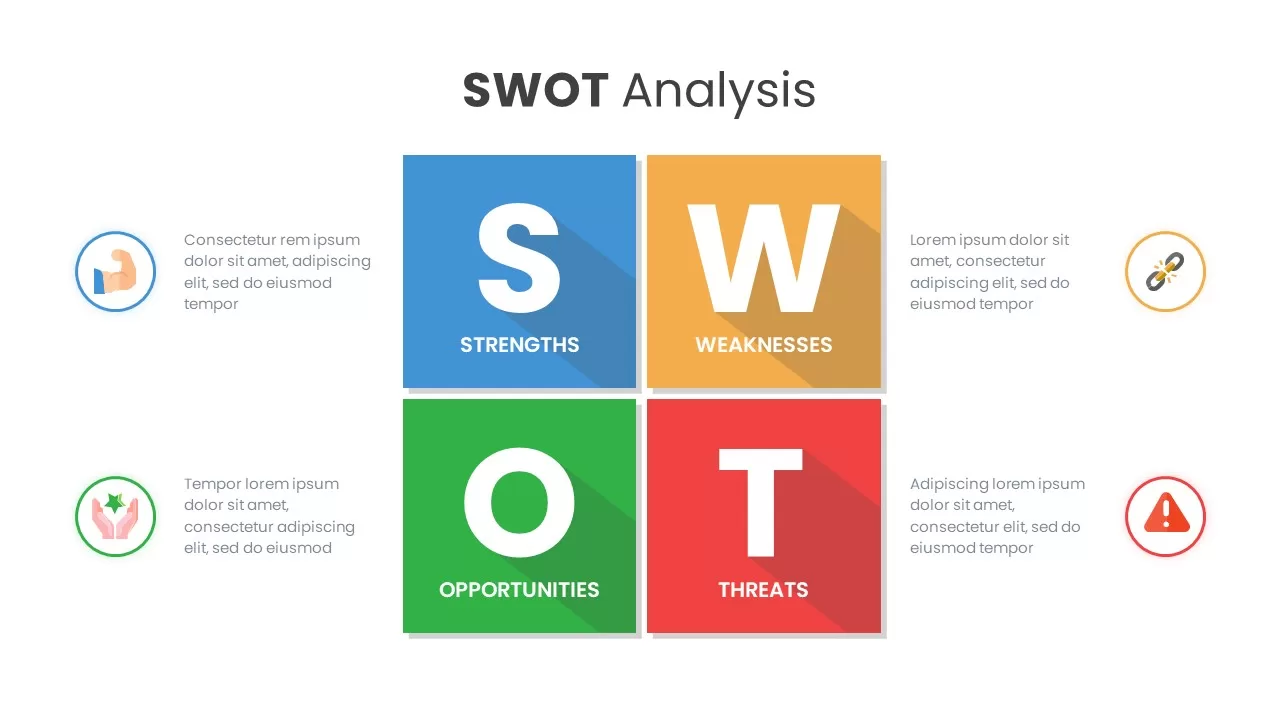
SWOT Analysis Grid Infographic Template for PowerPoint & Google Slides
SWOT
Editable World Map Callout Infographic Template for PowerPoint & Google Slides
World Maps
Editable World Map Callout Infographic Template for PowerPoint & Google Slides
World Maps
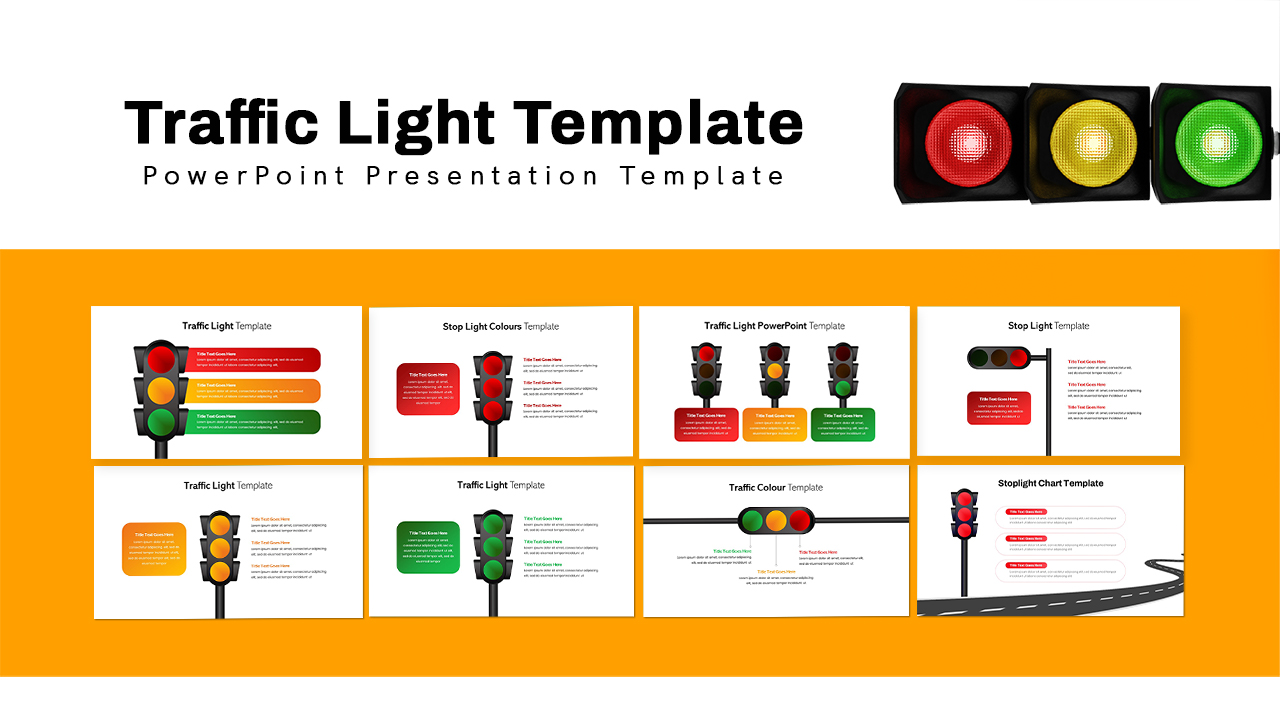
Traffic Light Infographic Pack Template for PowerPoint & Google Slides
Pitch Deck
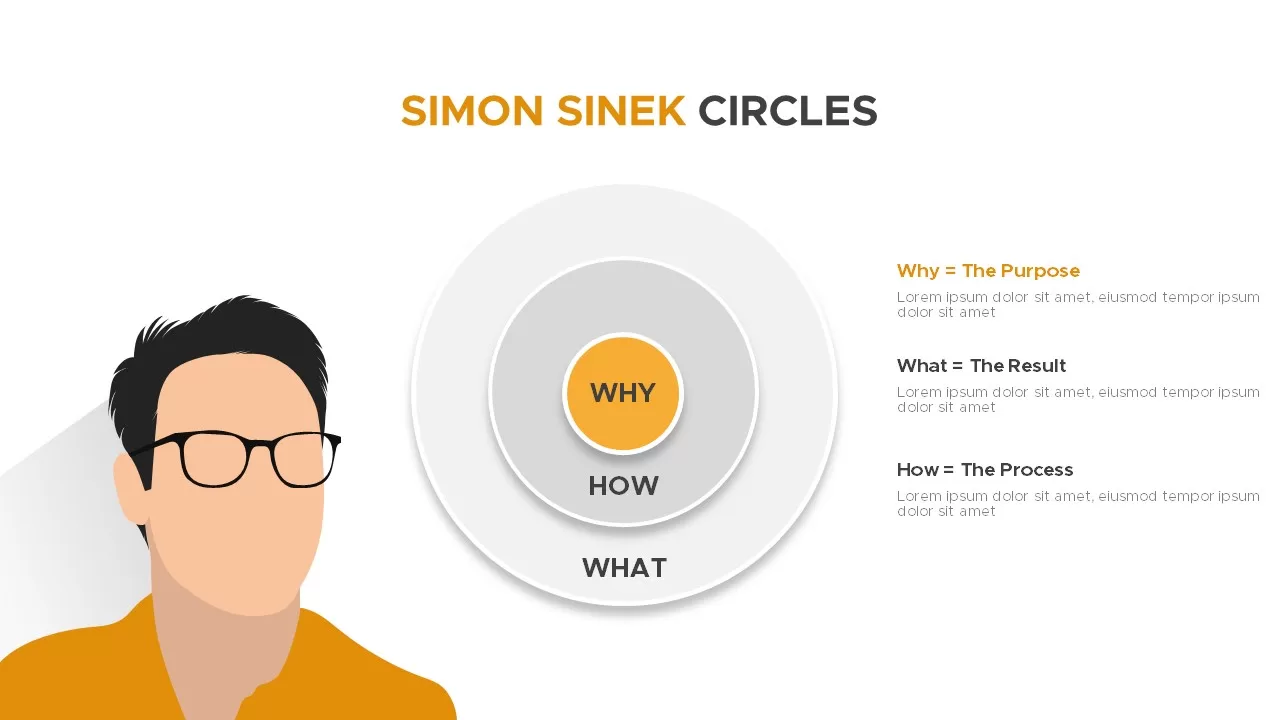
Simon Sinek Circles Model Infographic template for PowerPoint & Google Slides
Business Strategy
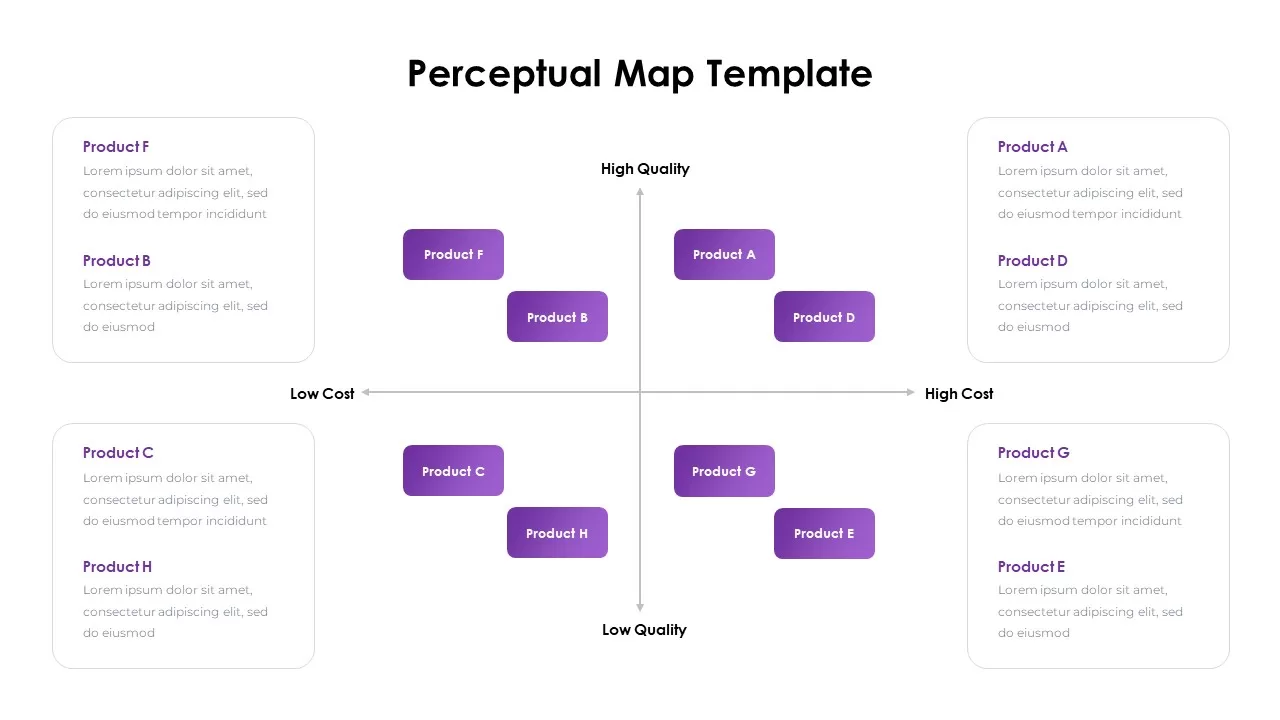
Perceptual Map infographic for PowerPoint & Google Slides
Competitor Analysis
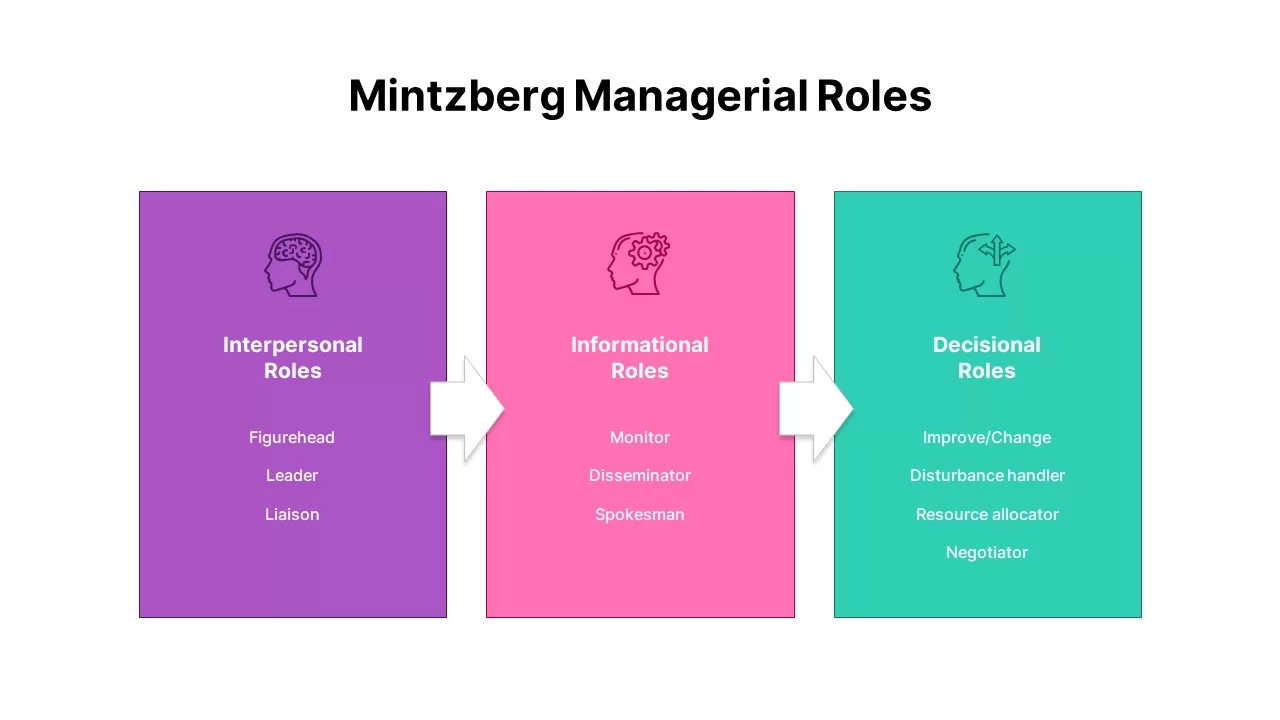
Mintzberg Managerial Roles Infographic Template for PowerPoint & Google Slides
Comparison Chart
Data-driven GDP Growth Infographic Pack Template for PowerPoint & Google Slides
Infographics
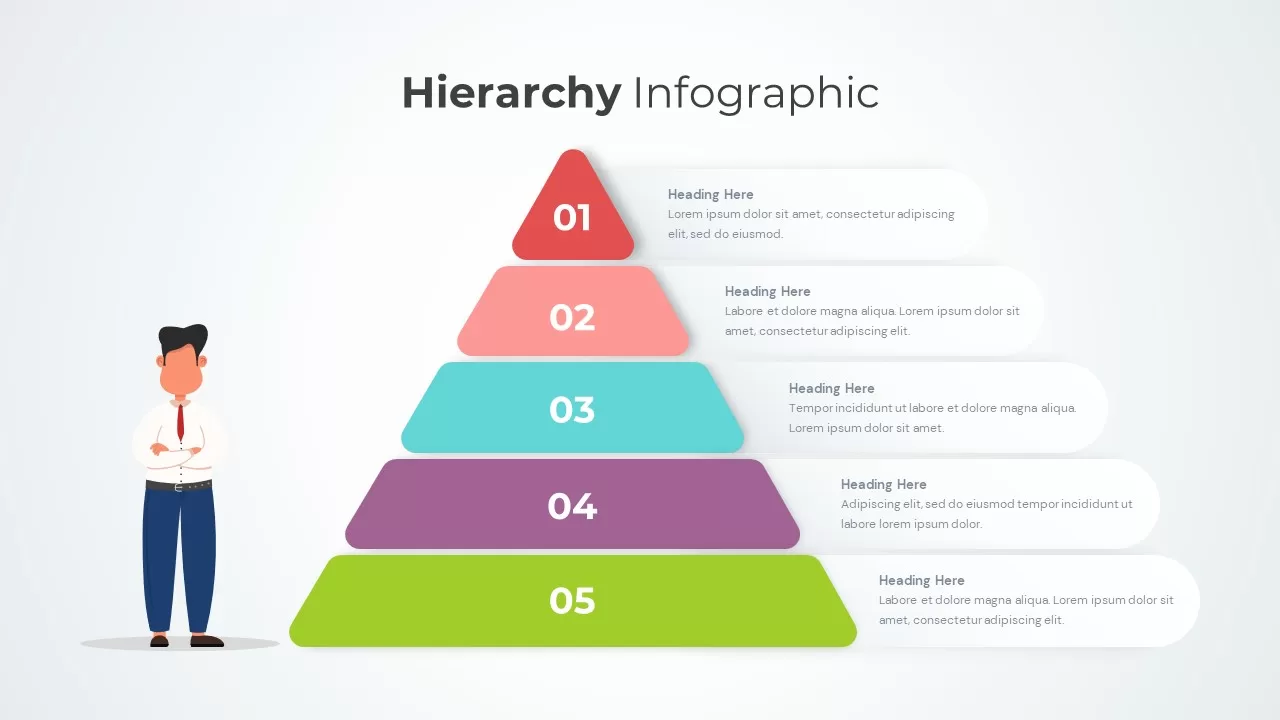
Hierarchy Infographic Design for PowerPoint & Google Slides
Business
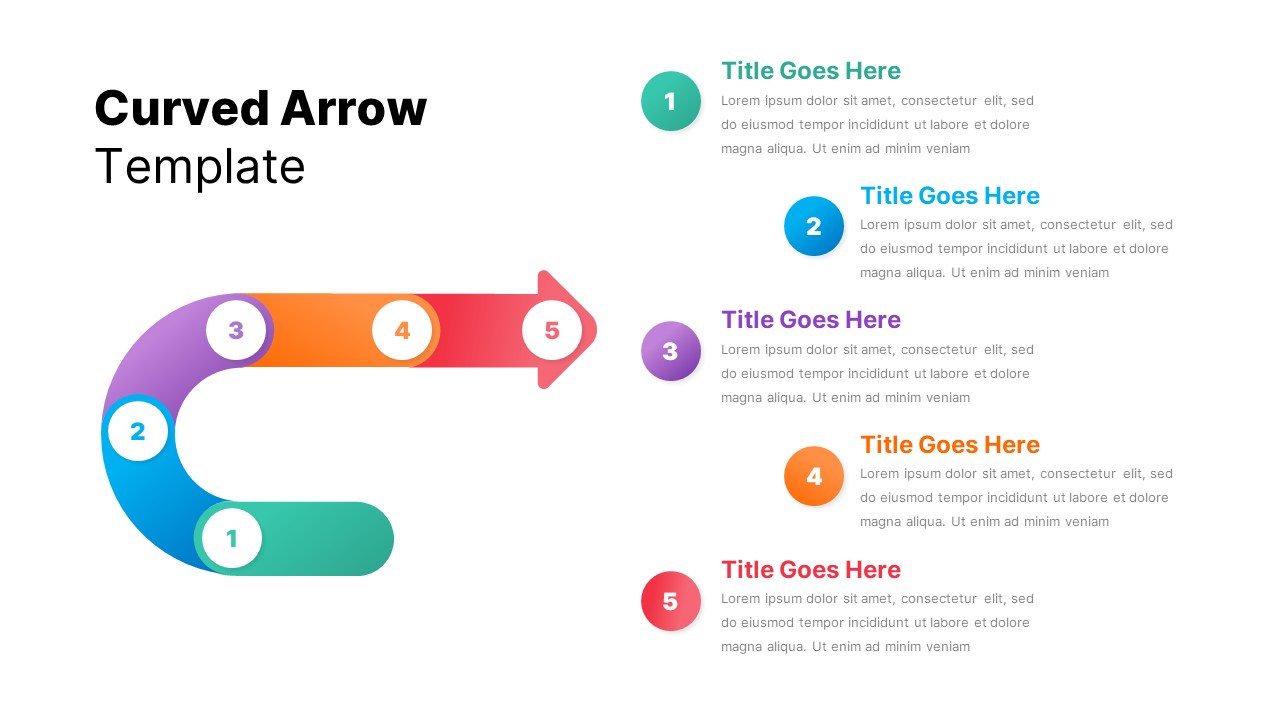
5-Step Curved Arrow Infographic Template for PowerPoint & Google Slides
Arrow
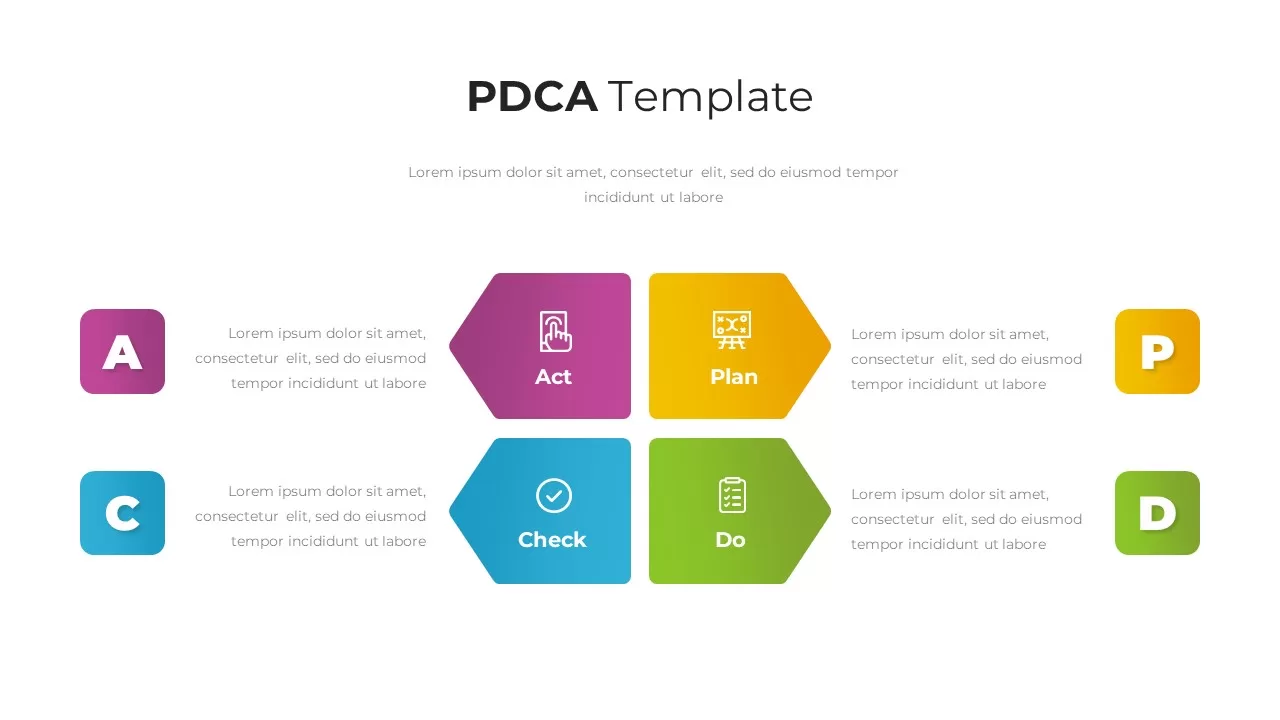
PDCA Cycle Infographic with Four Stages Template for PowerPoint & Google Slides
Process
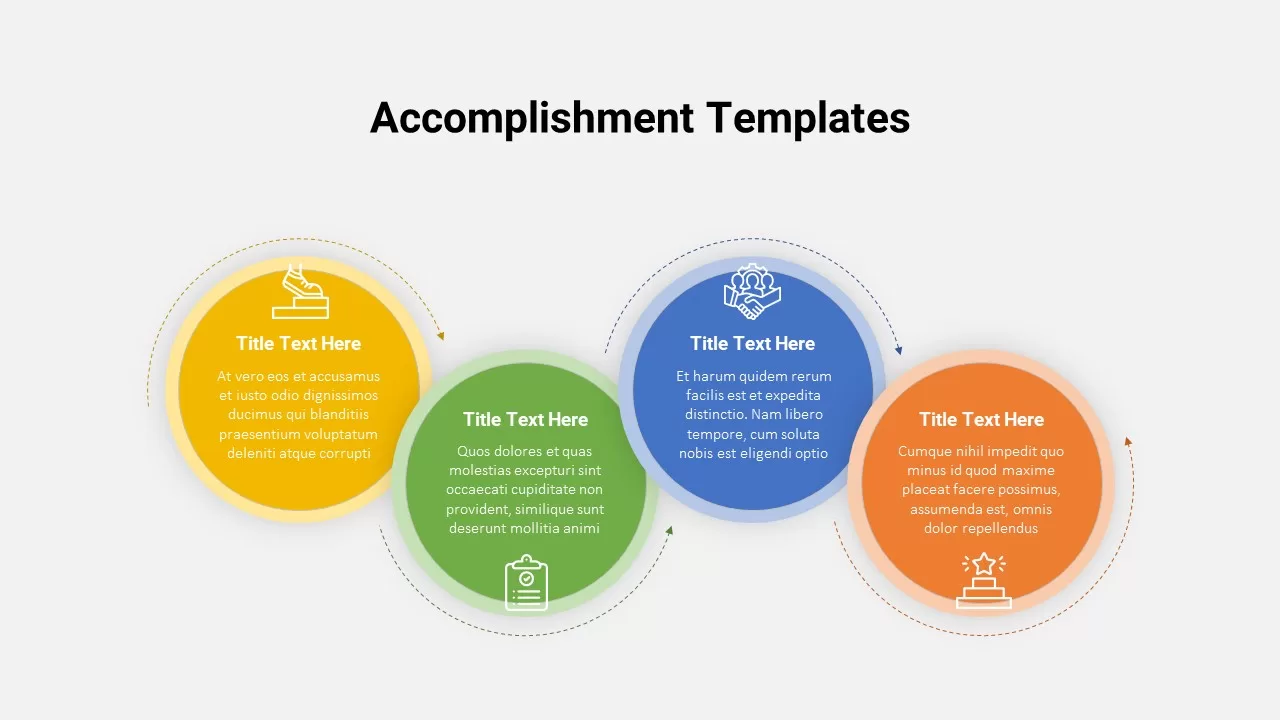
Accomplishment Circular Infographic Template for PowerPoint & Google Slides
Accomplishment
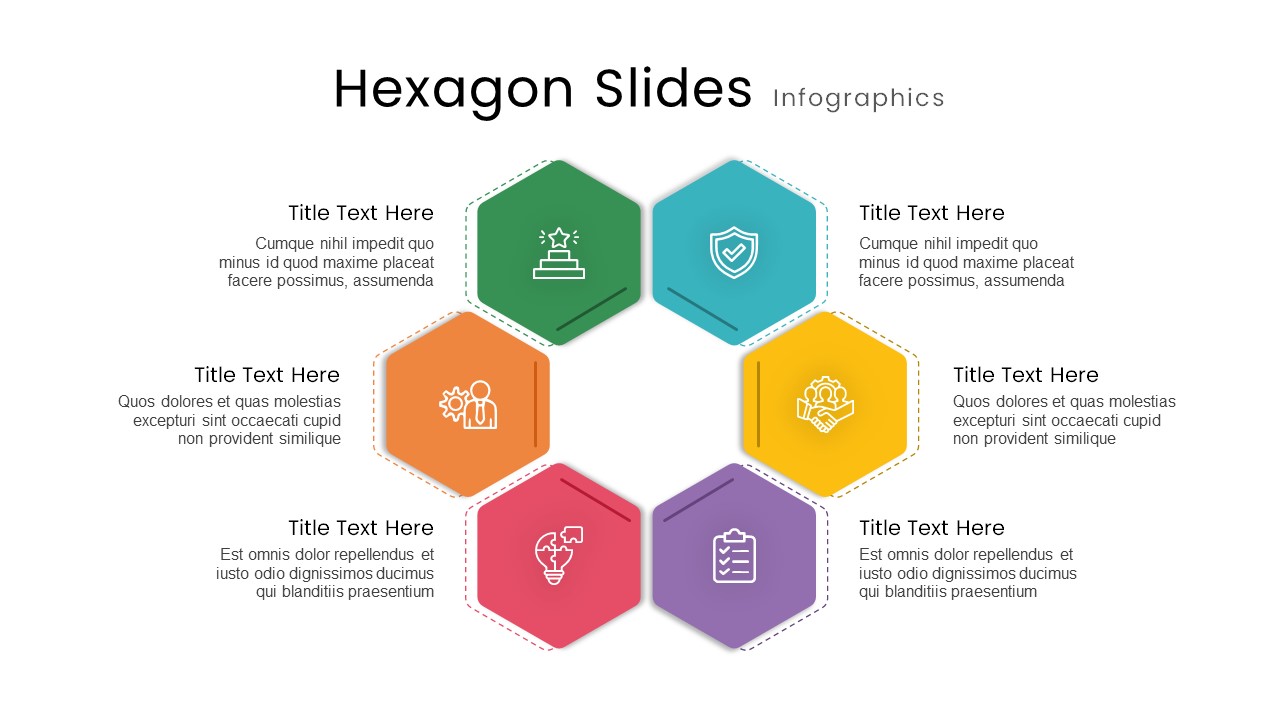
Six-Part Hexagon Infographic Layout Template for PowerPoint & Google Slides
Infographics
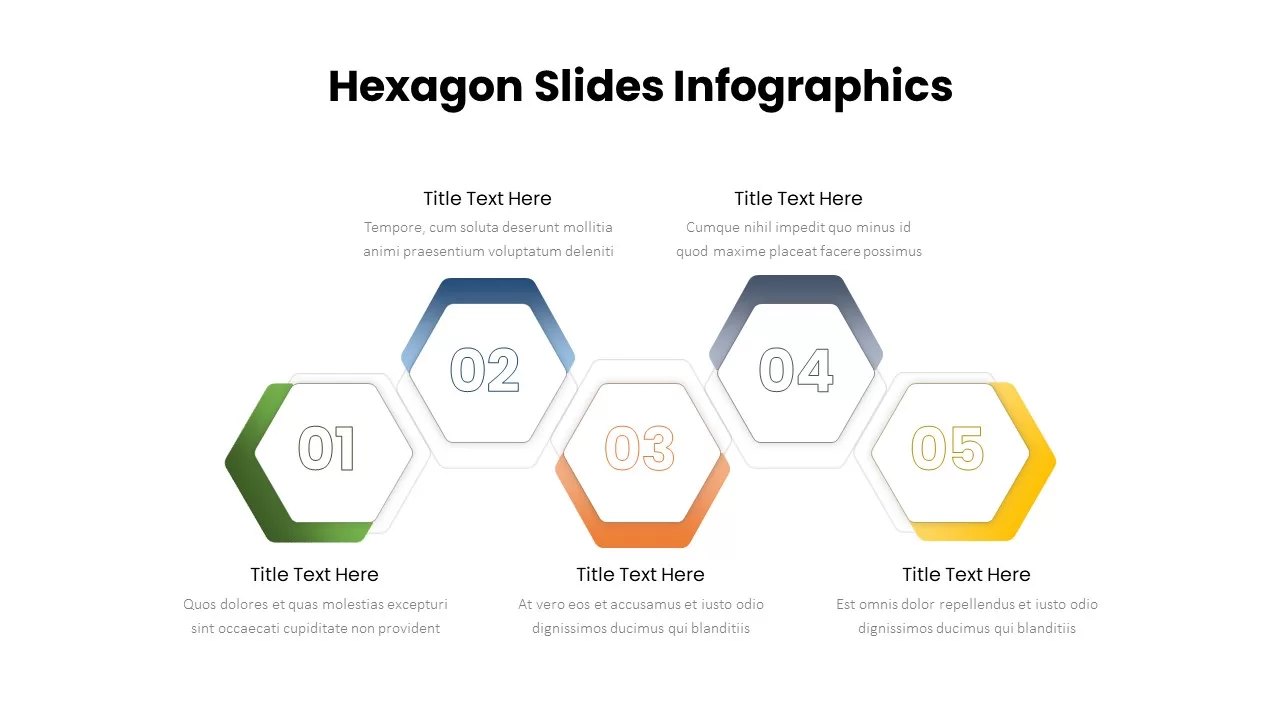
Five-Step Hexagon Infographic Process Template for PowerPoint & Google Slides
Process
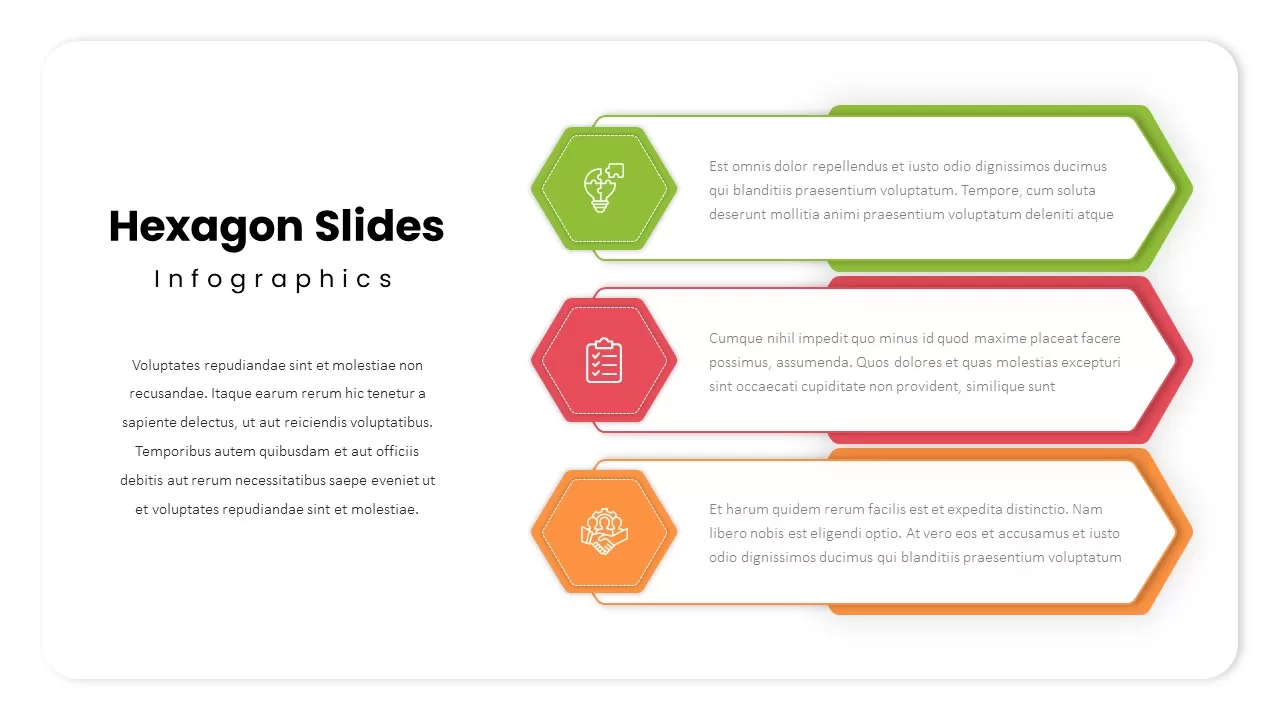
Three-Step Hexagon Infographic Process Template for PowerPoint & Google Slides
Process
Statistics Infographic Template for PowerPoint & Google Slides
Infographics
Chain Link Process Infographic Diagram Template for PowerPoint & Google Slides
Process
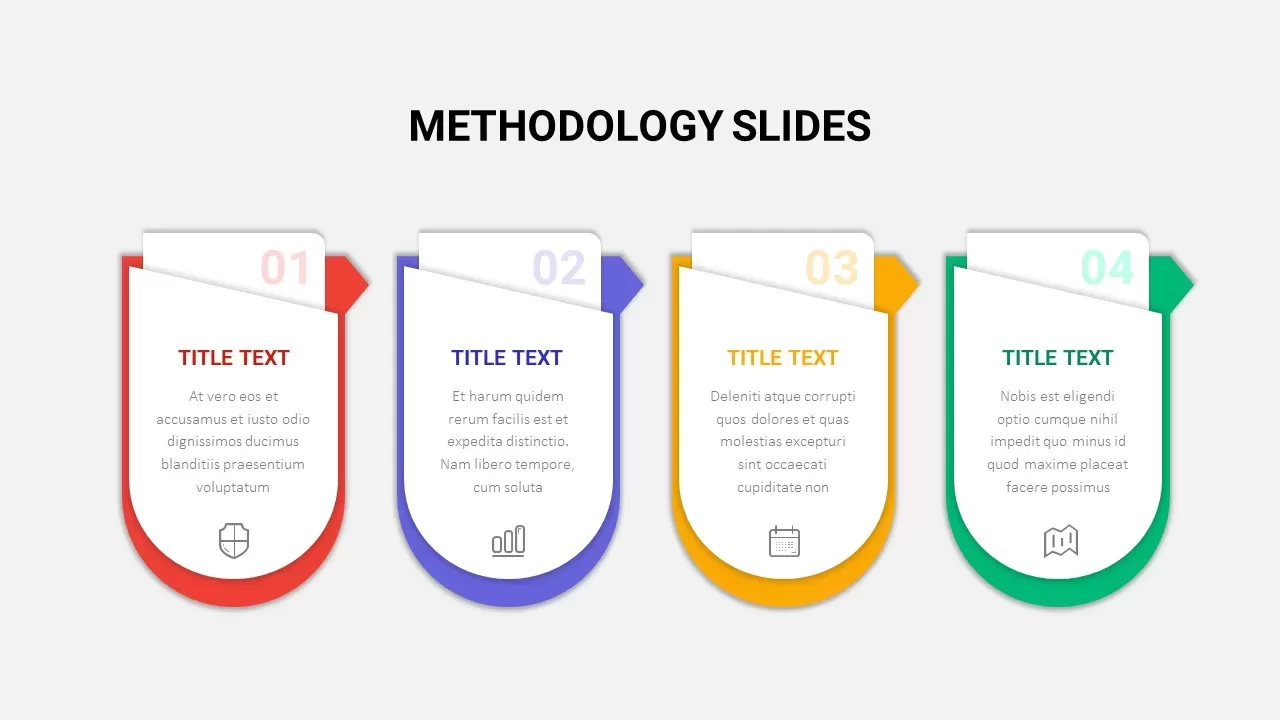
4 Step Methodology Infographic Template for PowerPoint & Google Slides
Process
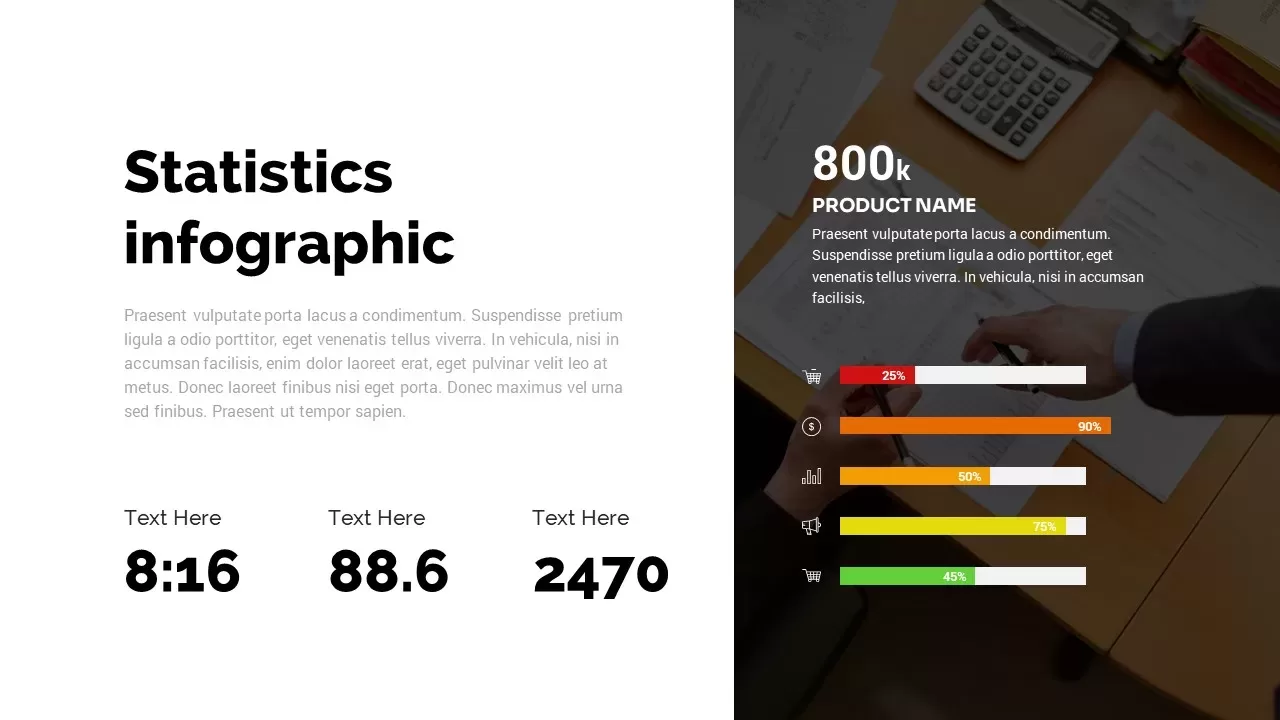
Statistics Infographic Template for PowerPoint & Google Slides
Bar/Column
Dynamic Circular Hub-and-Spoke Infographic Template for PowerPoint & Google Slides
Circular
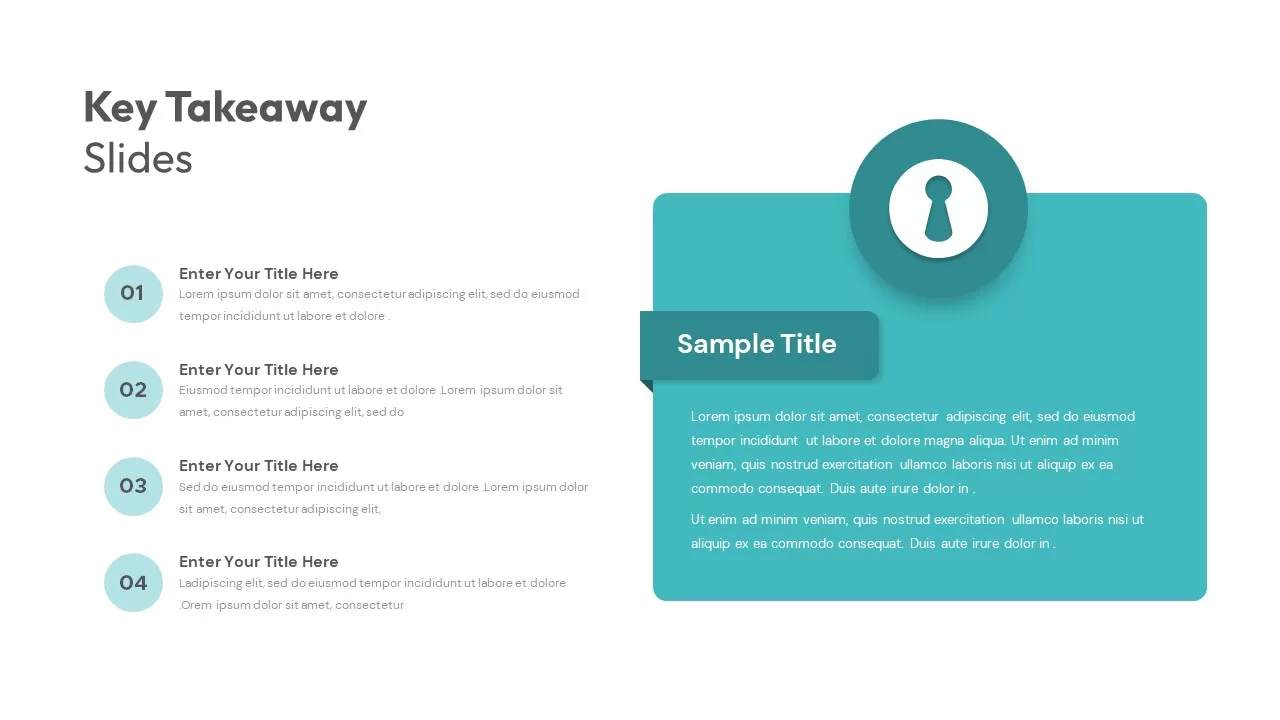
Key Takeaway Infographic Slide Deck Template for PowerPoint & Google Slides
Process
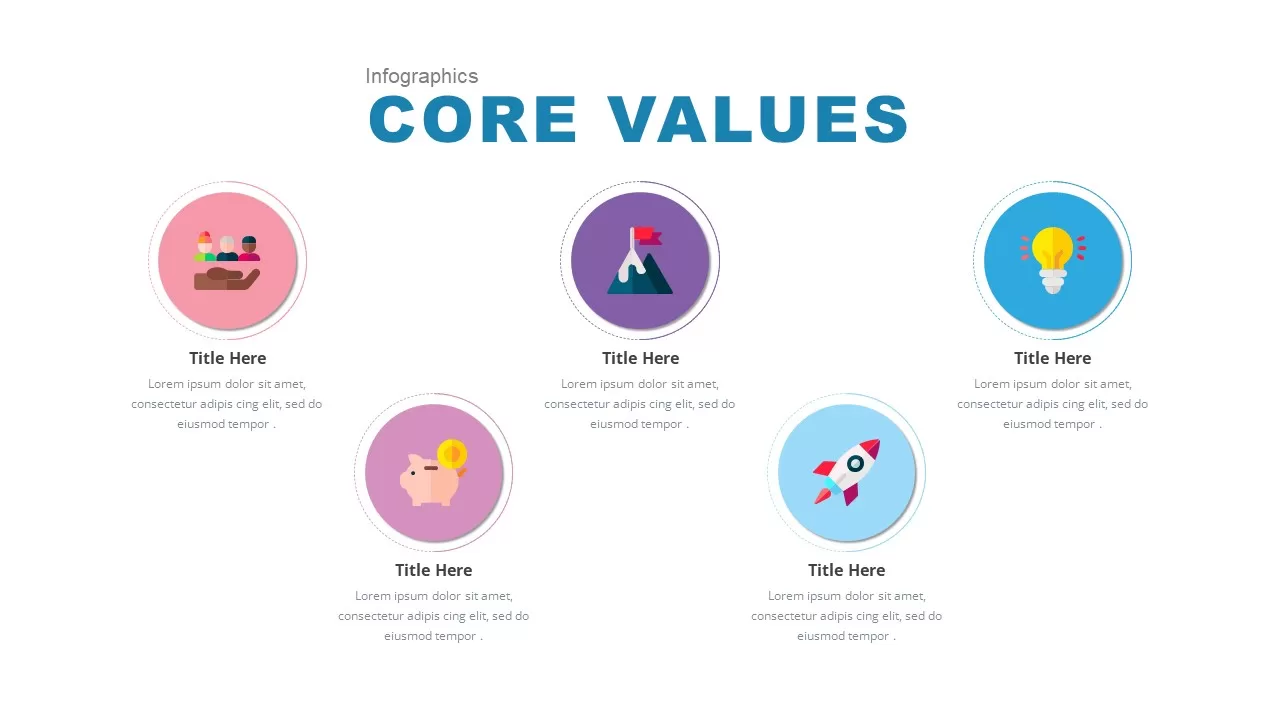
Core Values Infographic Slide Template for PowerPoint & Google Slides
Comparison
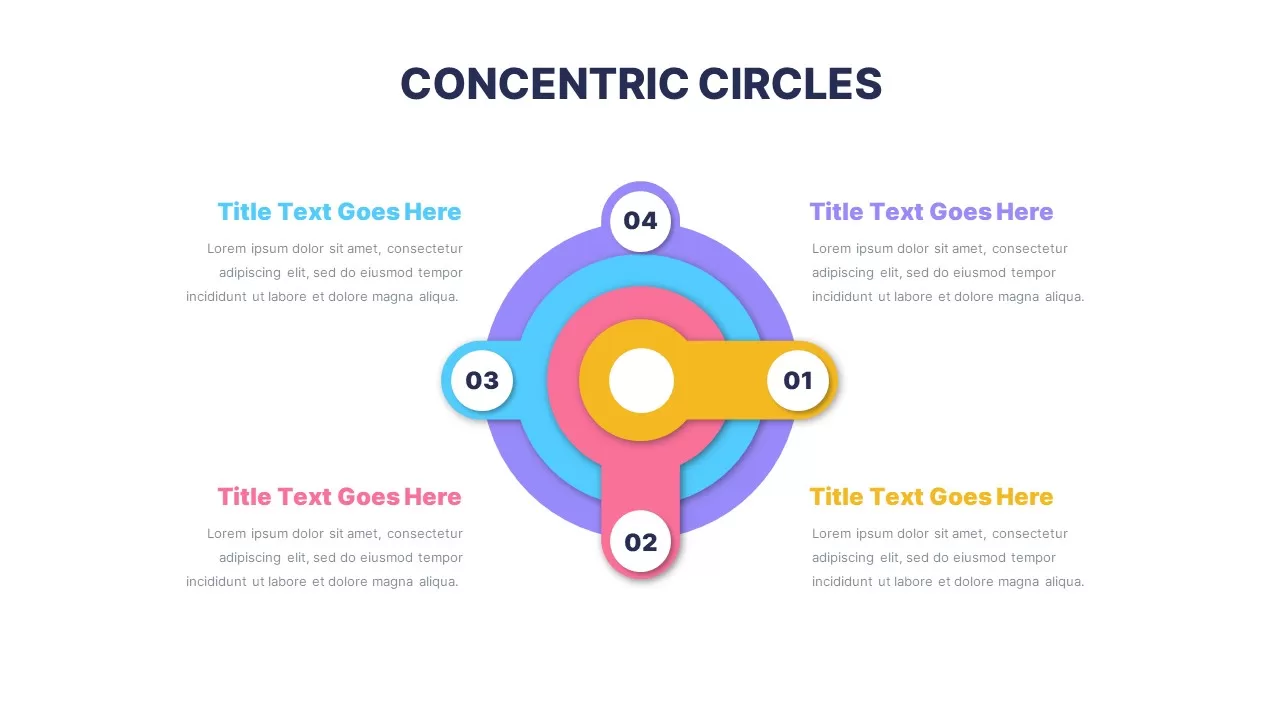
Colorful Concentric Circles Infographic Slide for PowerPoint & Google Slides
Process
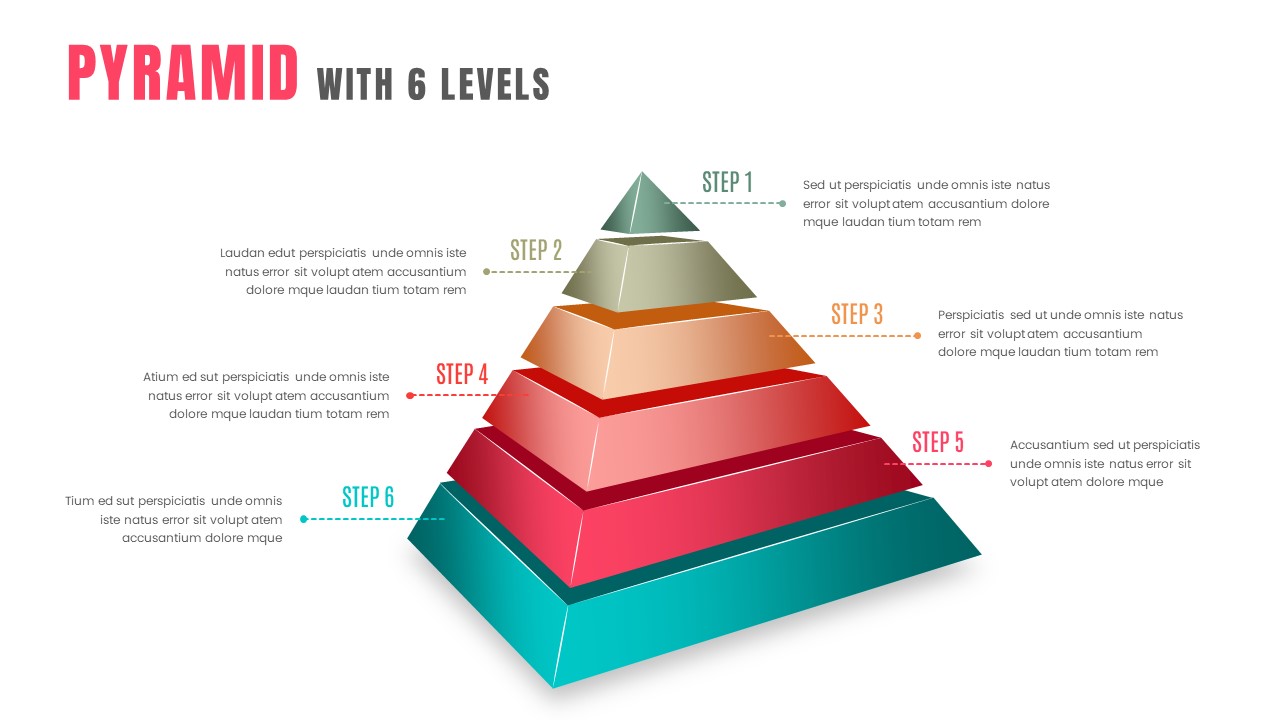
3D Six-Level Pyramid Diagram Infographic Template for PowerPoint & Google Slides
Pyramid
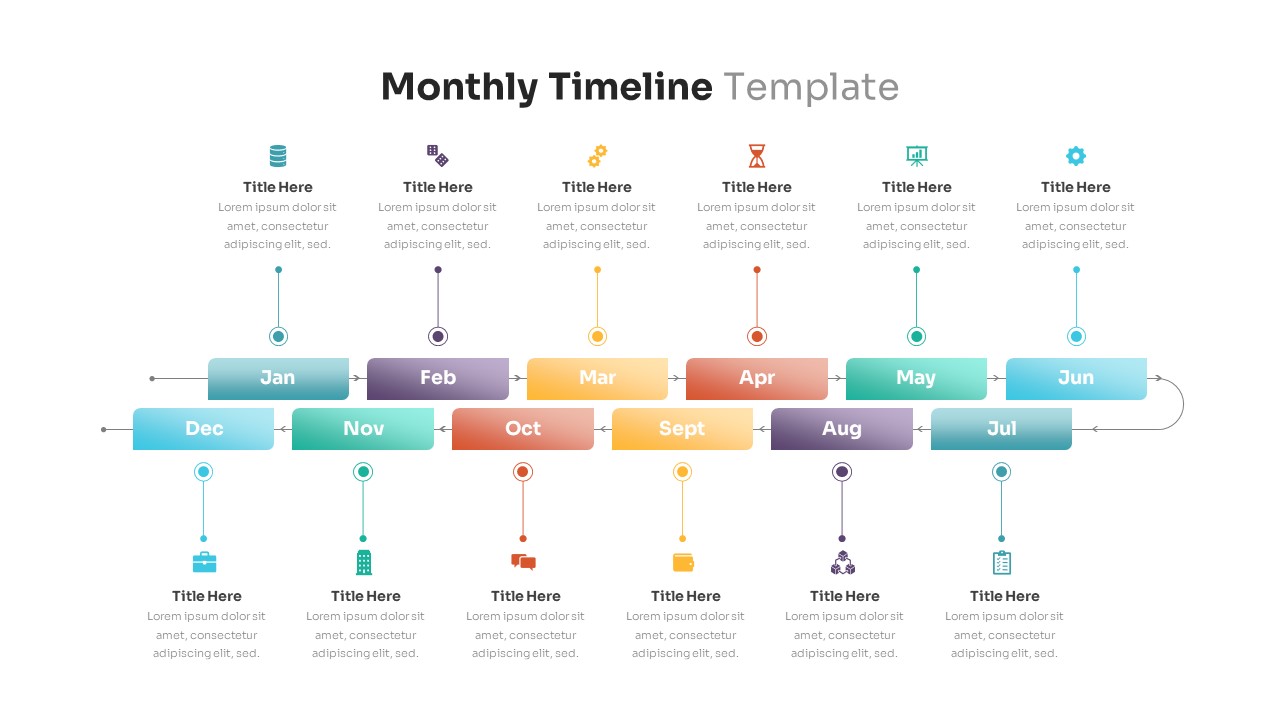
Editable Monthly Timeline Infographic Template for PowerPoint & Google Slides
Timeline
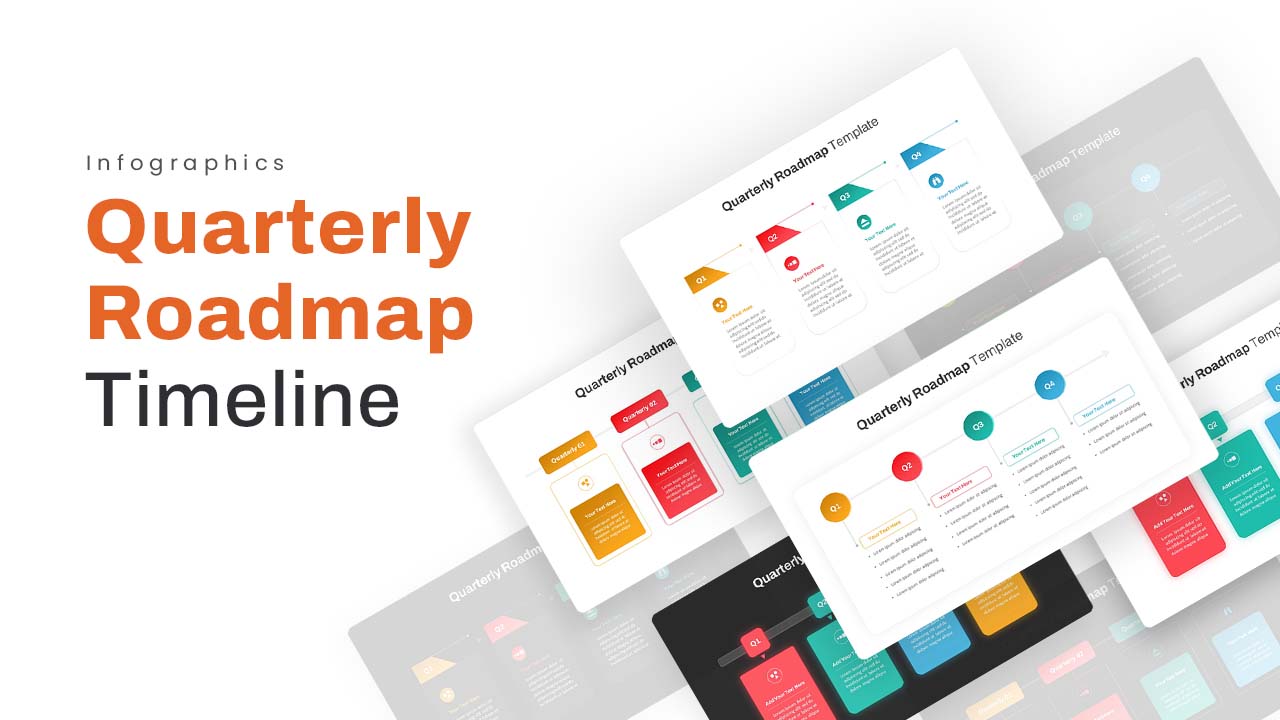
Quarterly Roadmap Timeline Infographic Template for PowerPoint & Google Slides
Timeline
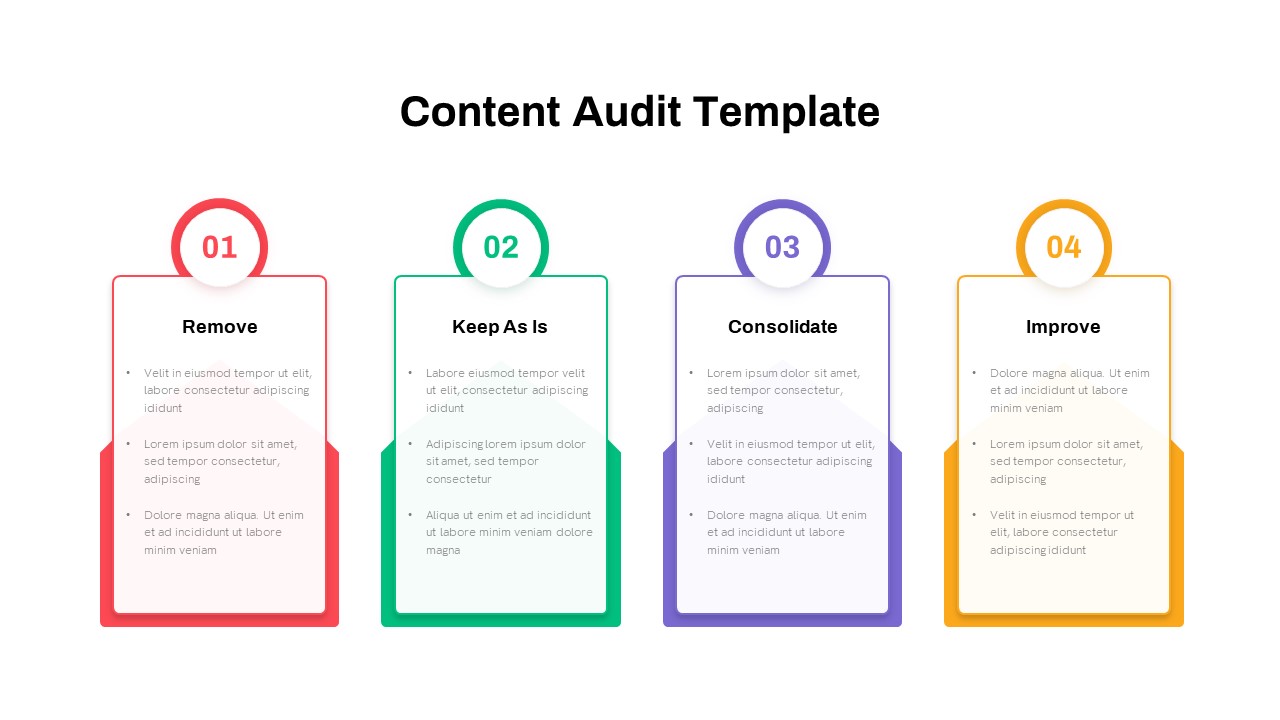
Four-Step Content Audit Infographic Template for PowerPoint & Google Slides
Process
Dynamic Chevron Timeline Infographic Template for PowerPoint & Google Slides
Timeline
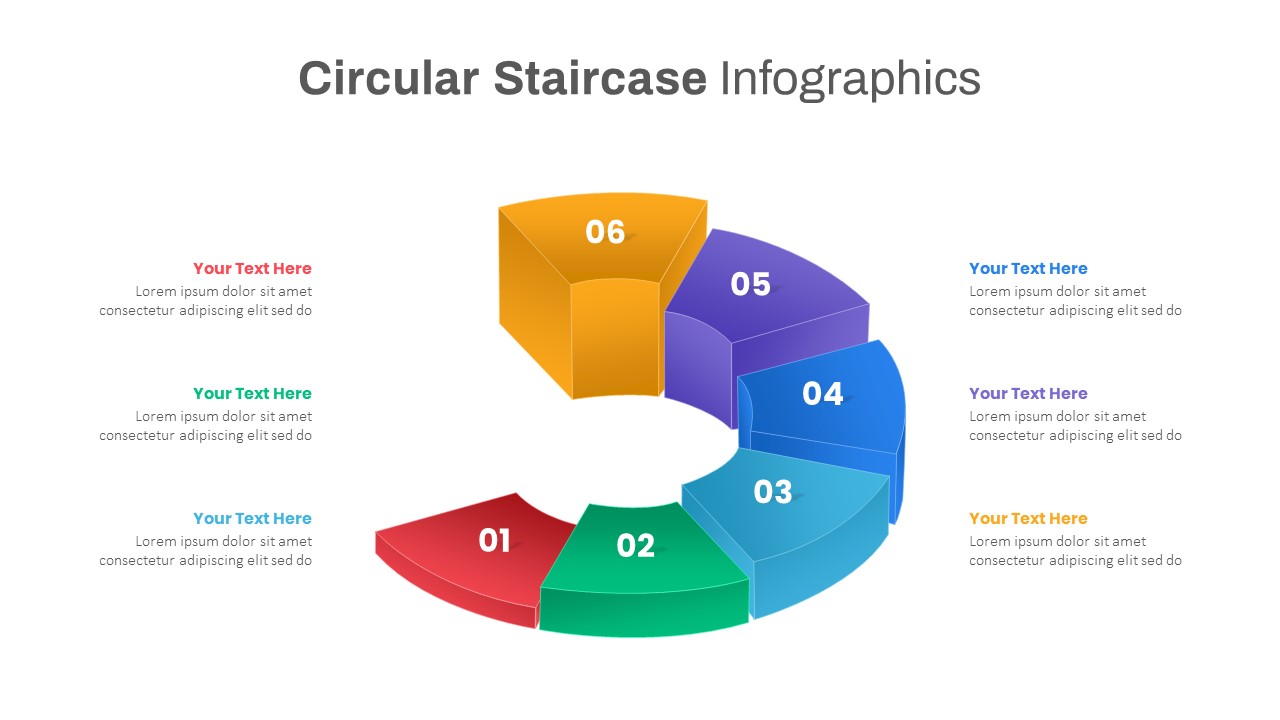
Six-Step Staircase Infographic Template for PowerPoint & Google Slides
Circular
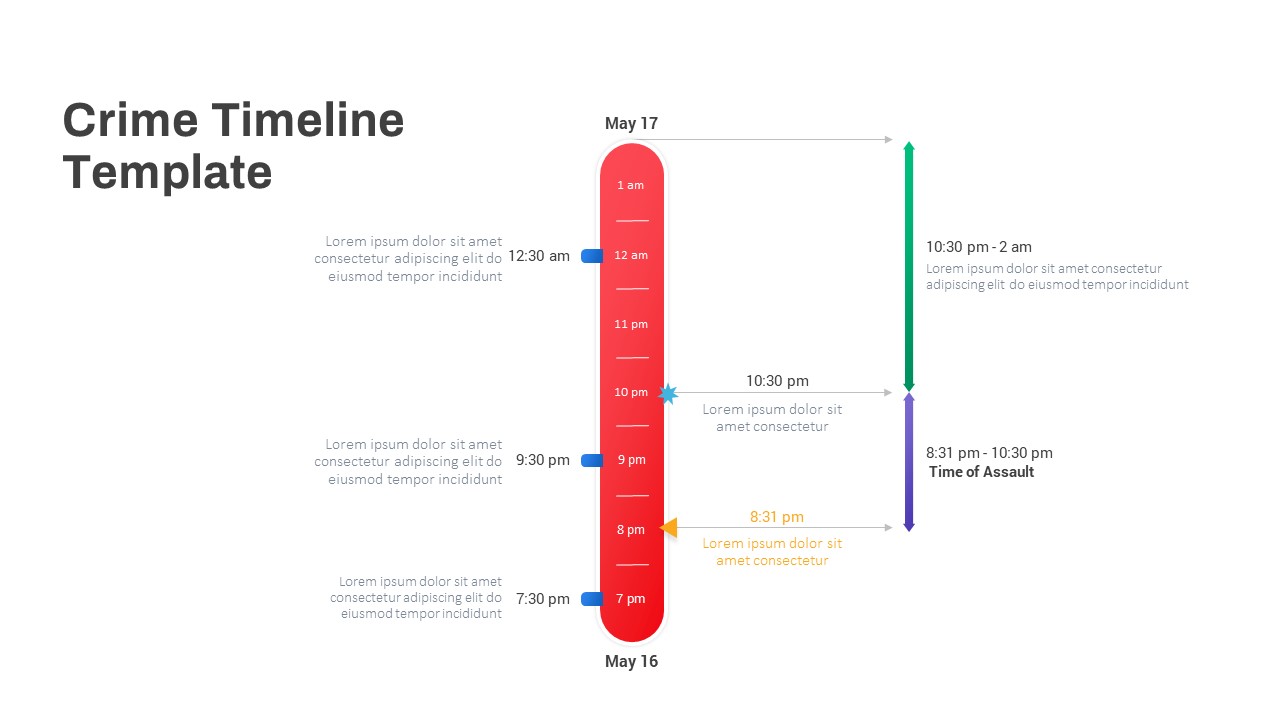
Vertical Crime Timeline Infographic Template for PowerPoint & Google Slides
Timeline
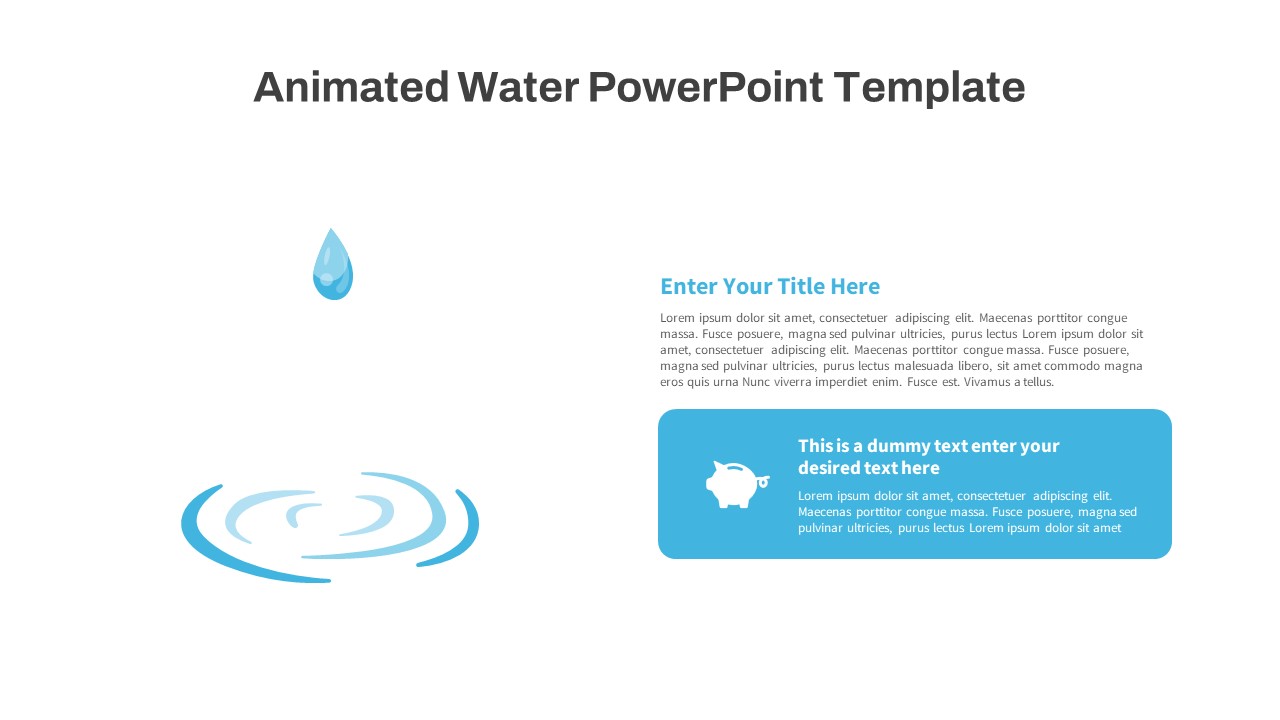
Animated Water Drop Ripple Infographic Template for PowerPoint & Google Slides
Graphics
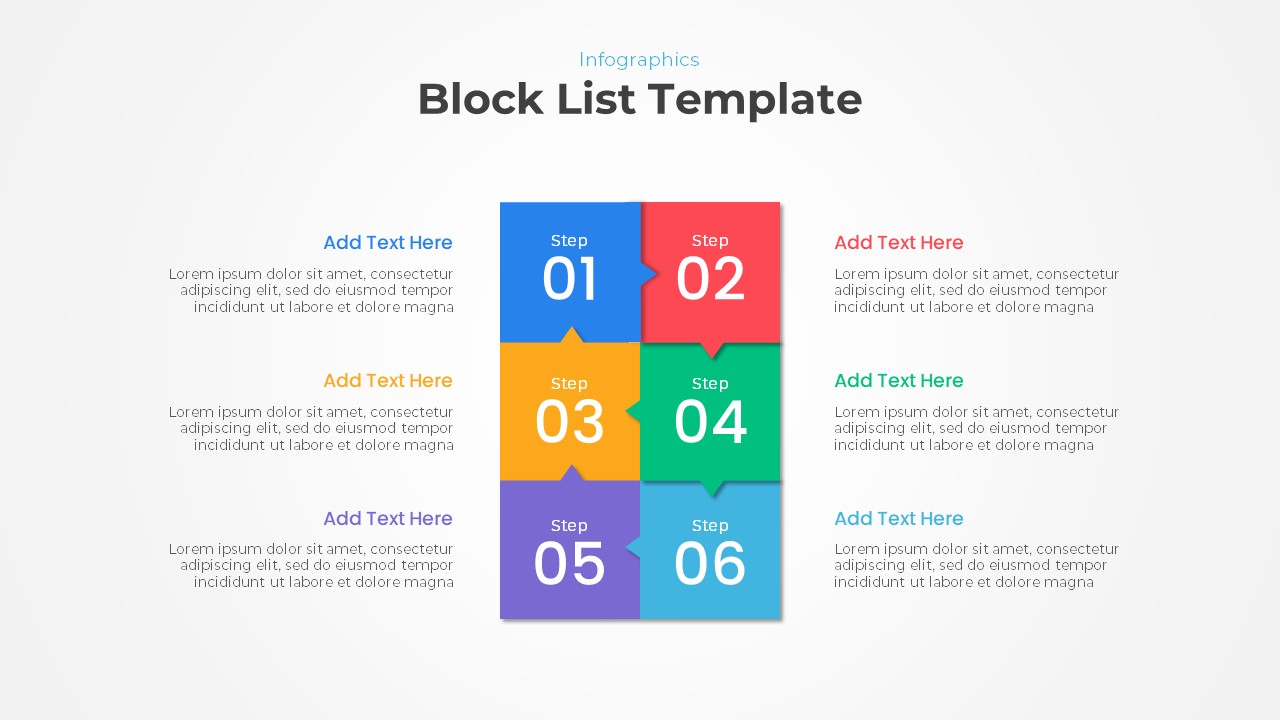
Creative Block List Infographic Template for PowerPoint & Google Slides
Agenda
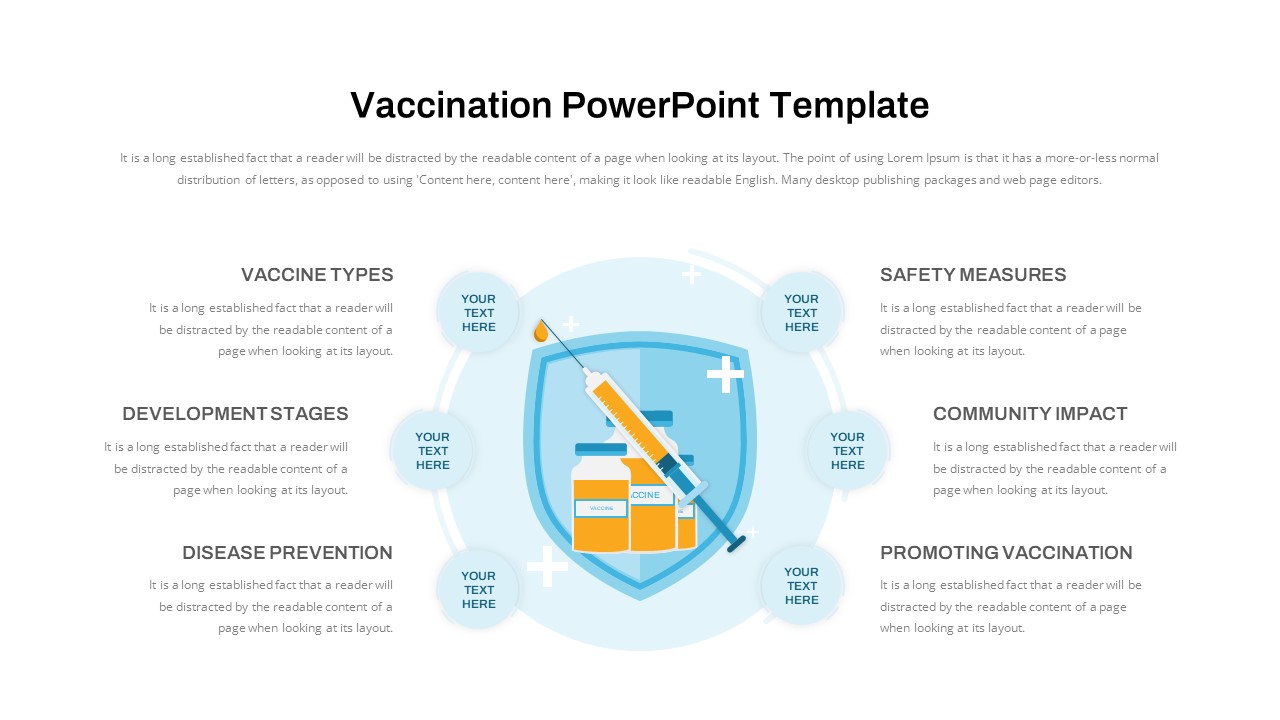
Vaccination Hub-and-Spoke Infographic Template for PowerPoint & Google Slides
Circular
Free Cute Dental Health Infographic Layout for PowerPoint & Google Slides
Health
Free
Six Colorful Gear Shapes Infographic Template for PowerPoint & Google Slides
Process
Free
Free Goal Setting Target Infographic Slide Template for PowerPoint & Google Slides
Goals
Free
Editable Ireland Map Infographic Slide Template for PowerPoint & Google Slides
World Maps
Free
Types of AI Comparison Infographic Template for PowerPoint & Google Slides
AI
Cost Control Measures Infographic Template for PowerPoint & Google Slides
Circular
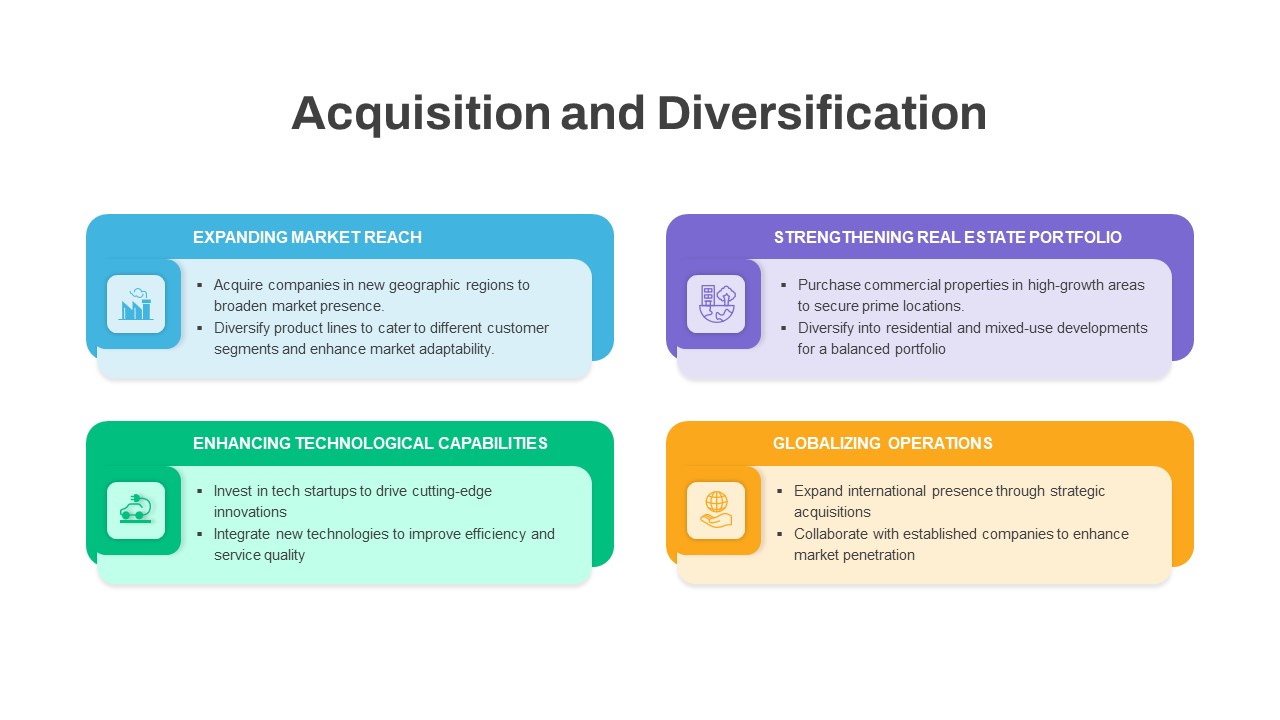
Acquisition & Diversification Infographic Template for PowerPoint & Google Slides
Business Plan
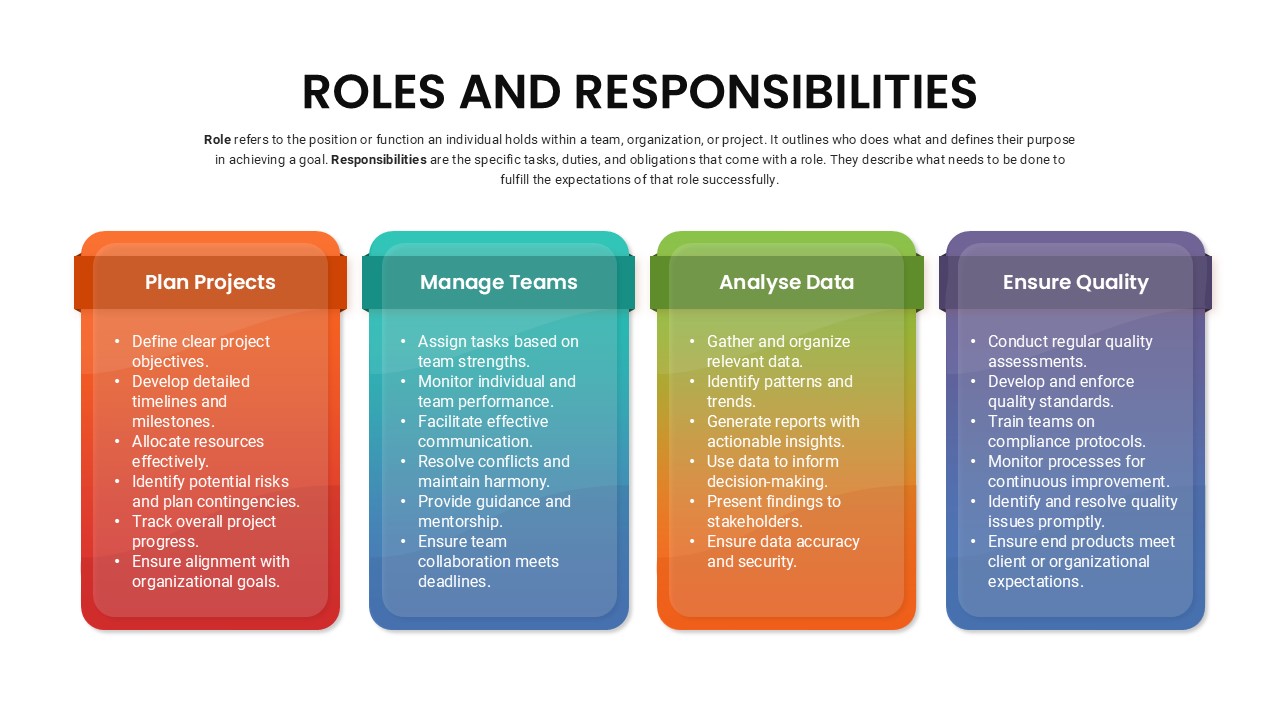
Roles and Responsibilities Infographic Template for PowerPoint & Google Slides
Our Team
Free Online Shopping 3-Slide Infographic Template for PowerPoint & Google Slides
Digital Marketing
Free
Data-Driven AI in Insurance Infographic Template for PowerPoint & Google Slides
Circular
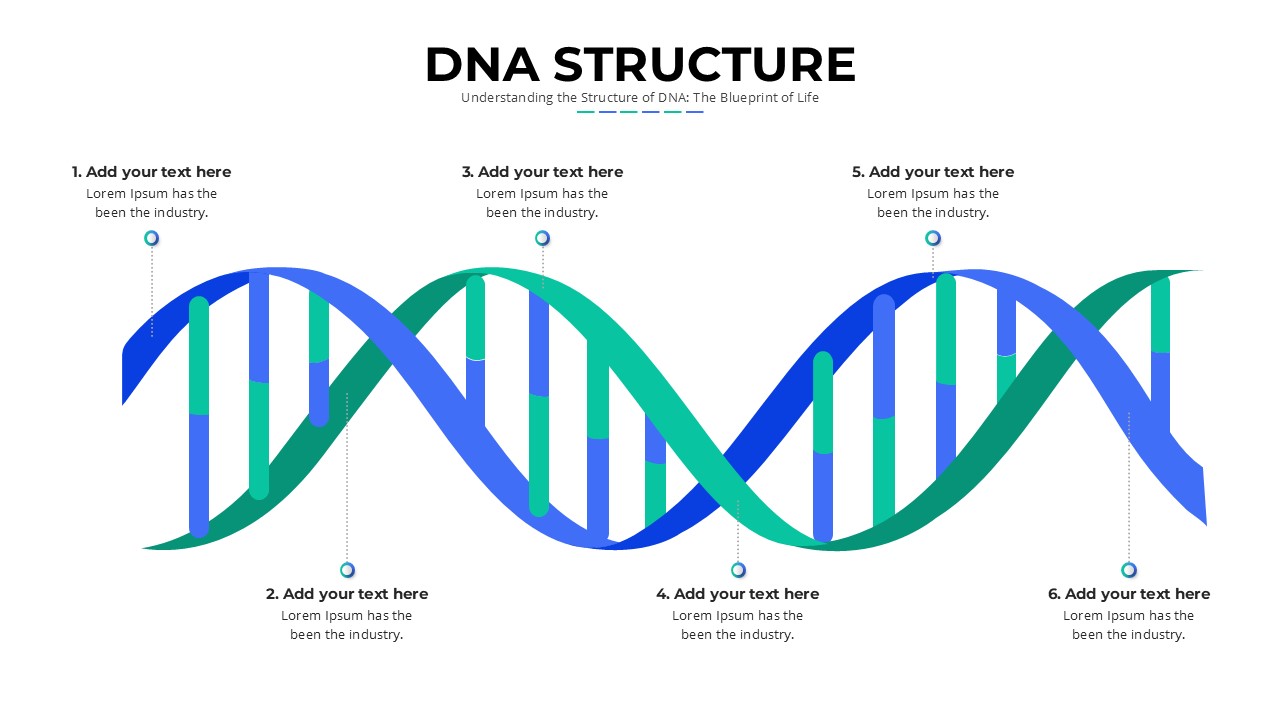
DNA Structure Infographic Template for PowerPoint & Google Slides
Health
Multimodal AI Modalities Infographic Template for PowerPoint & Google Slides
AI
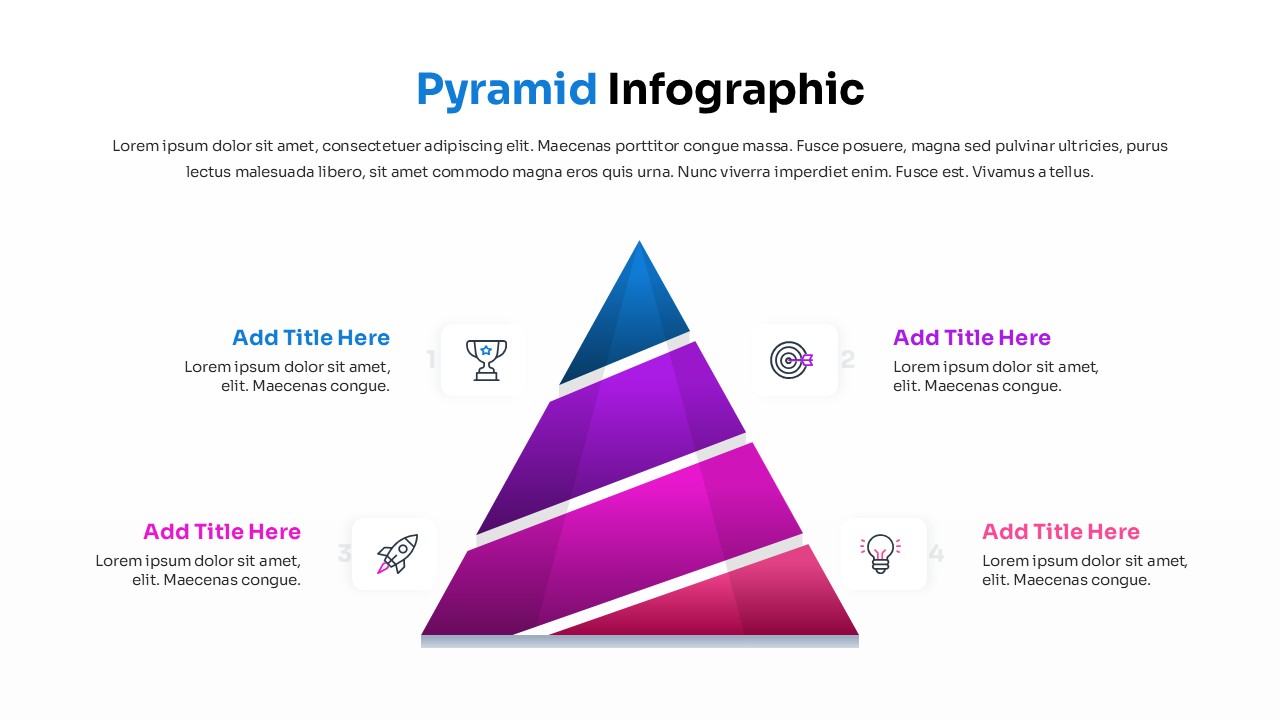
Four Level Pyramid Infographic Template for PowerPoint & Google Slides
Pyramid
Three Segment Donut Chart KPI Infographic Template for PowerPoint & Google Slides
Pie/Donut