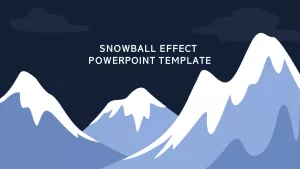
Snowball Effect Process Diagram Template for PowerPoint & Google Slides


Description
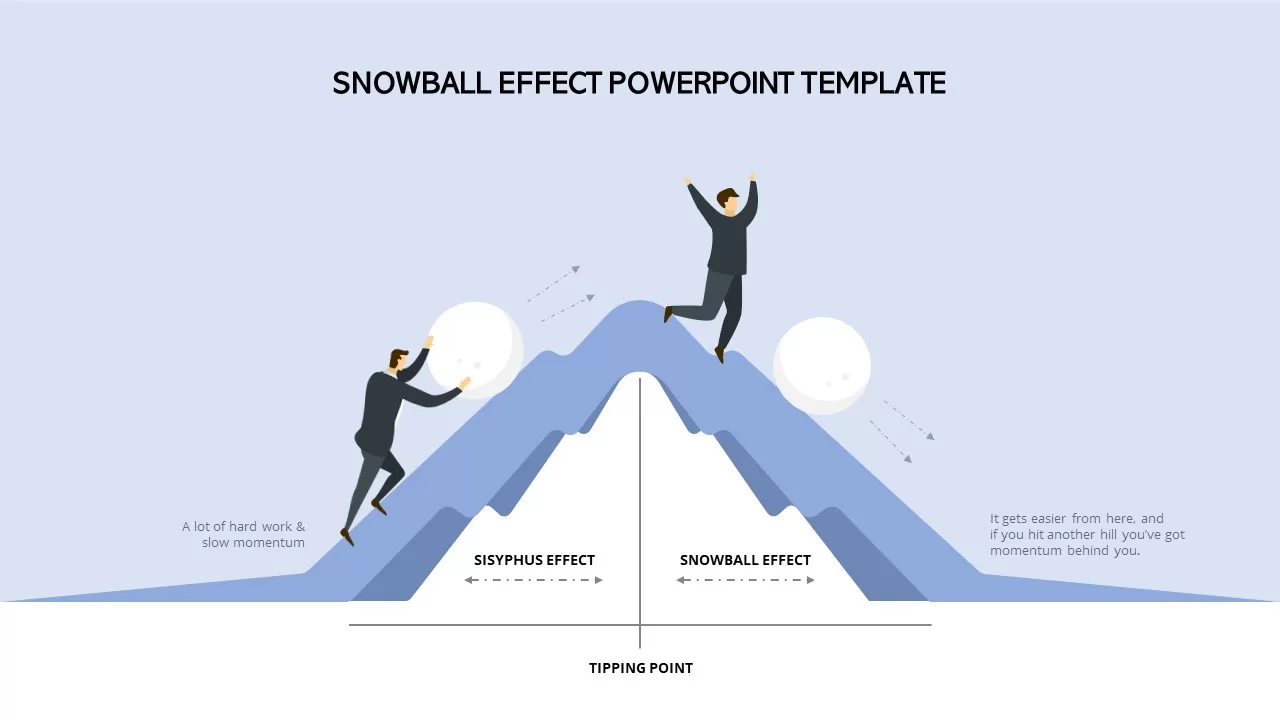
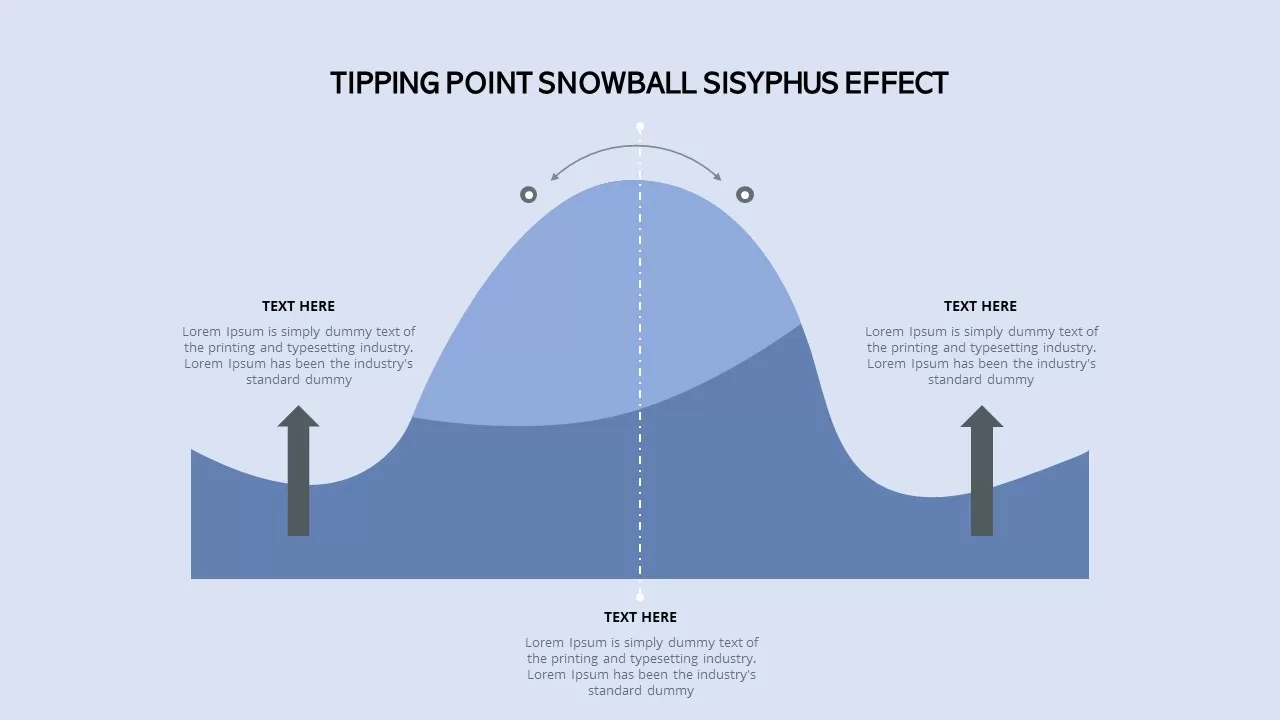
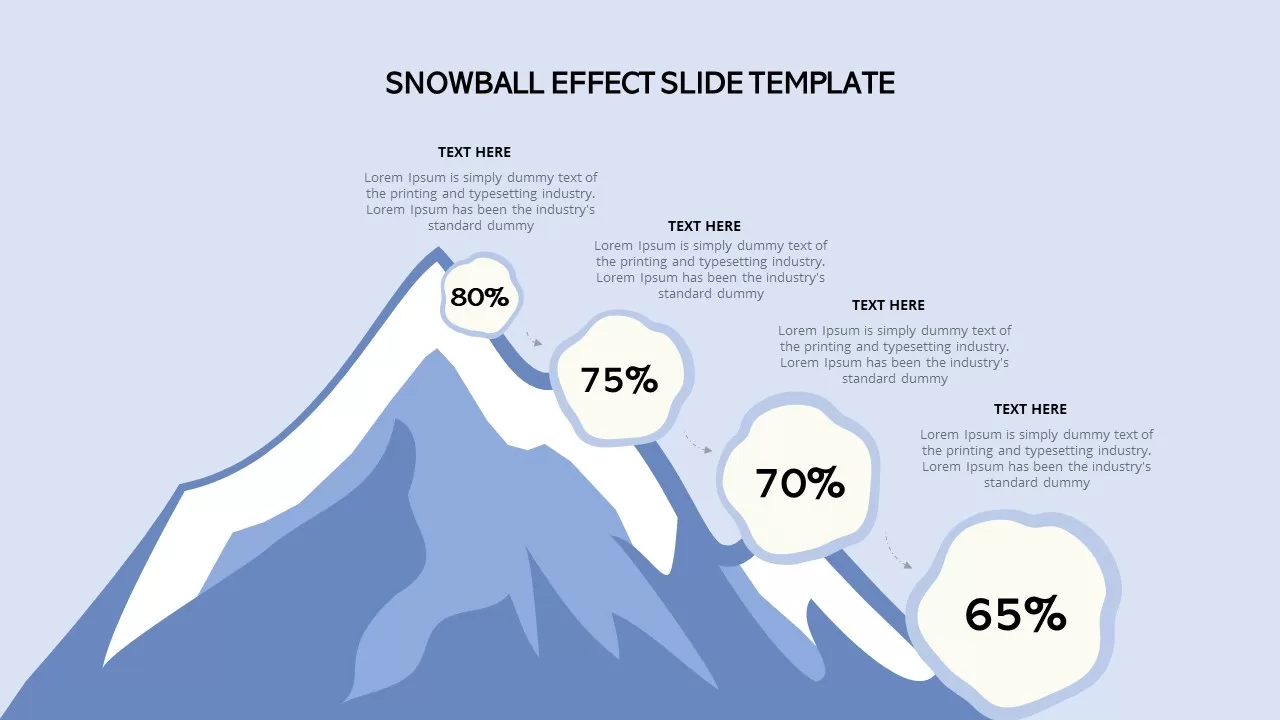
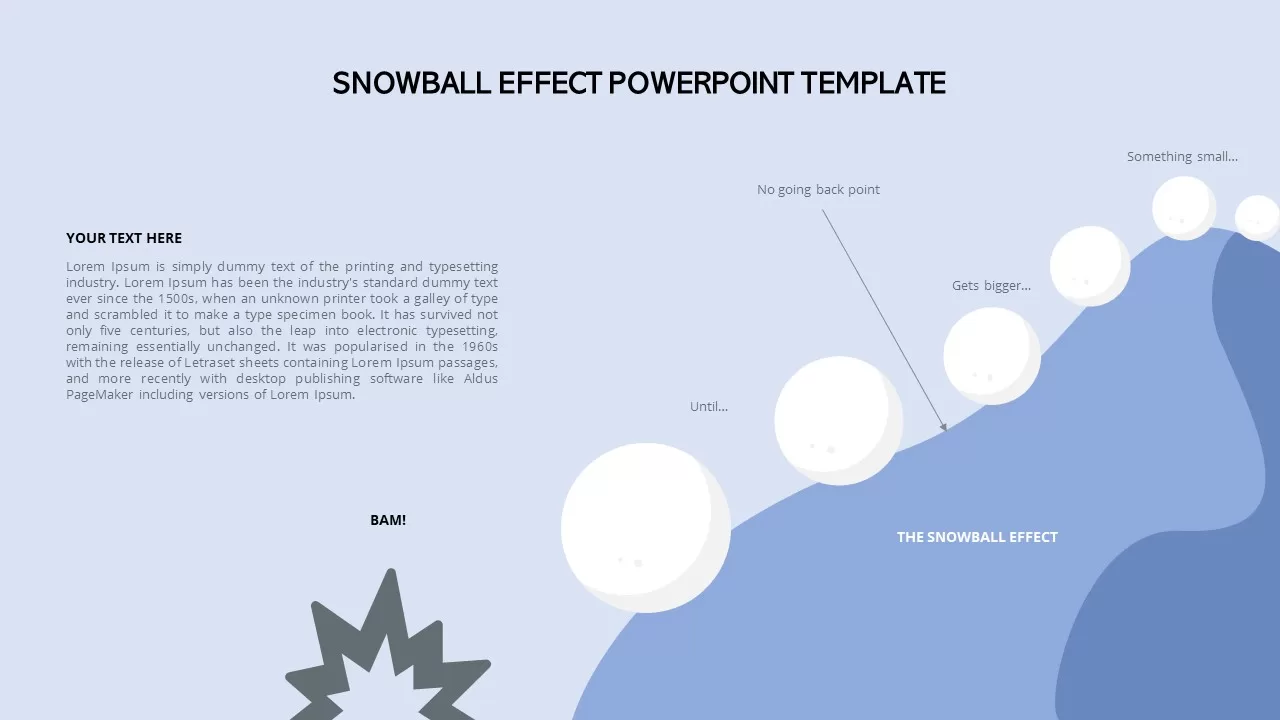
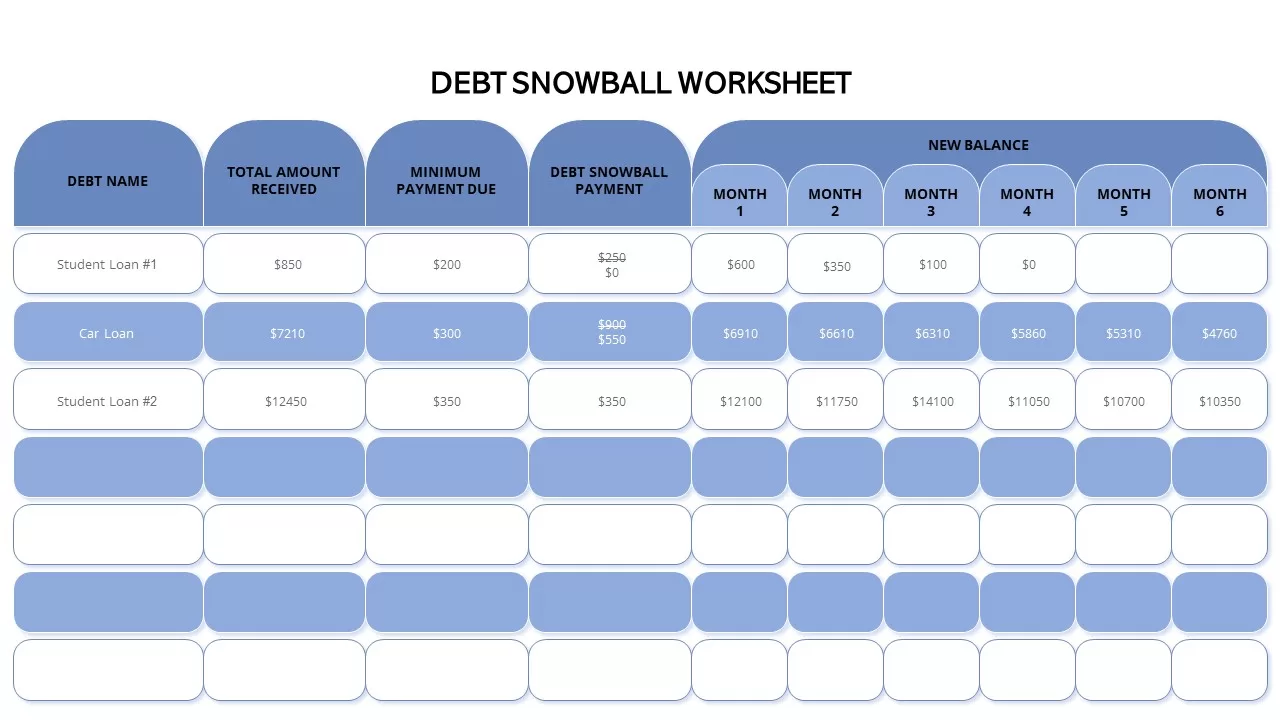
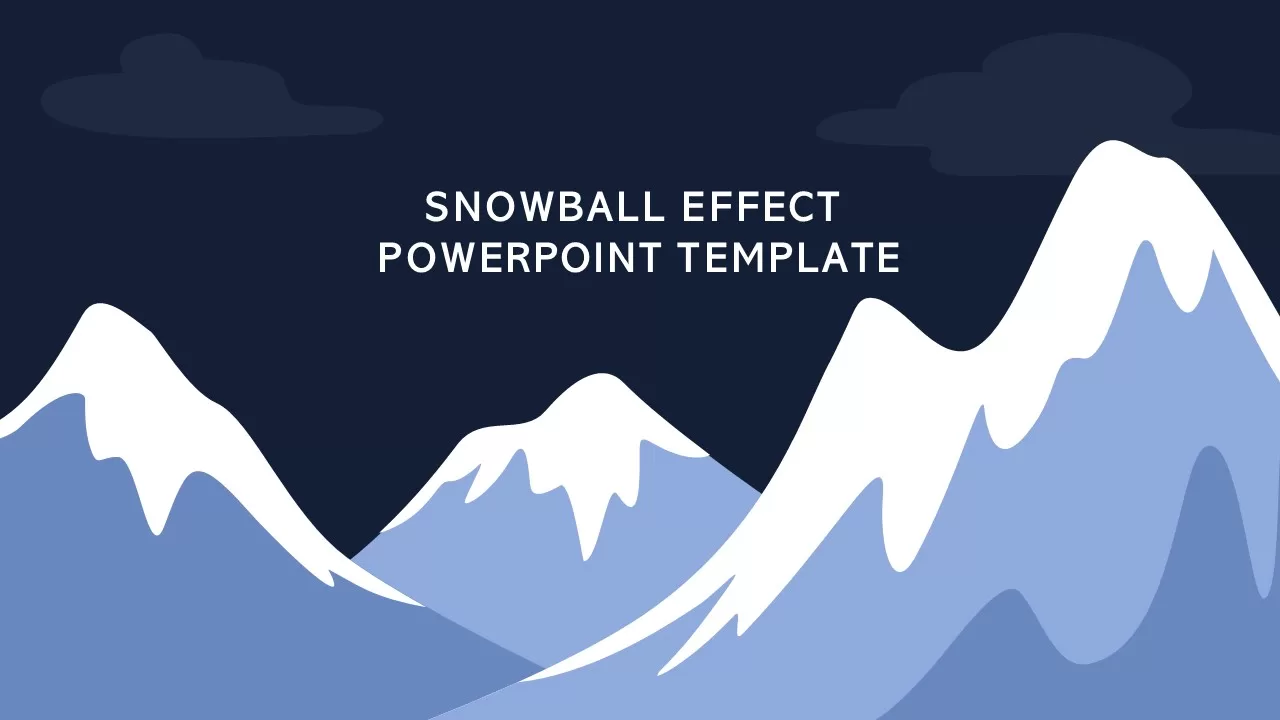
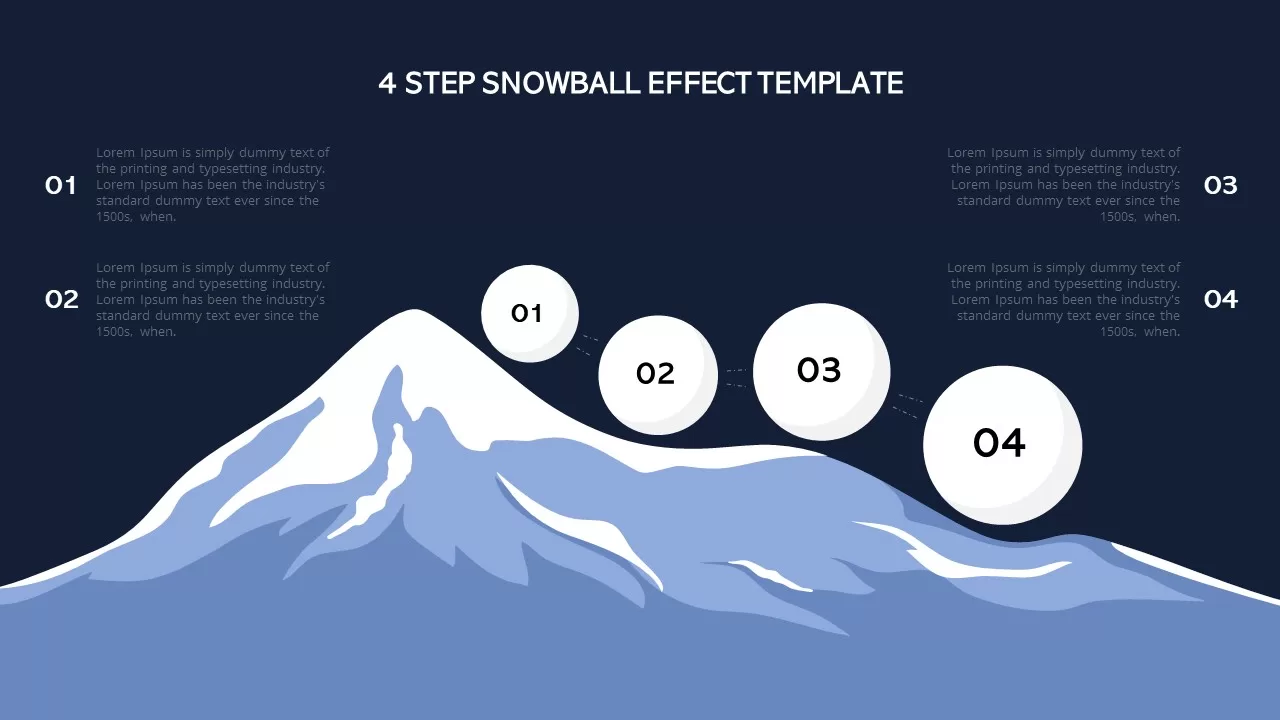
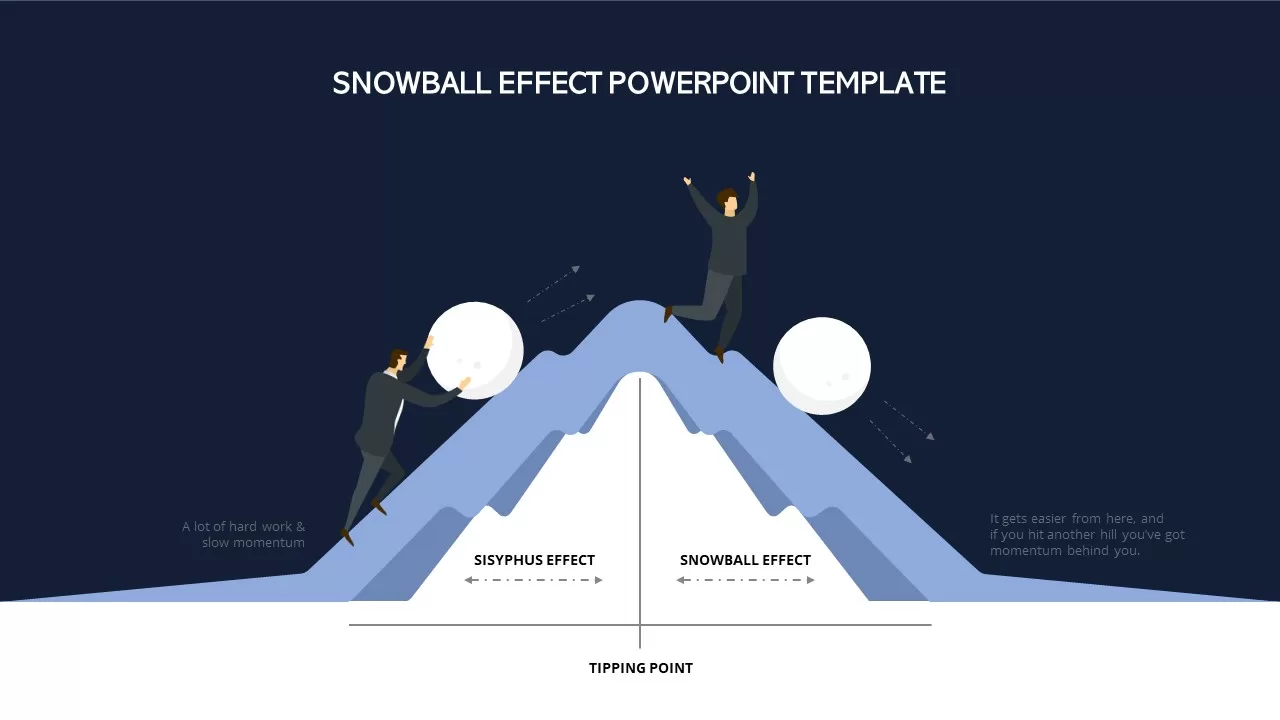
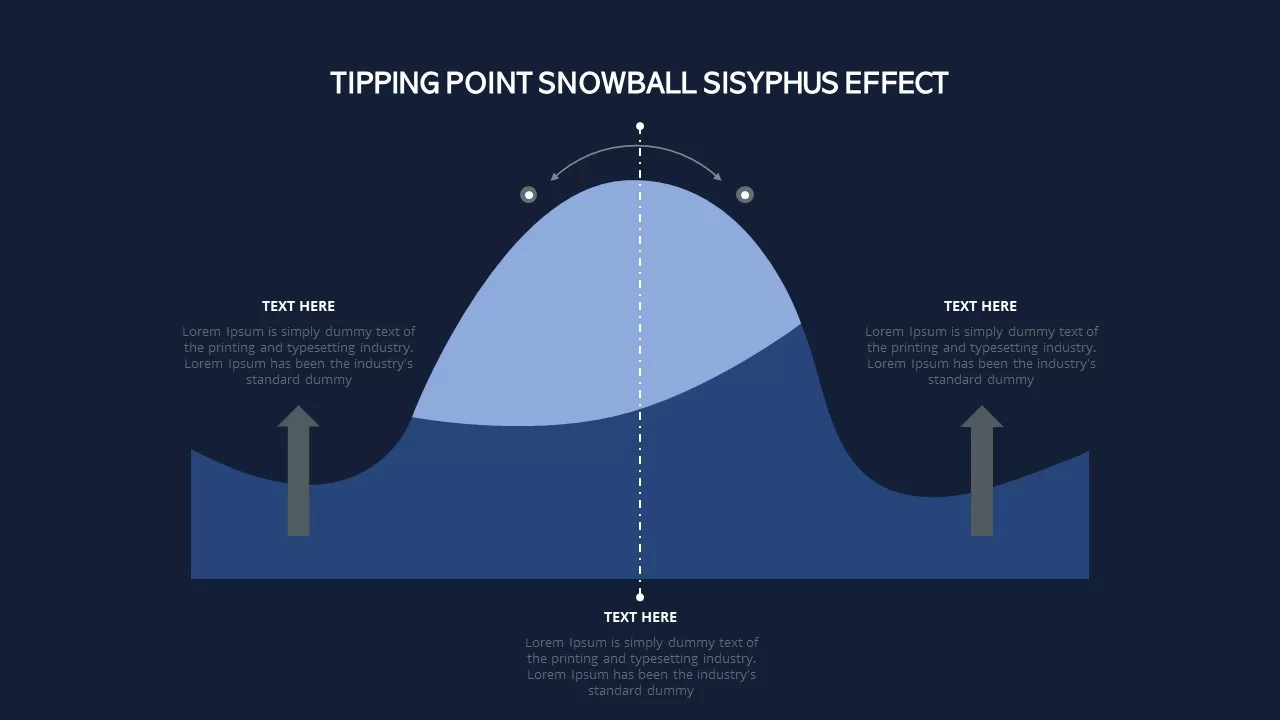
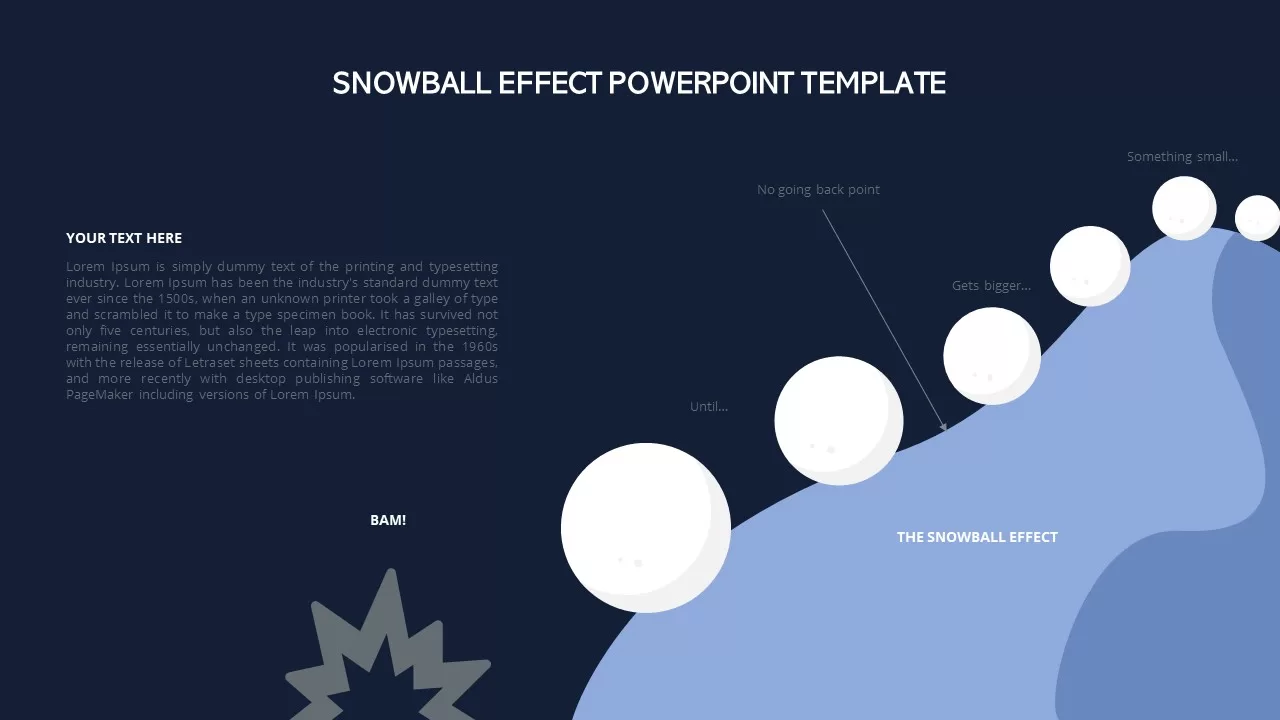
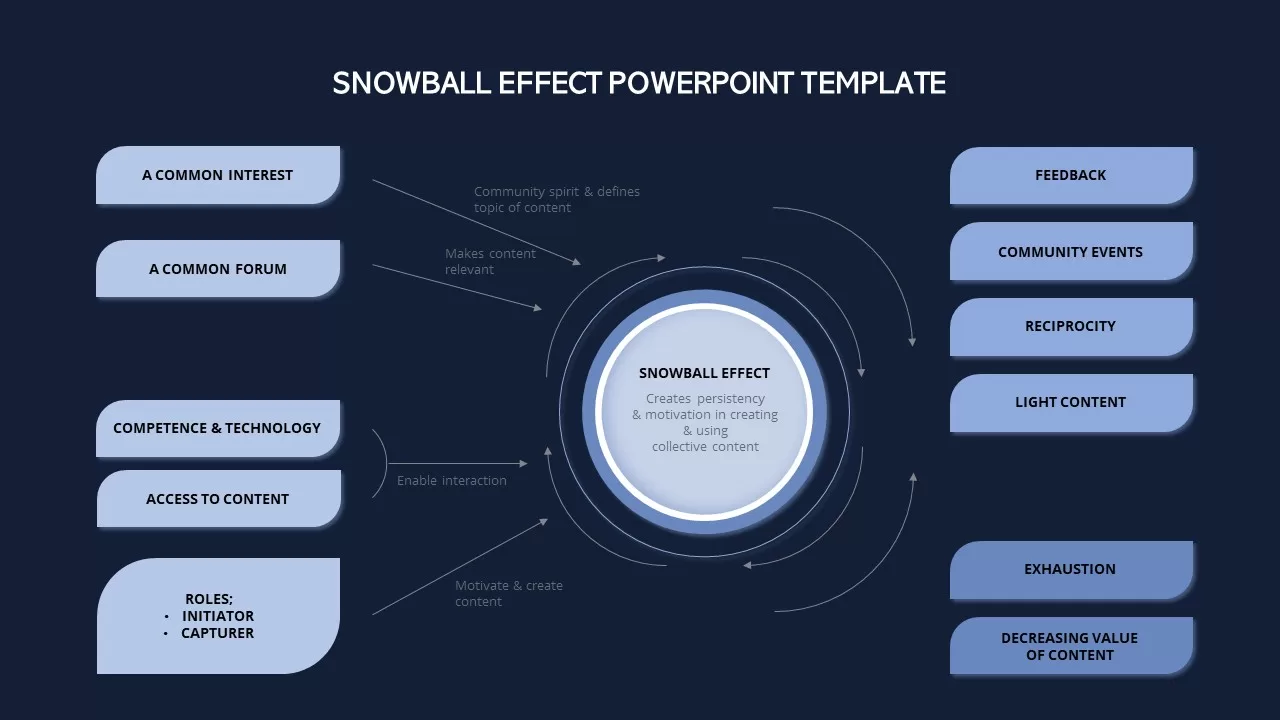
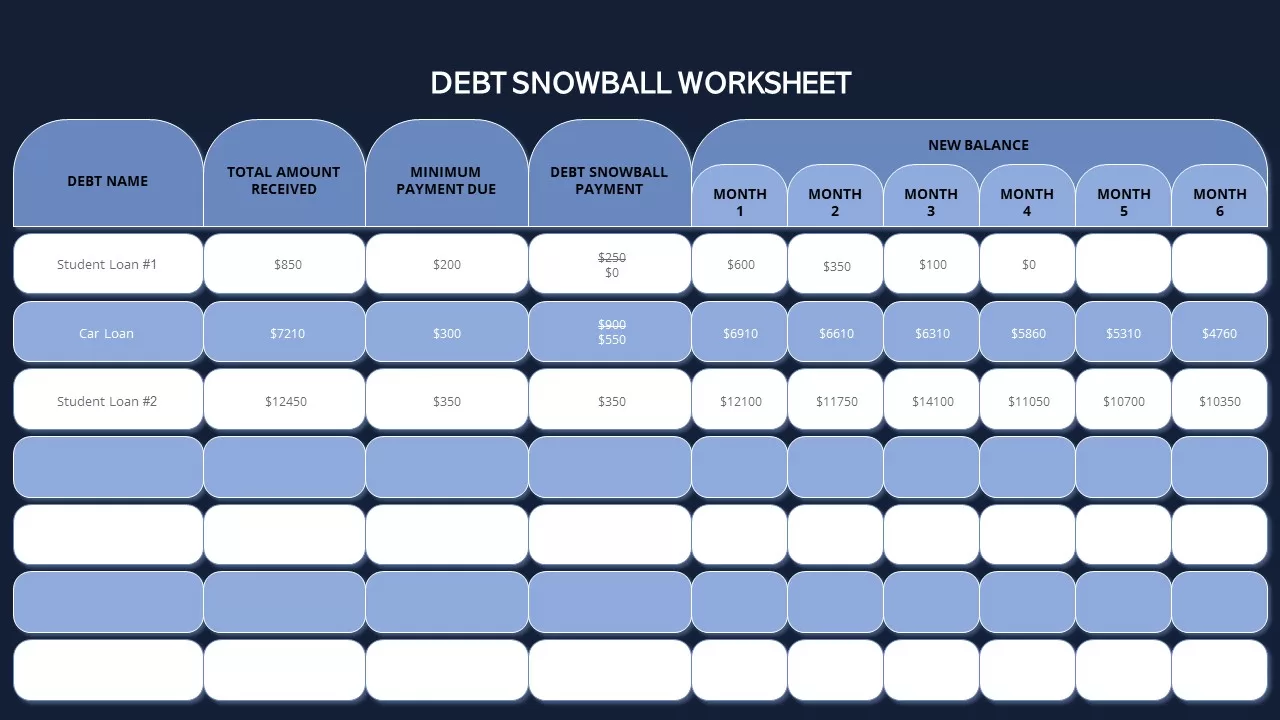
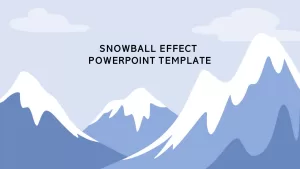
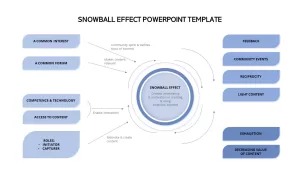
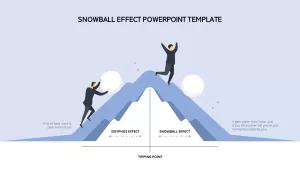
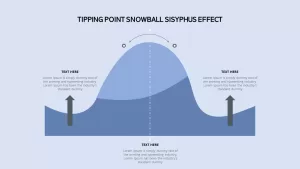
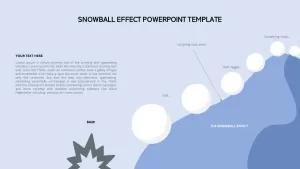
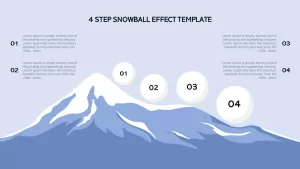
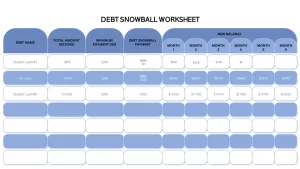
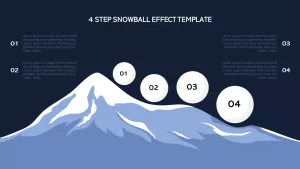
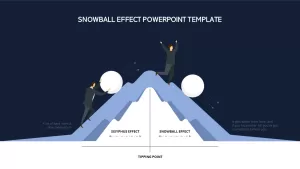
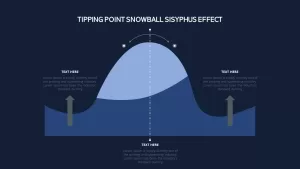
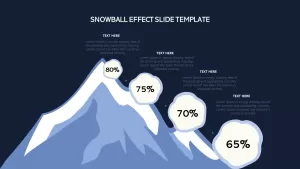
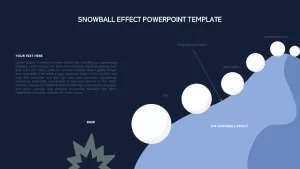
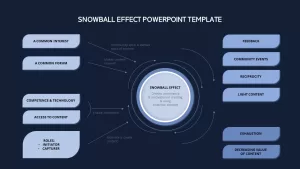
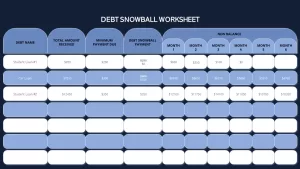
Transform abstract growth concepts into compelling visuals with this Snowball Effect Process Diagram template. Featuring layered mountain silhouettes and crisp snowcaps in shades of blue and white, the design uses step-by-step “snowball” metaphors to represent momentum, escalation, and compound impact. Prebuilt layouts include a four-step buildup diagram, tipping point area graph, Sisyphus-style cartoon, comparison charts, and a debt-snowball worksheet—each fully editable on master slides. Clean typography, intuitive icon placeholders, and subtle cloud accents ensure your audience focuses on key insights without distraction.
Customize effortlessly: swap colors, adjust fonts, or replace icons in seconds using built-in theme controls. With 16 slides optimized for both PowerPoint and Google Slides, you’ll maintain consistent branding and resolution across any device. Preconfigured transitions and entrance animations add professional flair, guiding viewers through each phase of your argument and reinforcing narrative flow. Whether you’re illustrating project milestones, funding strategies, or sampling methodologies, this template streamlines design work so you can concentrate on content.
Who is it for
Project managers, startup founders, and financial analysts will find this template ideal for demonstrating growth trajectories, funding rounds, or debt-reduction methods. Marketing strategists and researchers can leverage the snowball metaphor to showcase viral campaigns, network effects, or snowball sampling results.
Other Uses
Beyond financial or research contexts, repurpose these slides for sales forecasts, product-launch roadmaps, change-management plans, or performance reviews. Use the area graph for tipping-point analysis, the cartoon slide to lighten complex topics, and the comparison templates to weigh alternatives in boardroom pitches or academic presentations.
Login to download this file

Item ID
SB02125
Related Templates

Cause and Effect Diagram Infographic Template for PowerPoint & Google Slides
Bar/Column

Fishbone Diagram Cause-and-Effect Template for PowerPoint & Google Slides
Process
Fishbone Cause and Effect Diagram Template for PowerPoint & Google Slides
Process
Five-Input Cause and Effect Diagram Template for PowerPoint & Google Slides
Arrow
Underwater Fishbone Cause-Effect Diagram Template for PowerPoint & Google Slides
Process
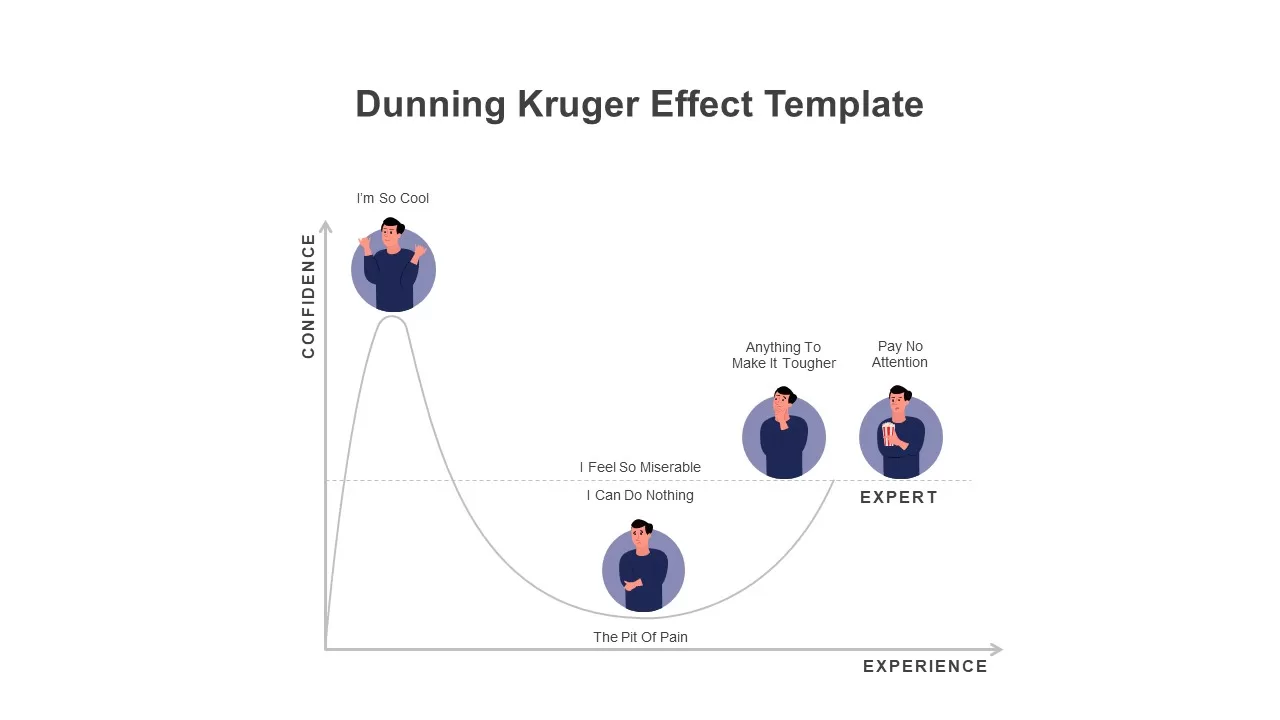
Modern Dunning Kruger Effect Diagram Template for PowerPoint & Google Slides
Business
5Cs of Network Effect Circular Diagram Template for PowerPoint & Google Slides
Circular
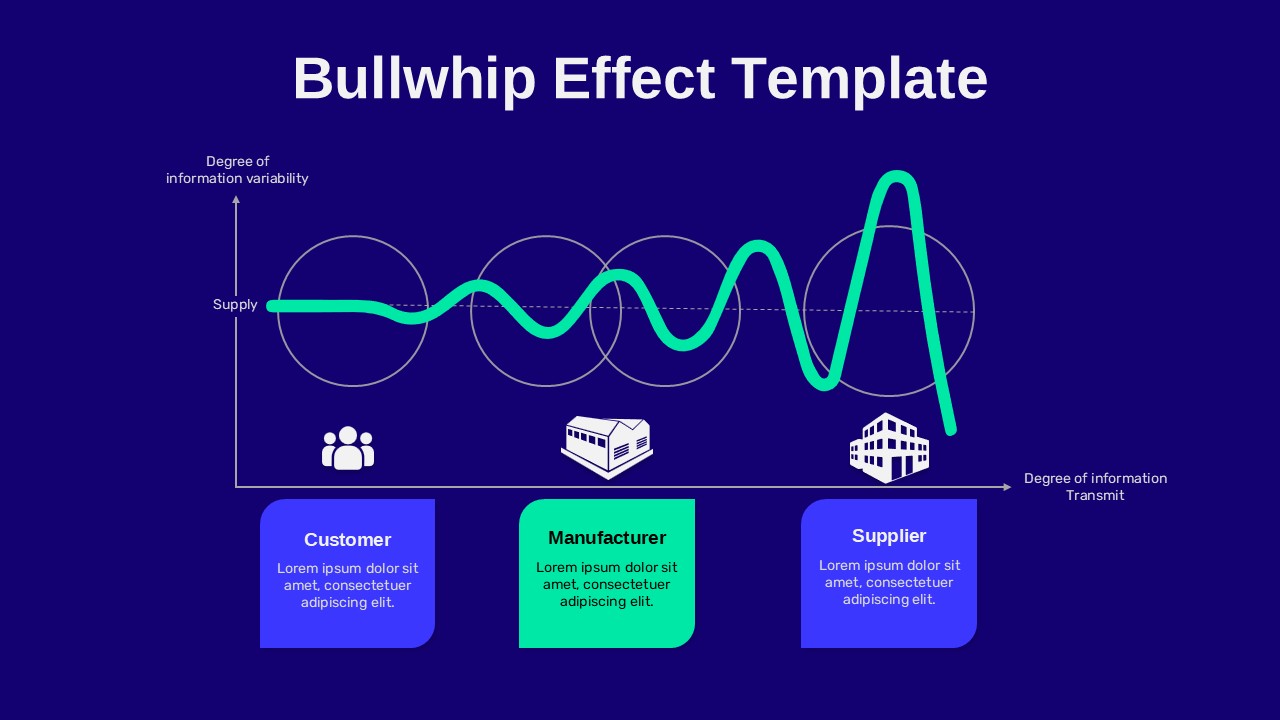
Bullwhip Effect Supply Chain Variability Diagram Template for PowerPoint & Google Slides
Business Models
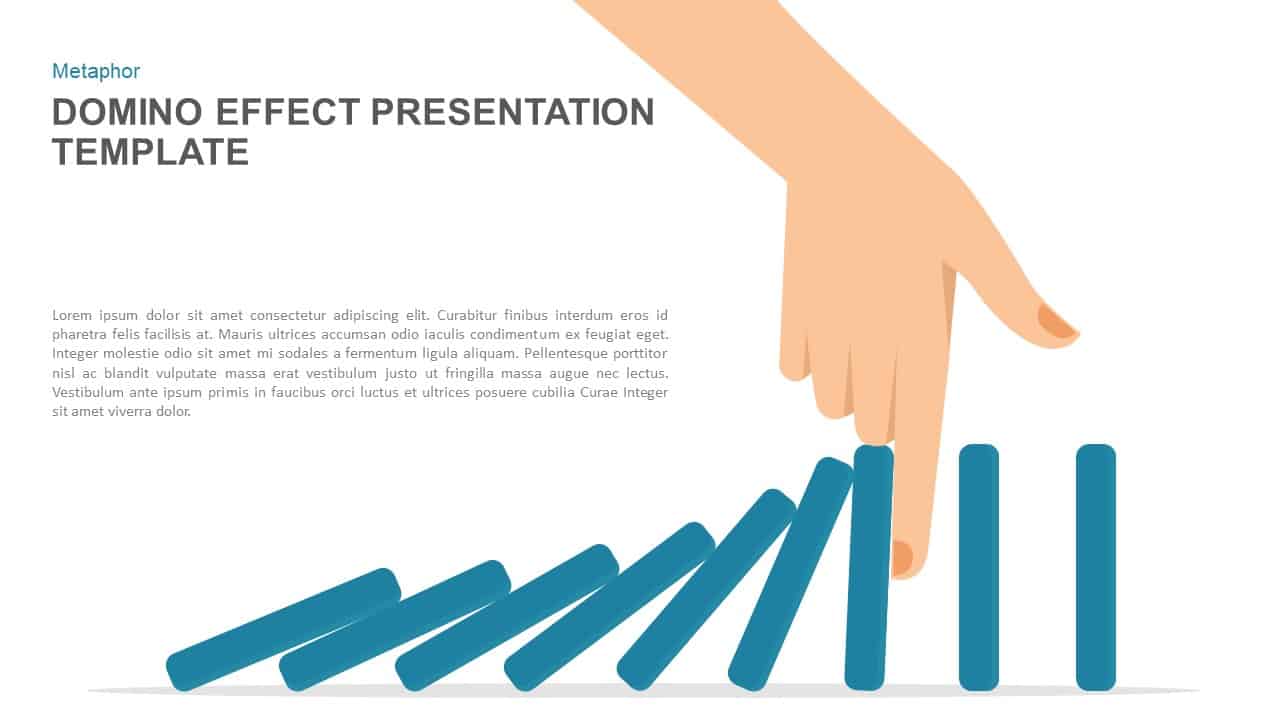
Domino Effect Prevention Presentation Template for PowerPoint & Google Slides
Process
Fishbone Cause and Effect Infographic Template for PowerPoint & Google Slides
Infographics
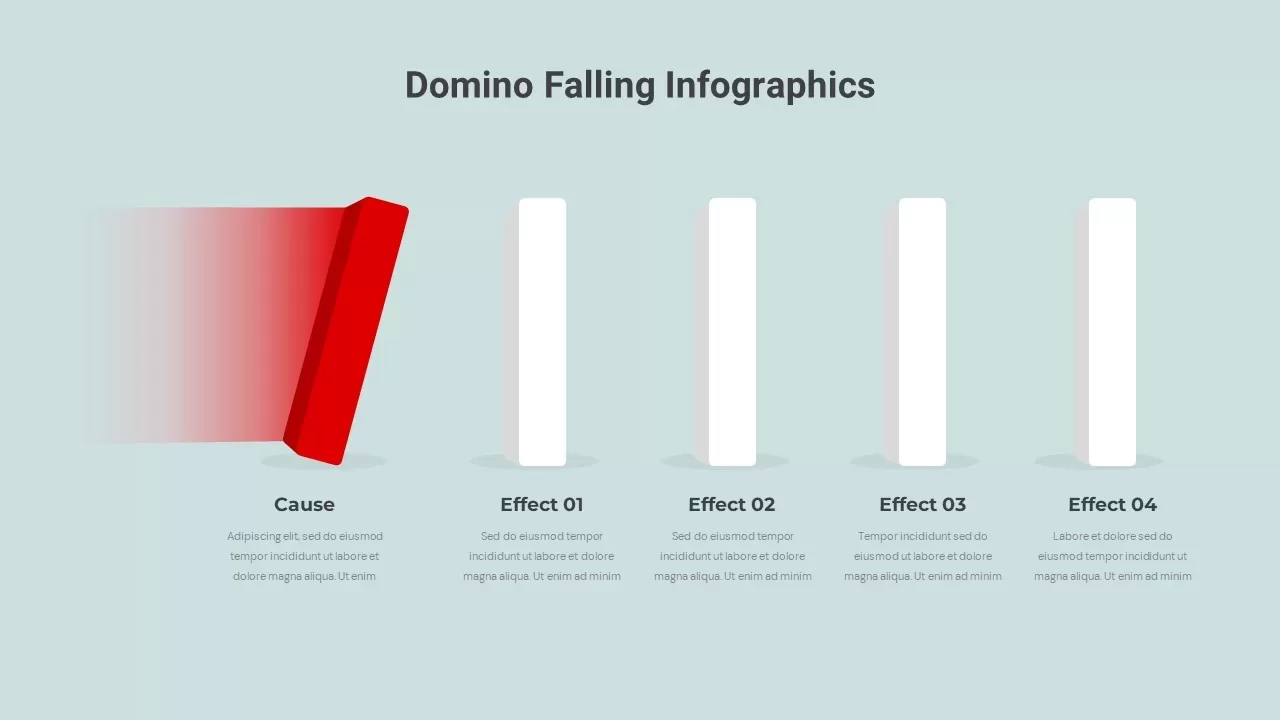
Domino Effect Sequential Infographics Template for PowerPoint & Google Slides
Process
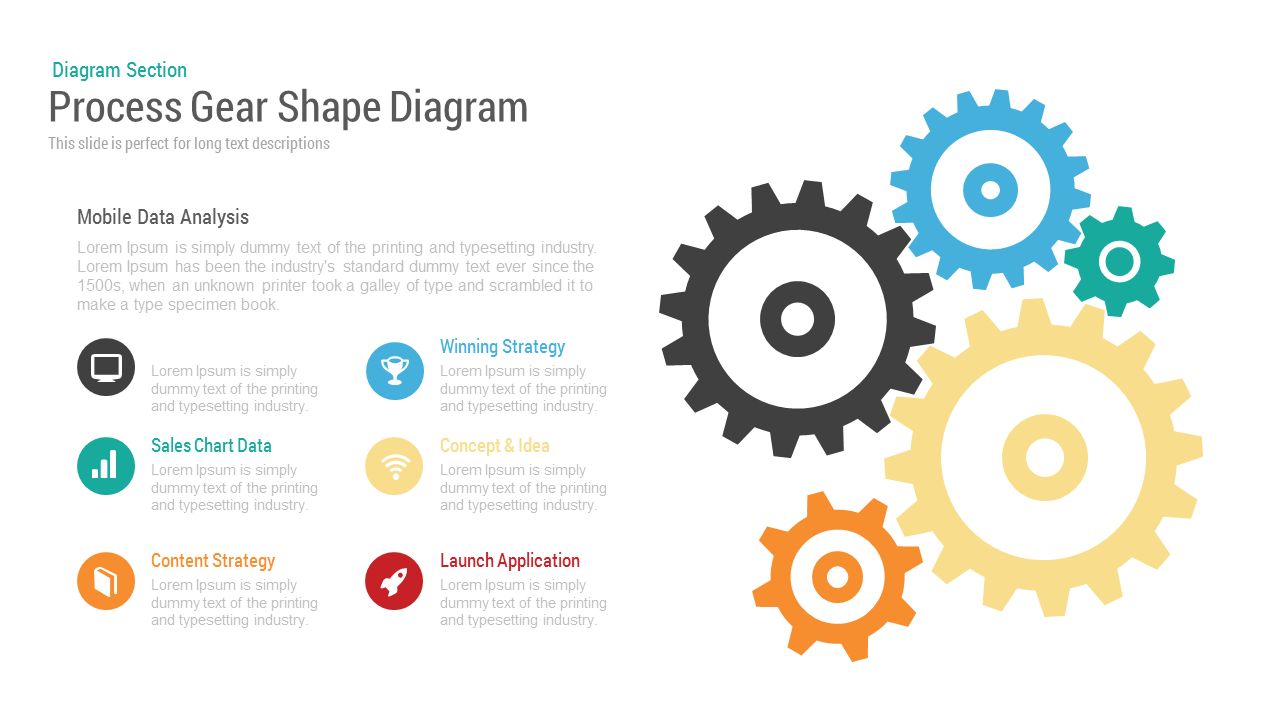
Gear Process Diagram PowerPoint Template for PowerPoint & Google Slides
Process
Sales Process Workflow Funnel Diagram PowerPoint Template for PowerPoint & Google Slides
Funnel
Gear Process Diagram template for PowerPoint & Google Slides
Process
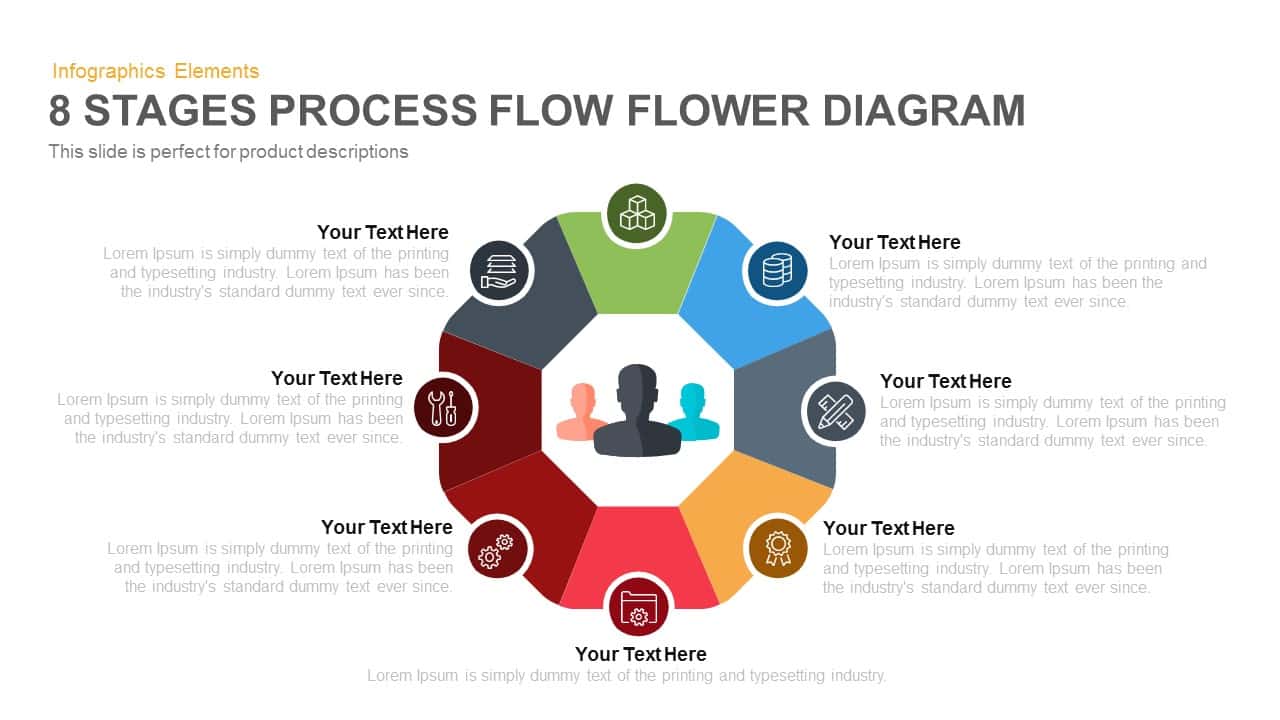
8-Stage Process Flow Flower Diagram Template for PowerPoint & Google Slides
Infographics
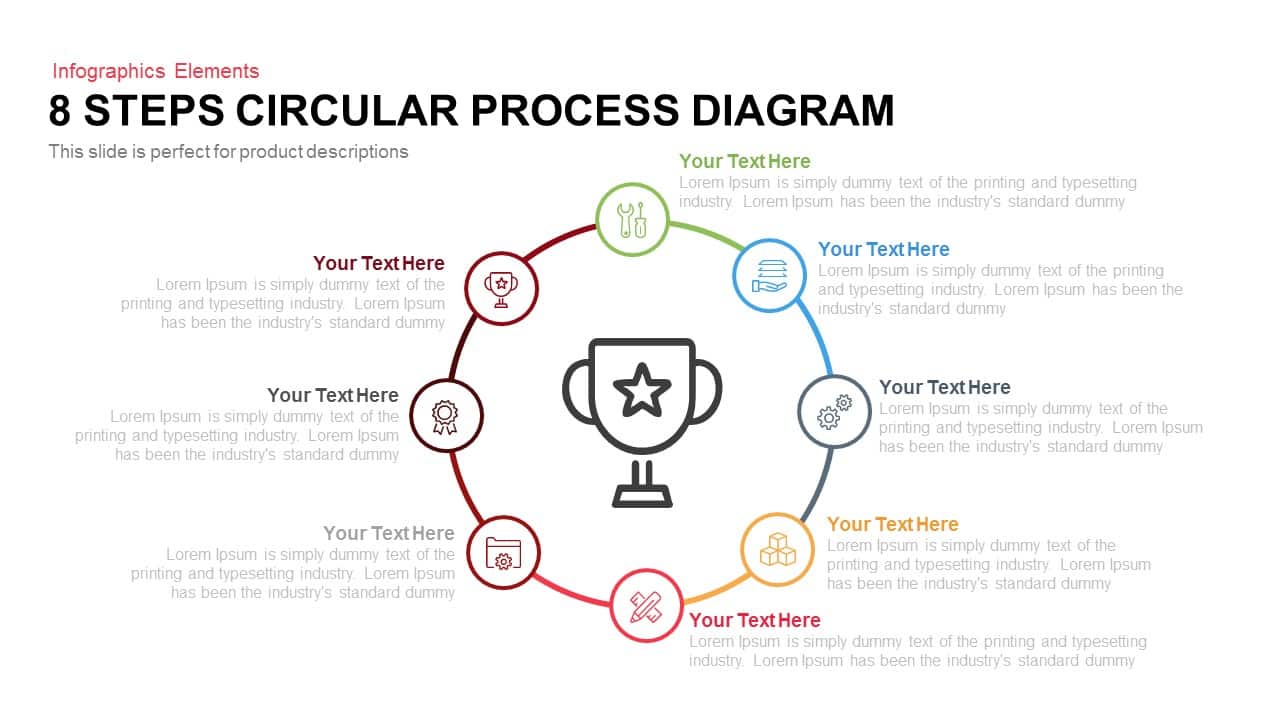
8 Steps Circular Process Diagram Template for PowerPoint & Google Slides
Process
Six Arrow Radial Process Diagram template for PowerPoint & Google Slides
Infographics
Three-Section Fishbone Process Diagram template for PowerPoint & Google Slides
Process
Three Circle Arrow Process Diagram template for PowerPoint & Google Slides
Circular
Six Stage Zigzag Process Diagram Template for PowerPoint & Google Slides
Process
Process Flow Diagram template for PowerPoint & Google Slides
Infographics
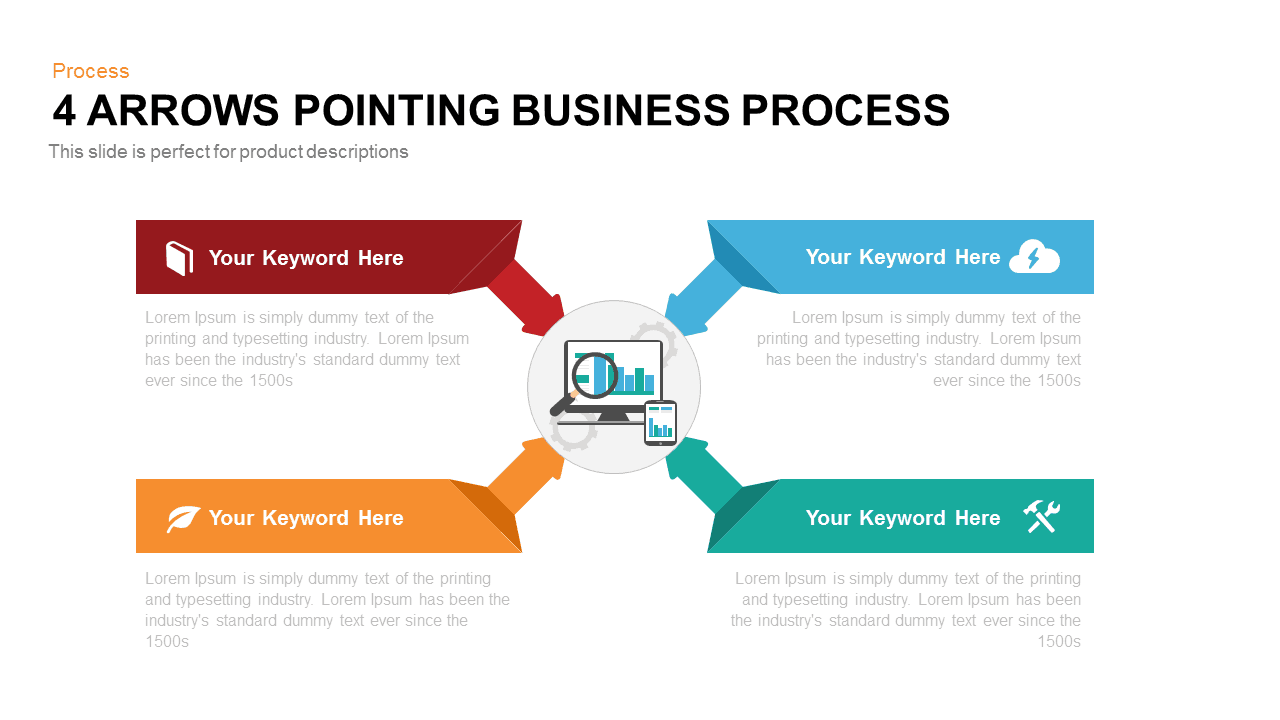
Four Arrows Business Process Diagram template for PowerPoint & Google Slides
Process

Five-Step Gear Process Diagram Template for PowerPoint & Google Slides
Process
Arrow Stage Process Diagram template for PowerPoint & Google Slides
Arrow
Roadmap Six-Step Process Diagram Template for PowerPoint & Google Slides
Roadmap
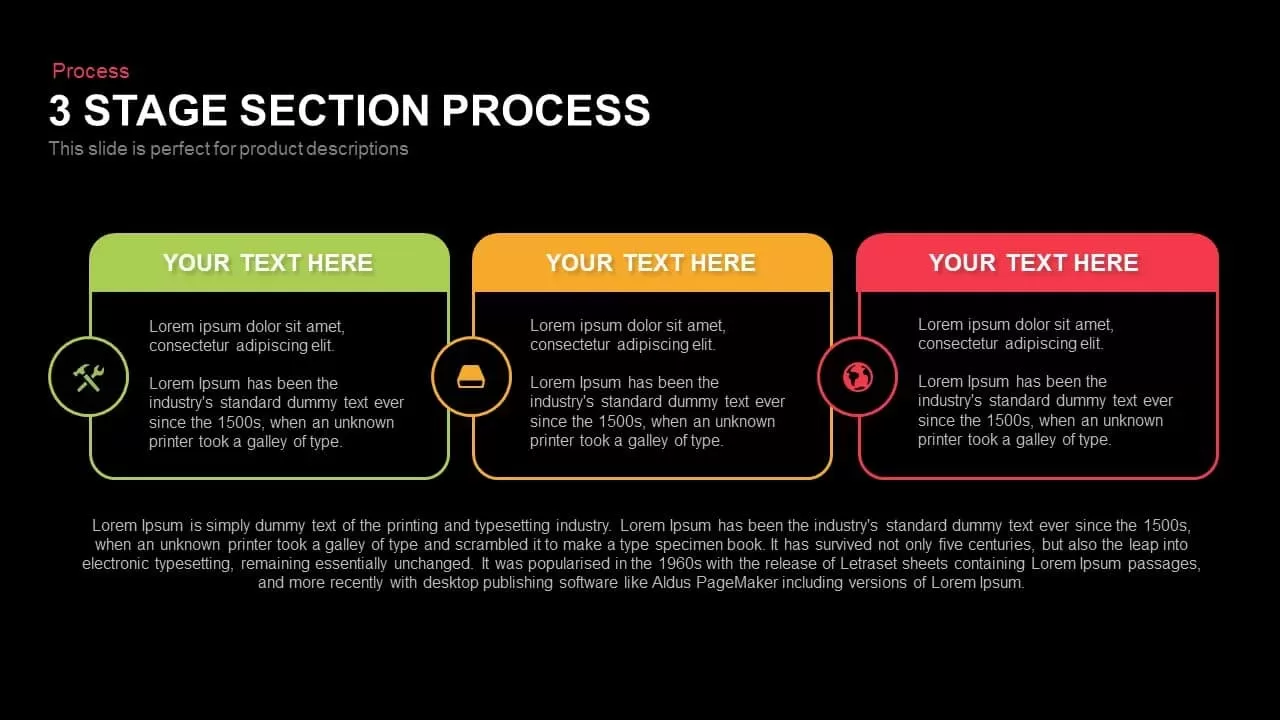
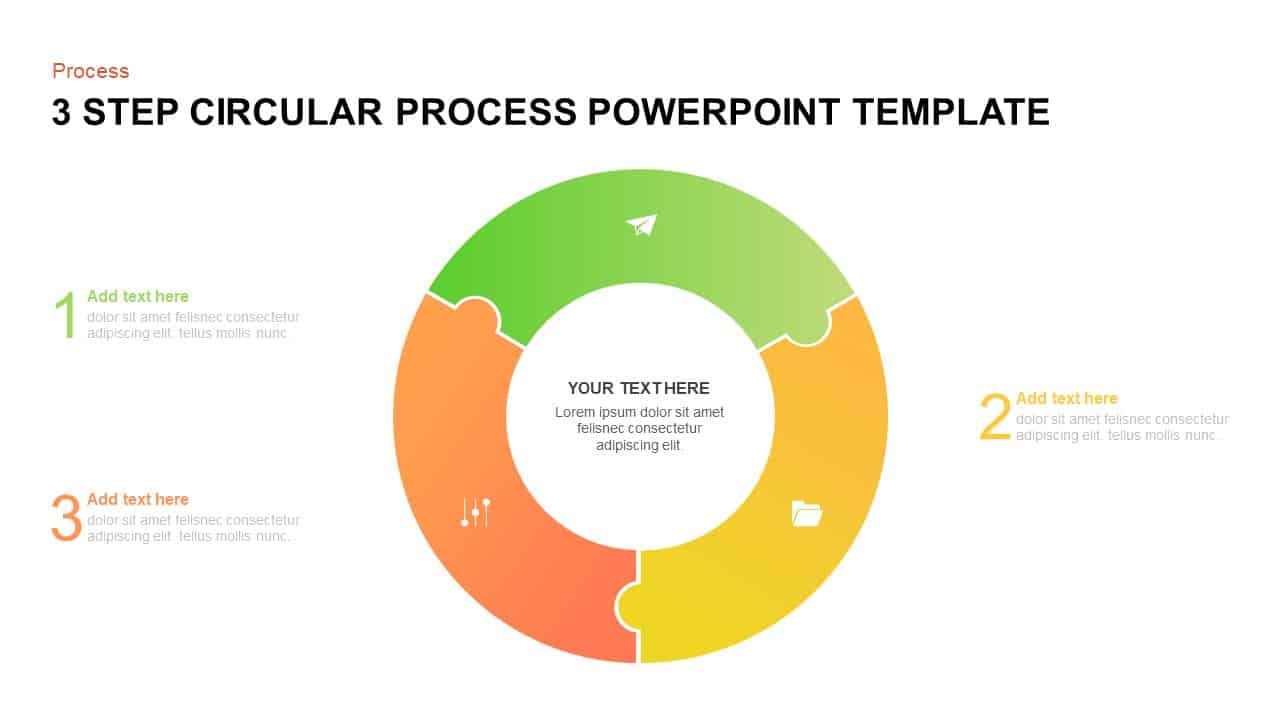
3 Stage Section Process Diagram Template for PowerPoint & Google Slides
Process

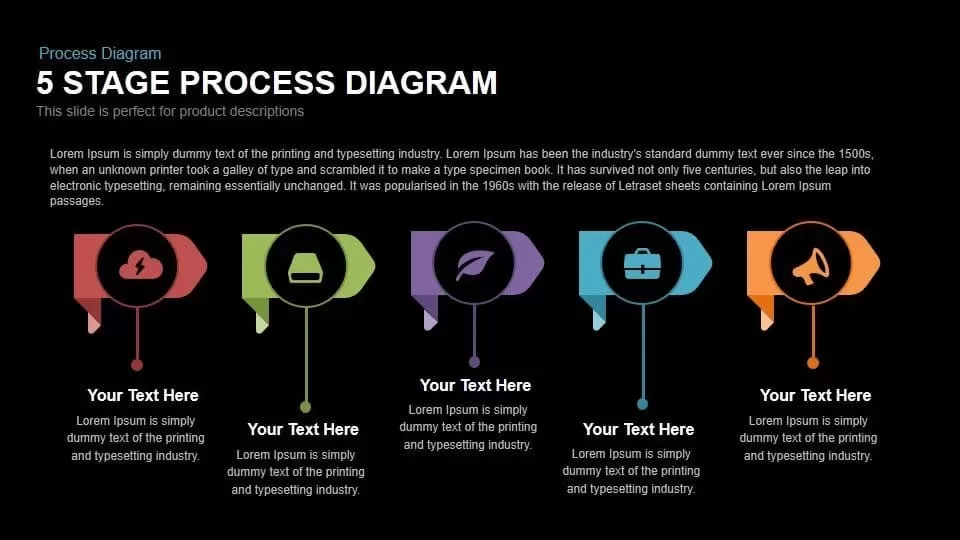
5 Stage Process Diagram Slide Overview Template for PowerPoint & Google Slides
Process

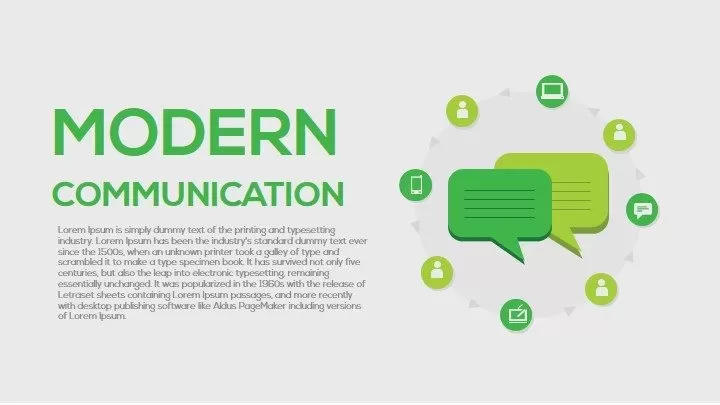
Modern Communication Process Diagram Template for PowerPoint & Google Slides
Process
Dynamic 4 Gear Process Diagram Template for PowerPoint & Google Slides
Process
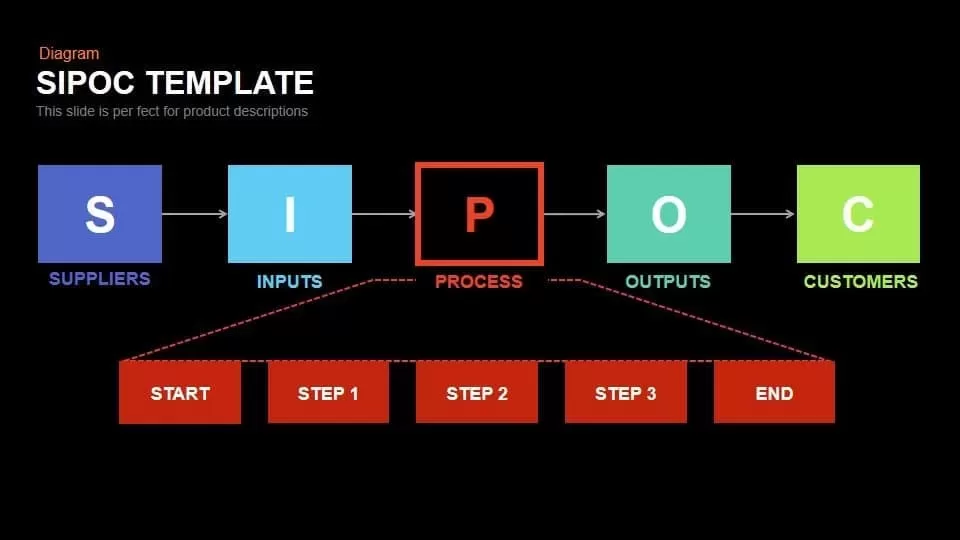
SIPOC Diagram with Process Breakdown Template for PowerPoint & Google Slides
Process
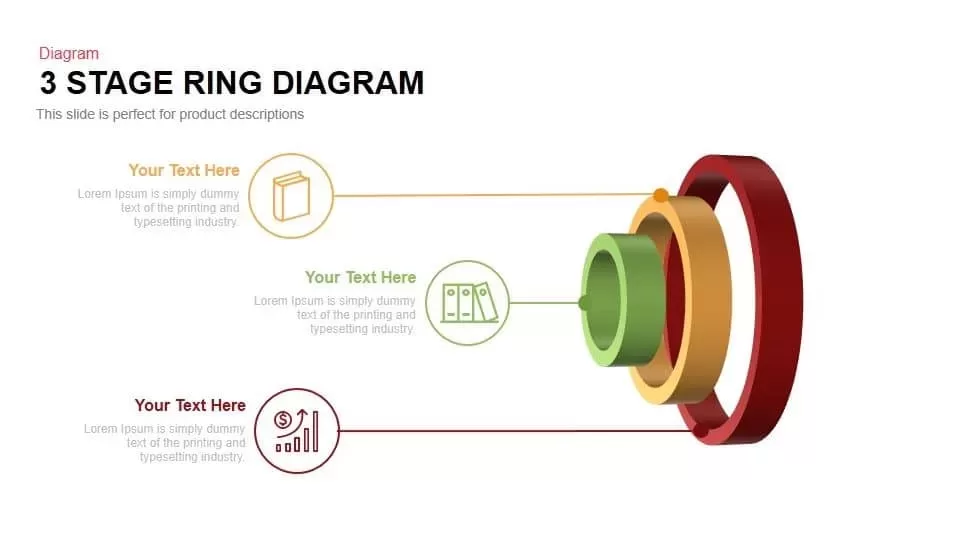
Three-Stage Ring Process Diagram Template for PowerPoint & Google Slides
Circular
Seven-Stage Arrow Process Diagram Template for PowerPoint & Google Slides
Process
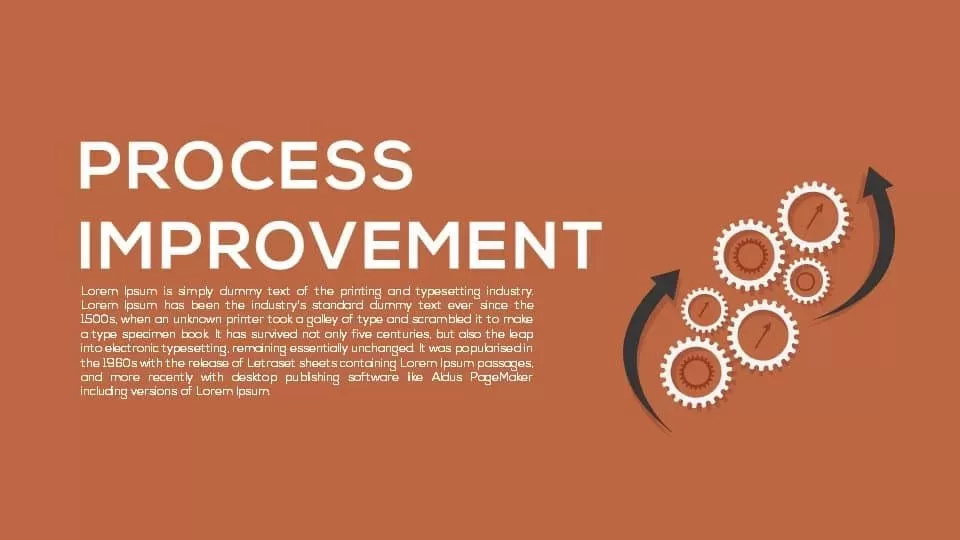
Process Improvement Metaphor Diagram Template for PowerPoint & Google Slides
Process
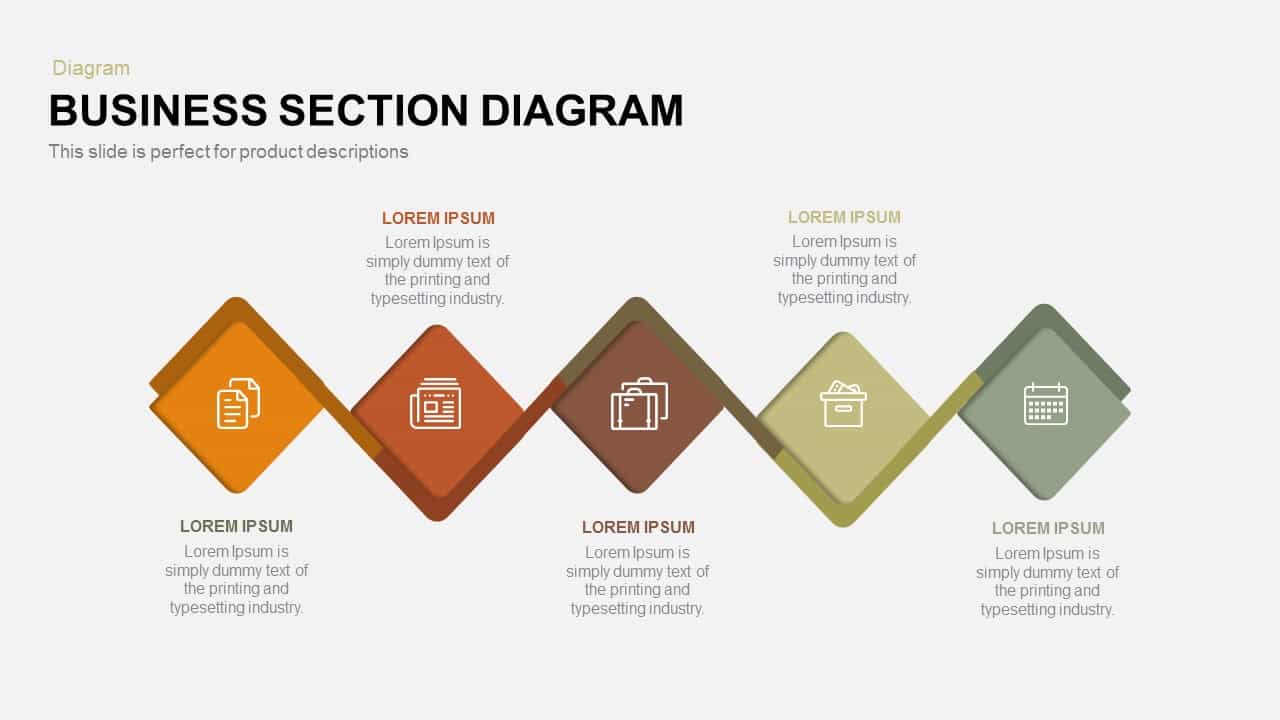
Business Section Diamond Process Diagram Template for PowerPoint & Google Slides
Process
Modern Five-Stage Cycle Process Diagram Template for PowerPoint & Google Slides
Process
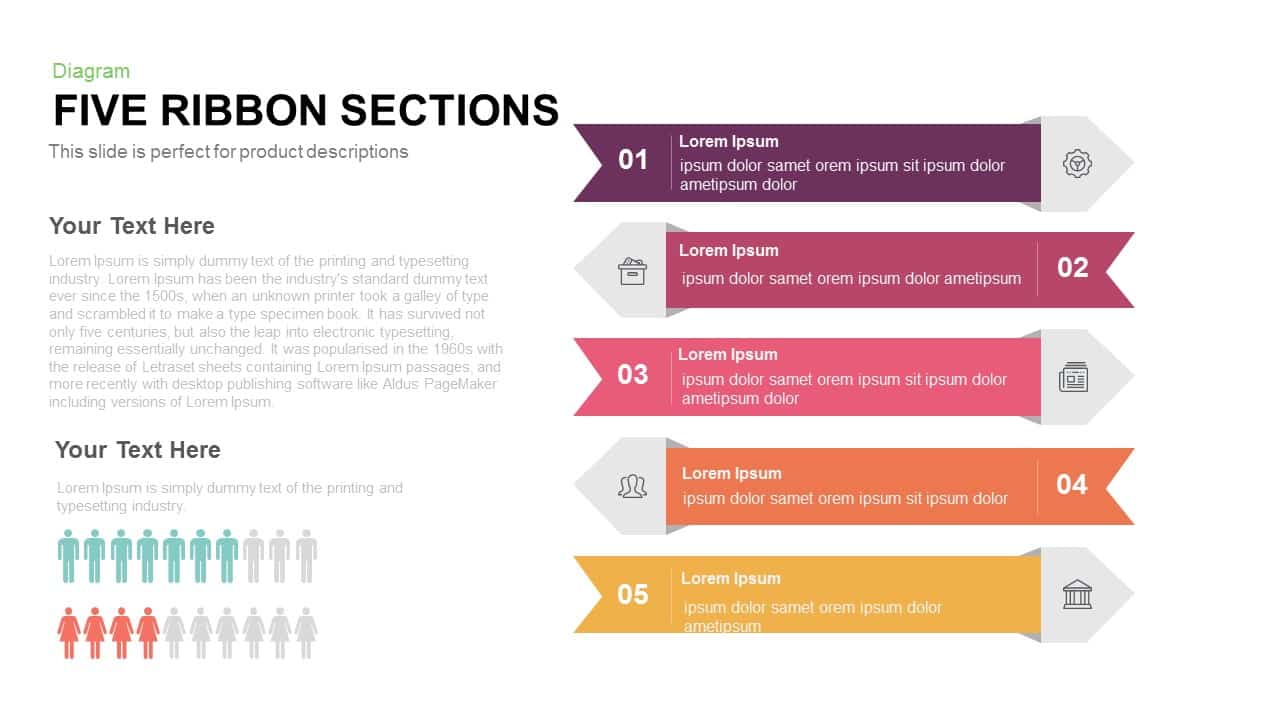
Five Ribbon Sections Process Diagram Template for PowerPoint & Google Slides
Process
Editable Six-Step Bubble Process Diagram Template for PowerPoint & Google Slides
Process
Free Six Stage Bubble Process Diagram template for PowerPoint & Google Slides
Process
Free

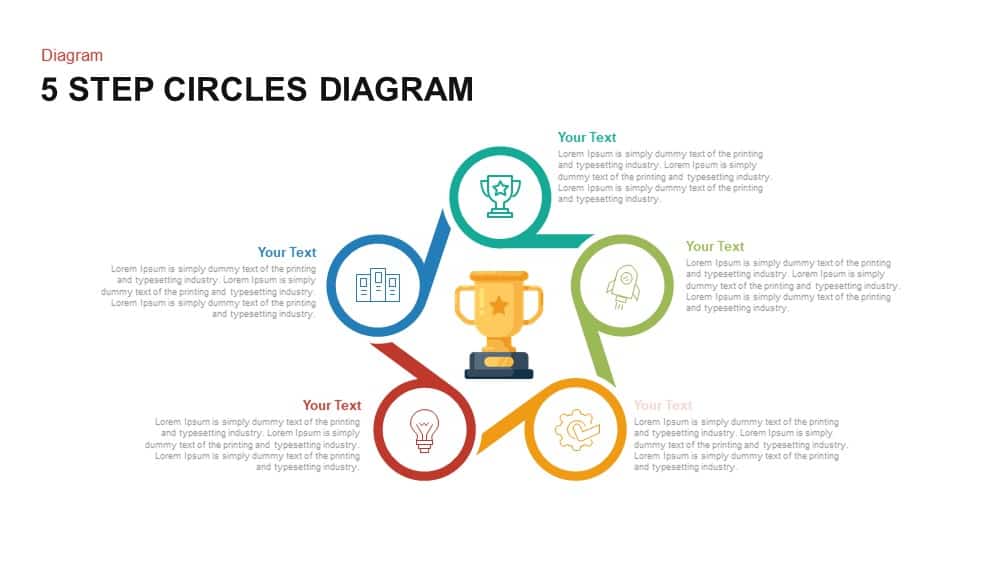
Modern Five-Step Circles Process Diagram Template for PowerPoint & Google Slides
Circular
Six-Stage Circle Process Diagram Template for PowerPoint & Google Slides
Process
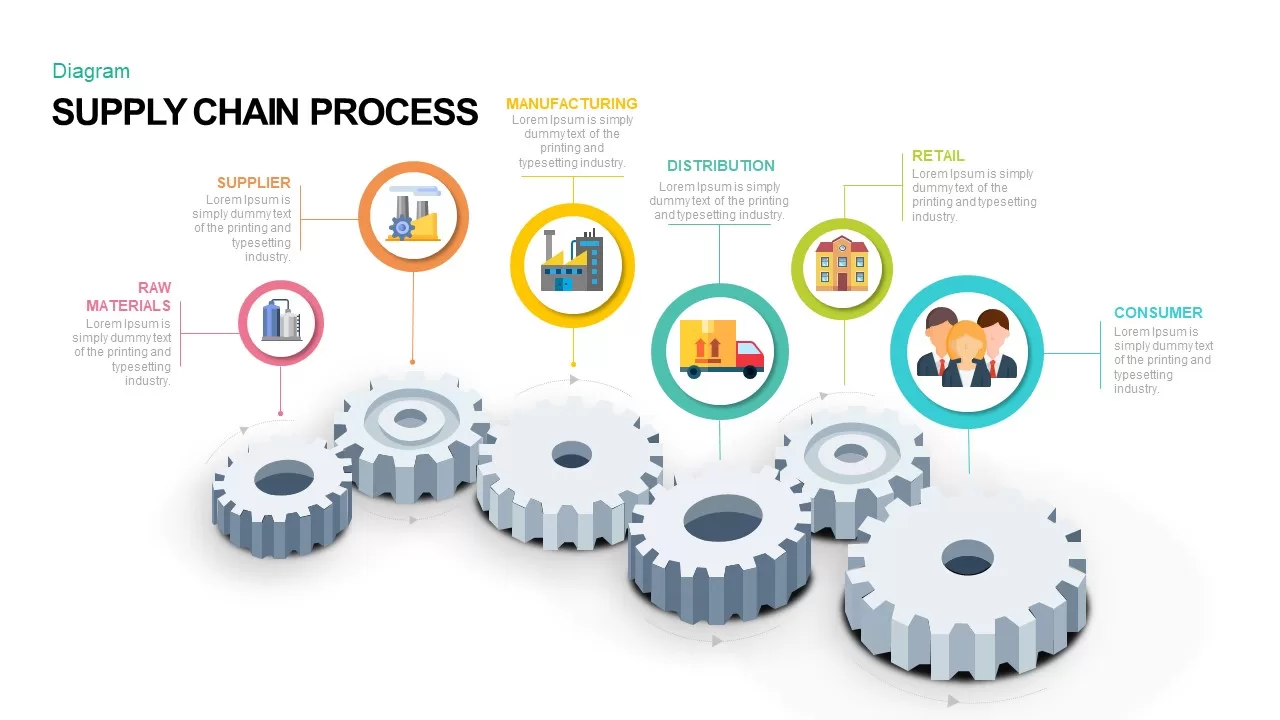
Supply Chain Process Gear Diagram Template for PowerPoint & Google Slides
Process
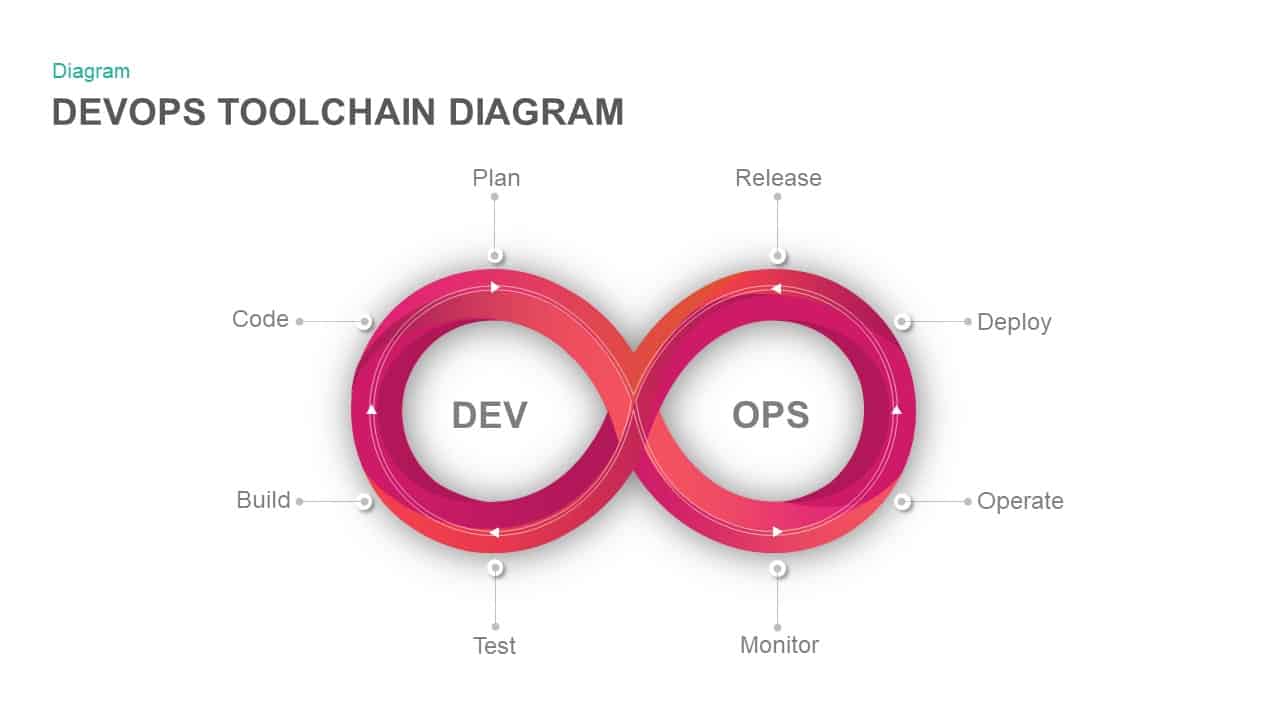
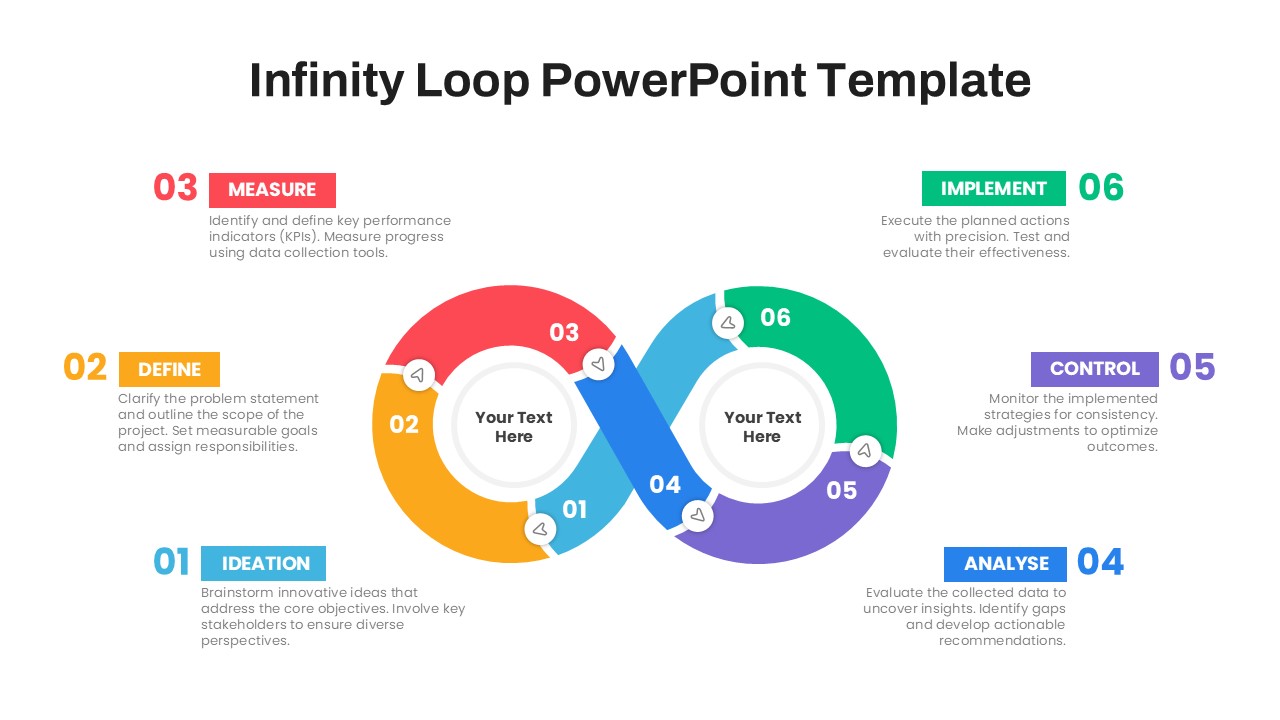
DevOps Infinity Loop Process Diagram Template for PowerPoint & Google Slides
Process
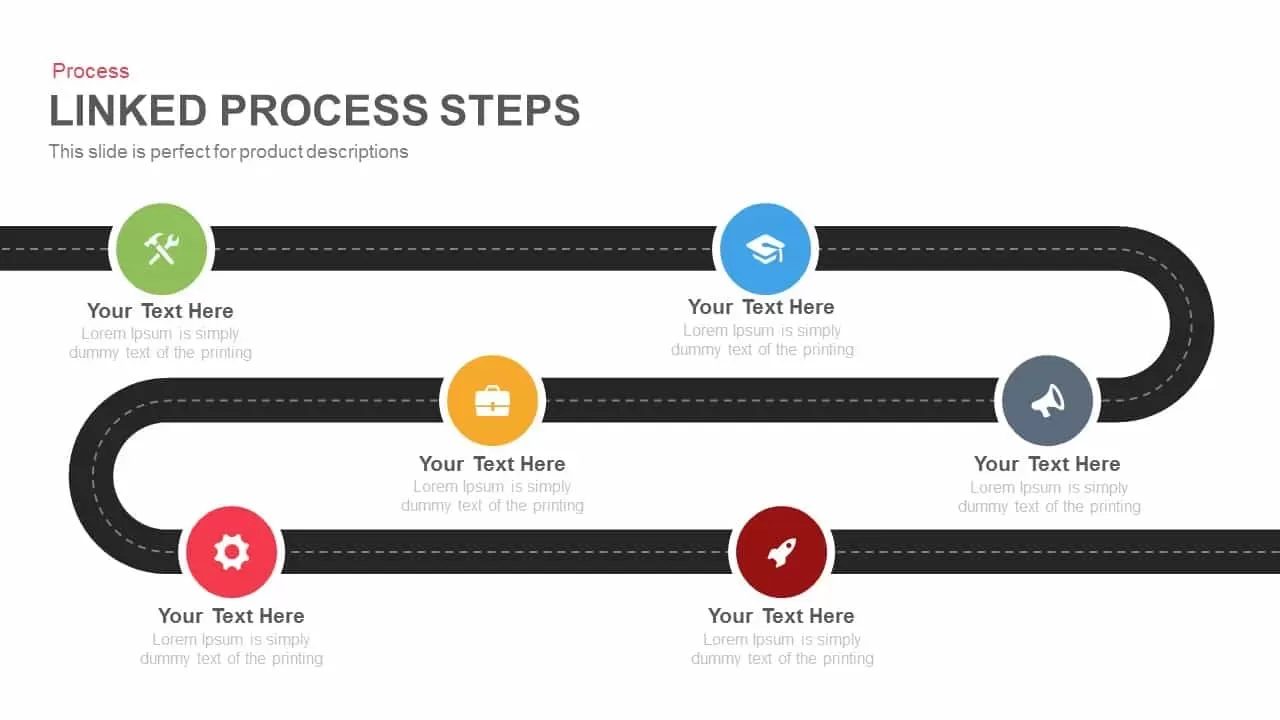
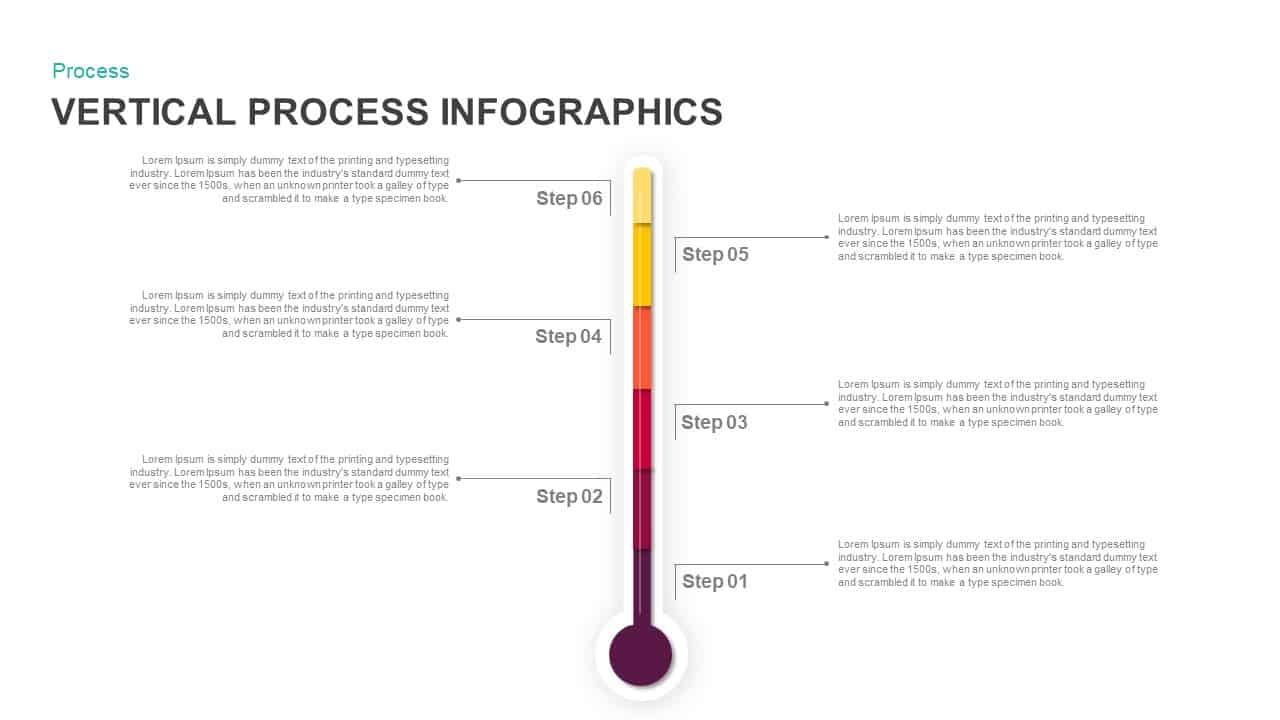
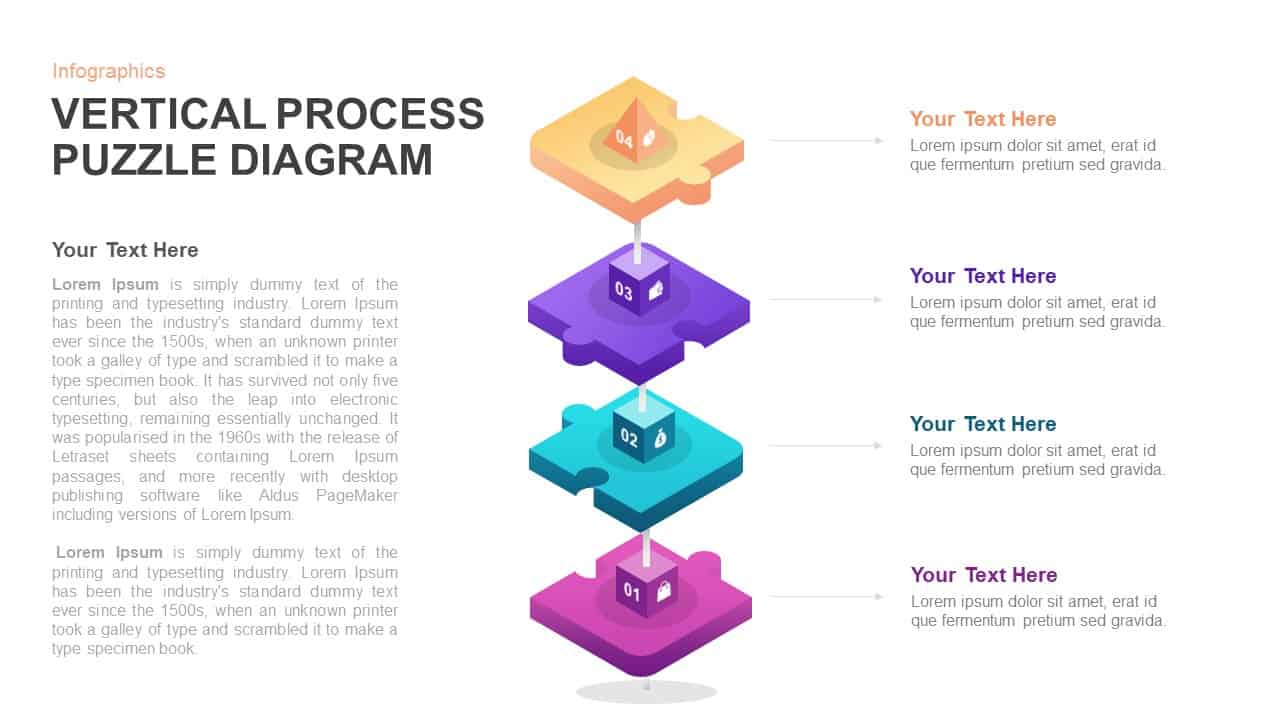
Six-Step Vertical Process Diagram Template for PowerPoint & Google Slides
Process
4 Staged Circular Business Process Diagram template for PowerPoint & Google Slides
Process

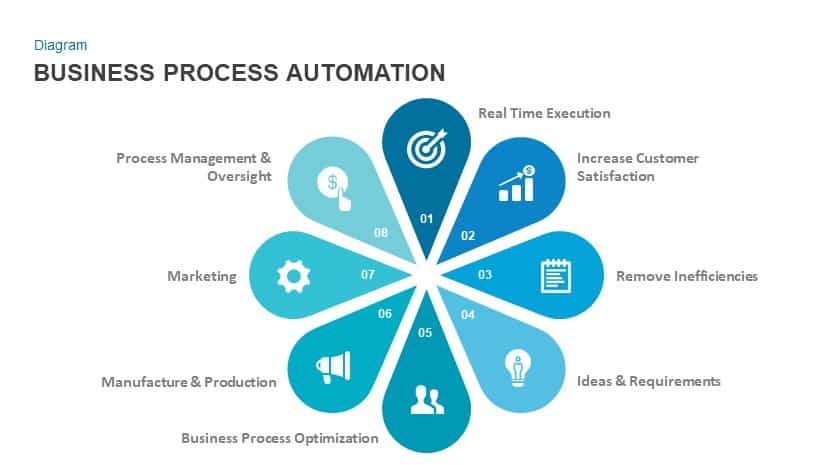
Business Process Automation Diagram Template for PowerPoint & Google Slides
Process
Six-Step Linear Arrow Process Diagram Template for PowerPoint & Google Slides
Process
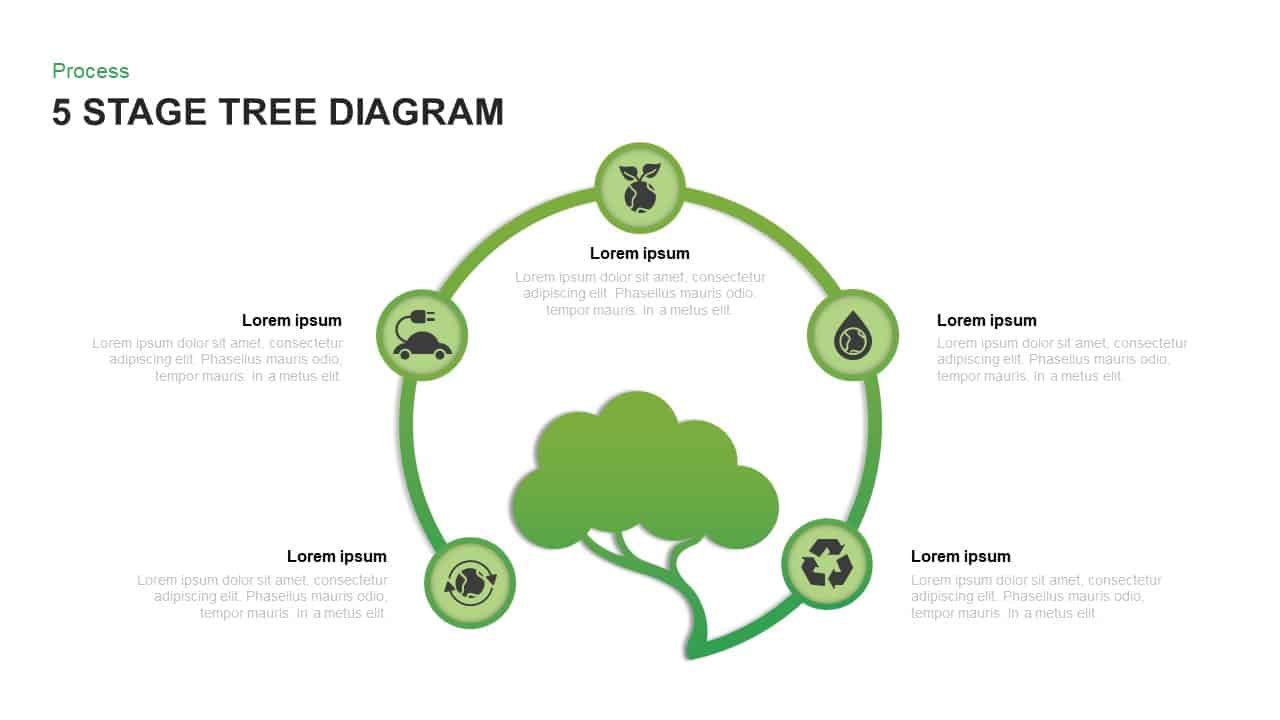
Five-Stage Eco Tree Process Diagram Template for PowerPoint & Google Slides
Process
Six-Stage Circular Diagram Process Template for PowerPoint & Google Slides
Circular
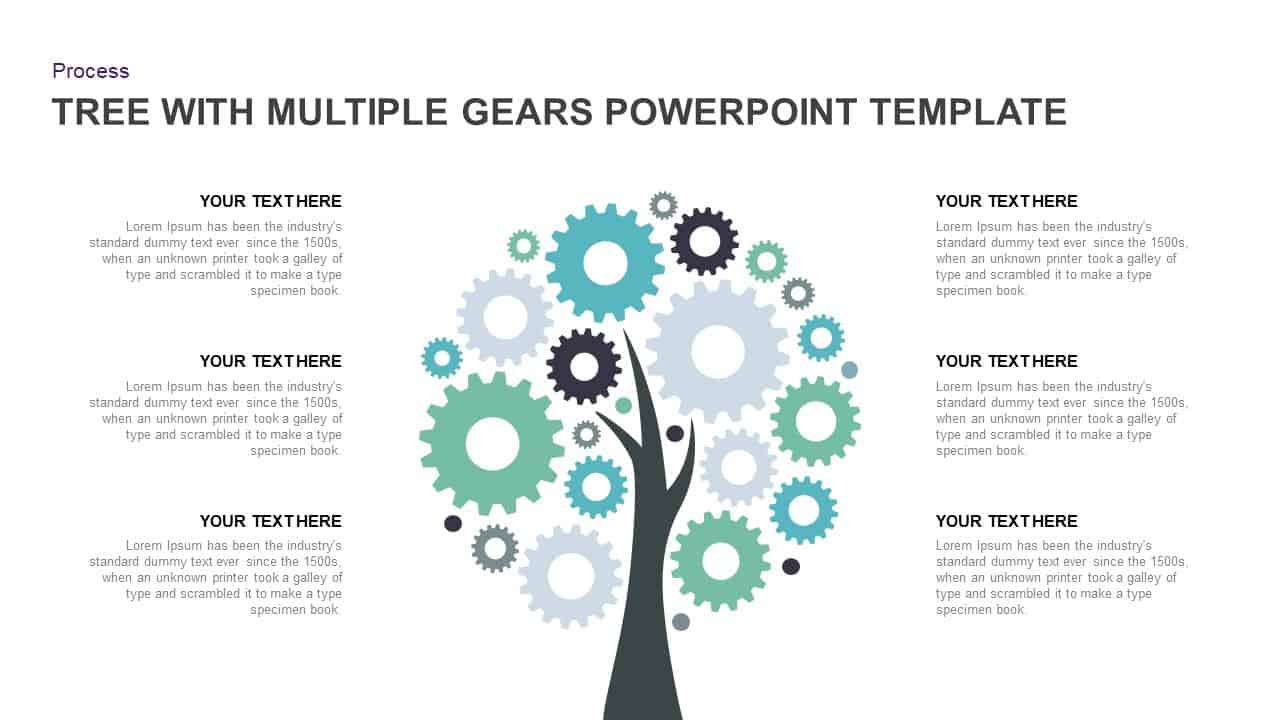
Tree Diagram with Gears Process Template for PowerPoint & Google Slides
Process
Three-Way Decision Process Arrow Diagram Template for PowerPoint & Google Slides
Arrow
Five-Step Circular Process Diagram Template for PowerPoint & Google Slides
Circular
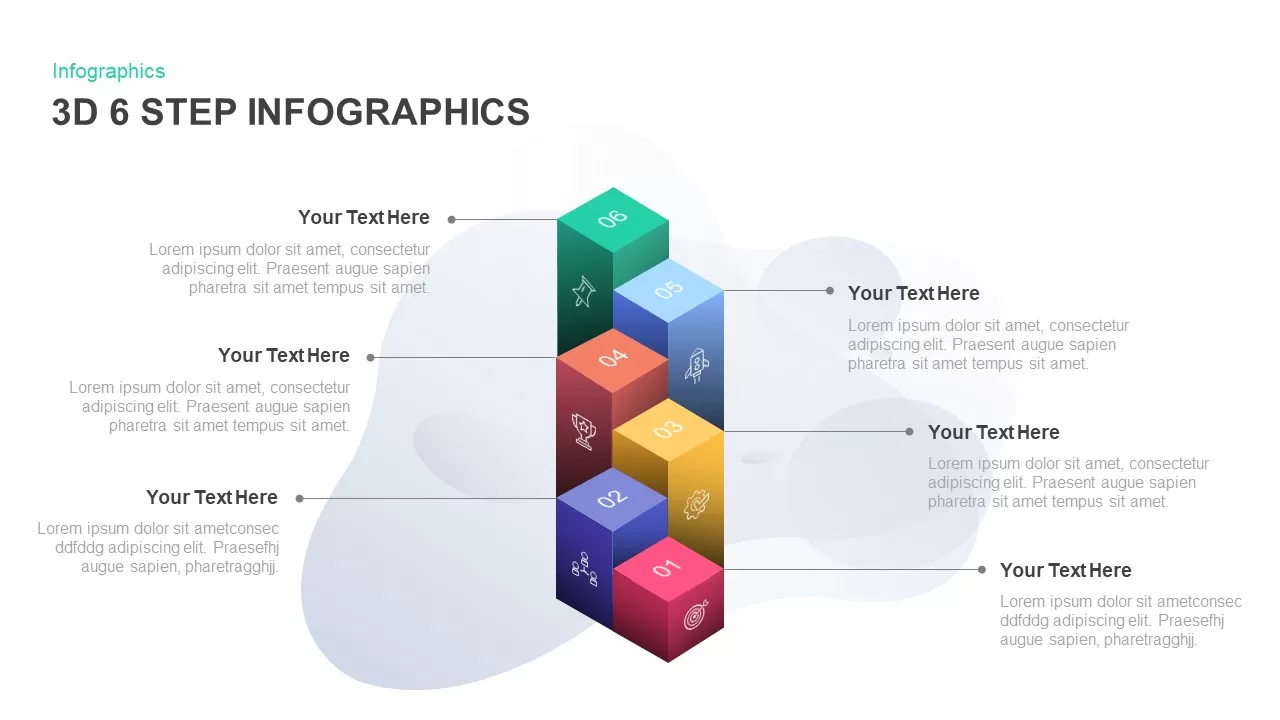
3D 6-Step Infographics Process Diagram Template for PowerPoint & Google Slides
Infographics
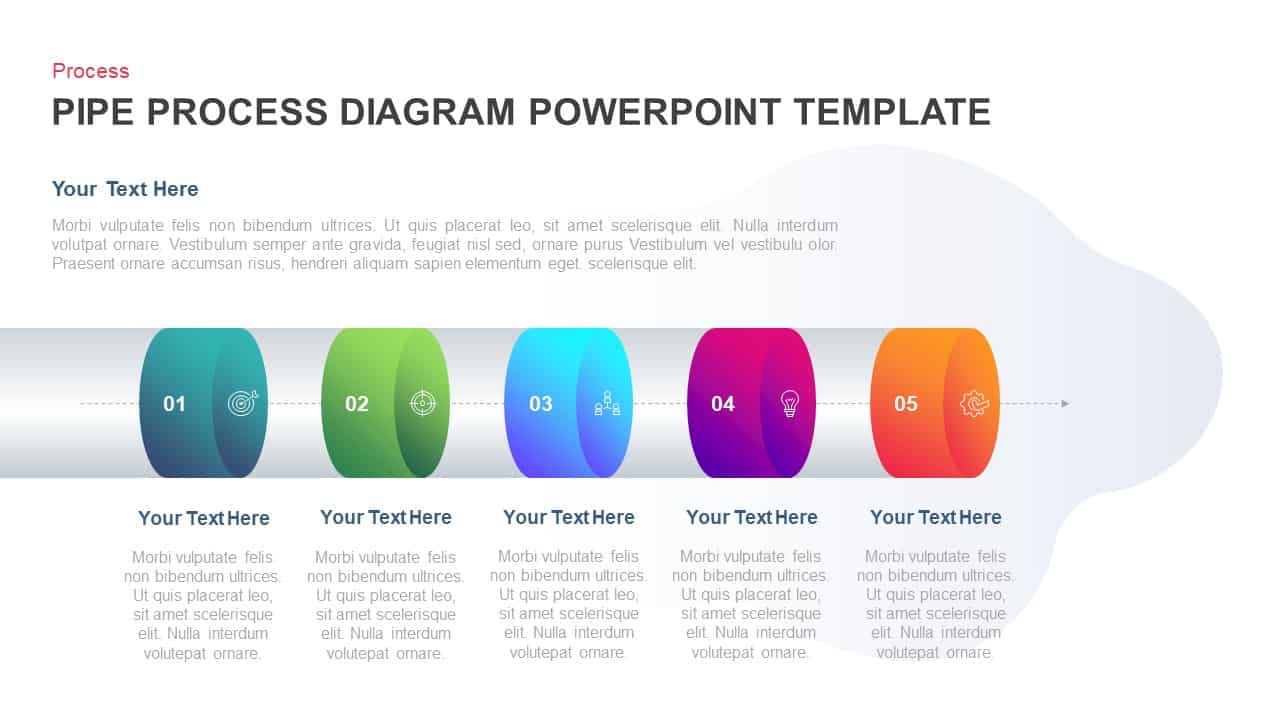
Five-Stage Pipe Process Diagram Template for PowerPoint & Google Slides
Process
Three to Nine-Step Puzzle Ring Process Diagram Template for PowerPoint & Google Slides
Circular
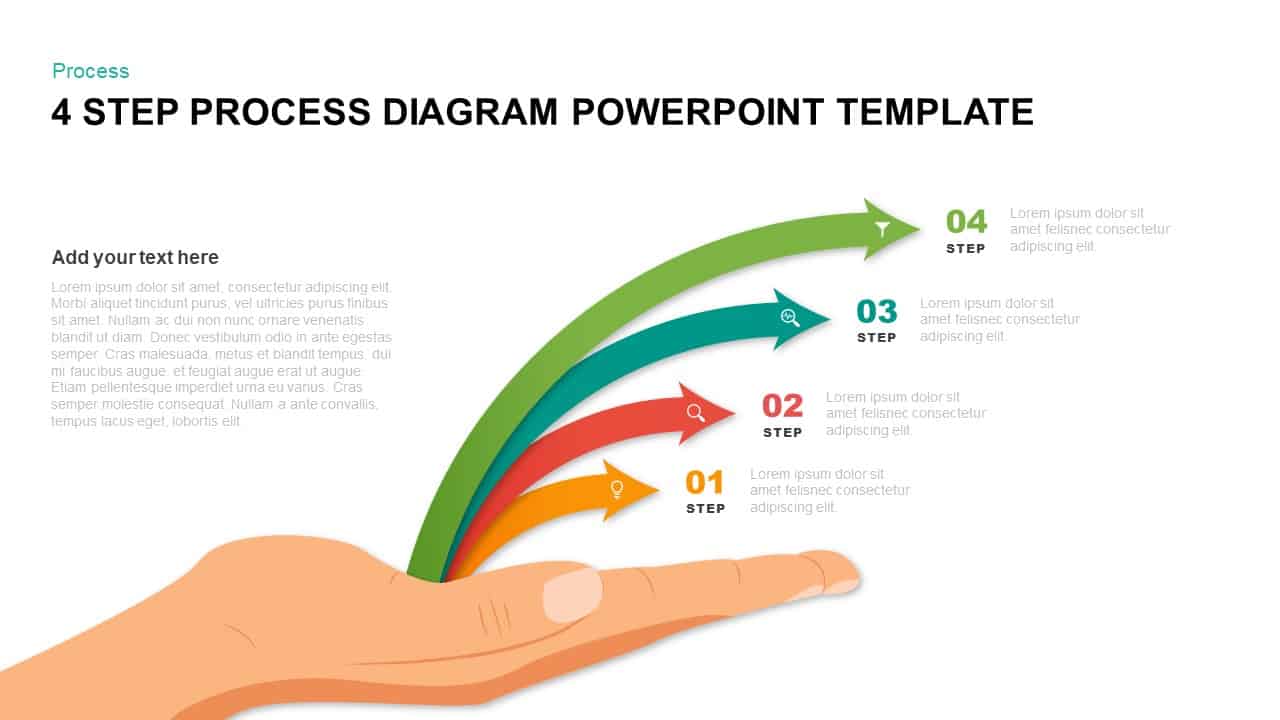
Hand-Held Four-Step Process Diagram Template for PowerPoint & Google Slides
Process
5 Stage Linear Process Flow Diagram Template for PowerPoint & Google Slides
Process
4 Stage Linear Process Flow Diagram Template for PowerPoint & Google Slides
Process
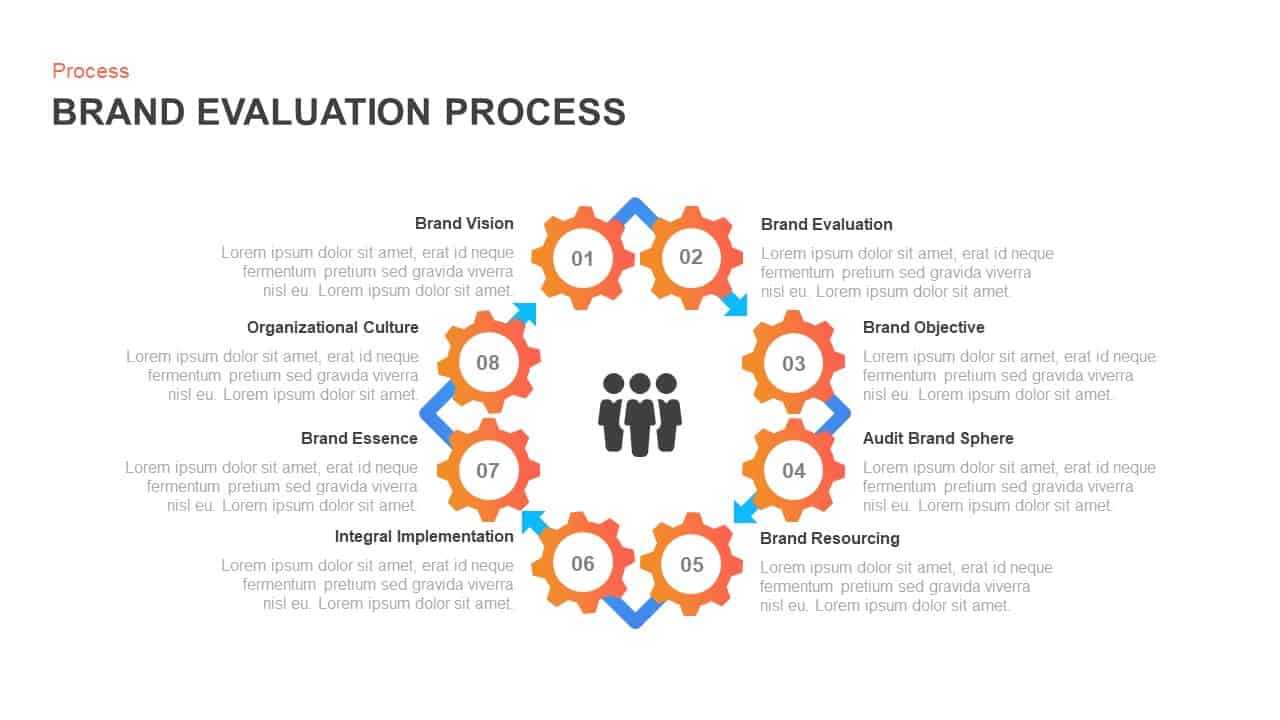
8-Stage Brand Evaluation Process Diagram Template for PowerPoint & Google Slides
Process
8 Step Circular Process Flow Diagram Template for PowerPoint & Google Slides
Process
Three-Step Flowchart Process Diagram Template for PowerPoint & Google Slides
Flow Charts
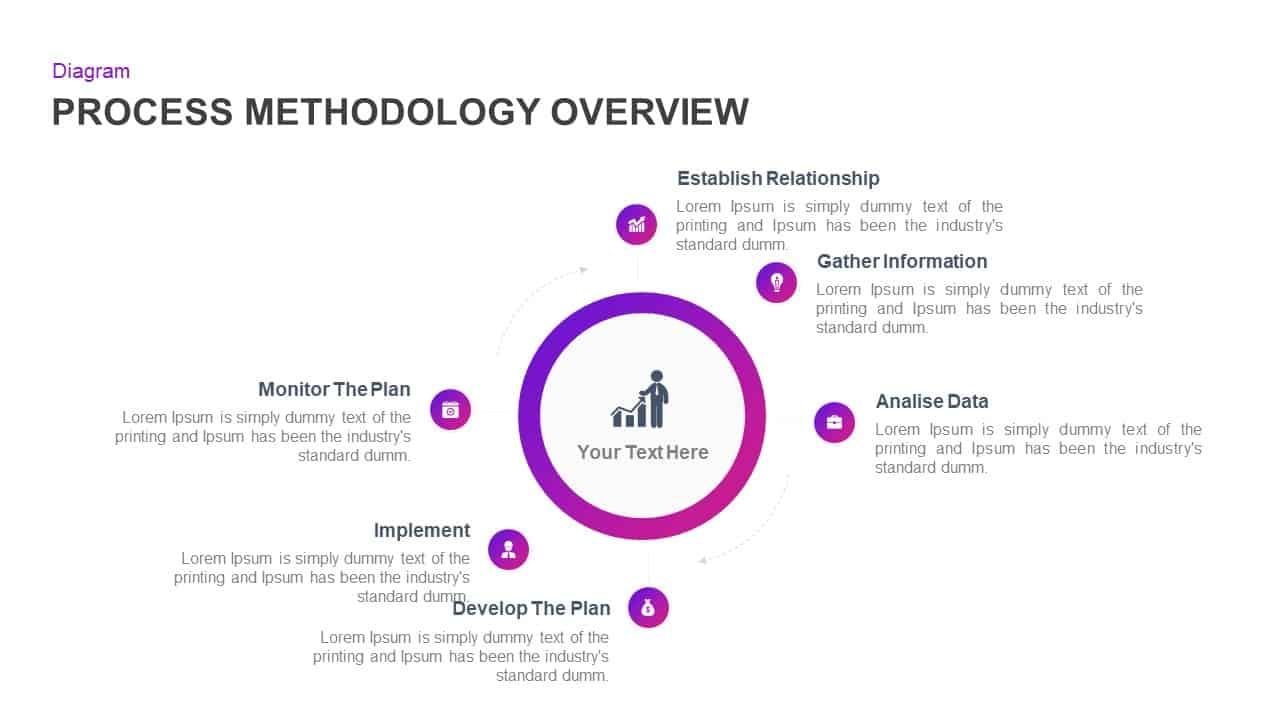
Process Methodology Overview Diagram Template for PowerPoint & Google Slides
Process
6-Step Circular Process Flow Diagram Template for PowerPoint & Google Slides
Process
Six-Step Infinity Loop Process Diagram Template for PowerPoint & Google Slides
Process
Six Sigma 6S Process Infographic Diagram Template for PowerPoint & Google Slides
Process
Six-Circle Process Infographic Diagram Template for PowerPoint & Google Slides
Circular
Vertical 4-Step Puzzle Process Diagram Template for PowerPoint & Google Slides
Process
Business Process Management Flow Diagram Template for PowerPoint & Google Slides
Process

Circular CRM Process Infographic Diagram Template for PowerPoint & Google Slides
Circular
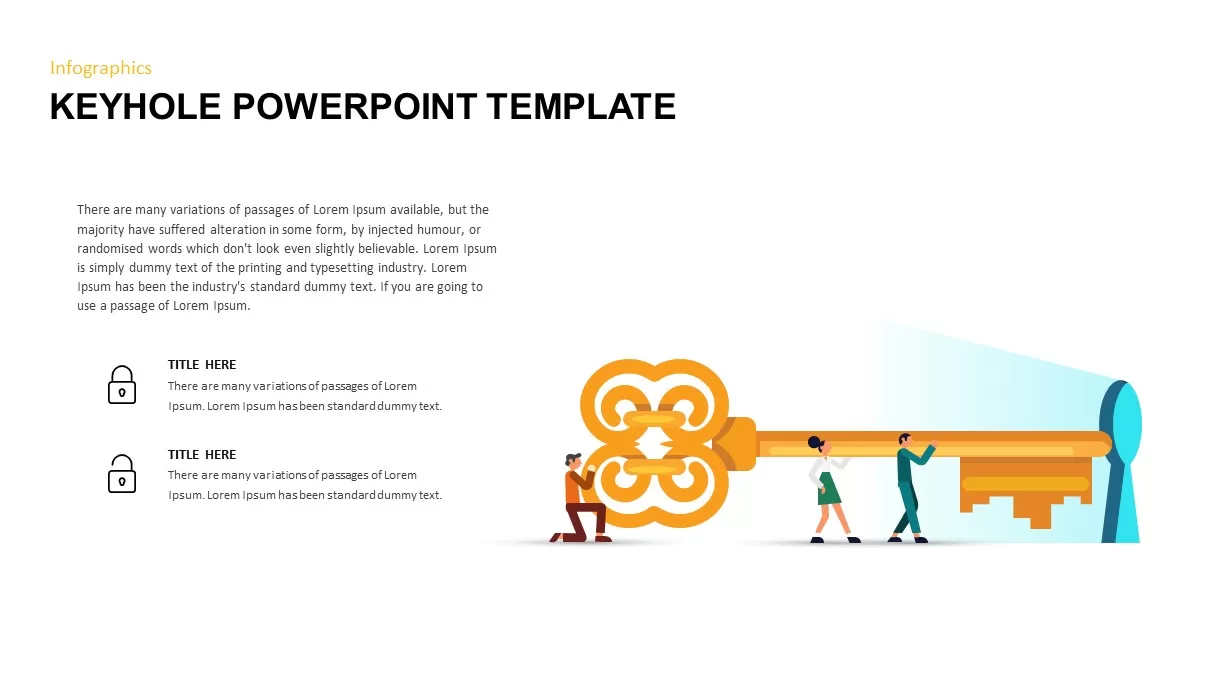
Keyhole Infographic Process Diagram Template for PowerPoint & Google Slides
Process
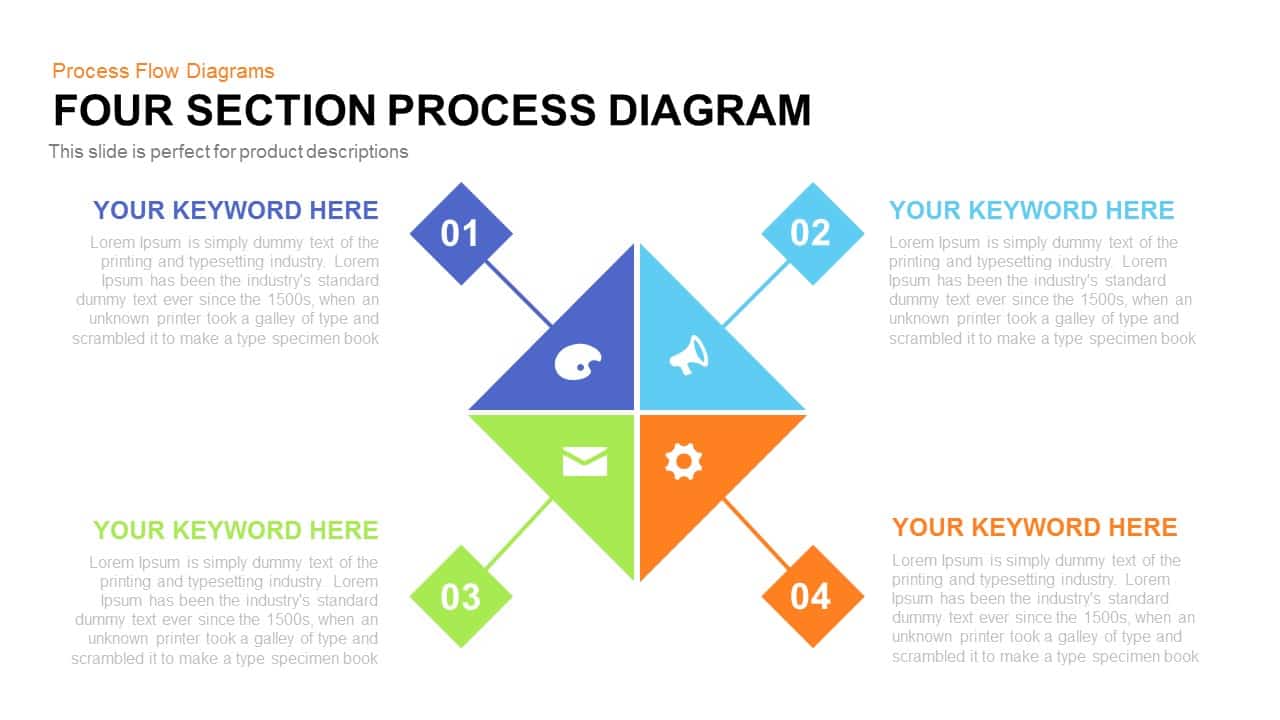
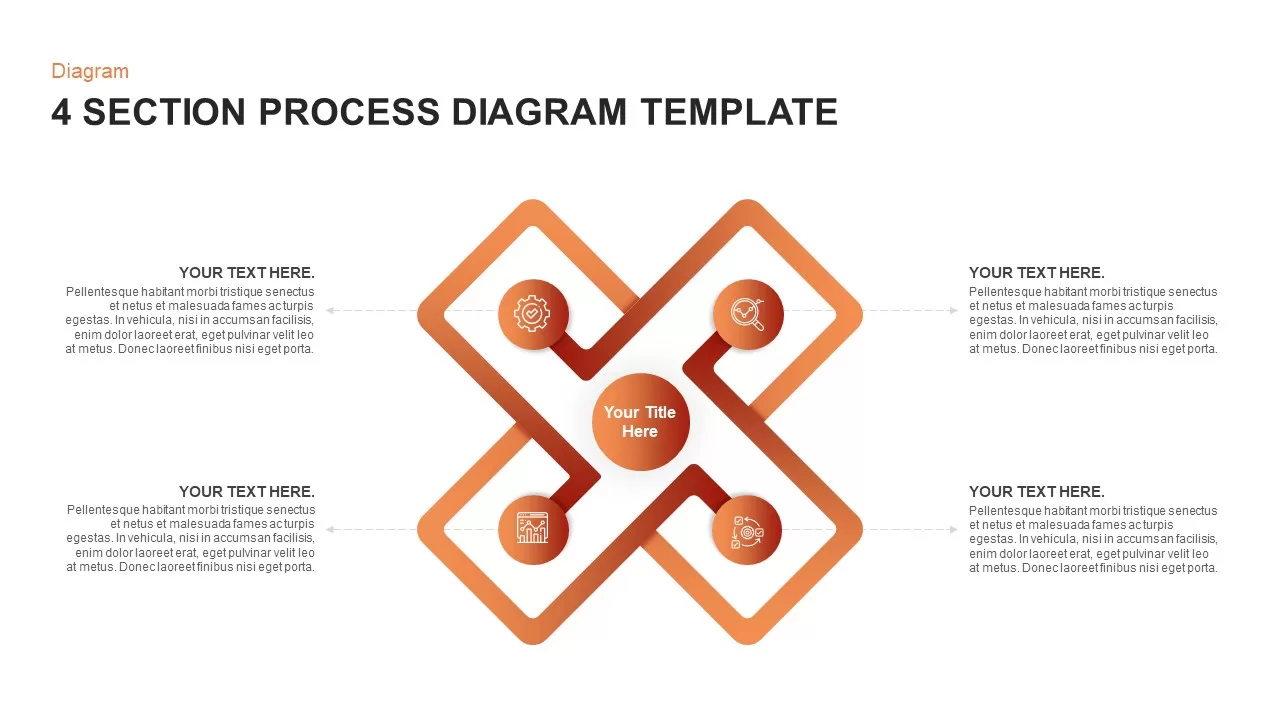
Modern 4 Section Process Diagram Template for PowerPoint & Google Slides
Process
Creative Infinity Loop Process Diagram Template for PowerPoint & Google Slides
Process
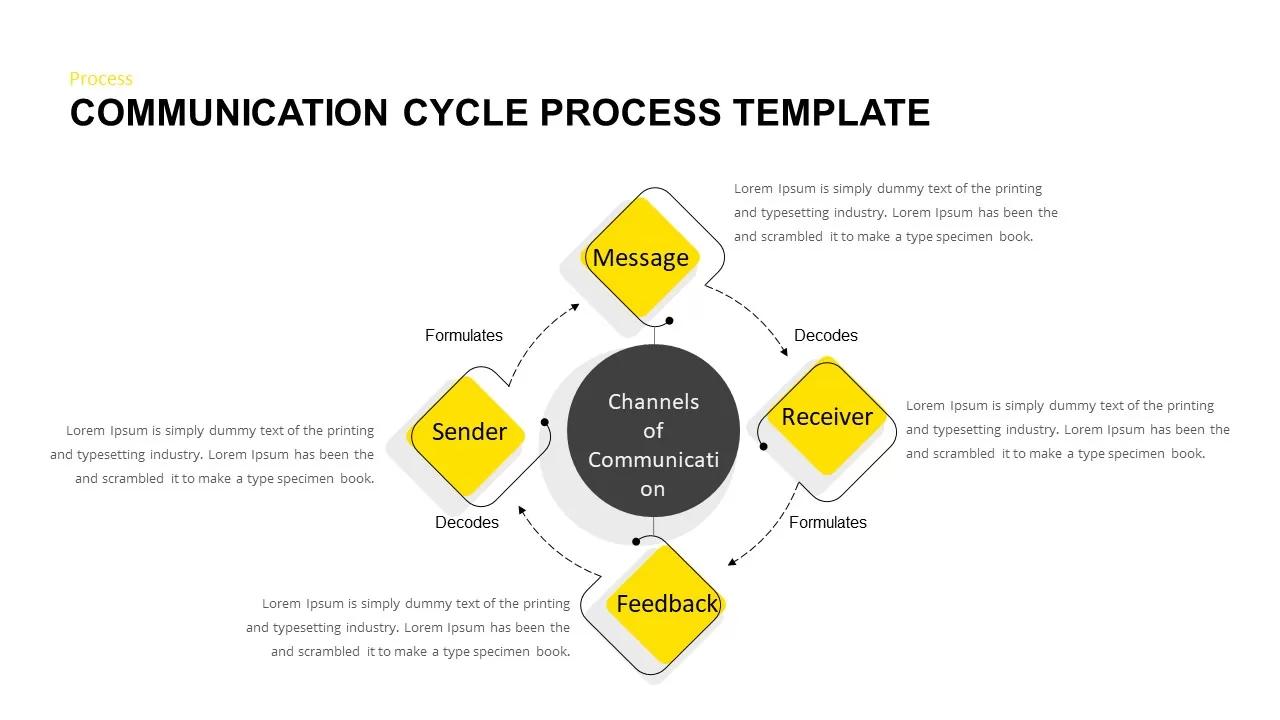
Communication Cycle Process Diagram template for PowerPoint & Google Slides
Business
Fishbone Process Diagram template for PowerPoint & Google Slides
Infographics
Three-Step Curved Arrow Process Diagram Template for PowerPoint & Google Slides
Arrow
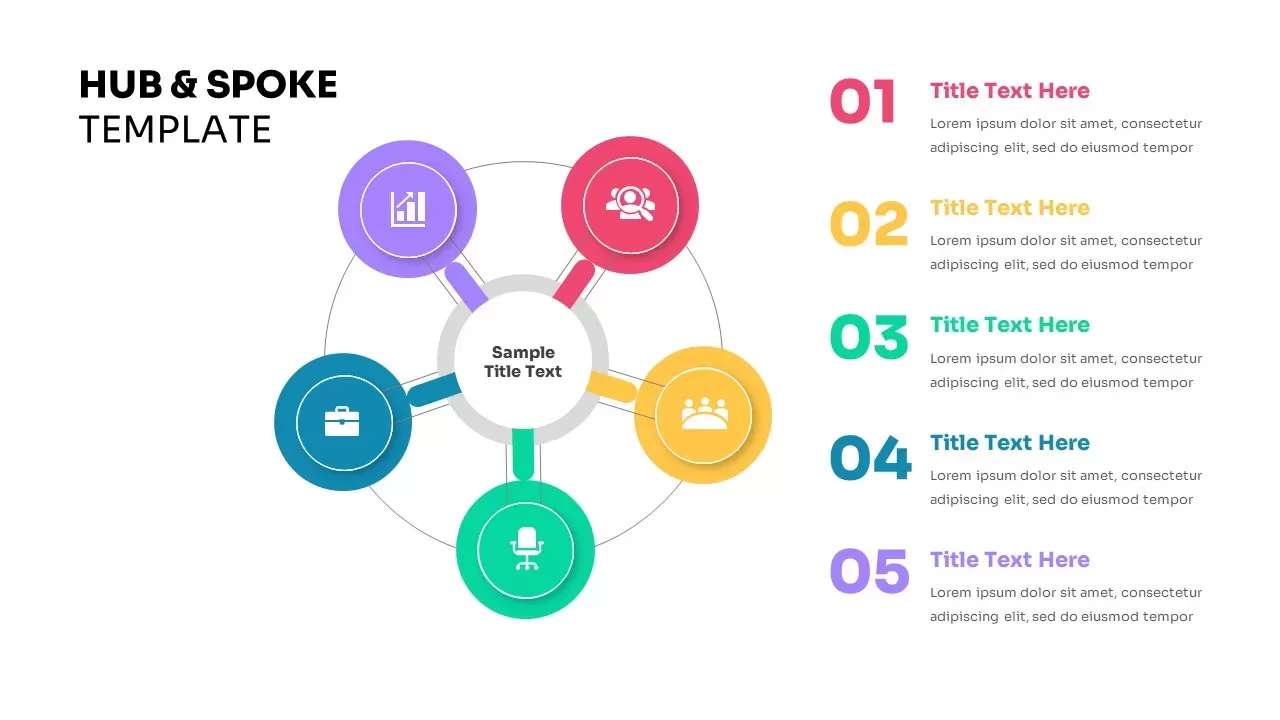
Five-Node Hub & Spoke Diagram Process Template for PowerPoint & Google Slides
Business Models
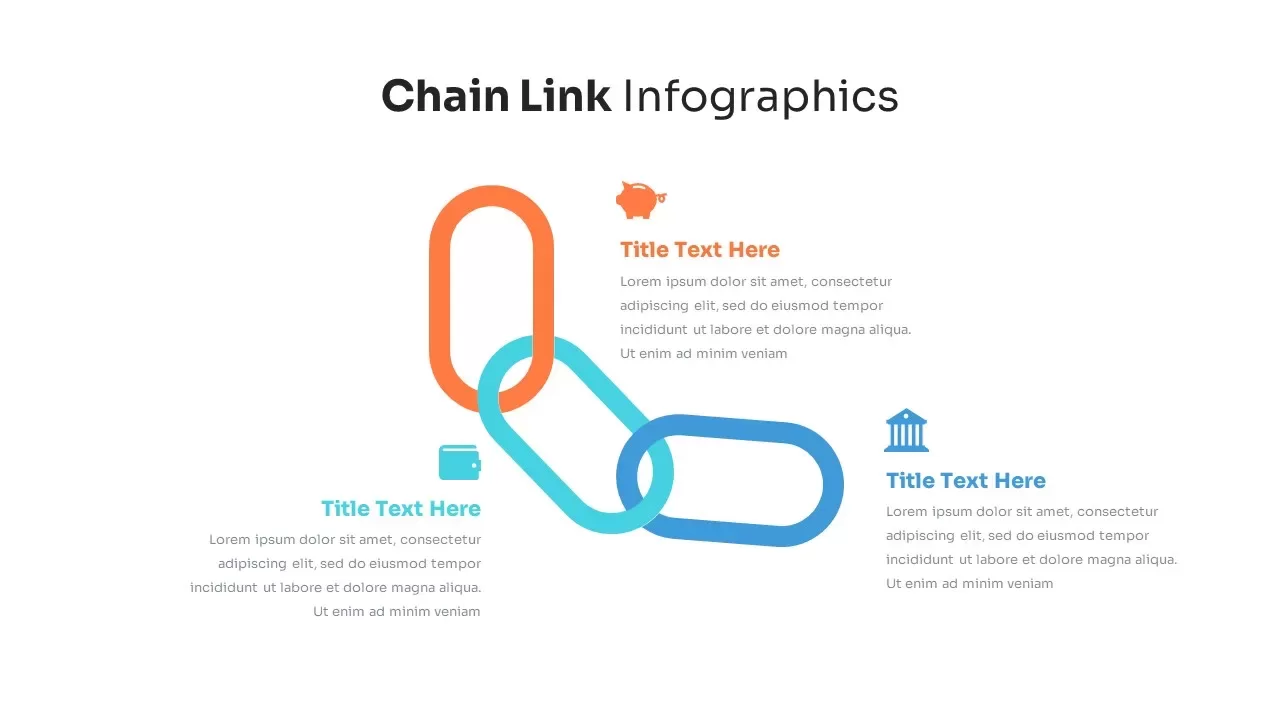
Chain Link Process Infographic Diagram Template for PowerPoint & Google Slides
Process
10 Step Circular Process Diagram Template for PowerPoint & Google Slides
Circular
3D Conveyor Belt Process Flow Diagram Template for PowerPoint & Google Slides
Process
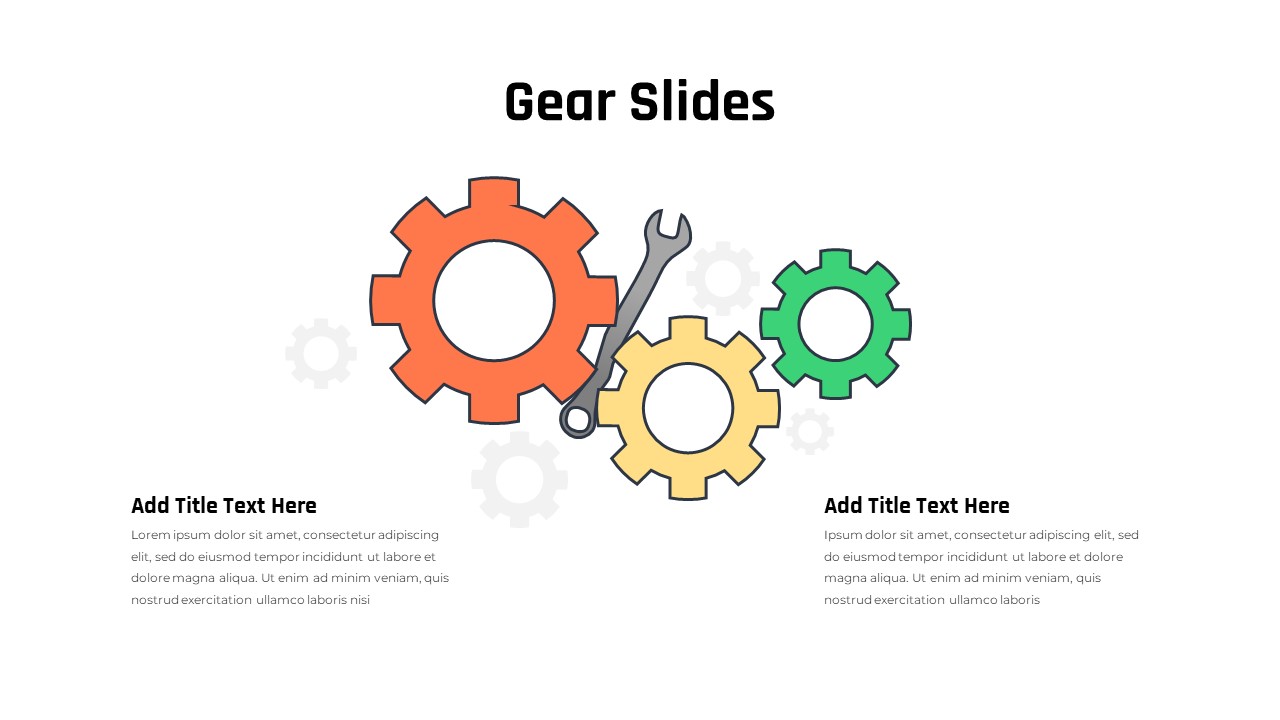
Gear Process Diagram Template for PowerPoint & Google Slides
Process
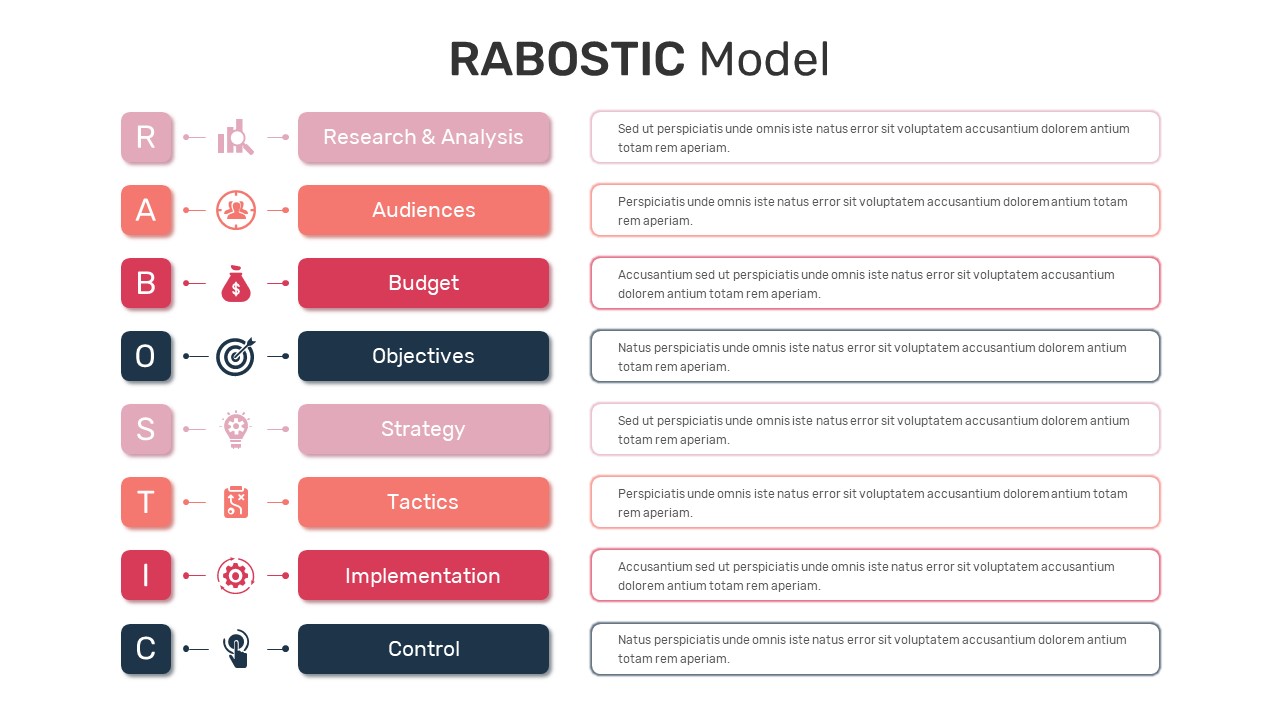
RABOSTIC Marketing Model Process Diagram Template for PowerPoint & Google Slides
Process
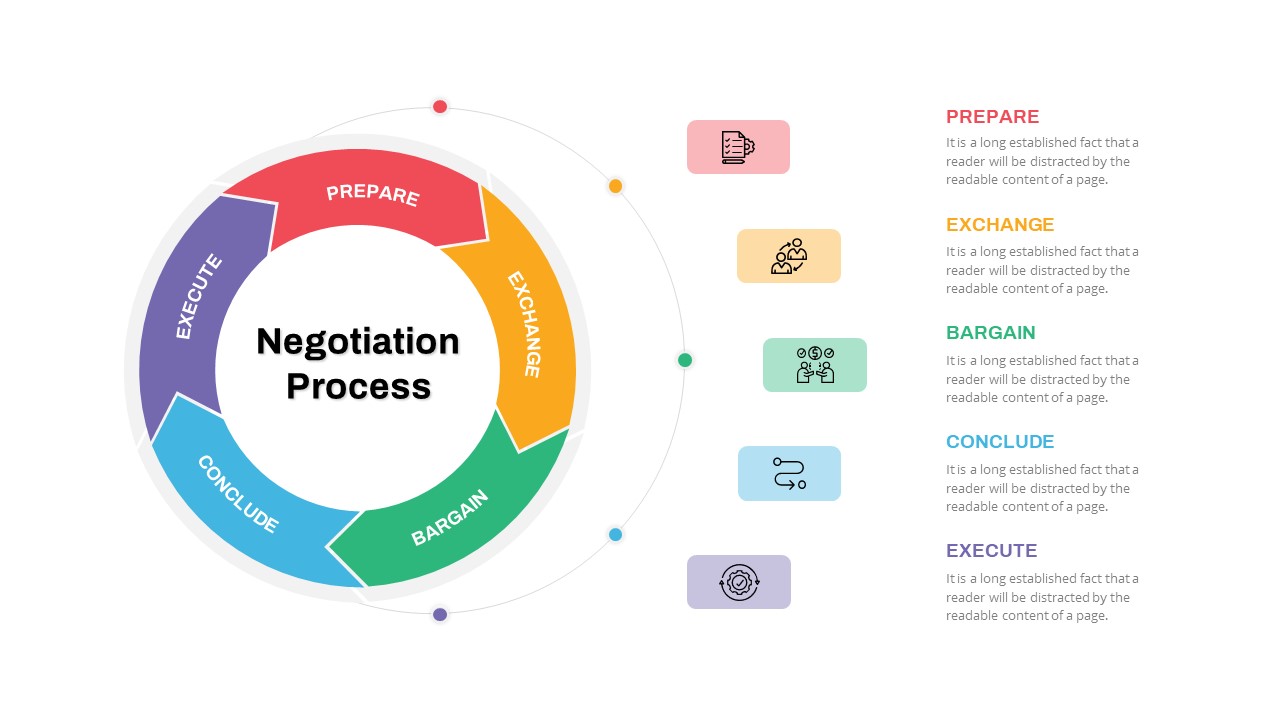
Negotiation Process Circular Diagram Template for PowerPoint & Google Slides
Circular
Business Process Analysis Cycle Diagram Template for PowerPoint & Google Slides
Business Strategy
Comprehensive Process Flow Diagram Template for PowerPoint & Google Slides
Process
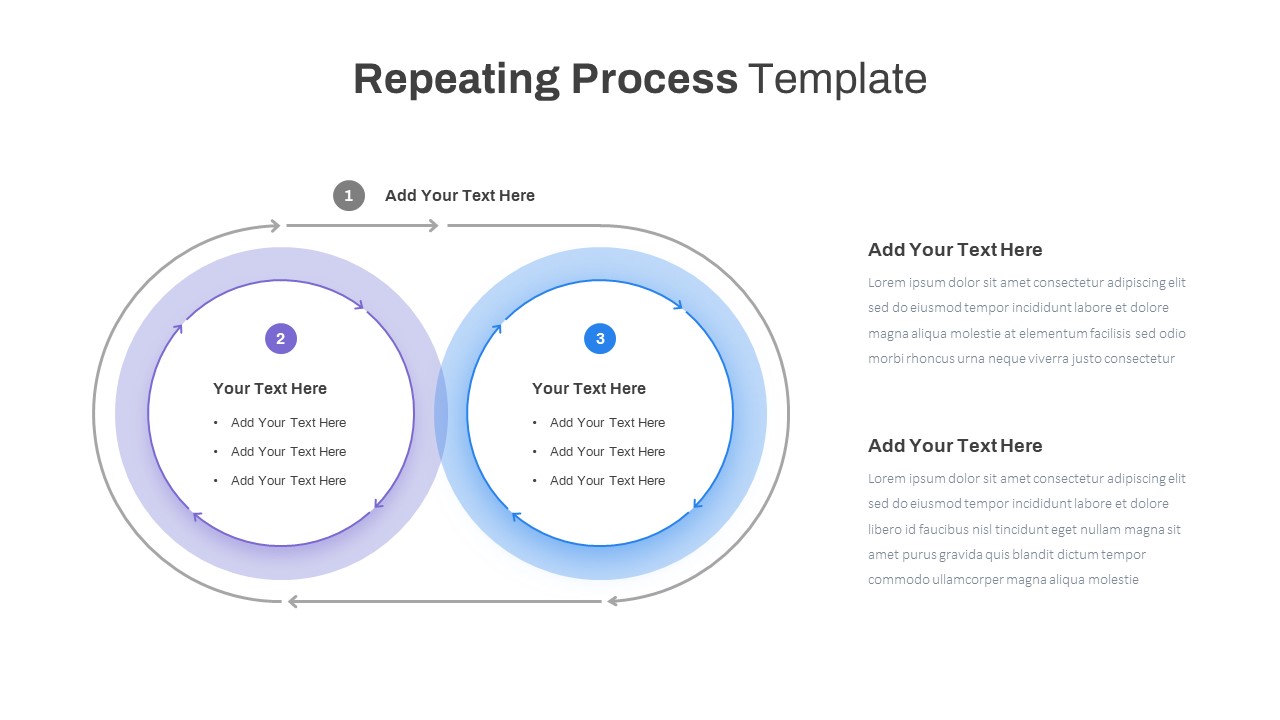
Repeating Overlapping Process Diagram Template for PowerPoint & Google Slides
Process
Animated Gears Process Flow Diagram Template for PowerPoint & Google Slides
Process
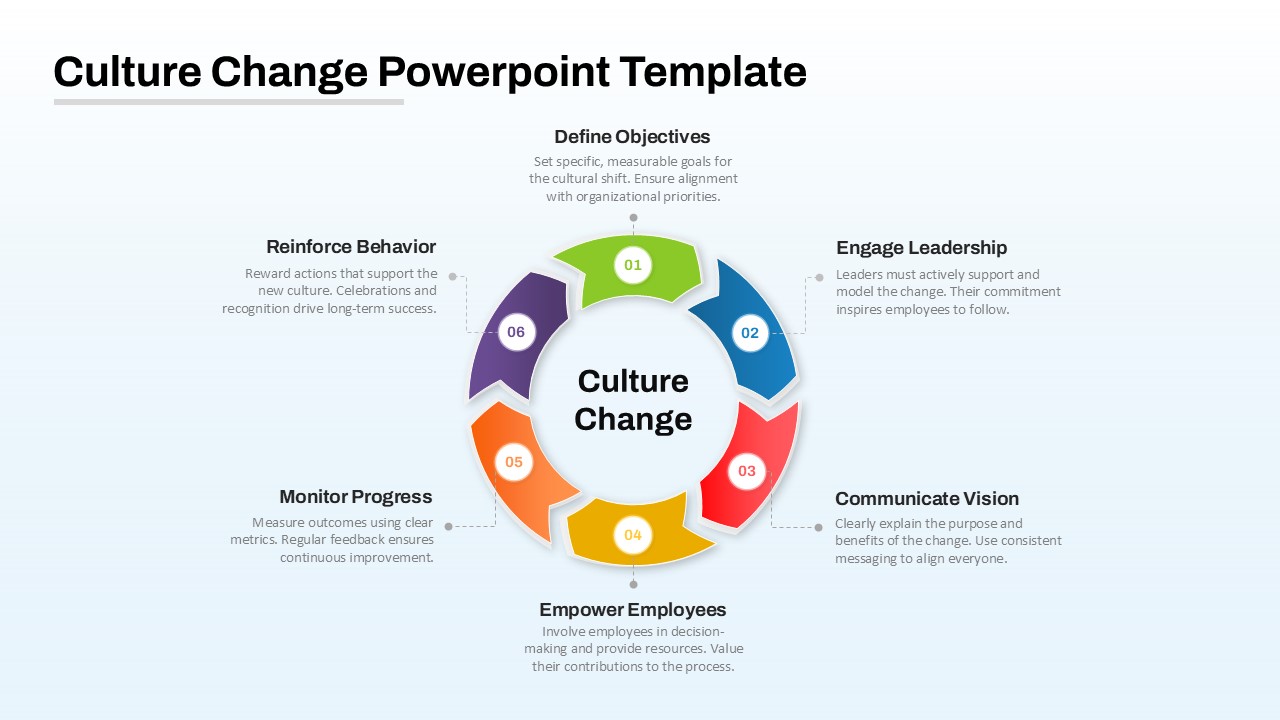
Culture Change Circular Process Diagram Template for PowerPoint & Google Slides
Process
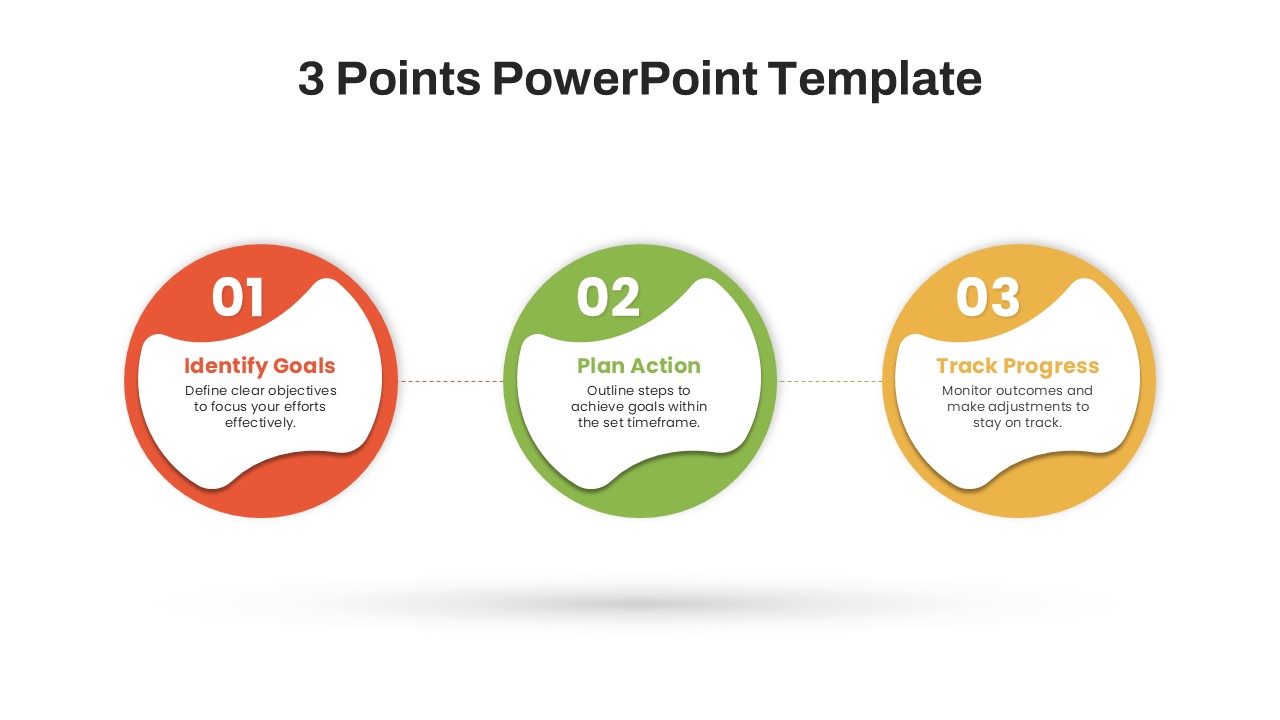
Modern Three-Point Process Diagram Template for PowerPoint & Google Slides
Process
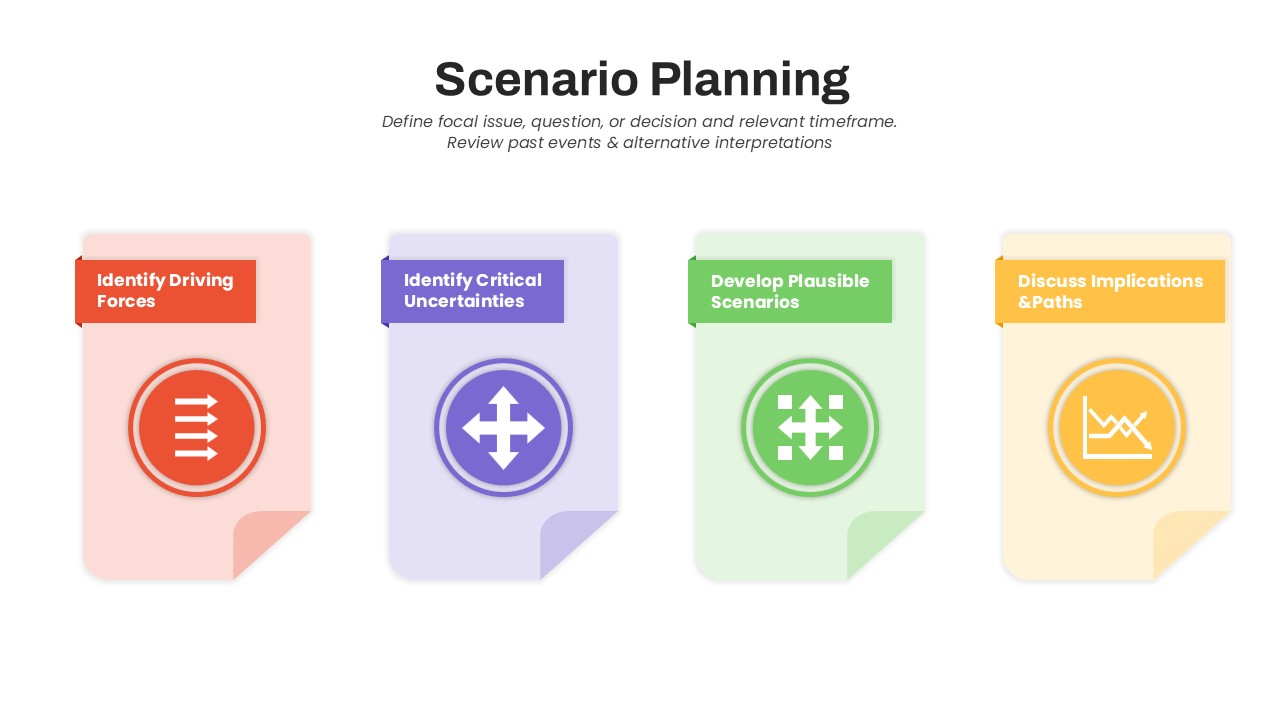
Scenario Planning Process Diagram Template for PowerPoint & Google Slides
Process
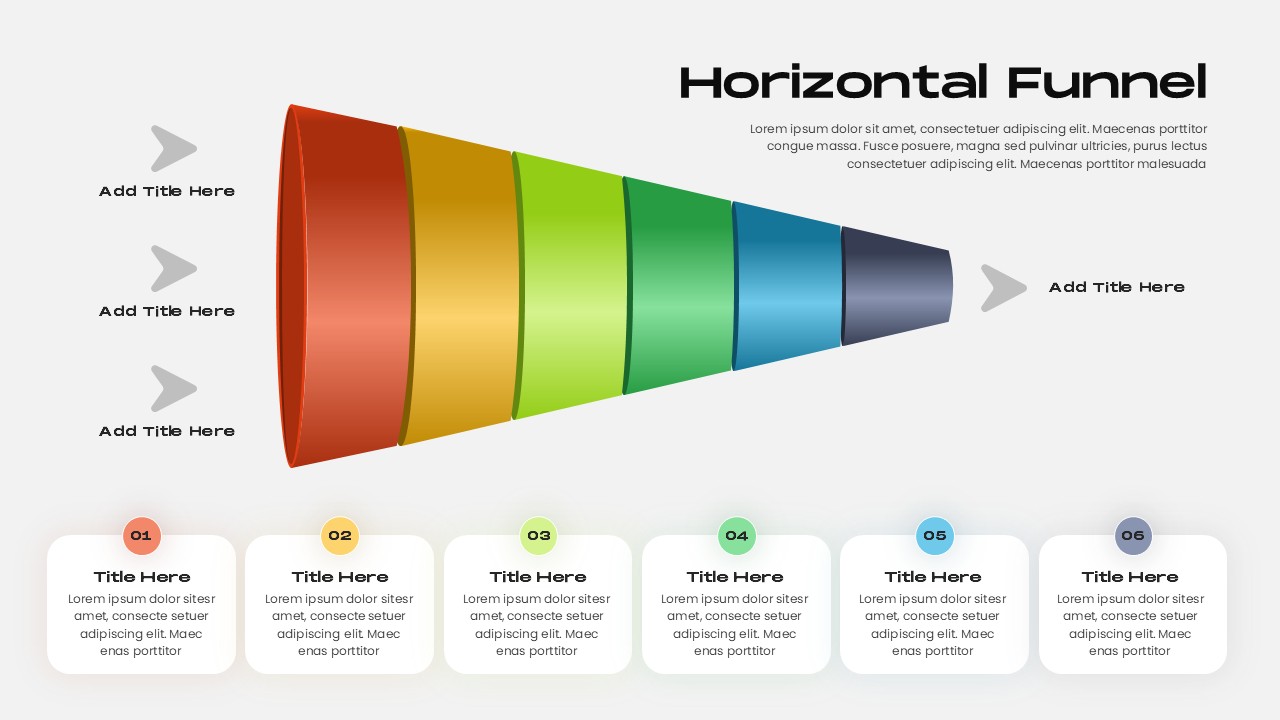
Horizontal Funnel Diagram Process Template for PowerPoint & Google Slides
Funnel
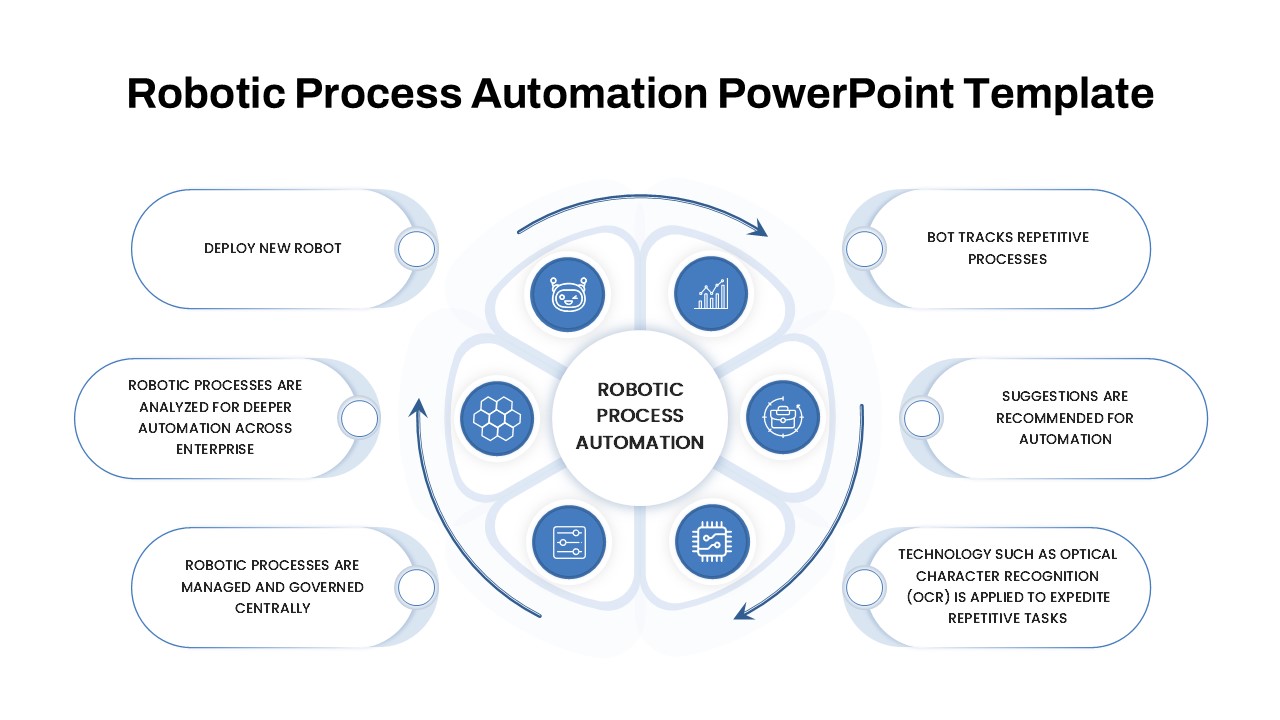
Robotic Process Automation Diagram Template for PowerPoint & Google Slides
Process
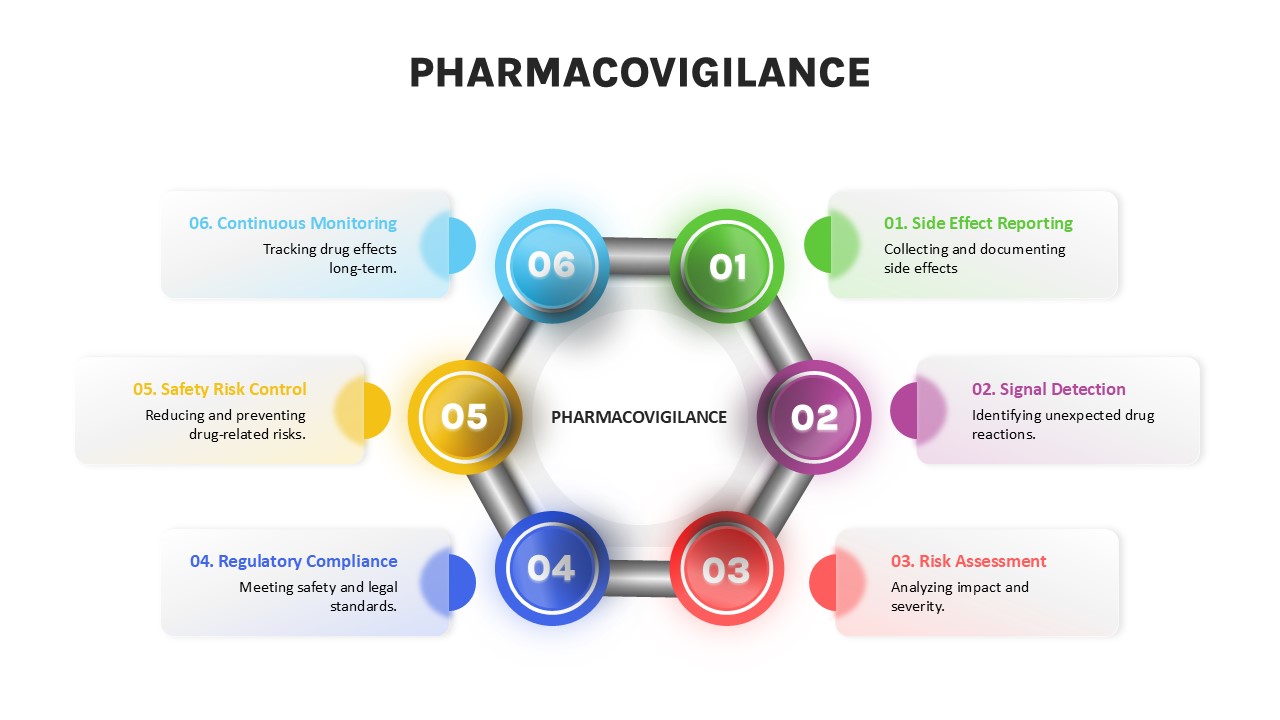
Pharmacovigilance Process Diagram Template for PowerPoint & Google Slides
Process
Change Management Process Cycle Diagram Template for PowerPoint & Google Slides
Process
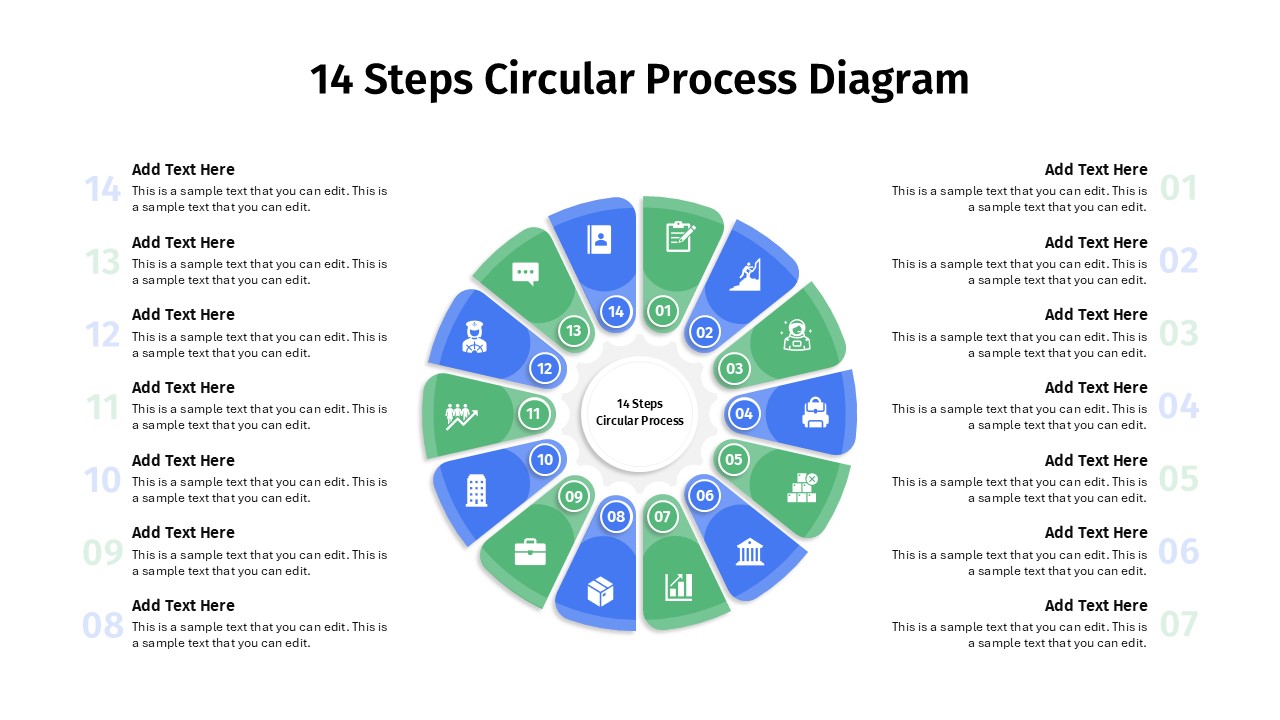
14 Steps Circular Process Diagram Template for PowerPoint & Google Slides
Circular
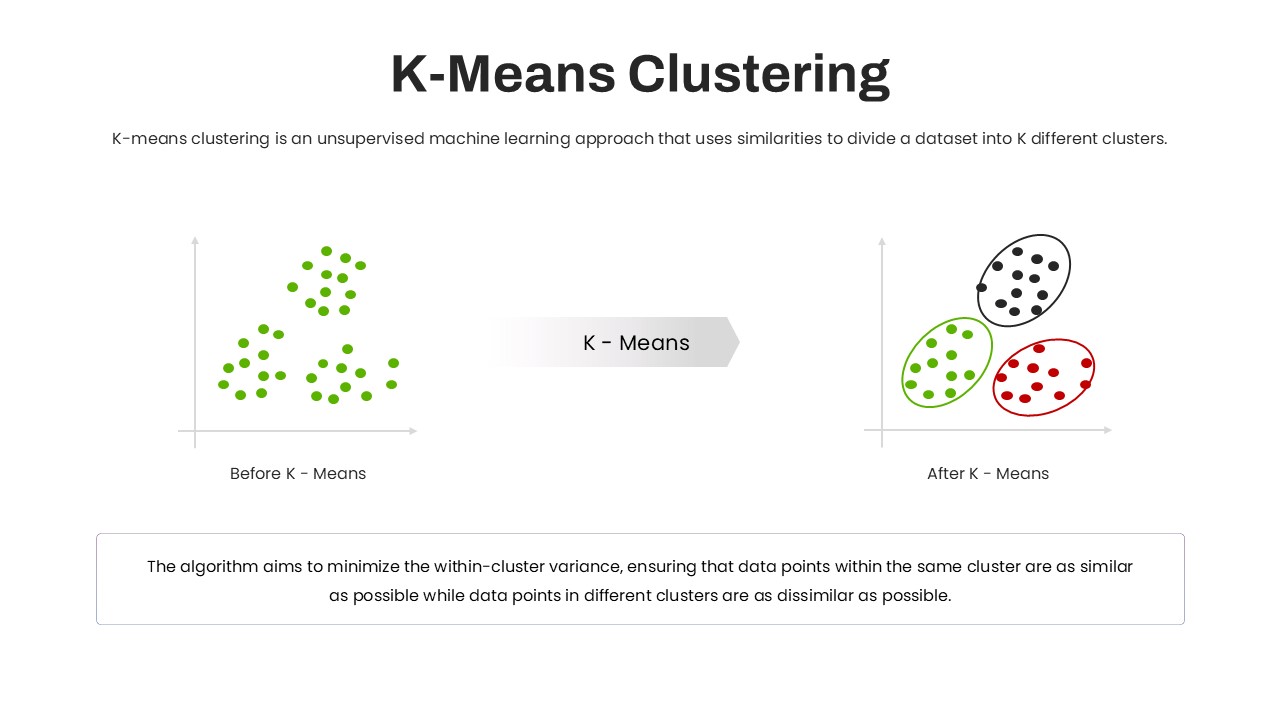
K-Means Clustering Process Diagram Template for PowerPoint & Google Slides
Machine Learning
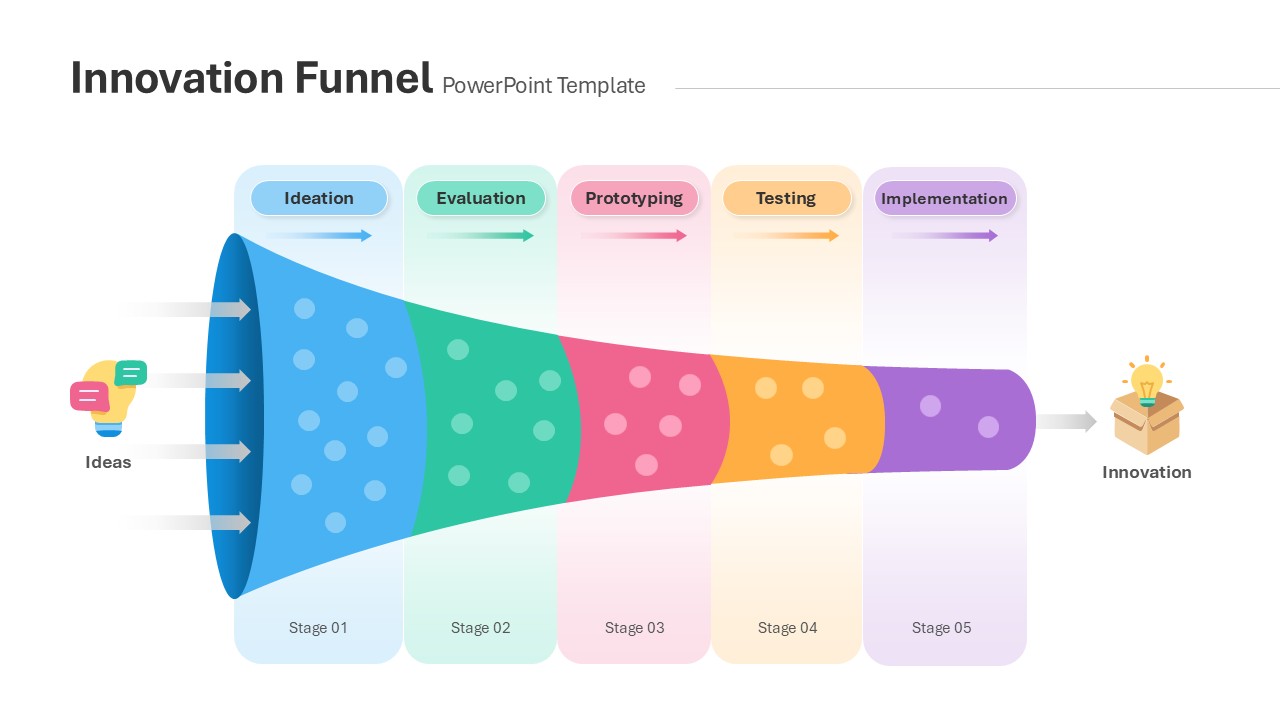
Innovation Funnel Process Diagram Template for PowerPoint & Google Slides
Funnel
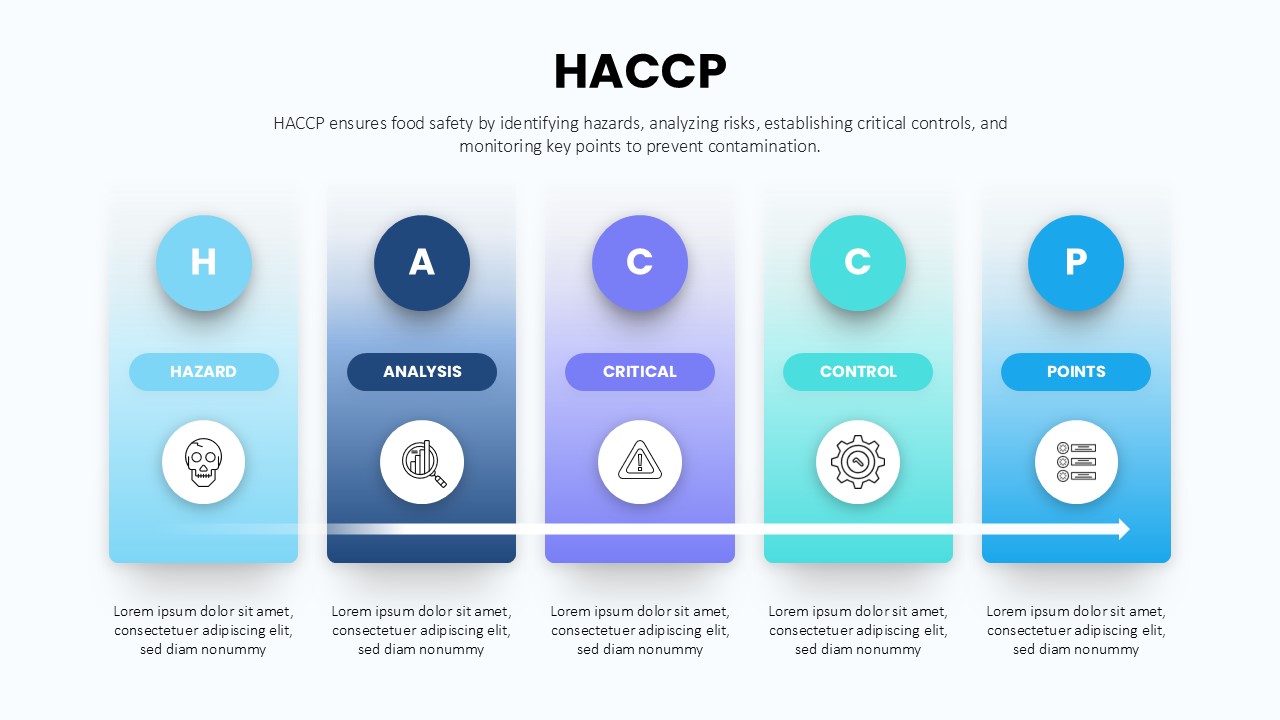
HACCP 5-Step Food Safety Process Diagram Template for PowerPoint & Google Slides
Process
Q-Learning Process Flow Diagram Template for PowerPoint & Google Slides
Process
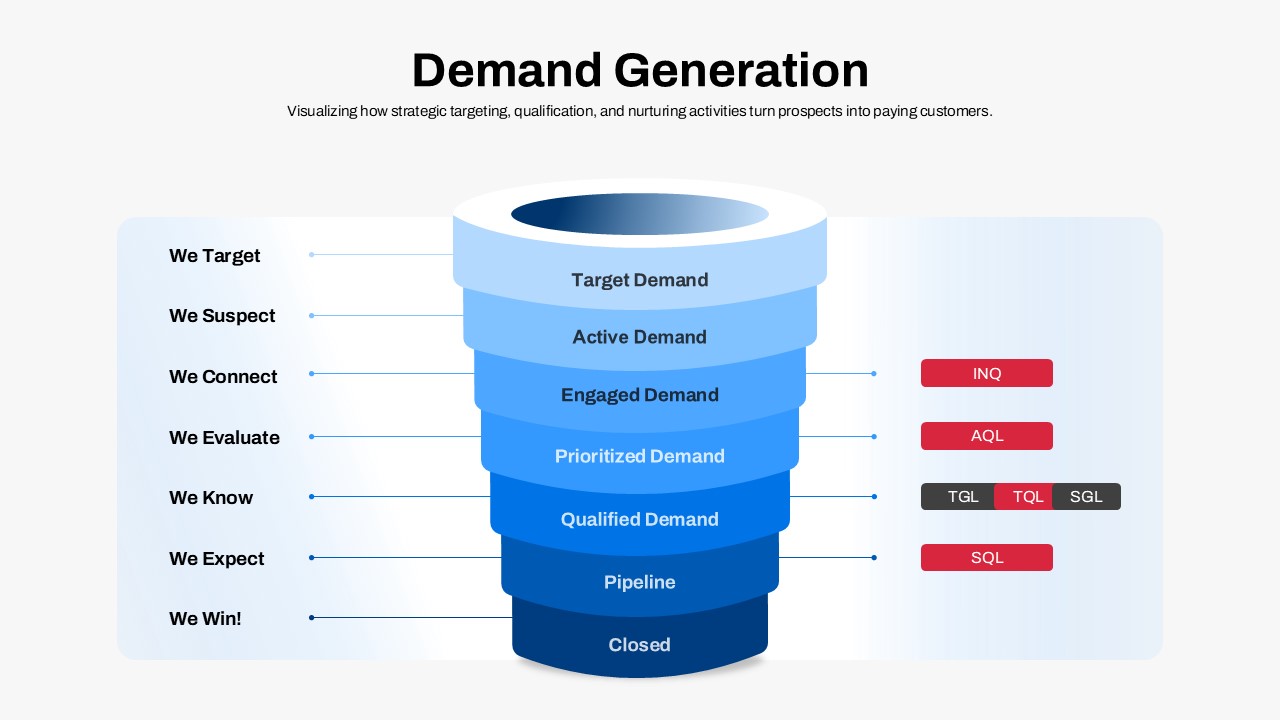
Demand Generation Funnel Process Diagram Template for PowerPoint & Google Slides
Funnel
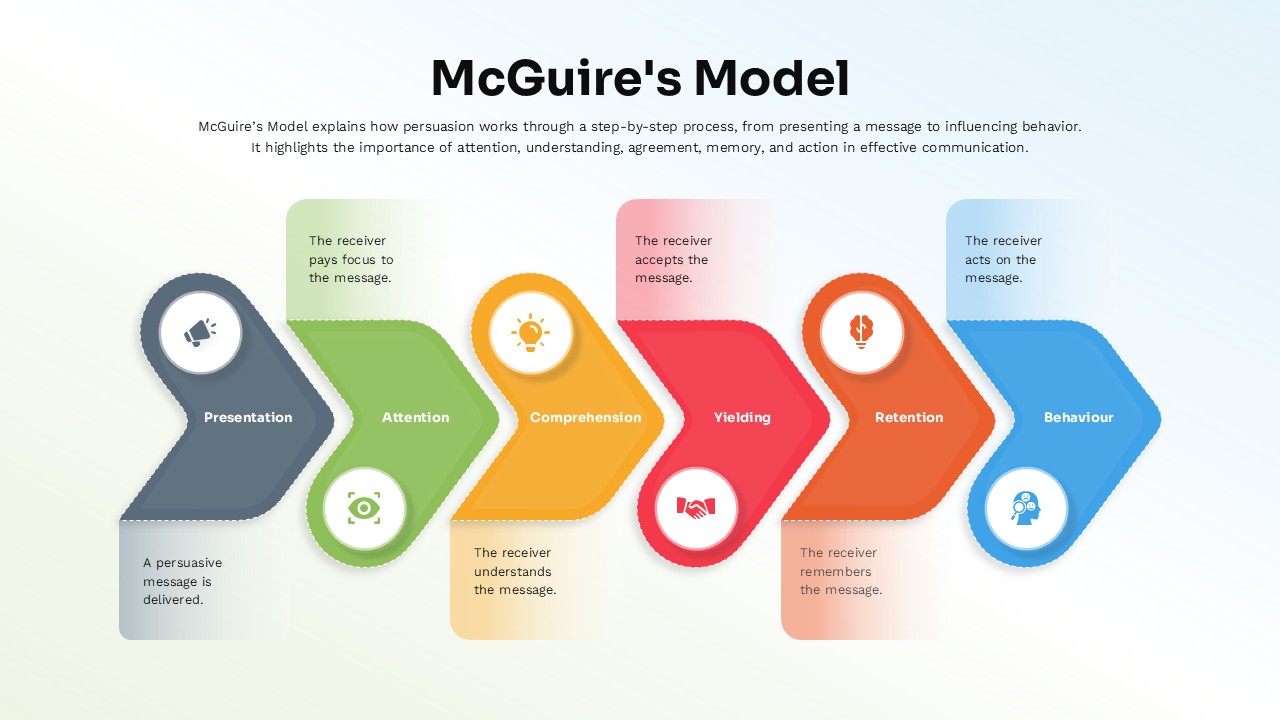
McGuire’s Persuasion Process Flow Diagram Template for PowerPoint & Google Slides
Marketing
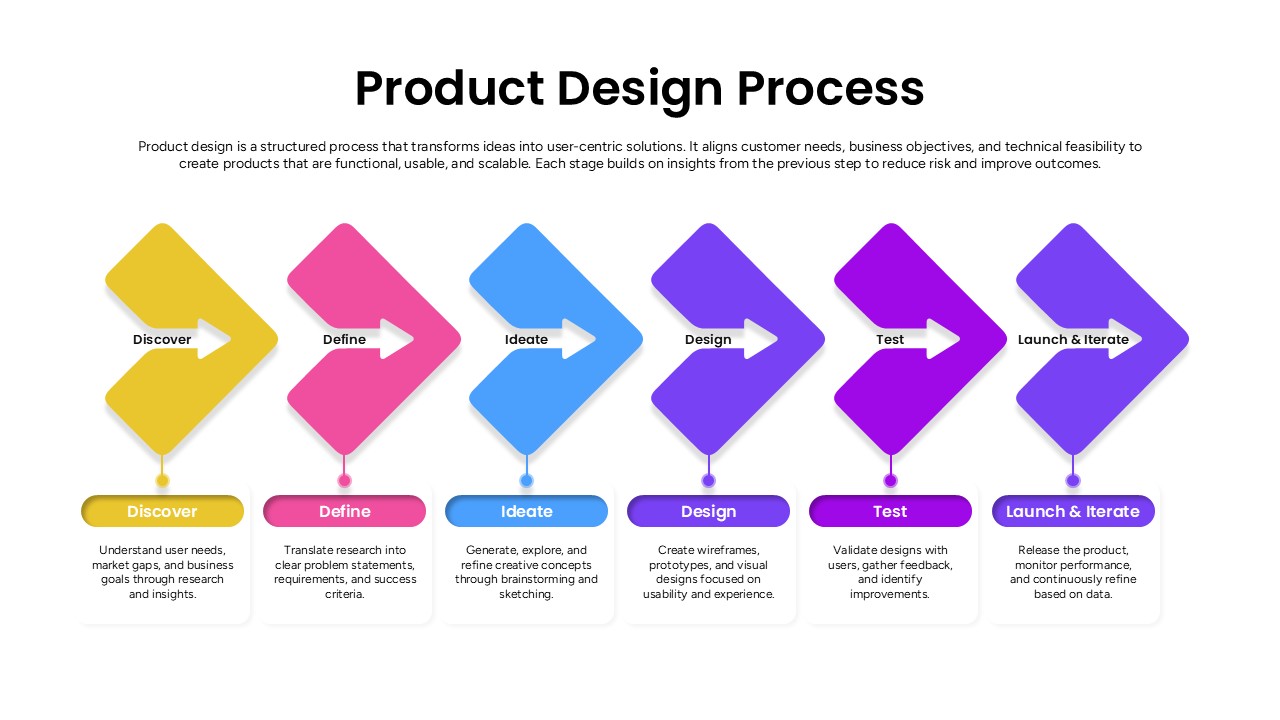
Product Design Process Flow Diagram Template for PowerPoint & Google Slides
Process