Six Stage Timeline Infographics Template for PowerPoint & Google Slides
Description
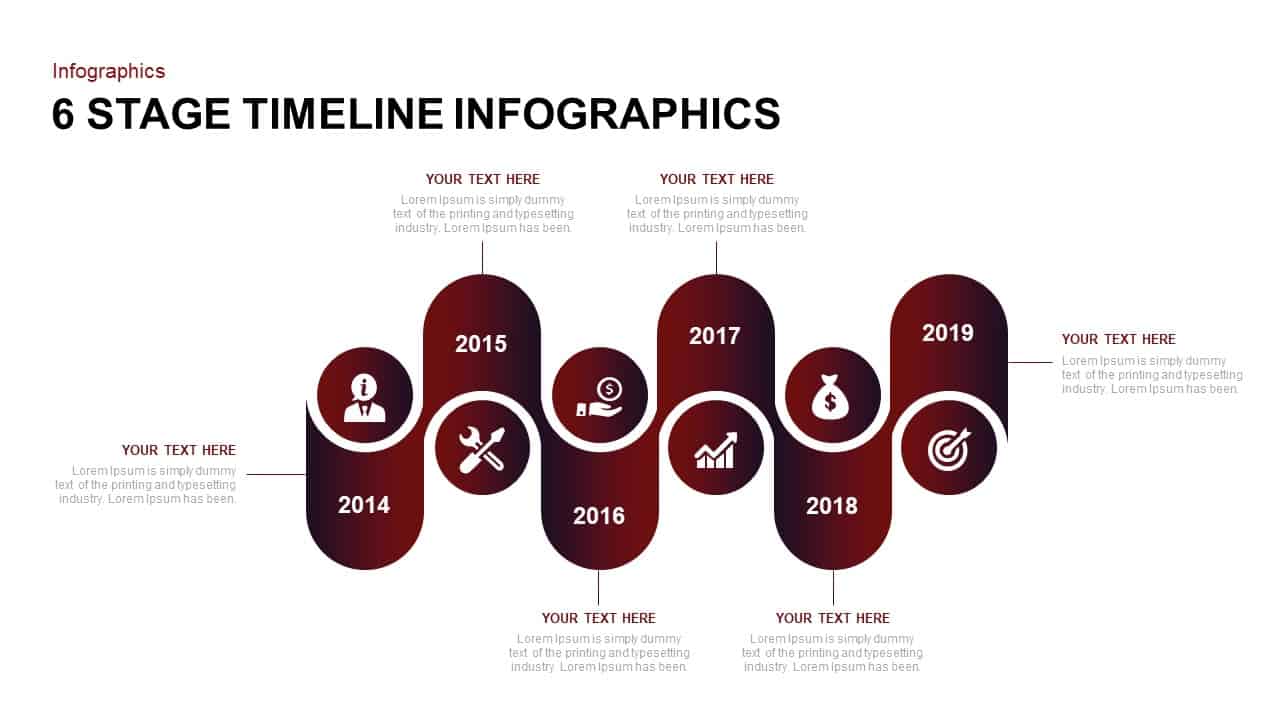
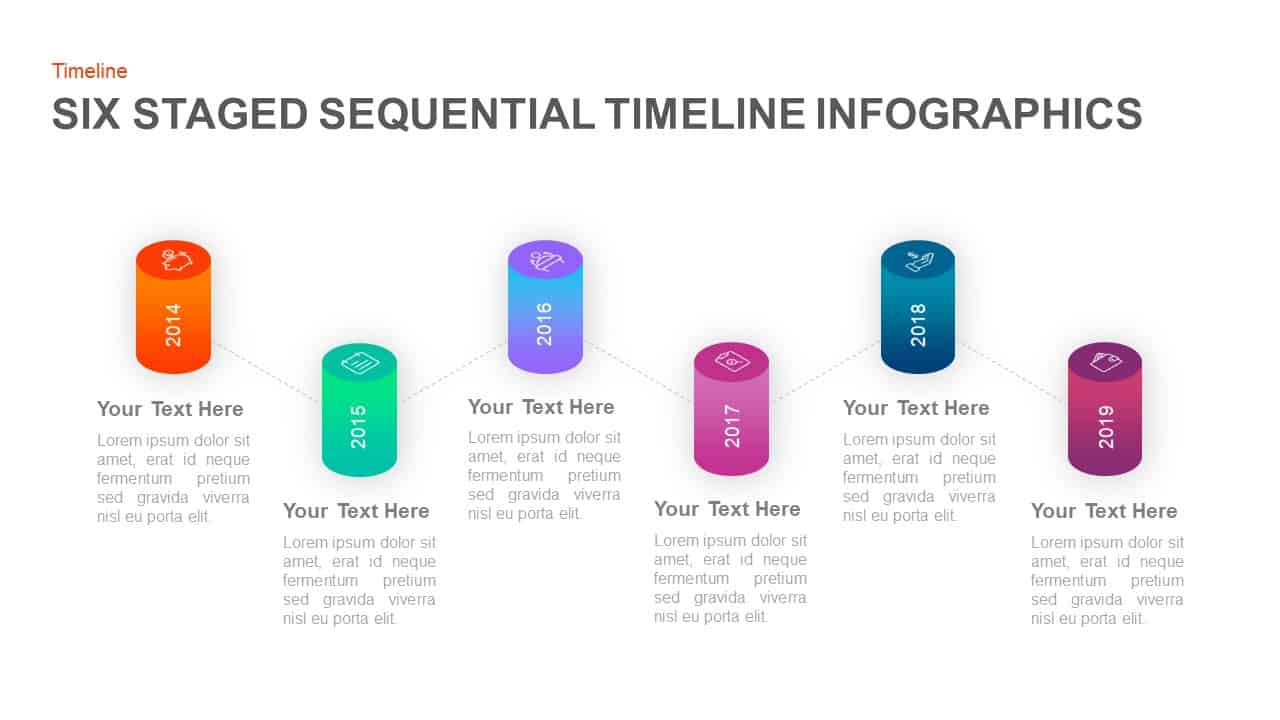
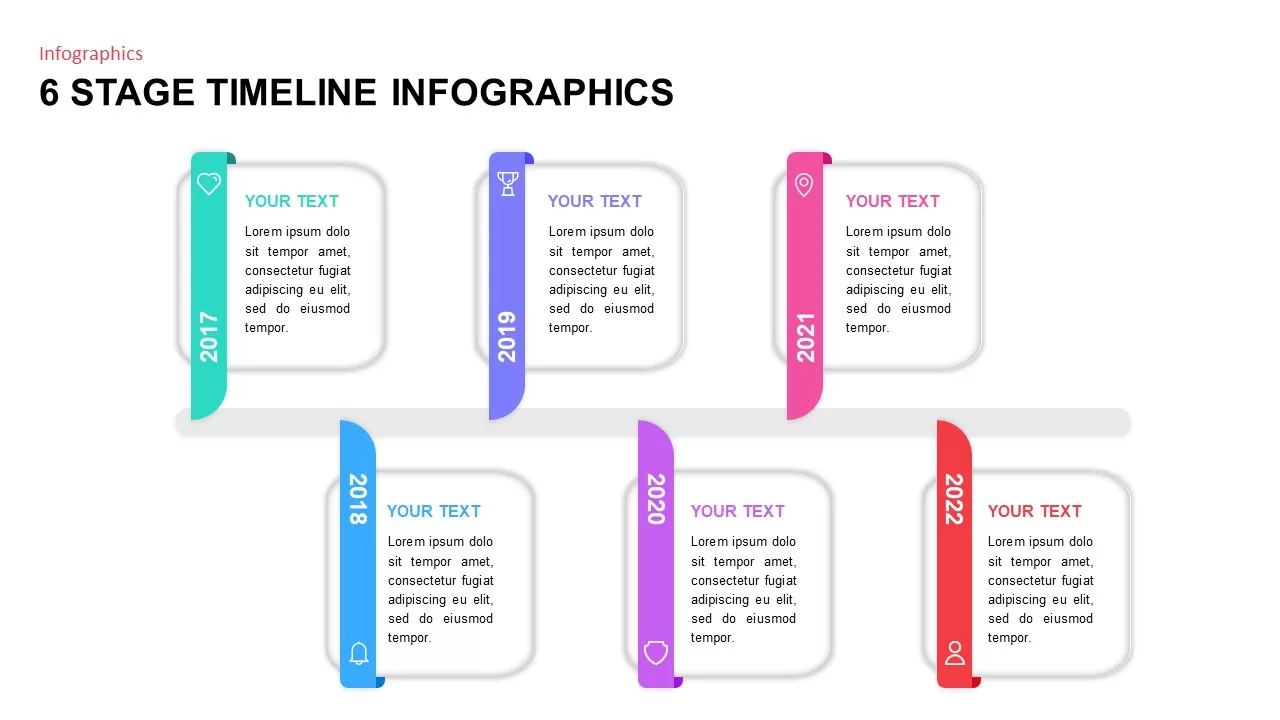
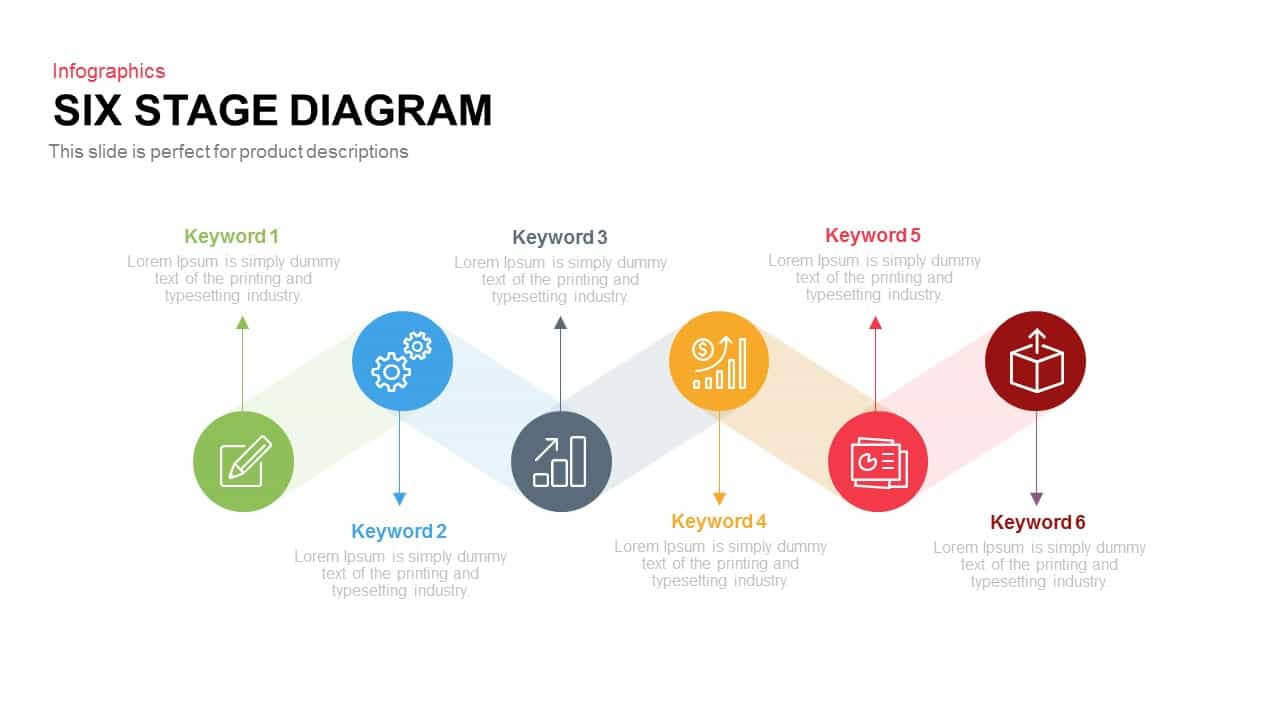
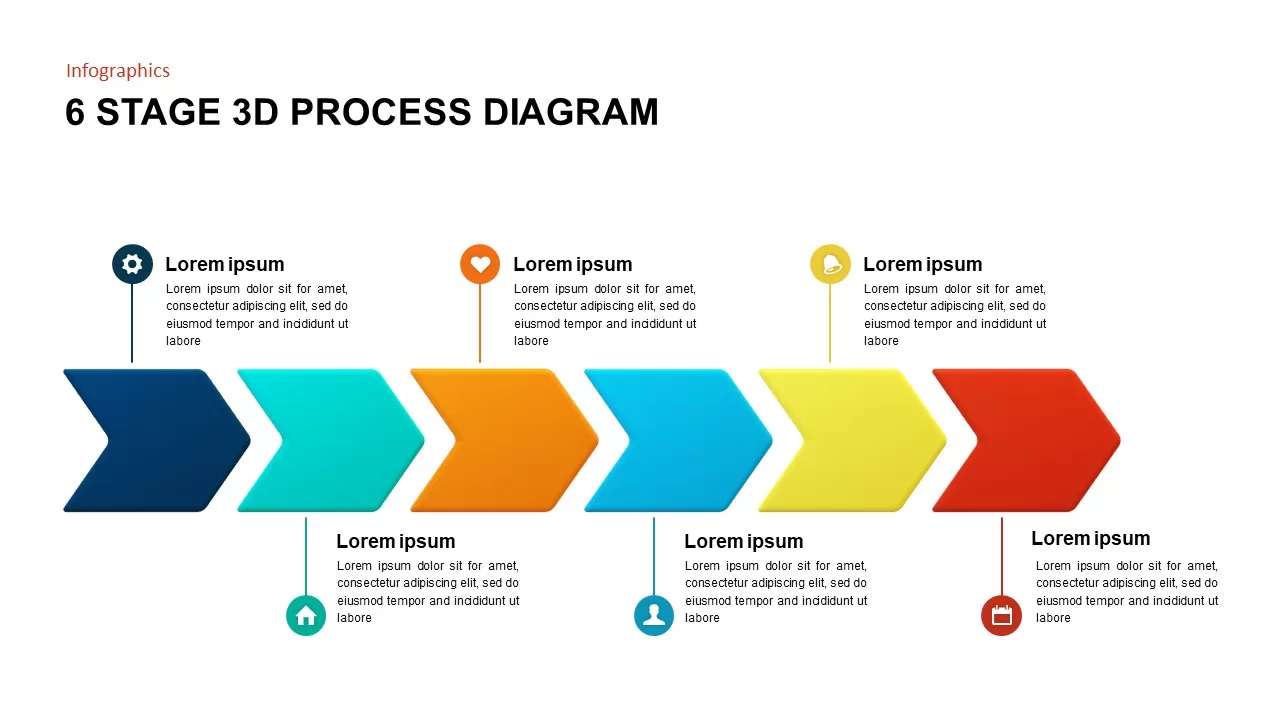
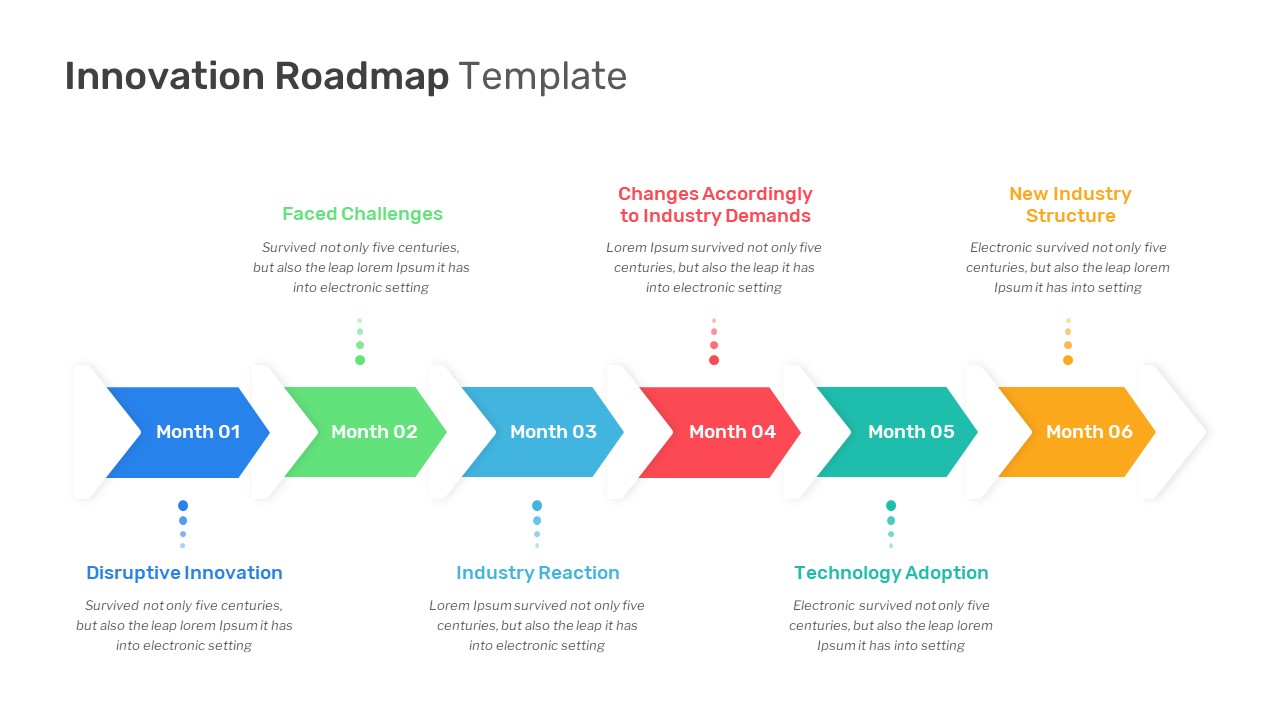
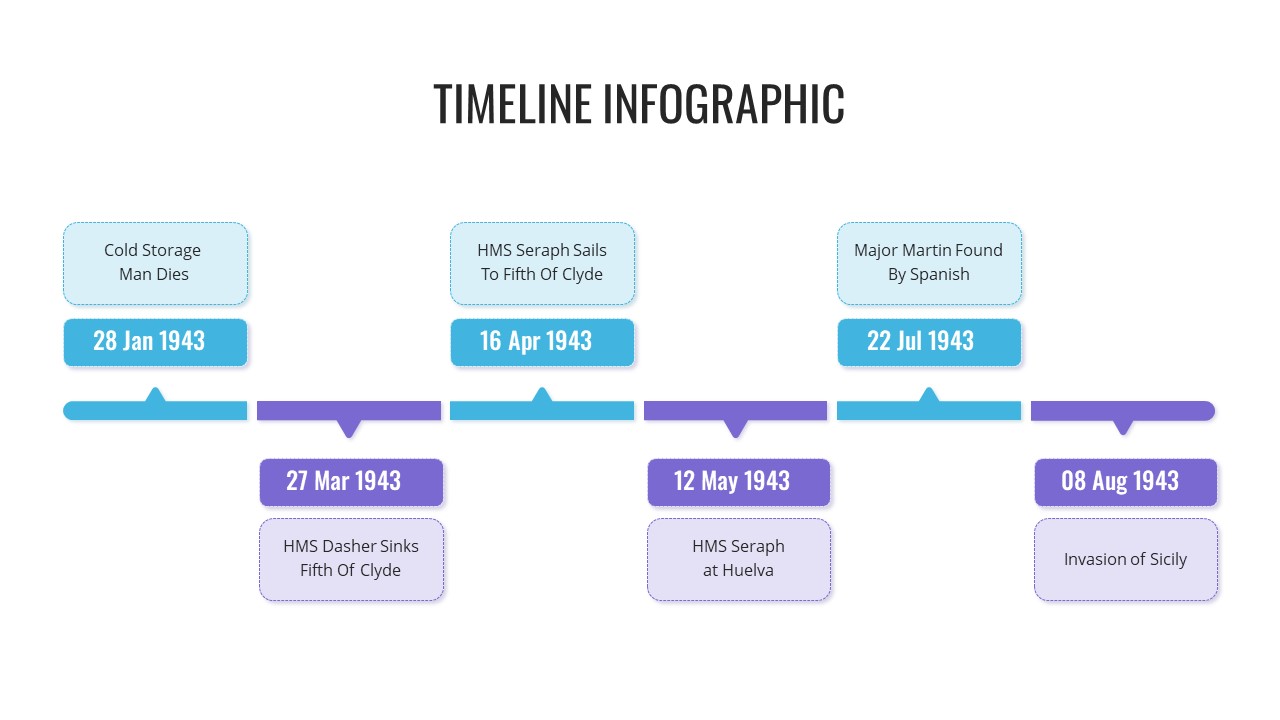
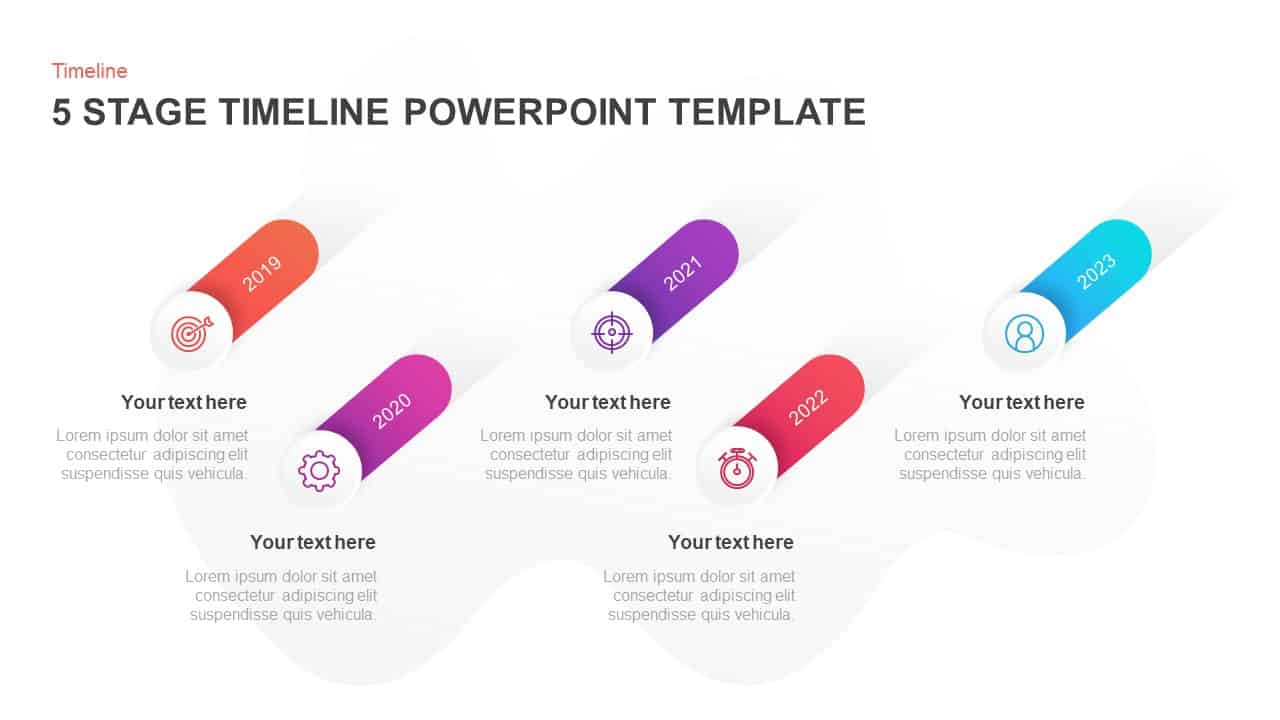
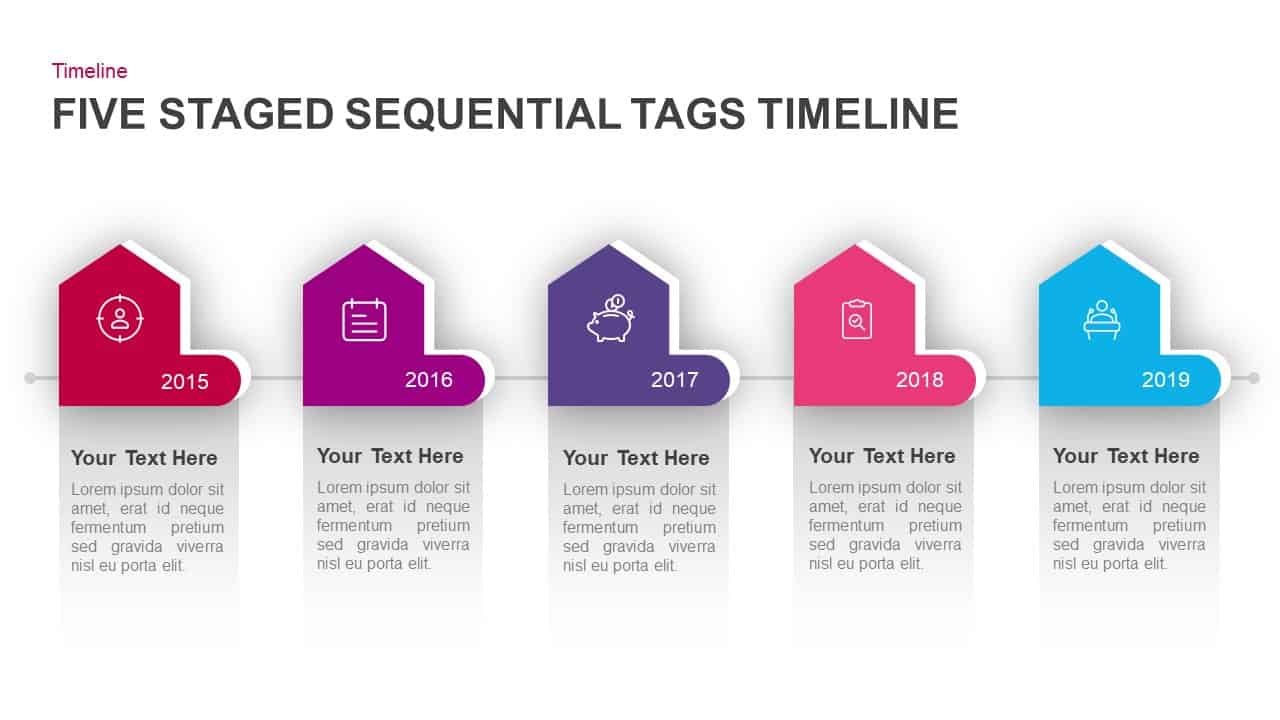
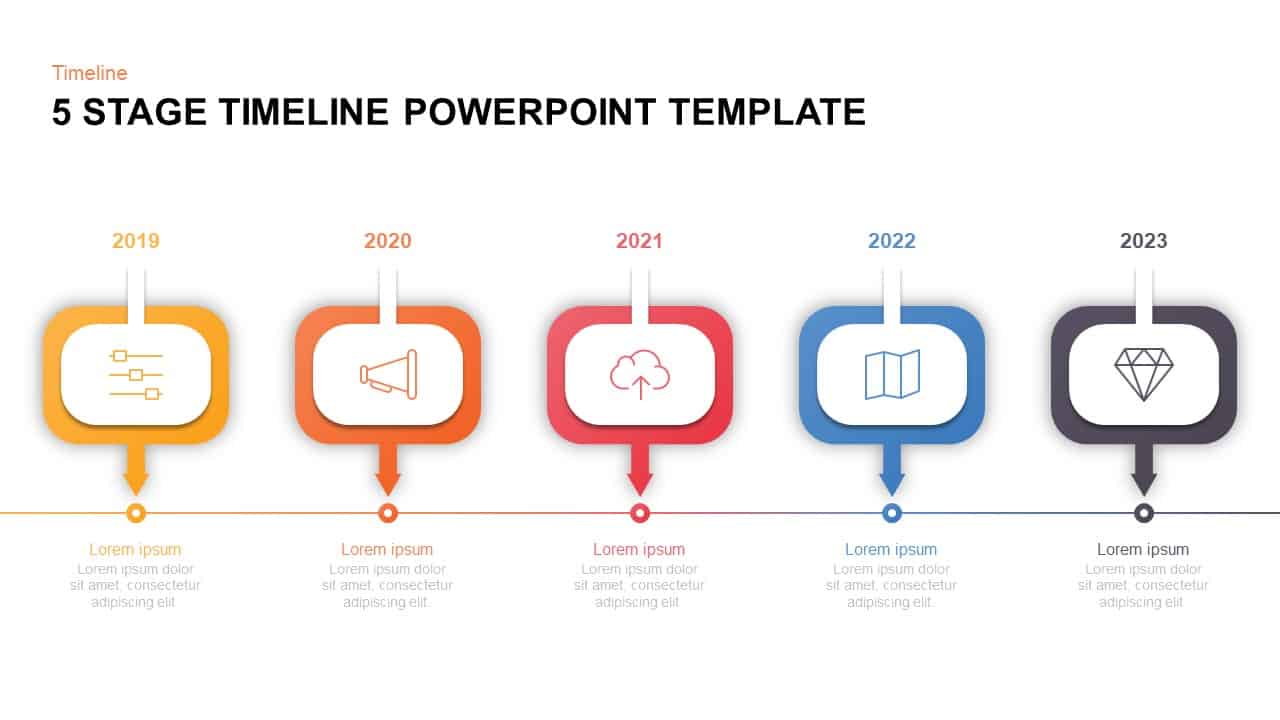
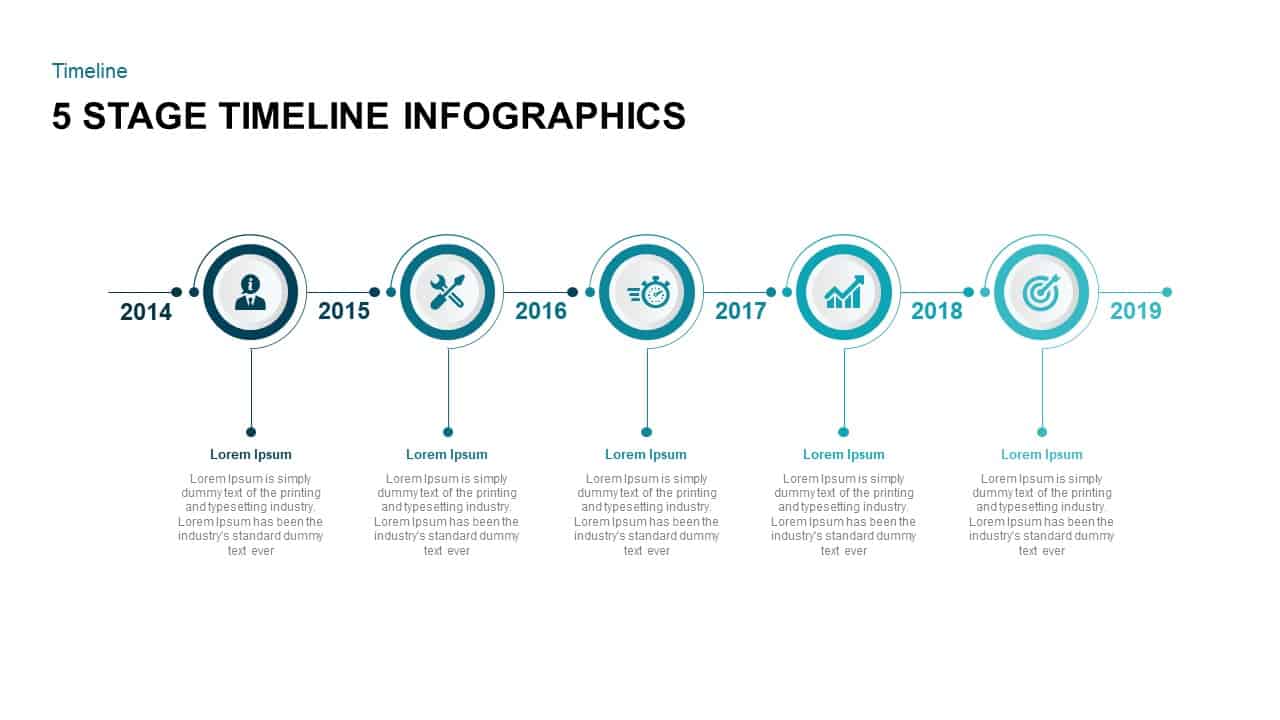
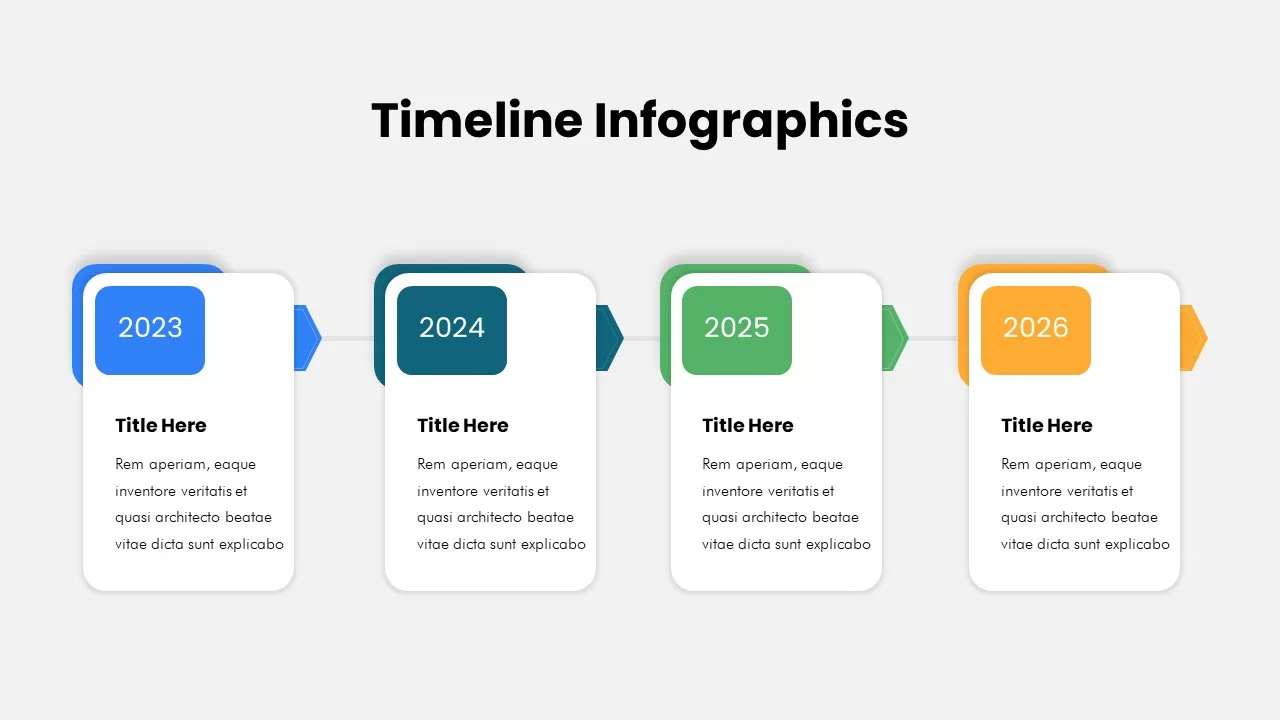
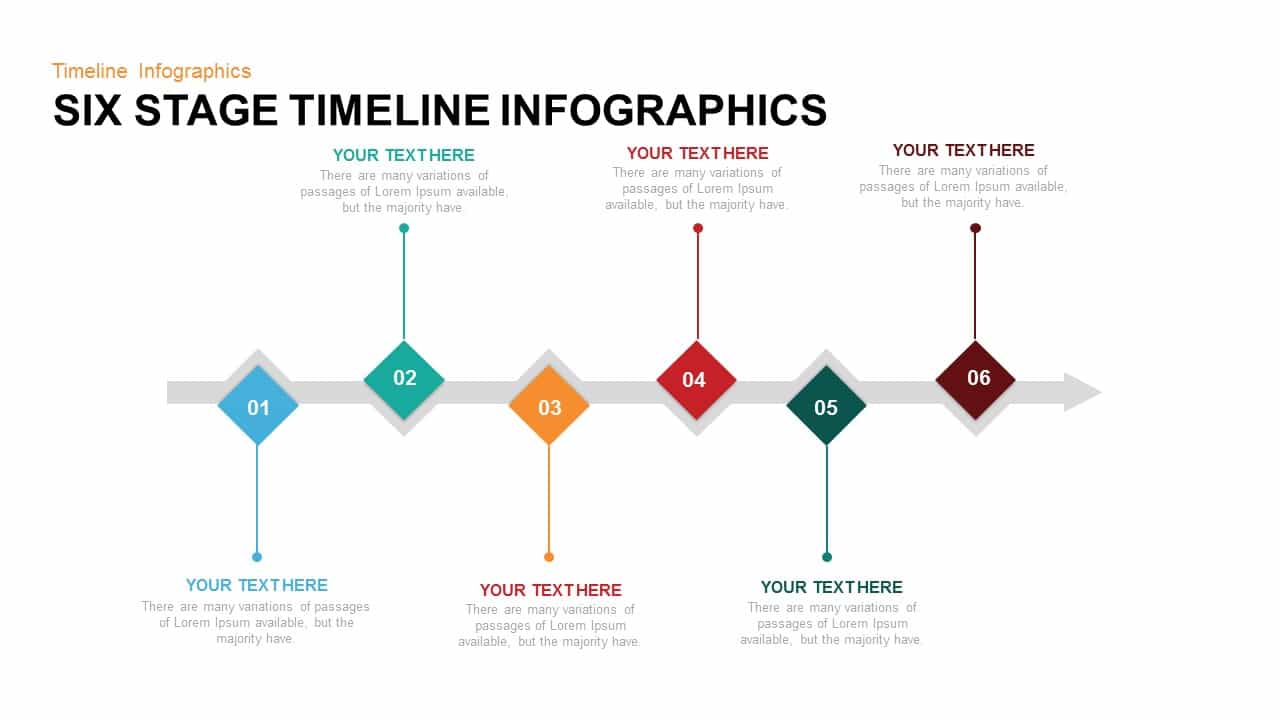
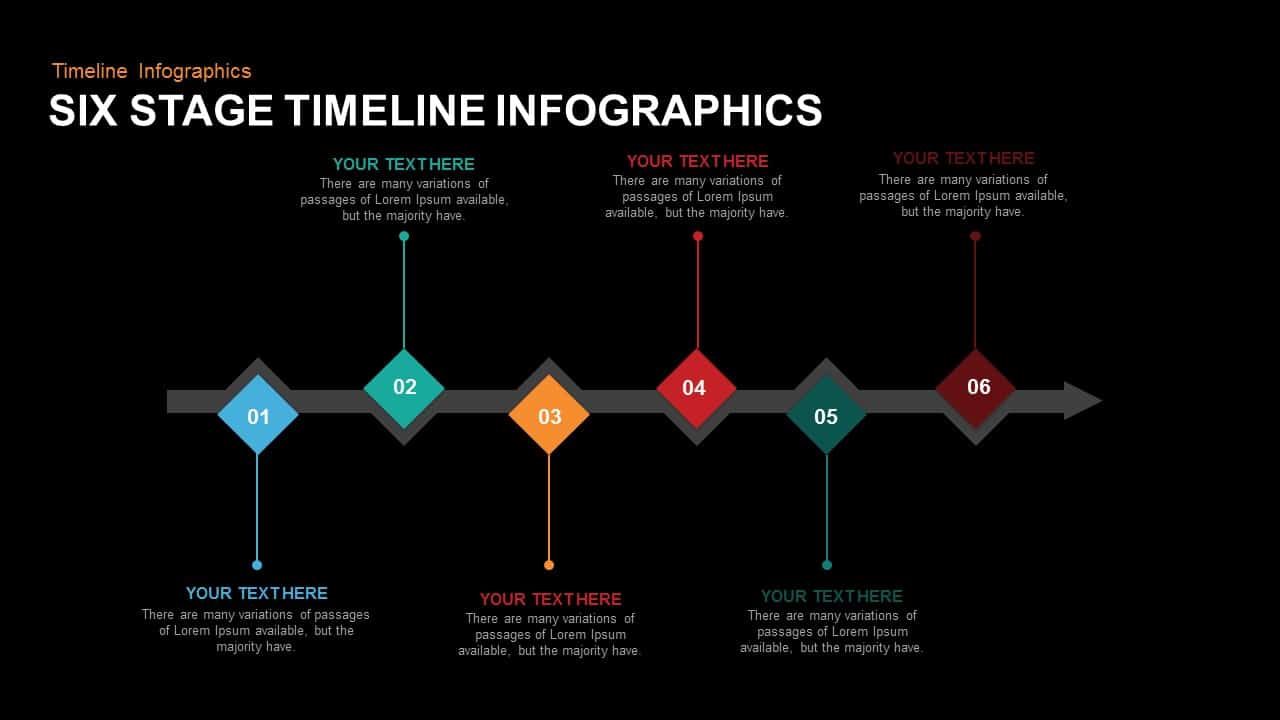
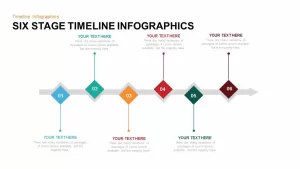
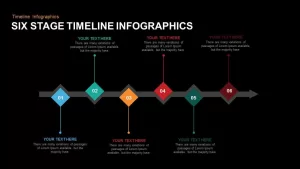
This six-stage timeline infographic slide delivers a clear, structured roadmap for presenting sequential milestones, project phases, or process steps. Featuring a horizontal arrow base with six diamond markers, it alternates above and below text placeholders tied to each stage. The distinct color palette—blue, teal, orange, red, dark teal, and maroon—ensures each milestone stands out, while the grey arrow maintains visual continuity. Drag-and-drop image and icon placeholders let you reinforce each stage with graphics, status indicators, or KPI visuals.
Built on master slides for PowerPoint and Google Slides, this layout includes editable vector shapes and smart guides for effortless alignment. Customize colors to match brand guidelines, adjust marker positions, or swap icons in seconds using the intuitive shape-styling panel. Paired text boxes support rich formatting, headings, and body text, so you can communicate dates, objectives, or key insights with precision.
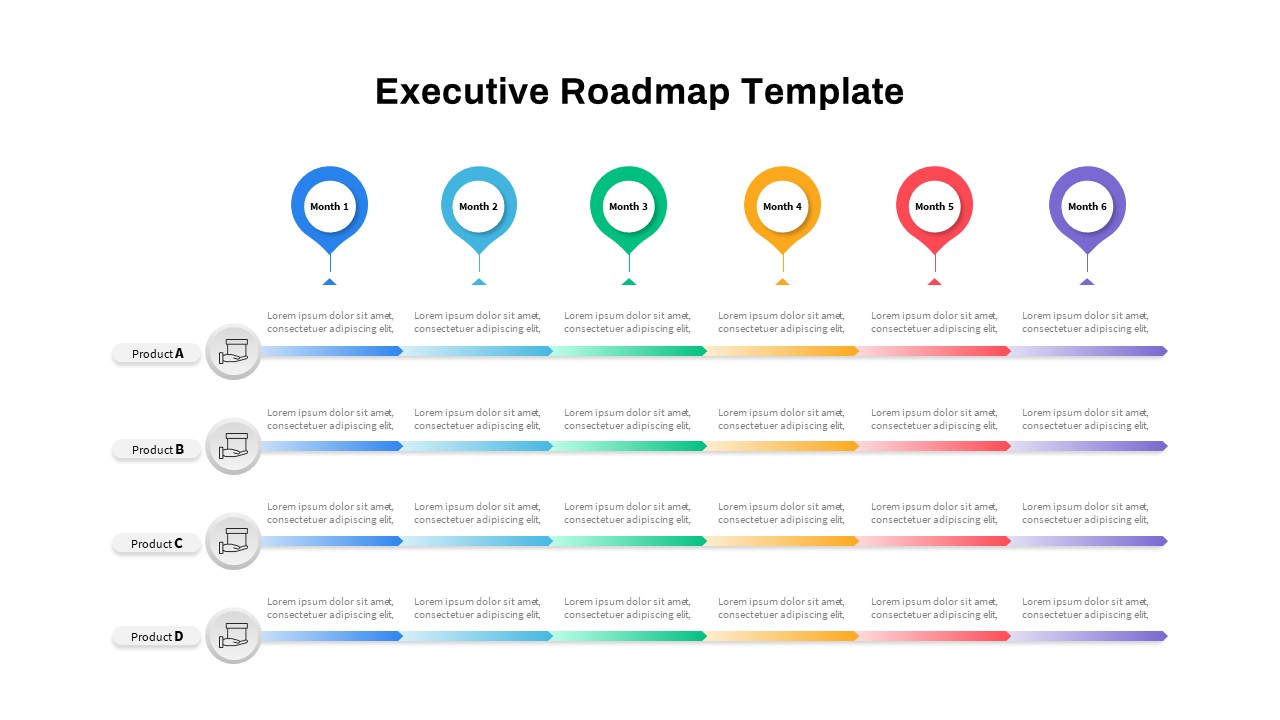
The slide supports multiple theme variants, enabling you to replicate the six-stage structure across different topics or departments within the same deck. Use alignment grids to maintain consistent spacing when duplicating or resizing markers. This design maintains sharp resolution on desktop, tablet, and mobile views, and exports seamlessly to PDF or image formats for reports, social media, or print collateral. Lightweight file size and simplified layout help prevent versioning issues and reduce editing time. Whether you’re mapping product releases, strategic roadmaps, training modules, or historical timelines, this flexible infographic slide brings data to life with clarity and professional polish. Color themes and typography presets are fully integrated, ensuring brand consistency across all stages.
Who is it for
Project managers, product teams, business analysts, consultants, and marketing professionals seeking to visualize milestones, workflows, or process sequences in a concise and engaging format.
Other Uses
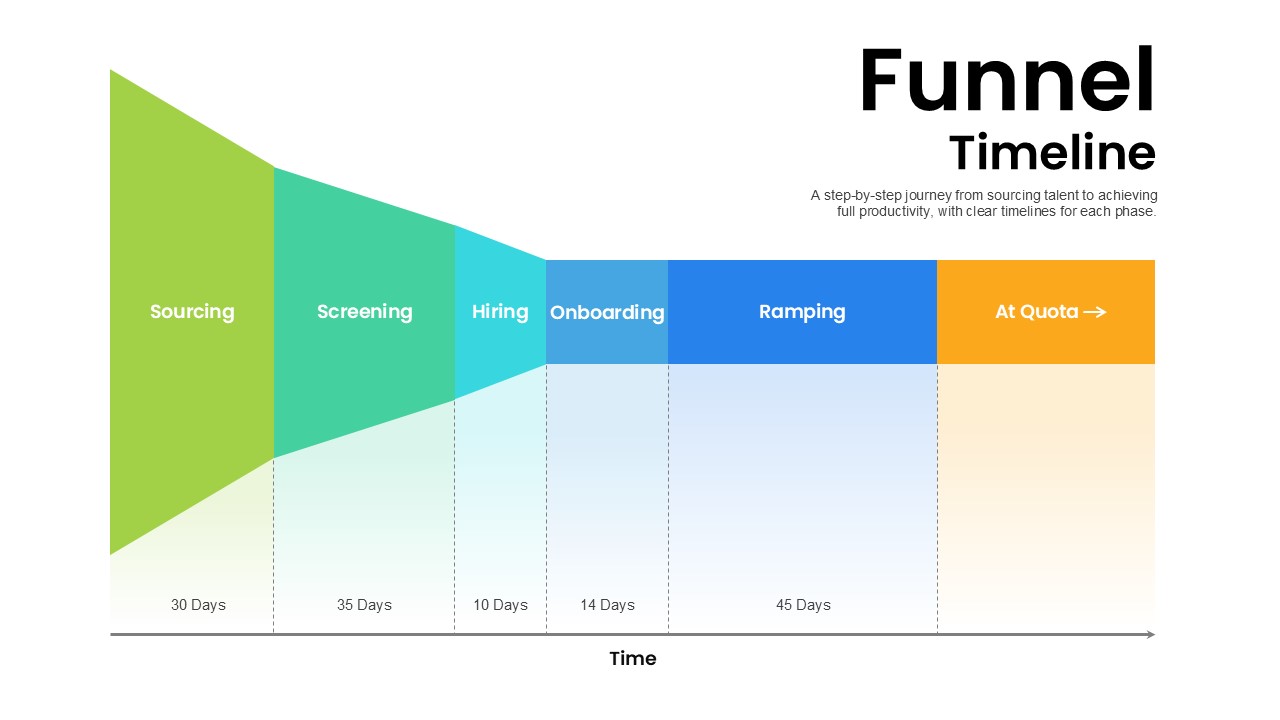
Ideal for illustrating event schedules, development roadmaps, change management timelines, training agendas, historical overviews, or process flows in corporate presentations, academic lectures, and consultant reports.
Login to download this file

Item ID
SB00623
Related Templates

Six-Stage Timeline Infographics Slide Template for PowerPoint & Google Slides
Timeline
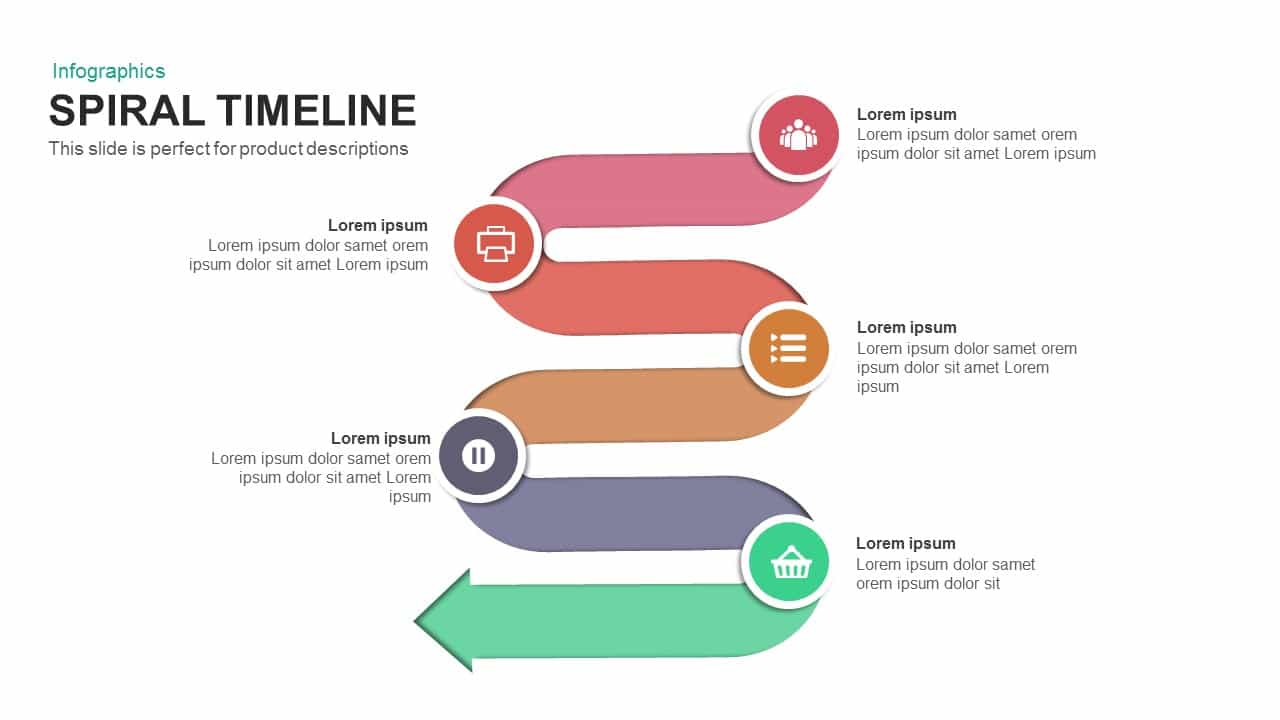
Six-Stage Colorful Spiral Timeline Template for PowerPoint & Google Slides
Timeline
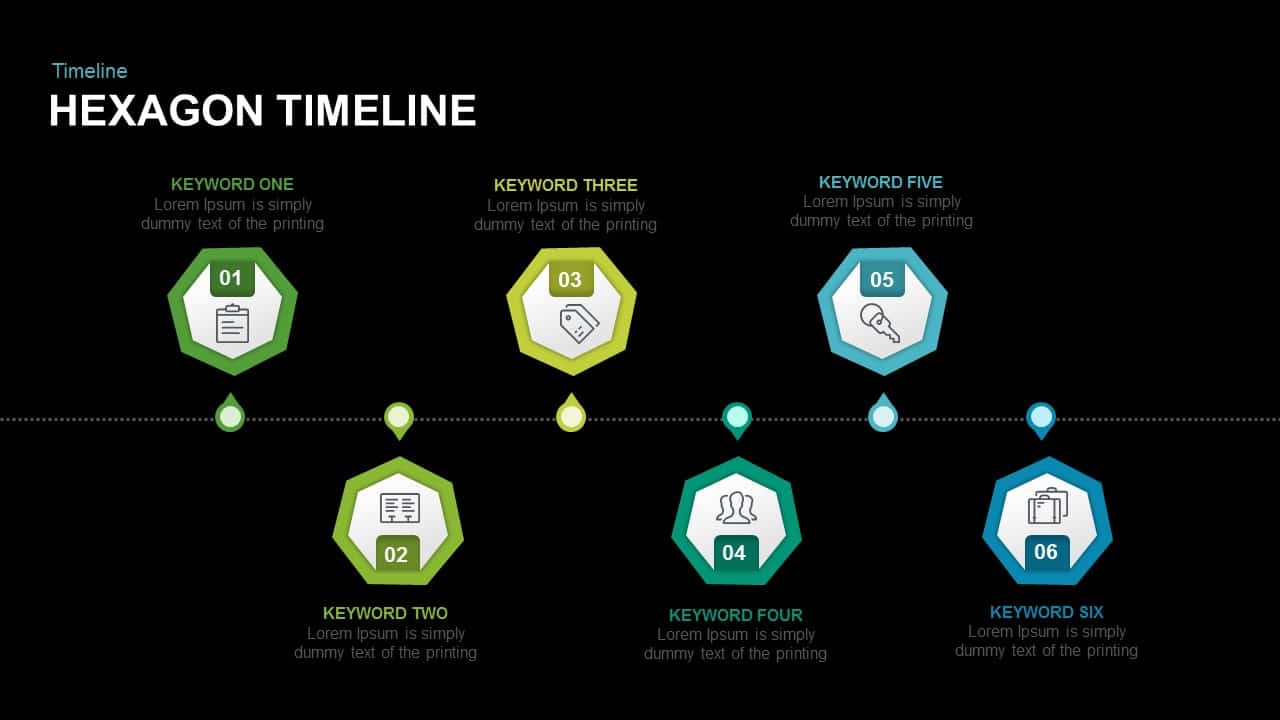
Six-Stage Hexagon Timeline Infographic Template for PowerPoint & Google Slides
Timeline
Six-Stage Arrow Timeline Diagram Template for PowerPoint & Google Slides
Timeline
Six-Stage Timeline Infographic Template for PowerPoint & Google Slides
Timeline
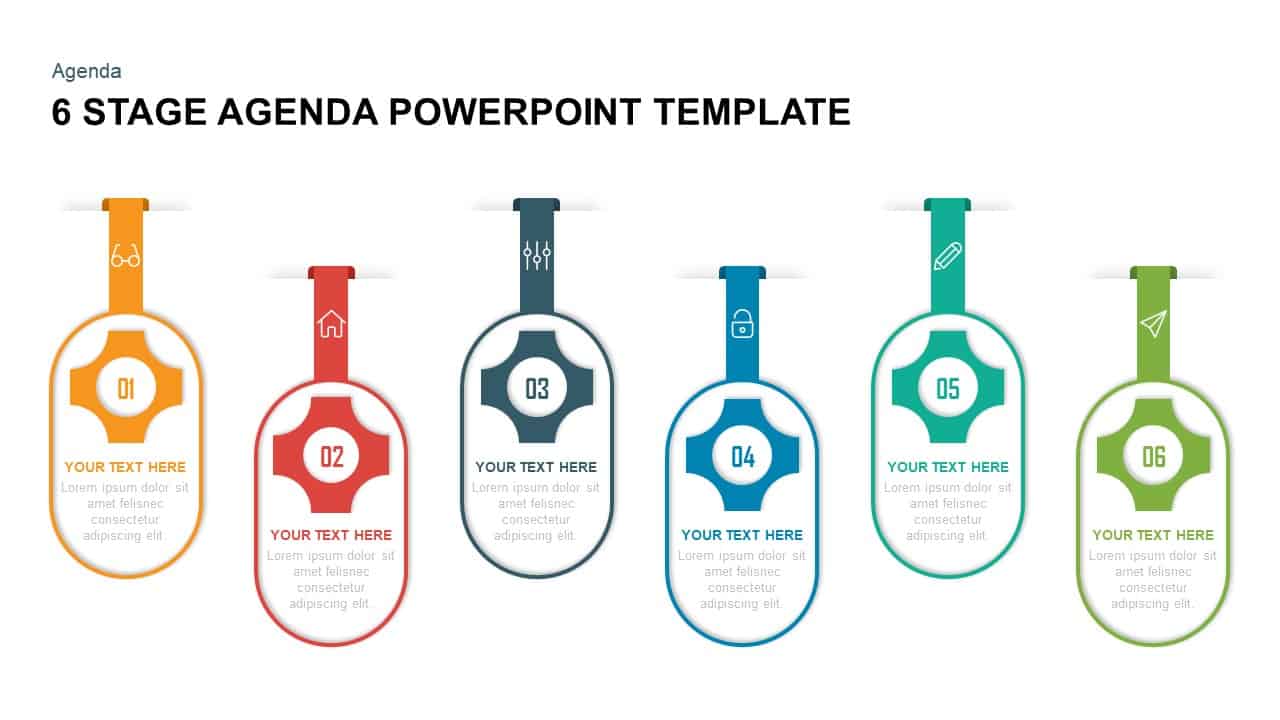
Six Stage Agenda Timeline Diagram template for PowerPoint & Google Slides
Agenda
Six-Stage Road Map Infographic Timeline Template for PowerPoint & Google Slides
Roadmap
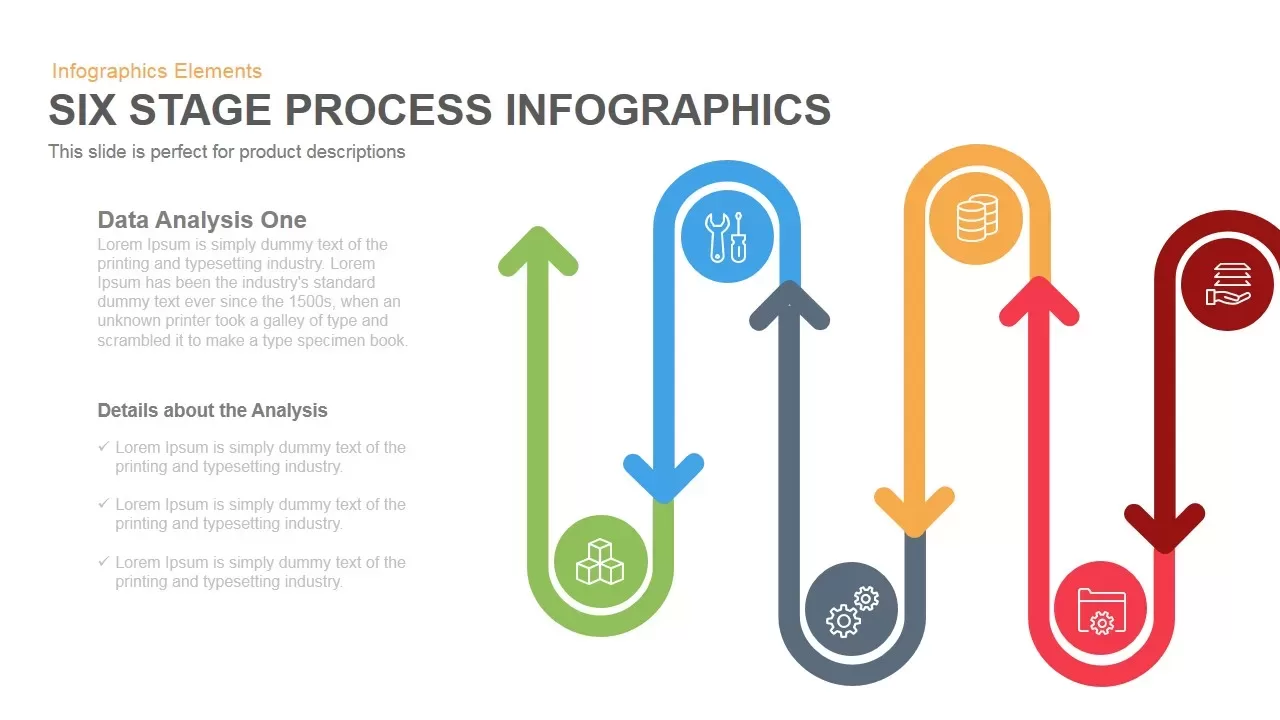
Six-Stage Process Infographics Template for PowerPoint & Google Slides
Process
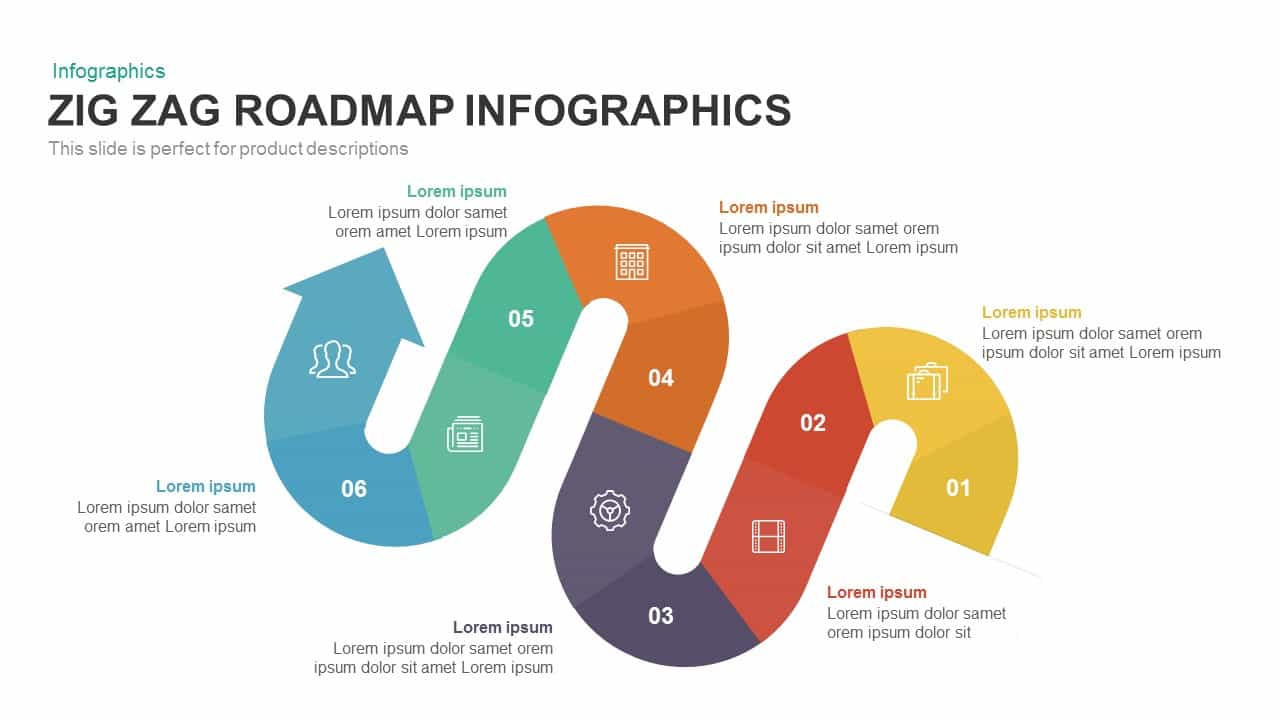
Six-Stage Zig-Zag Roadmap Infographics Template for PowerPoint & Google Slides
Roadmap
Six-Stage Time Arrow Infographics Template for PowerPoint & Google Slides
Arrow
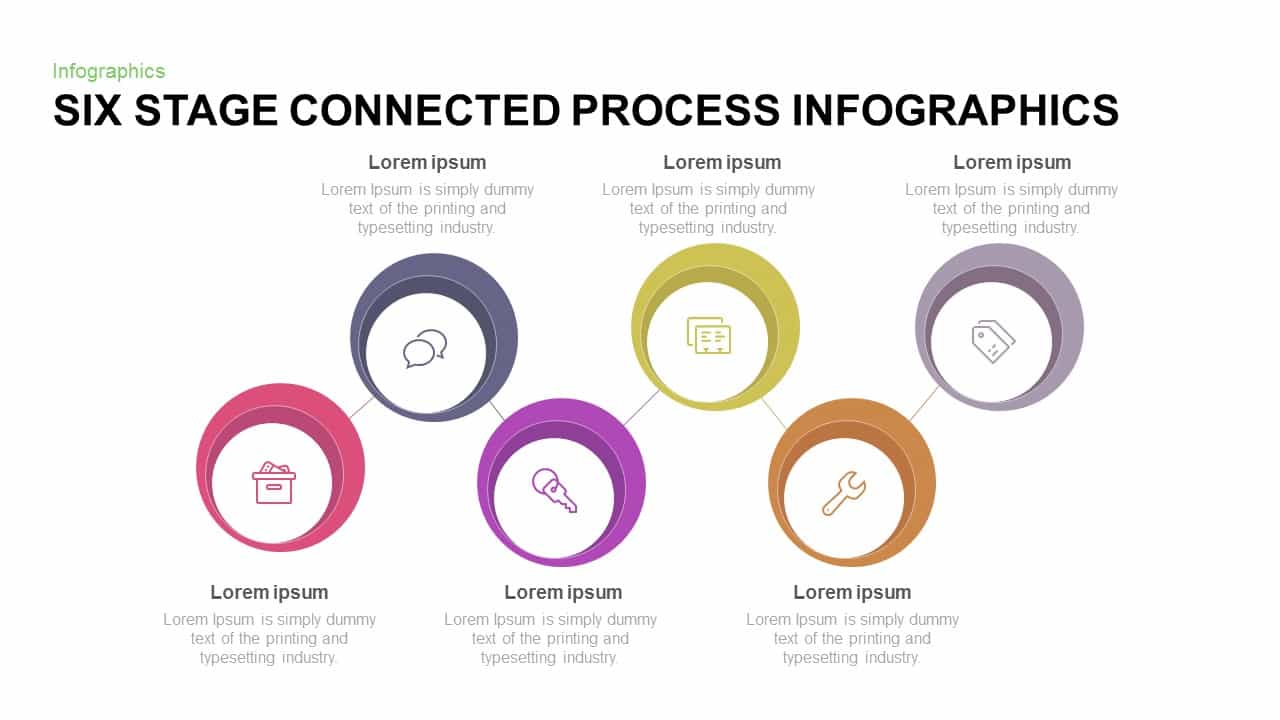
Six-Stage Connected Process Infographics Template for PowerPoint & Google Slides
Process
Six Stage Timeline Diagram for PowerPoint & Google Slides
Timeline
Multi-Stage Timeline Infographics Template for PowerPoint & Google Slides
Timeline
Five-Stage Arrow Infographics Timeline Template for PowerPoint & Google Slides
Arrow

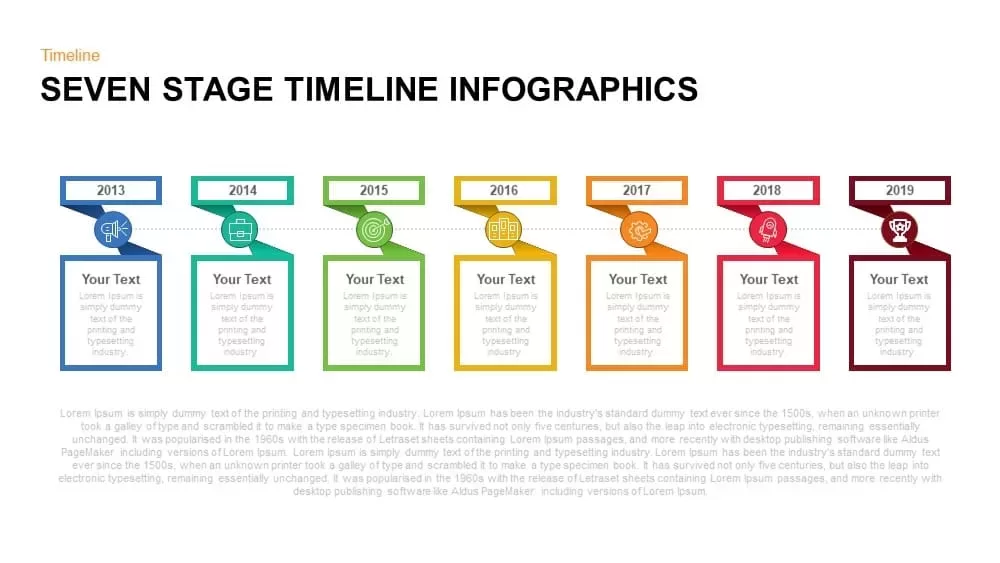
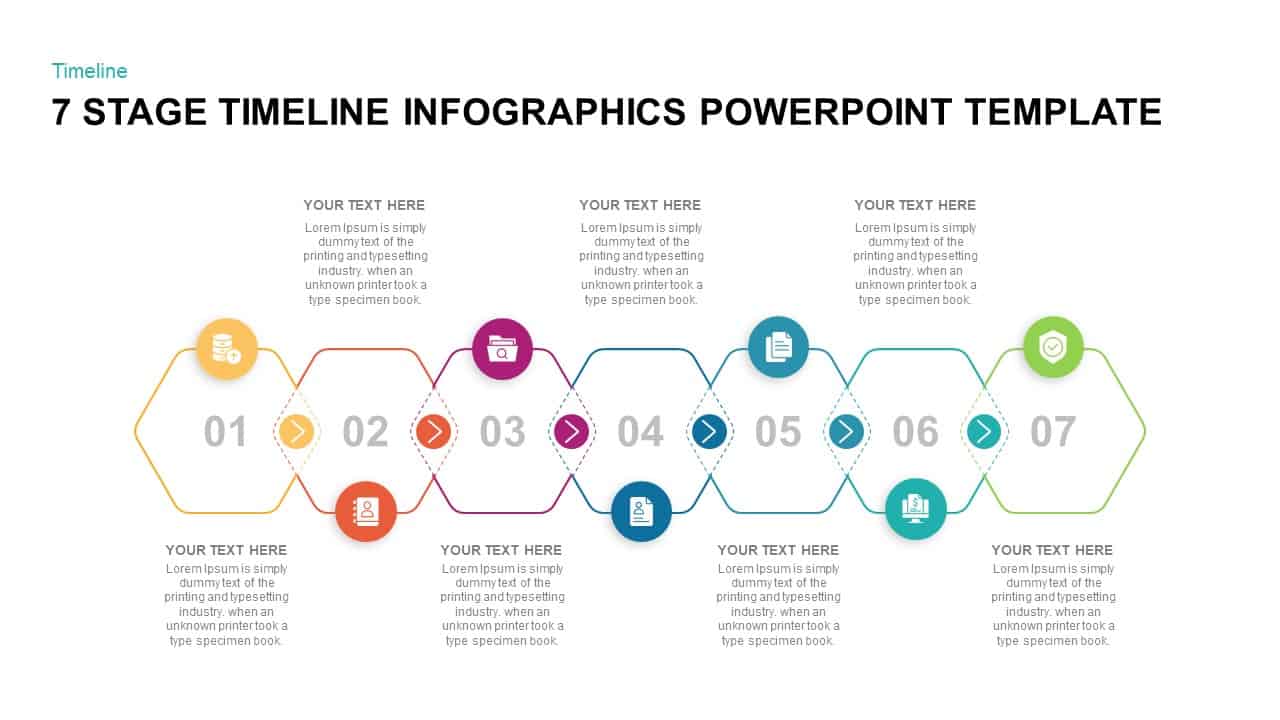
Seven-Stage Timeline Infographics Template for PowerPoint & Google Slides
Timeline
6 Stage Timeline Infographics template for PowerPoint & Google Slides
Timeline
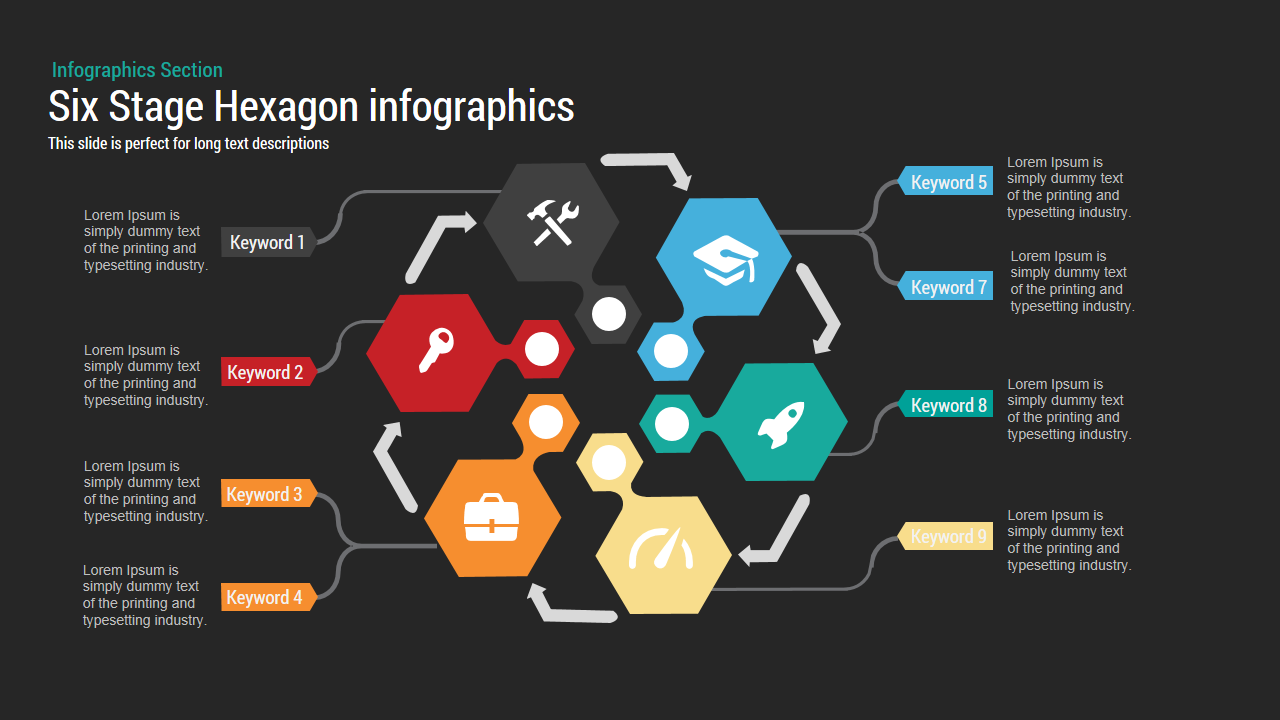
Six-Stage Hexagon template for PowerPoint & Google Slides
Process
Six Stage Zigzag Process Diagram Template for PowerPoint & Google Slides
Process
Six-Stage Zig-Zag Process Flow Diagram Template for PowerPoint & Google Slides
Process
Six-Stage Semi-Circle Diagram with Icons Template for PowerPoint & Google Slides
Circular
Six-Stage Circular Cycle Diagram Template for PowerPoint & Google Slides
Process
Free Six Stage Bubble Process Diagram template for PowerPoint & Google Slides
Process
Free
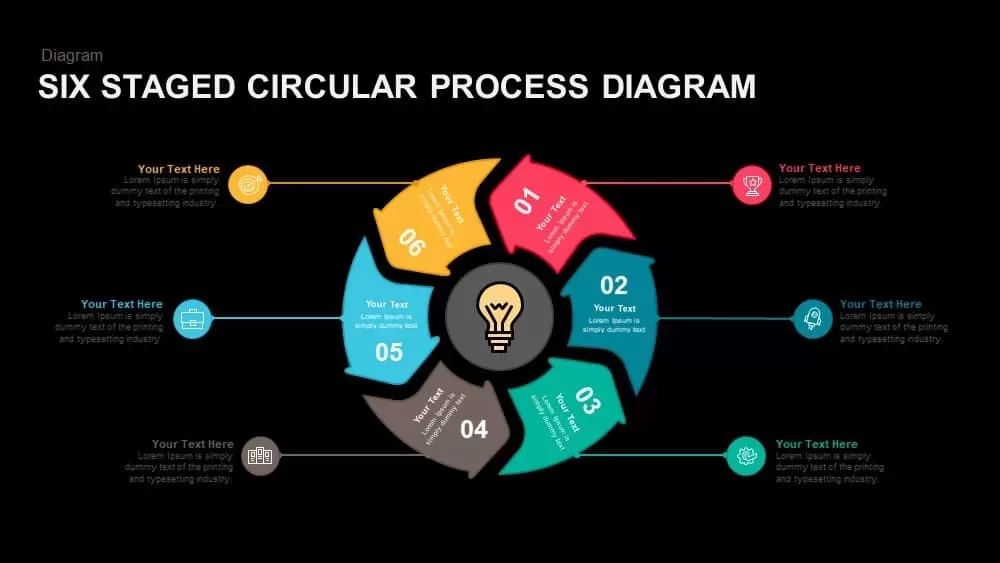
Six-Stage Circular Process Diagram Template for PowerPoint & Google Slides
Process
Six Stage Circular Diagram with Icons Template for PowerPoint & Google Slides
Circular
Six-Stage Circle Process Diagram Template for PowerPoint & Google Slides
Process
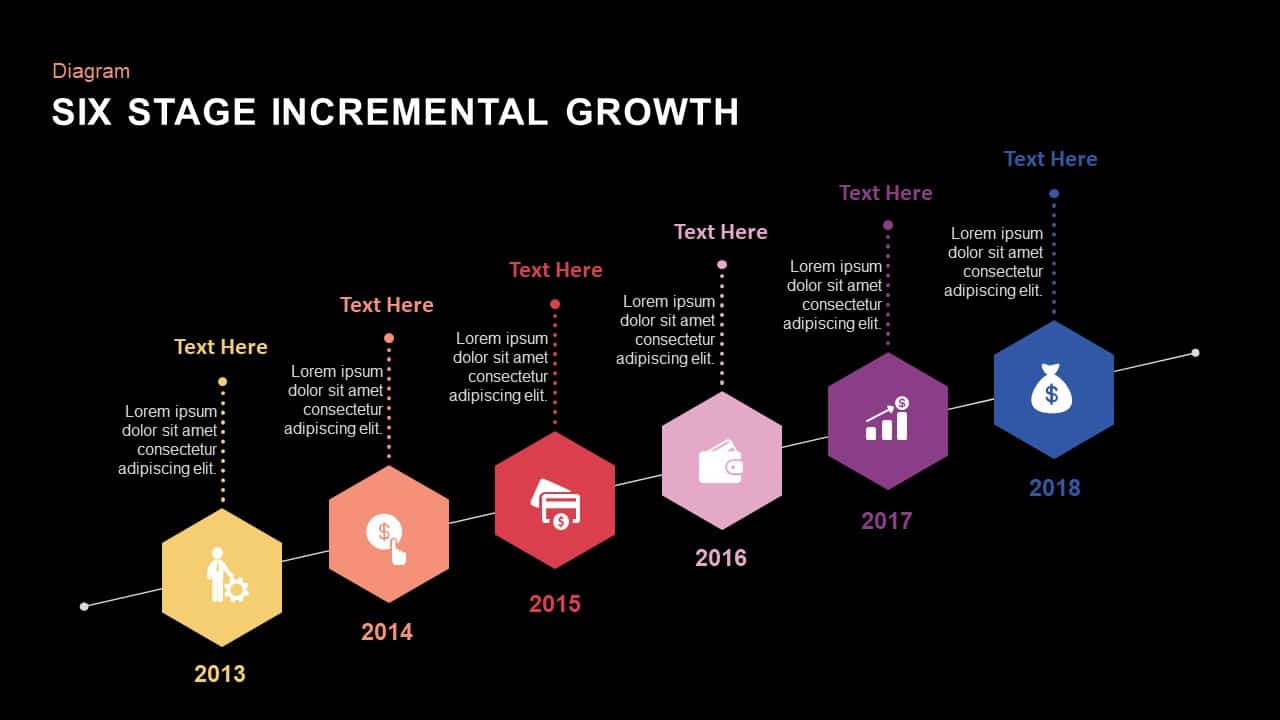
Six Stage Incremental Growth template for PowerPoint & Google Slides
Timeline
Free Six-Stage Arrow Process Diagram Template for PowerPoint & Google Slides
Process
Free
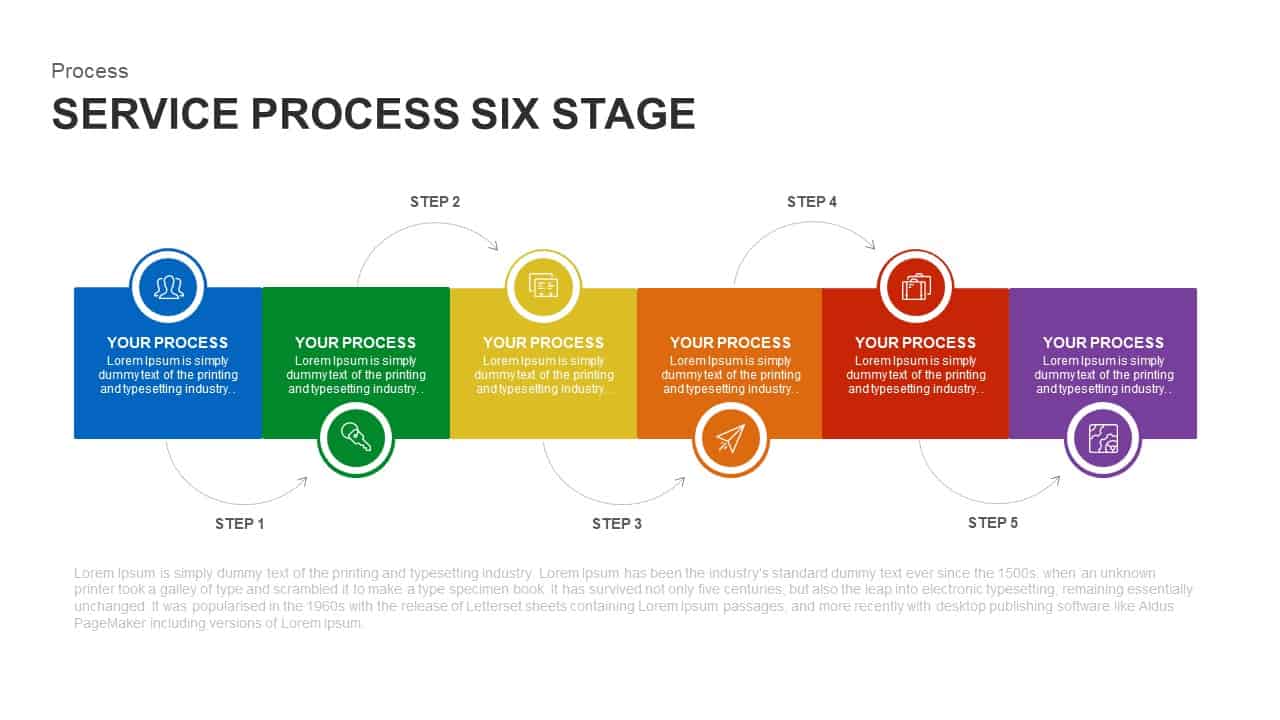
Six-Stage Service Process Workflow Template for PowerPoint & Google Slides
Process
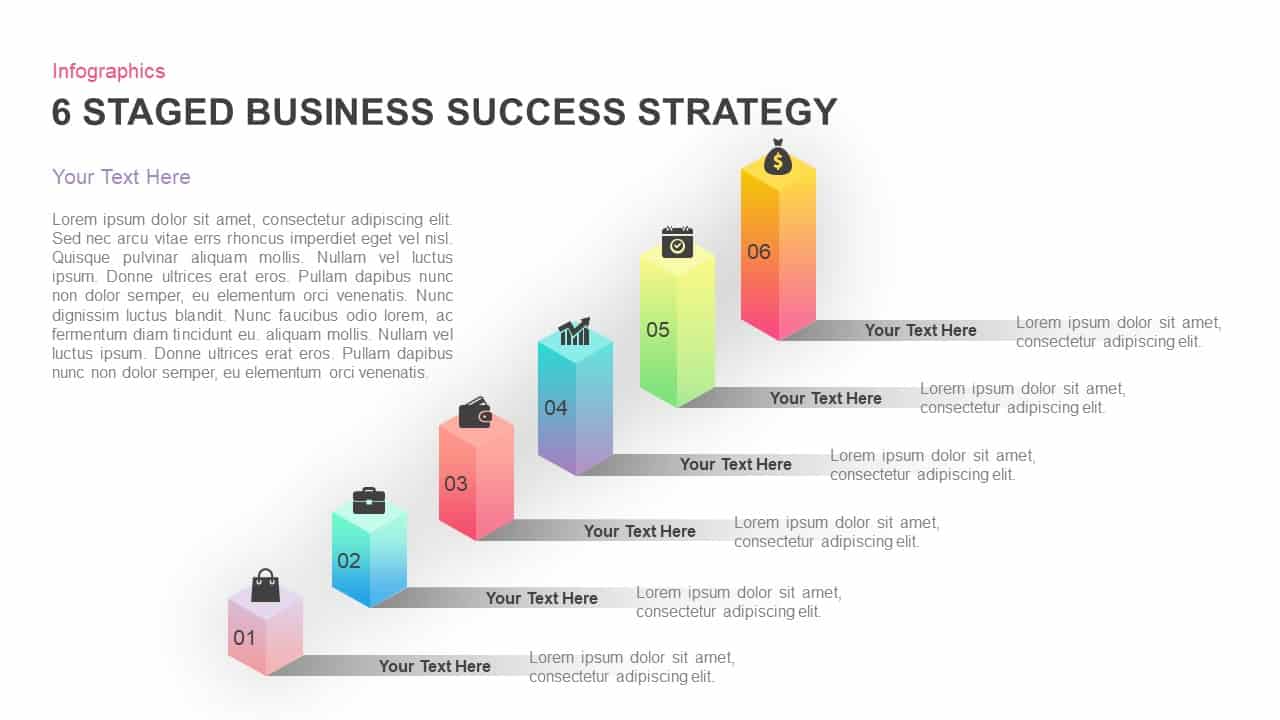
Six-Stage Business Success Strategy Template for PowerPoint & Google Slides
Business Strategy
Six-Stage Gear Wheel Diagram Template for PowerPoint & Google Slides
Circular
Six-Stage Circular Diagram Process Template for PowerPoint & Google Slides
Circular
Six Stage Hexagon Process Diagram Template for PowerPoint & Google Slides
Process
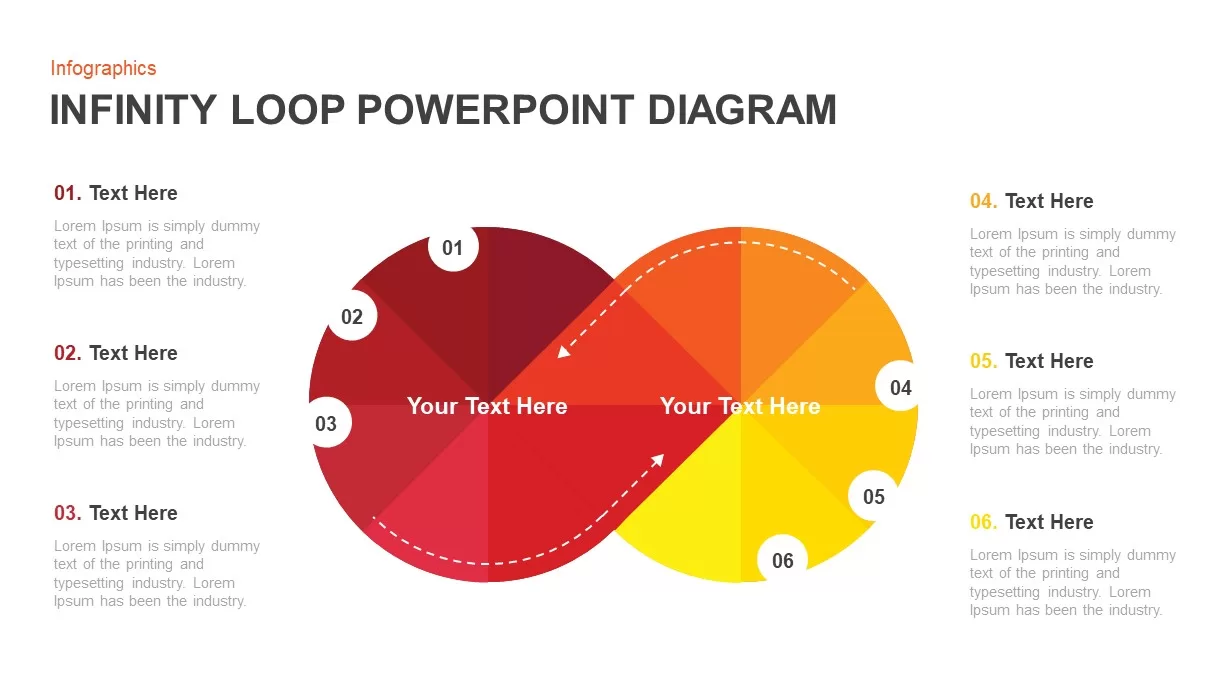
Six-Stage Infinity Loop Process Diagram Template for PowerPoint & Google Slides
Process
Six-Stage Clockwise Circular Diagram Template for PowerPoint & Google Slides
Circular
Six-Stage Circular Flow Diagram Template for PowerPoint & Google Slides
Circular
Six-Stage Star Diagram Infographic Template for PowerPoint & Google Slides
Process

Six-Stage Infinity Loop Diagram Template for PowerPoint & Google Slides
Process
Animated Six-Stage 3D Process Diagram Template for PowerPoint & Google Slides
Arrow
Six-Stage Pyramid Process Slide Template for PowerPoint & Google Slides
Pyramid
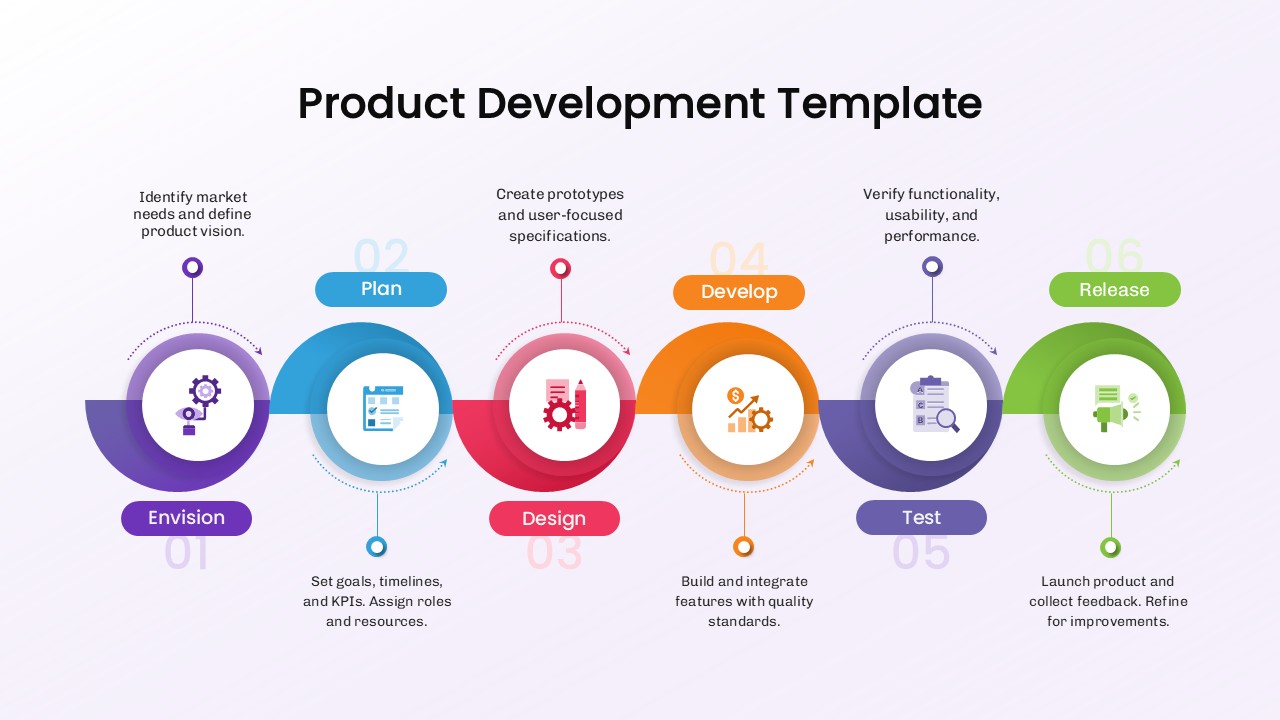
Six Stage Product Development Process Template for PowerPoint & Google Slides
Software Development
Five and Six Step Line Linear Stage Diagram for PowerPoint & Google Slides
Infographics
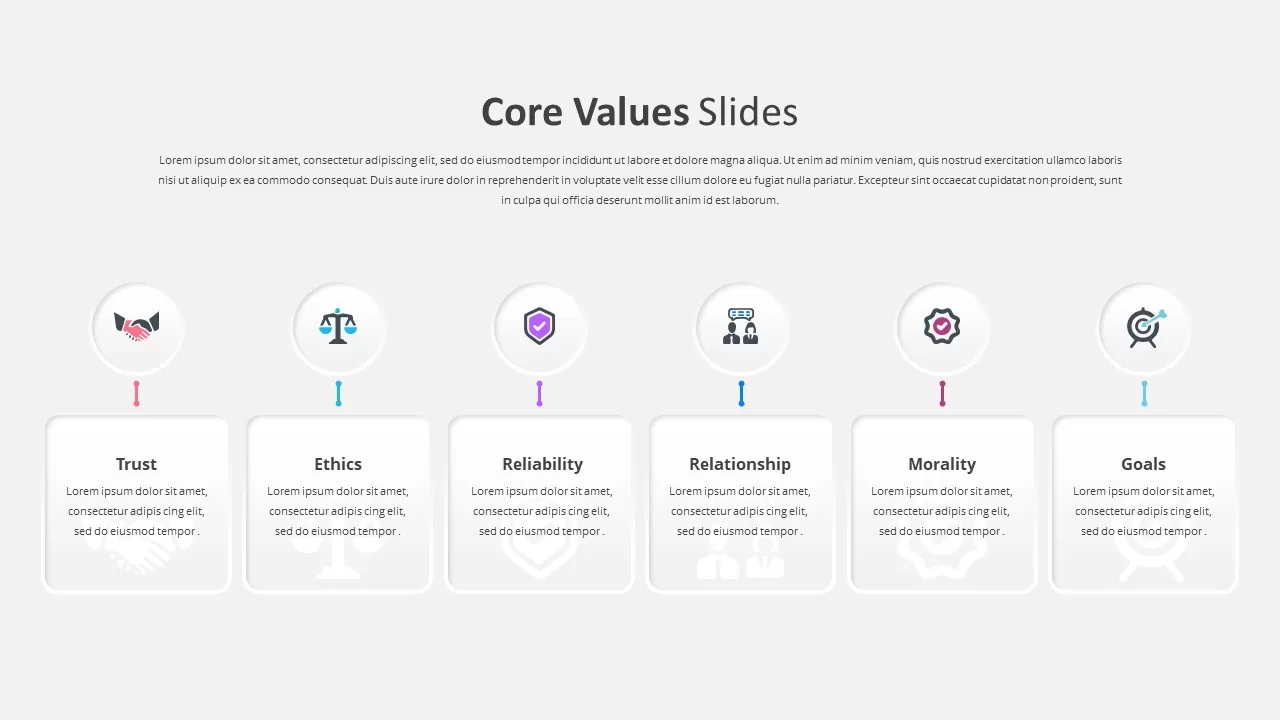
Six Core Values Infographic Timeline Template for PowerPoint & Google Slides
Comparison
Six-Month Innovation Roadmap Timeline Template for PowerPoint & Google Slides
Roadmap
Modern Six-Point Timeline Infographic Template for PowerPoint & Google Slides
Timeline
Executive Roadmap Six-Month Timeline Template for PowerPoint & Google Slides
Roadmap
Hiring Funnel Timeline with Six Phases Template for PowerPoint & Google Slides
Recruitment
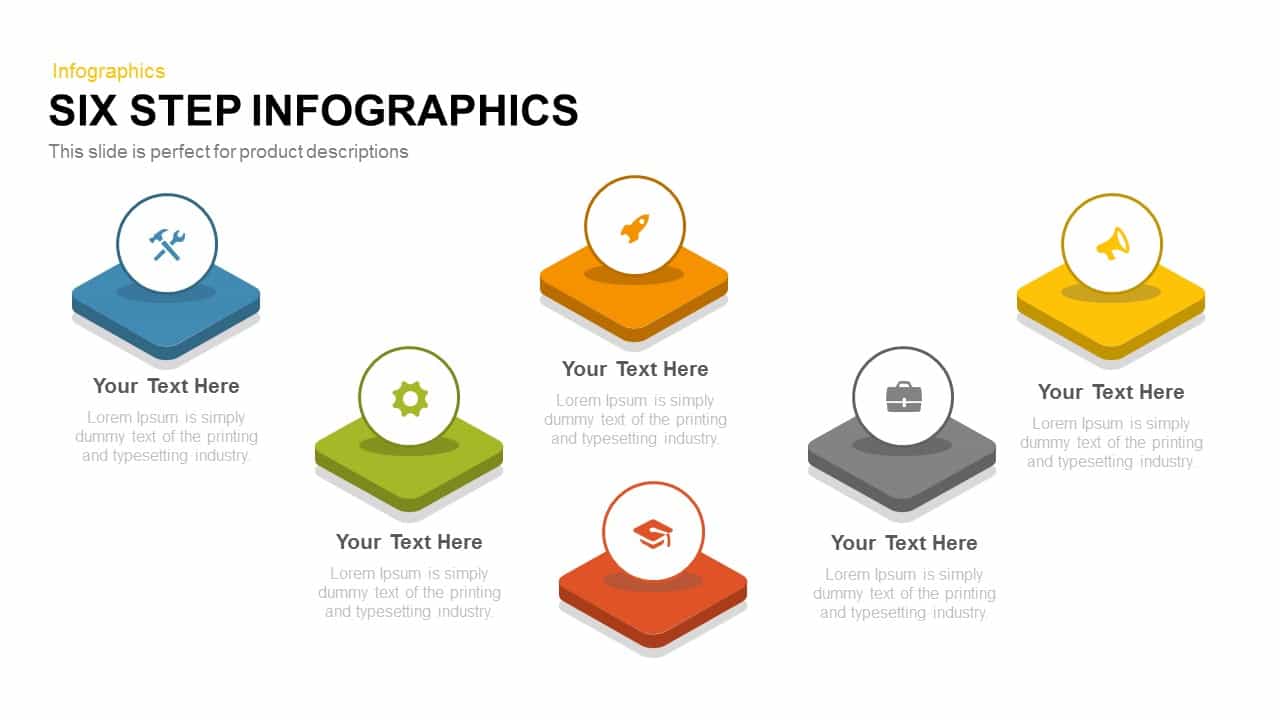
Six-Step Infographics Template for PowerPoint & Google Slides
Process
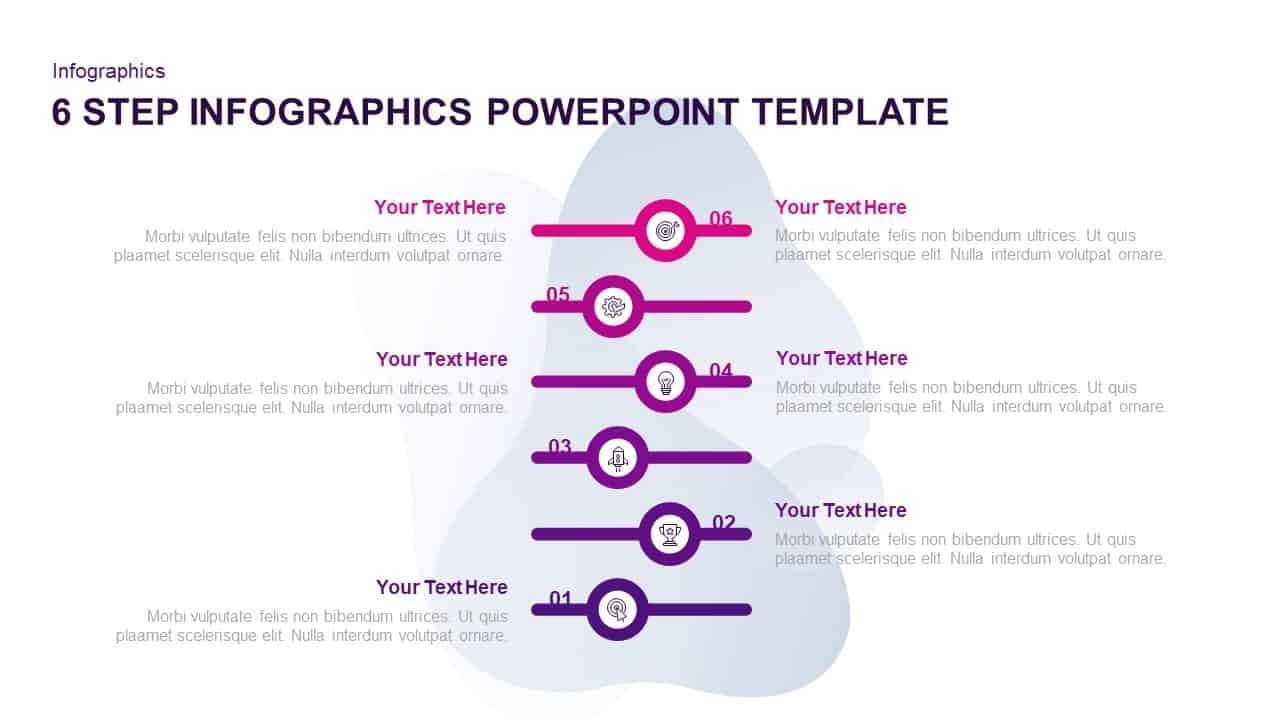
Six-Step Purple Gradient Infographics Template for PowerPoint & Google Slides
Process
Six-Step Circular Diagram Infographics Template for PowerPoint & Google Slides
Circular
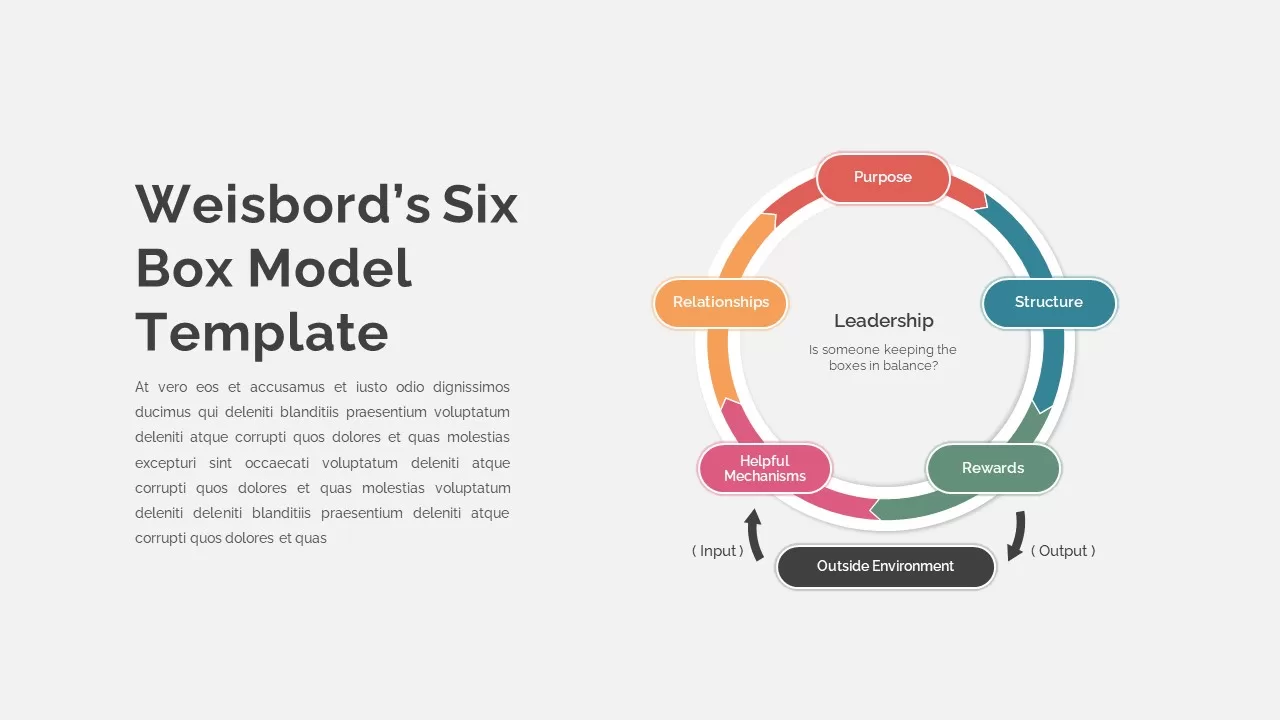
Weisbord’s Six Box Model Infographics Template for PowerPoint & Google Slides
Circular
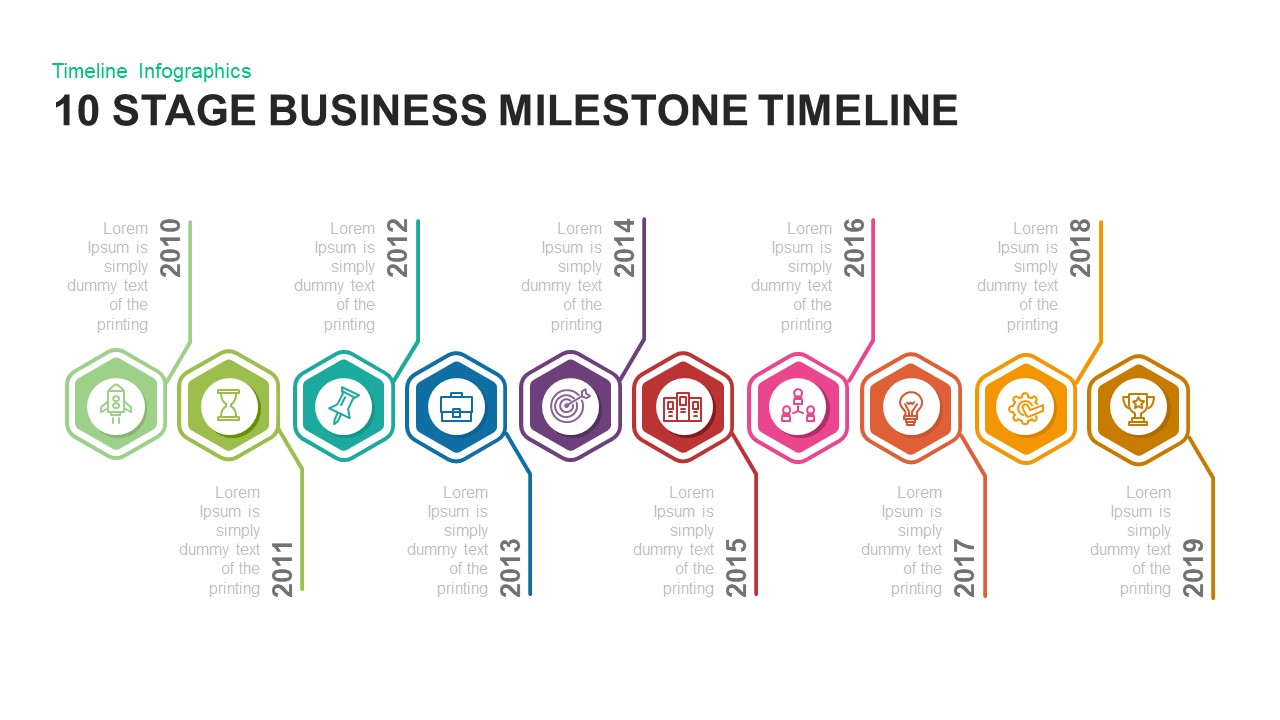
10 Stage Business Milestone Timeline PowerPoint Template for PowerPoint & Google Slides
Timeline
7-Stage Colorful Timeline Infographic Template for PowerPoint & Google Slides
Timeline
Three Four Five Stage Timeline Infographic Template for PowerPoint & Google Slides
Timeline

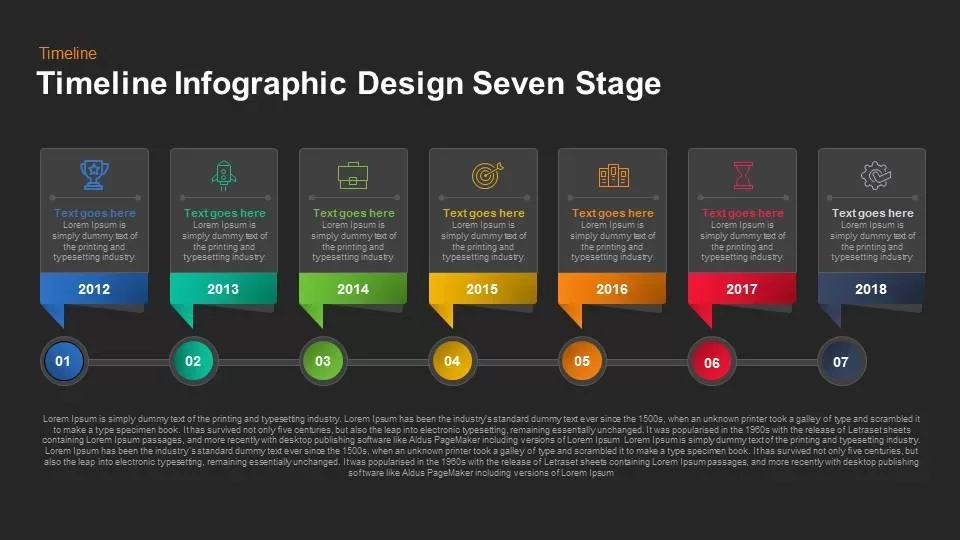
Timeline Infographic Design Seven Stage template for PowerPoint & Google Slides
Timeline
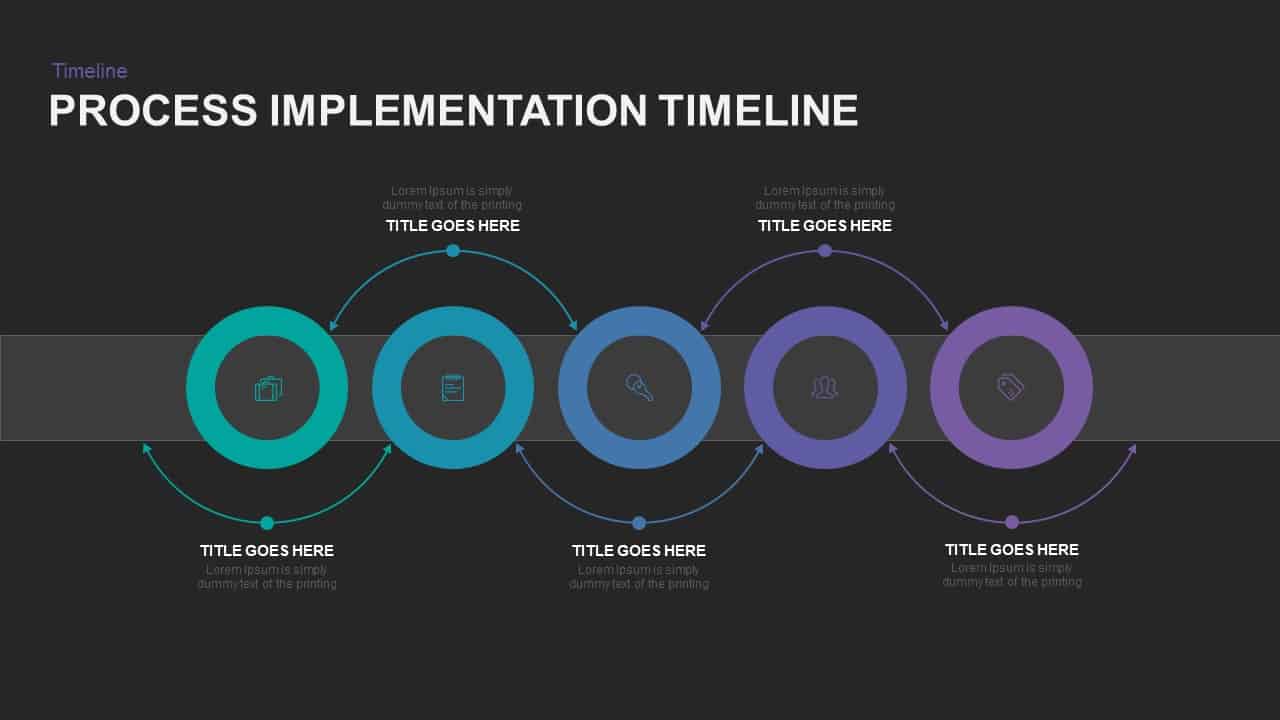
5-Stage Process Implementation Timeline Template for PowerPoint & Google Slides
Timeline
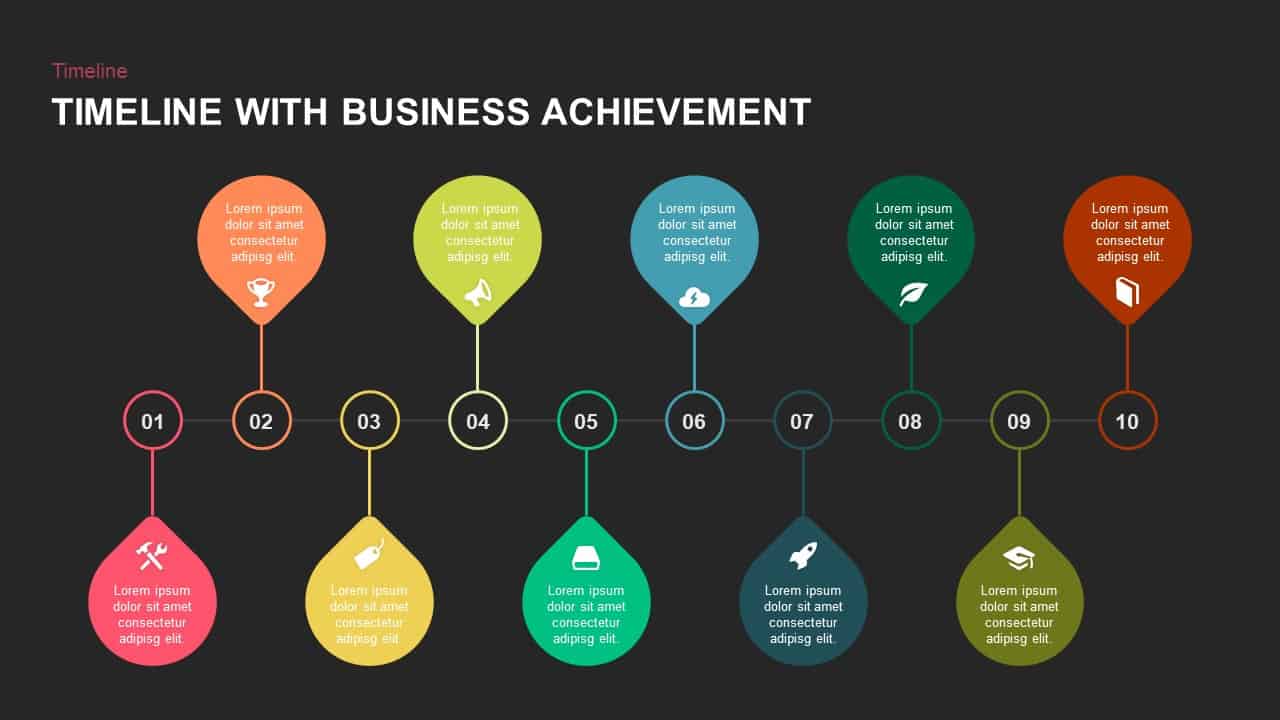
10-Stage Timeline with Business Achievements Template for PowerPoint & Google Slides
Timeline
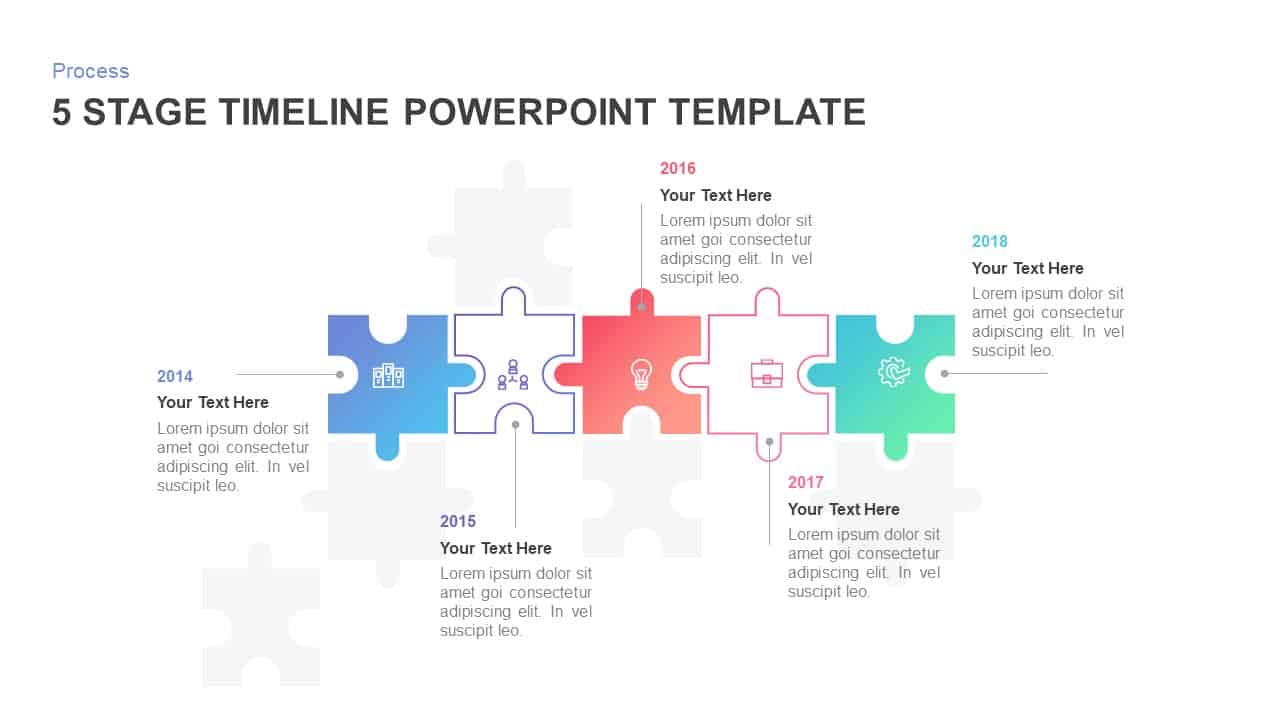
Animated 5-Stage Puzzle Timeline Infographic Template for PowerPoint & Google Slides
Timeline
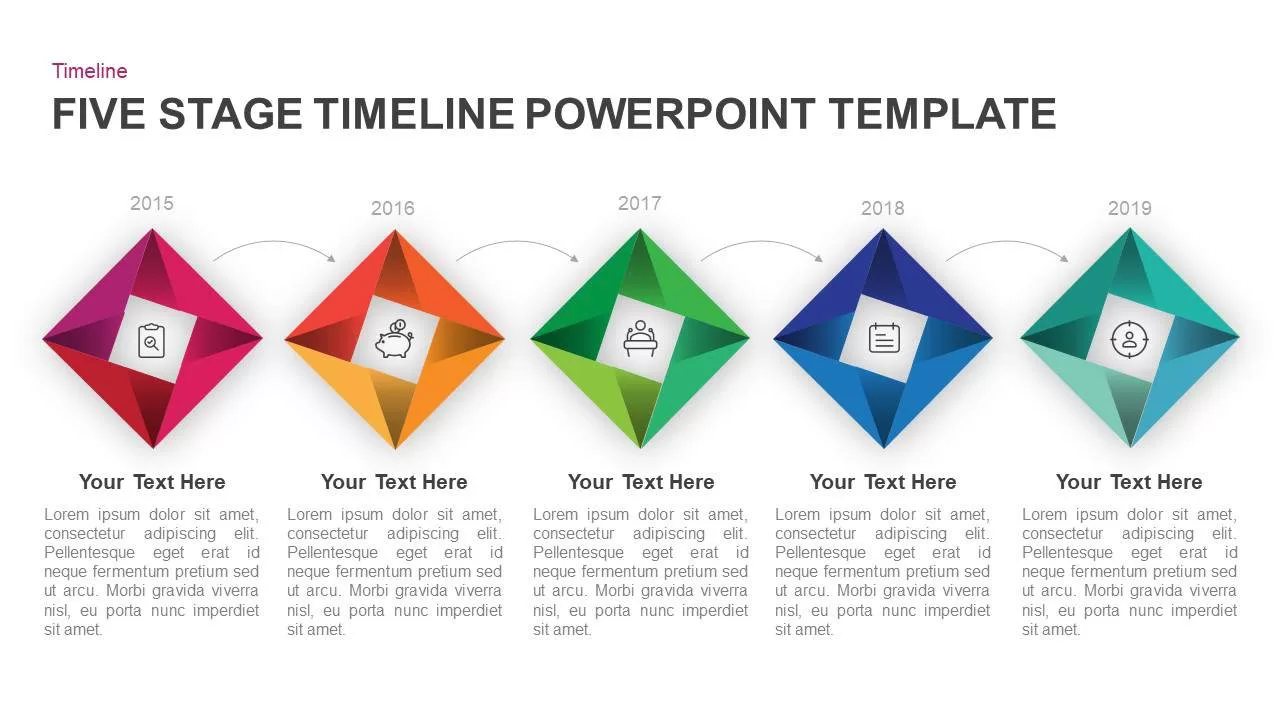
Five-Stage Diamond Timeline Chart Template for PowerPoint & Google Slides
Timeline
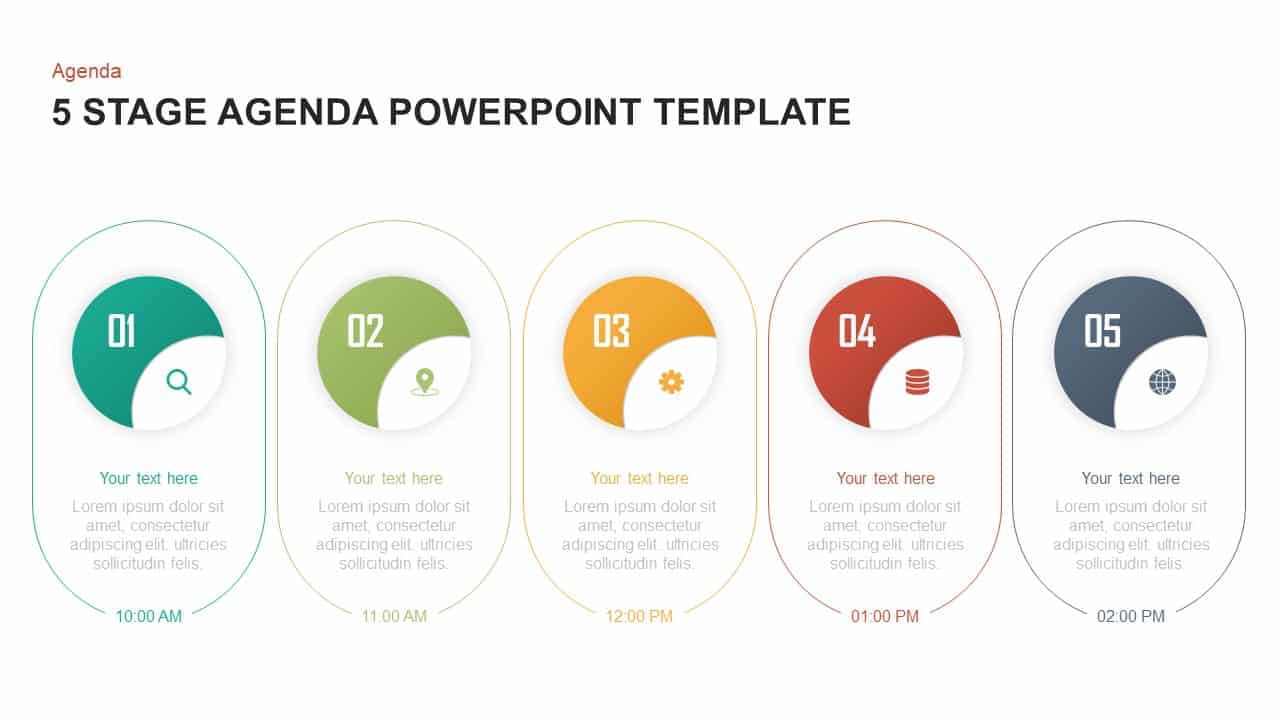
5 Stage Agenda Timeline Carousel Template for PowerPoint & Google Slides
Agenda
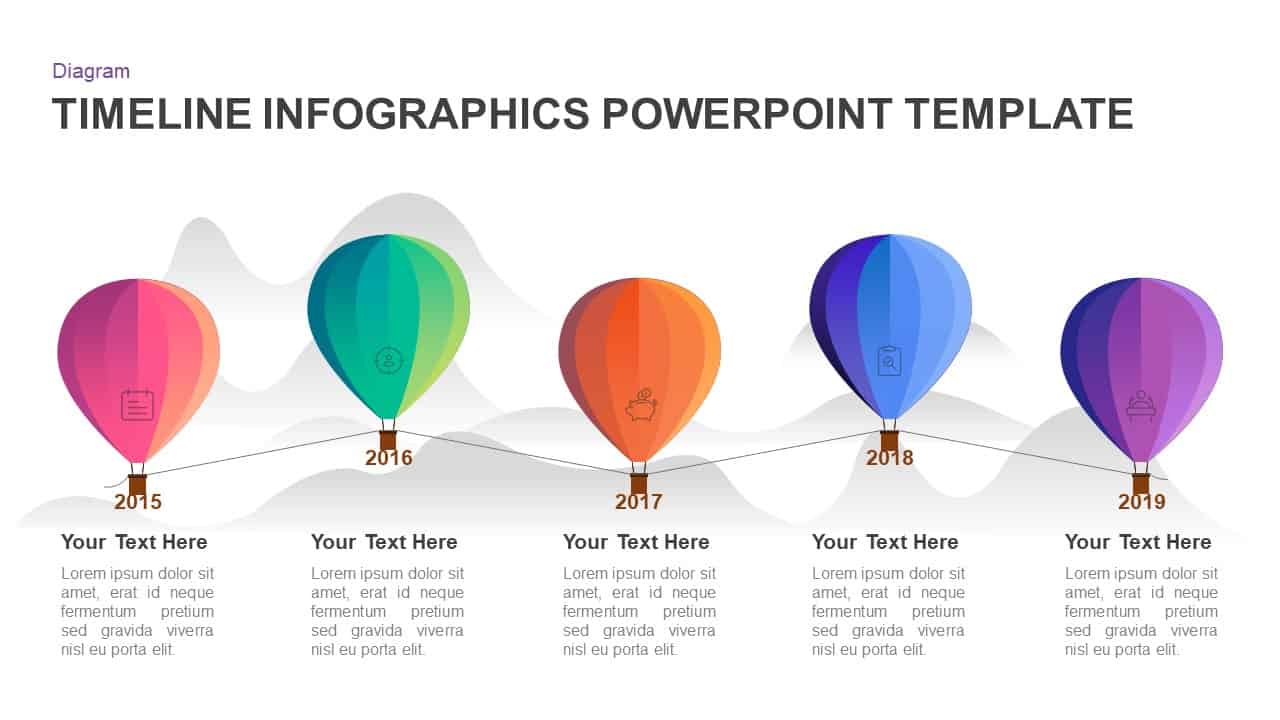
5-Stage Hot-Air Balloon Timeline Template for PowerPoint & Google Slides
Timeline
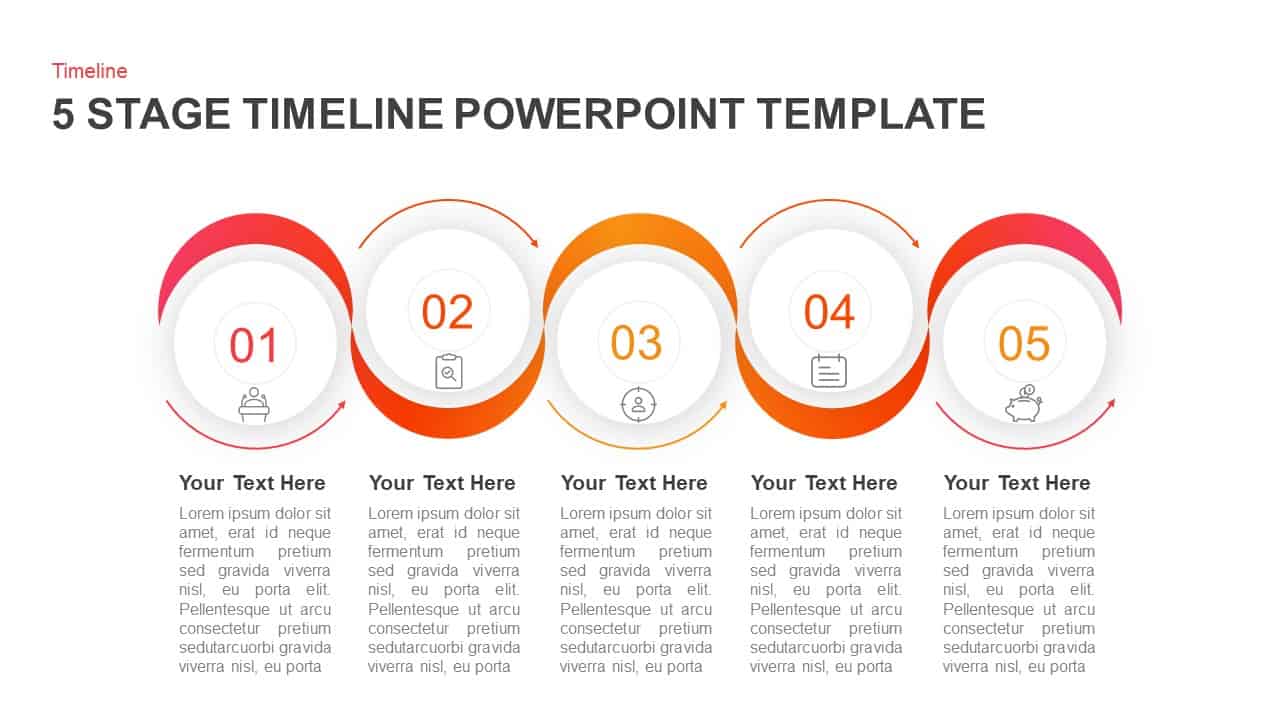
5 Stage Circular Timeline Infographic Template for PowerPoint & Google Slides
Timeline
Five-Stage Slanted Timeline Diagram Template for PowerPoint & Google Slides
Timeline
Five-Stage Sequential Tags Timeline Template for PowerPoint & Google Slides
Timeline
5 Stage Timeline Infographic Slide Template for PowerPoint & Google Slides
Timeline
5-Stage Financial Growth Timeline Template for PowerPoint & Google Slides
Timeline
5-Stage Timeline Infographic Slide Template for PowerPoint & Google Slides
Timeline
Seven-Stage Hexagon Timeline Infographic Template for PowerPoint & Google Slides
Timeline
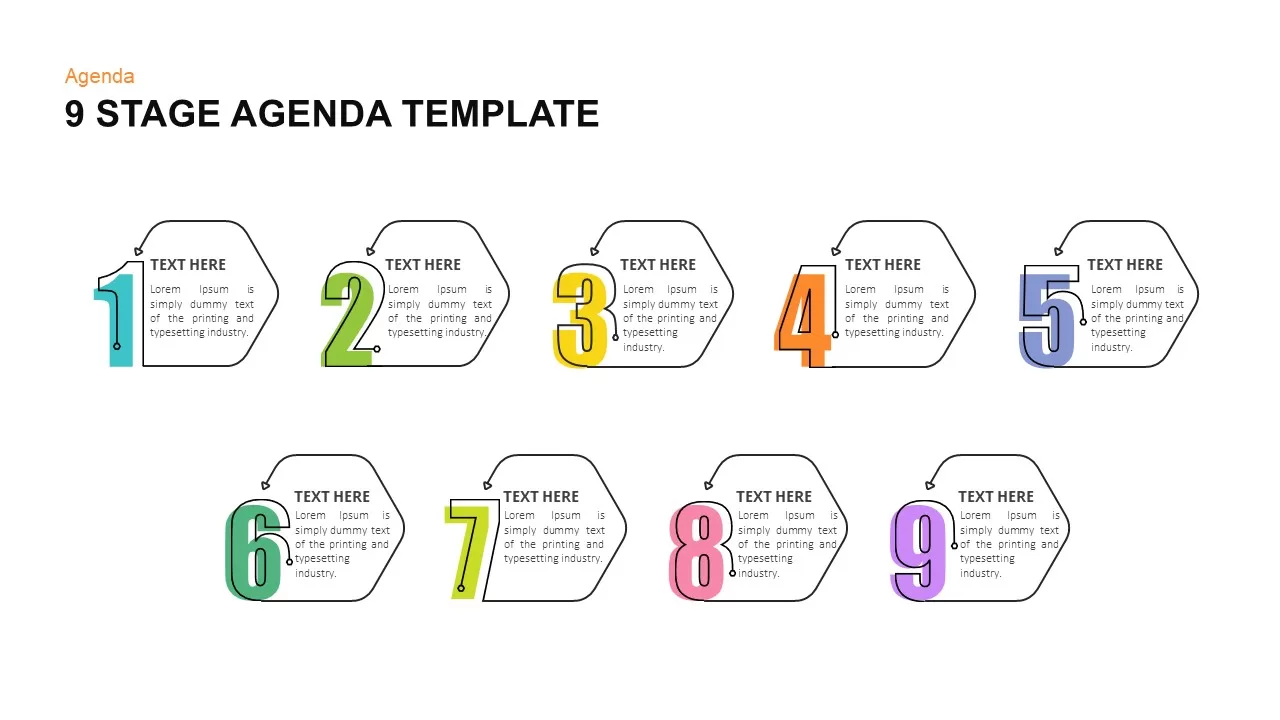
Clock-Timeline Nine-Stage Agenda Template for PowerPoint & Google Slides
Agenda
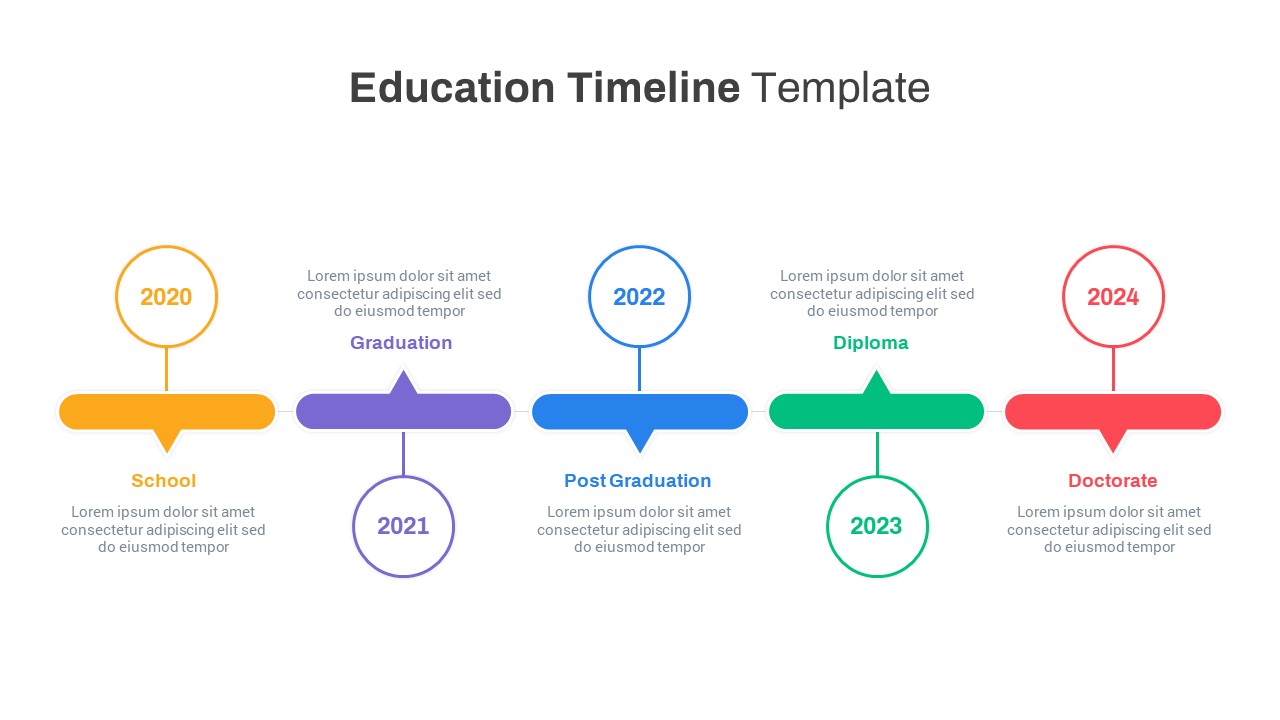
Colorful Five-Stage Education Timeline Template for PowerPoint & Google Slides
Timeline
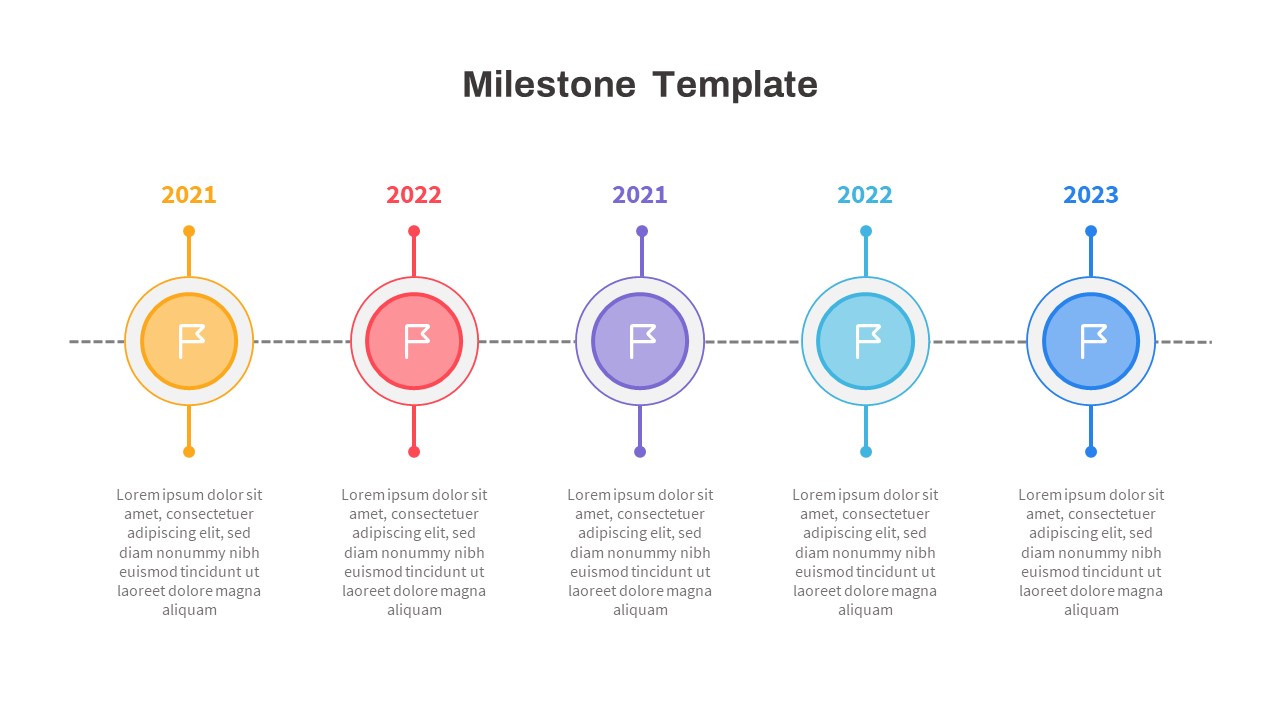
Free Multicolor Five-Stage Milestone Timeline Template for PowerPoint & Google Slides
Timeline
Free
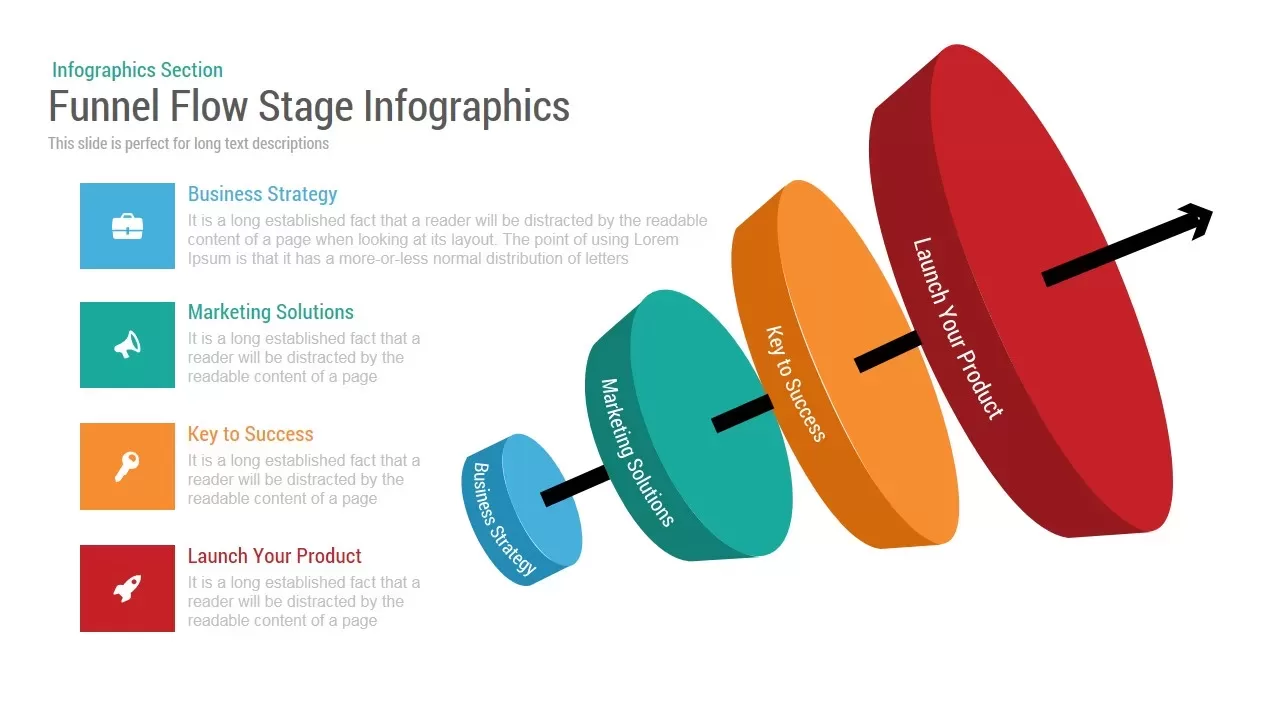
Funnel Flow Stage Infographics template for PowerPoint & Google Slides
Funnel
5-Stage Arrow Infographics Process Flow Template for PowerPoint & Google Slides
Arrow
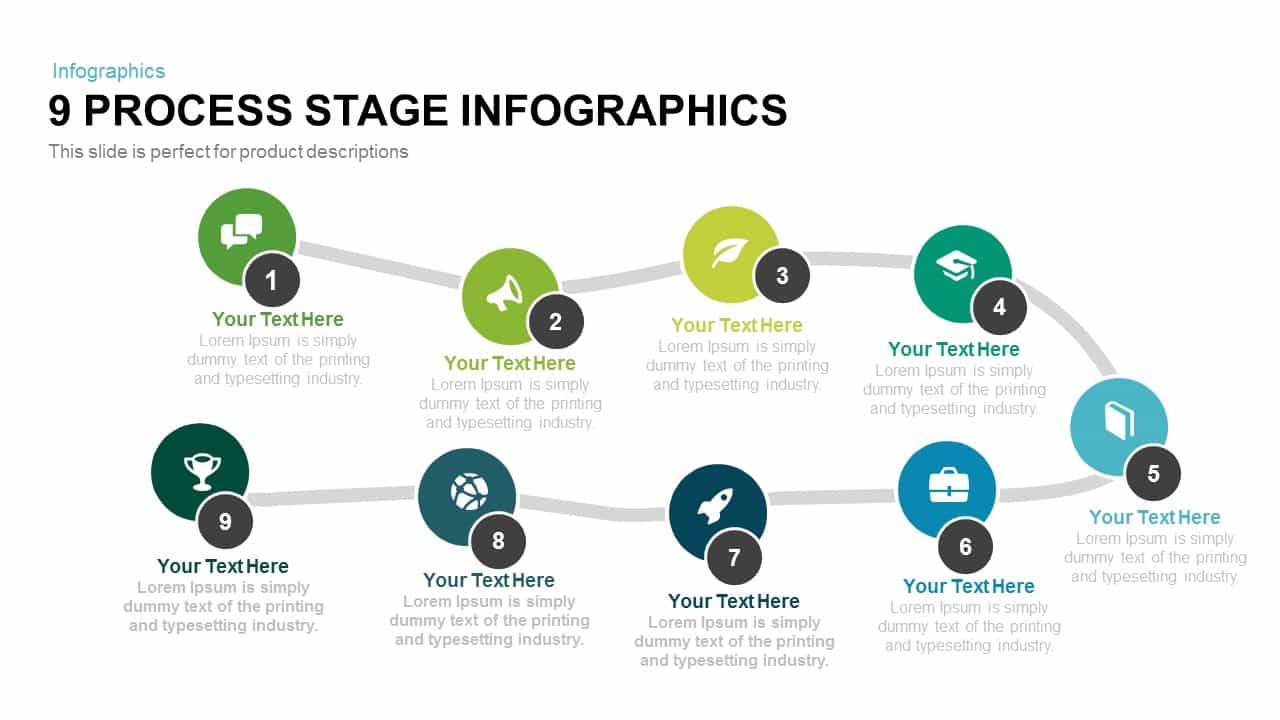
9 Process Stage Infographics template for PowerPoint & Google Slides
Process
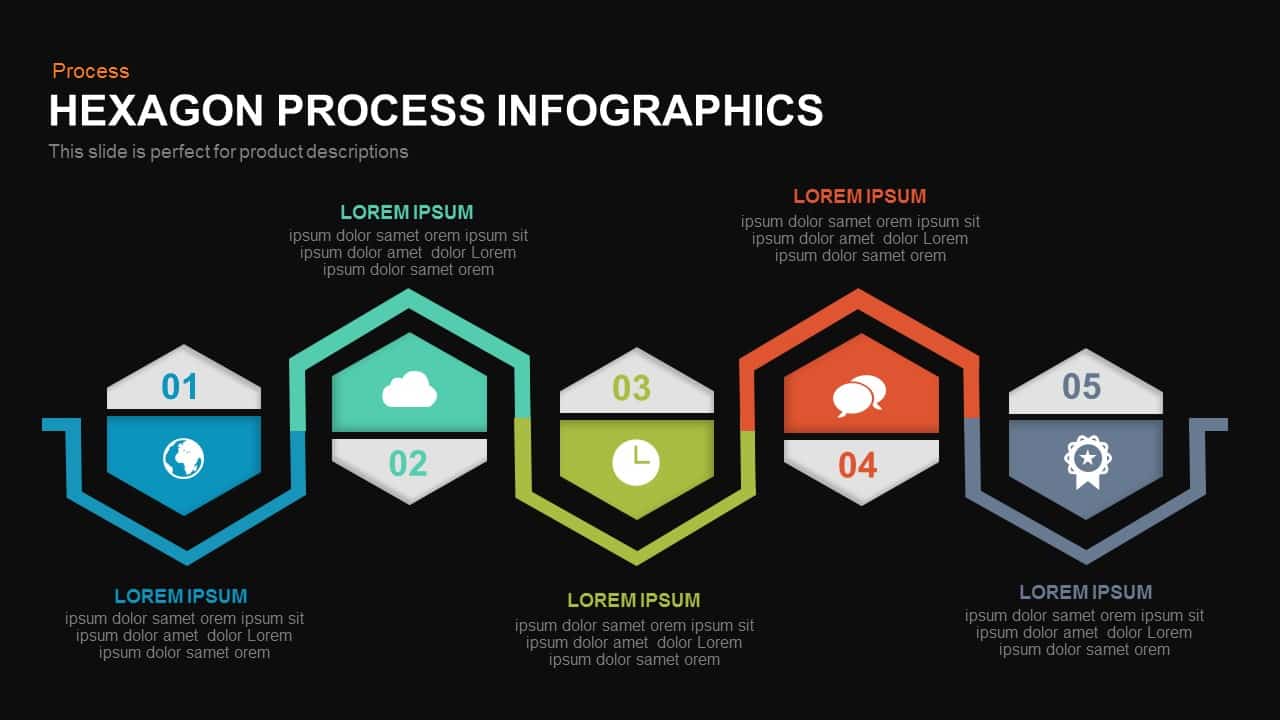
Five-Stage Hexagon Process Infographics template for PowerPoint & Google Slides
Process
Five-Stage Pyramid Infographics Diagram Template for PowerPoint & Google Slides
Pyramid
Five-Stage Pyramid Infographics Process Template for PowerPoint & Google Slides
Pyramid
Six Double Diamond Infographic Slides Template for PowerPoint & Google Slides
Process
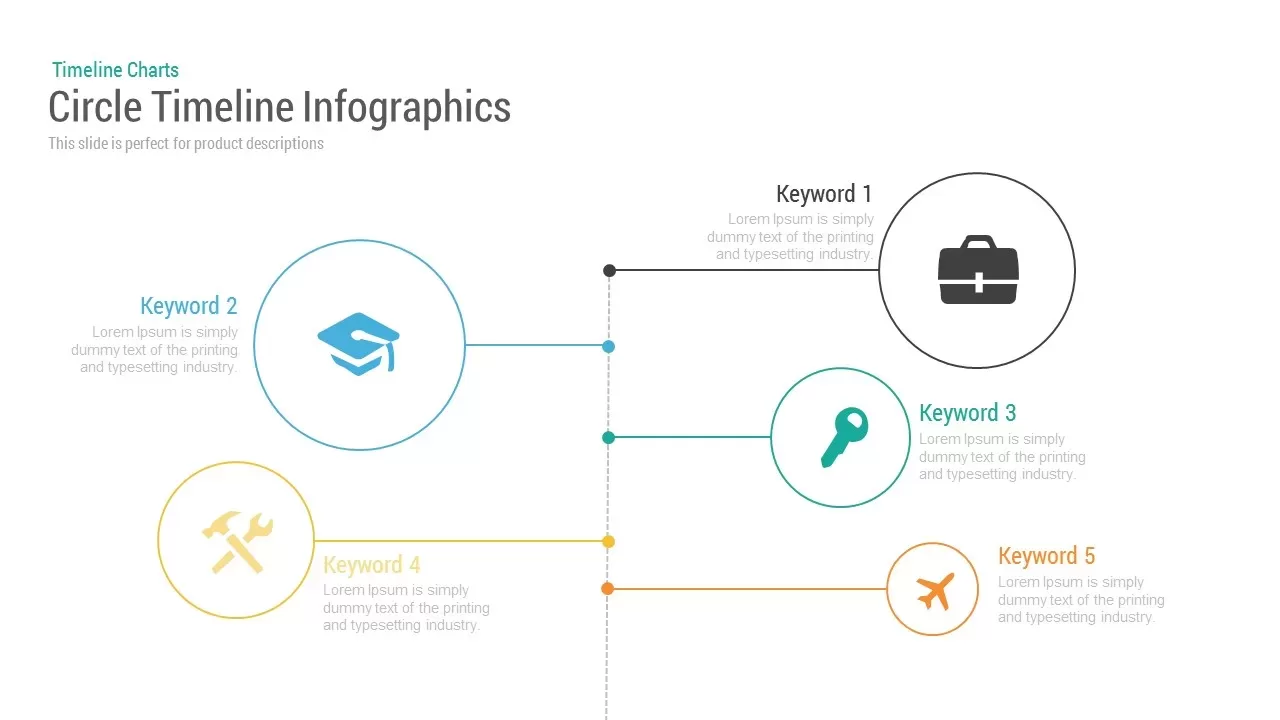
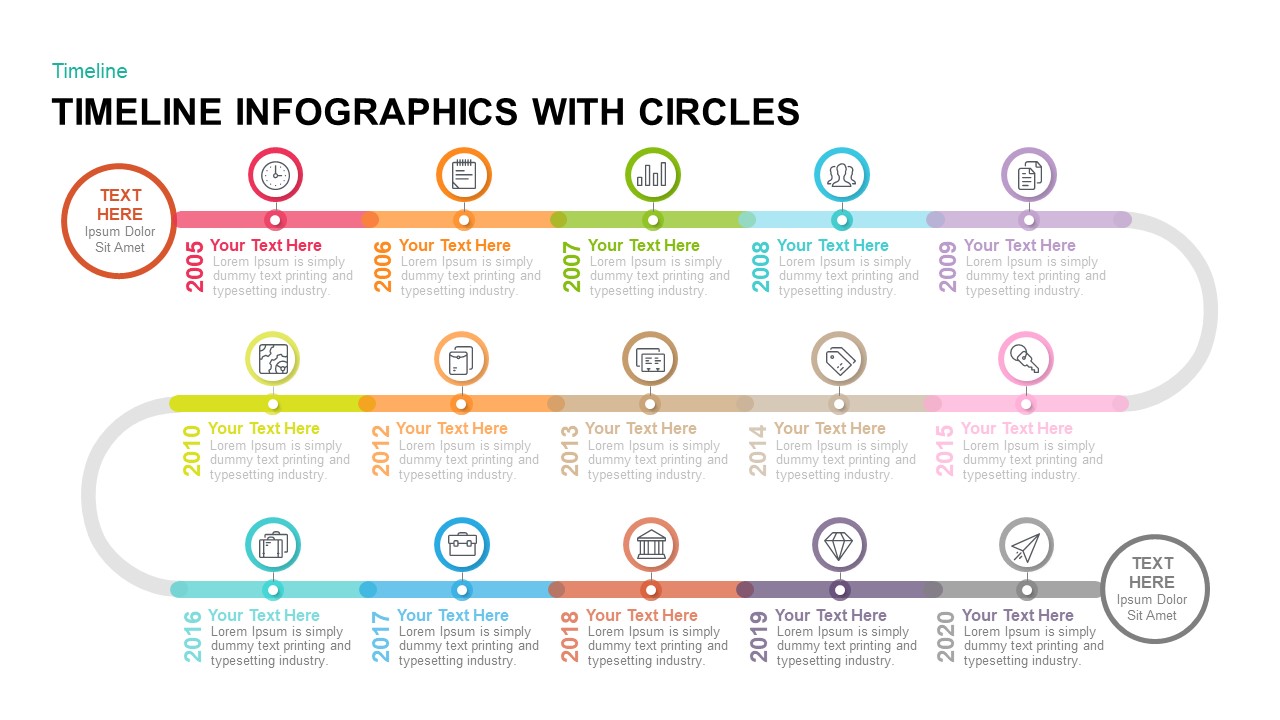
Circle Timeline Infographics template for PowerPoint & Google Slides
Timeline

Dynamic Circle Timeline Infographics template for PowerPoint & Google Slides
Timeline
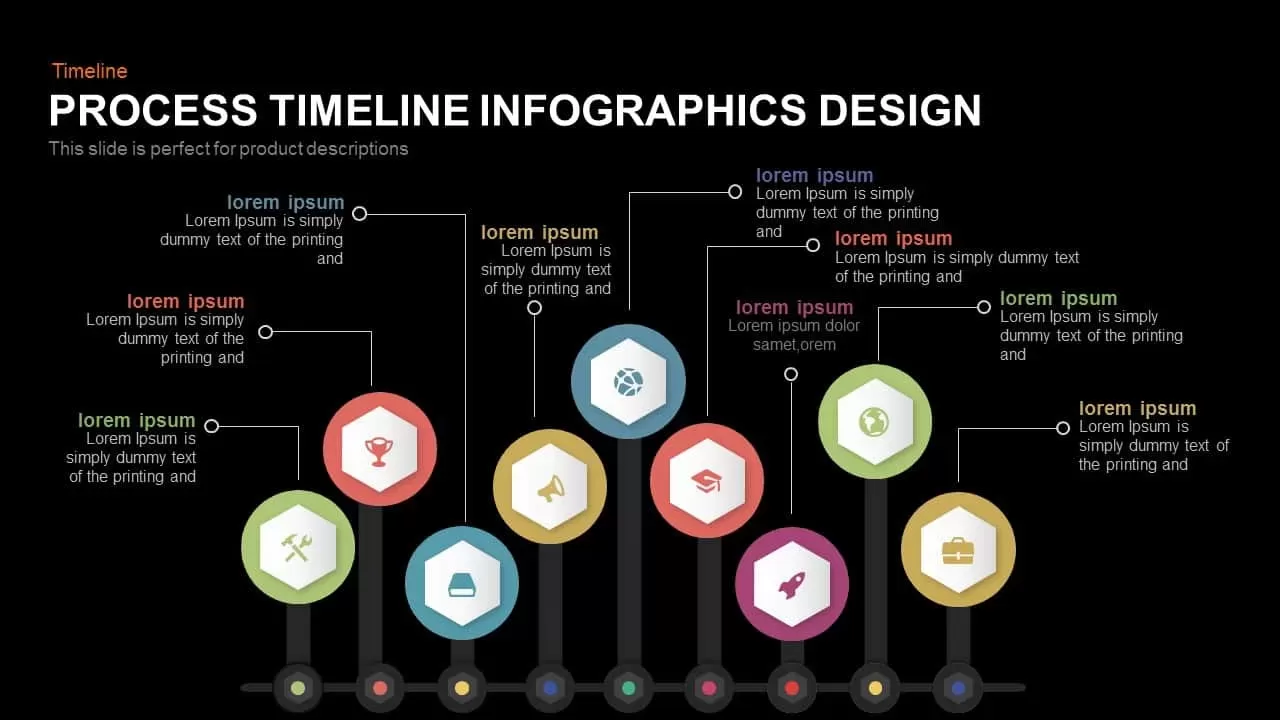
Process Timeline Infographics Design template for PowerPoint & Google Slides
Timeline
Timeline Arrow Infographics Diagram Template for PowerPoint & Google Slides
Timeline
Circular Timeline Infographics Template for PowerPoint & Google Slides
Timeline
Wavy Ribbon Timeline Infographics Template for PowerPoint & Google Slides
Timeline
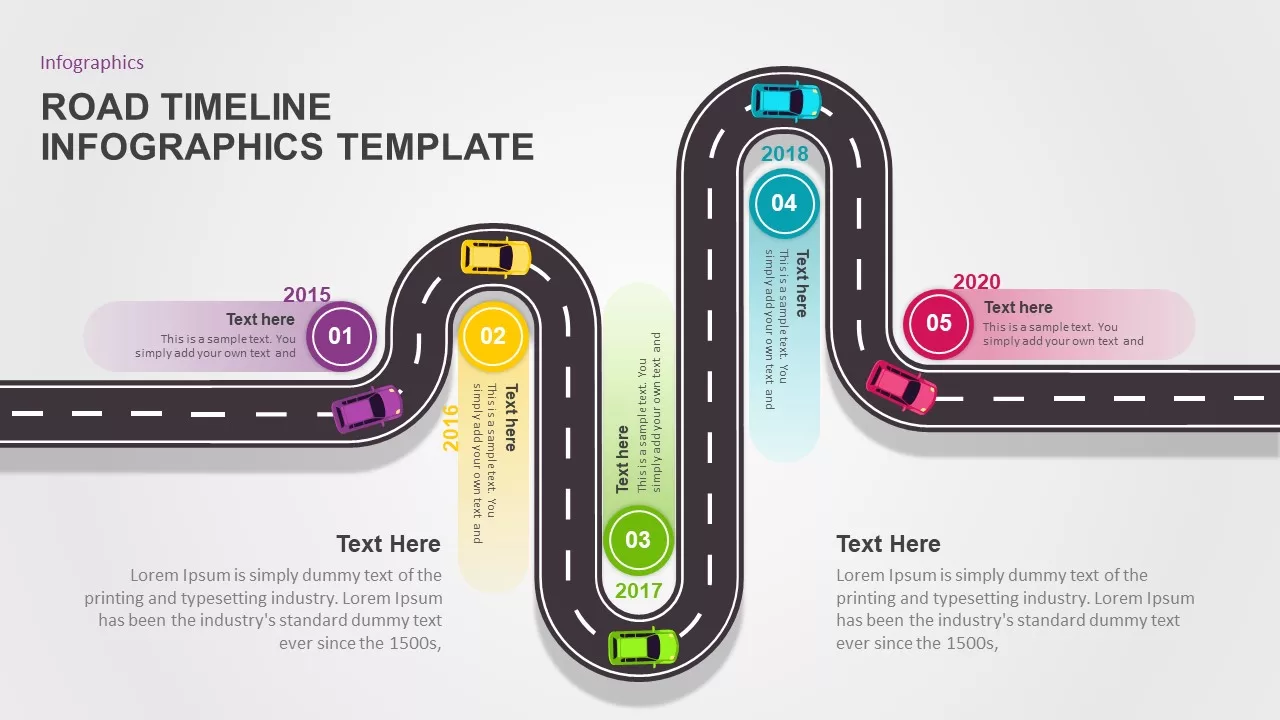
Road Timeline Infographics Template for PowerPoint & Google Slides
Timeline
Animated Timeline Infographics template for PowerPoint & Google Slides
Timeline
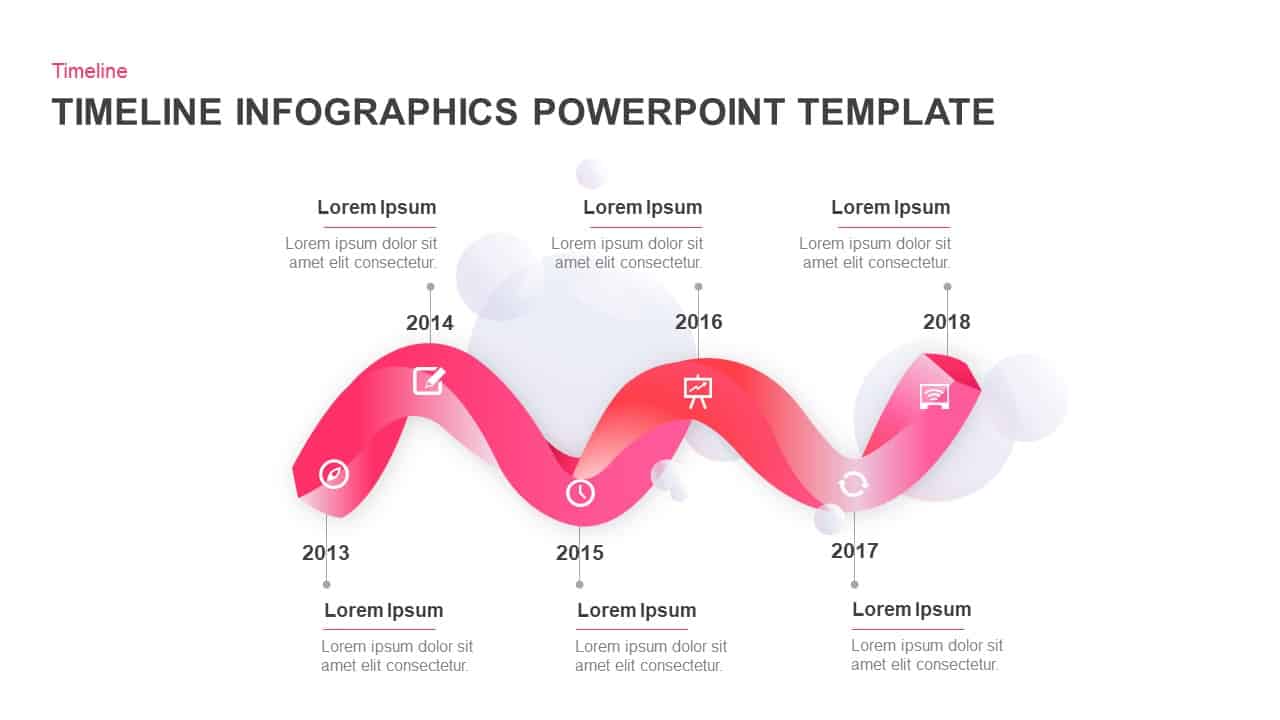
Timeline Infographics template for PowerPoint & Google Slides
Timeline
Hiring Process Timeline Infographics Template for PowerPoint & Google Slides
Recruitment

Free Colorful Timeline Infographics Template for PowerPoint & Google Slides
Timeline
Free
Timeline Infographics for PowerPoint & Google Slides
Timeline
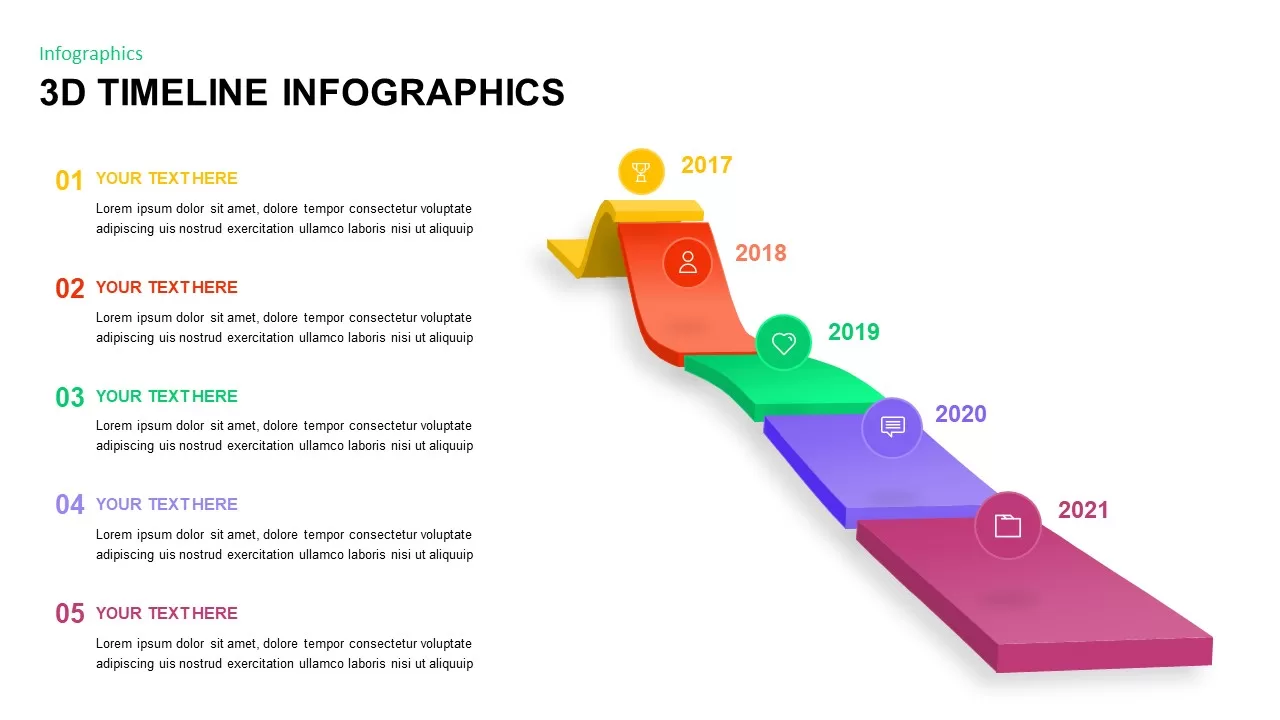
3D Timeline Infographics for PowerPoint & Google Slides
Project Status
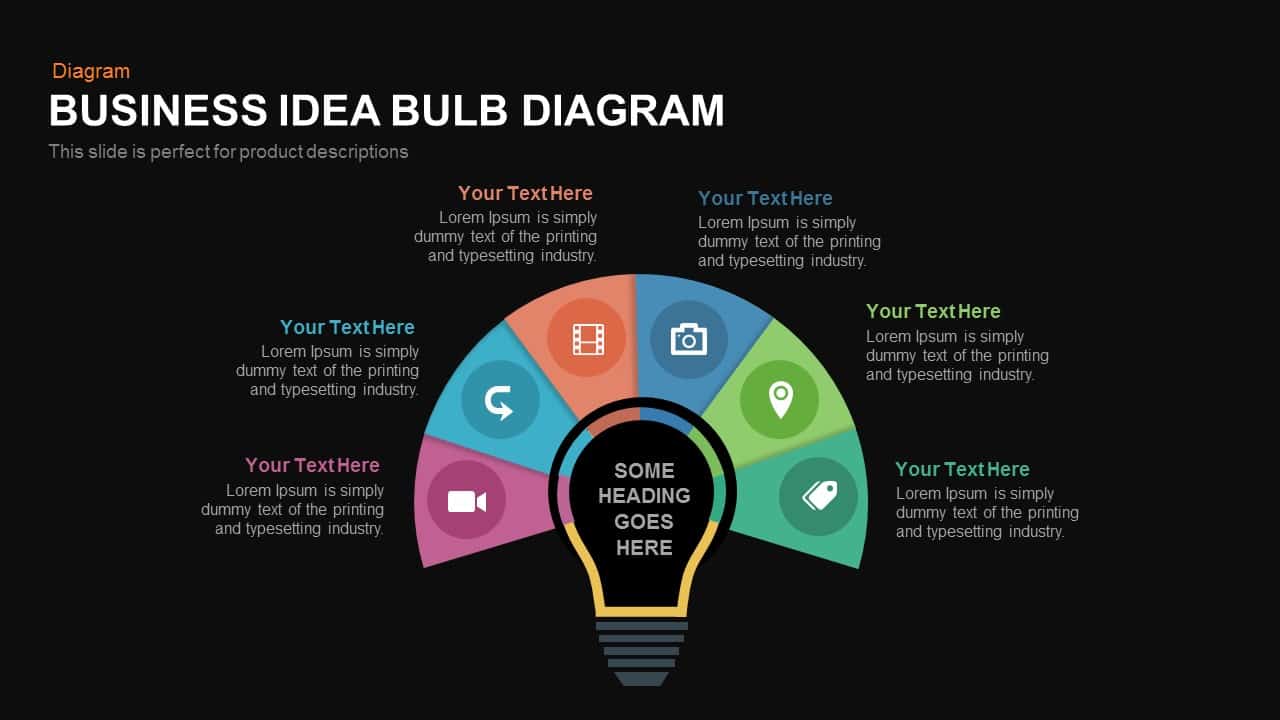
Six-Part Business Idea Bulb Diagram Template for PowerPoint & Google Slides
Circular
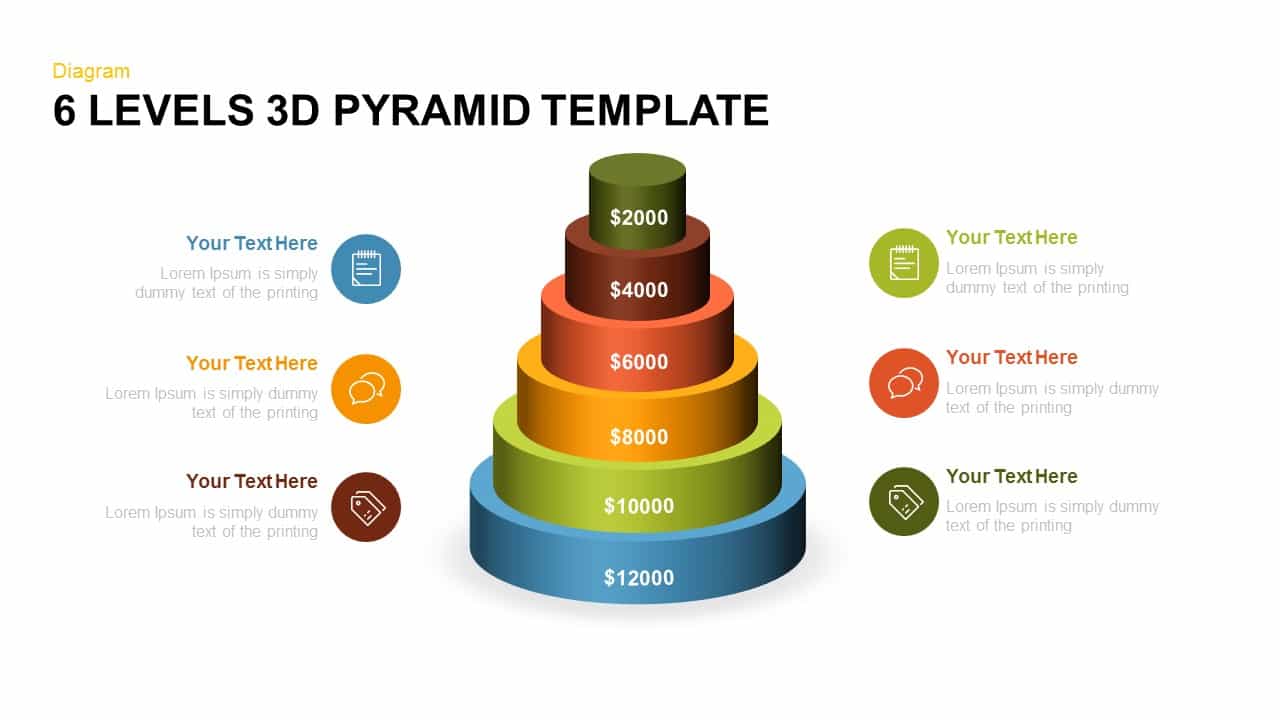
Editable Six-Level 3D Pyramid Diagram Template for PowerPoint & Google Slides
Pyramid

Six-Process Circular Arrow Diagram Template for PowerPoint & Google Slides
Circular
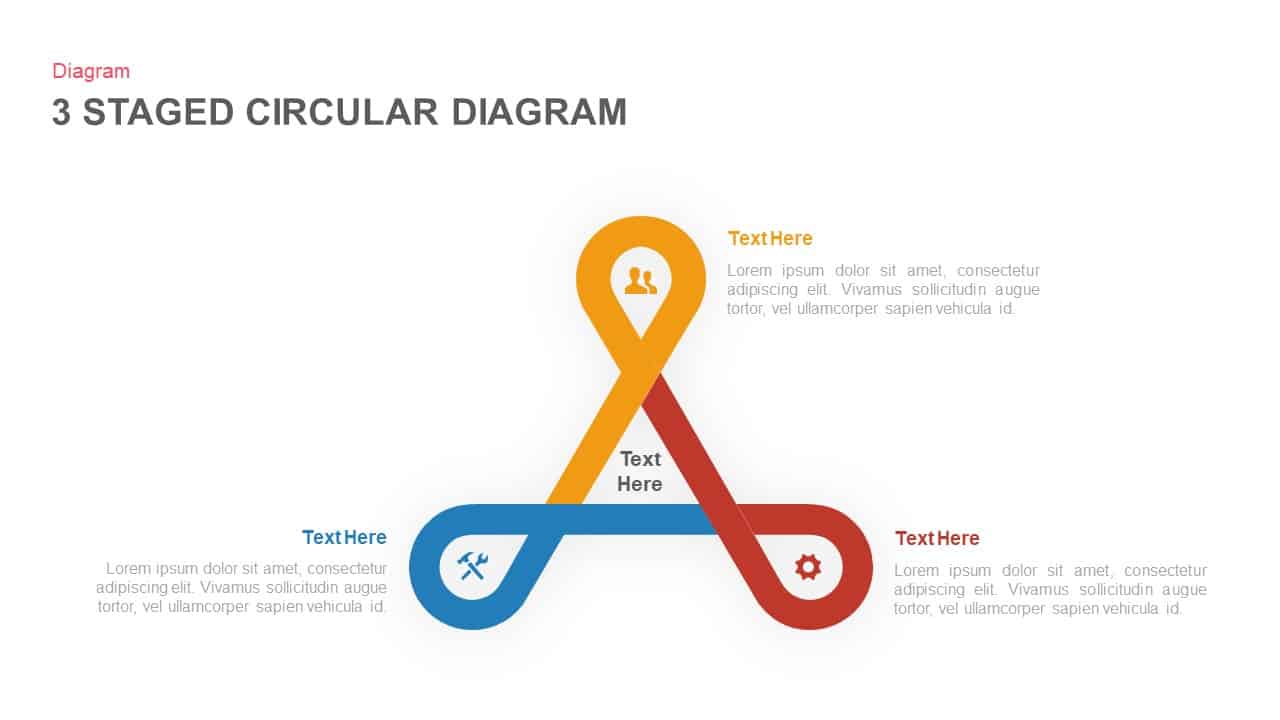
Three to Six Staged Circular Diagram Template for PowerPoint & Google Slides
Process
Six Thinking Hats Template for PowerPoint & Google Slides
Business Strategy
Six-Slide Animated Accordion Pack Template for PowerPoint & Google Slides
Business
Six-Day Weekly Planner Layout Template for PowerPoint & Google Slides
Infographics
Free Hexagonal Six-Step Business Strategy Template for PowerPoint & Google Slides
Process
Free
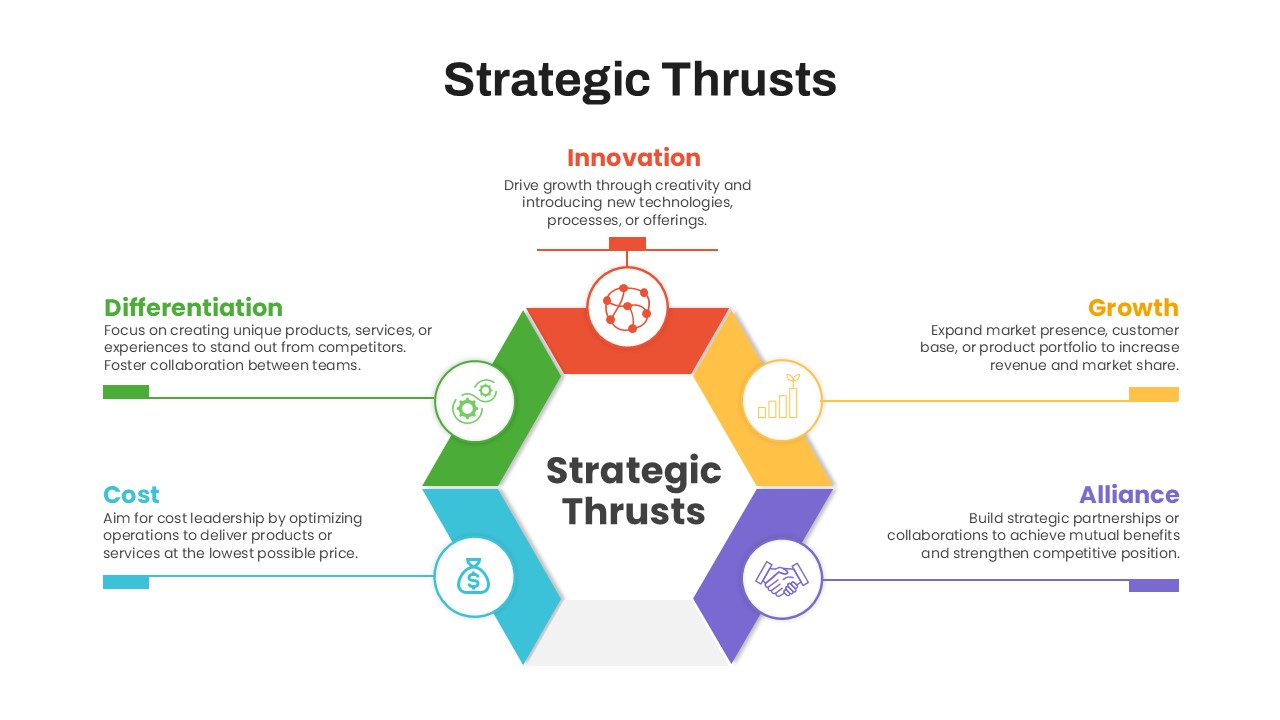
Six-Step Strategic Thrusts Diagram Slide Template for PowerPoint & Google Slides
Process
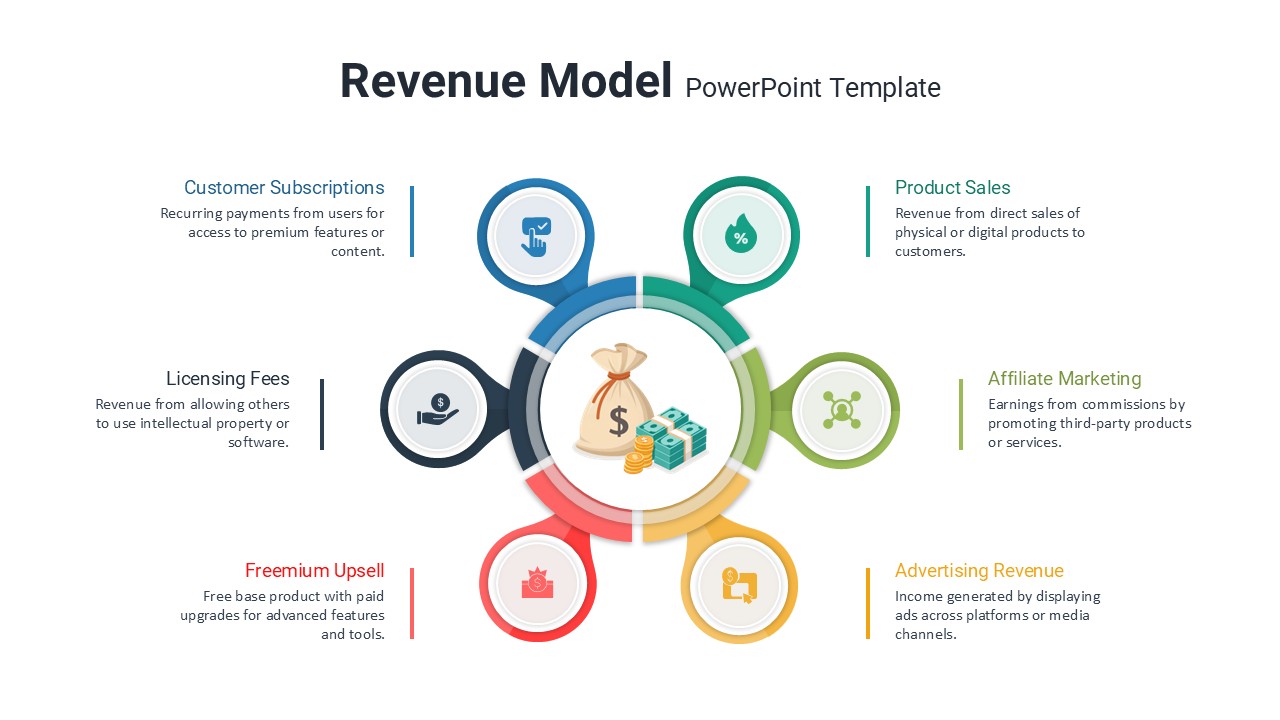
Six Revenue Stream Model Infographic Template for PowerPoint & Google Slides
Circular