SCORE Model Pentagon Assessment Diagram Template for PowerPoint & Google Slides


Description
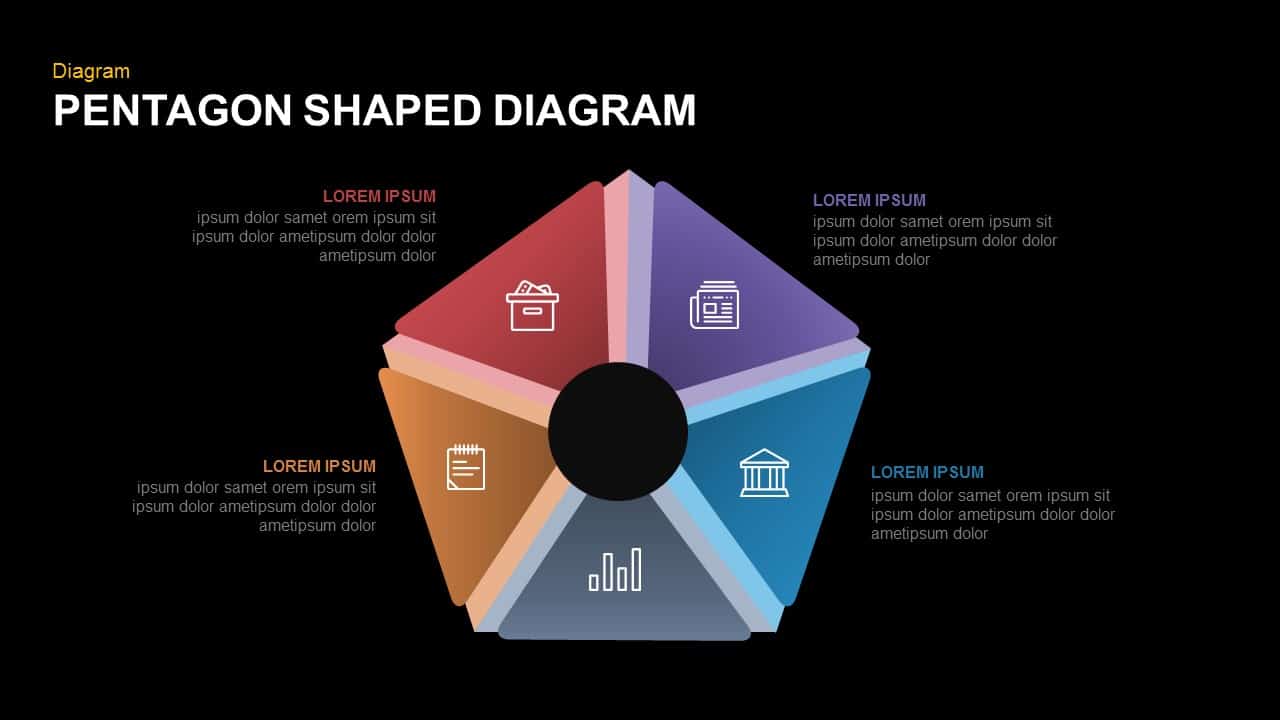
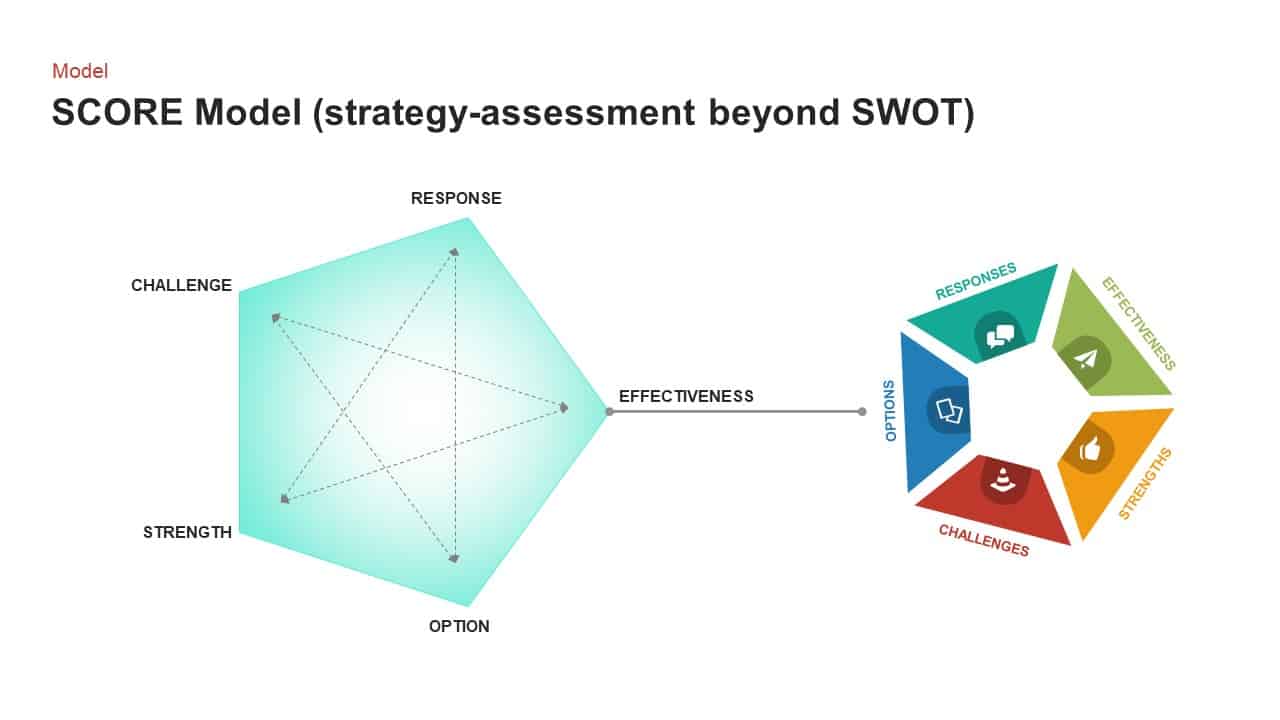
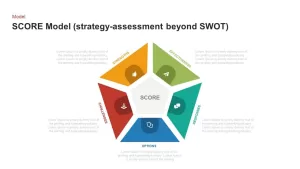
Leverage this SCORE Model pentagon diagram to perform a comprehensive strategy assessment beyond a traditional SWOT analysis. The slide features a central hub labeled “SCORE” surrounded by five vividly color-coded segments—Strengths, Challenges, Options, Responses, and Effectiveness—each rendered as a bold pentagon slice against a dark backdrop. Icons within each slice enhance visual recognition, while subtle leader lines connect to text placeholders for detailed insights or action items. The high-contrast palette and minimal flat shading ensure clarity in live presentations or printed reports, directing audience focus to the critical dimensions of strategic evaluation.
Crafted with fully editable vector shapes and master slide layouts, this template empowers you to tailor every element in seconds. Customize segment labels, swap icons, or apply your brand’s color palette by simply selecting each shape. Adjust the central hub text to reflect alternative acronyms or bespoke methodologies, resize the pentagon to emphasize priority areas, or animate individual slices to reveal phases sequentially. Duplicate and compare multiple SCORE diagrams side-by-side, embed charts to correlate metrics with each strategic dimension, or overlay progress indicators to illustrate milestone achievements. With seamless compatibility between PowerPoint and Google Slides, your formatting, animations, and vector fidelity remain intact across platforms, enabling consistent, data-driven storytelling.
Who is it for
Strategy consultants, business analysts, and executive leadership teams will find this SCORE Model slide invaluable for structuring strategic reviews, stakeholder workshops, and planning sessions. Marketing managers, project sponsors, and enterprise risk officers can also leverage its clear five-part framework to align priorities and drive informed decision-making.
Other Uses
Beyond strategic audits, repurpose this pentagon layout to map product feature evaluations, decision-making criteria, or departmental performance metrics. Use it as a comparative tool to visualize before-and-after scenarios, risk-response frameworks, or customized maturity models in any corporate, academic, or nonprofit context.
Login to download this file

Item ID
SB00976
Related Templates

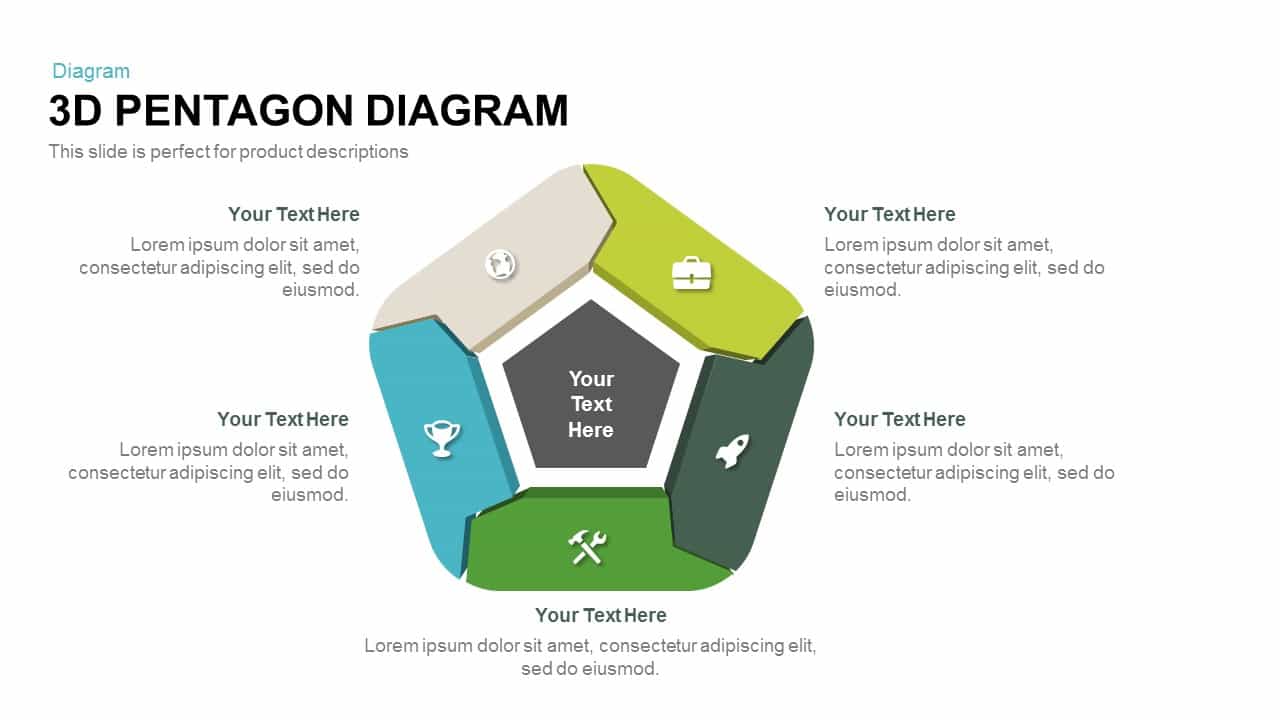
3D Pentagon Diagram template for PowerPoint & Google Slides
Process
Five-Part Pentagon Shaped Diagram Template for PowerPoint & Google Slides
Process
Five-Stage Pentagon Arrow Diagram Template for PowerPoint & Google Slides
Arrow
Pentagon Arrow Process Diagram Template for PowerPoint & Google Slides
Process
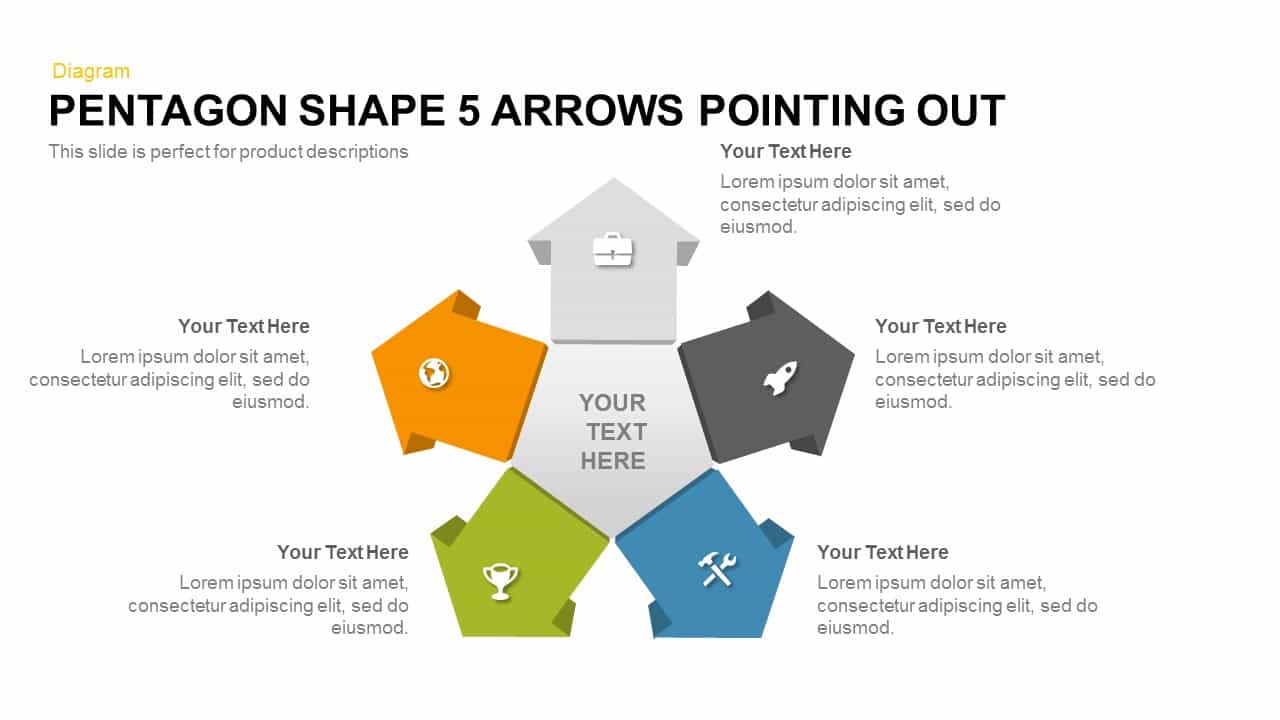
Pentagon Shape 5 Arrows Pointing Out template for PowerPoint & Google Slides
Arrow
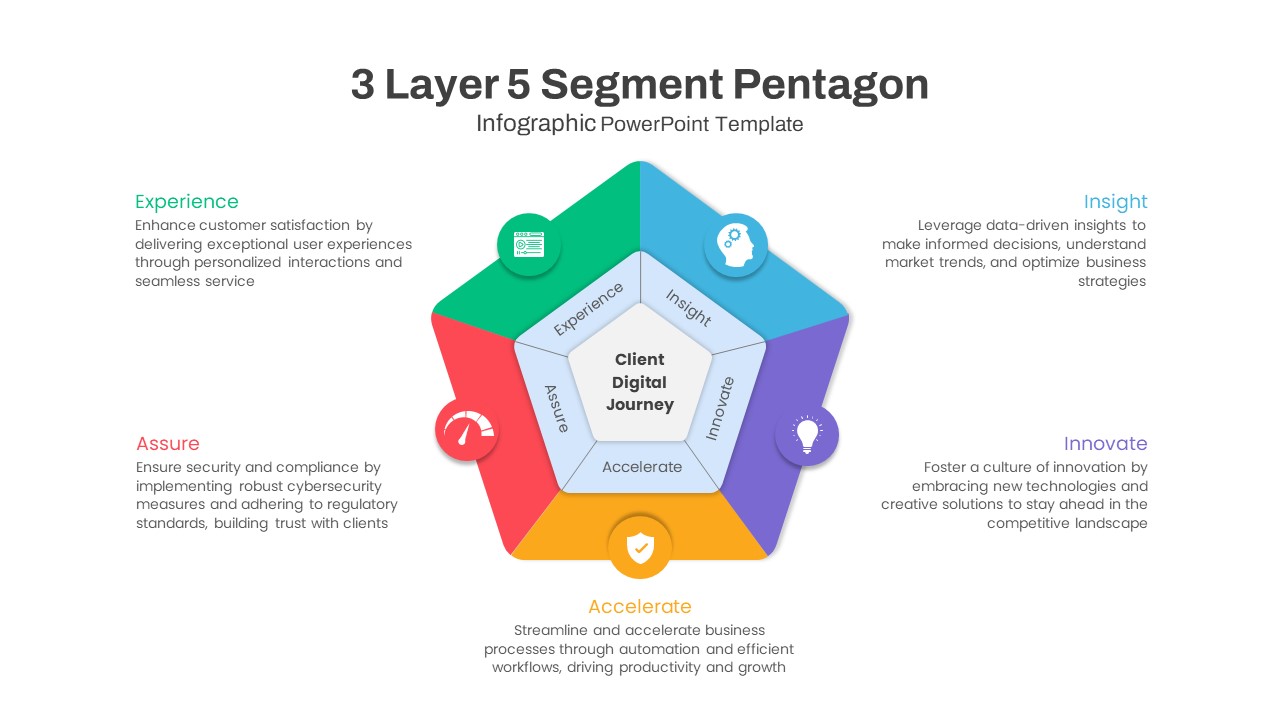
Five-Segment Pentagon Digital Journey Template for PowerPoint & Google Slides
Process
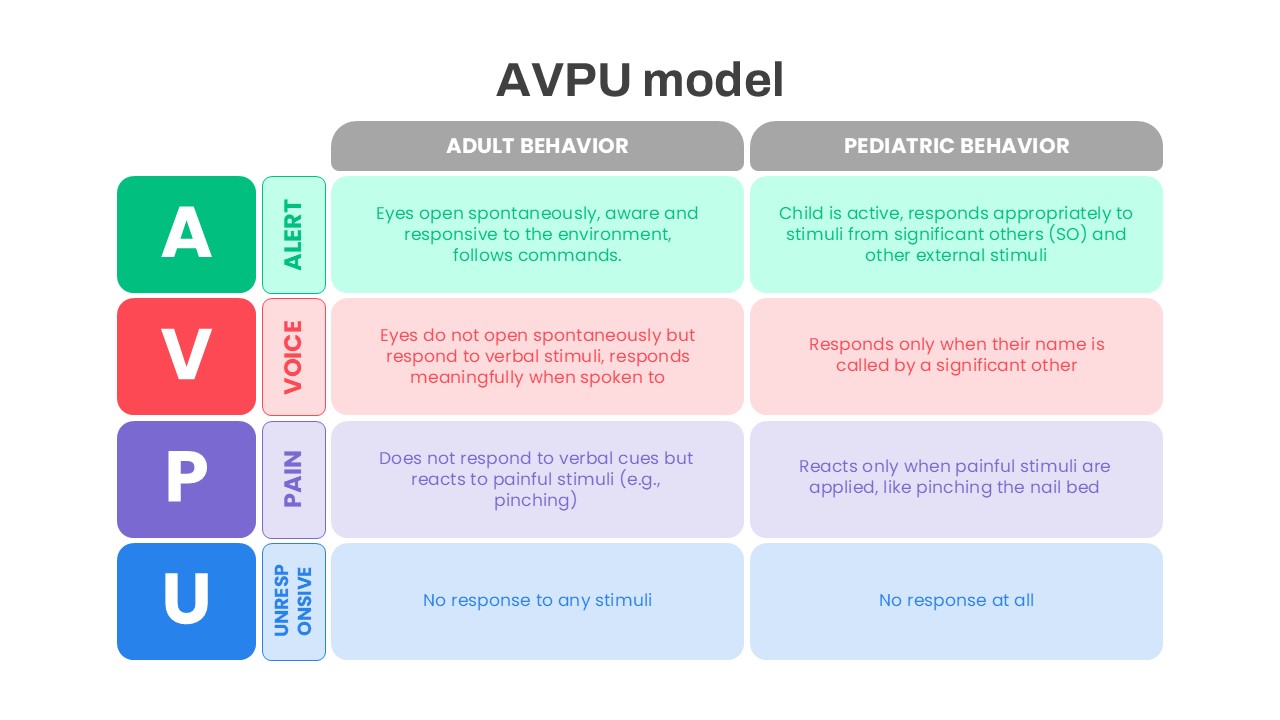
AVPU Model Behavior Assessment Template for PowerPoint & Google Slides
Health

Net Promoter Score Dashboard Template for PowerPoint & Google Slides
Customer Experience
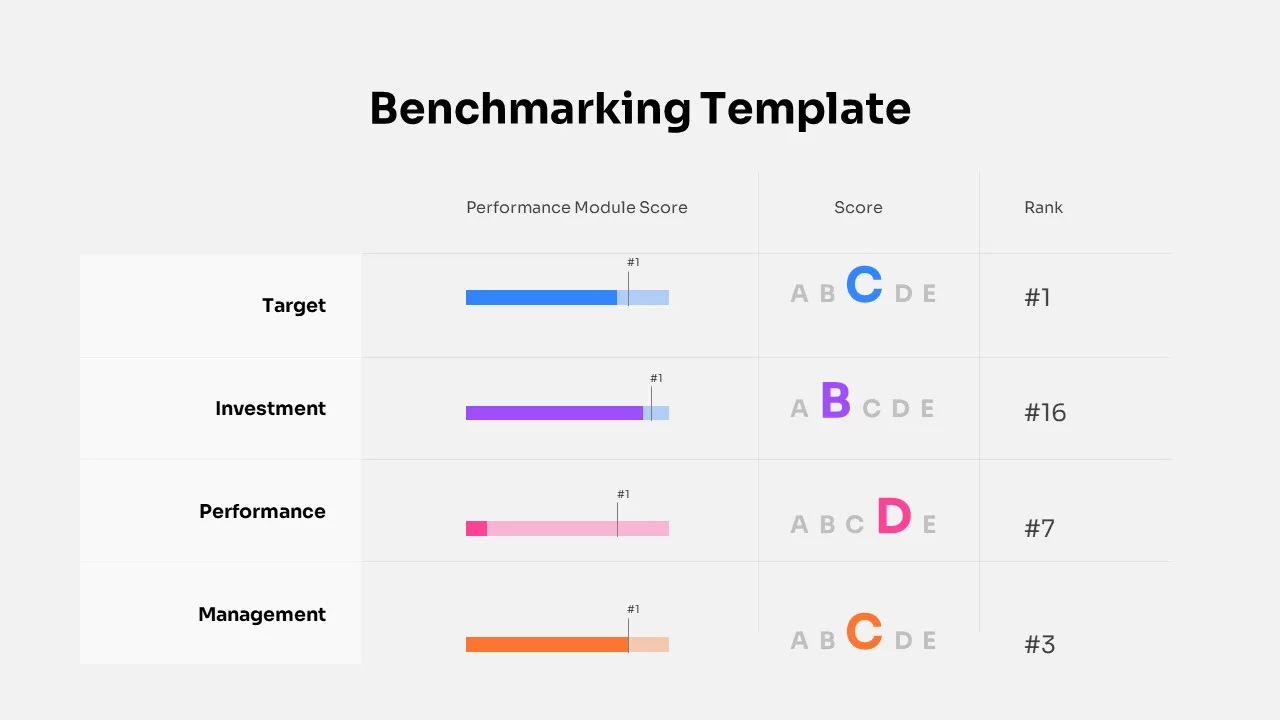
Benchmarking Performance Score Template for PowerPoint & Google Slides
Comparison Chart
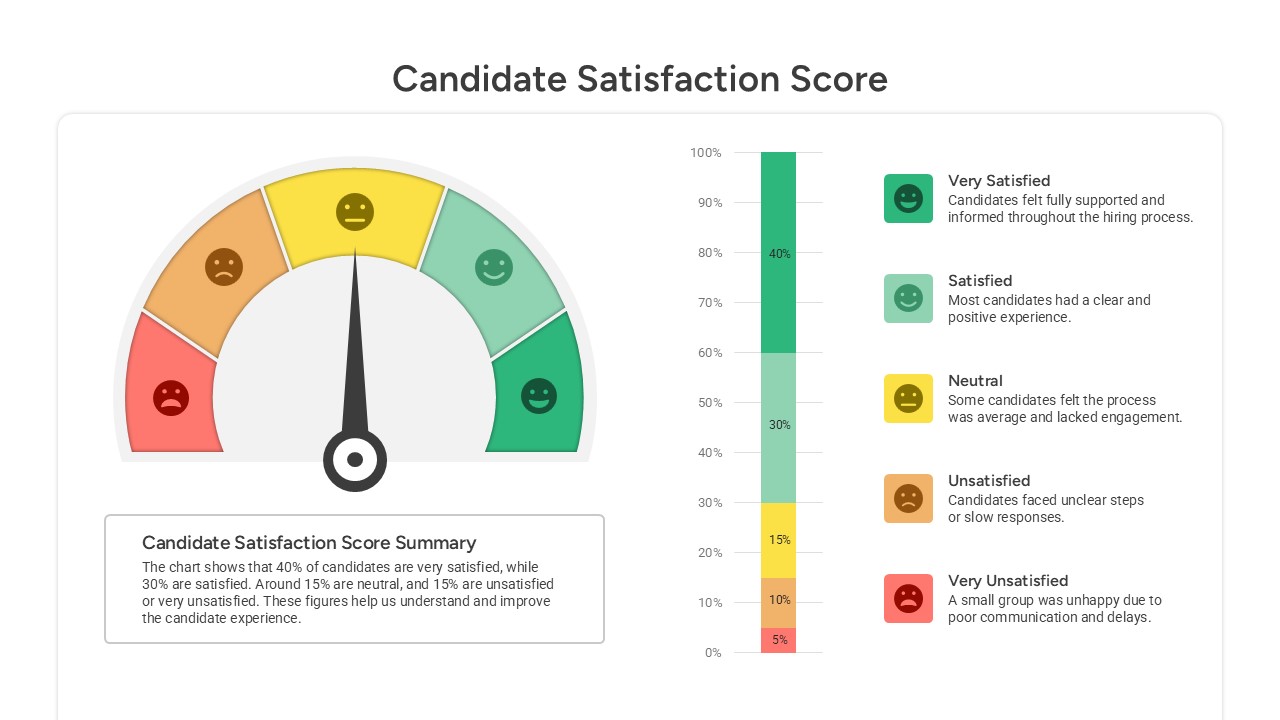
Candidate Satisfaction Score template for PowerPoint & Google Slides
Business
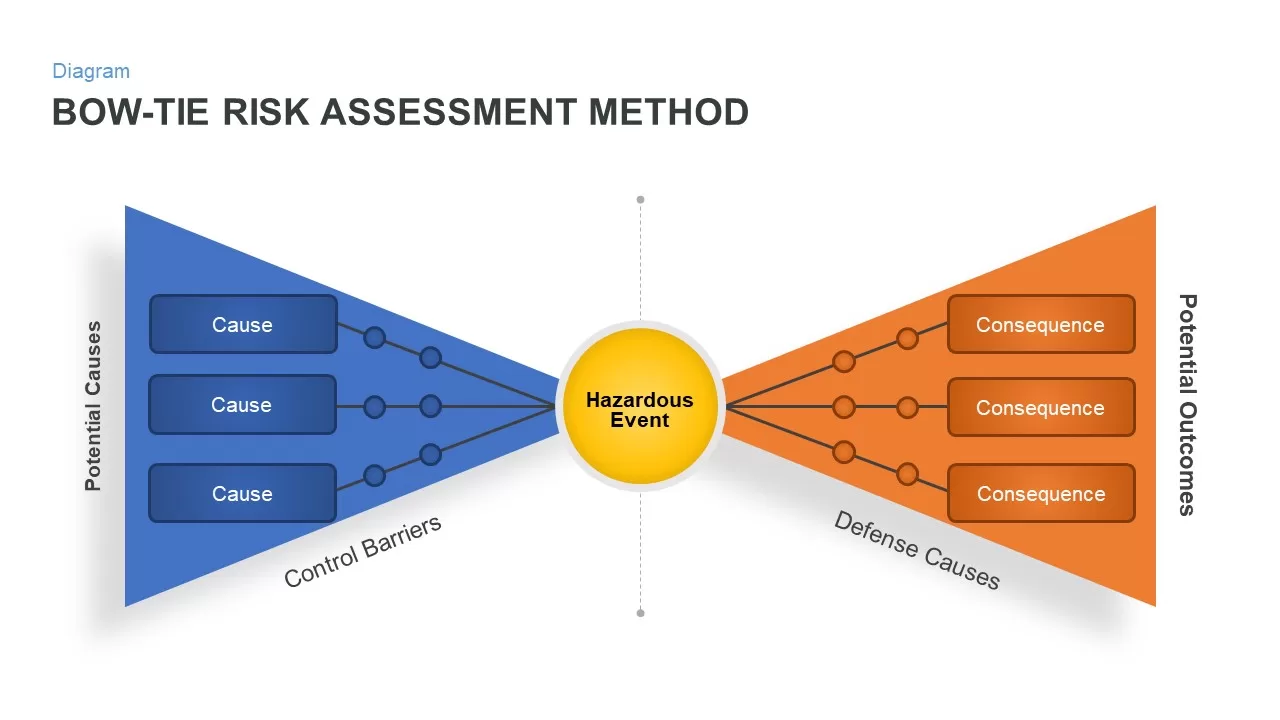
Bow-Tie Risk Assessment Diagram Template for PowerPoint & Google Slides
Risk Management
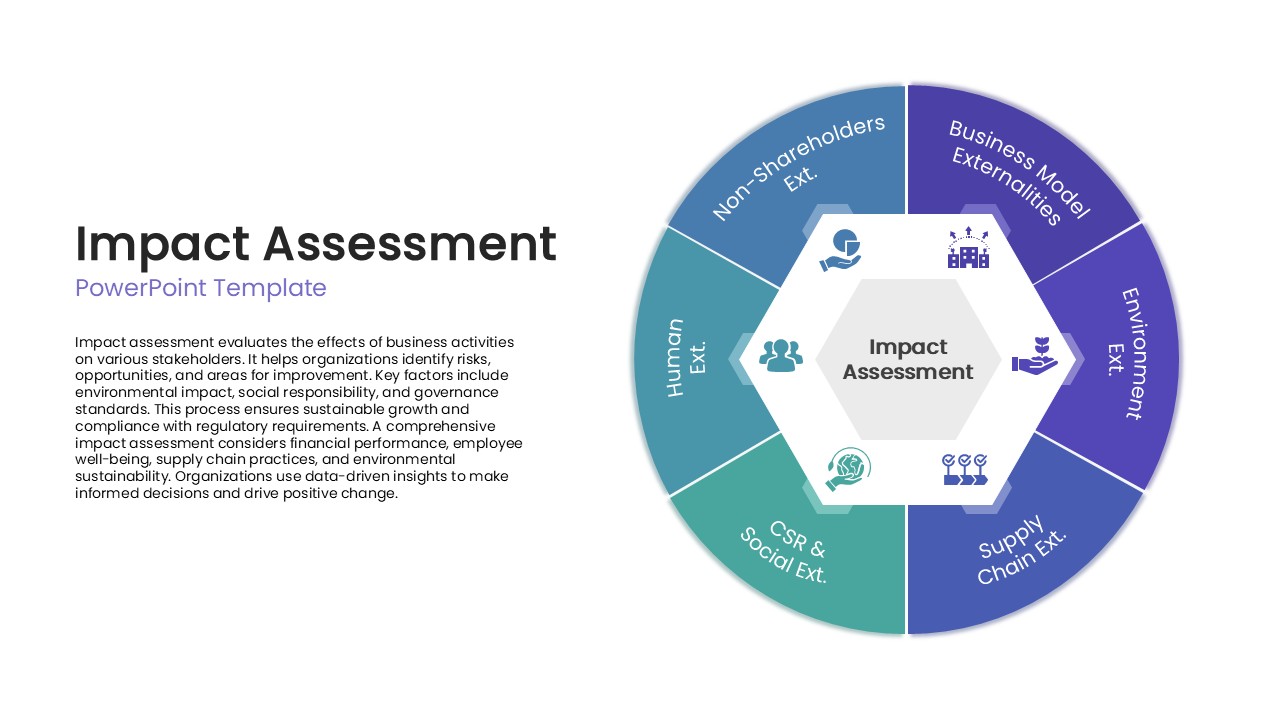
Impact Assessment Circular Diagram Template for PowerPoint & Google Slides
Circular
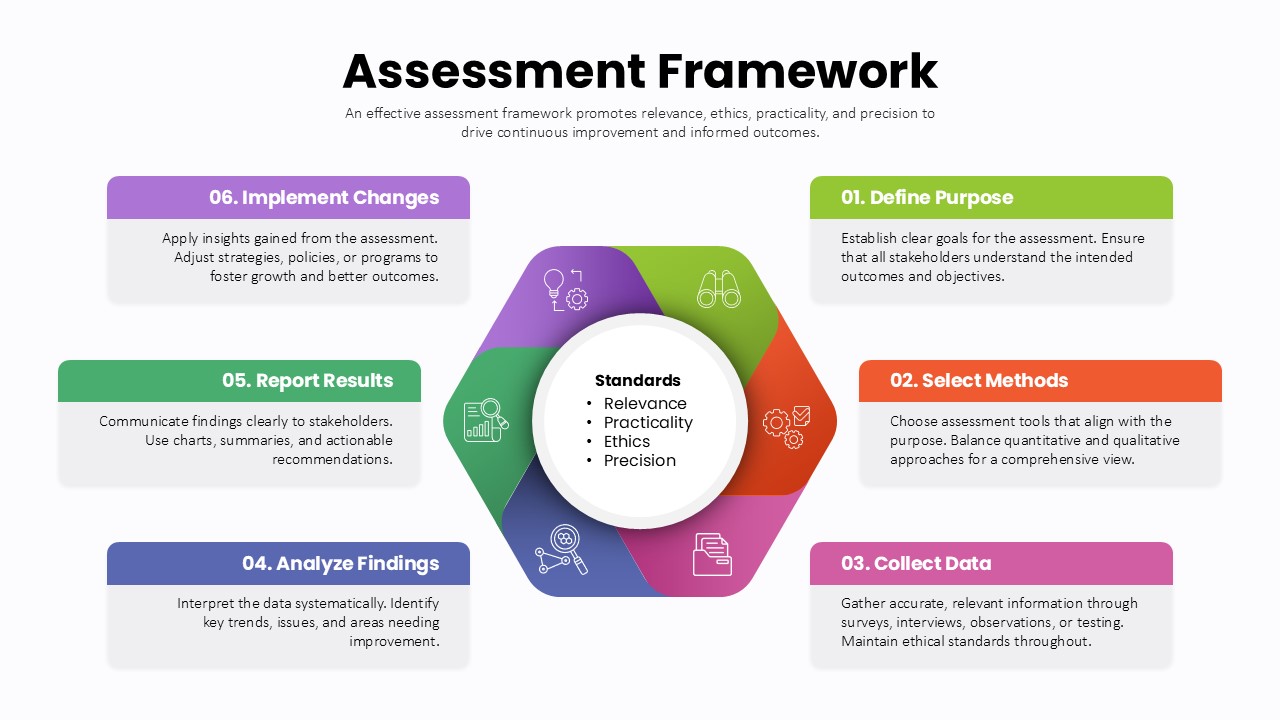
Assessment Framework Circular Diagram Template for PowerPoint & Google Slides
Circular
Materiality Assessment Matrix Diagram Template for PowerPoint & Google Slides
Risk Management
Heat Map Risk Assessment Presentation Template for PowerPoint & Google Slides
Risk Management
Risk Assessment Heatmap Matrix Slide Template for PowerPoint & Google Slides
Comparison Chart
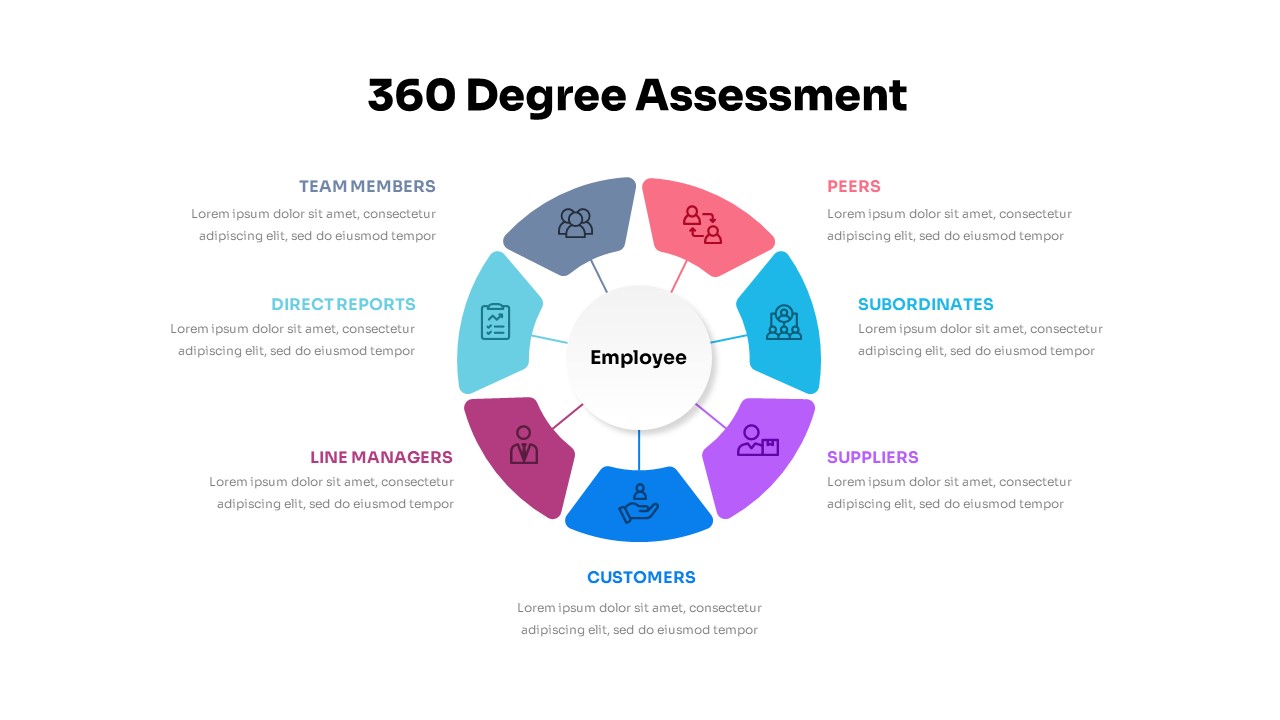
360 Degree Assessment Template for PowerPoint & Google Slides
Employee Performance
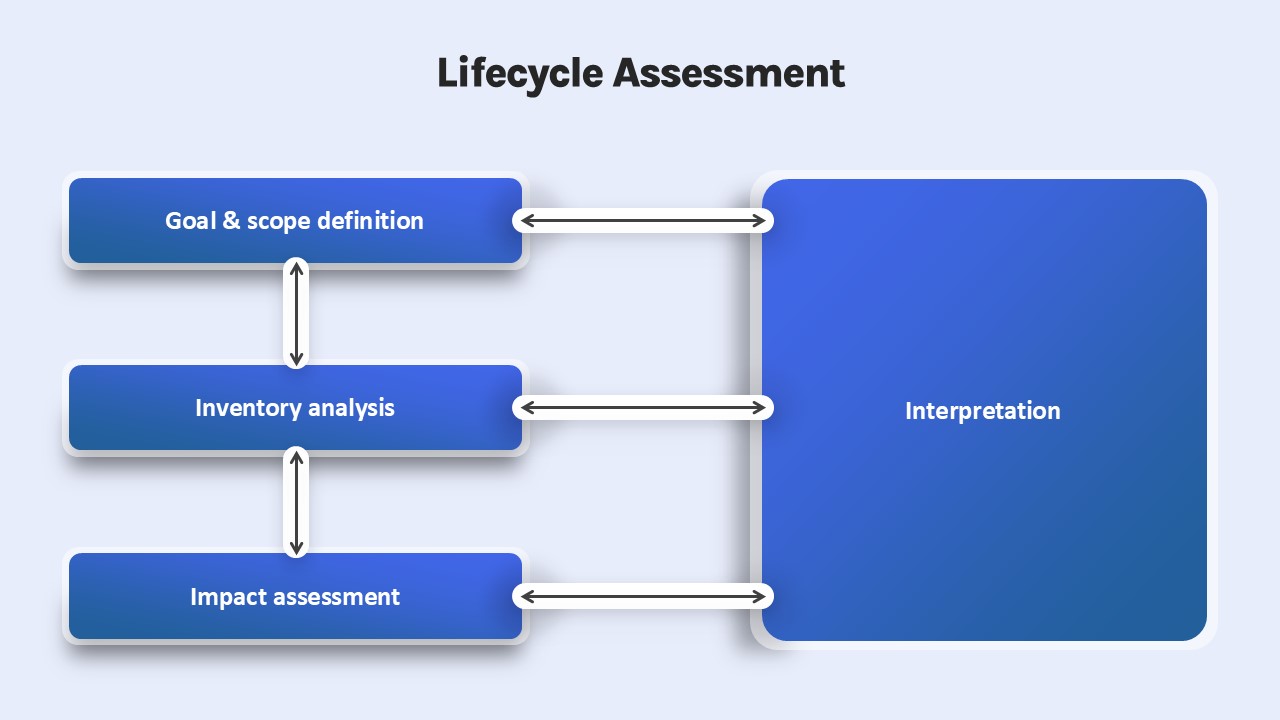
Lifecycle Assessment template for PowerPoint & Google Slides
Process
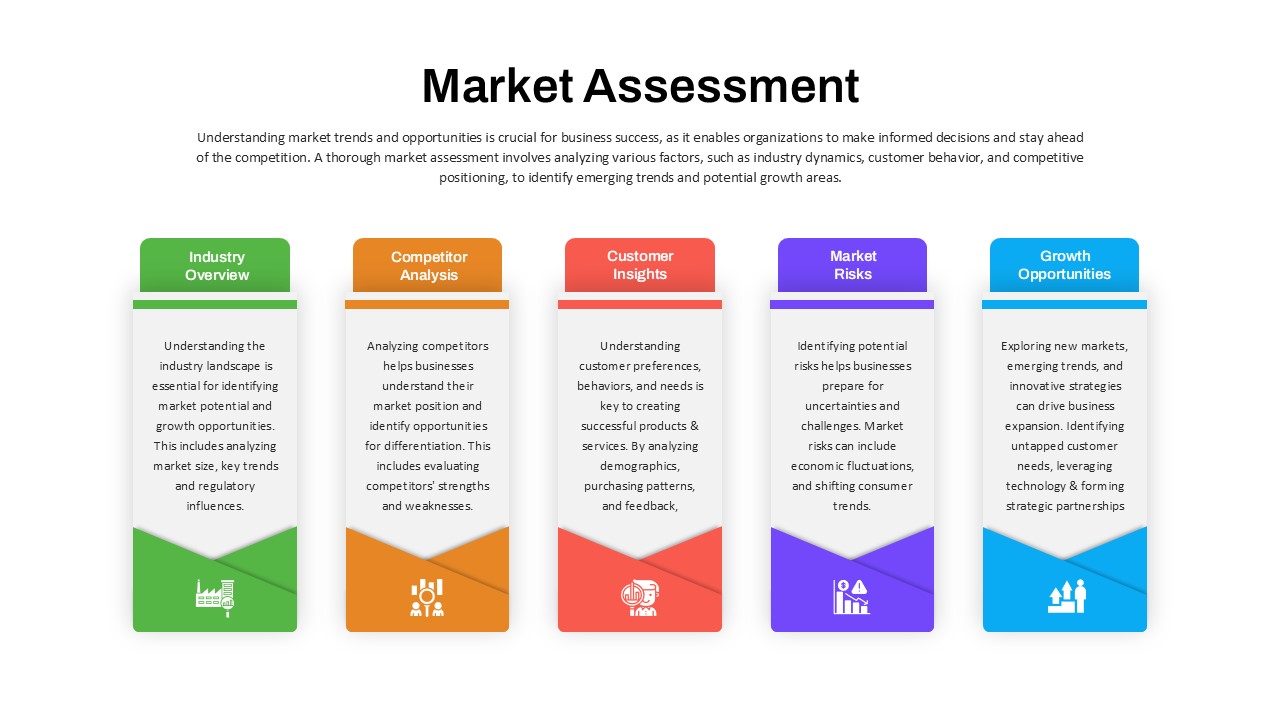
Market Assessment Infographic Slide Template for PowerPoint & Google Slides
Process
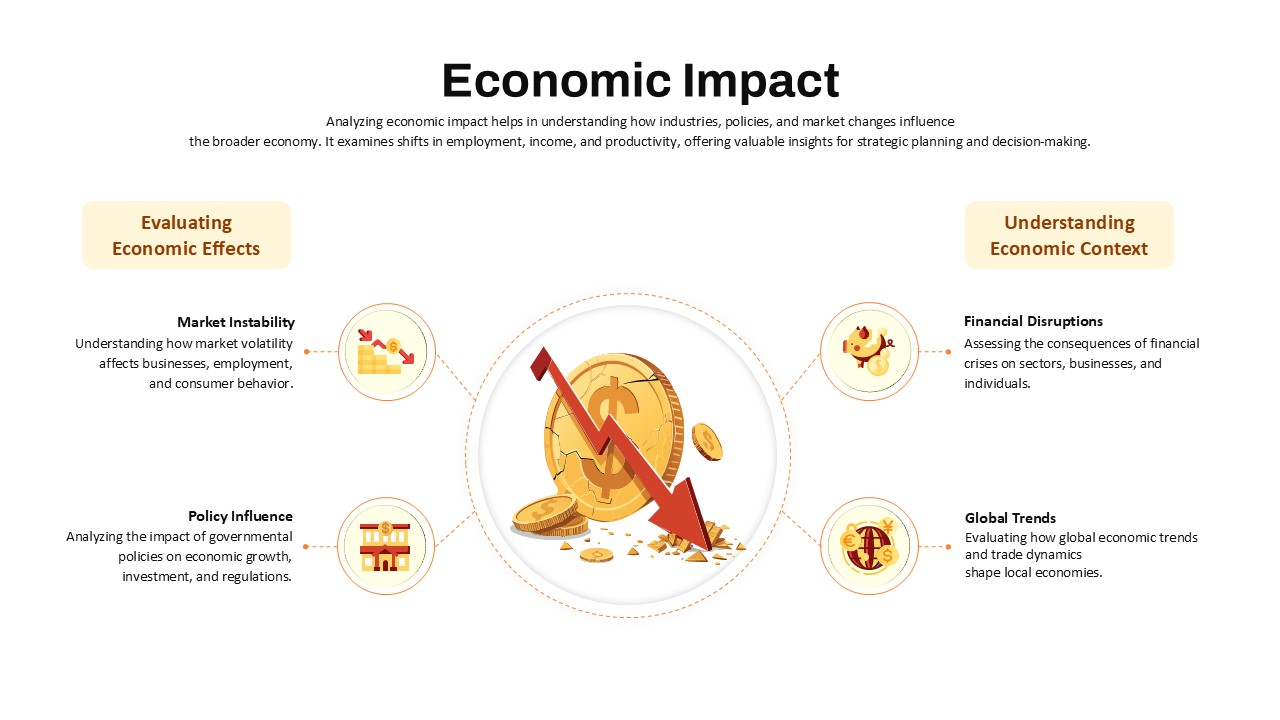
Economic Impact Assessment template for PowerPoint & Google Slides
Business Report
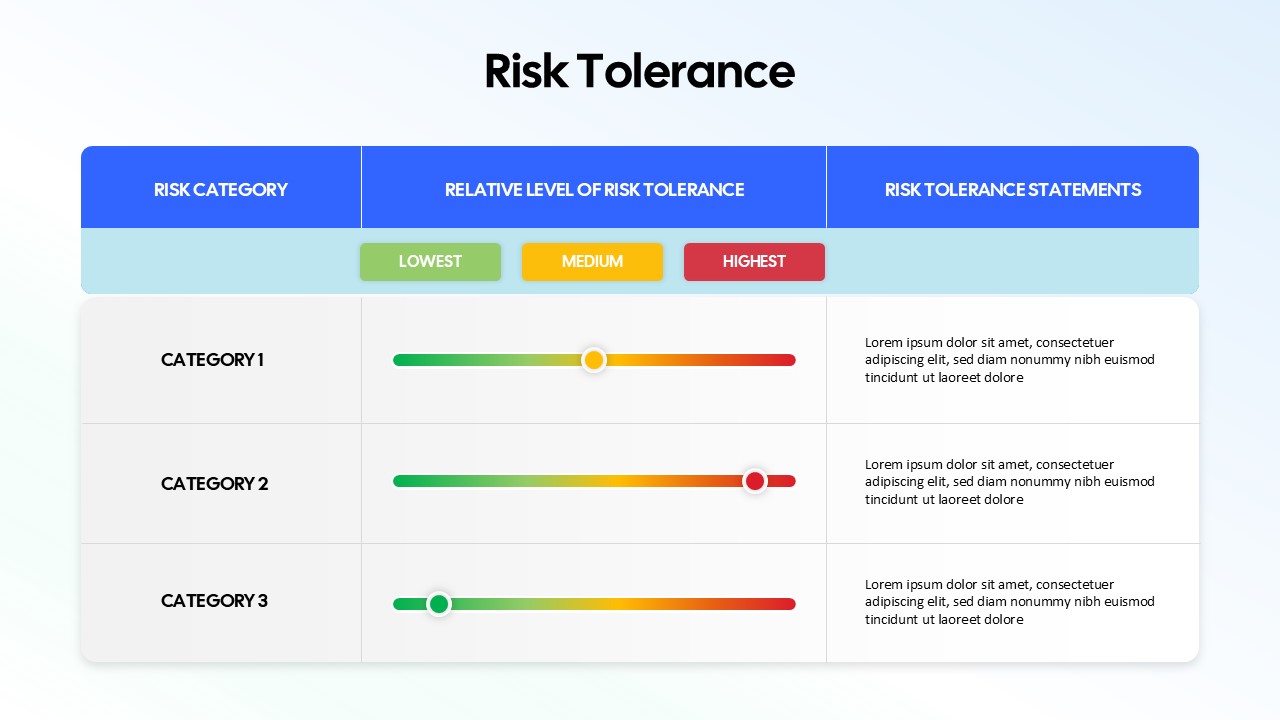
Risk Tolerance Assessment Sliders Template for PowerPoint & Google Slides
Finance
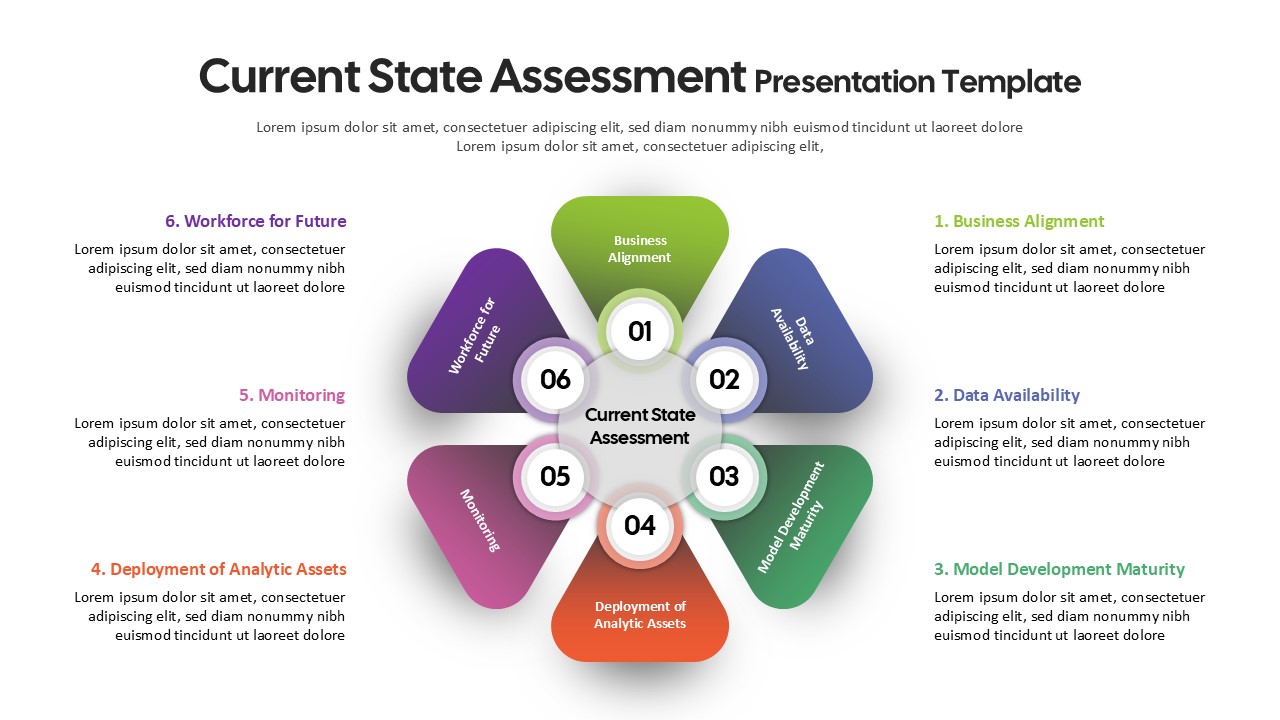
Current State Assessment Template for PowerPoint & Google Slides
Gap
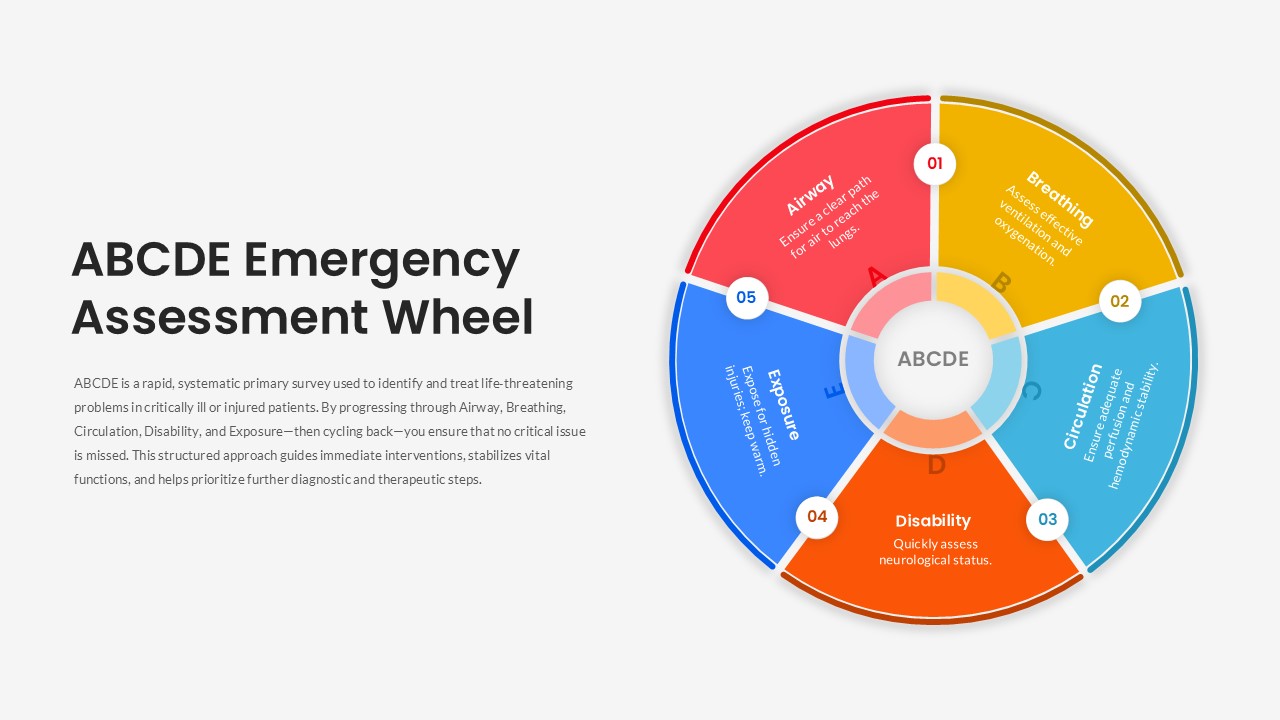
ABCDE Emergency Assessment Wheel Template for PowerPoint & Google Slides
Circular
IT Gap Analysis Assessment Matrix Template for PowerPoint & Google Slides
Information Technology
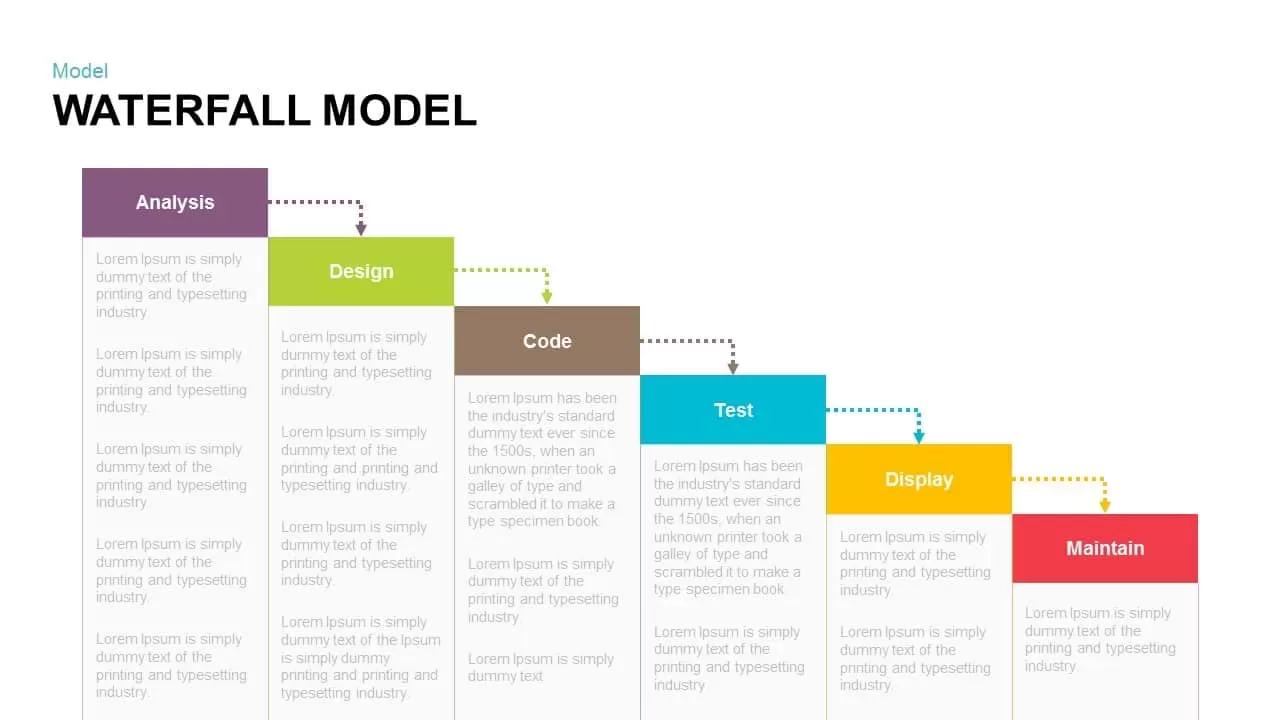
Waterfall Model Diagram Template for PowerPoint & Google Slides
Information Technology
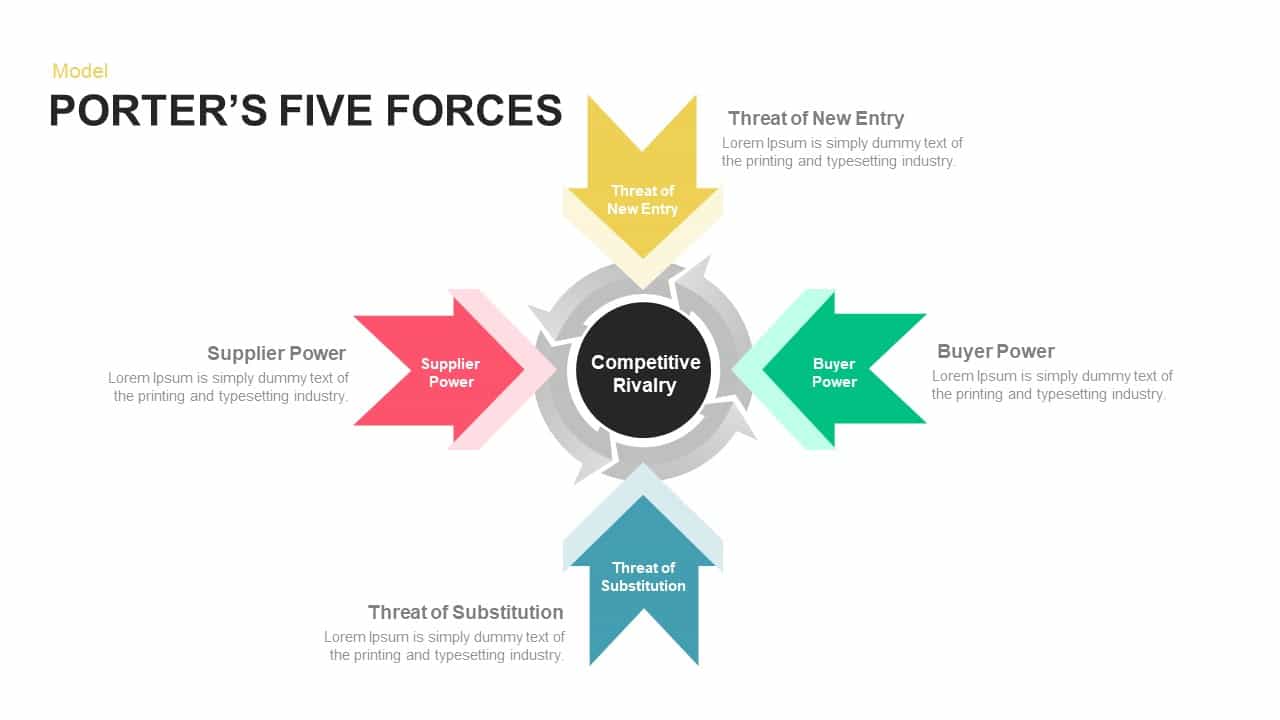
Porter’s Five Forces Model Diagram Template for PowerPoint & Google Slides
Competitor Analysis
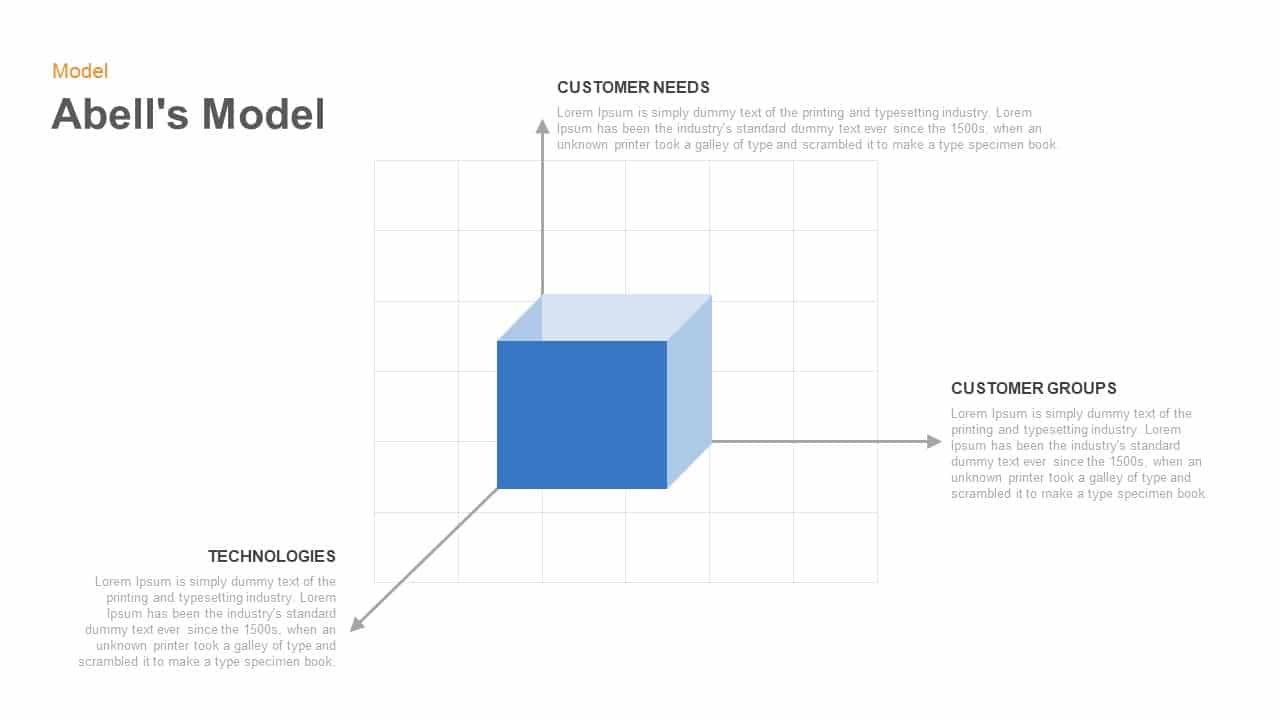
Abell’s 3D Cube Model Diagram Template for PowerPoint & Google Slides
Business Models

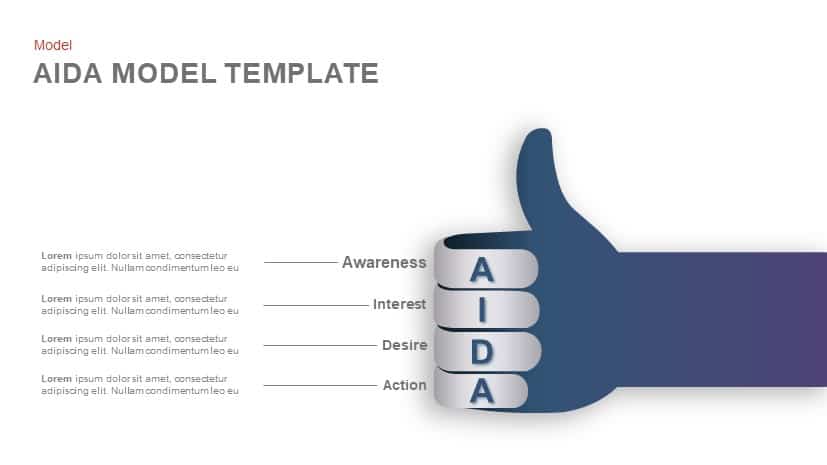
AIDA Model Funnel Thumb Diagram Template for PowerPoint & Google Slides
Process
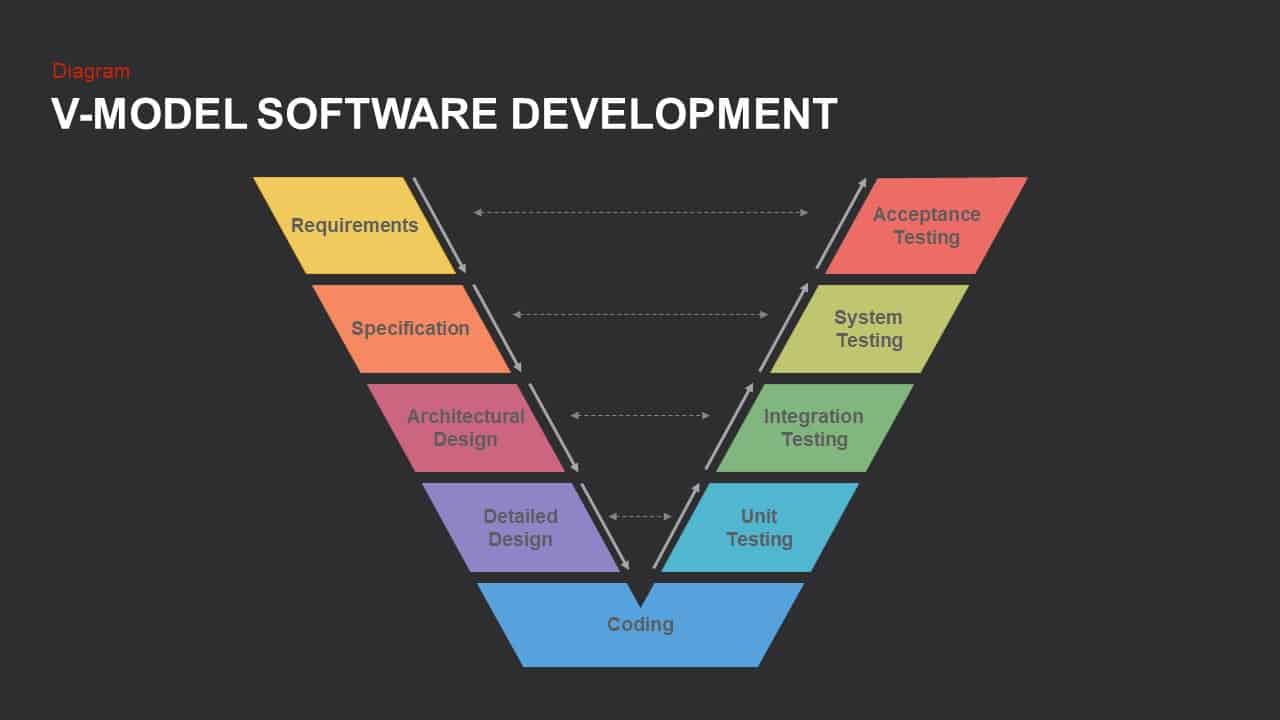
V-Model Software Development Diagram Template for PowerPoint & Google Slides
Software Development
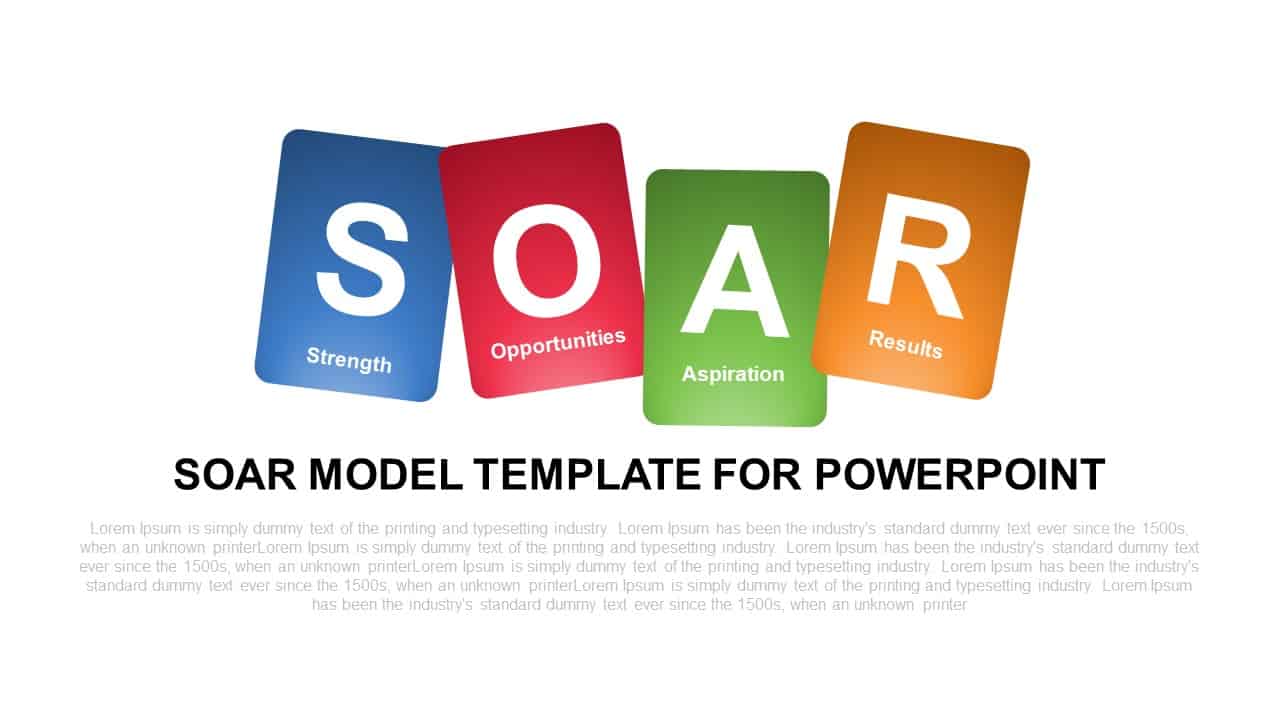
SOAR Strategic Model Card Diagram Template for PowerPoint & Google Slides
Process
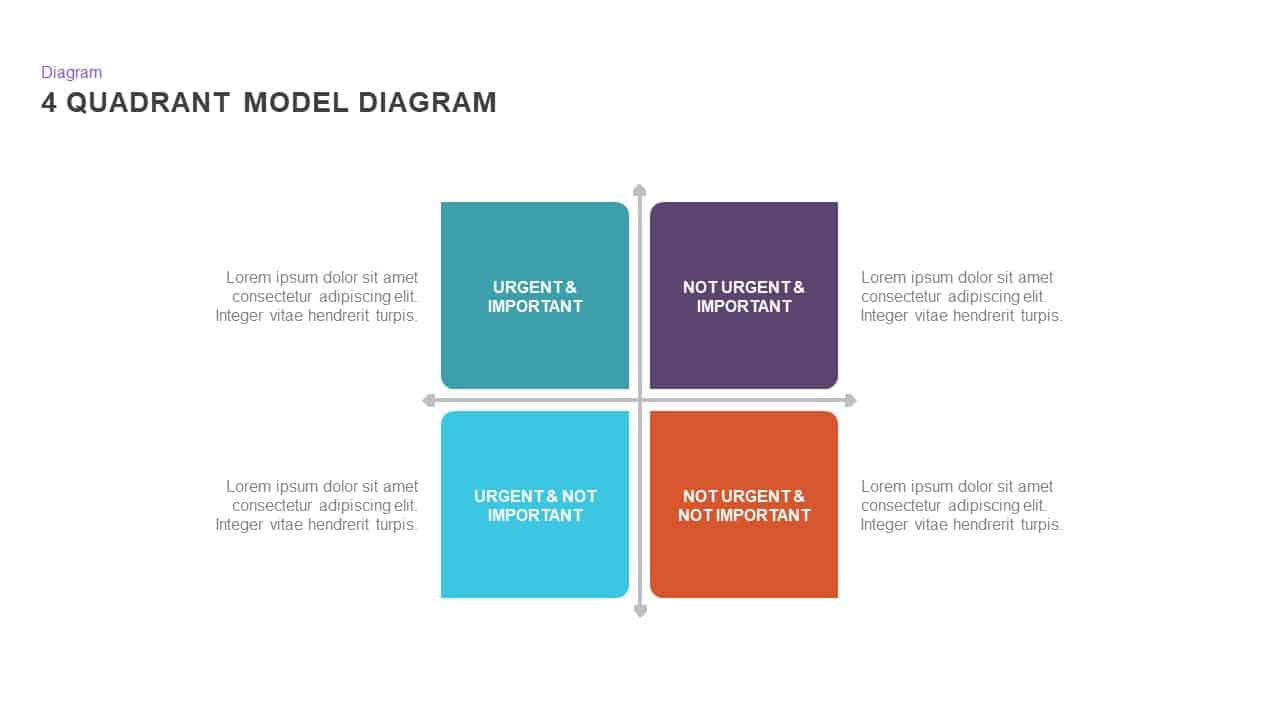
4 Quadrant Model Diagram template for PowerPoint & Google Slides
Process
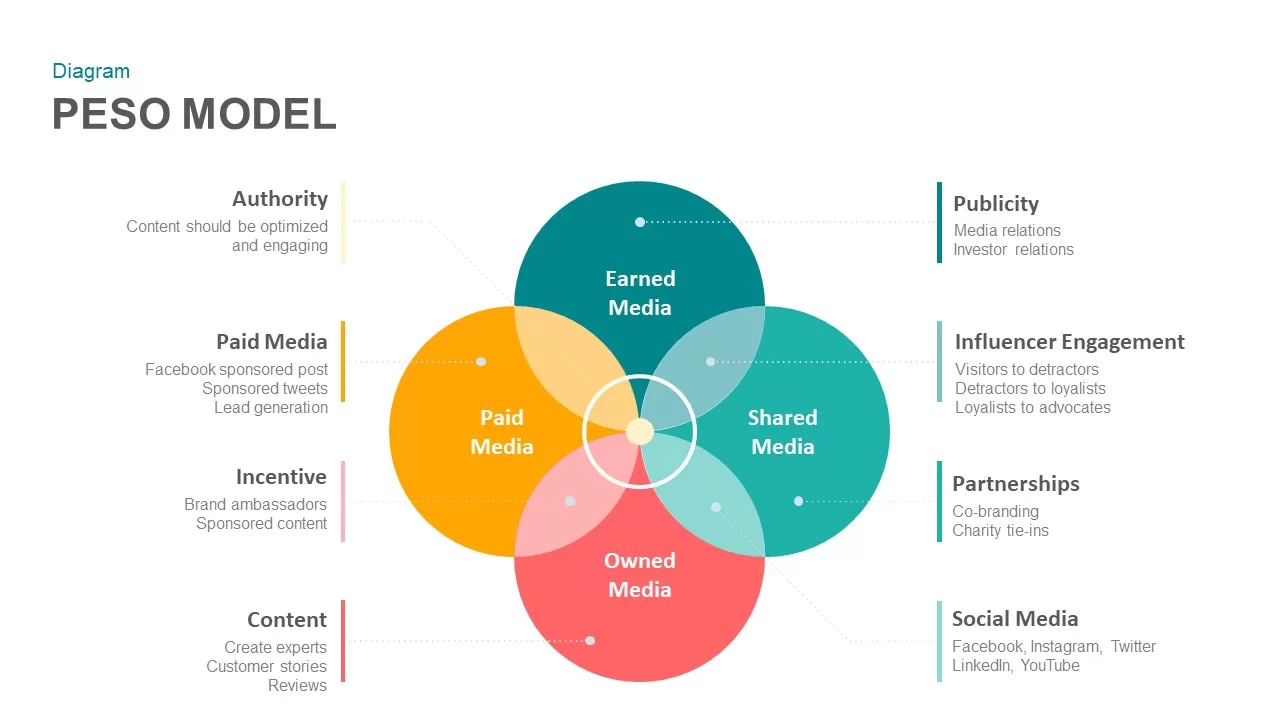
PESO Model Marketing Diagram Template for PowerPoint & Google Slides
Digital Marketing
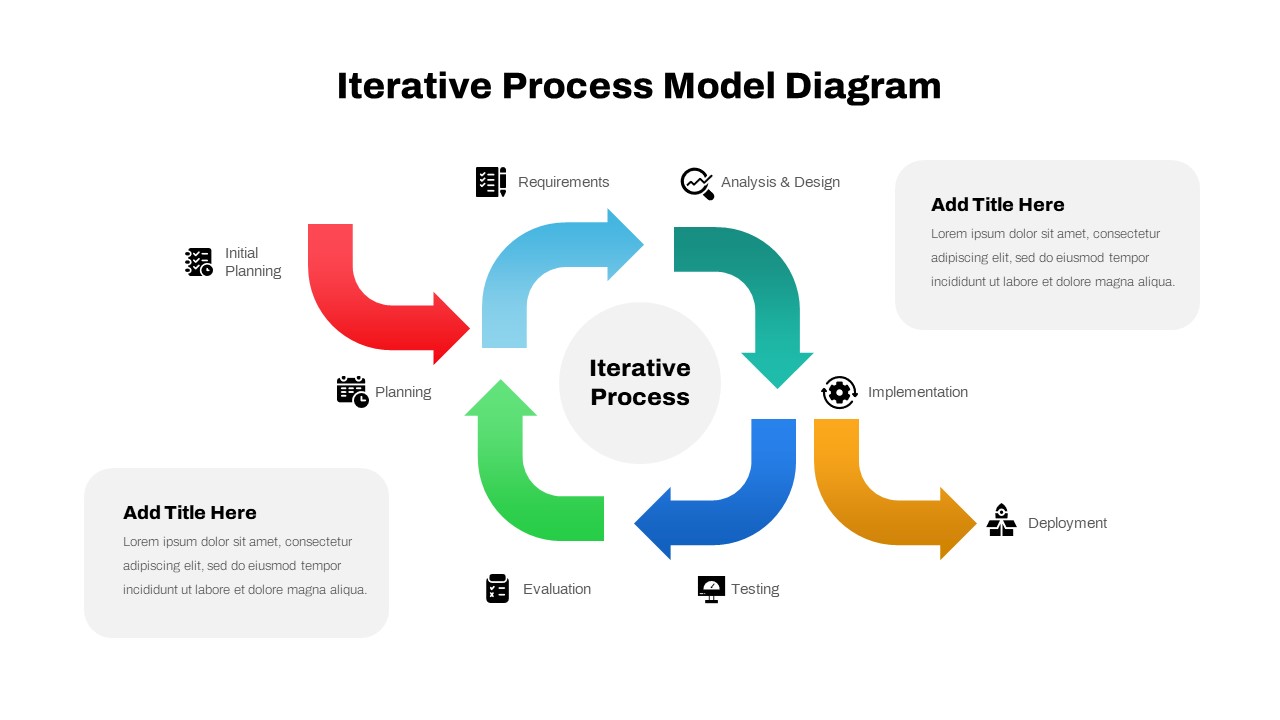
Iterative Process Model Diagram Template for PowerPoint & Google Slides
Process
Greiner Growth Model Six-Phase Diagram Template for PowerPoint & Google Slides
Business Models
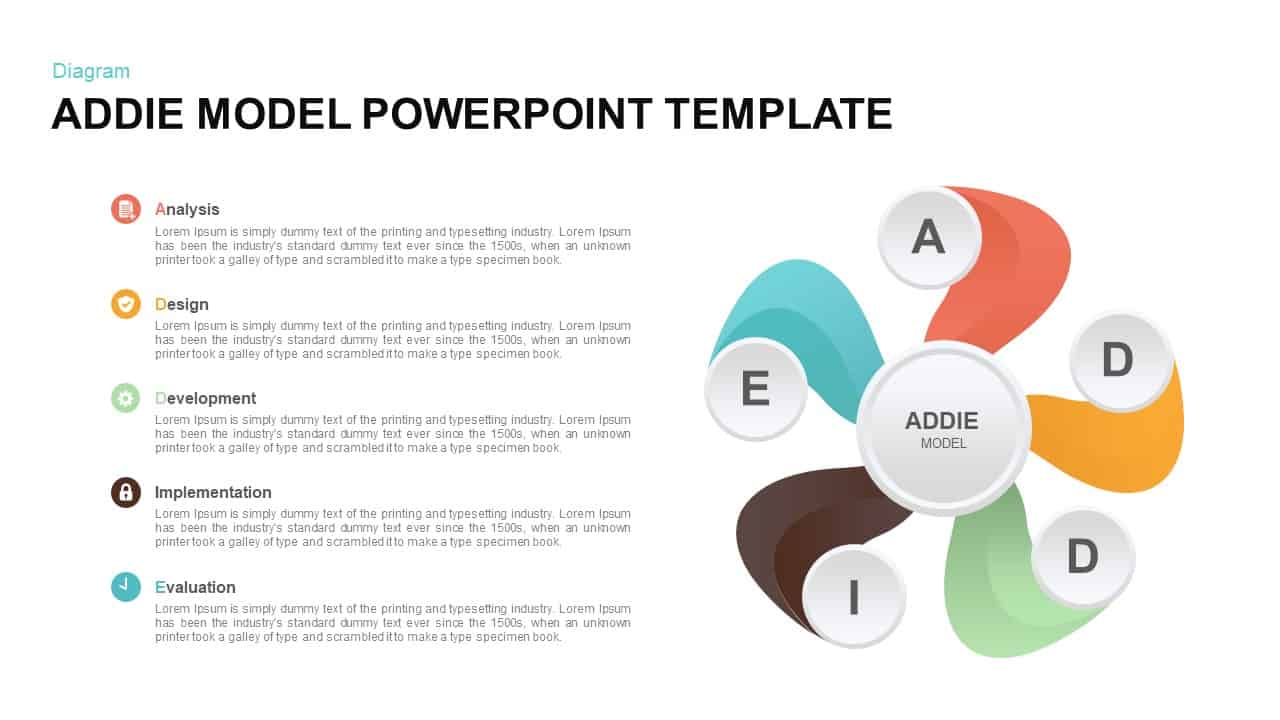
ADDIE Model Hub and Spoke Diagram Template for PowerPoint & Google Slides
Process

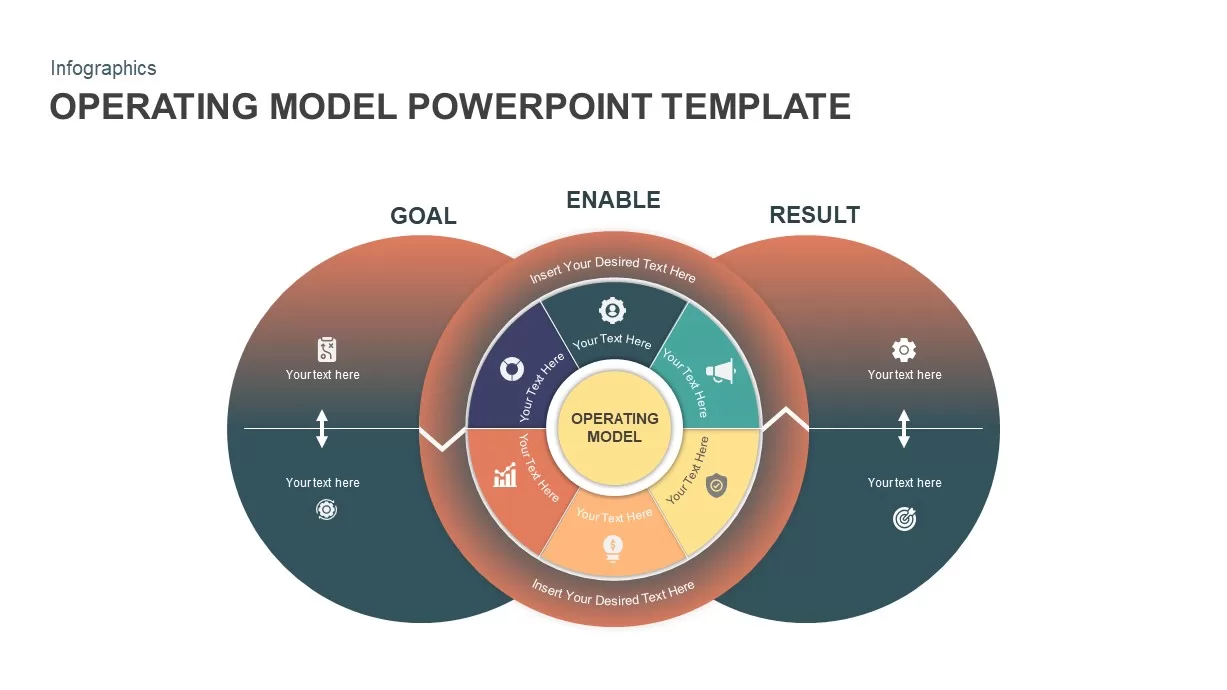
Operating Model Hub-and-Spoke Diagram Template for PowerPoint & Google Slides
Business Models
Four-Phase Maturity Model Diagram Template for PowerPoint & Google Slides
Process
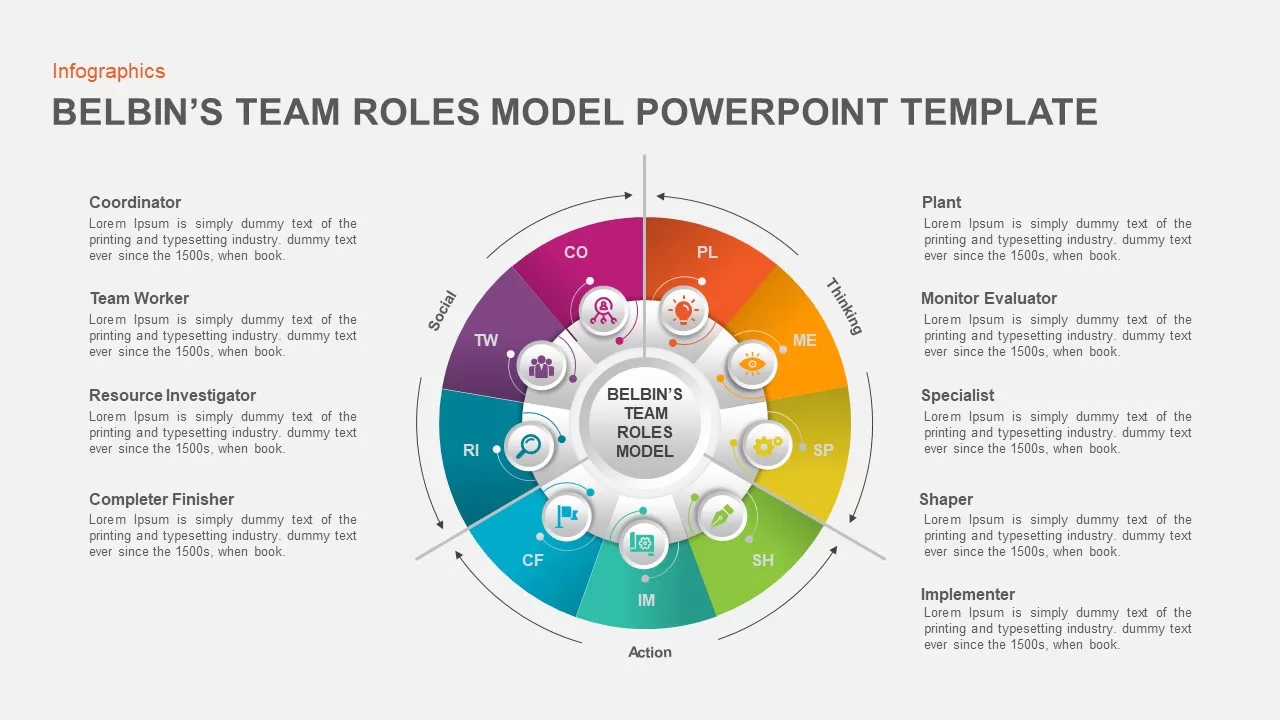
Belbin’s Team Roles Model Diagram Template for PowerPoint & Google Slides
HR
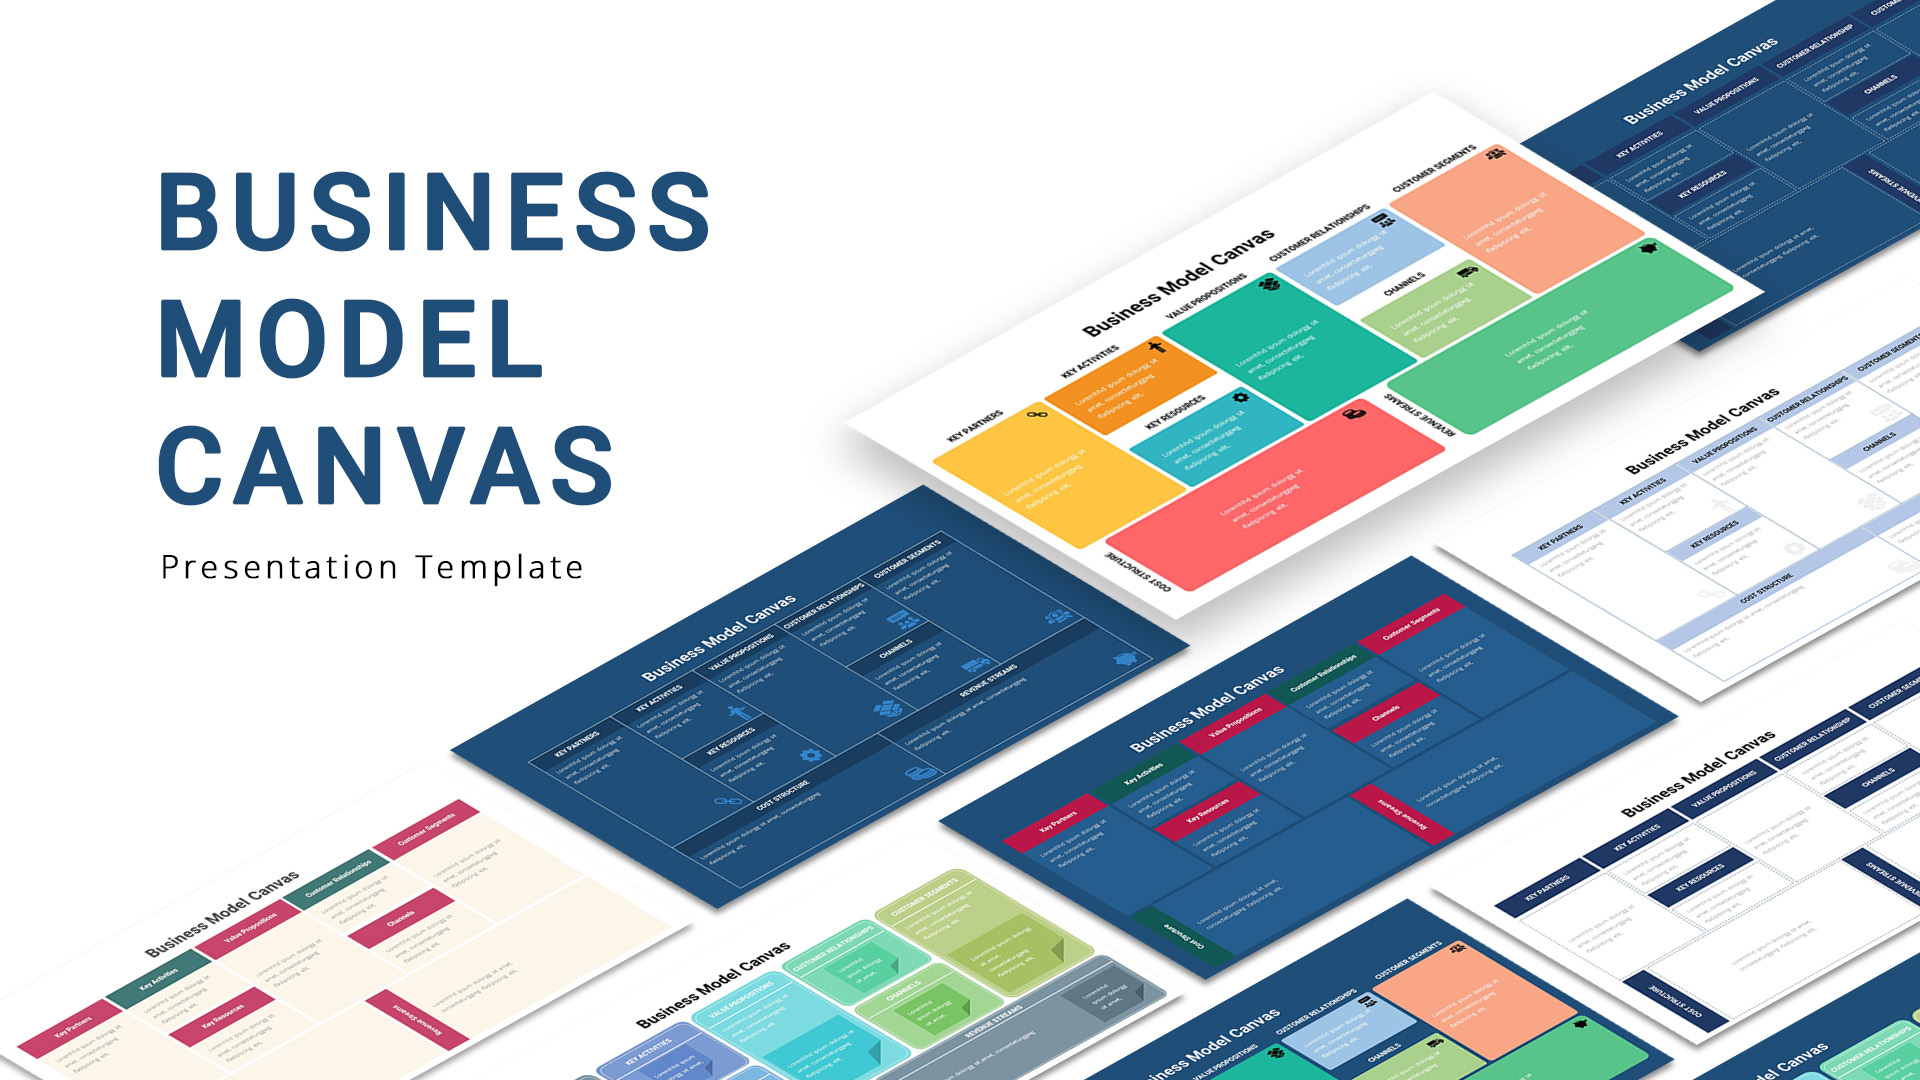
Business Model Canvas Diagram Template for PowerPoint & Google Slides
Business Models
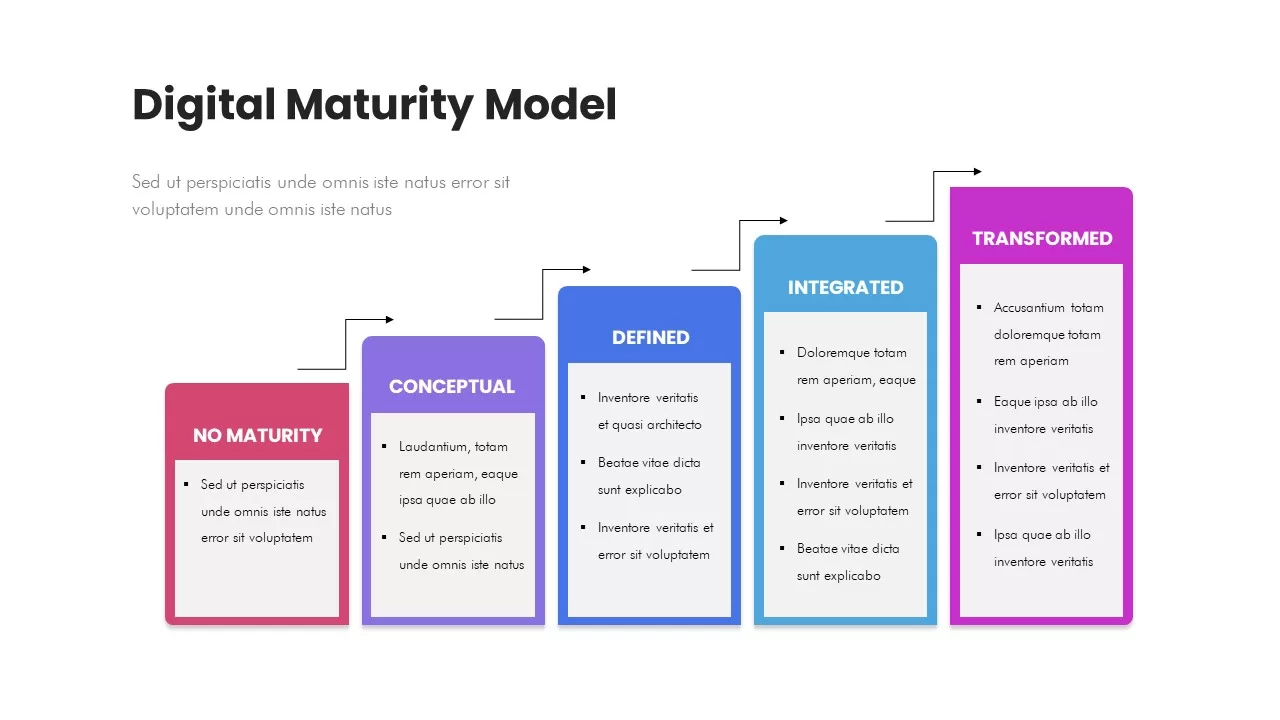
Digital Maturity Model Stages Diagram Template for PowerPoint & Google Slides
Process
Five-Stage Digital Maturity Model Diagram Template for PowerPoint & Google Slides
Process
Business Strategy House Model Diagram Template for PowerPoint & Google Slides
Business Strategy
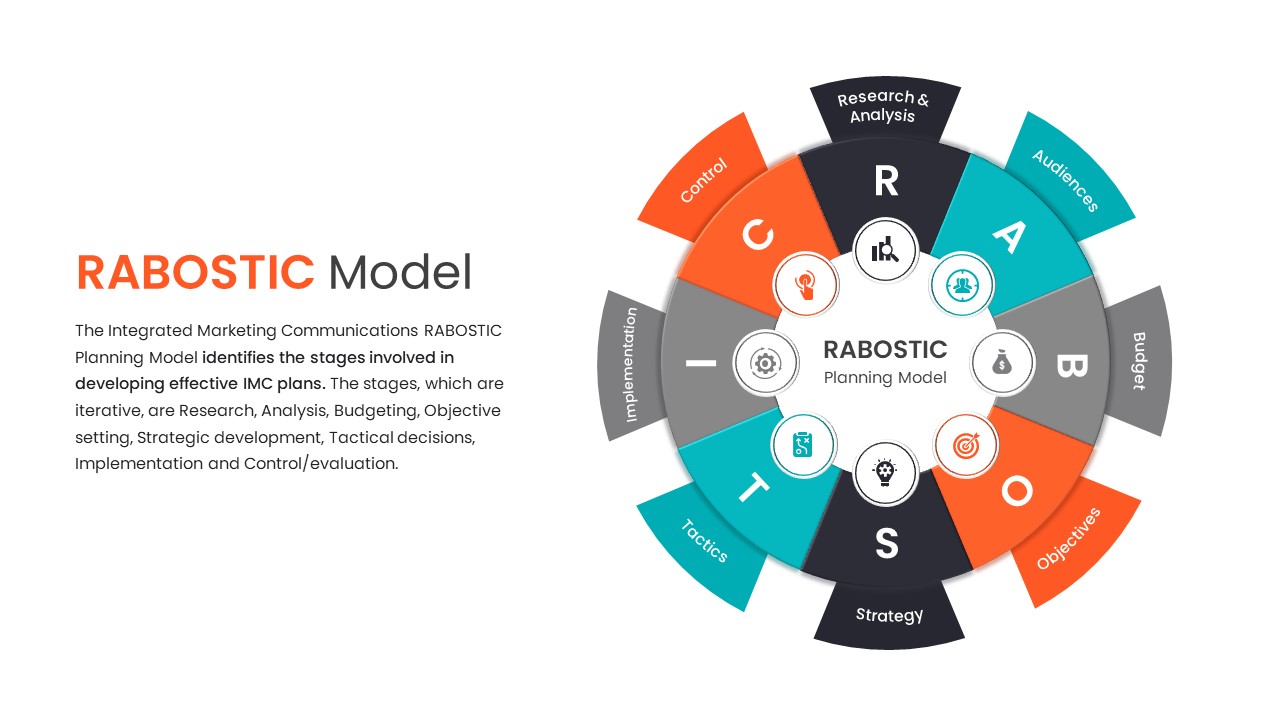
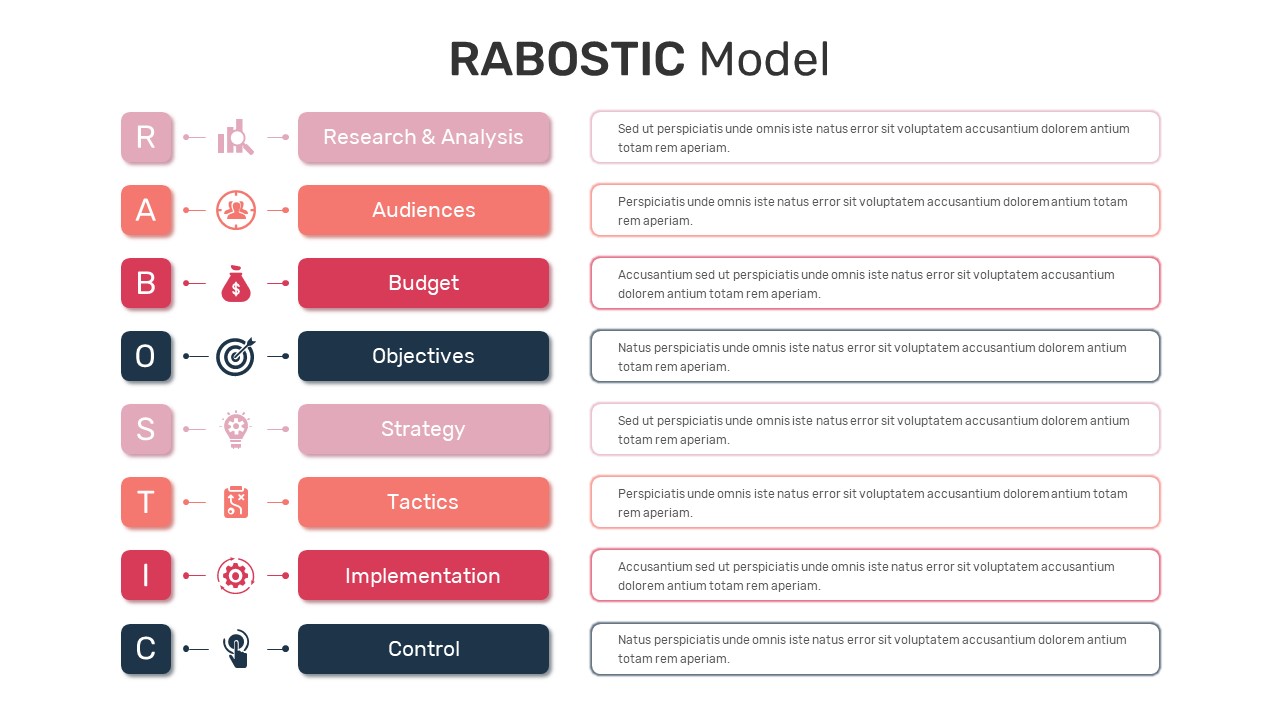
RABOSTIC IMC Planning Model Diagram Template for PowerPoint & Google Slides
Process
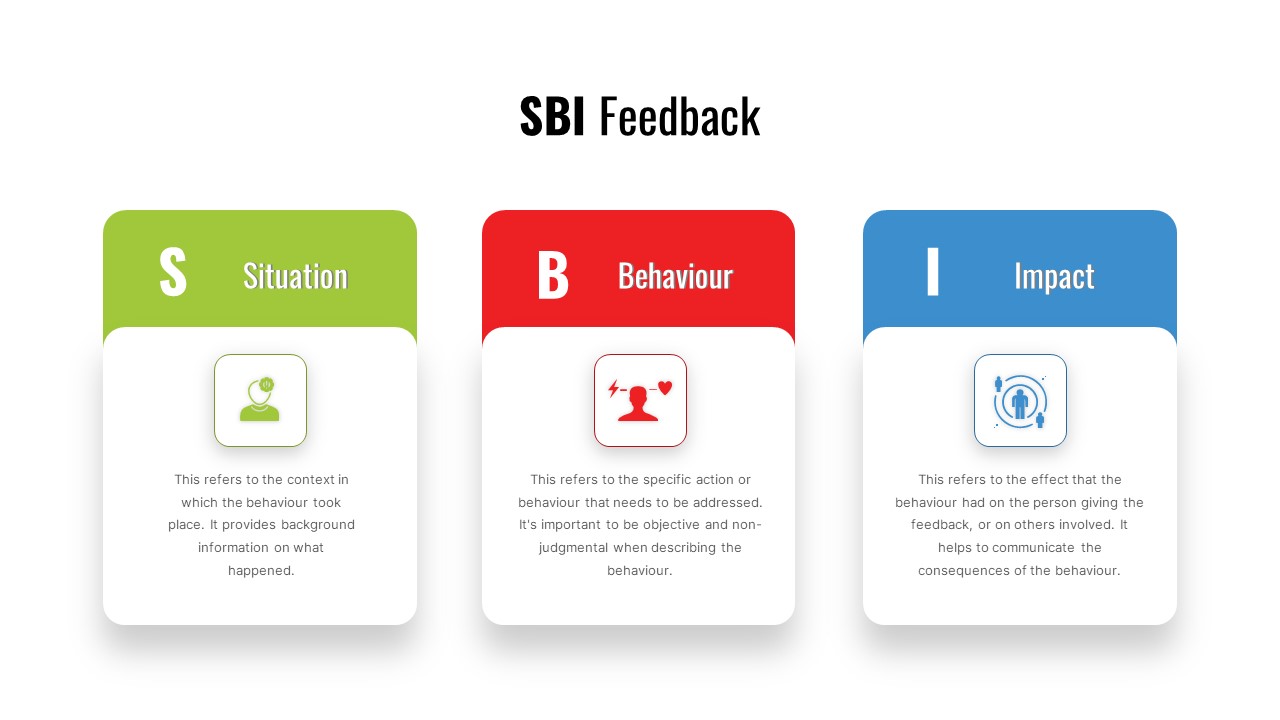
SBI Feedback Model Process Diagram Template for PowerPoint & Google Slides
Process
RABOSTIC Marketing Model Process Diagram Template for PowerPoint & Google Slides
Process
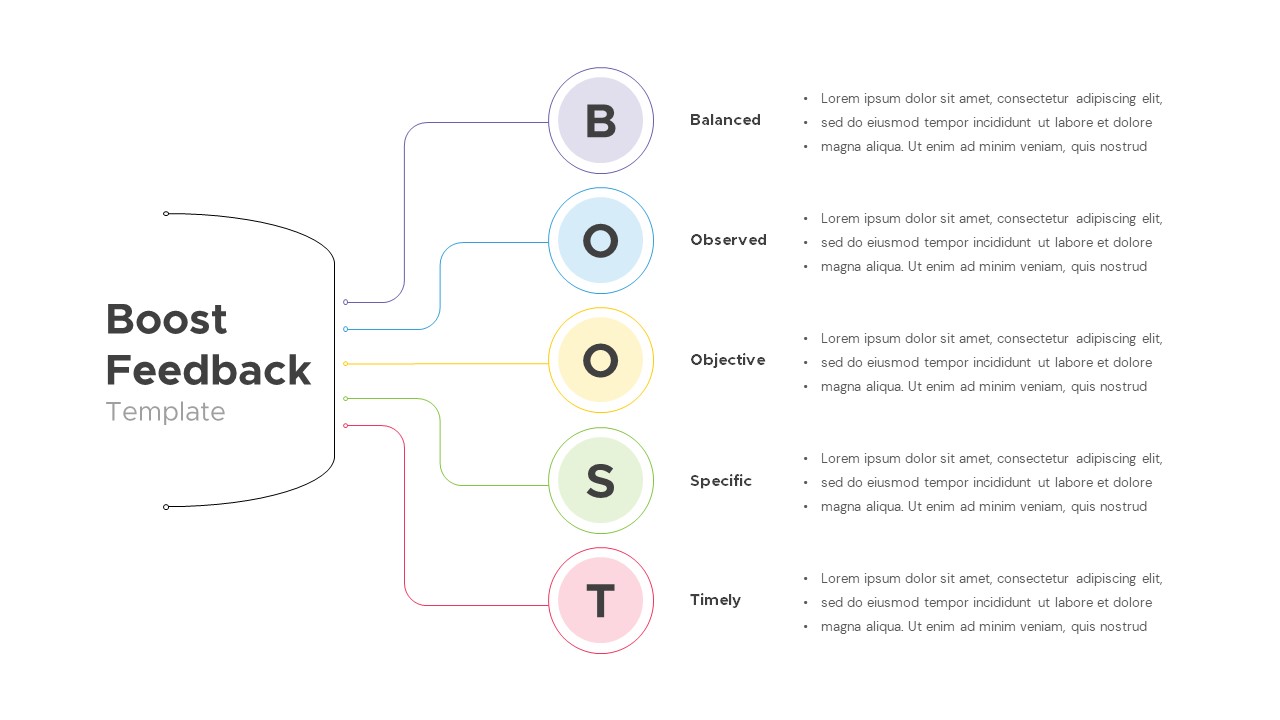
Interactive Boost Feedback Model Diagram Template for PowerPoint & Google Slides
Process
Organizational Maturity Model Diagram Template for PowerPoint & Google Slides
Process
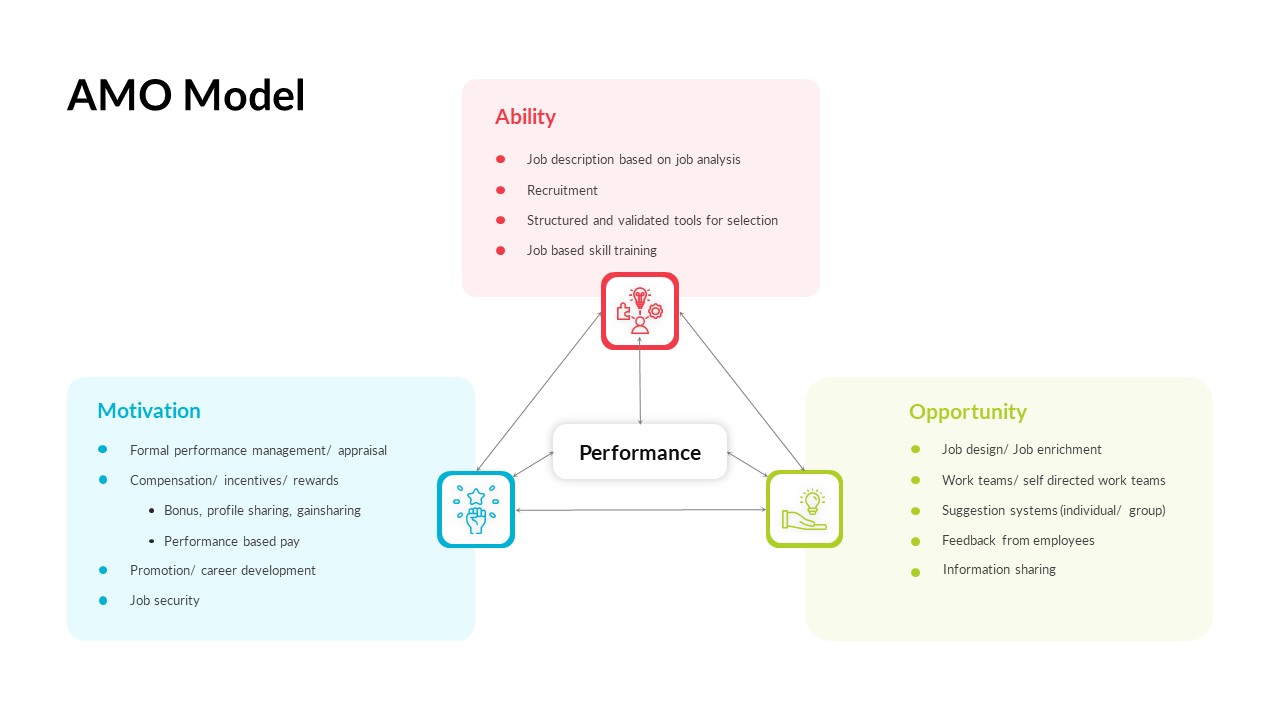
AMO Performance Model Feedback Diagram Template for PowerPoint & Google Slides
Employee Performance
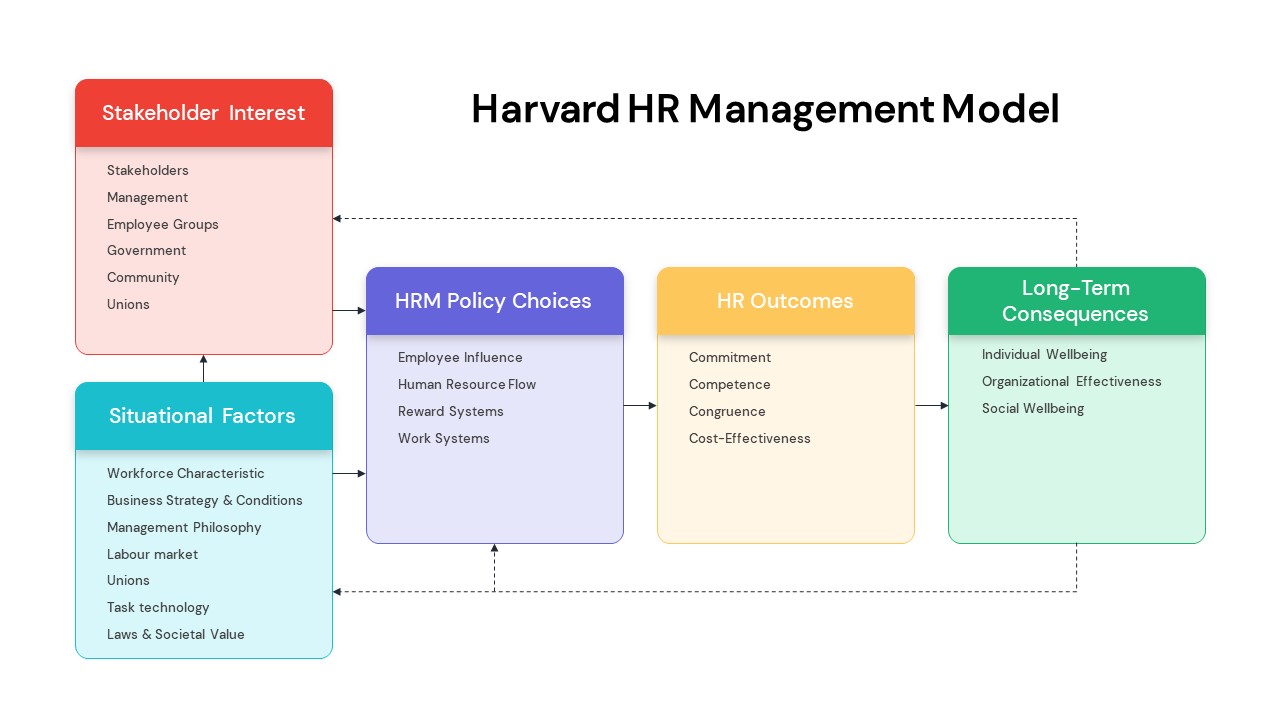
Harvard HR Management Model Diagram Template for PowerPoint & Google Slides
Process
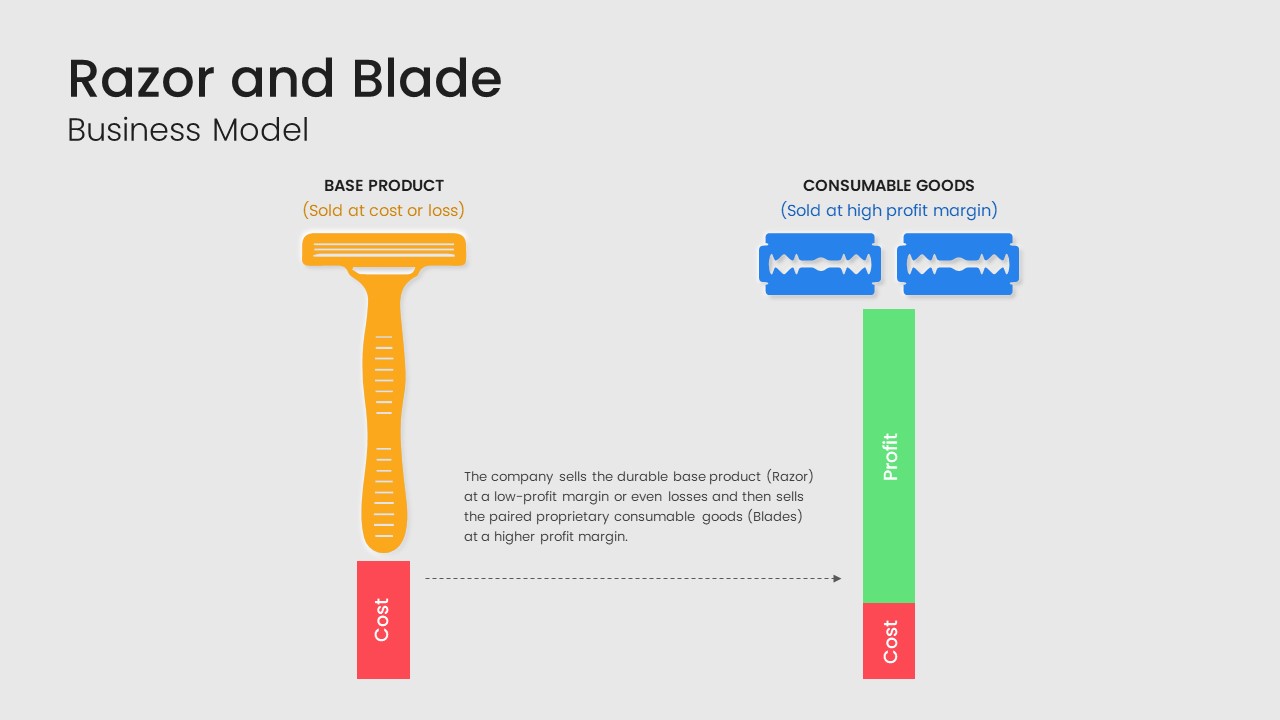
Razor and Blade Business Model Diagram Template for PowerPoint & Google Slides
Business Models
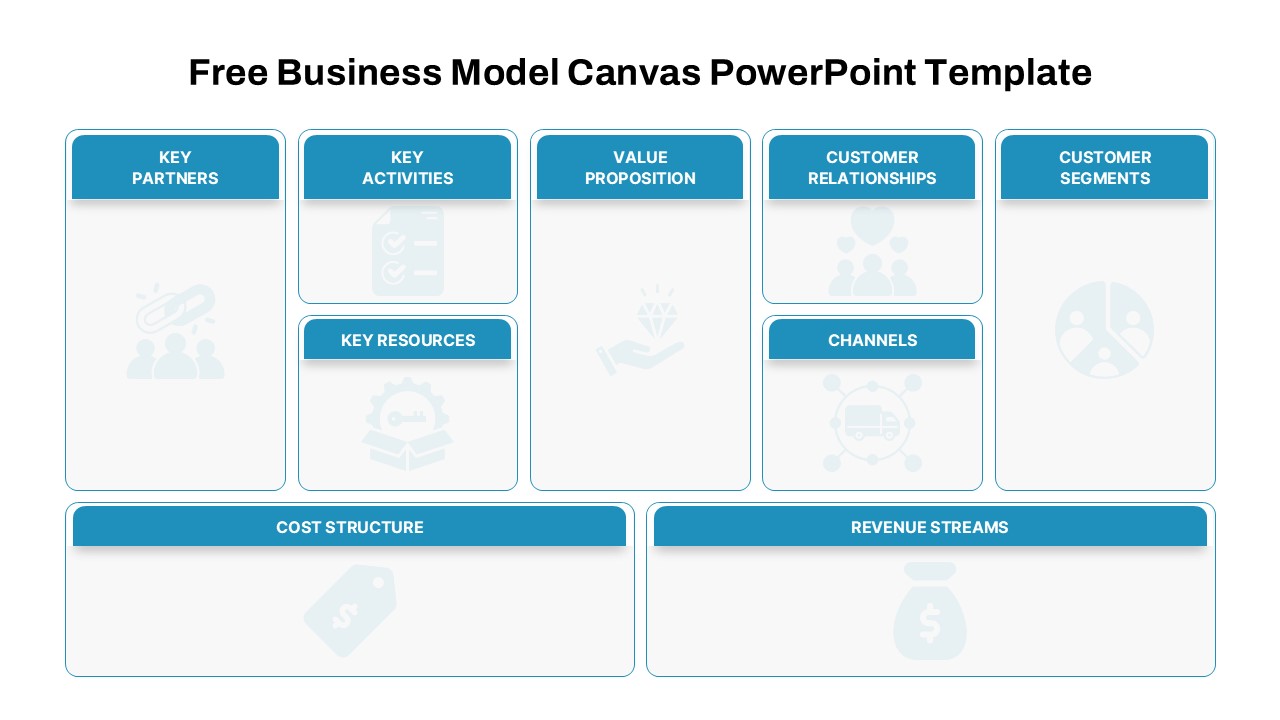
Free Business Model Canvas Diagram Slide Template for PowerPoint & Google Slides
Business Models
Free
Salience Model Venn Diagram Infographic Template for PowerPoint & Google Slides
Circular
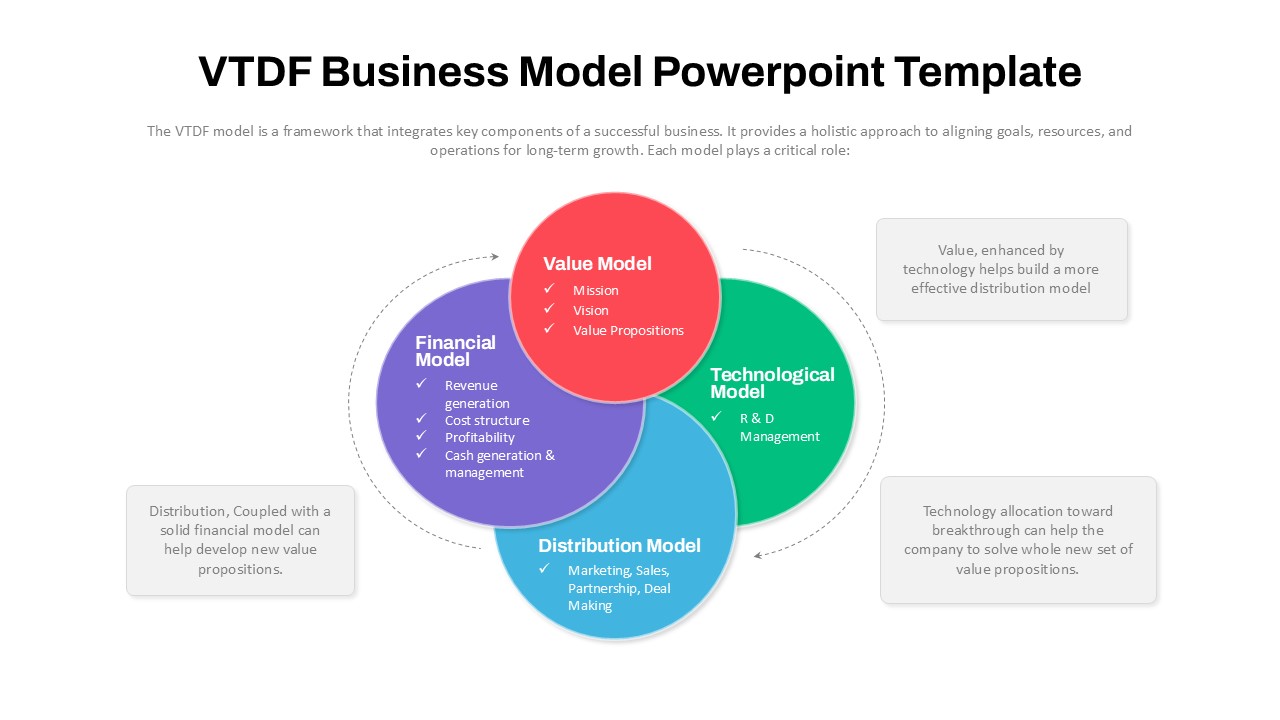
VTDF Business Model Framework Diagram Template for PowerPoint & Google Slides
Business Models
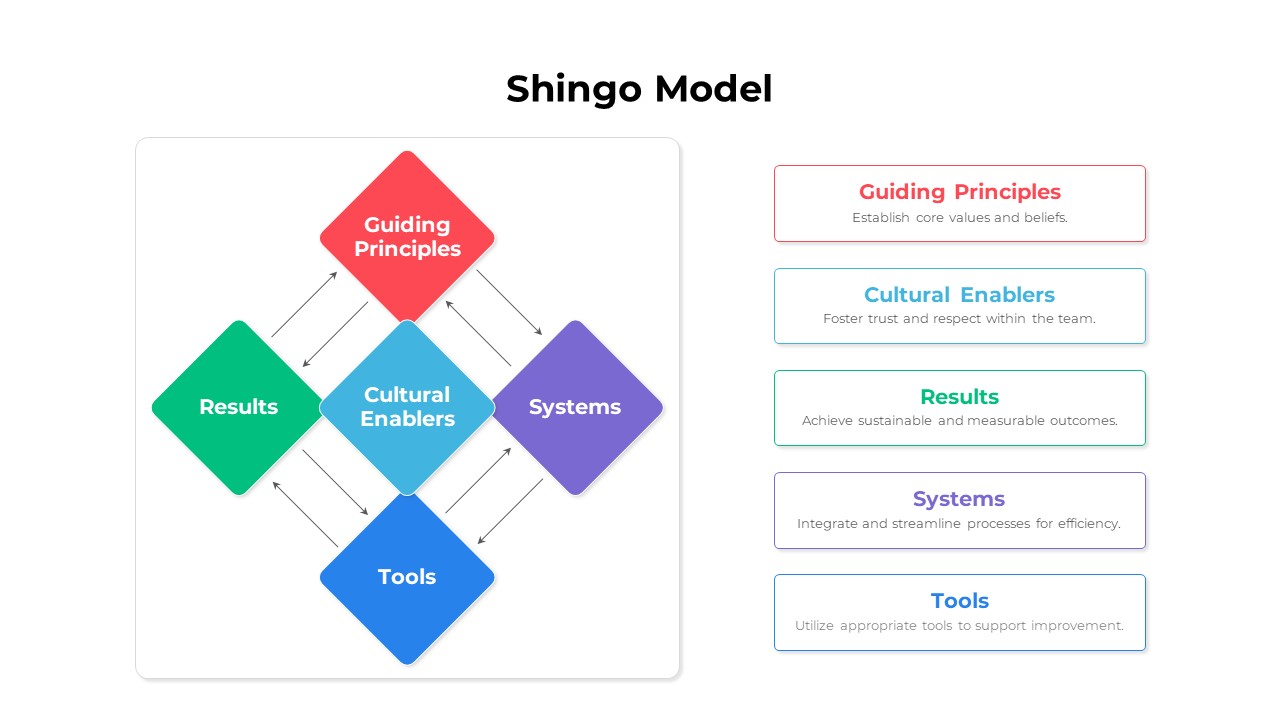
Shingo Model Diagram Template for PowerPoint & Google Slides
Process
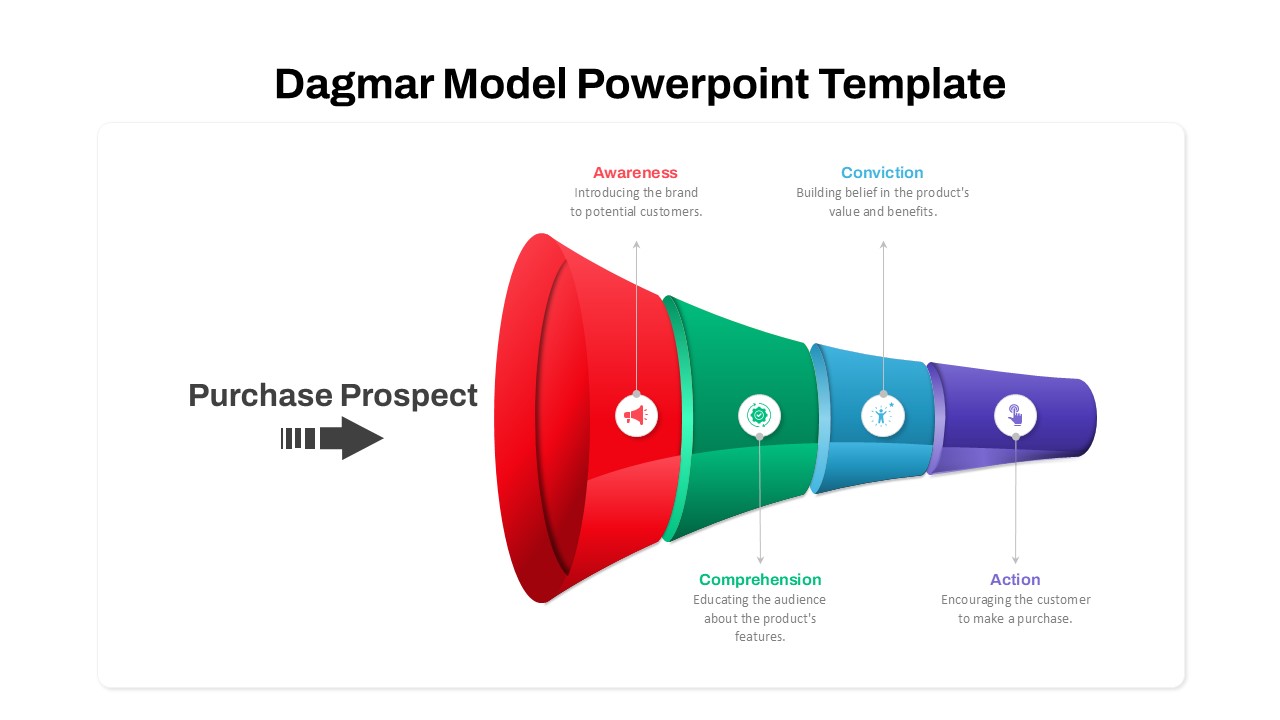
Dagmar Model Marketing Funnel Diagram Template for PowerPoint & Google Slides
Funnel
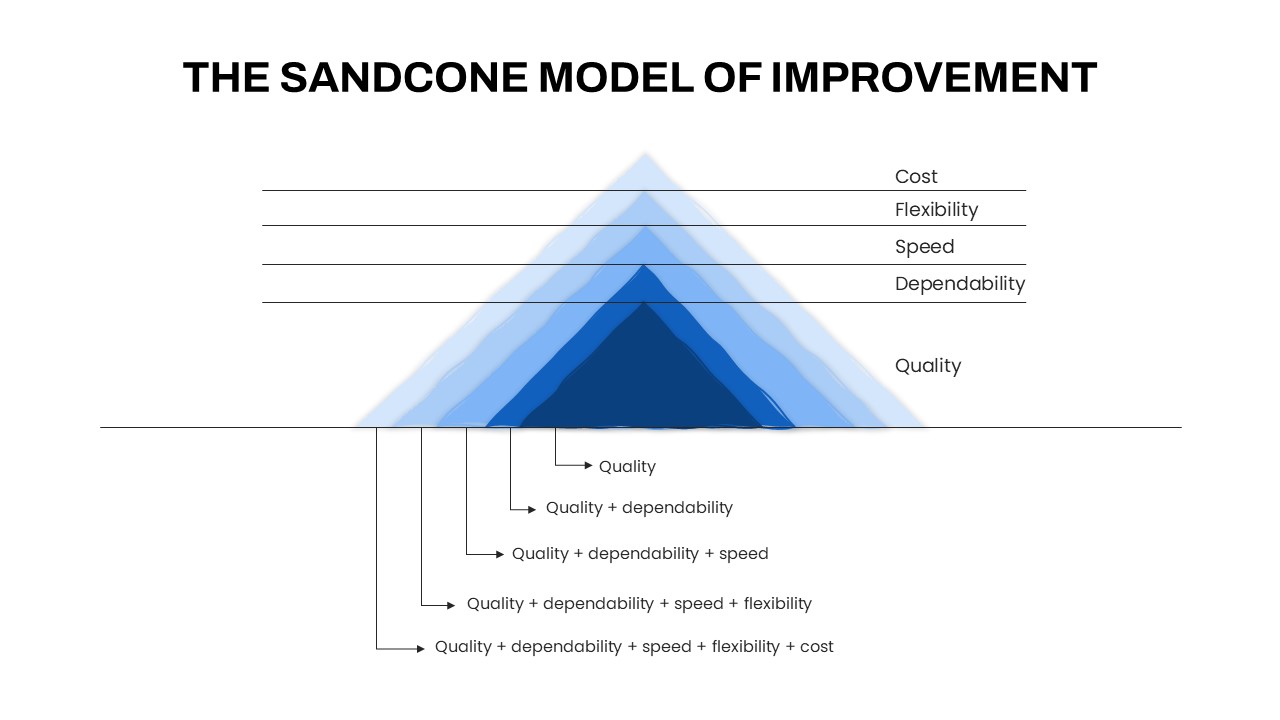
Sandcone Model of Improvement Diagram Template for PowerPoint & Google Slides
Pyramid
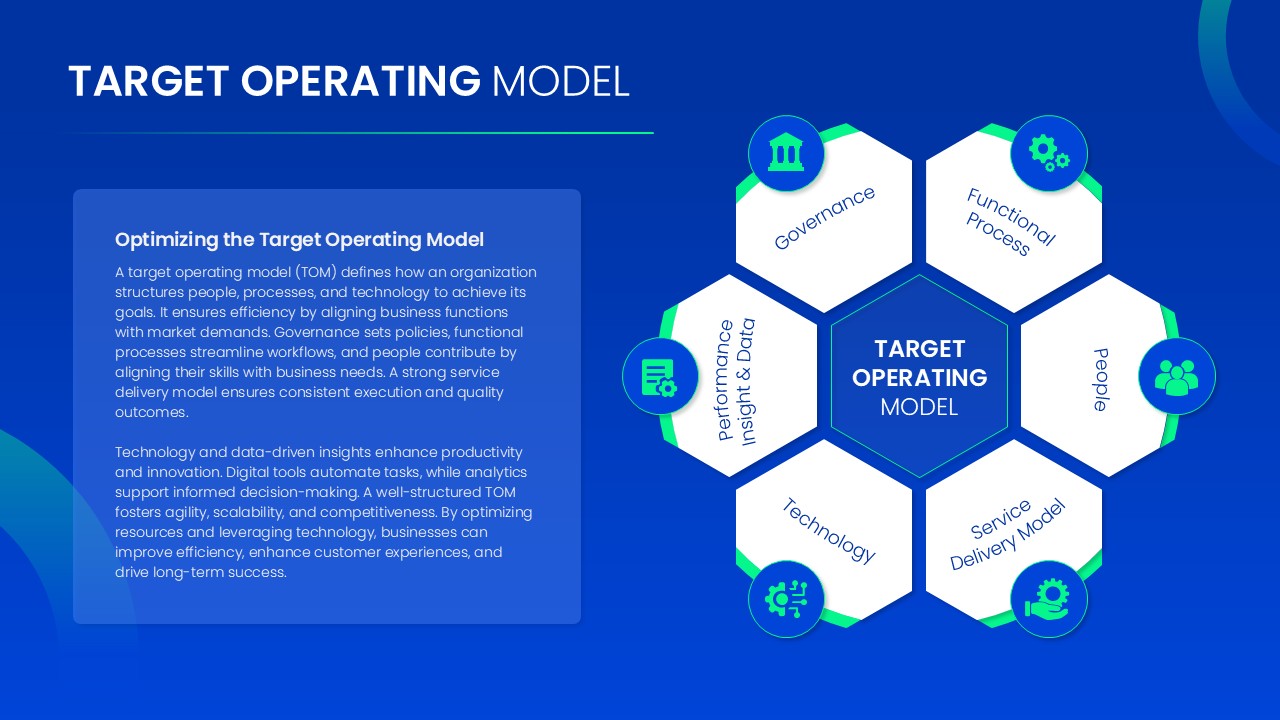
Target Operating Model Diagram Template for PowerPoint & Google Slides
Business Strategy
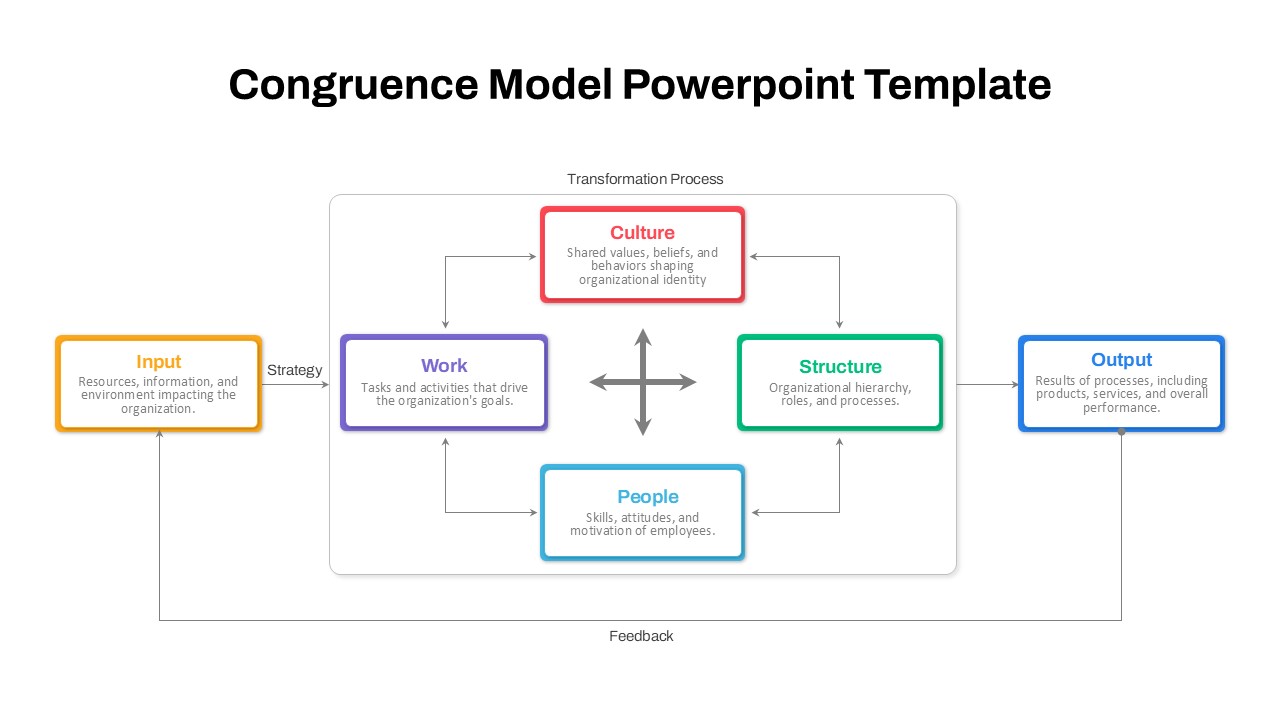
Organizational Congruence Model Diagram Template for PowerPoint & Google Slides
Process
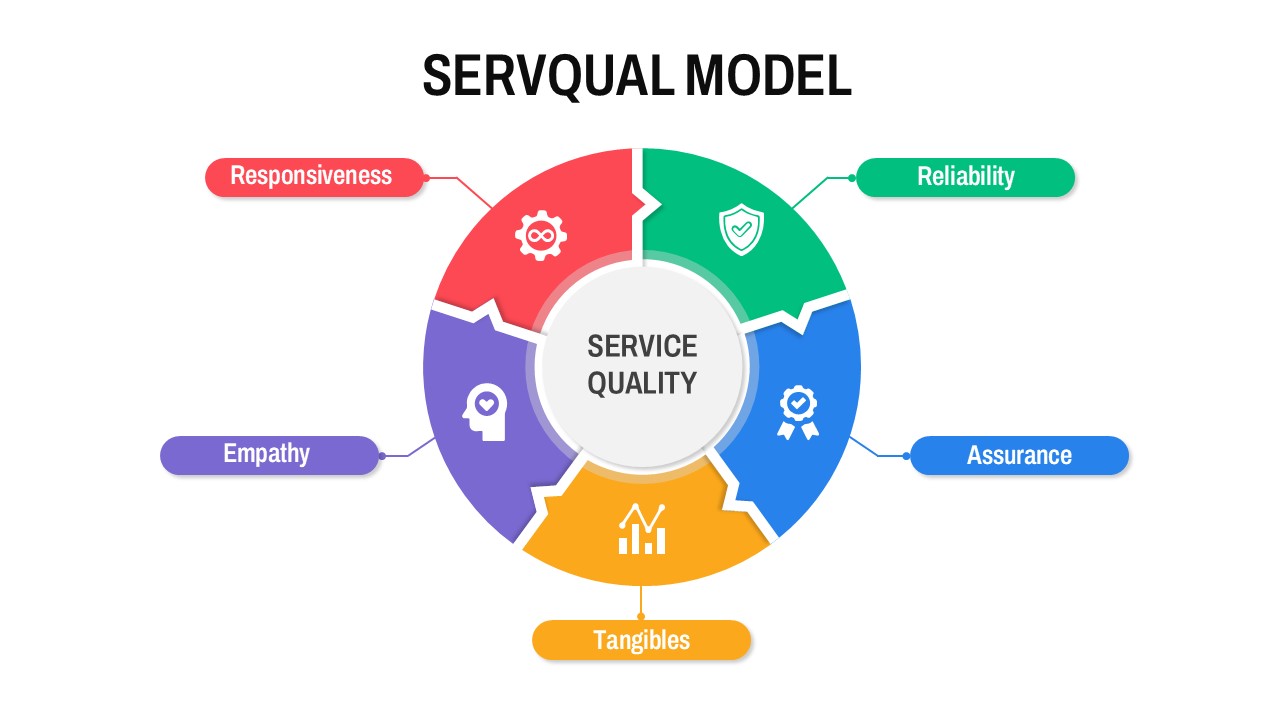
Circular SERVQUAL Model Diagram Template for PowerPoint & Google Slides
Business Strategy
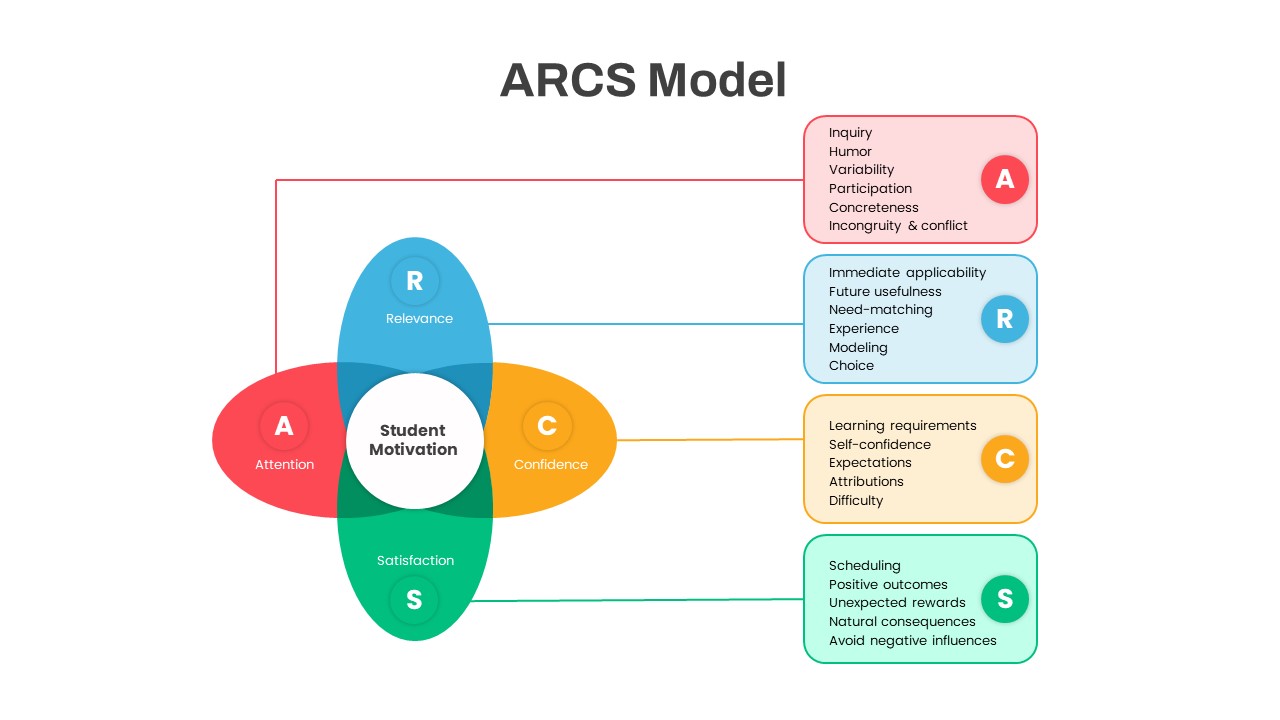
ARCS Student Motivation Model Diagram Template for PowerPoint & Google Slides
Process
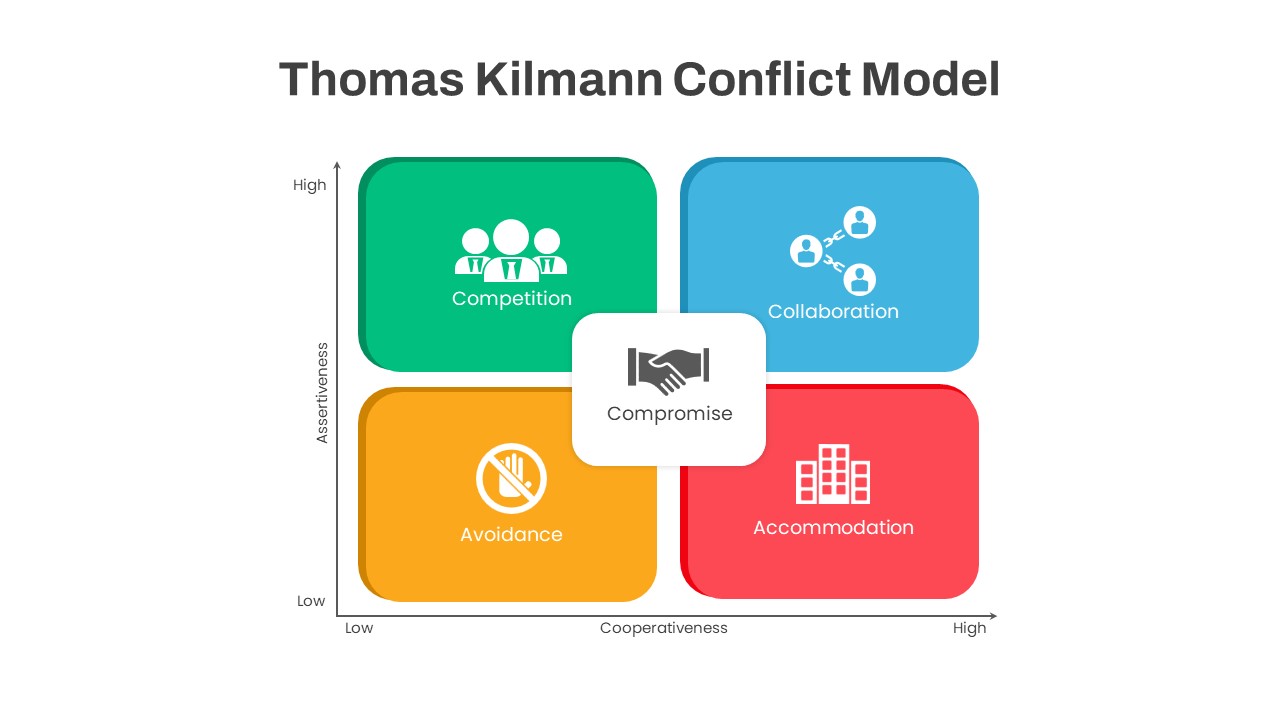
Thomas Kilmann Conflict Model Diagram Template for PowerPoint & Google Slides
Leadership
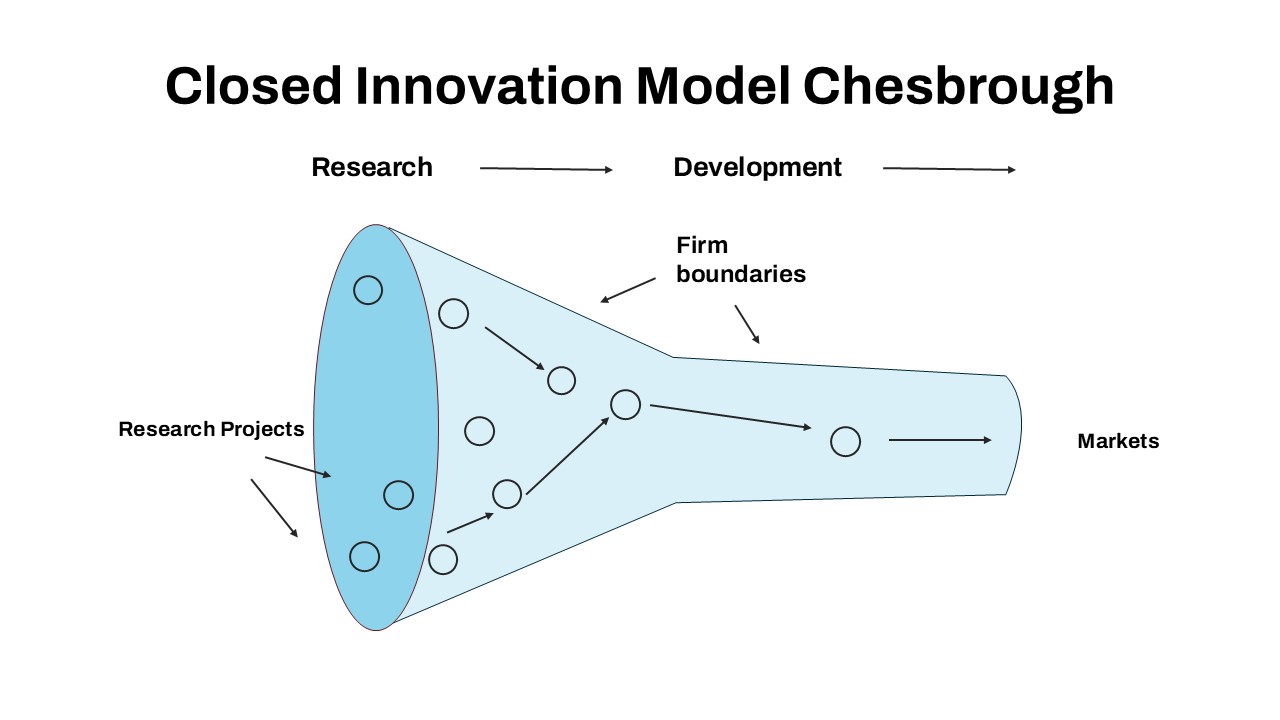
Closed Innovation Model Funnel Diagram Template for PowerPoint & Google Slides
Funnel
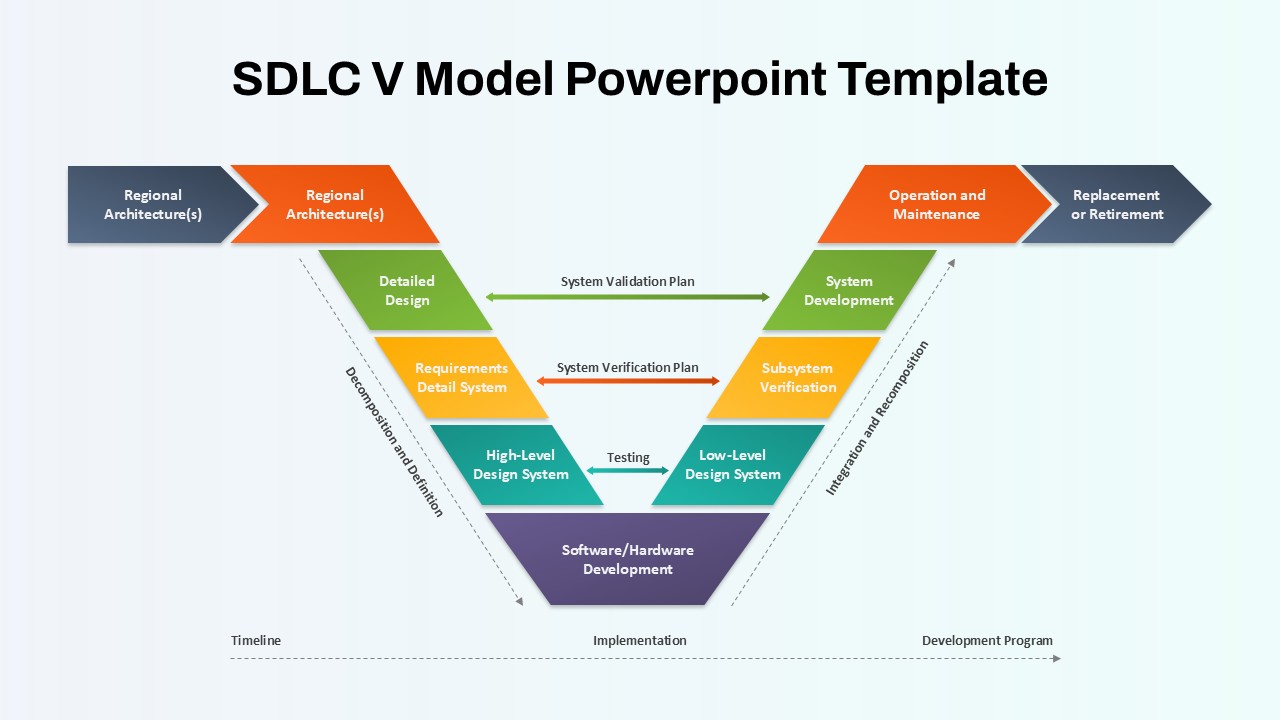
SDLC V Model Lifecycle Diagram Template for PowerPoint & Google Slides
Process
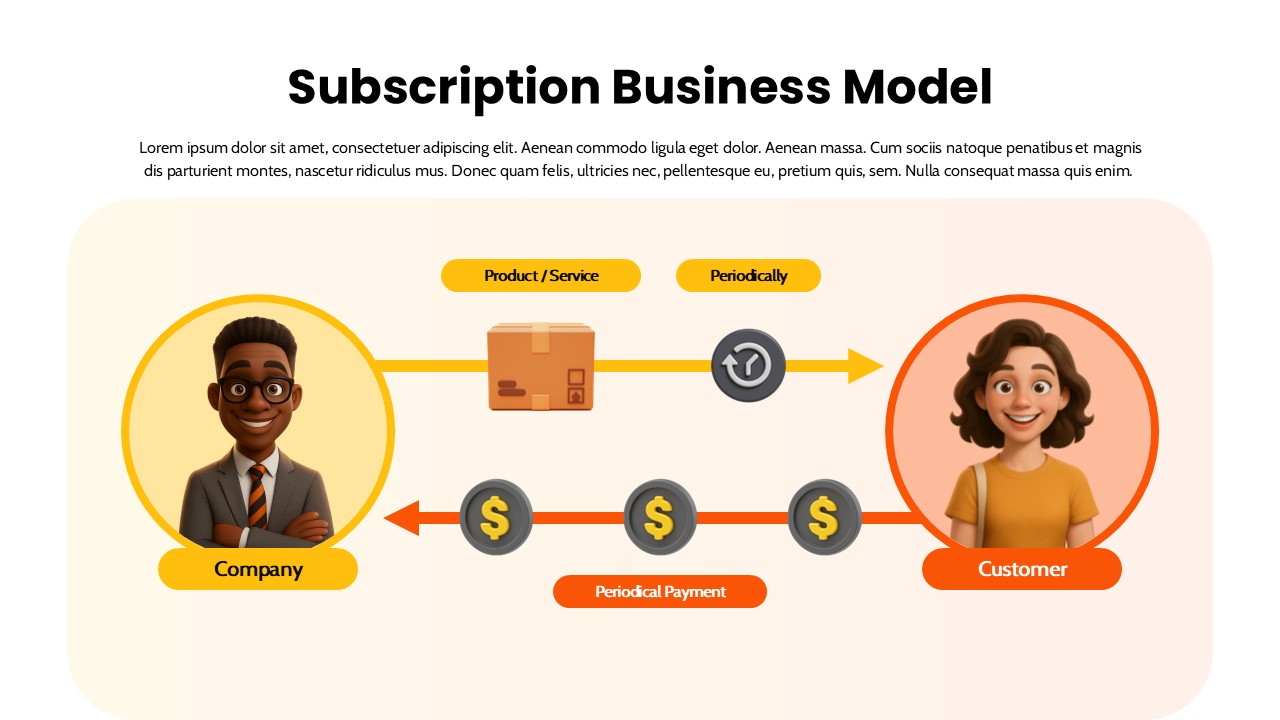
Subscription Business Model Flow Diagram Template for PowerPoint & Google Slides
Business Models
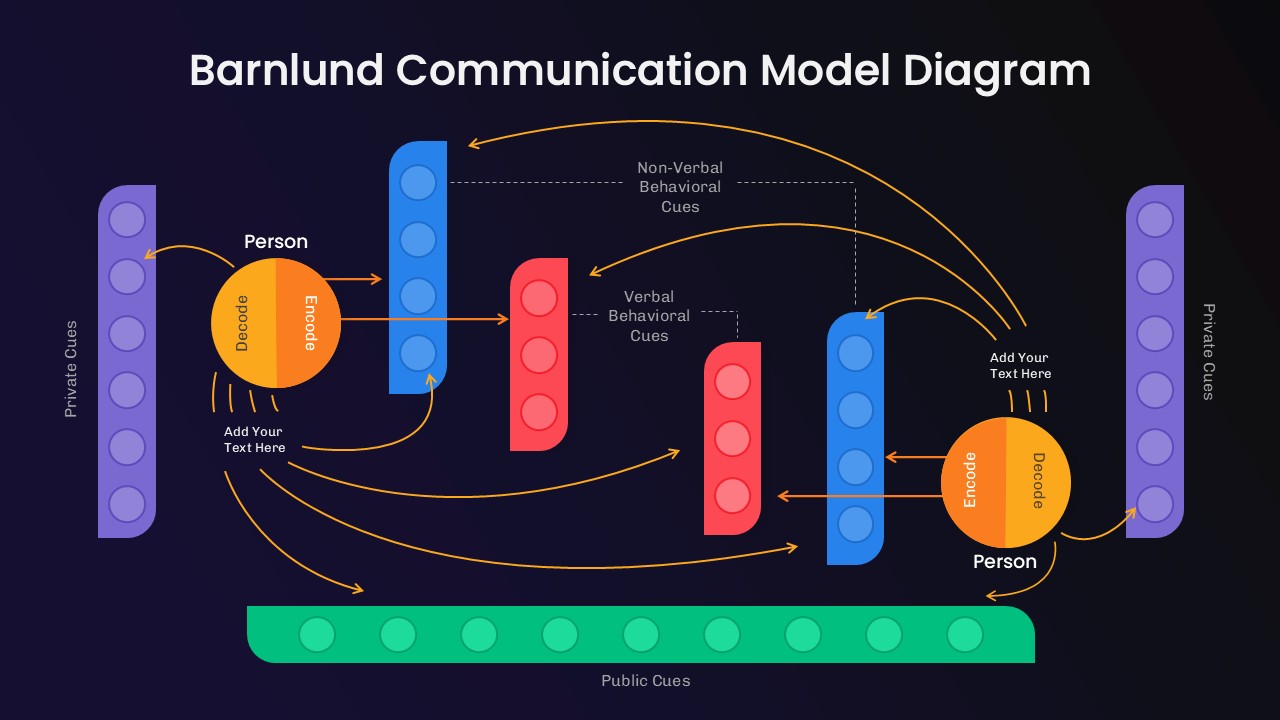
Barnlund Communication Model Diagram Template for PowerPoint & Google Slides
Process
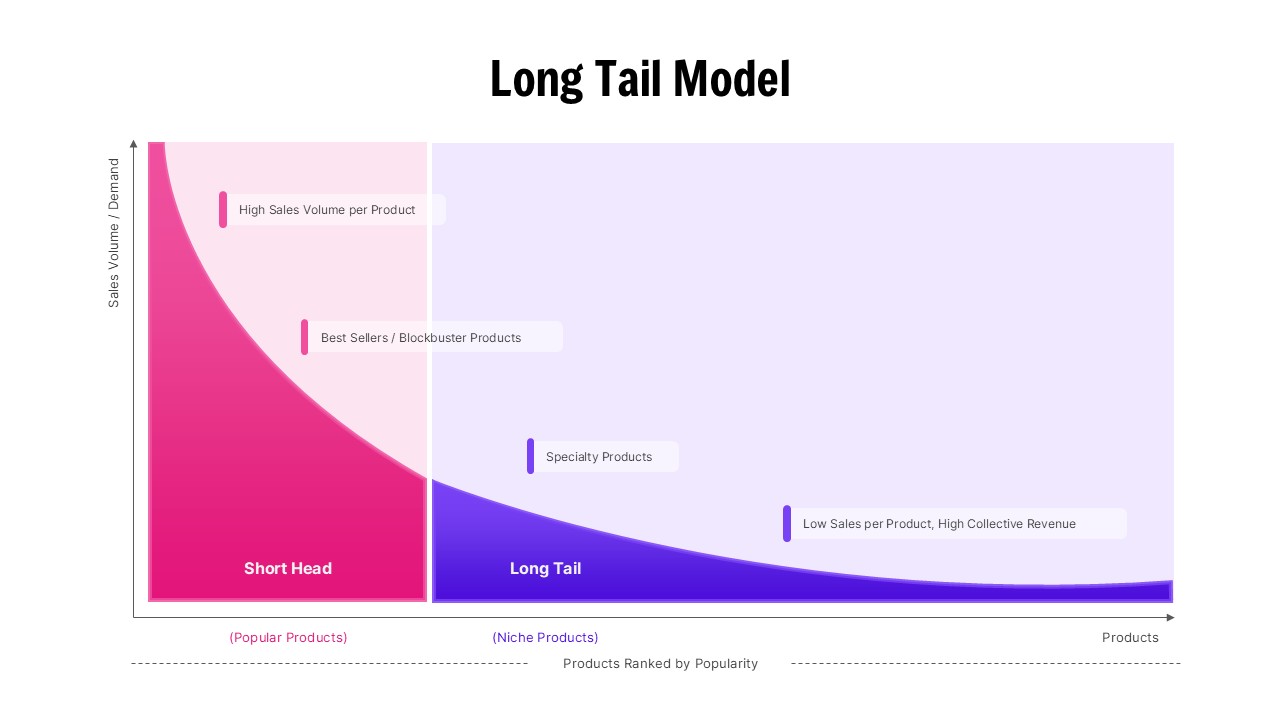
Long Tail Model Business Strategy Diagram Template for PowerPoint & Google Slides
Business
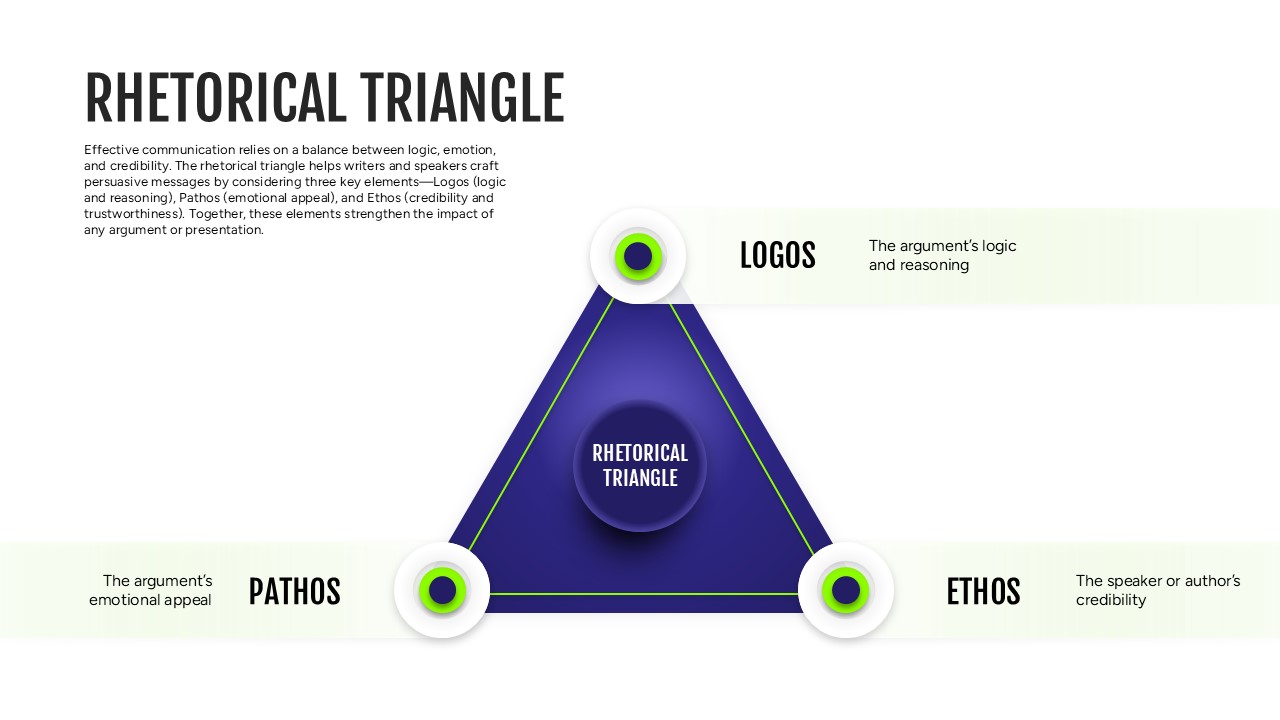
Rhetorical Triangle Model Diagram Template for PowerPoint & Google Slides
Leadership
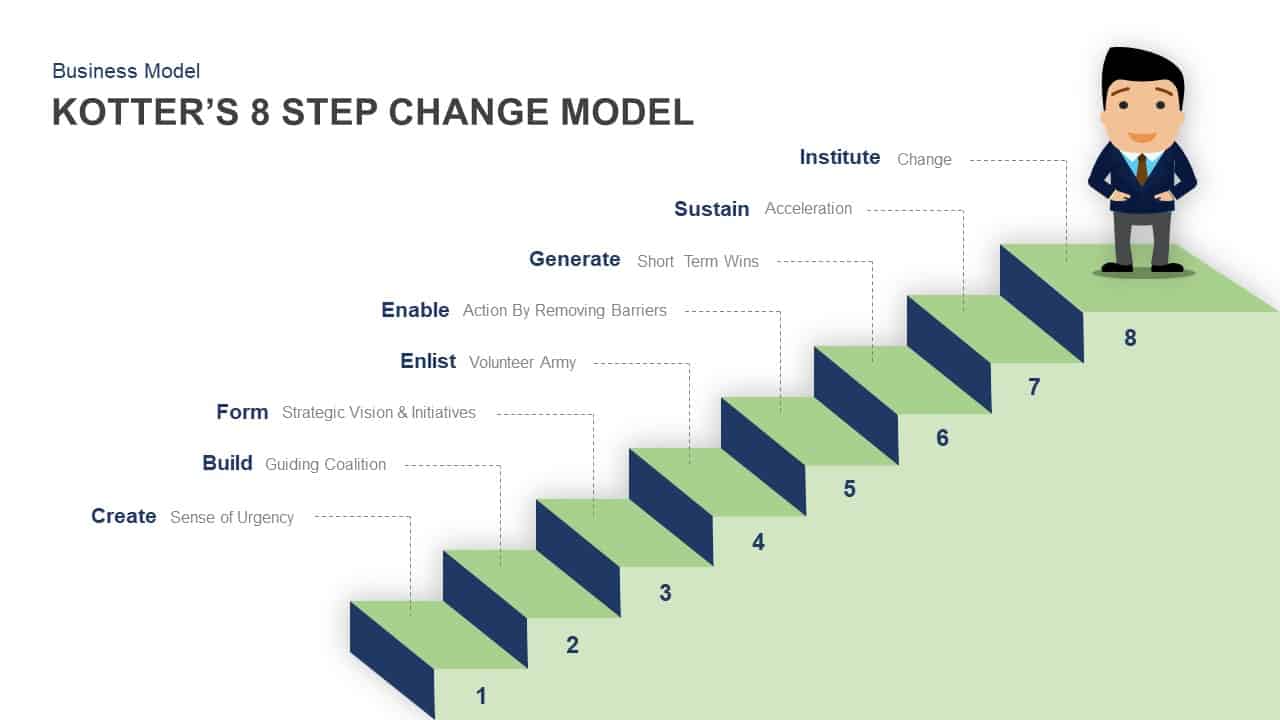
Kotter’s 8 Step Change Model Diagram for PowerPoint & Google Slides
Business Models
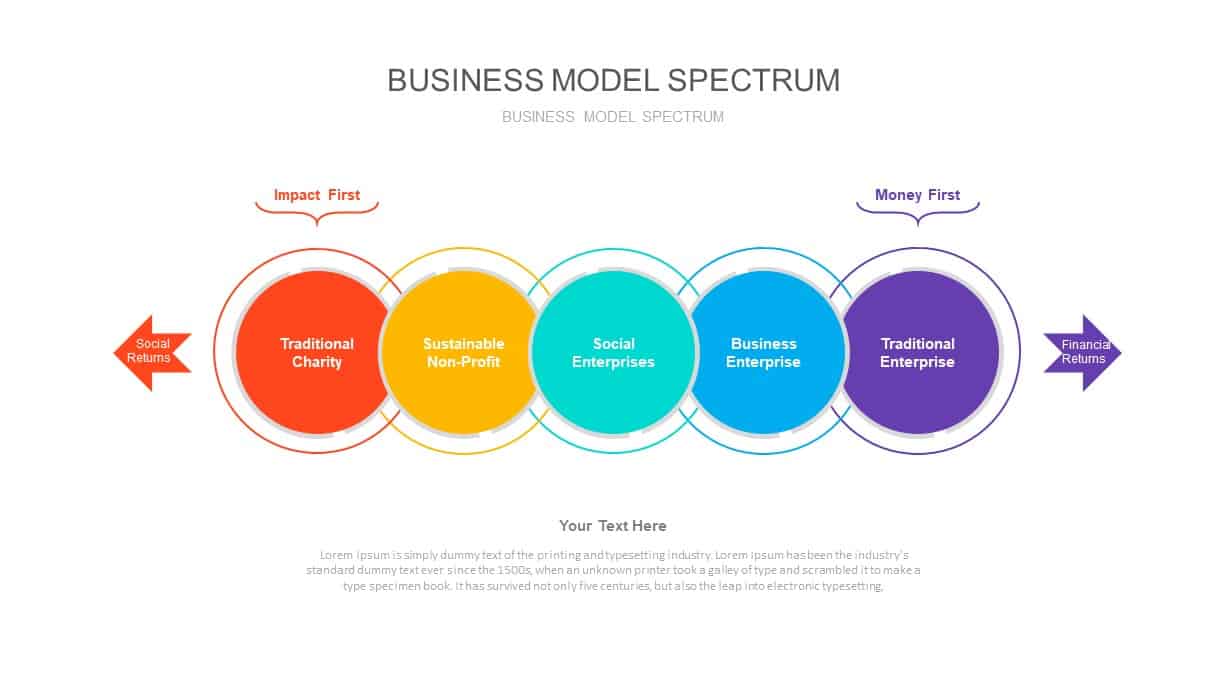
Business Model Spectrum Diagram Pack for PowerPoint & Google Slides
Business Models
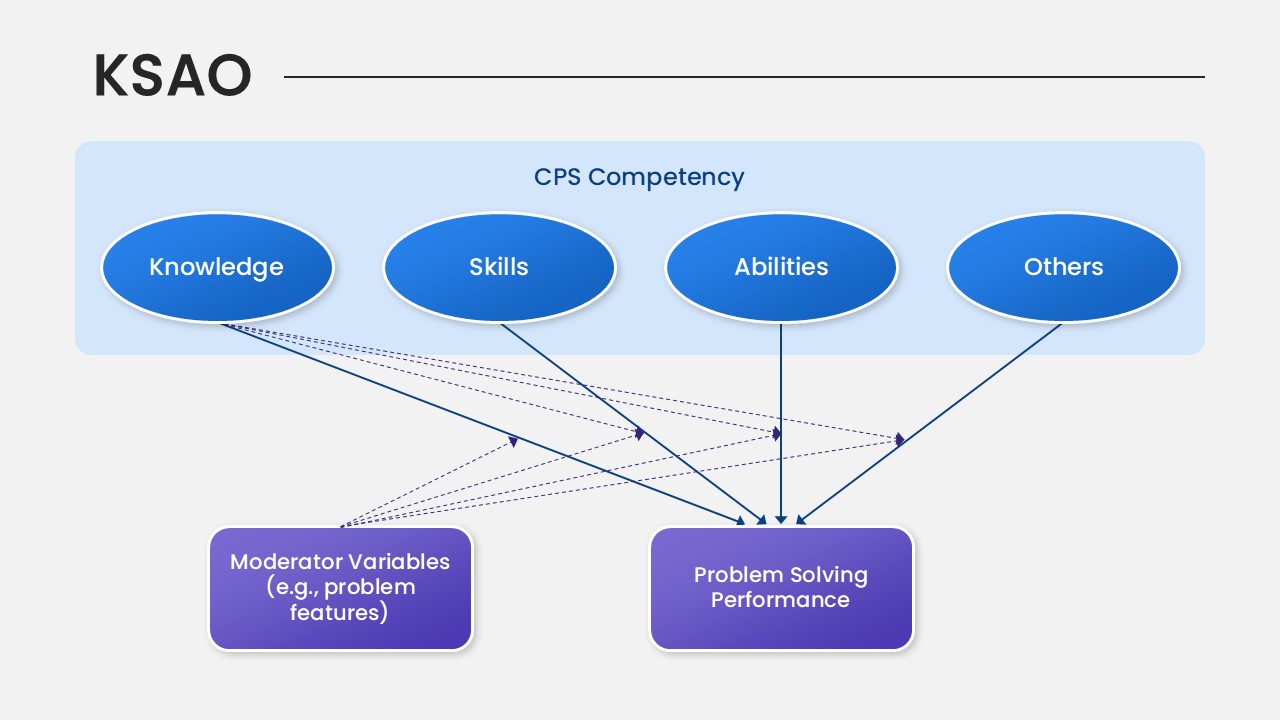
KSAO Model PowerPoint Template for PowerPoint & Google Slides
Business Strategy
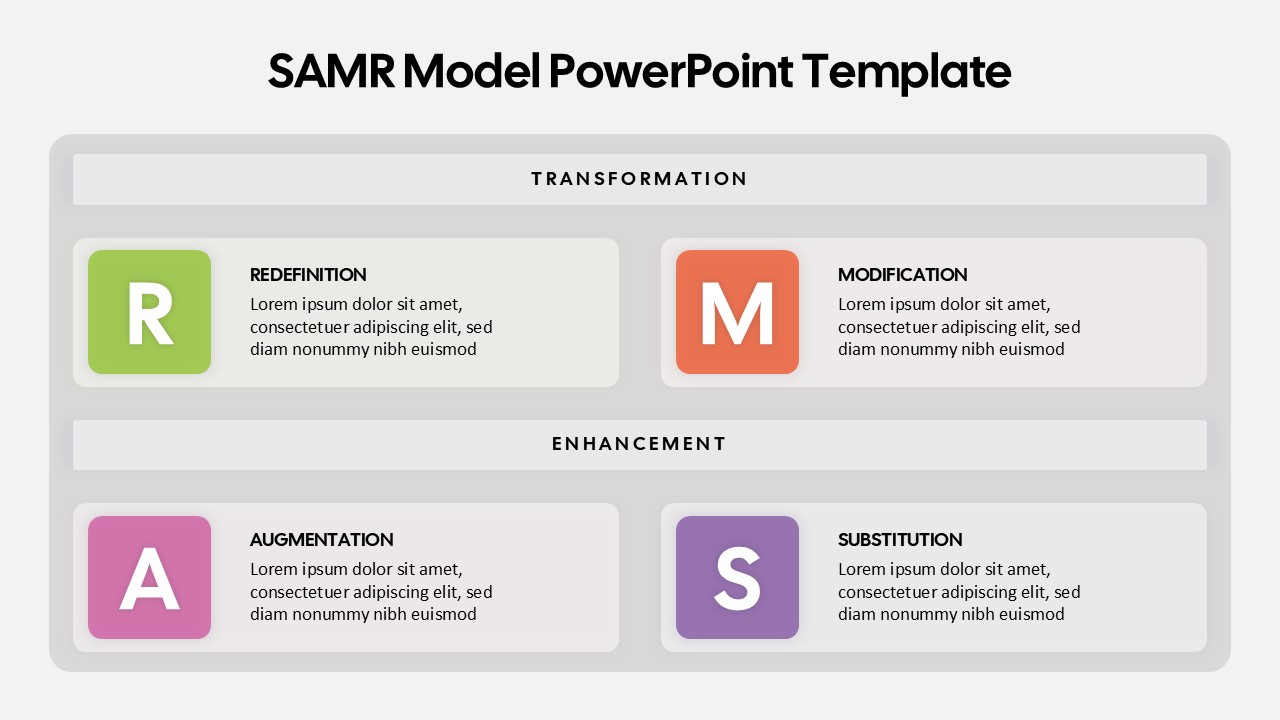
SAMR Model PowerPoint Template for PowerPoint & Google Slides
Business
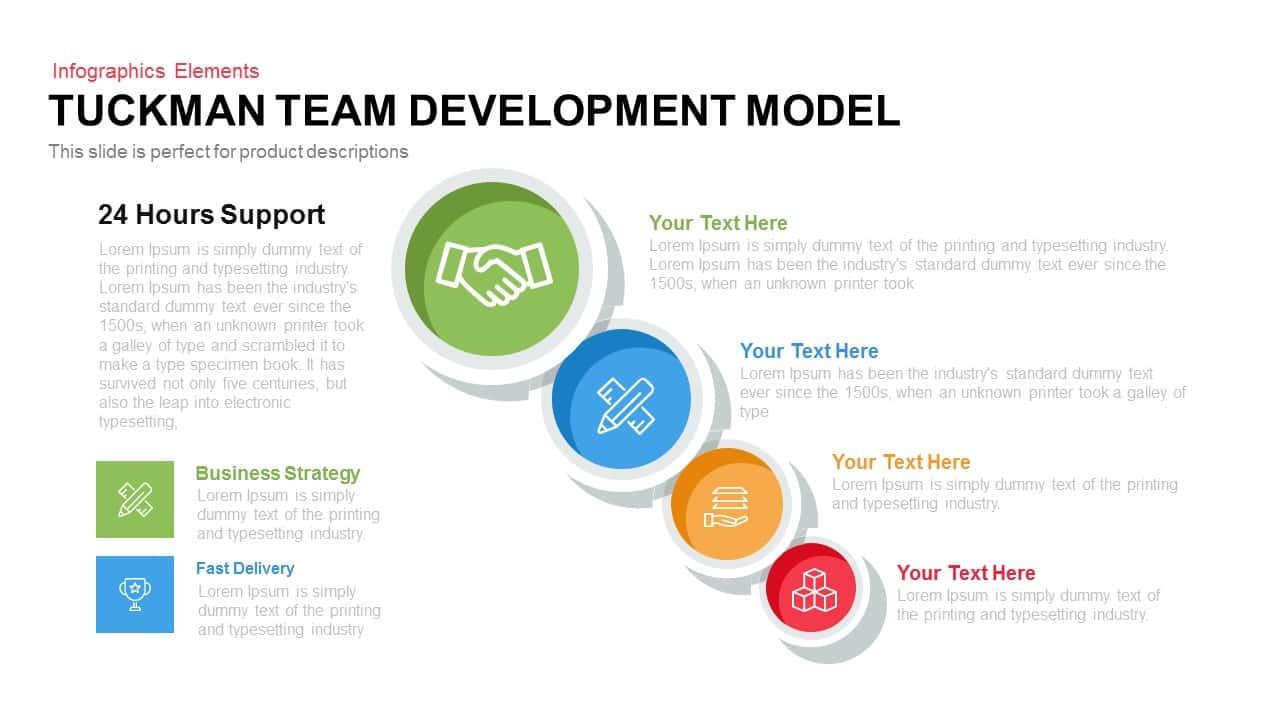
Tuckman Team Model Template for PowerPoint & Google Slides
Infographics
Ansoff Matrix Growth Strategy Model Template for PowerPoint & Google Slides
BCG
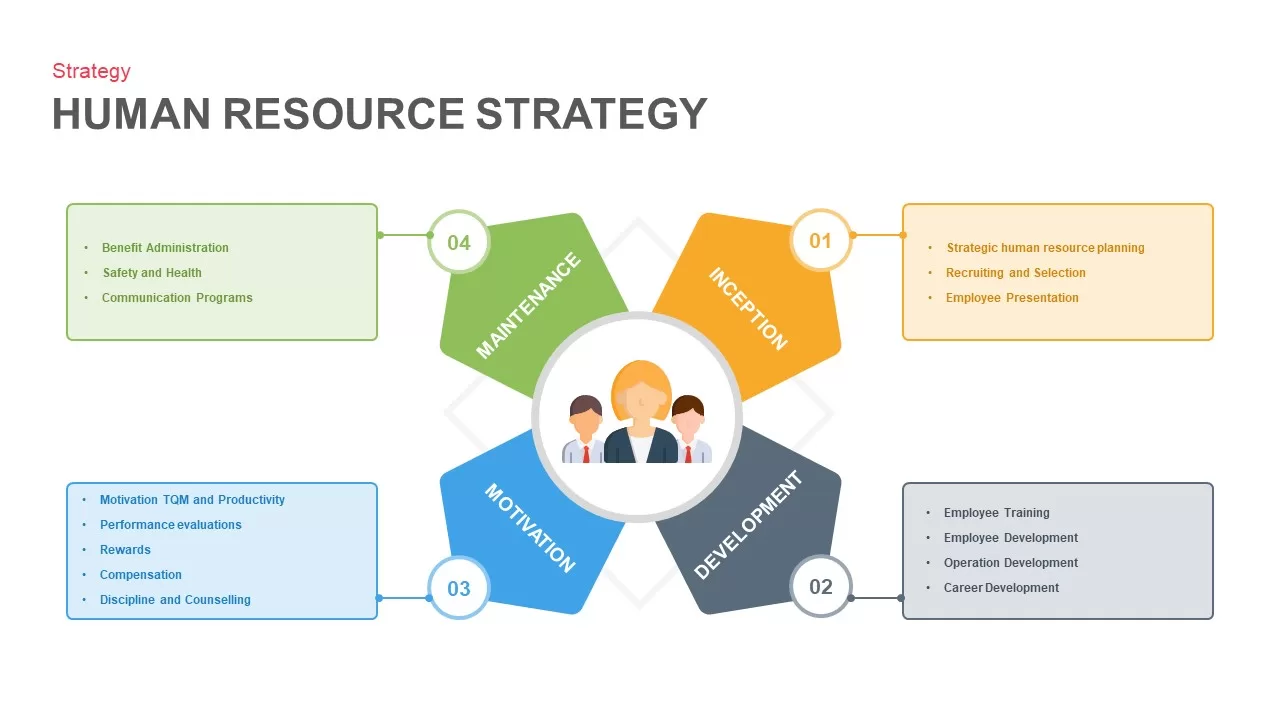
Human Resource Strategy Model Pack Template for PowerPoint & Google Slides
HR
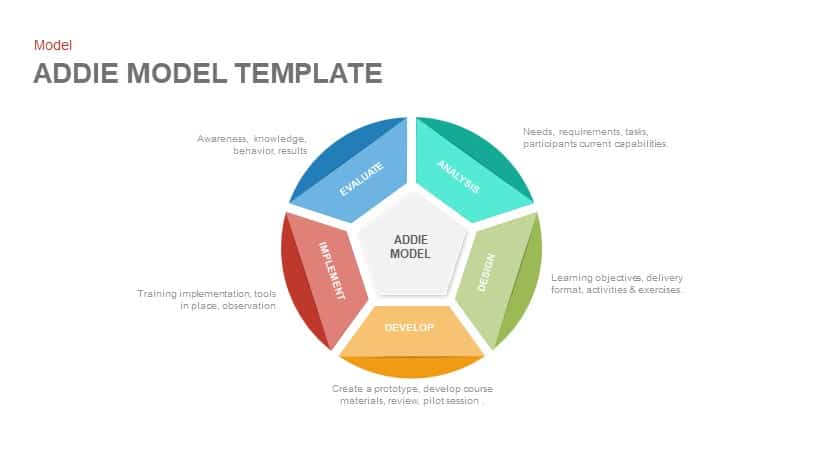
ADDIE Model Instructional Design Template for PowerPoint & Google Slides
Circular
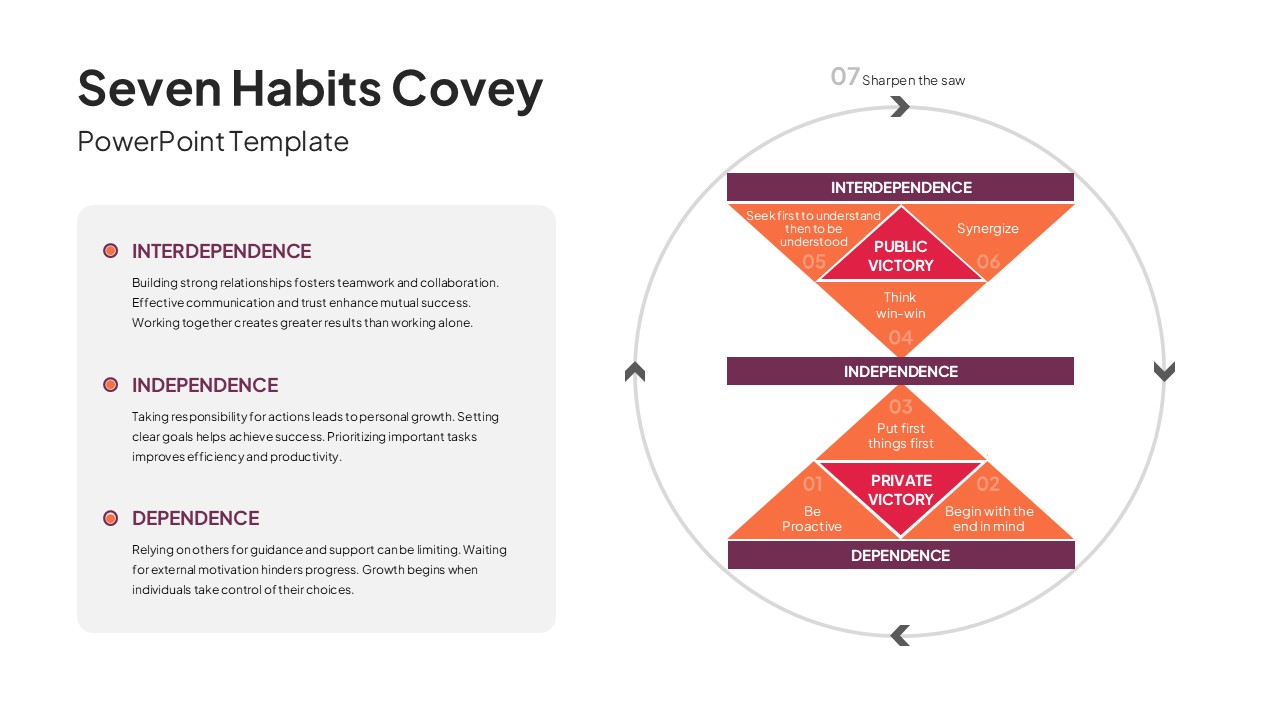
7 Habits of Highly Effective People Covey Model Template for PowerPoint & Google Slides
Leadership
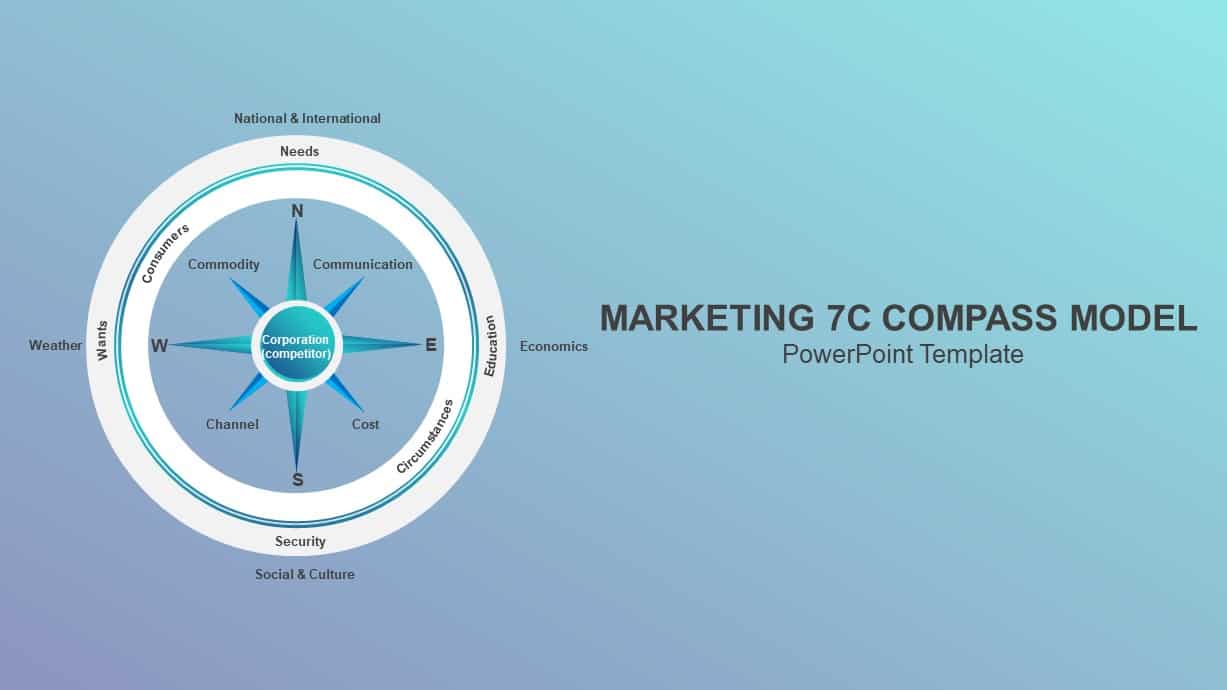
Marketing 7C Compass Model Infographic Template for PowerPoint & Google Slides
Circular
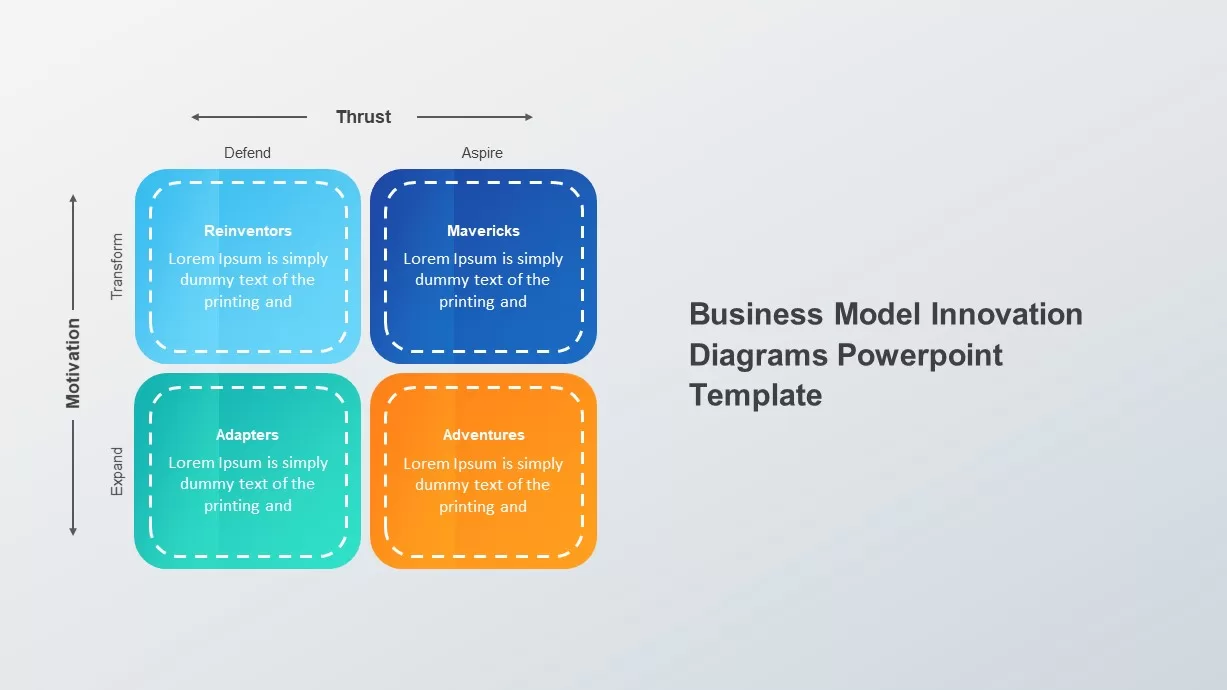
Business Model Innovation Diagrams template for PowerPoint & Google Slides
Process
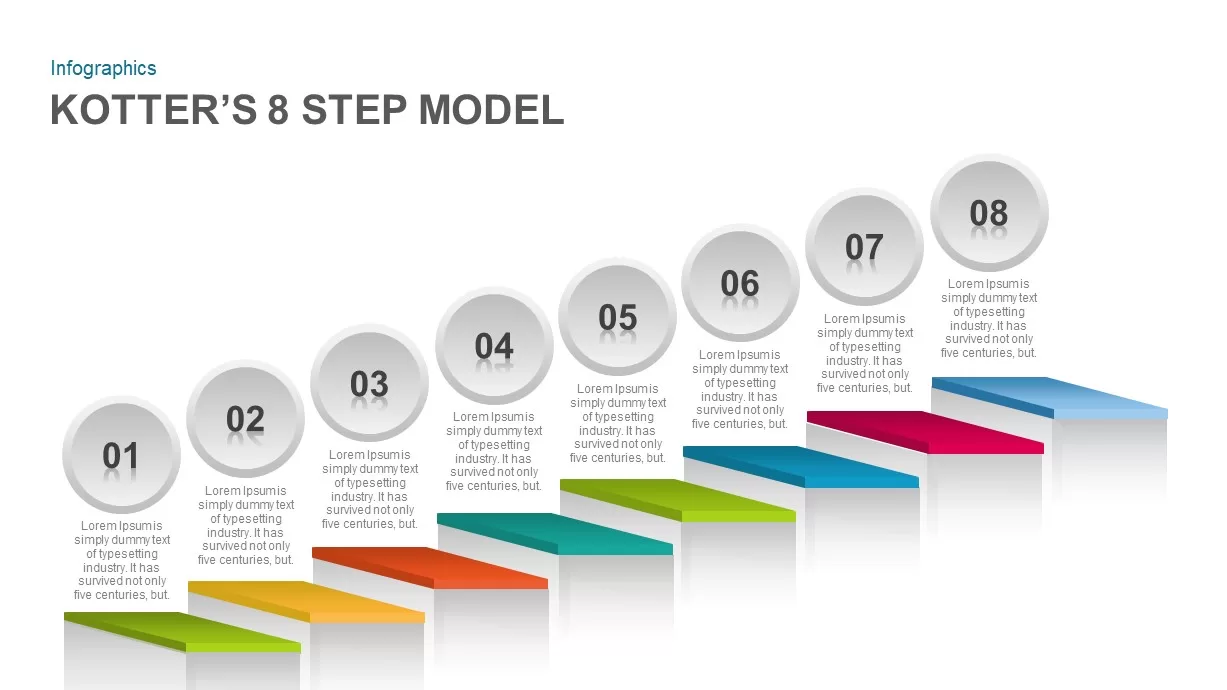
Kotter’s 8-Step Model Infographic Template for PowerPoint & Google Slides
Process
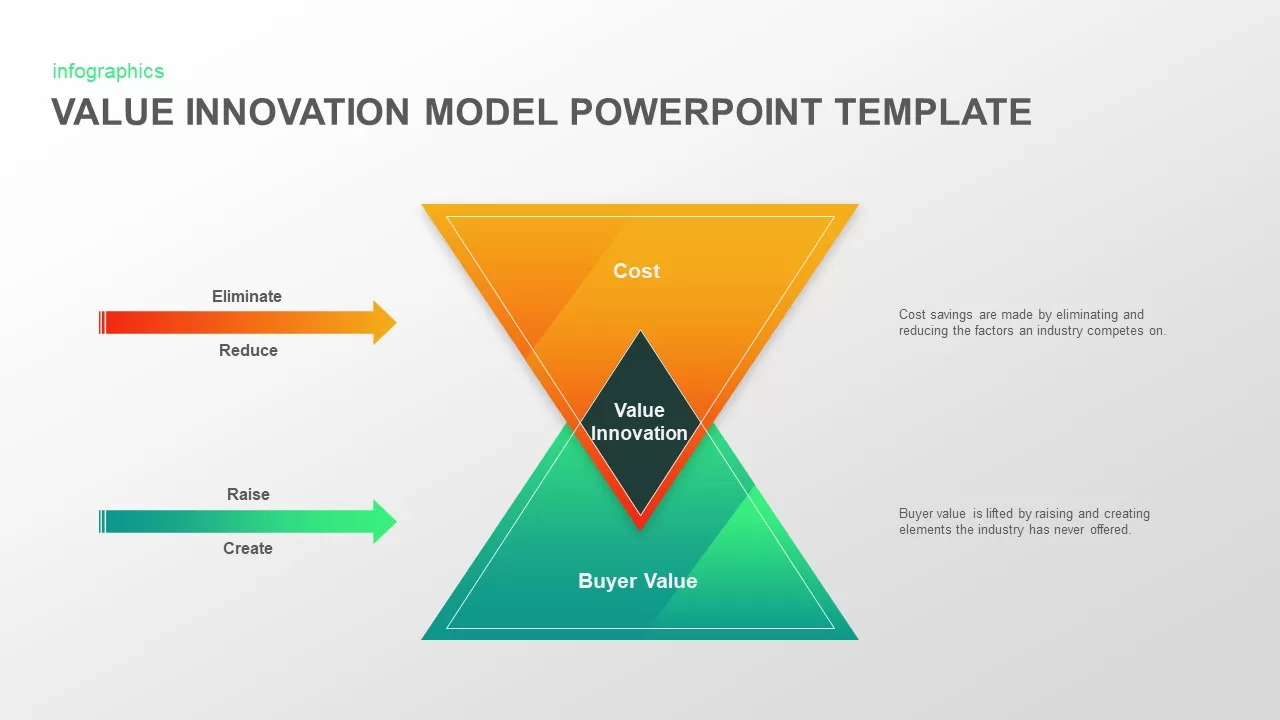
Value Innovation Model PowerPoint & Google Slides Template for Presentations
Business Proposal
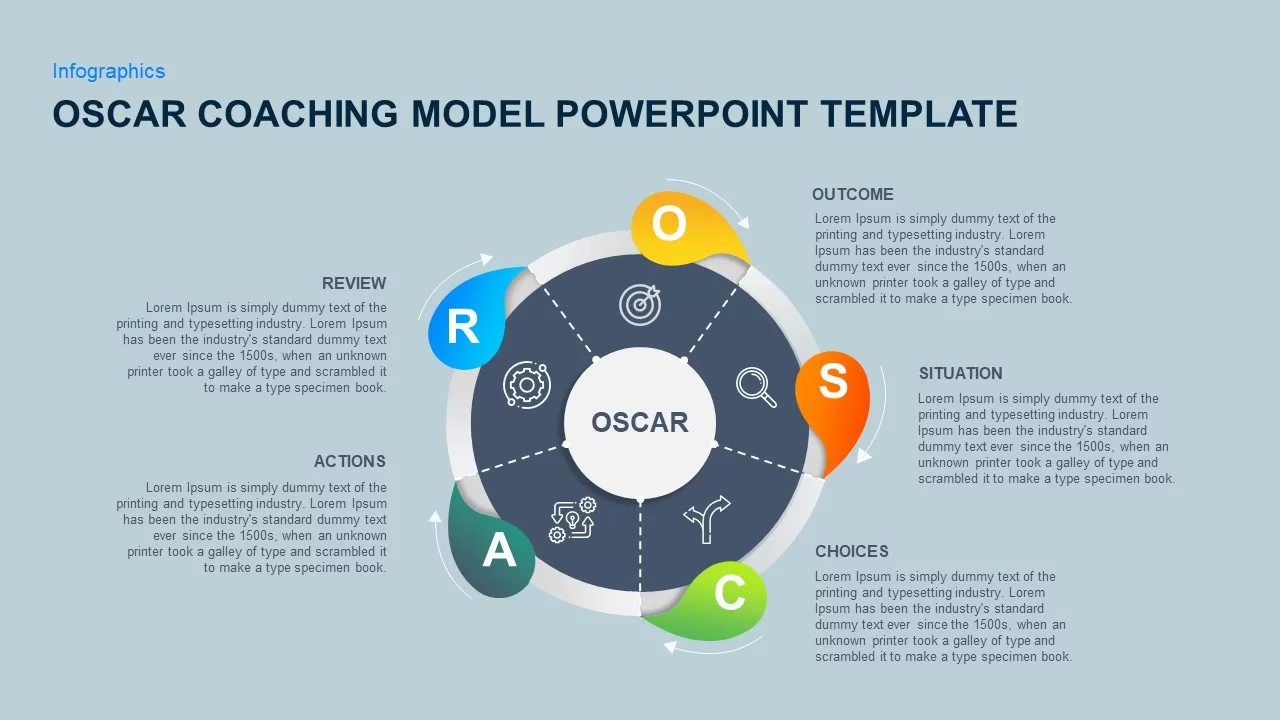
OSCAR Coaching Model Template for PowerPoint & Google Slides
Business Models
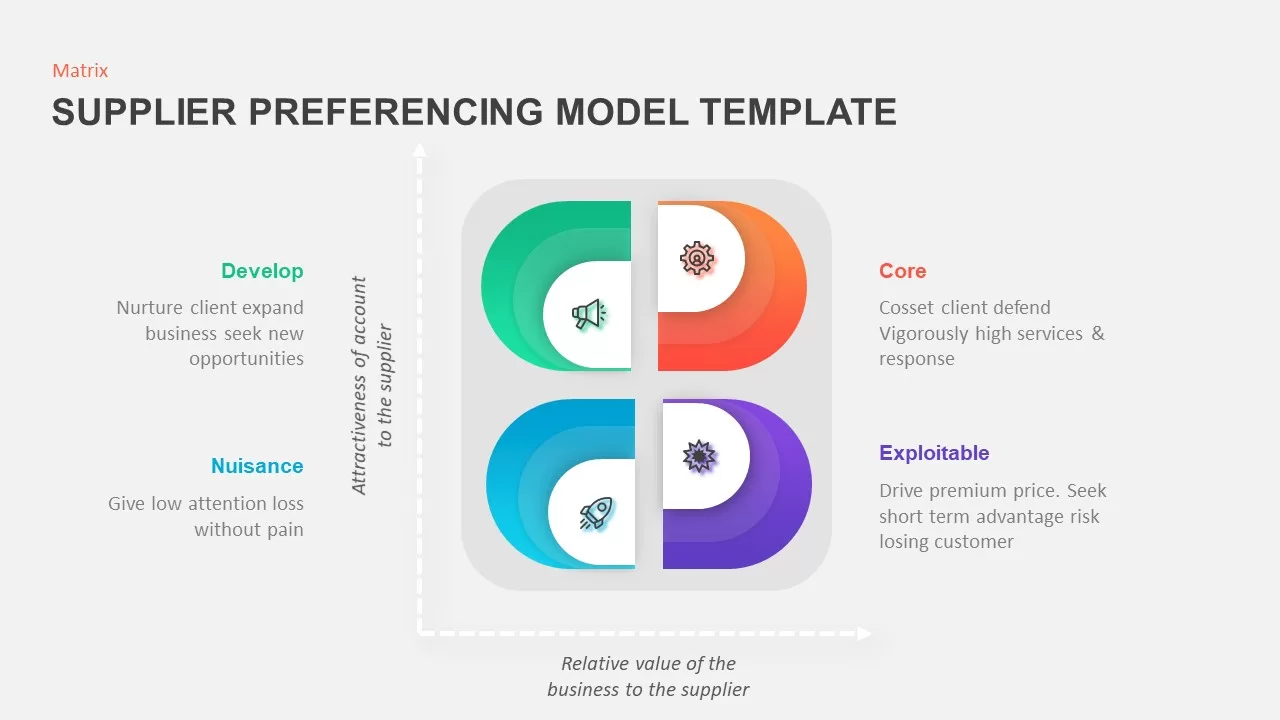
Supplier Preferencing Model Matrix Template for PowerPoint & Google Slides
Business Strategy
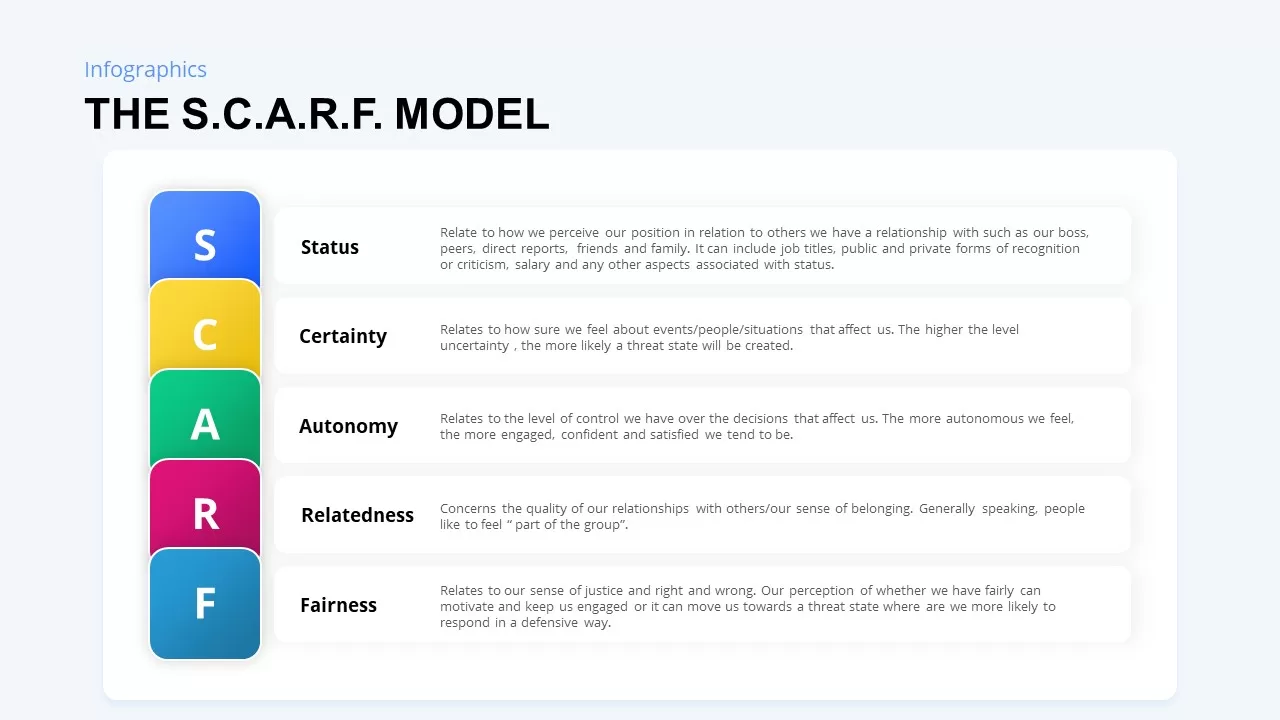
SCARF Model Social Threats & Rewards Template for PowerPoint & Google Slides
Business Strategy
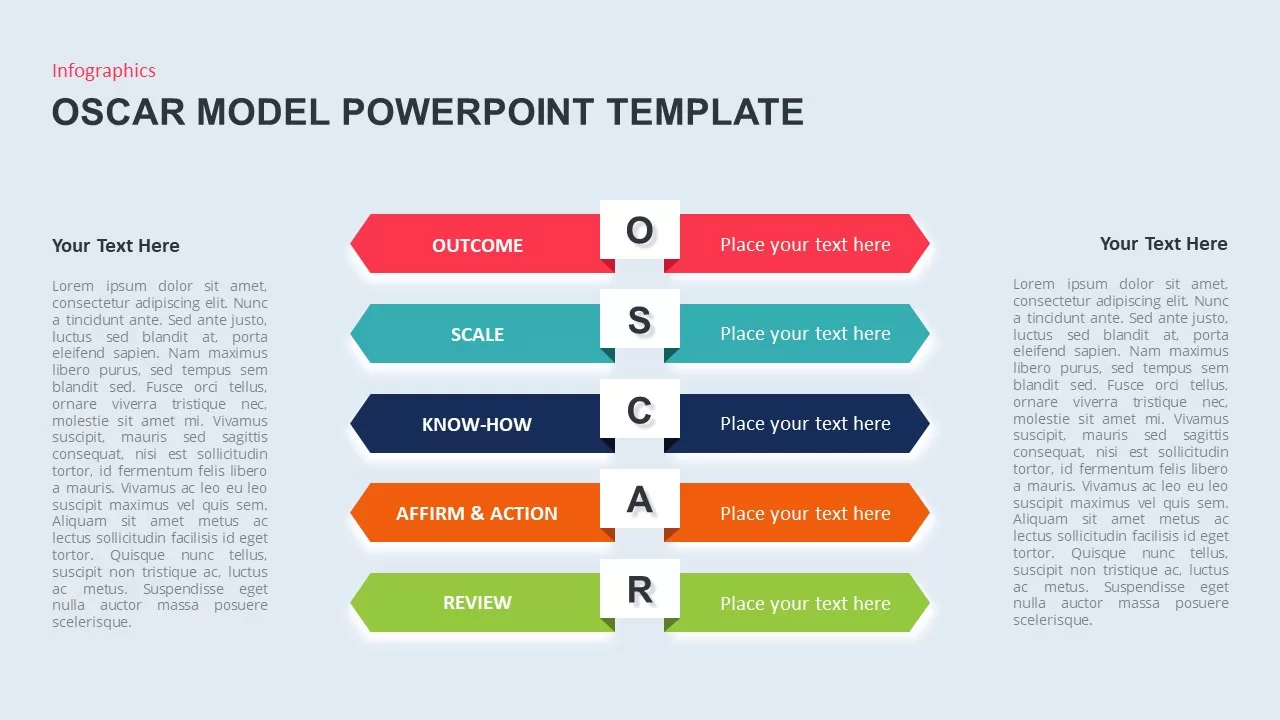
OSCAR Behavior Model Infographic Template for PowerPoint & Google Slides
HR
Demographic Transition Model Template for PowerPoint & Google Slides
Process
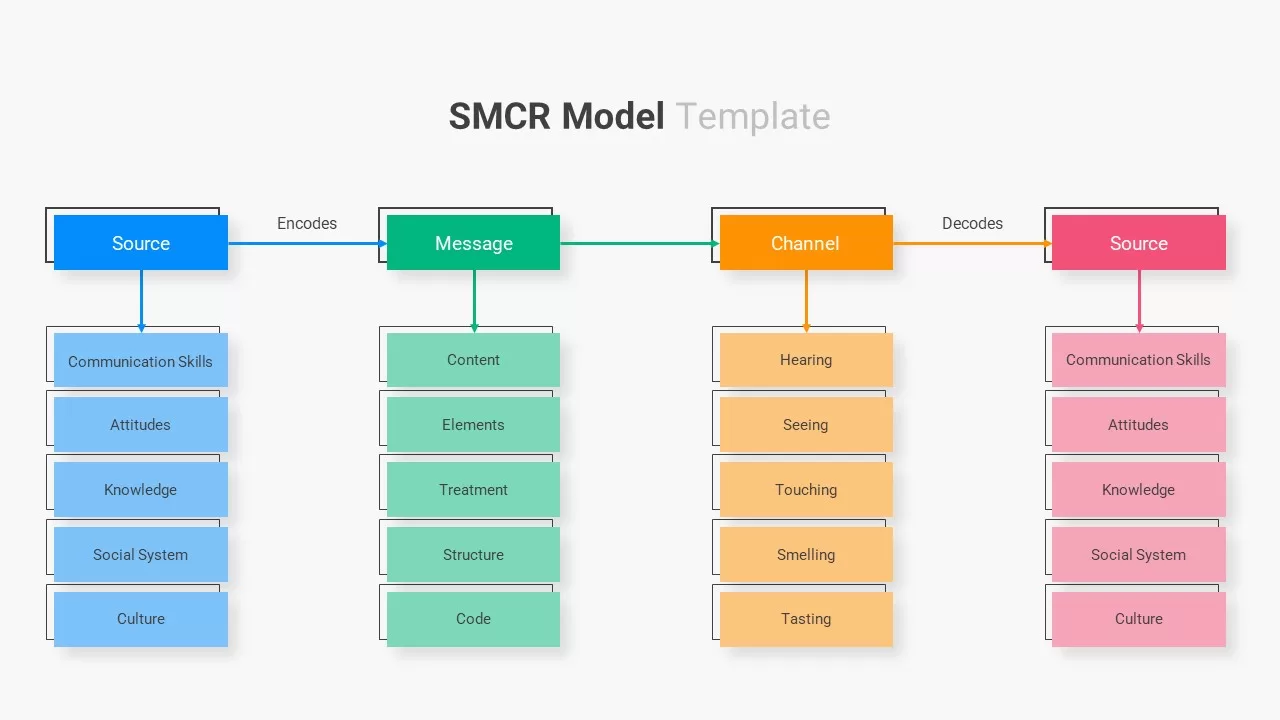
SMCR Model Template for PowerPoint & Google Slides
Infographics
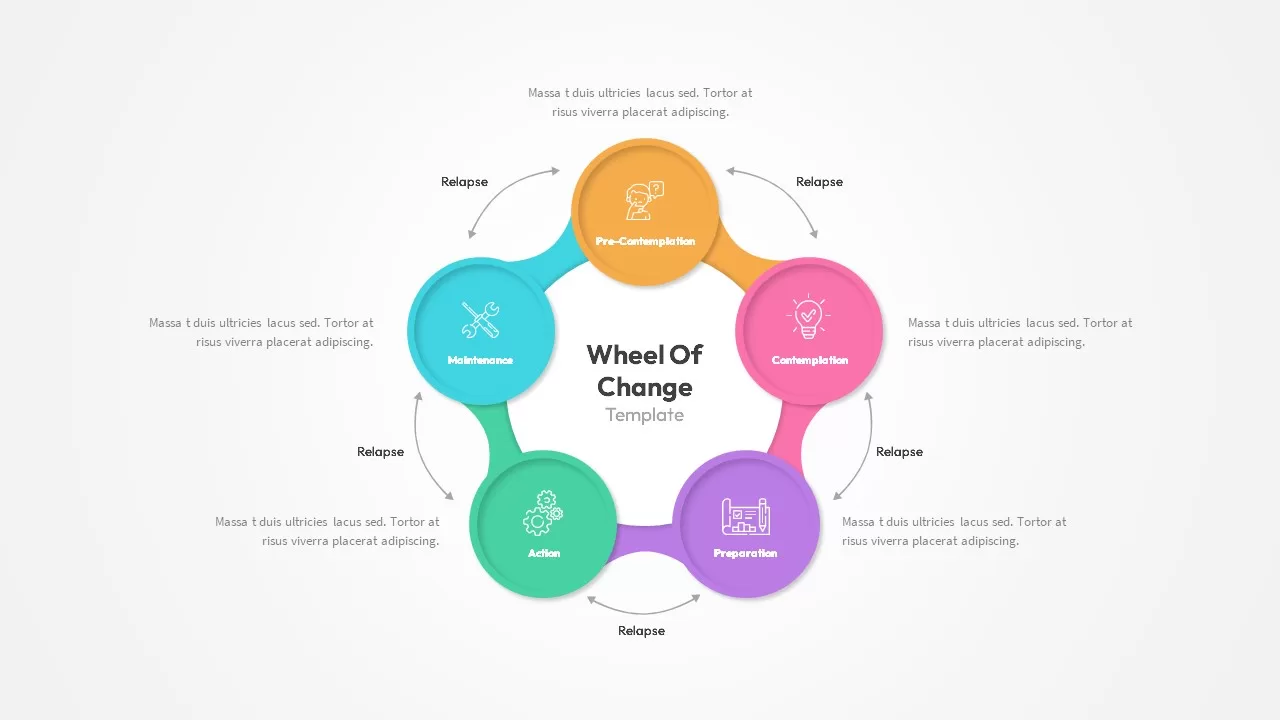
Wheel of Change Model template for PowerPoint & Google Slides
Business Strategy
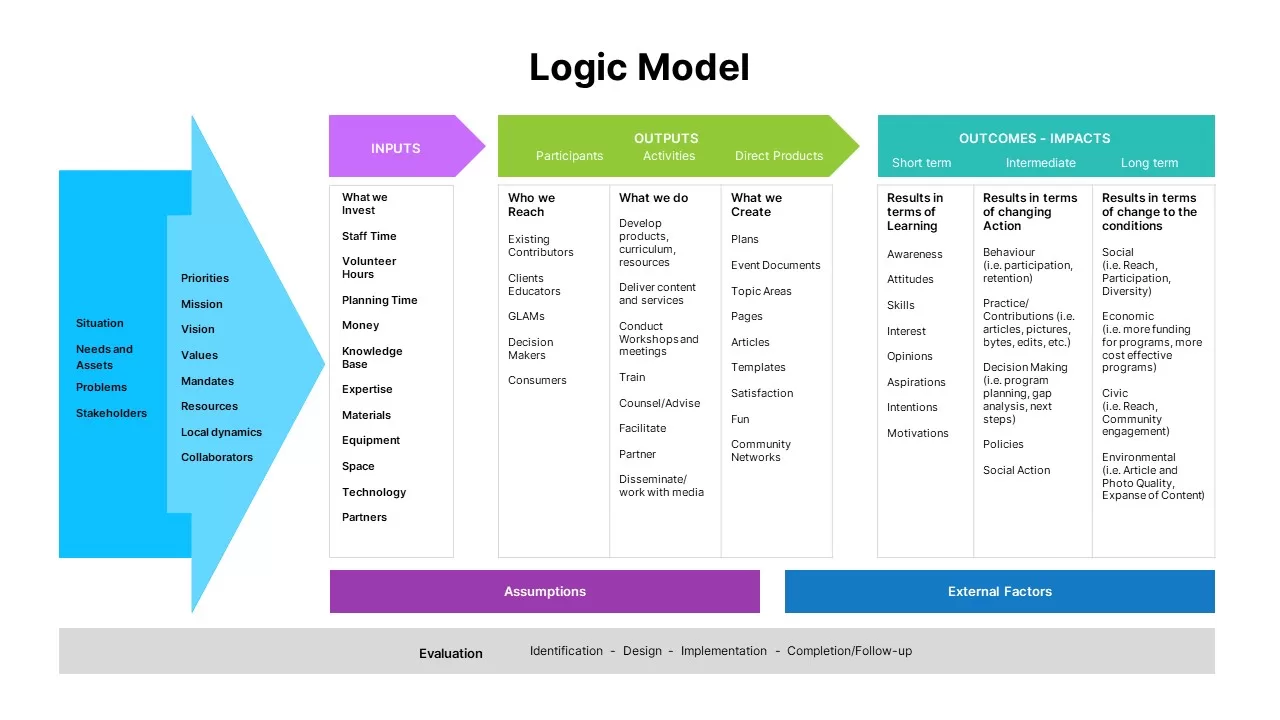
Logic Model template for PowerPoint & Google Slides
Infographics
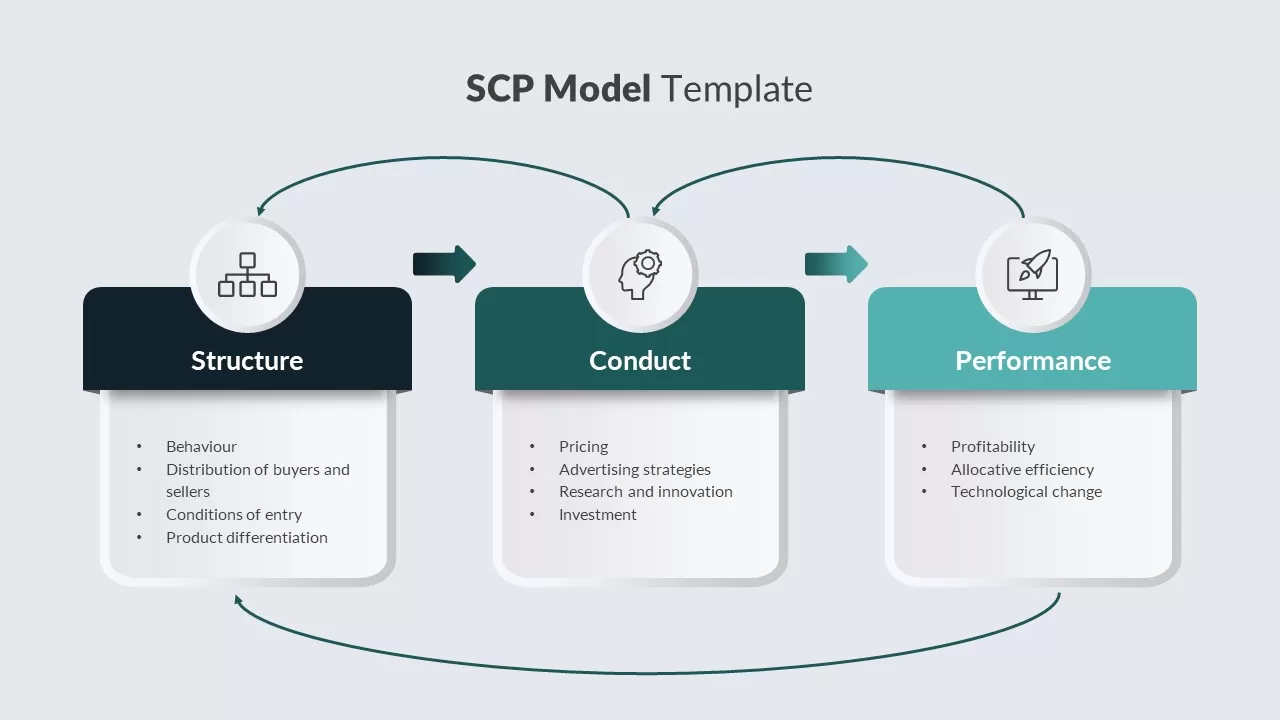
SCP Model Template for PowerPoint & Google Slides
Process
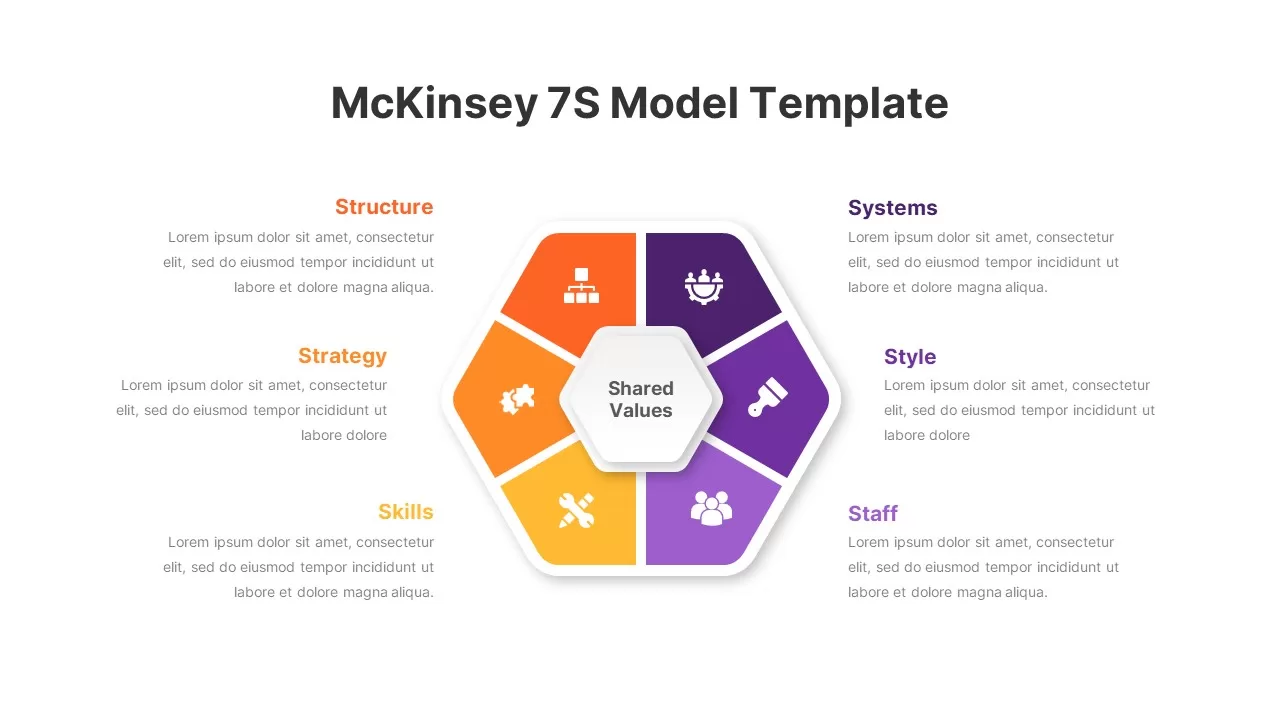
Hexagon 7S Strategic Alignment Model Template for PowerPoint & Google Slides
Business Strategy
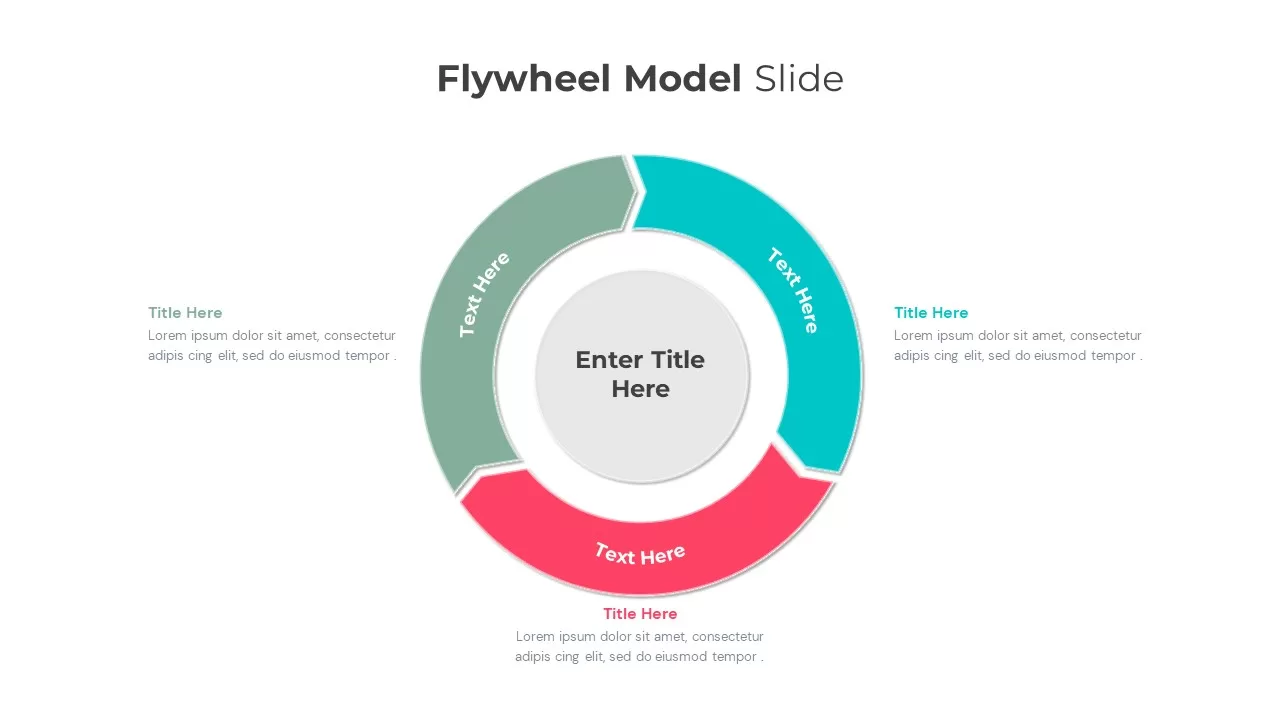
Flywheel Model Infographic Template for PowerPoint & Google Slides
Process
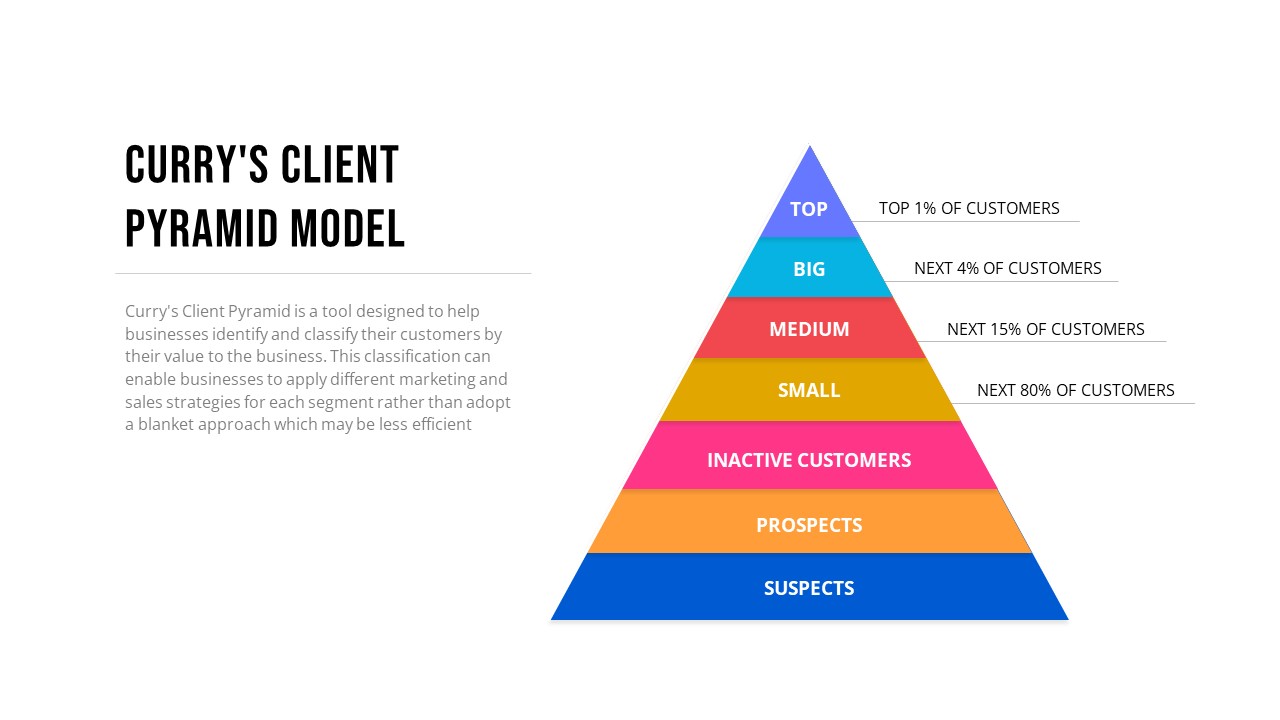
Curry’s Client Segmentation Pyramid Model Template for PowerPoint & Google Slides
Pyramid
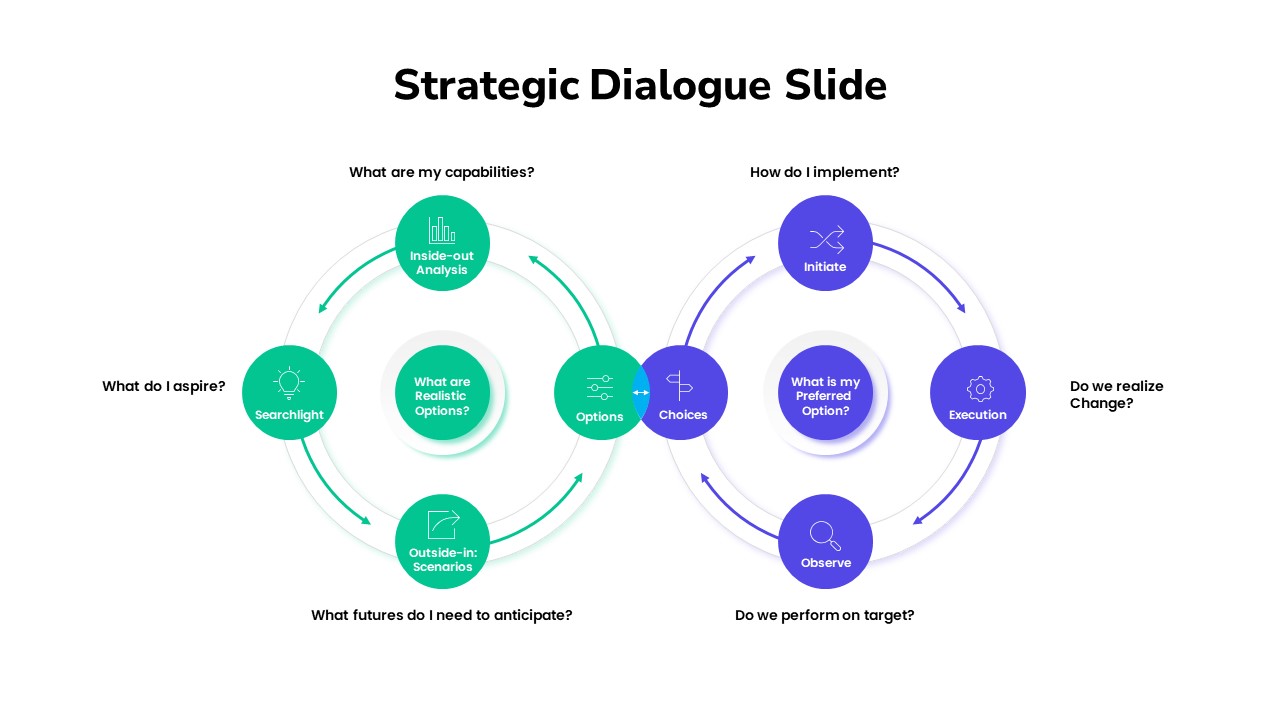
Strategic Dialogue Model Cycle Template for PowerPoint & Google Slides
Circular
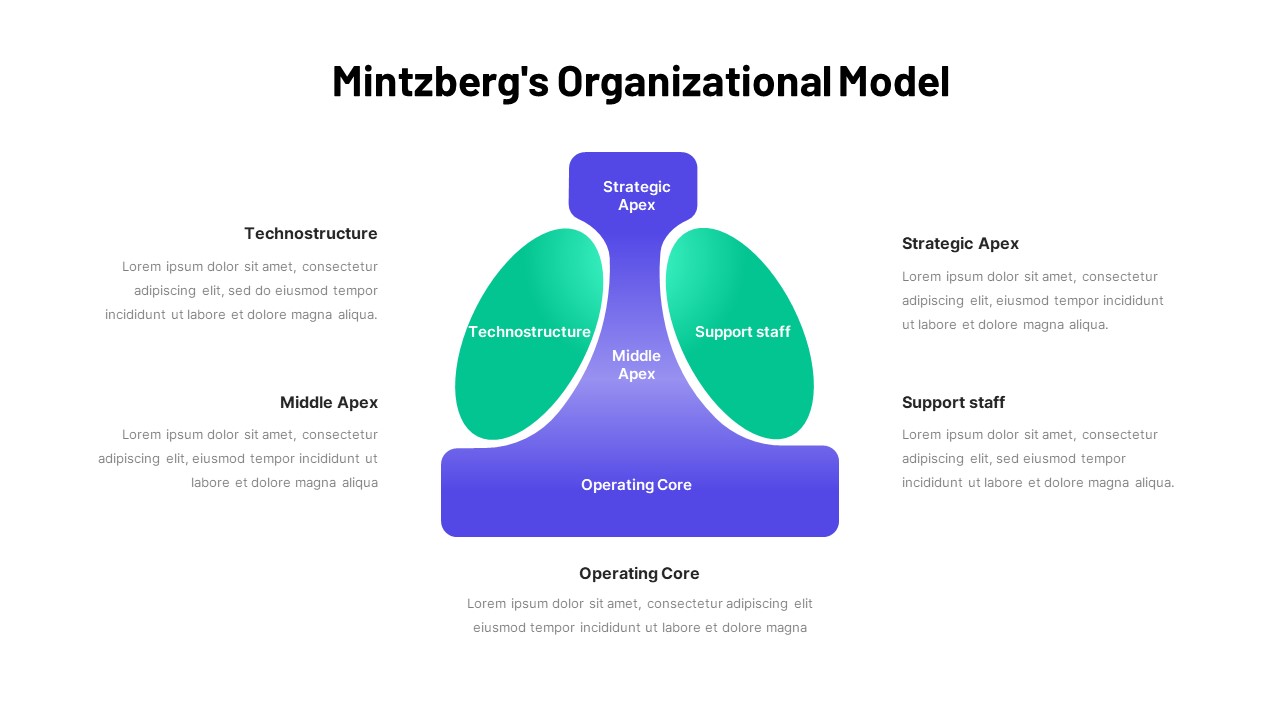
Mintzberg Organizational Model Gradient Template for PowerPoint & Google Slides
Business
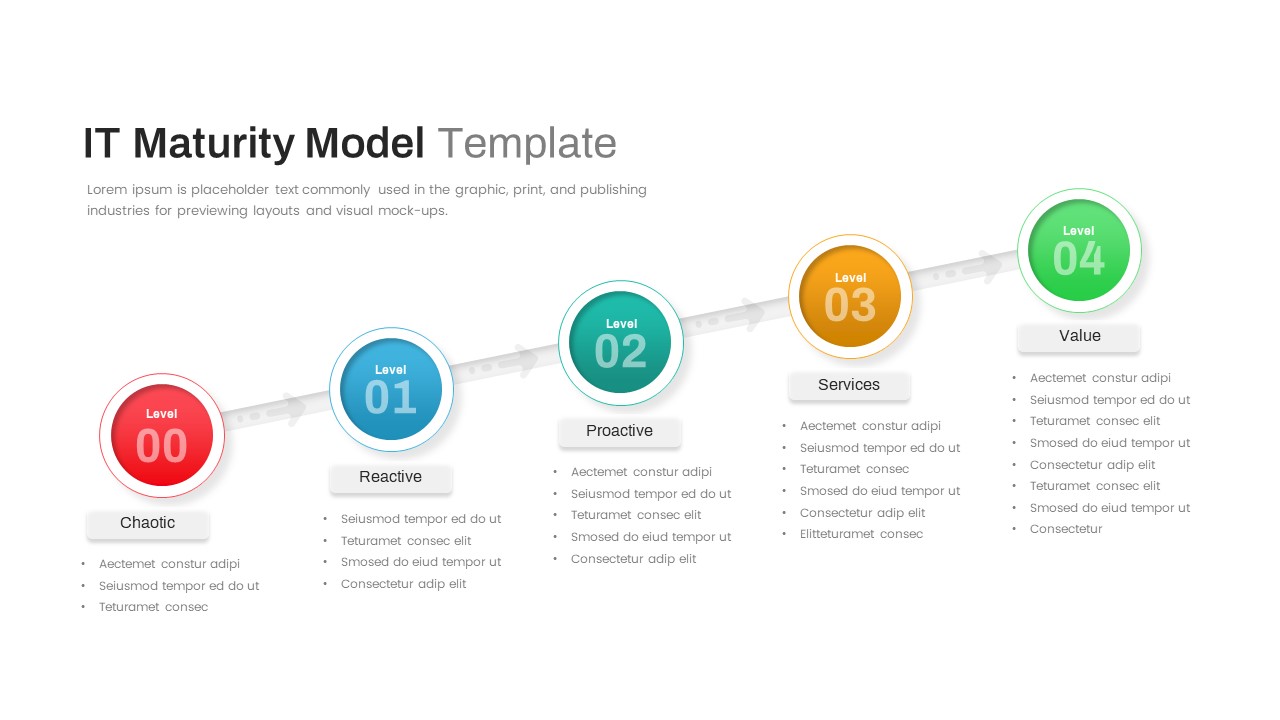
IT Maturity Model with Five Stages Template for PowerPoint & Google Slides
Timeline
Layered Data Governance Maturity Model Template for PowerPoint & Google Slides
Process
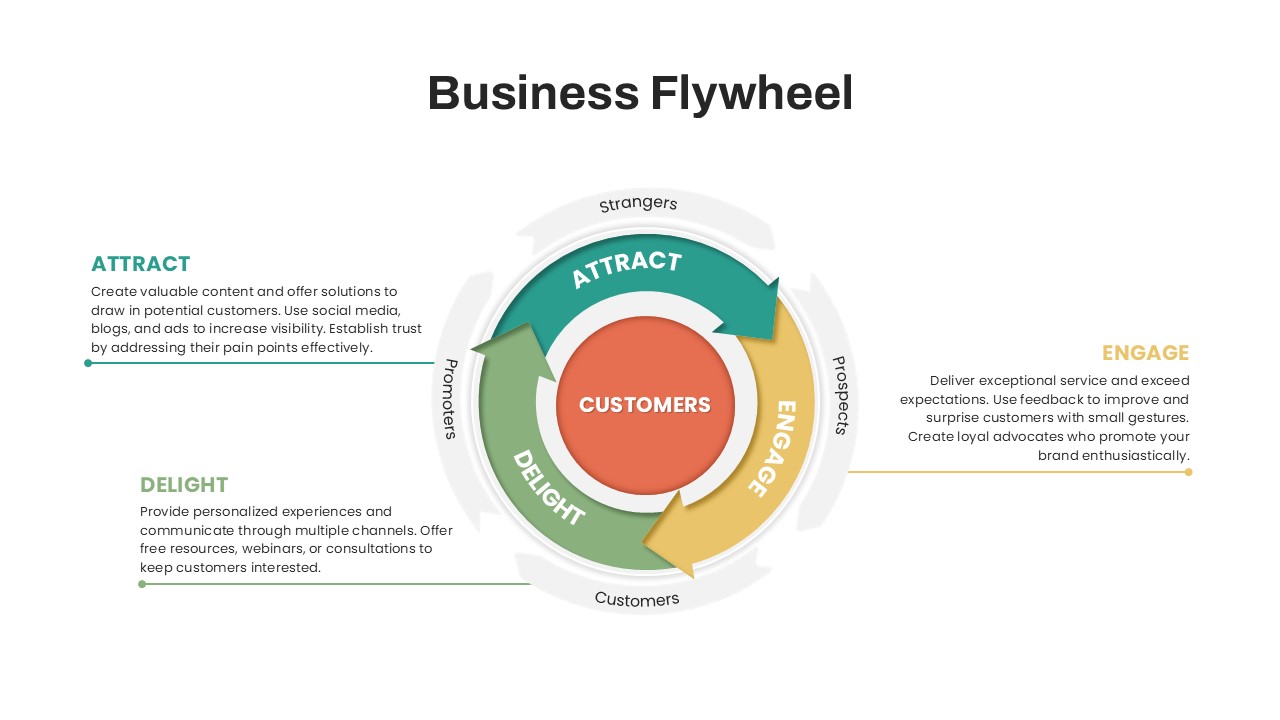
Business Flywheel Lifecycle Model Template for PowerPoint & Google Slides
Circular
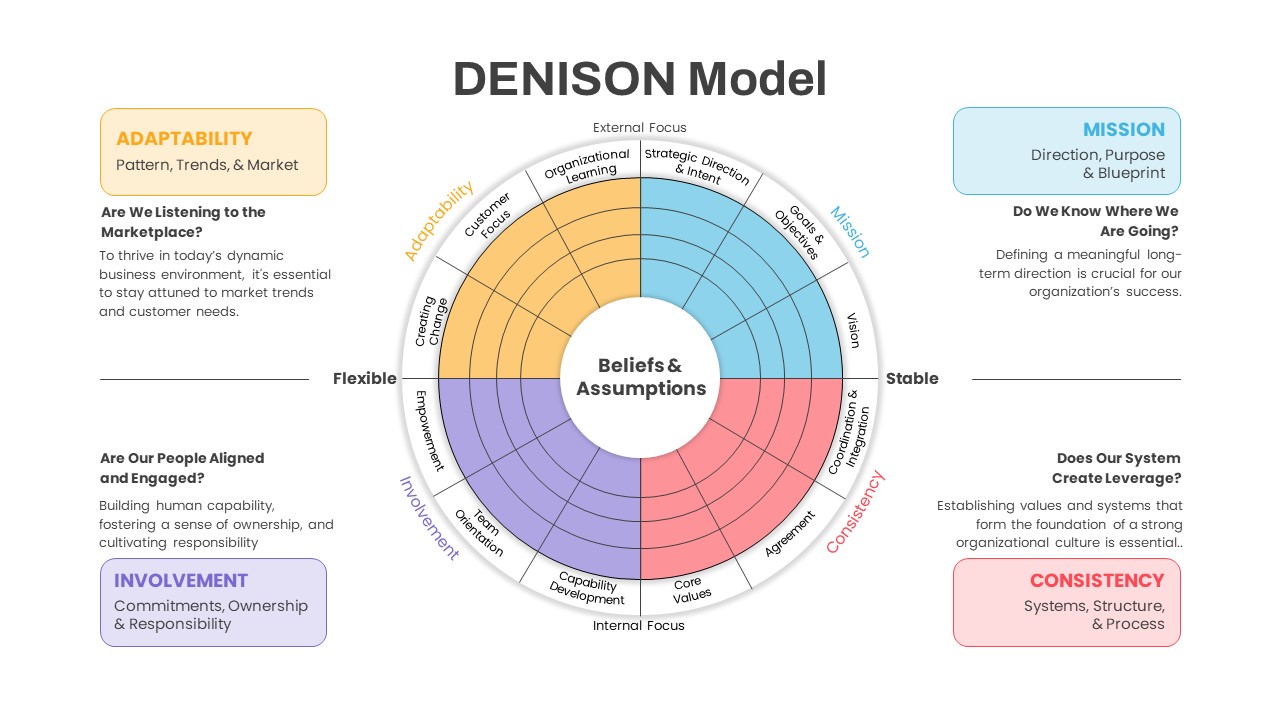
Denison Culture Model Wheel template for PowerPoint & Google Slides
Leadership
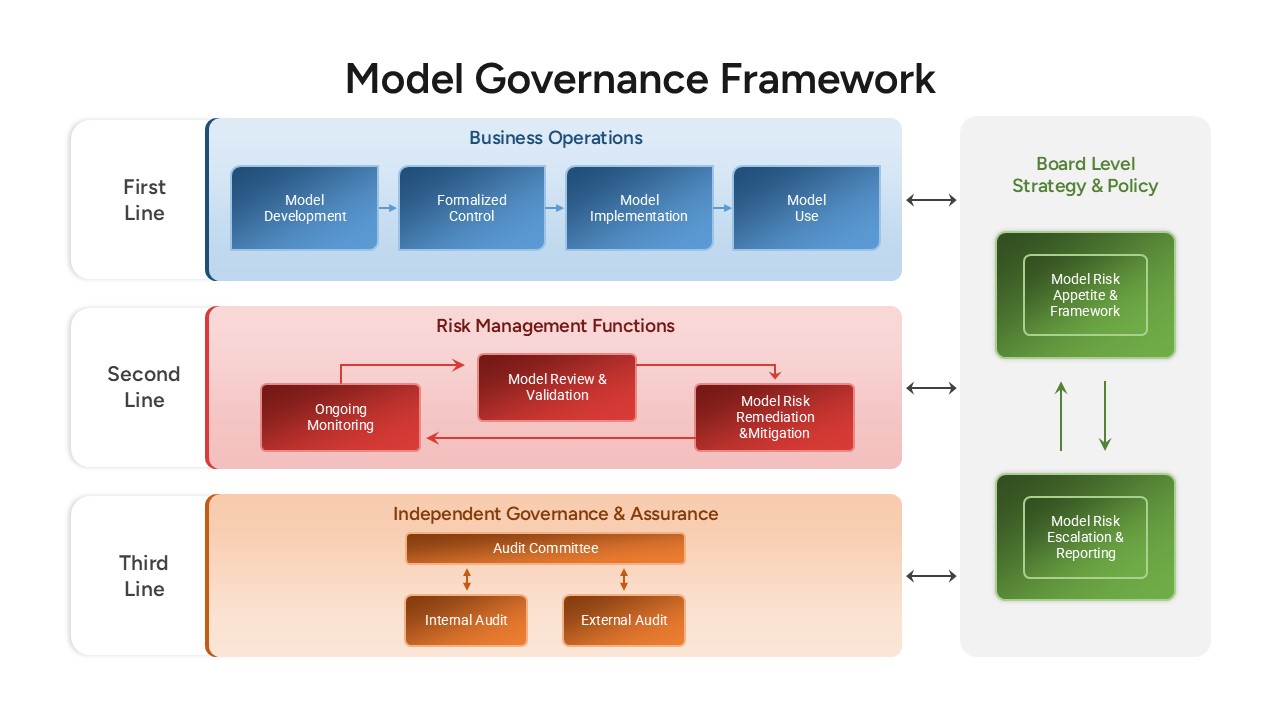
Model Governance Framework Template for PowerPoint & Google Slides
Risk Management
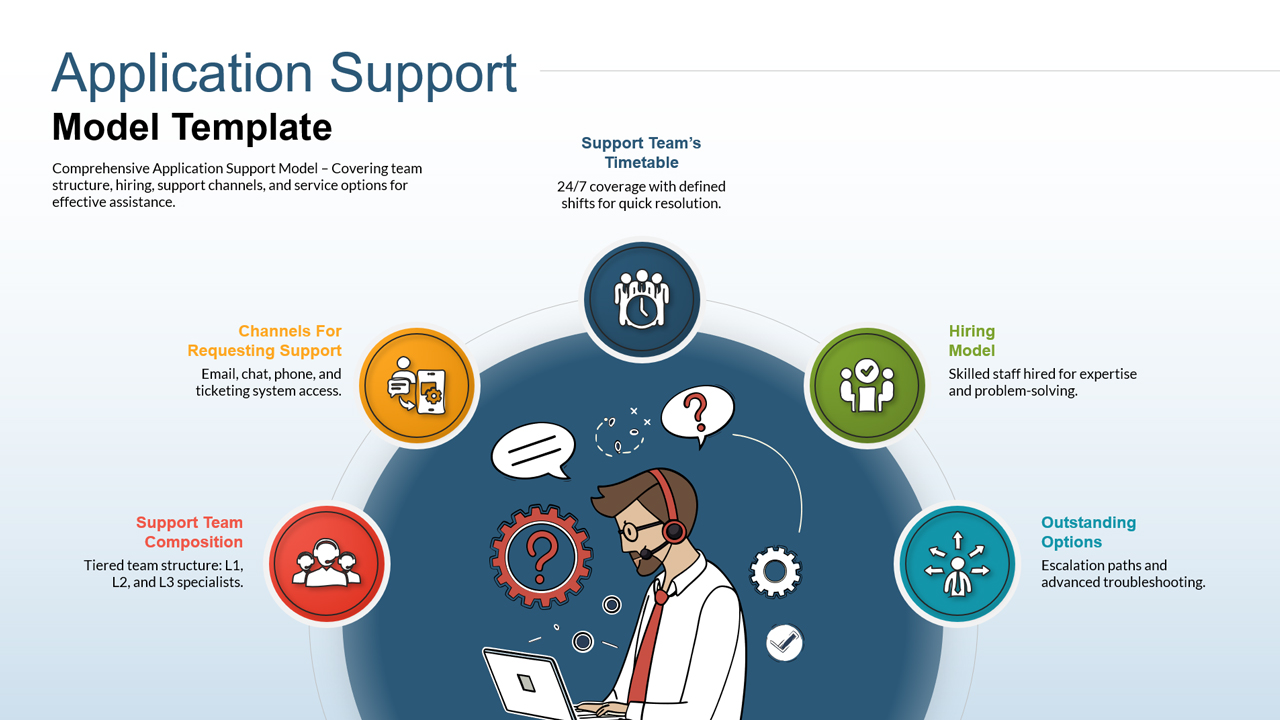
Application Support Operating Model Framework Slide Template for PowerPoint & Google Slides
Information Technology