S-Curve Progression Framework Diagram Template for PowerPoint & Google Slides

Description
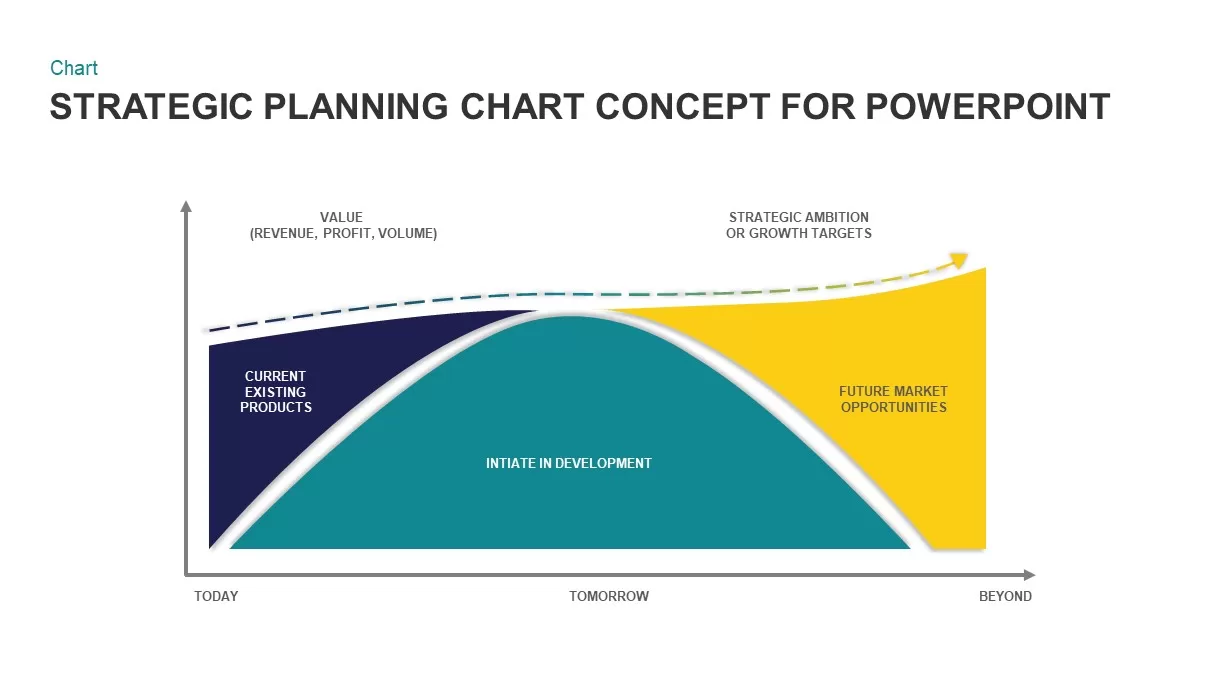
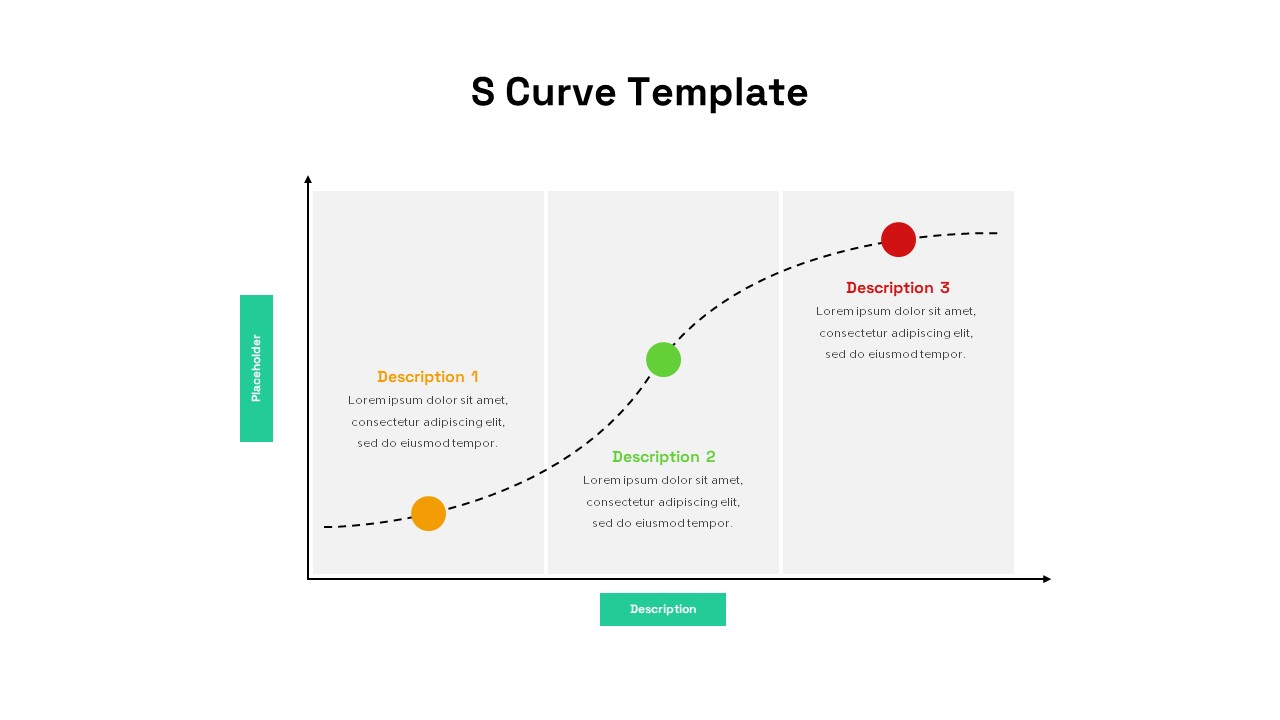
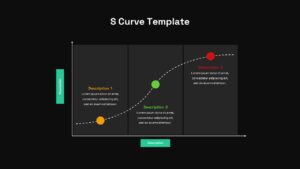
Visualize growth and adoption over time with this versatile S-Curve diagram slide. The template features a bold S-shaped dotted trajectory plotted across a three-stage backdrop with subtle gray vertical partitions, highlighting each phase with vibrant colored nodes (yellow, green, red) and corresponding text blocks. A teal vertical placeholder tab labels the Y-axis, while a horizontal placeholder at the bottom anchors the X-axis, providing clear reference points for customization.
Master slide integration ensures you can easily swap node colors, adjust the S-curve style, and modify axis labels in PowerPoint and Google Slides. Each node supports icon or text placeholder replacements, and the gridlines and axes can be hidden or styled to match brand guidelines. Grouped objects allow for smooth animations: reveal phases sequentially to guide audience attention through introduction, growth, and maturity stages.
Optimized for strategic roadmaps, this slide accelerates decision-making during executive reviews, investment pitches, and project kick-offs. Use it to map product lifecycles, illustrate technology adoption curves, or track sales and revenue trajectories. The three-phase design encourages clear segmentation of data, while the clean white background and minimalist axes maintain focus on content.
Extend the template by duplicating the canvas to include additional phases or by integrating KPI callouts, timeline markers, or risk thresholds. Resize the diagram for print-ready reports or scale up for large-screen presentations without losing resolution. The intuitive layout reduces design overhead, allowing teams to concentrate on insights rather than formatting.
Who is it for
Business analysts, project managers, marketing strategists, product managers, and strategic consultants will find this S-Curve diagram invaluable for mapping growth trajectories, adoption trends, and milestone planning in PowerPoint or Google Slides.
Other Uses
Beyond growth modeling, repurpose this slide to illustrate sales pipeline stages, technology adoption lifecycle, project milestone timelines, product maturity curves, or process improvement roadmaps. Customize axis labels and node sets to support risk assessments, capacity planning, and performance benchmarking across any industry.
Login to download this file

Item ID
SB03272
Related Templates

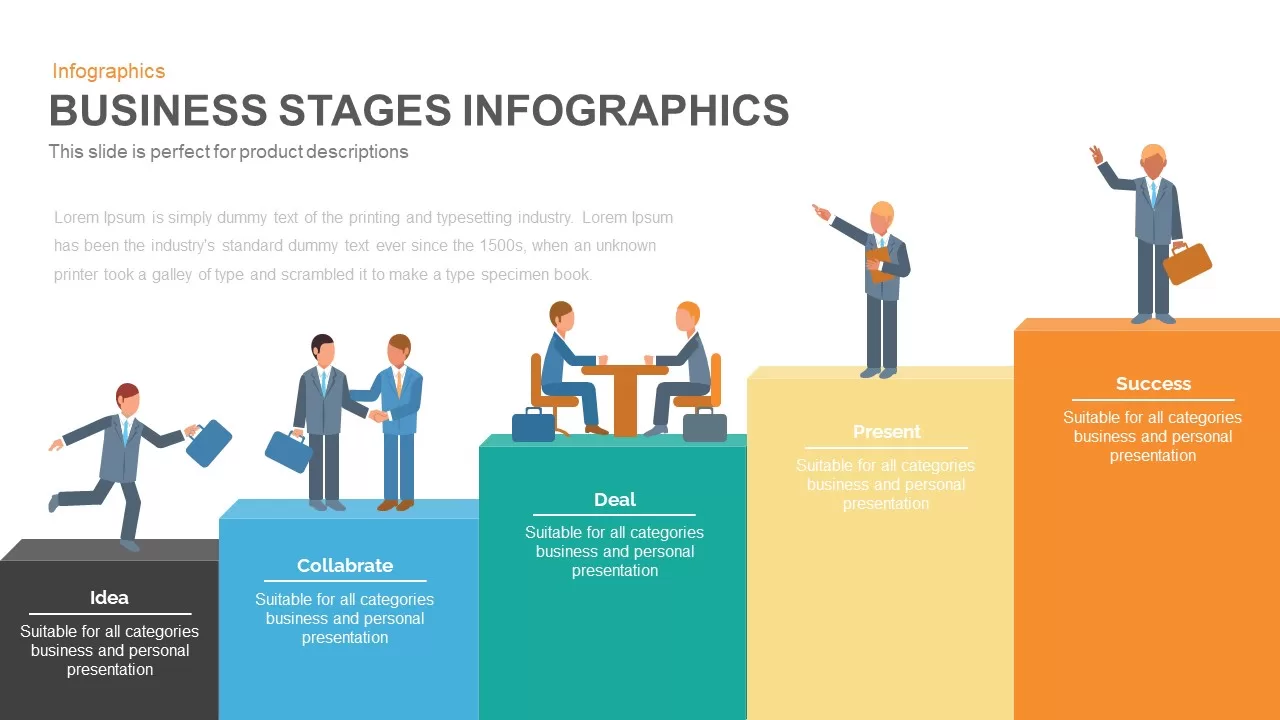
Business Stages Progression Infographic template for PowerPoint & Google Slides
Process
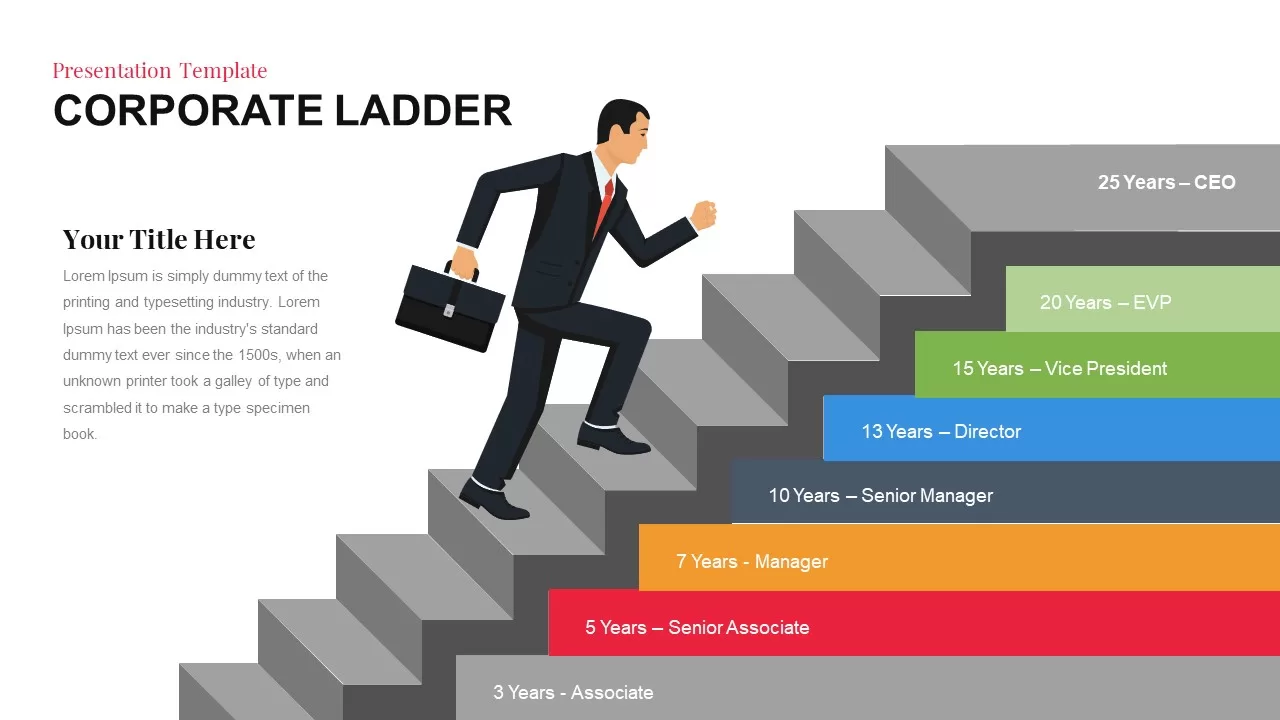
Corporate Ladder Career Progression Template for PowerPoint & Google Slides
Timeline
Curved Arrow Progression template for PowerPoint & Google Slides
Process
Progression Track Milestone Table Template for PowerPoint & Google Slides
Project Status
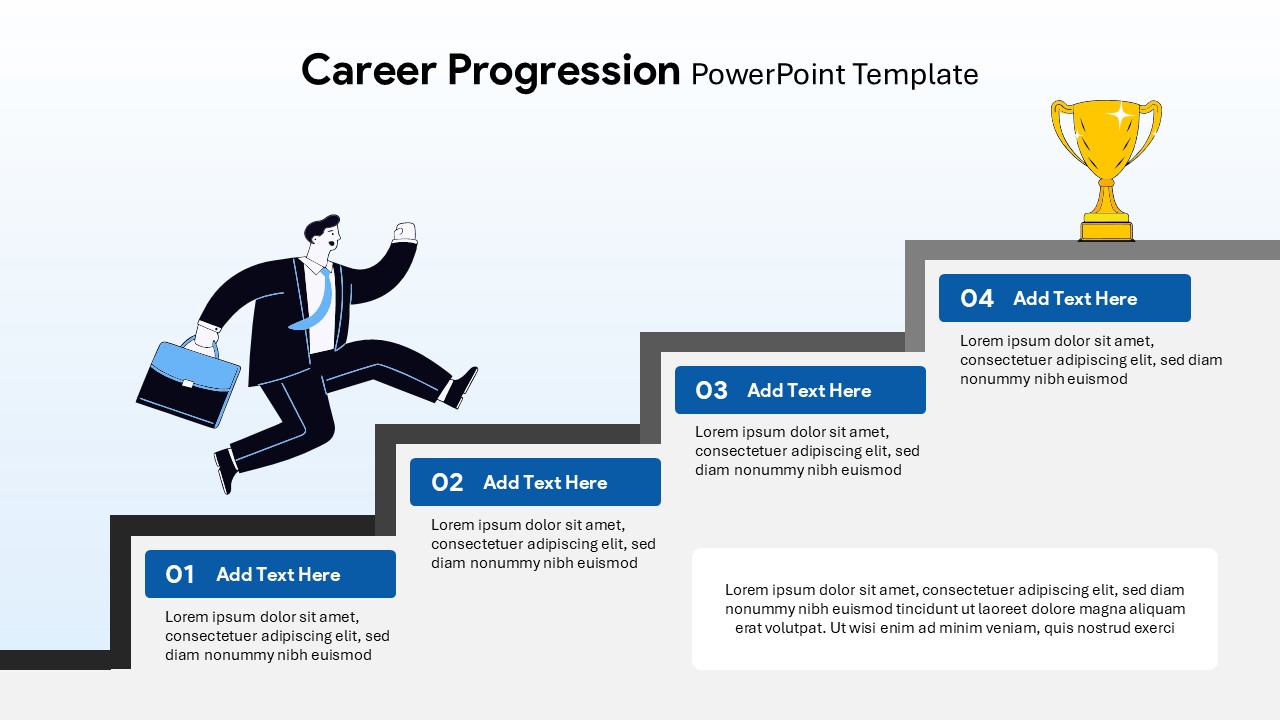
Career Progression Steps Template for PowerPoint & Google Slides
Employee Performance
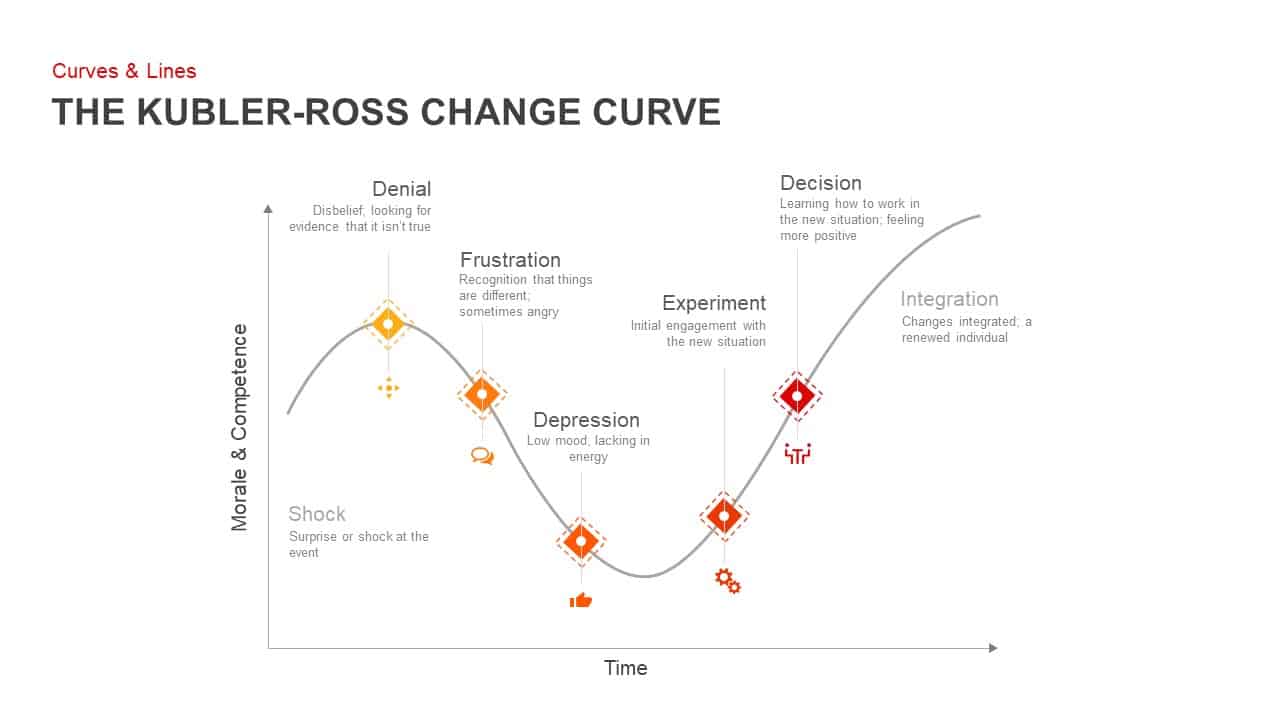
Kubler-Ross Change Curve Diagram Template for PowerPoint & Google Slides
Timeline

Strategic Planning Curve Diagram Template for PowerPoint & Google Slides
Charts
Snake Shaped Curve Diagram template for PowerPoint & Google Slides
Business
Three-Stage S Curve Growth Diagram Template for PowerPoint & Google Slides
Process
Experience Curve Analysis Diagram Template for PowerPoint & Google Slides
Business Strategy
Gartner Hype Cycle Adoption Curve Diagram Template for PowerPoint & Google Slides
Infographics
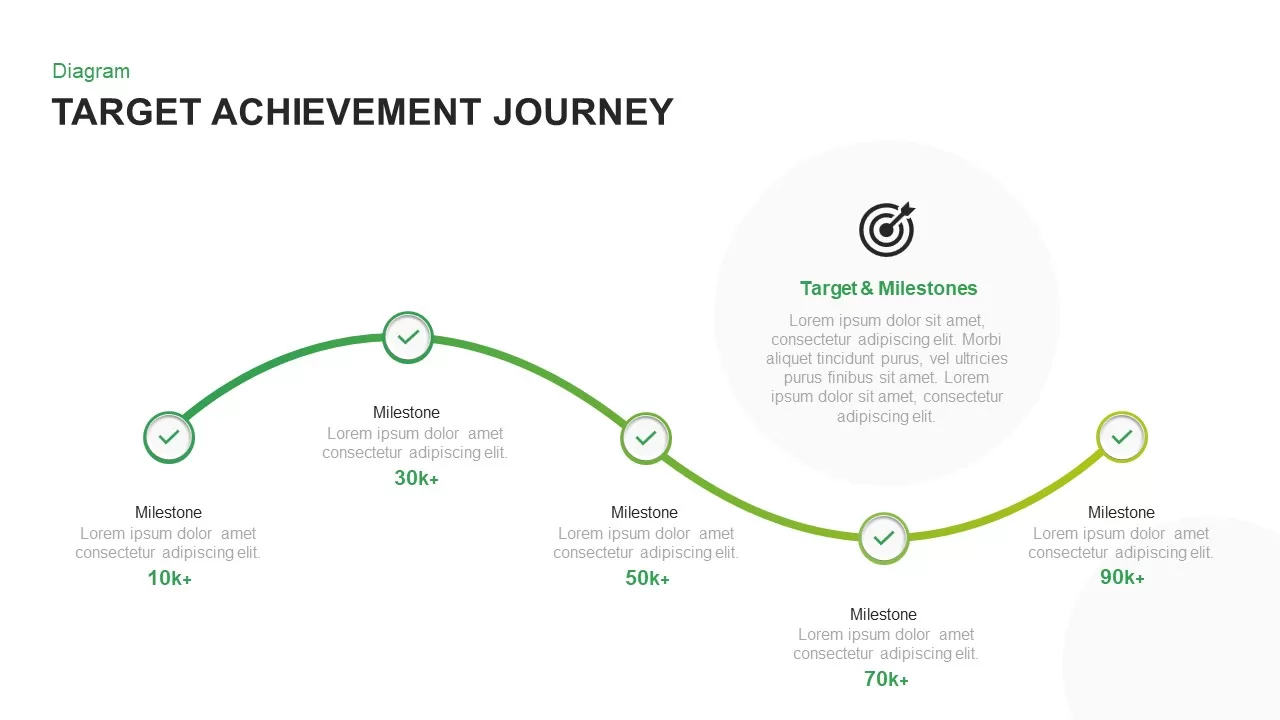
Target Achievement Milestone Curve Template for PowerPoint & Google Slides
Roadmap
Greiner’s Growth Model Curve template for PowerPoint & Google Slides
Infographics
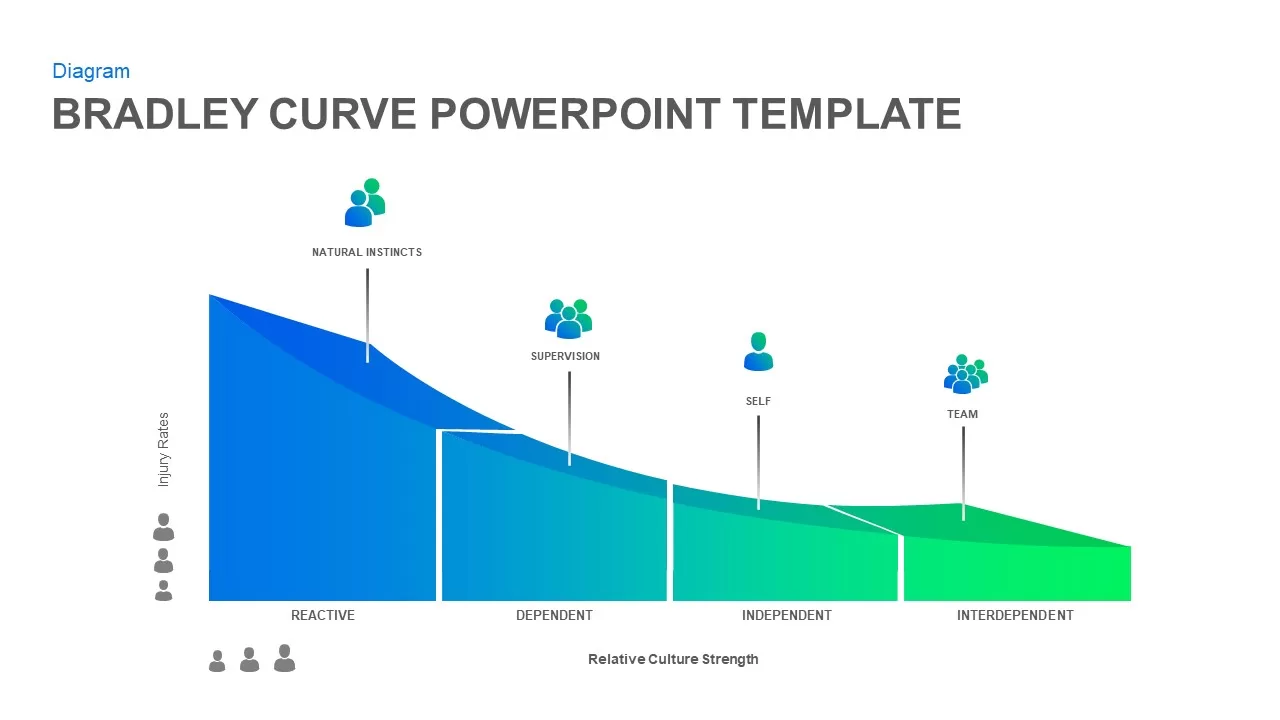
Bradley Curve Infographic Template for PowerPoint & Google Slides
Infographics
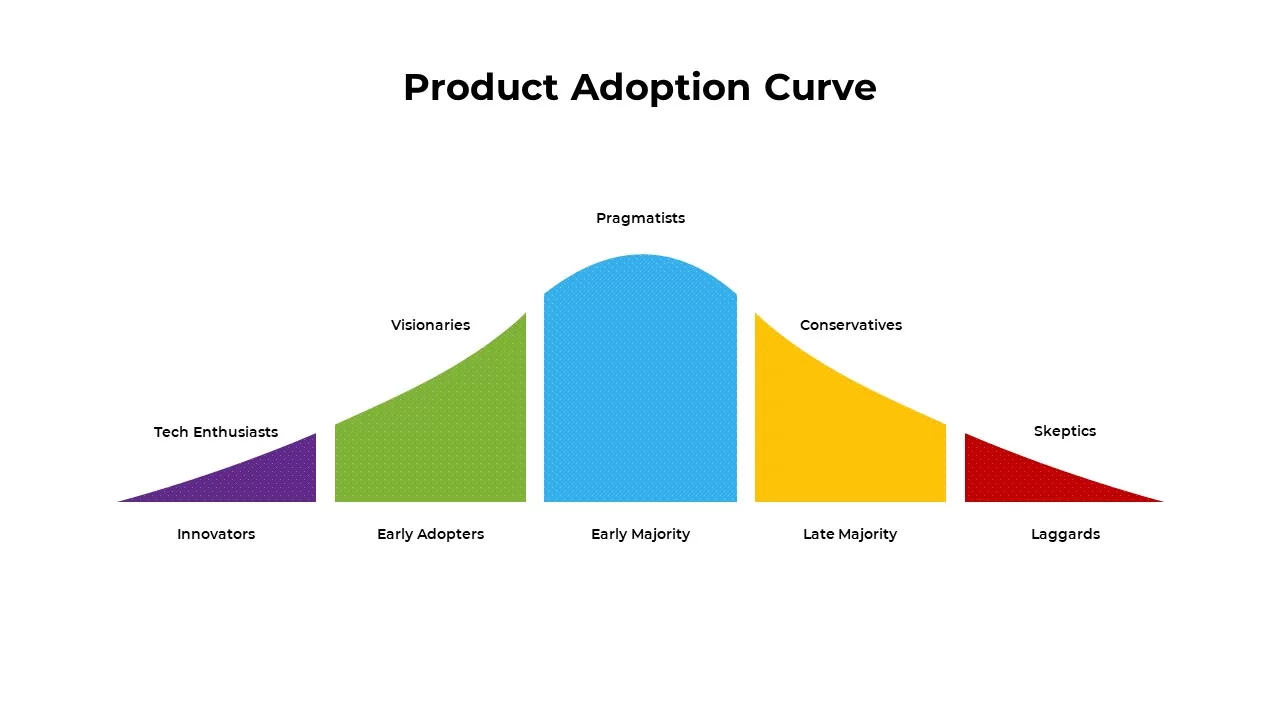
Product Adoption Curve Template for PowerPoint & Google Slides
Process
8-Bell Curve Infographic Slide Template for PowerPoint & Google Slides
Comparison Chart
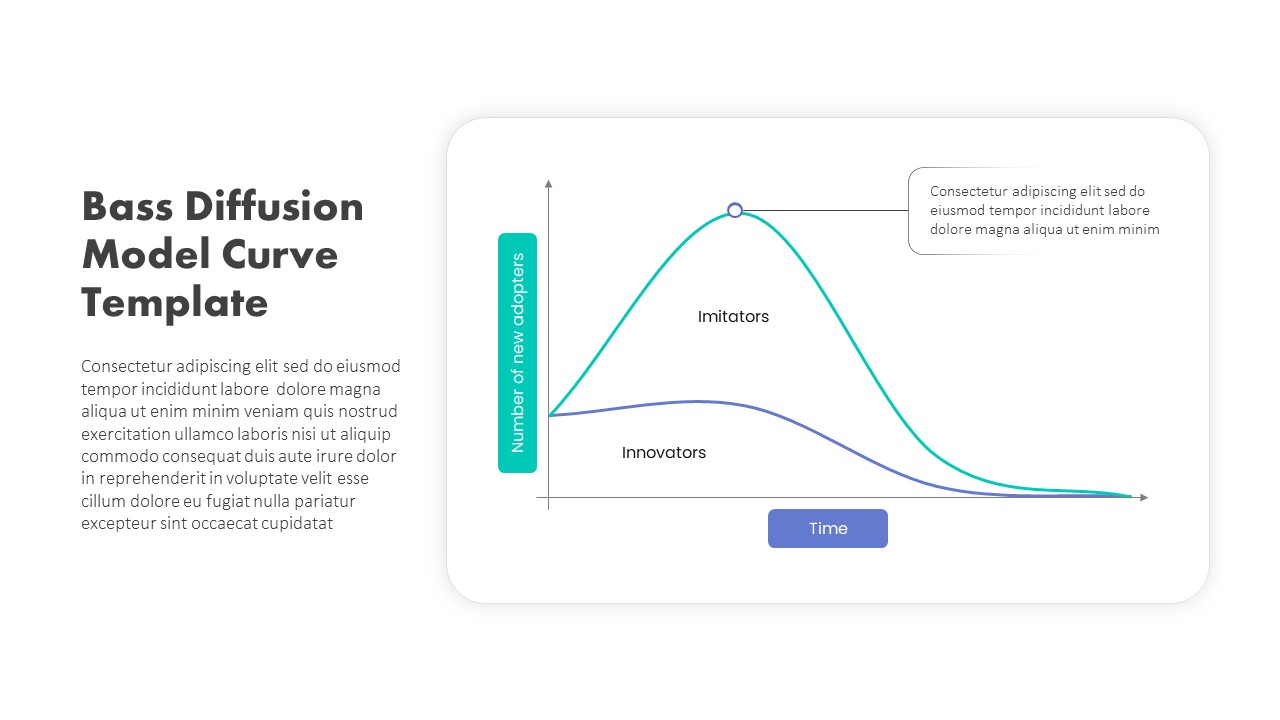
Bass Diffusion Model Curve for Adoption Template for PowerPoint & Google Slides
Comparison Chart
Growth Curve Line Chart Visualization Template for PowerPoint & Google Slides
Charts
Economies of Scale Cost Curve Comparison Template for PowerPoint & Google Slides
Comparison Chart
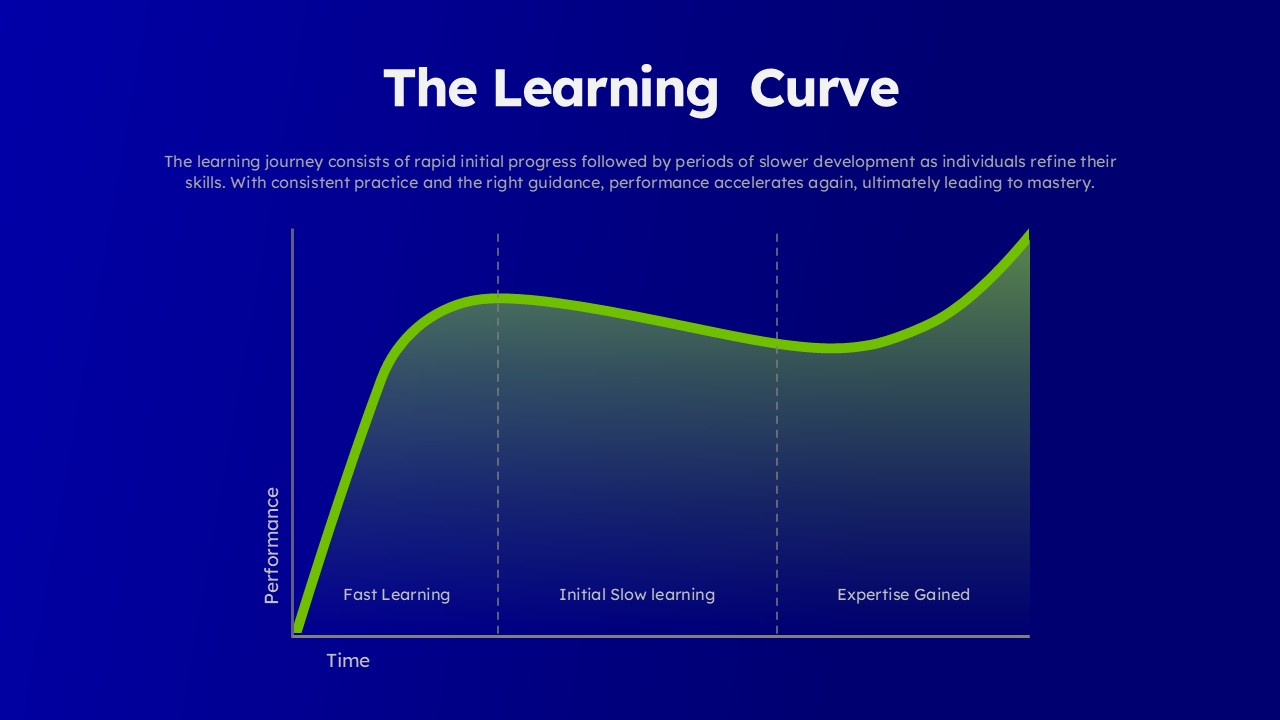
Learning Curve Performance Growth Chart Template for PowerPoint & Google Slides
Employee Performance
Six-Staged Gear Diagram Framework Template for PowerPoint & Google Slides
Process
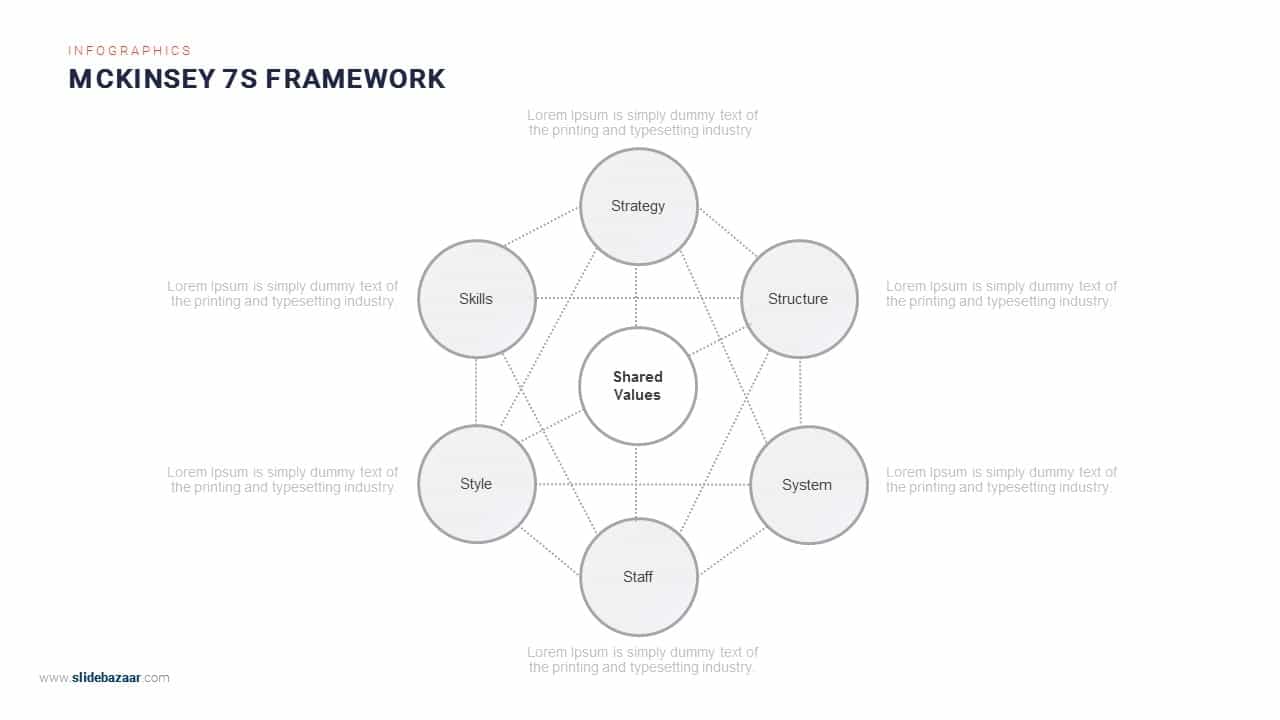
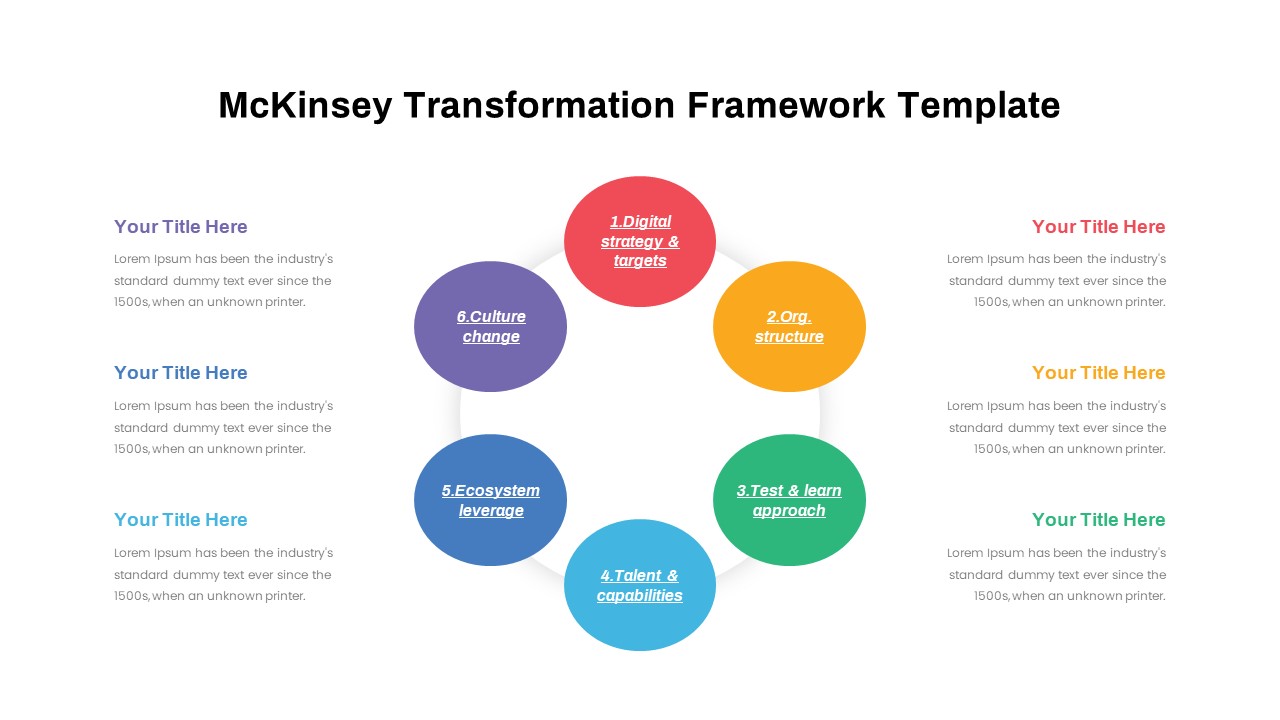
McKinsey 7S Framework Circular Diagram Template for PowerPoint & Google Slides
Circular
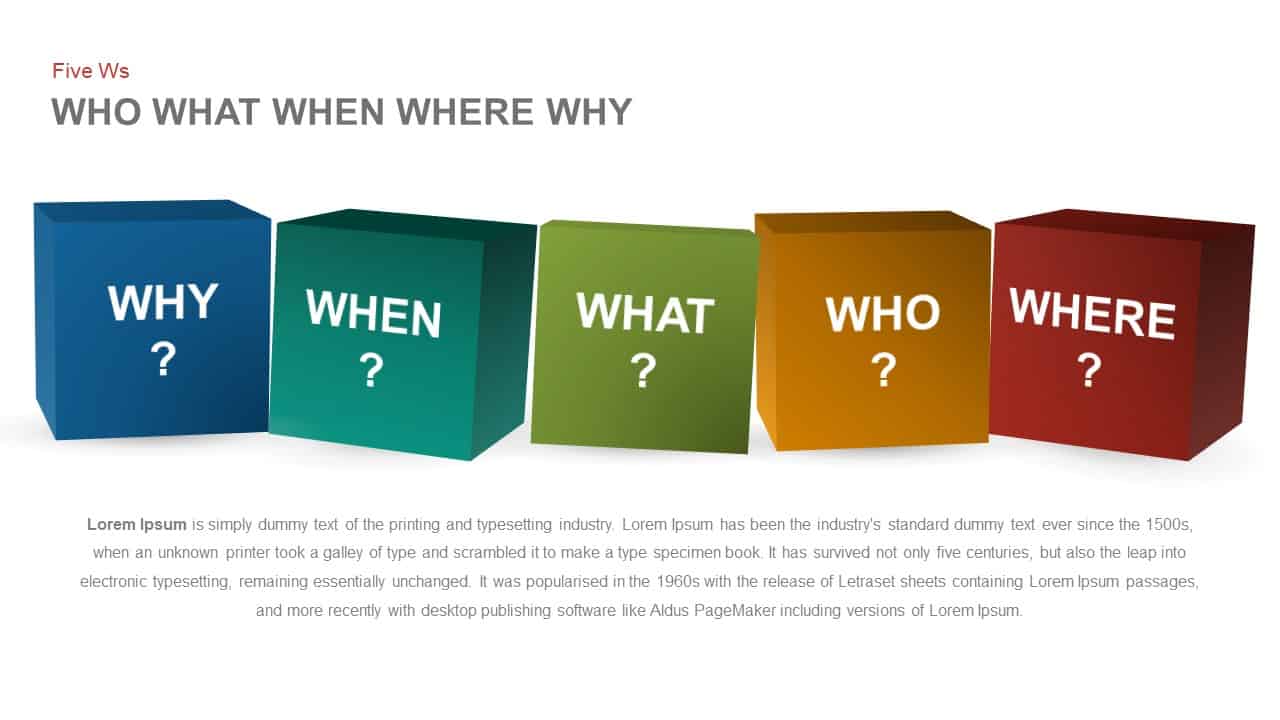
Five Ws Framework Cube Diagram Template for PowerPoint & Google Slides
Comparison
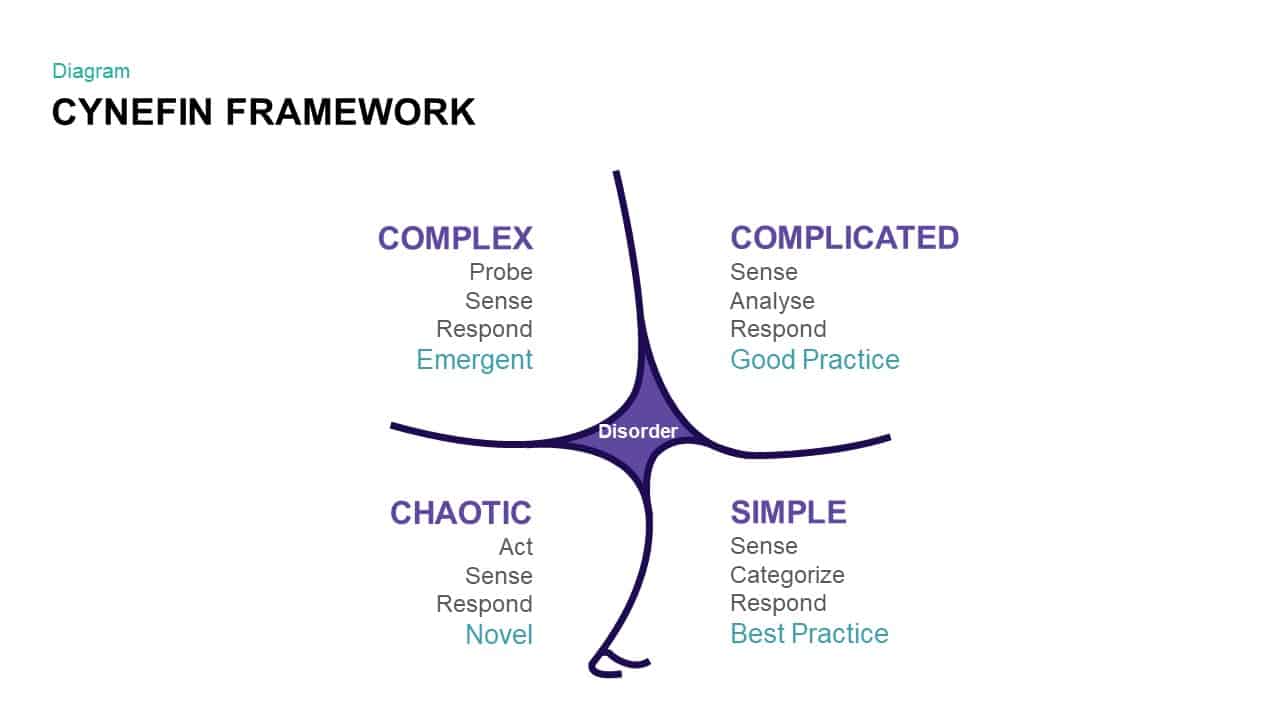
Comprehensive Cynefin Framework Diagram Template for PowerPoint & Google Slides
Opportunities Challenges
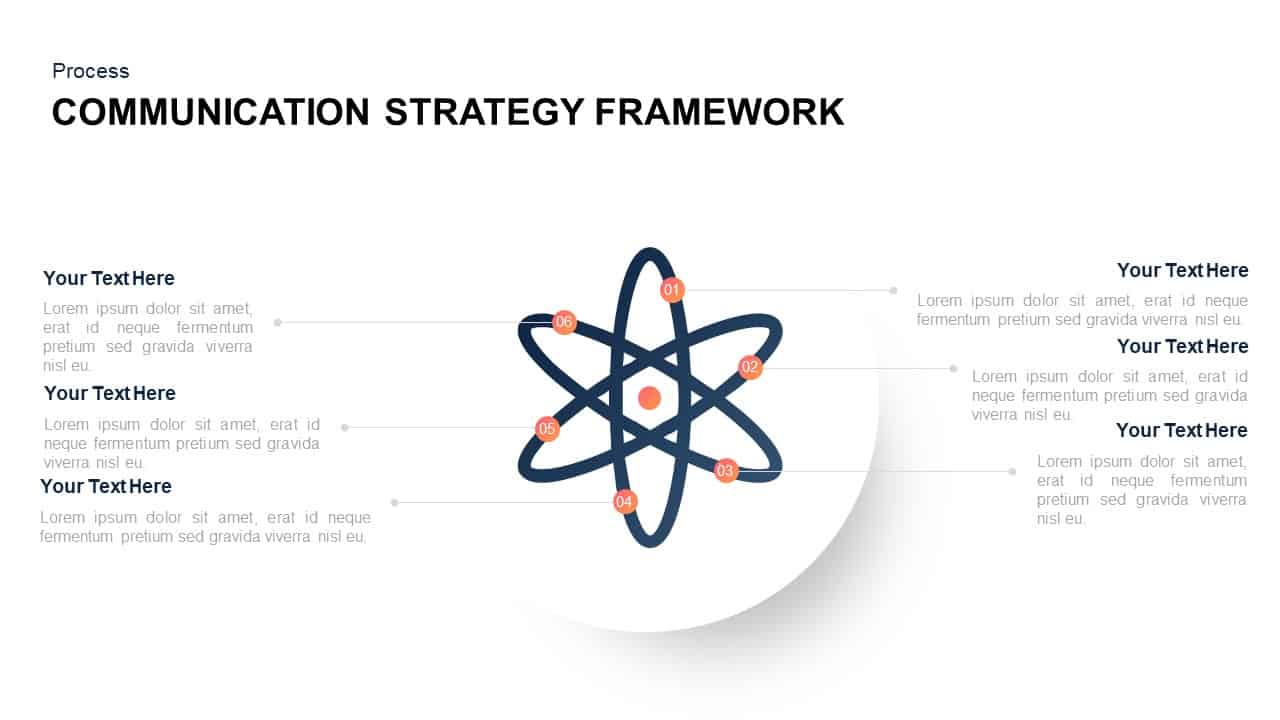
Communication Strategy Framework Diagram Template for PowerPoint & Google Slides
Circular
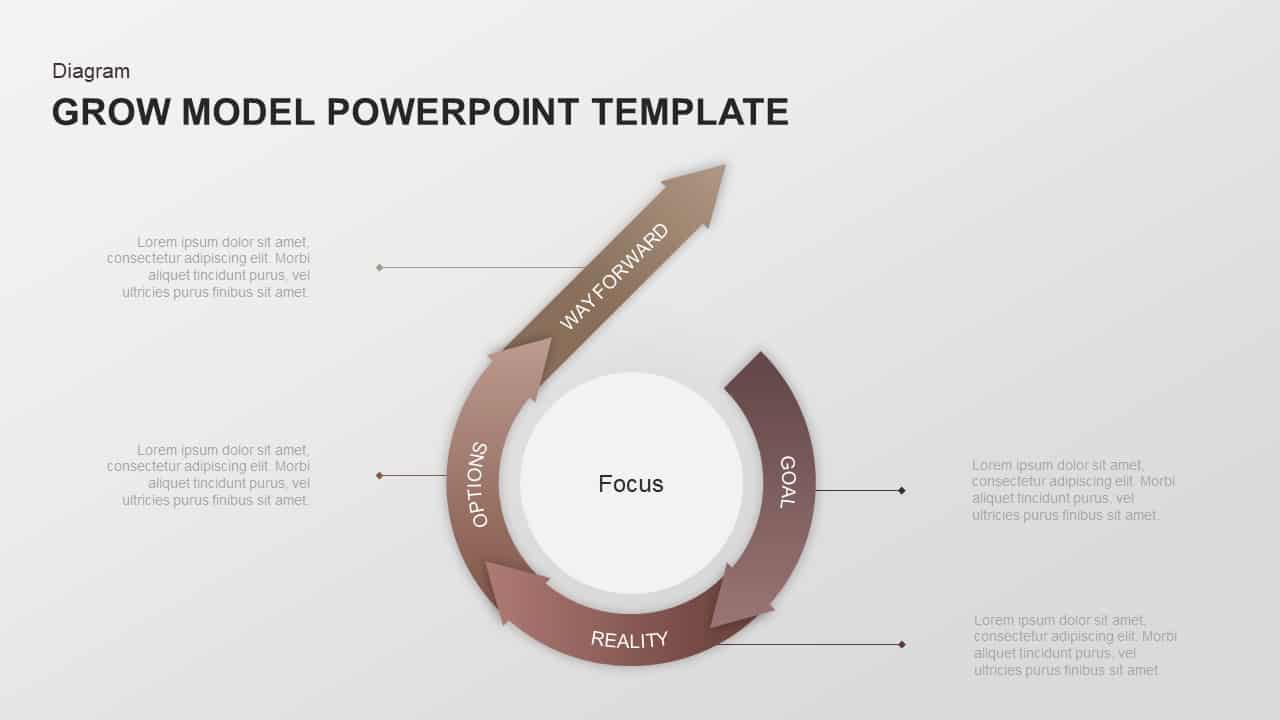
GROW Coaching Framework Diagram Template for PowerPoint & Google Slides
Process
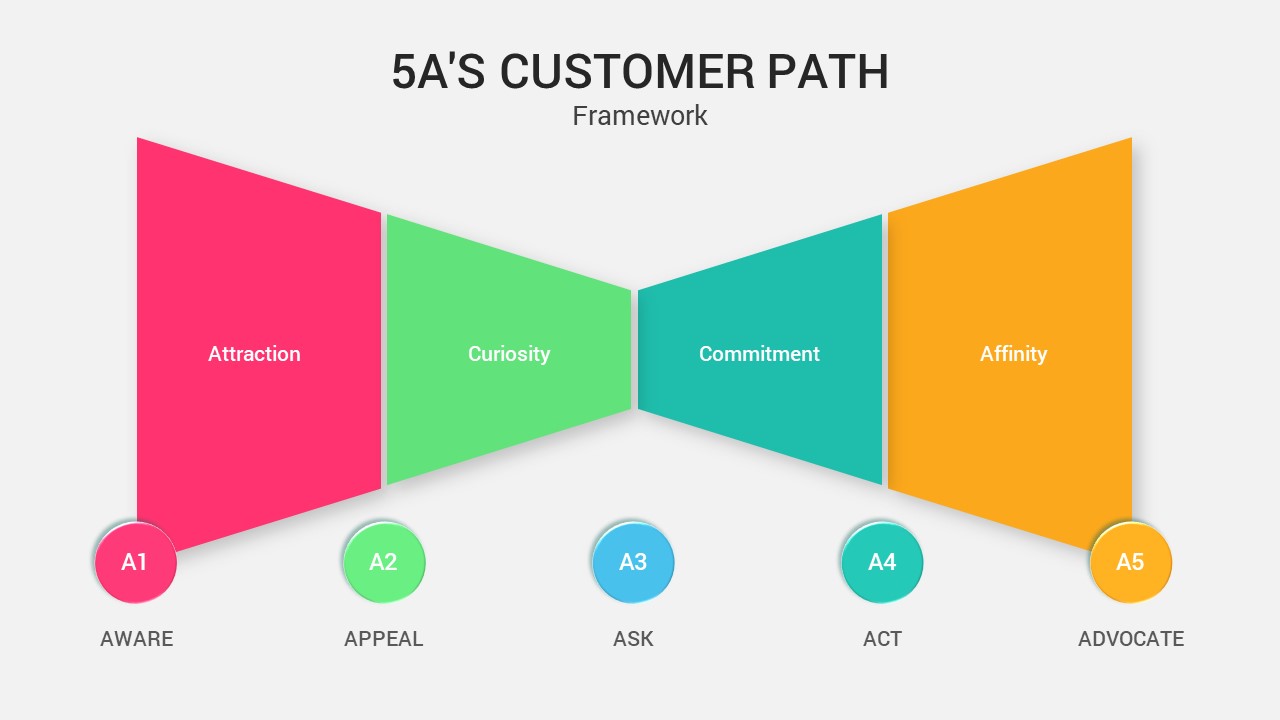
5A’s Customer Path Framework Diagram Template for PowerPoint & Google Slides
Process
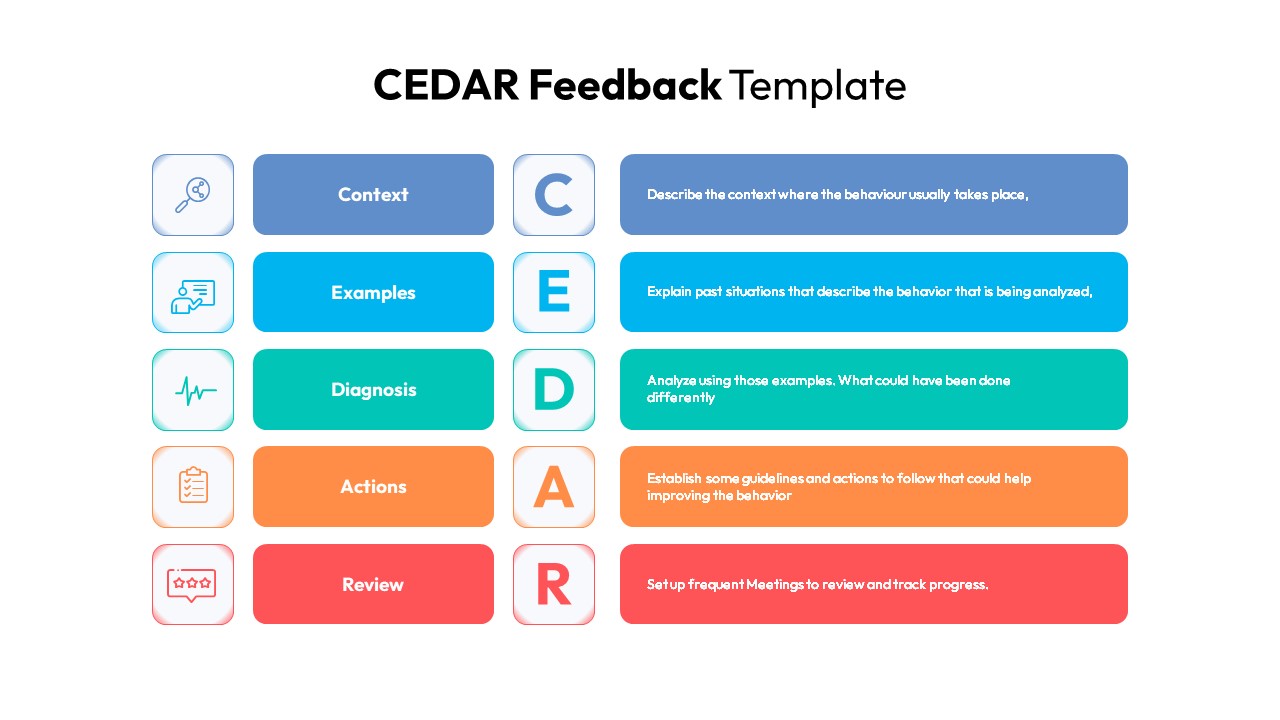
CEDAR Feedback Framework Diagram Template for PowerPoint & Google Slides
Employee Performance
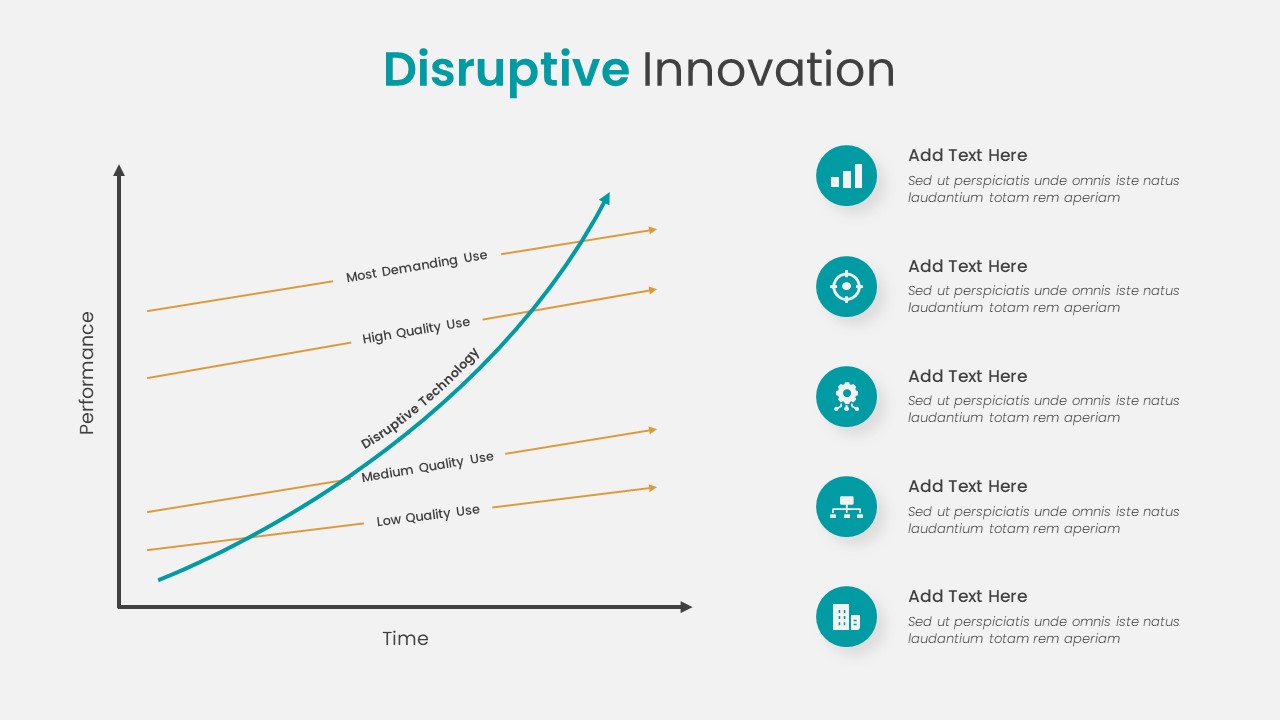
Disruptive Innovation Framework Diagram Template for PowerPoint & Google Slides
Comparison Chart
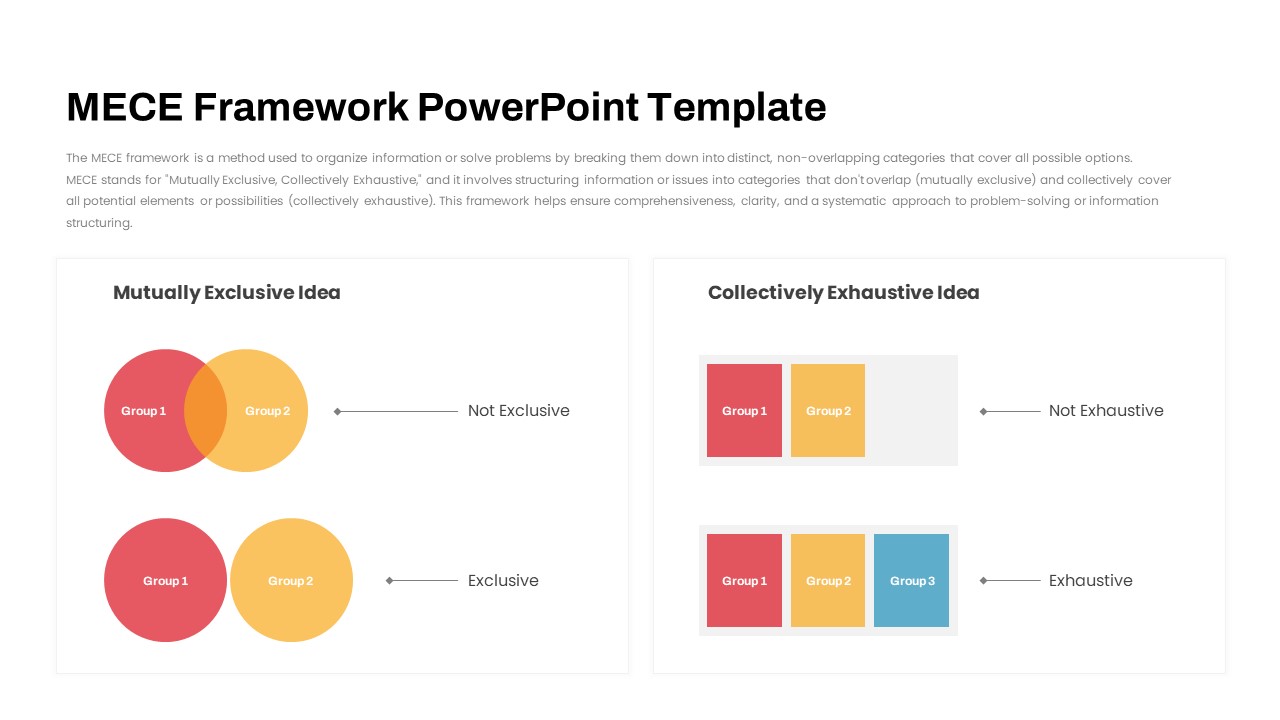
MECE Framework Venn & Block Diagram Template for PowerPoint & Google Slides
Comparison
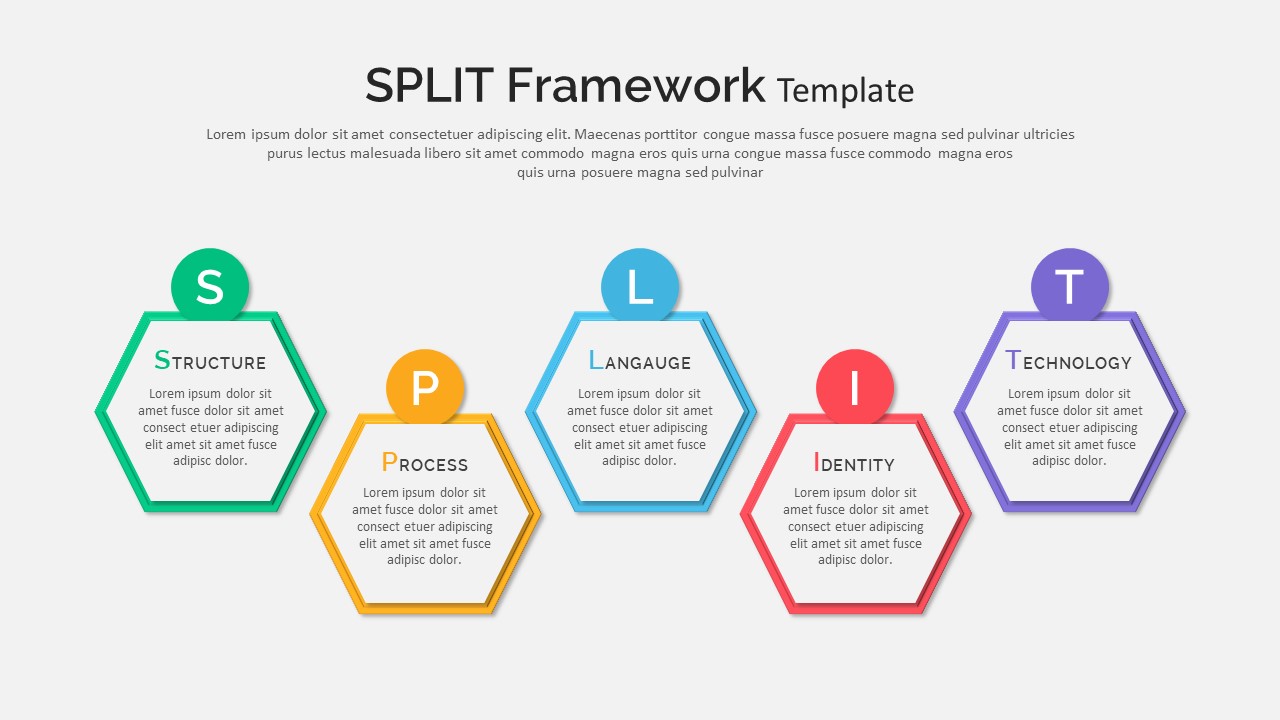
Split Framework Hexagon Diagram Slide Template for PowerPoint & Google Slides
Process
BCG Transformation Framework Diagram Template for PowerPoint & Google Slides
BCG
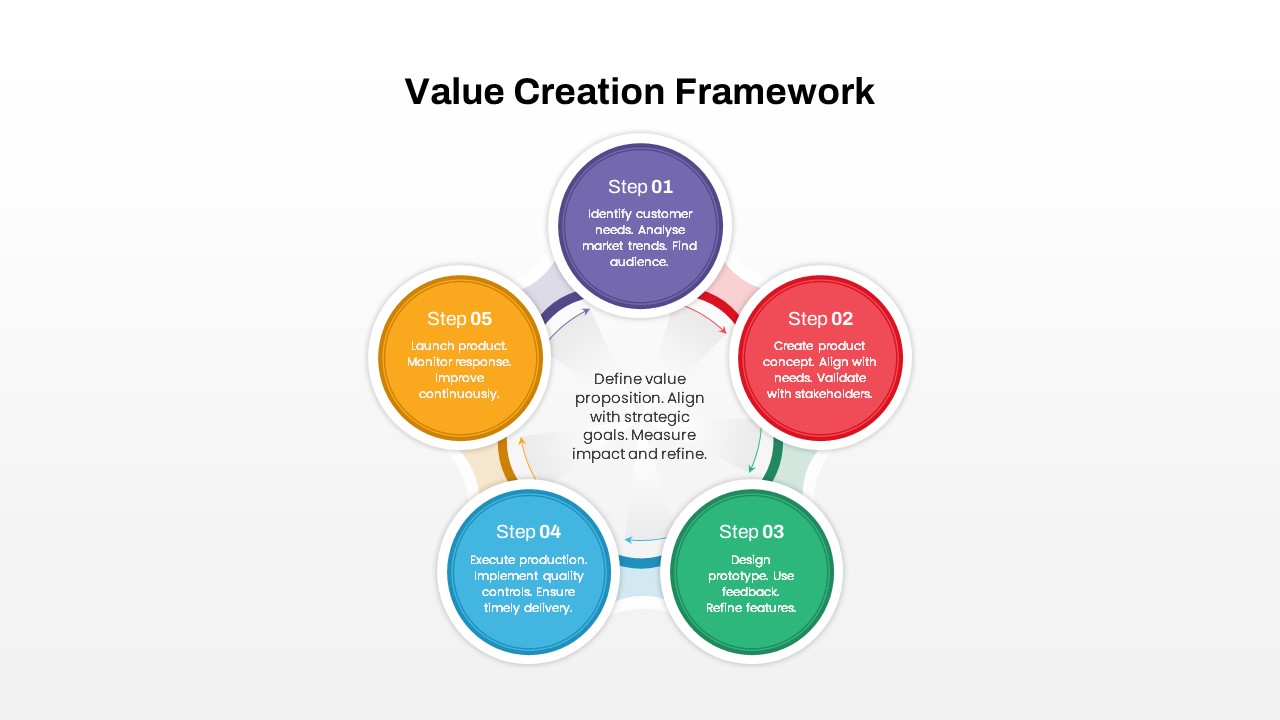
Value Creation Framework Process Diagram Template for PowerPoint & Google Slides
Business Plan
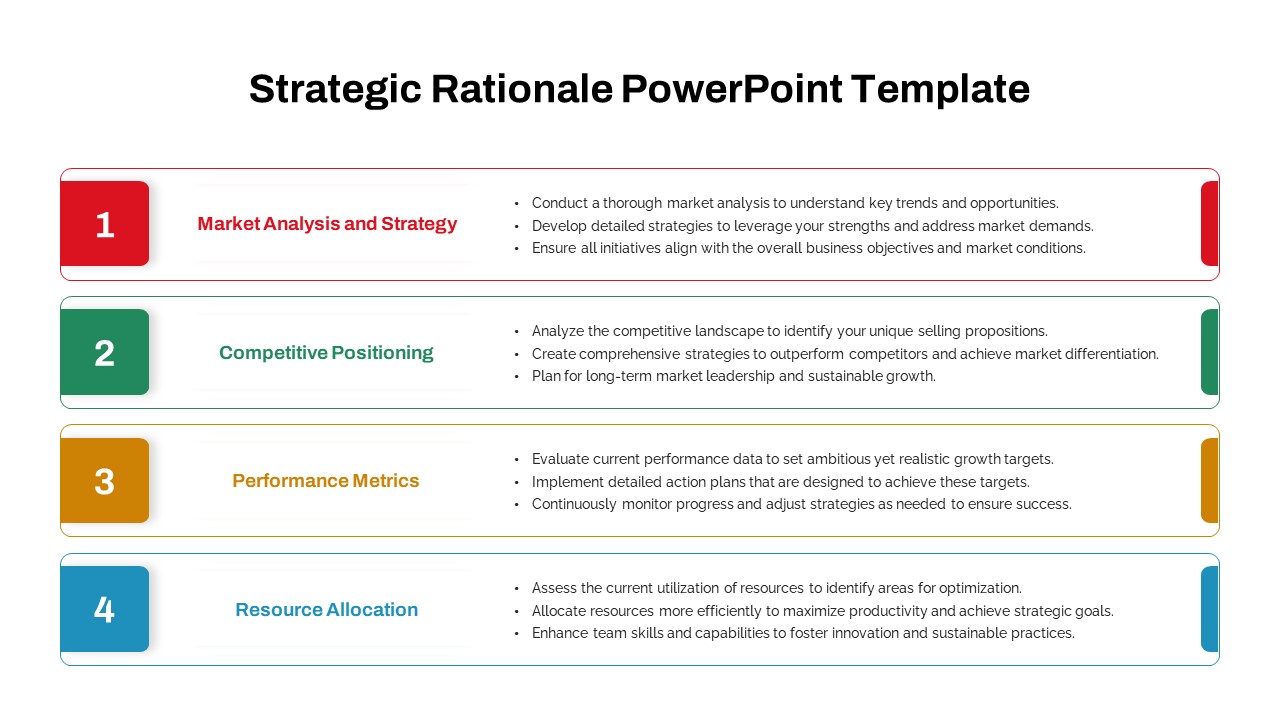
Strategic Rationale Framework Diagram Template for PowerPoint & Google Slides
Process
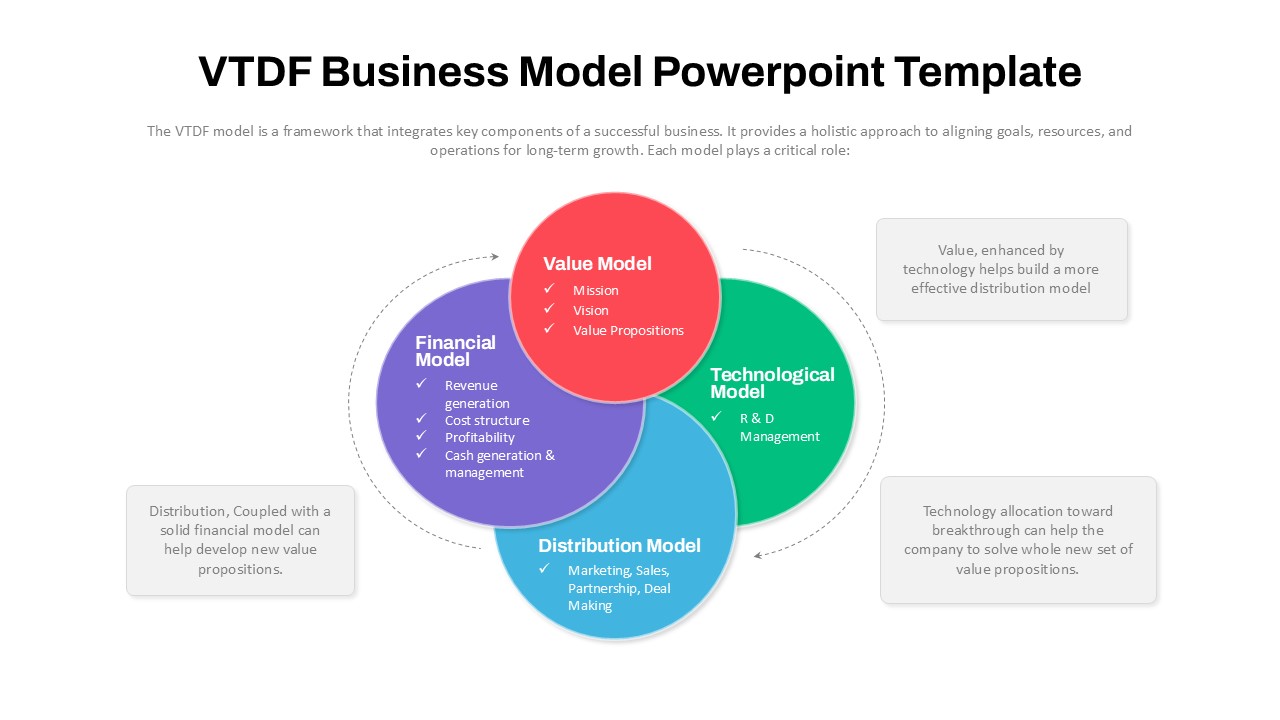
VTDF Business Model Framework Diagram Template for PowerPoint & Google Slides
Business Models
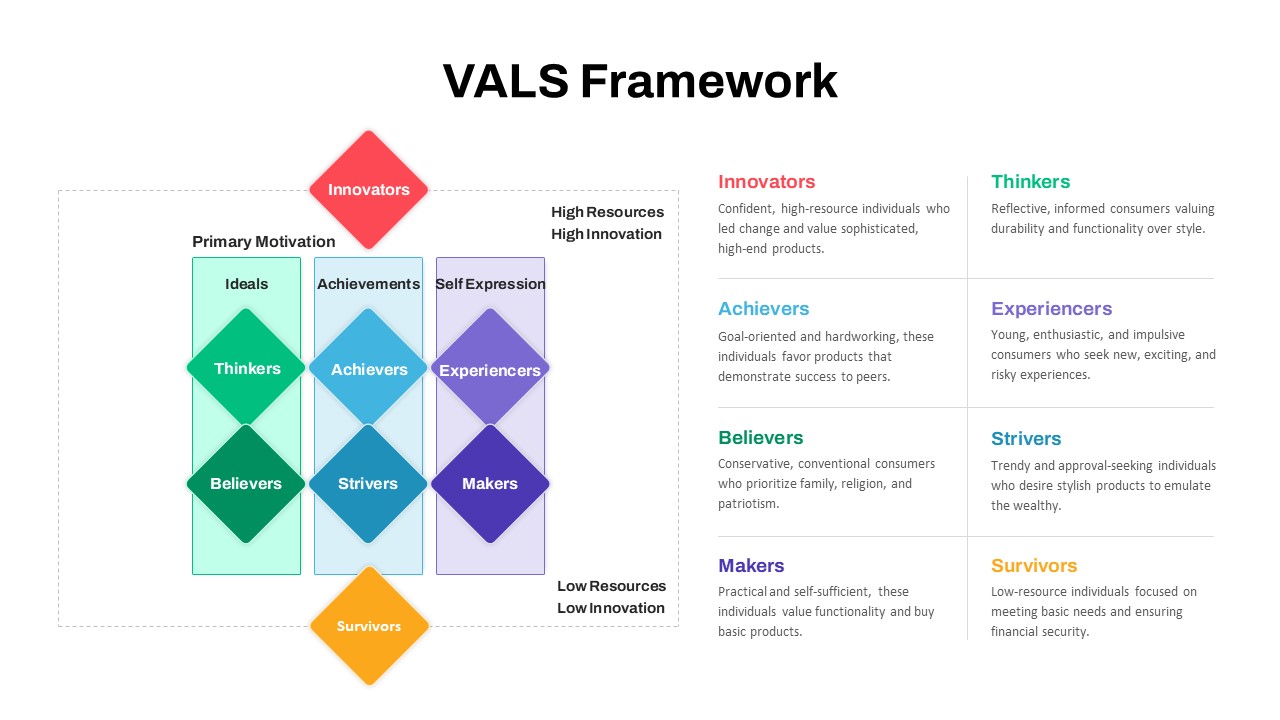
VALS Segmentation Framework Diagram Template for PowerPoint & Google Slides
Marketing
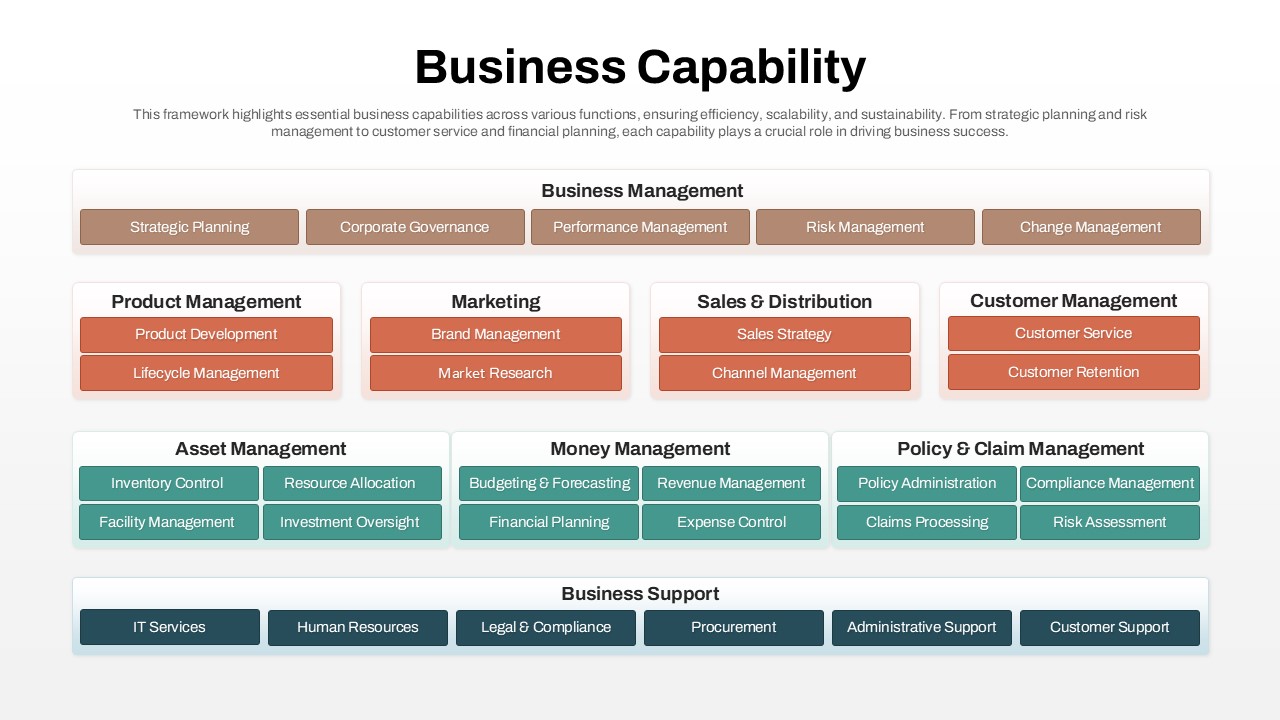
Business Capability Framework Diagram Template for PowerPoint & Google Slides
Business Models
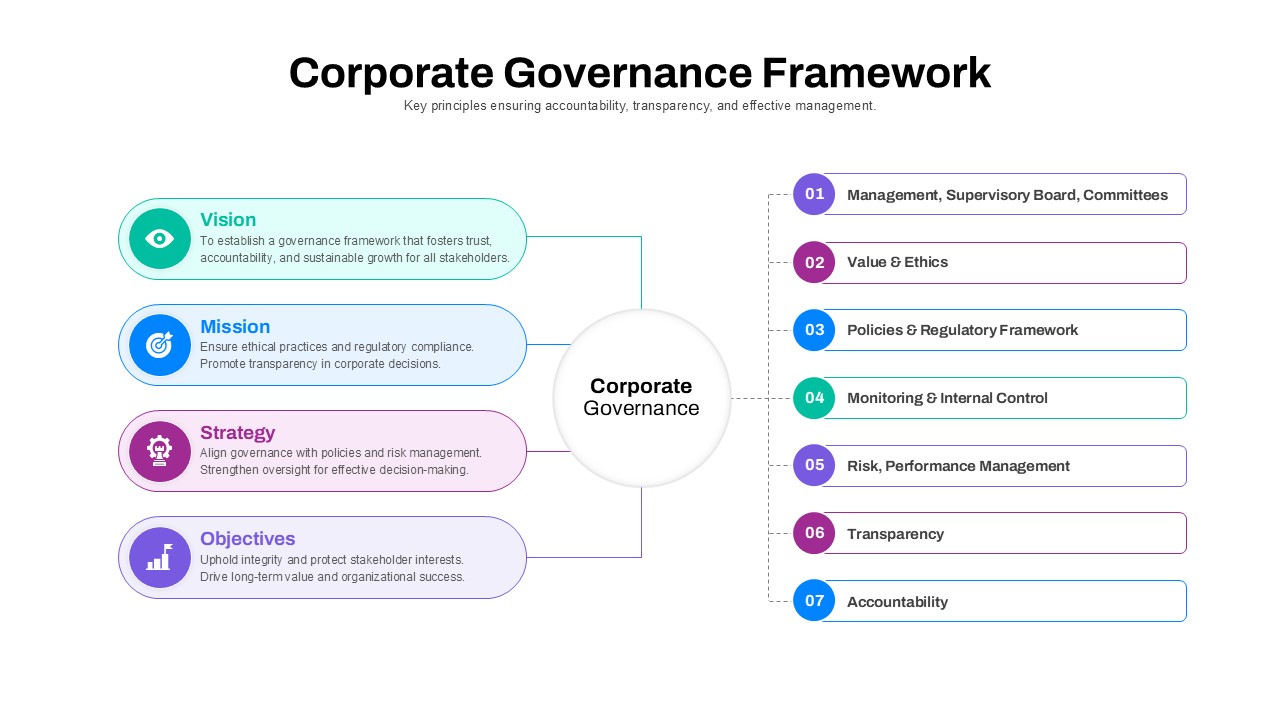
Corporate Governance Framework Diagram Template for PowerPoint & Google Slides
Process
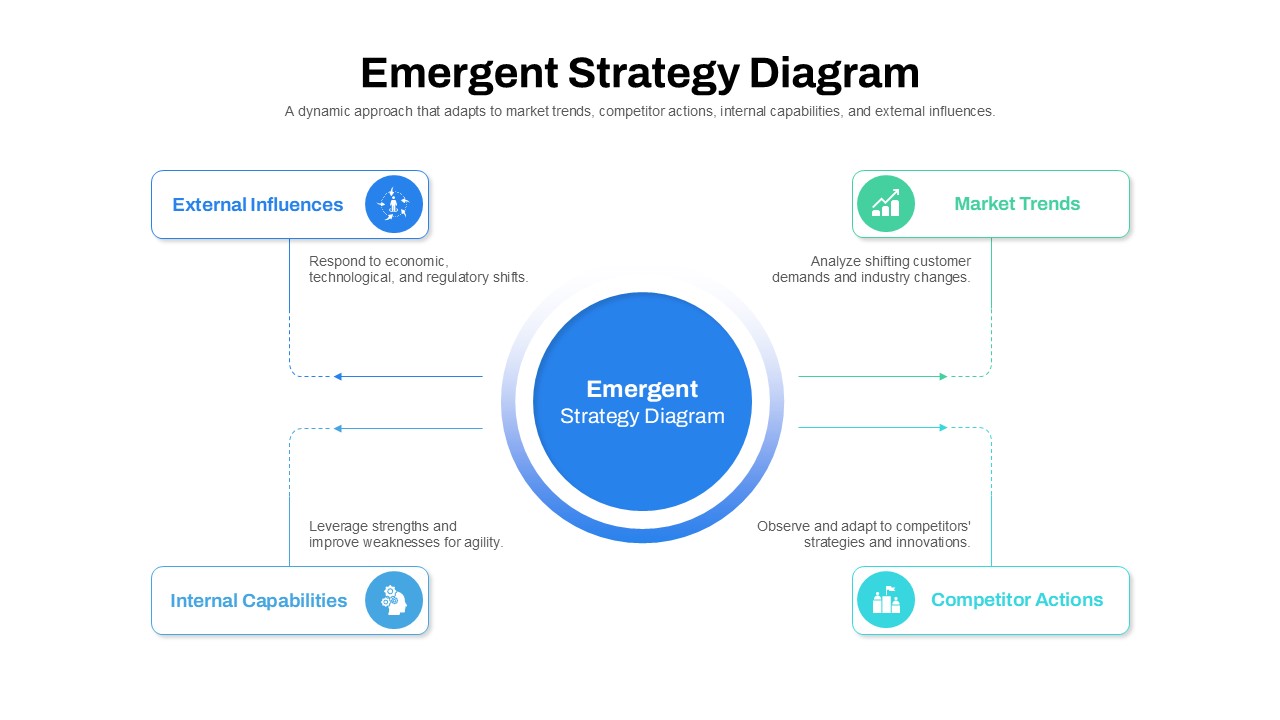
Emergent Strategy Diagram Framework Template for PowerPoint & Google Slides
Process
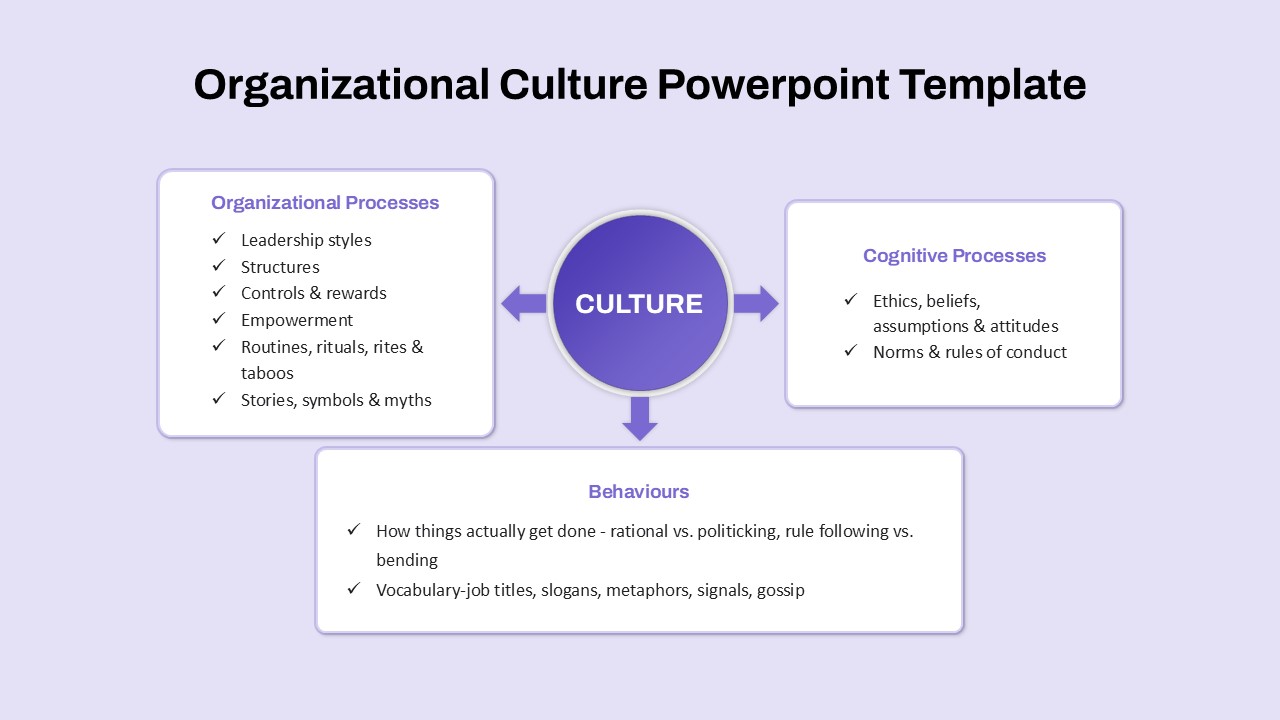
Organizational Culture Framework Diagram Template for PowerPoint & Google Slides
Arrow
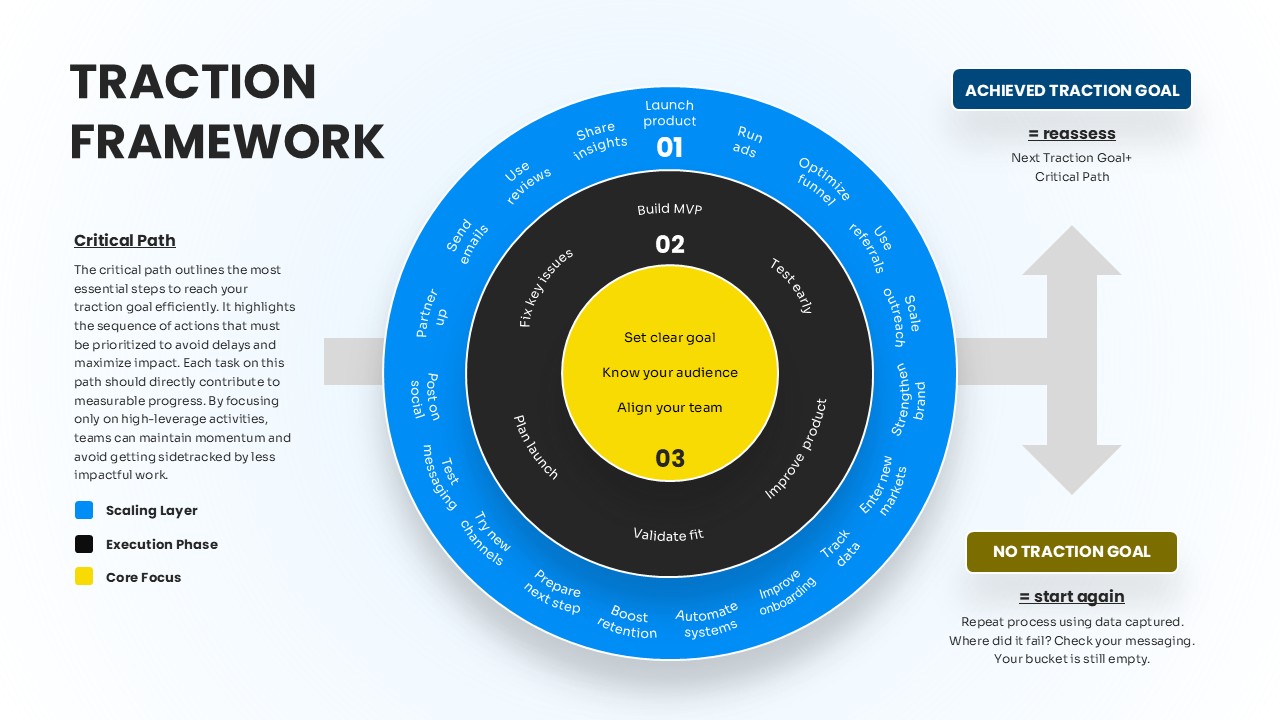
Concentric Traction Framework Diagram Template for PowerPoint & Google Slides
Process
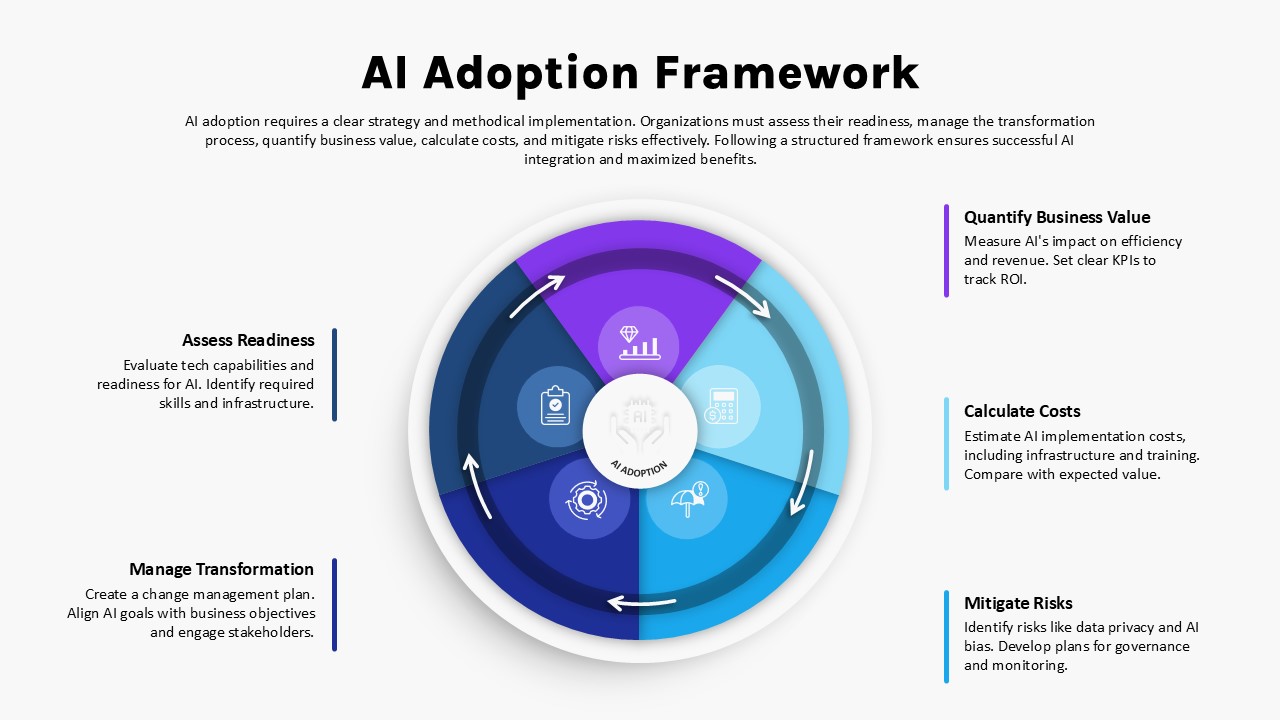
AI Adoption Framework Circular Diagram Template for PowerPoint & Google Slides
AI
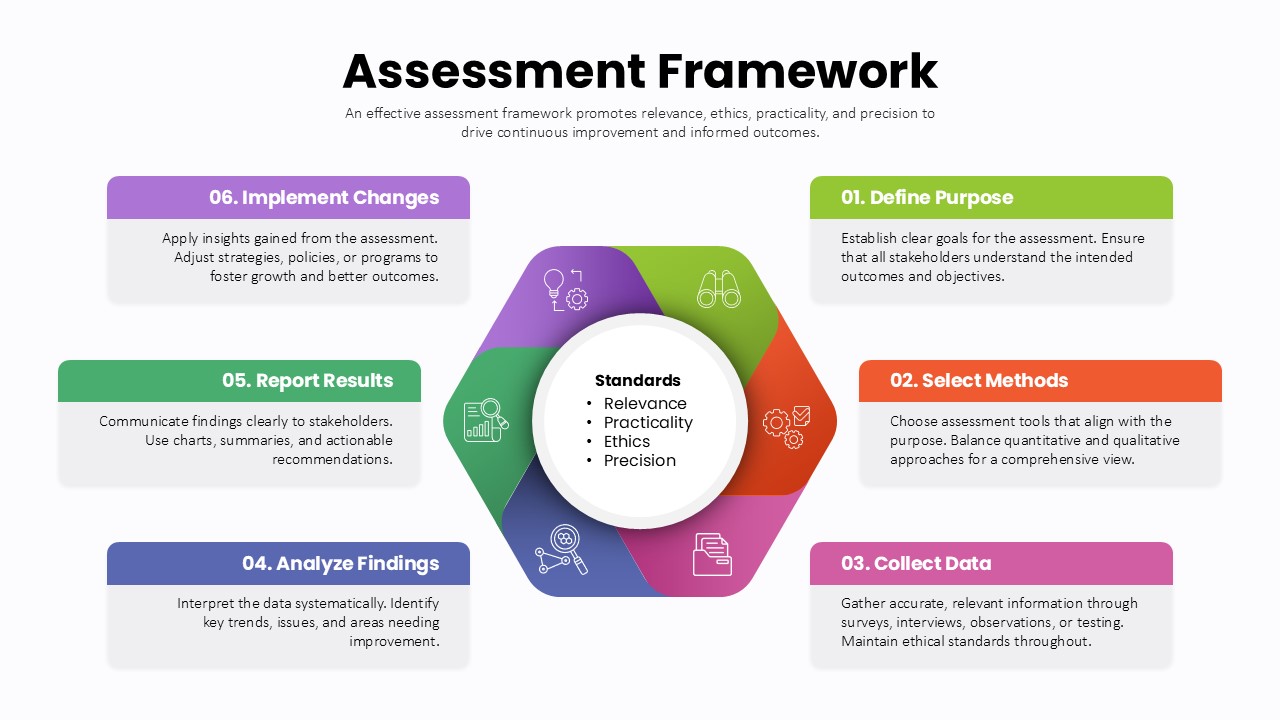
Assessment Framework Circular Diagram Template for PowerPoint & Google Slides
Circular
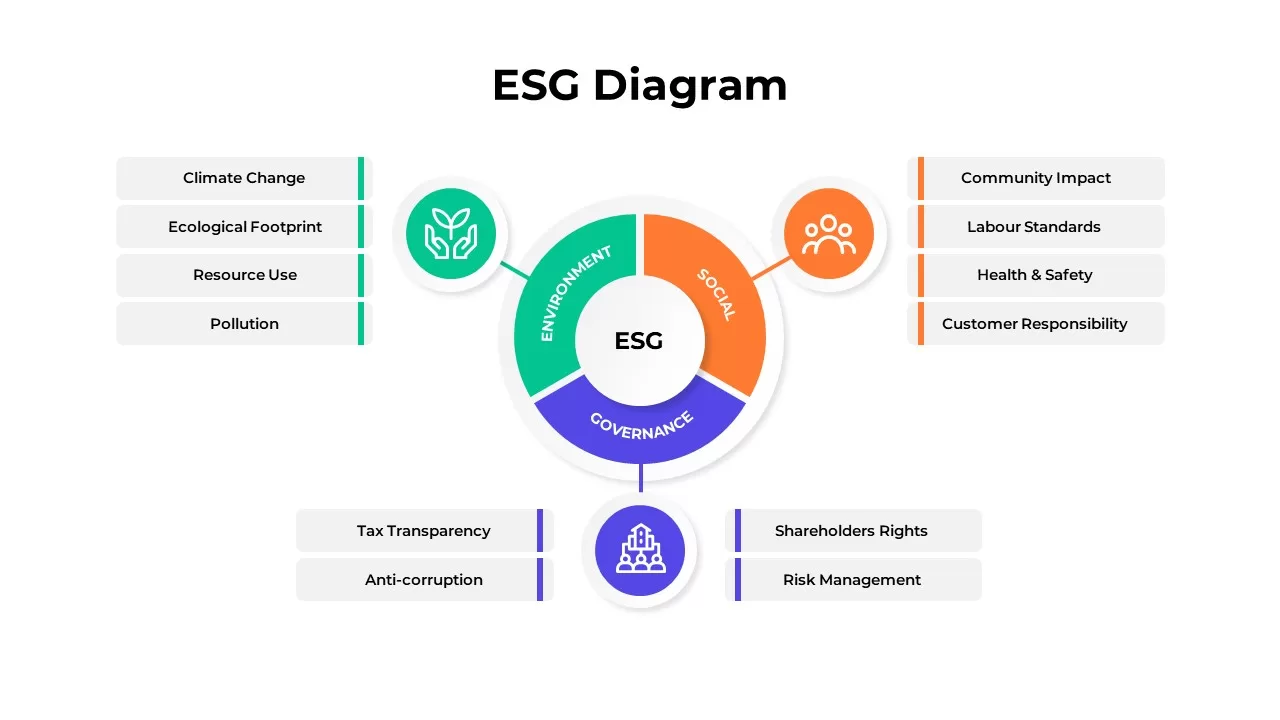
ESG Framework Segmentation Diagram for PowerPoint & Google Slides
Risk Management
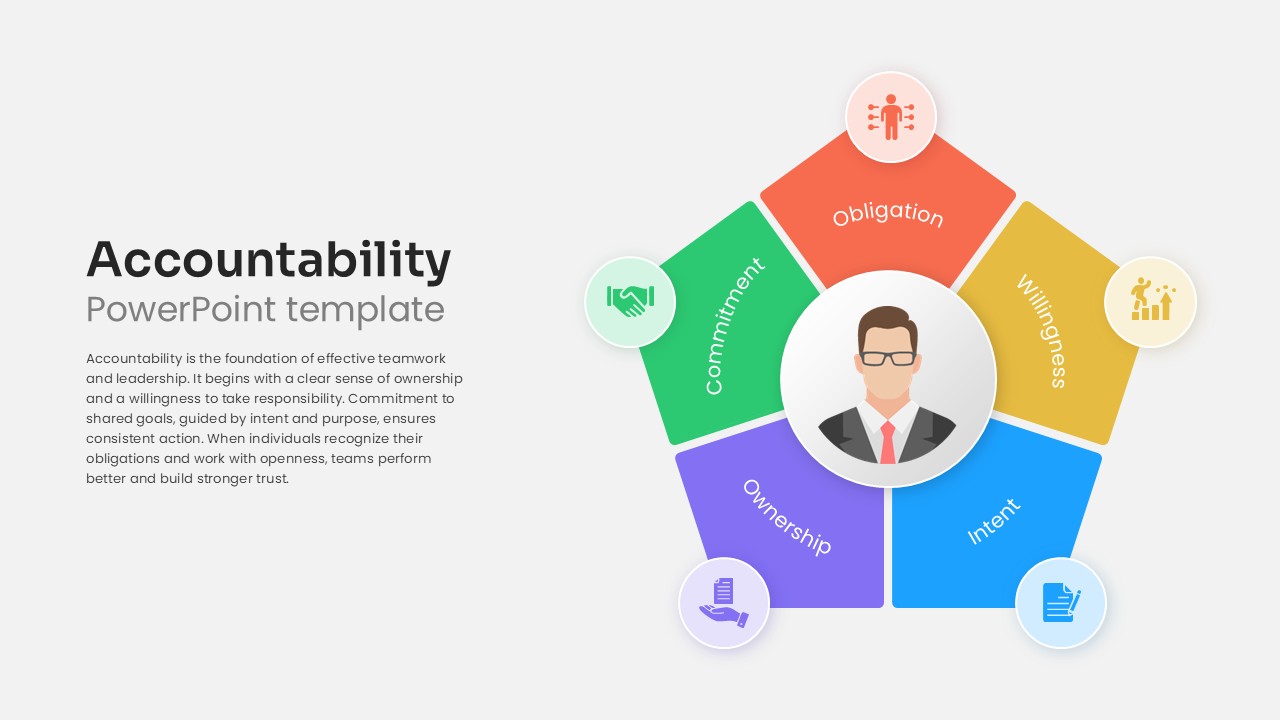
Accountability Framework PowerPoint template for PowerPoint & Google Slides
Leadership
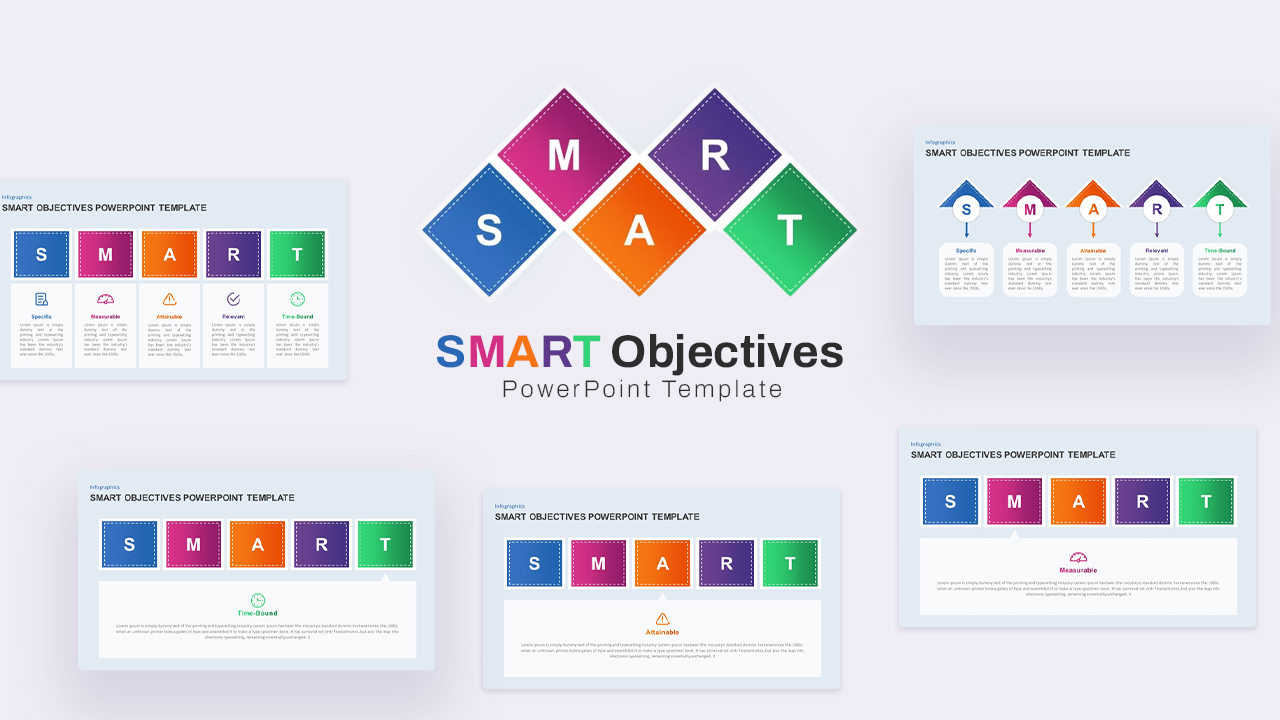
SMART Objectives – 5 Goals Framework Template for PowerPoint & Google Slides
Goals
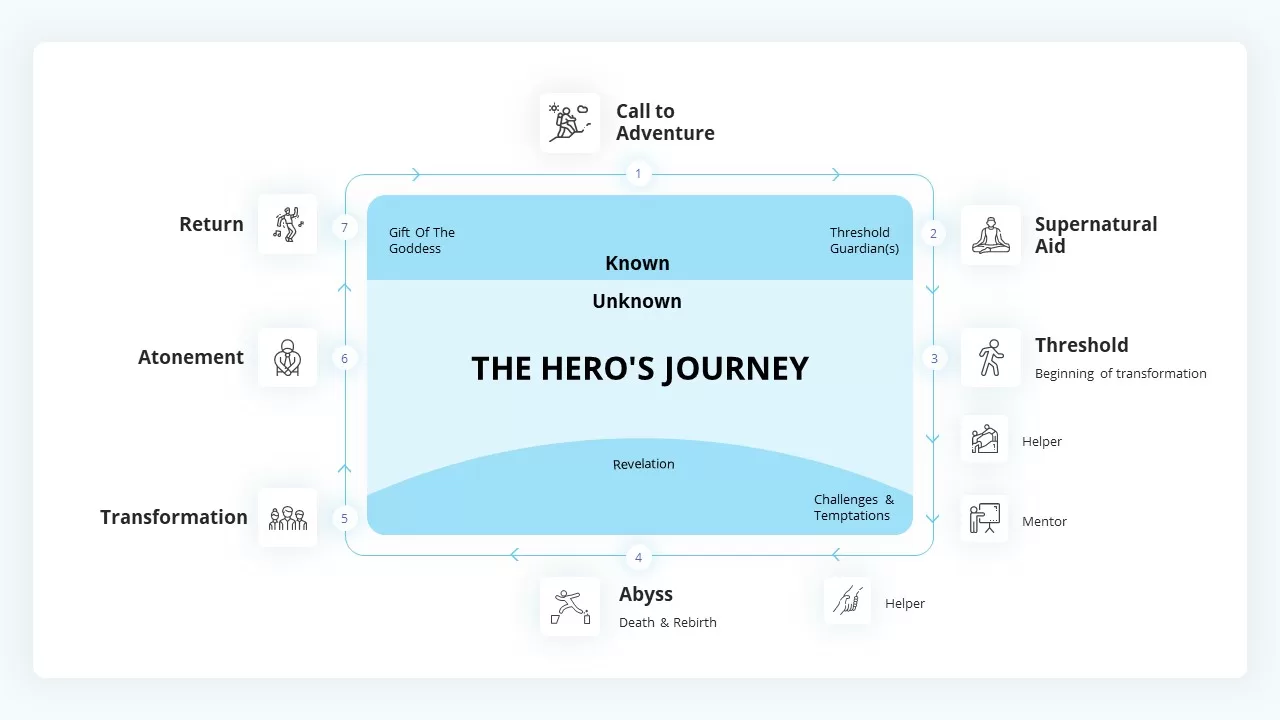
The Hero’s Journey Infographic Framework Template for PowerPoint & Google Slides
Customer Journey
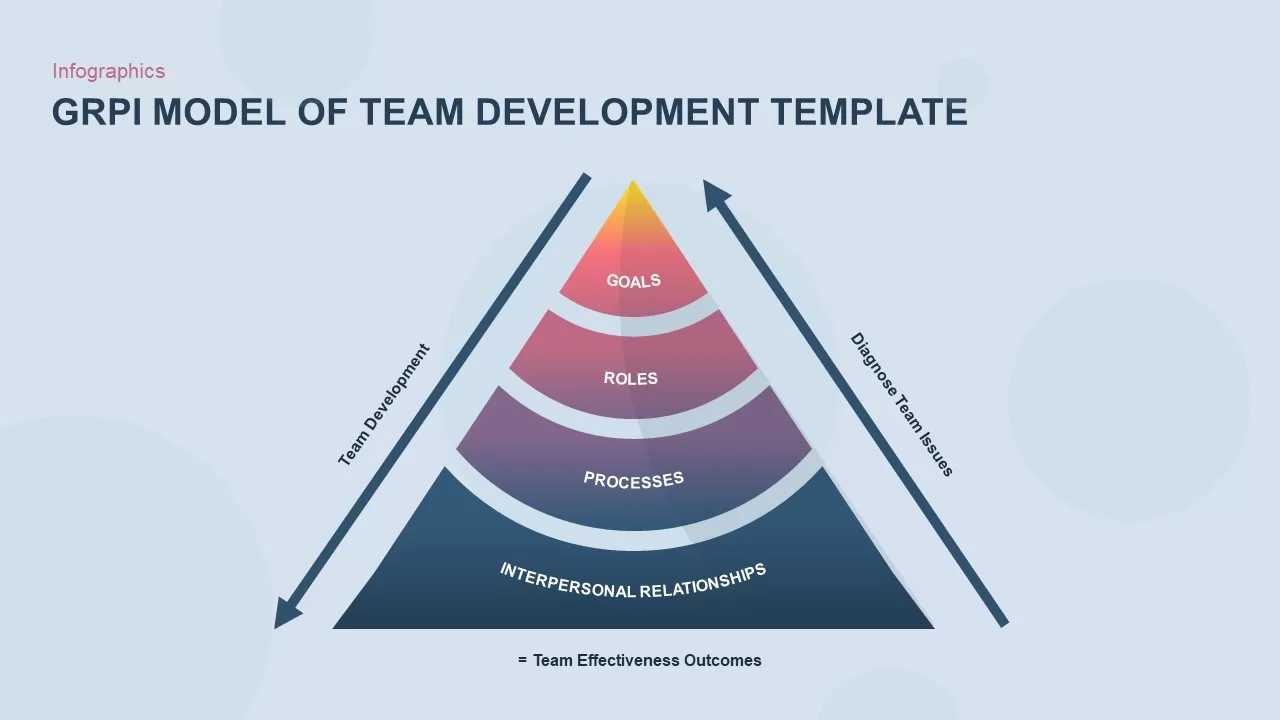
GRPI Model of Team Development Framework Template for PowerPoint & Google Slides
Leadership
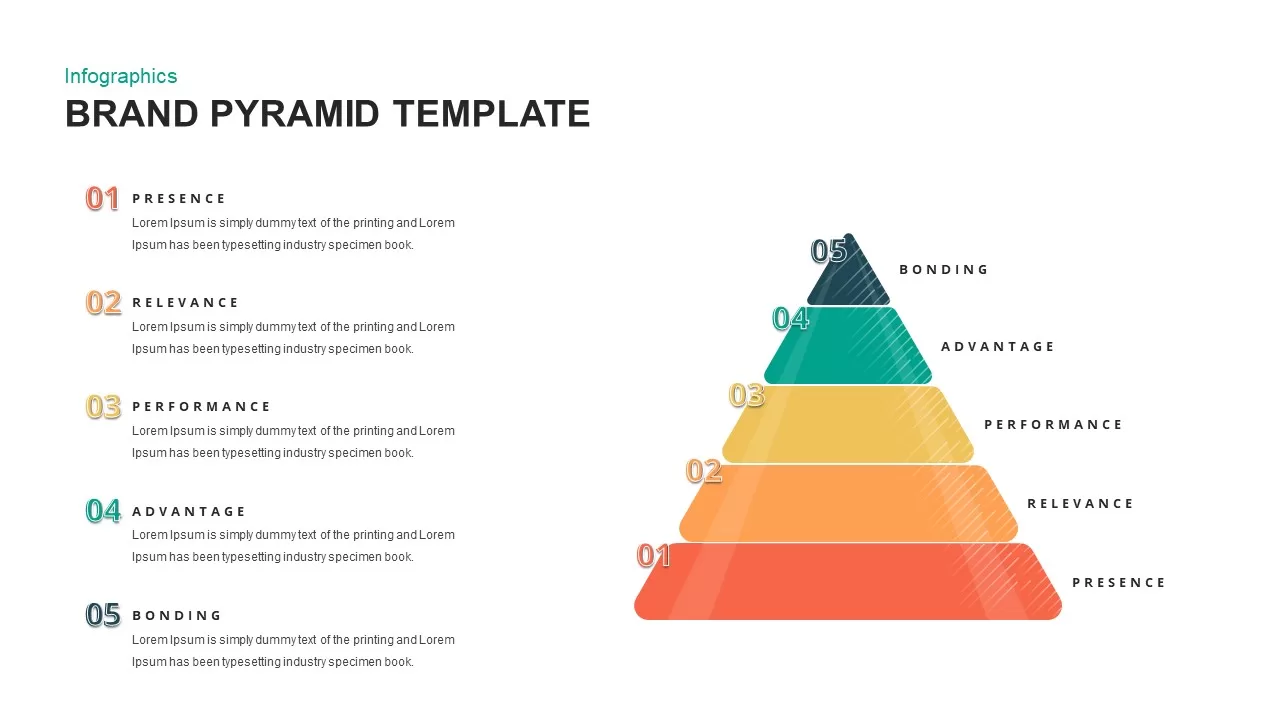
Brand Pyramid Framework template for PowerPoint & Google Slides
Pyramid
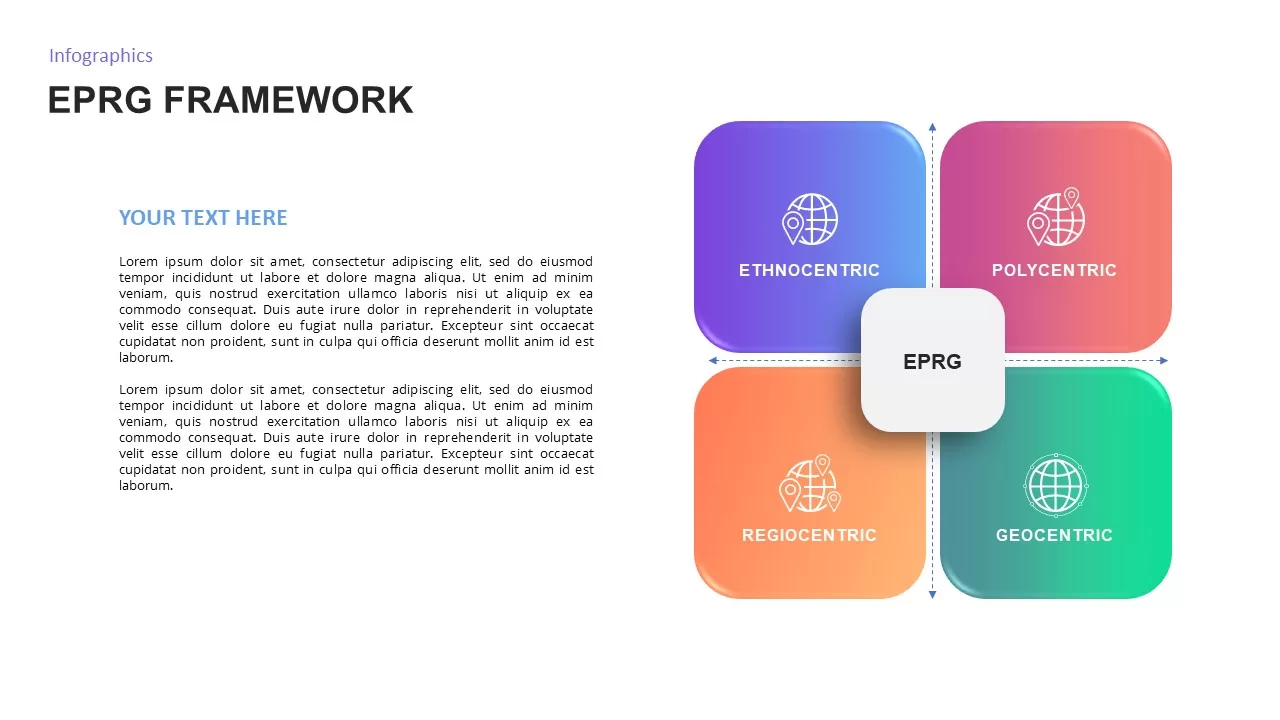
EPRG Framework Analysis template for PowerPoint & Google Slides
Business Strategy
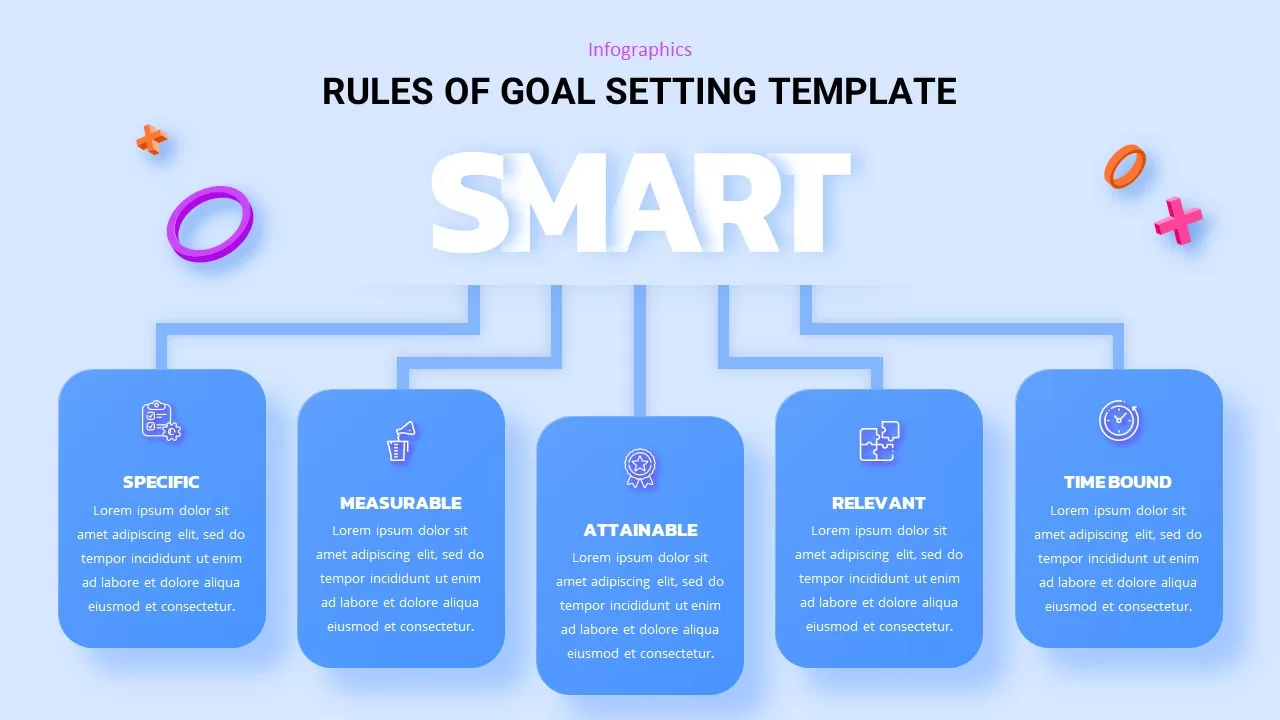
SMART Goals Framework Rules Template for PowerPoint & Google Slides
Business
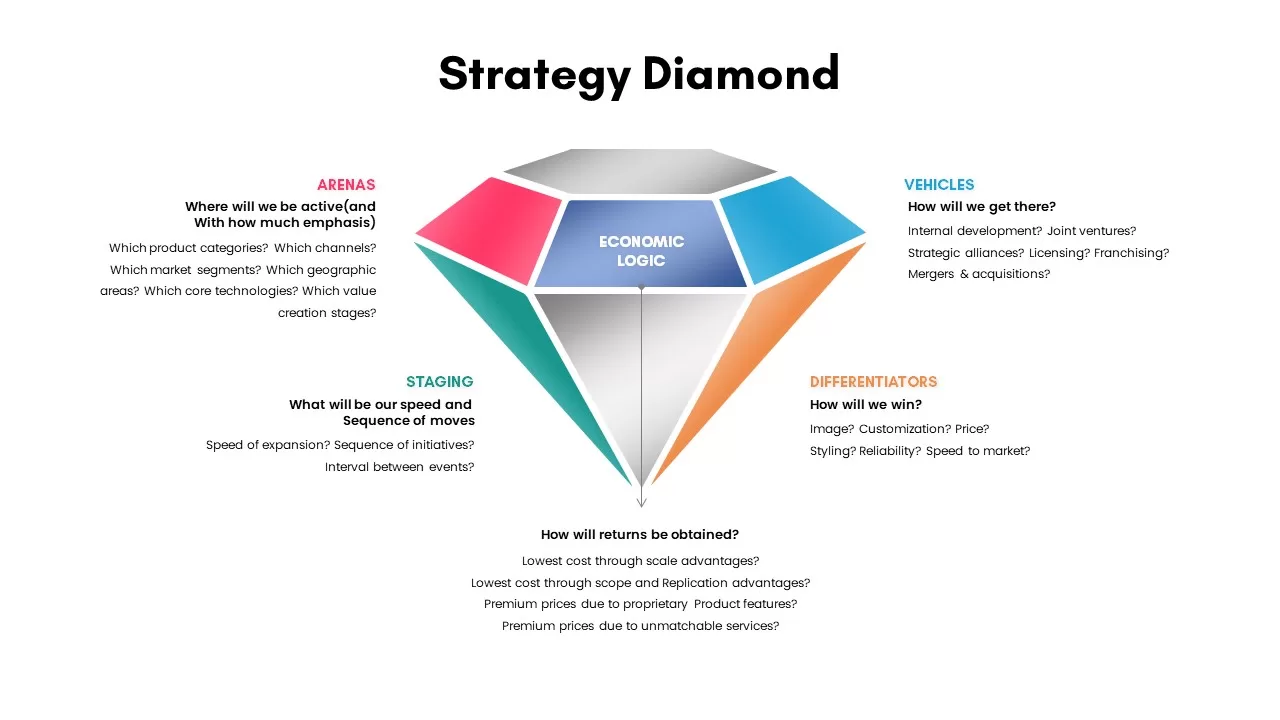
Strategy Diamond Framework Visual Template for PowerPoint & Google Slides
Competitor Analysis
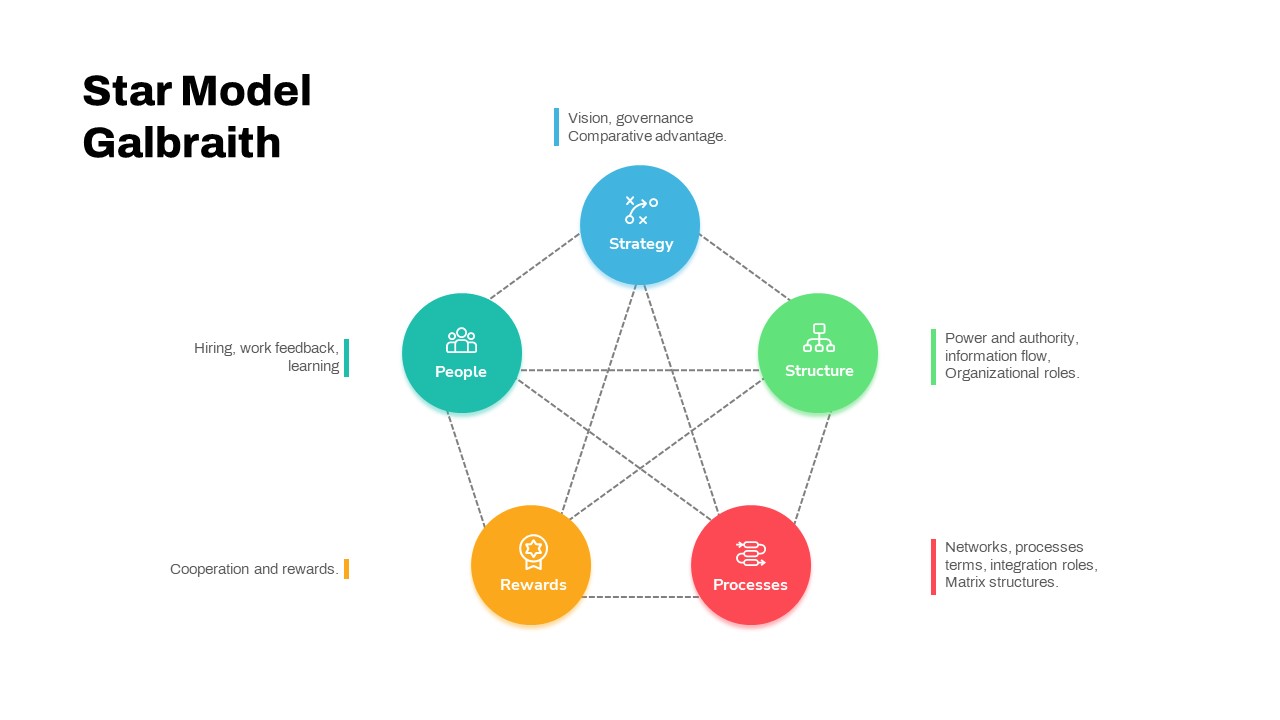
Star Model Galbraith Framework Template for PowerPoint & Google Slides
Business Strategy
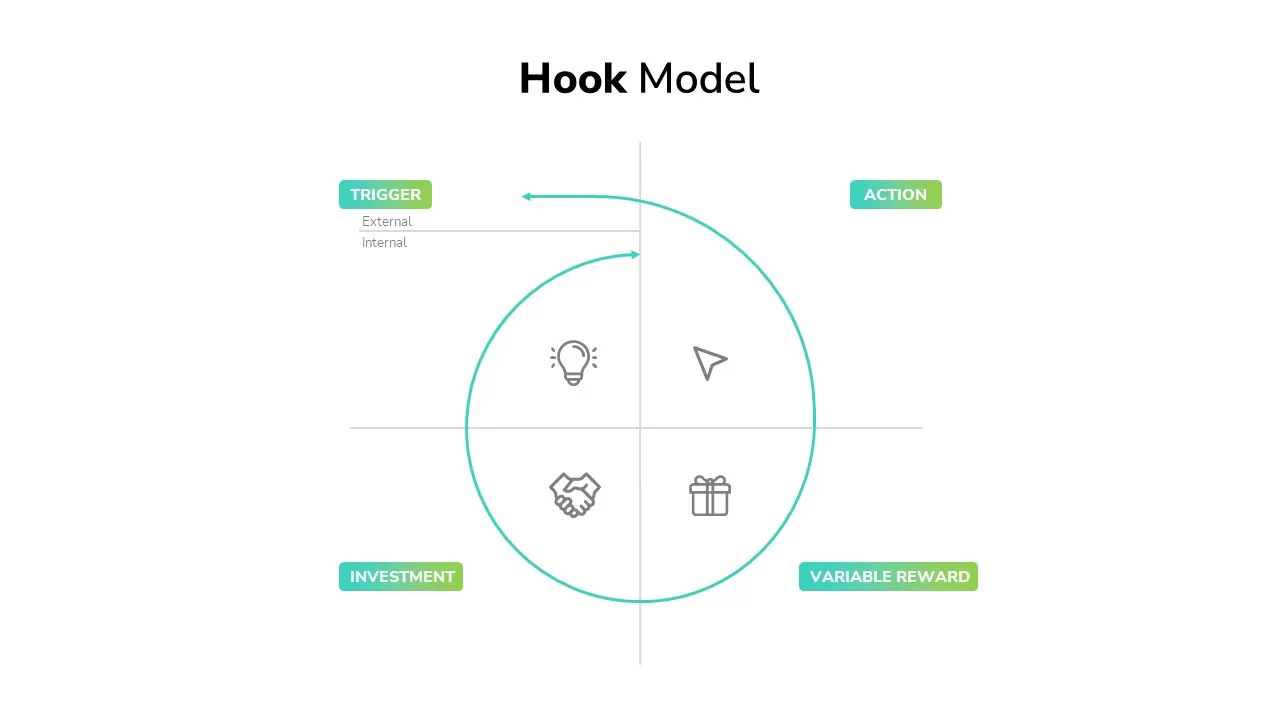
Hook Model Framework Template for PowerPoint & Google Slides
Business Strategy
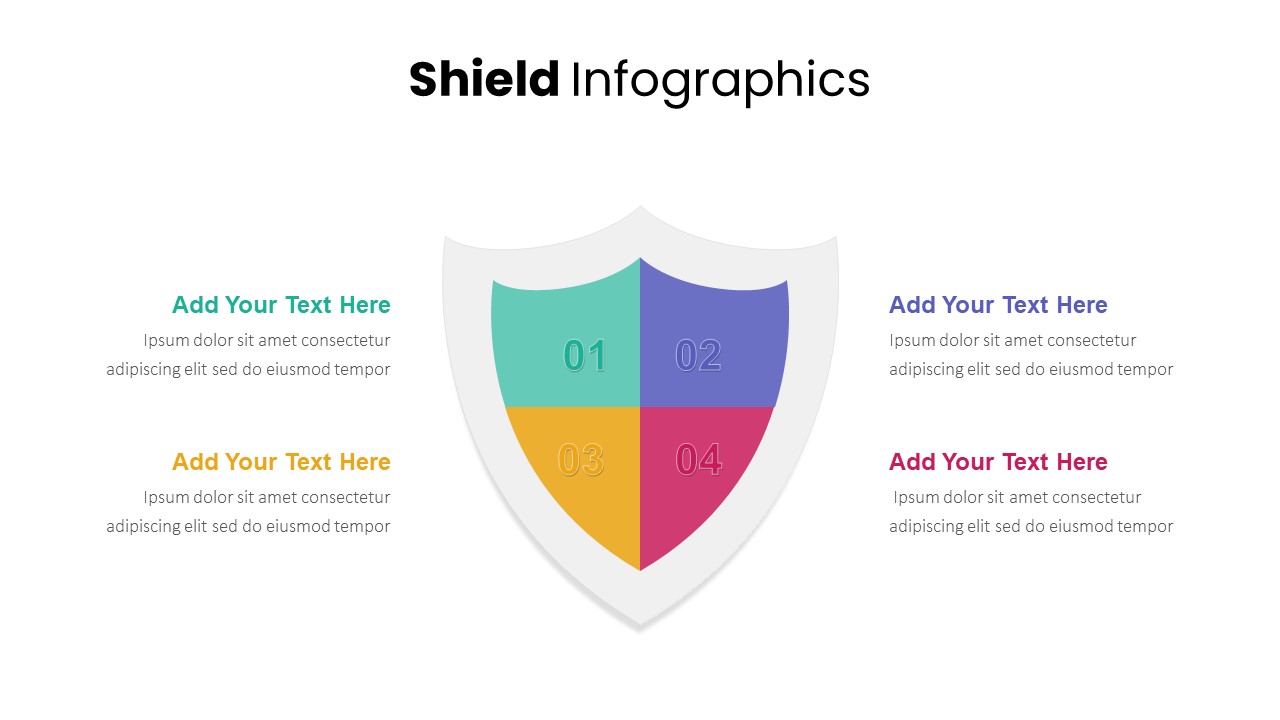
Shield Infographics Four-Part Framework Template for PowerPoint & Google Slides
Process
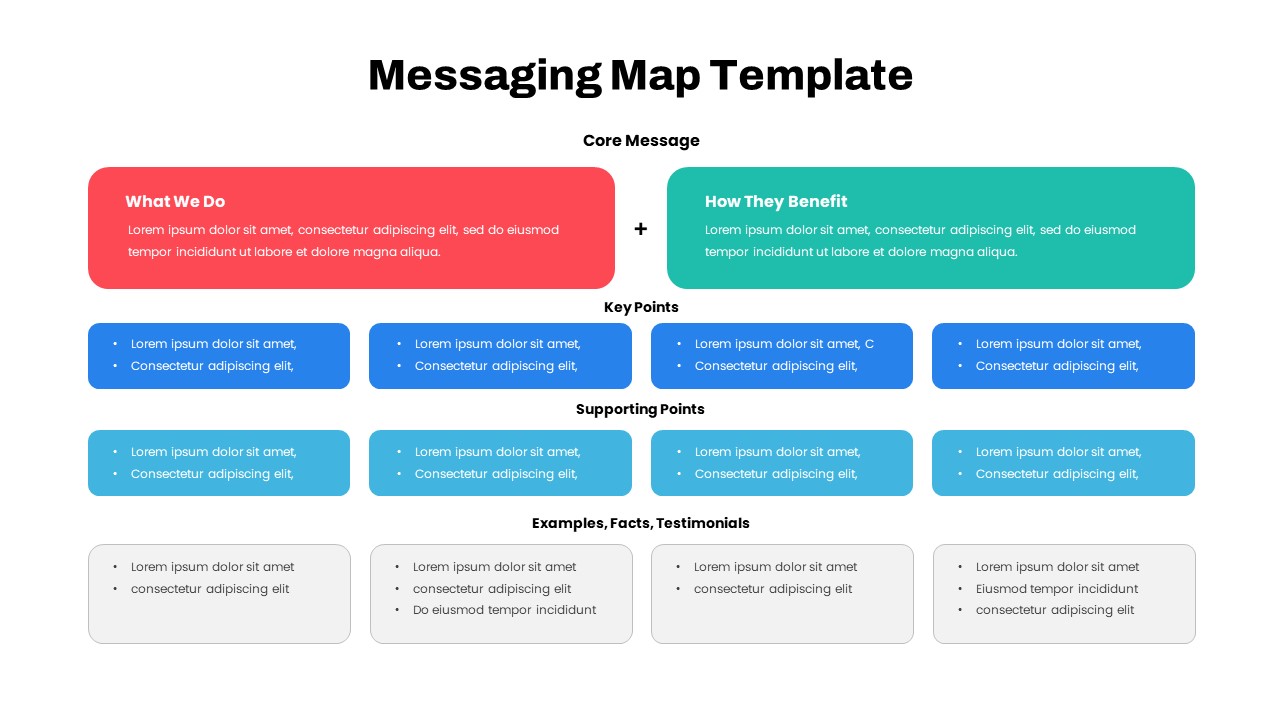
Comprehensive Messaging Map Framework Template for PowerPoint & Google Slides
Process
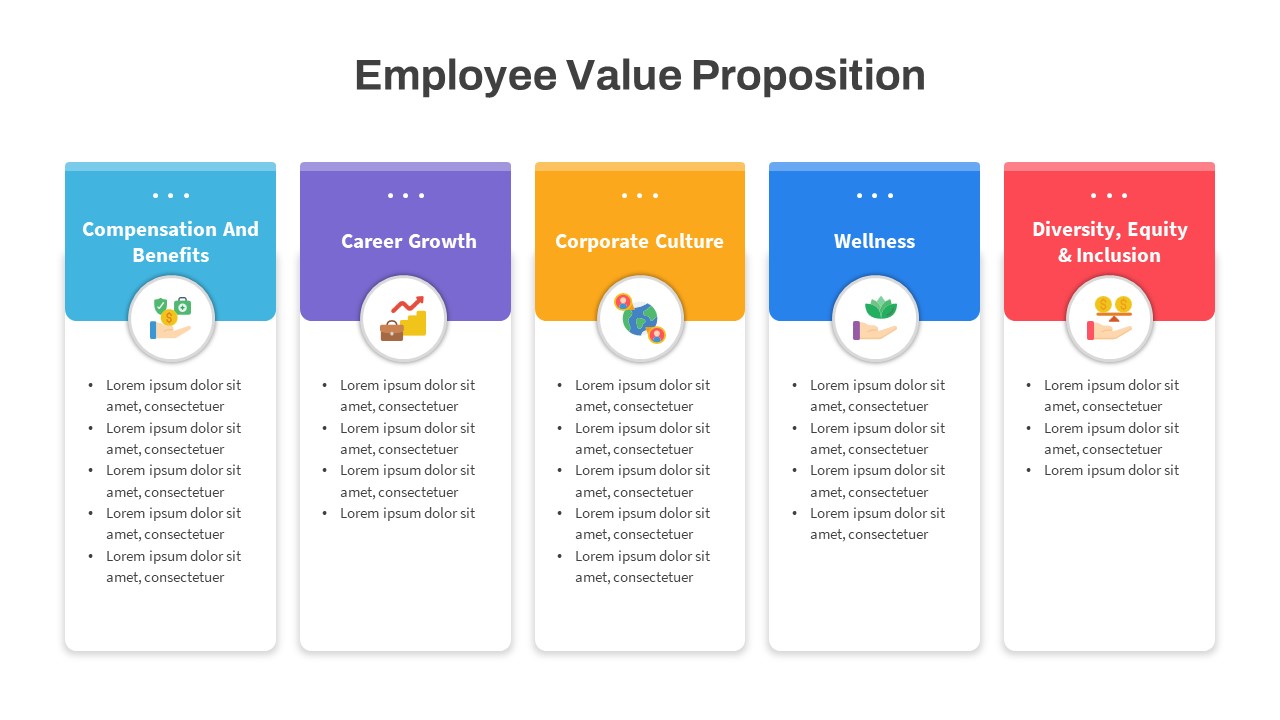
Employee Value Proposition Framework Template for PowerPoint & Google Slides
Recruitment
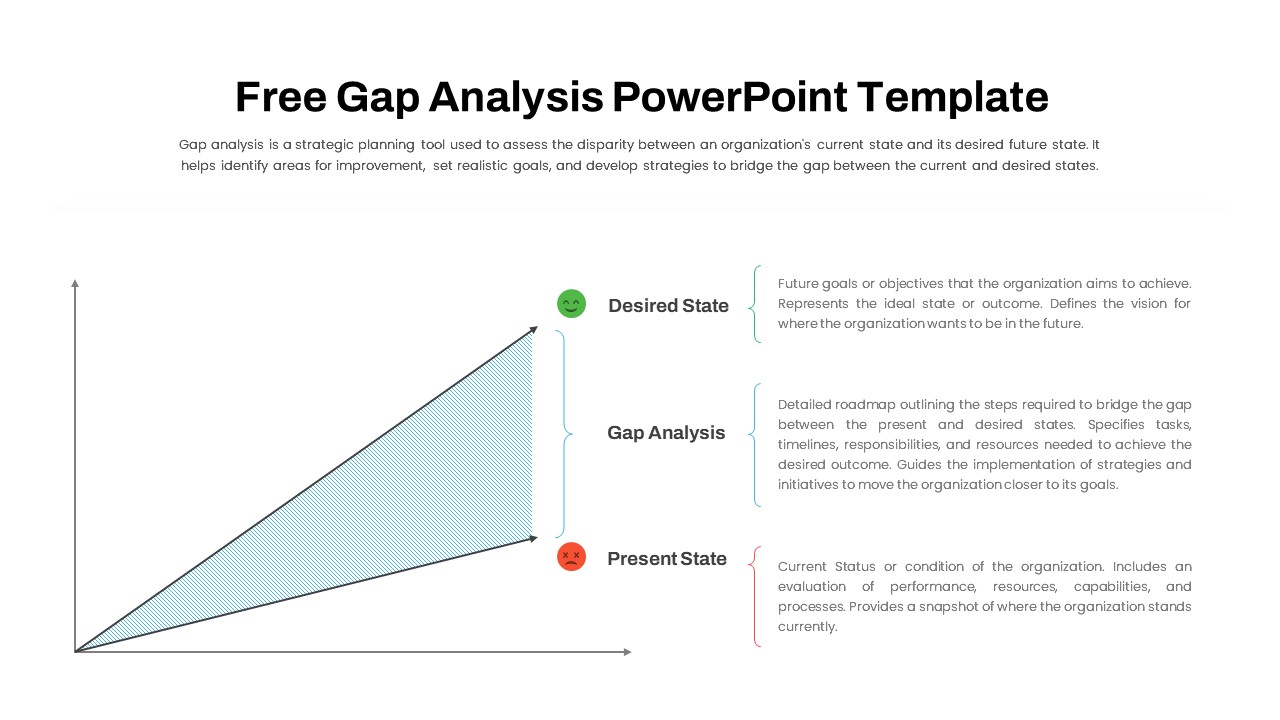
Free Comprehensive Gap Analysis Framework Template for PowerPoint & Google Slides
Opportunities Challenges
Free
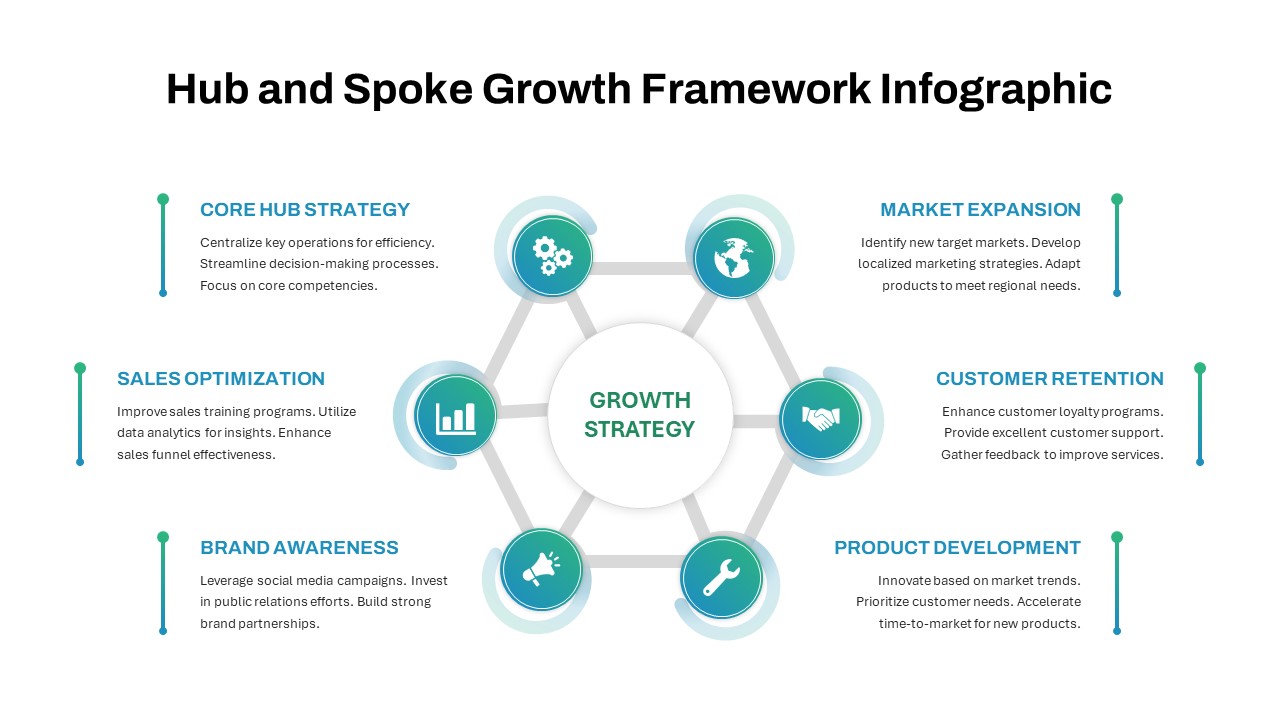
Hub and Spoke Growth Framework Template for PowerPoint & Google Slides
Circular
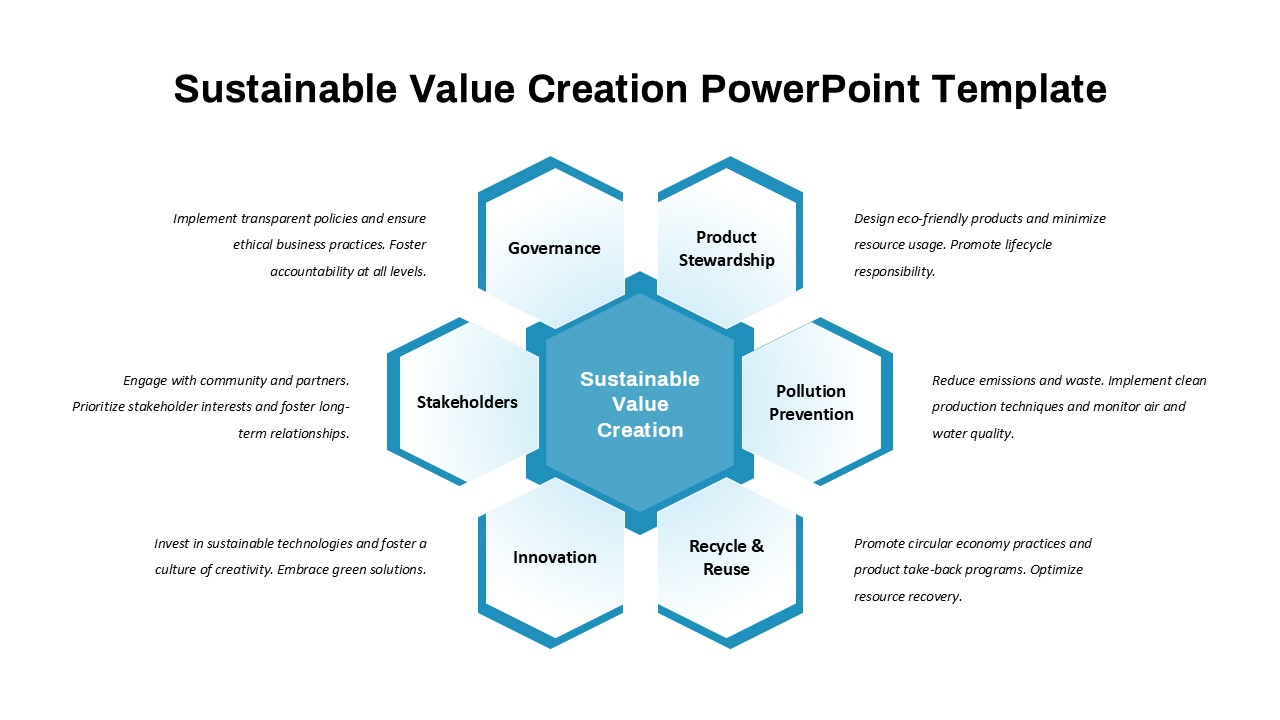
Sustainable Value Creation Framework Template for PowerPoint & Google Slides
Process
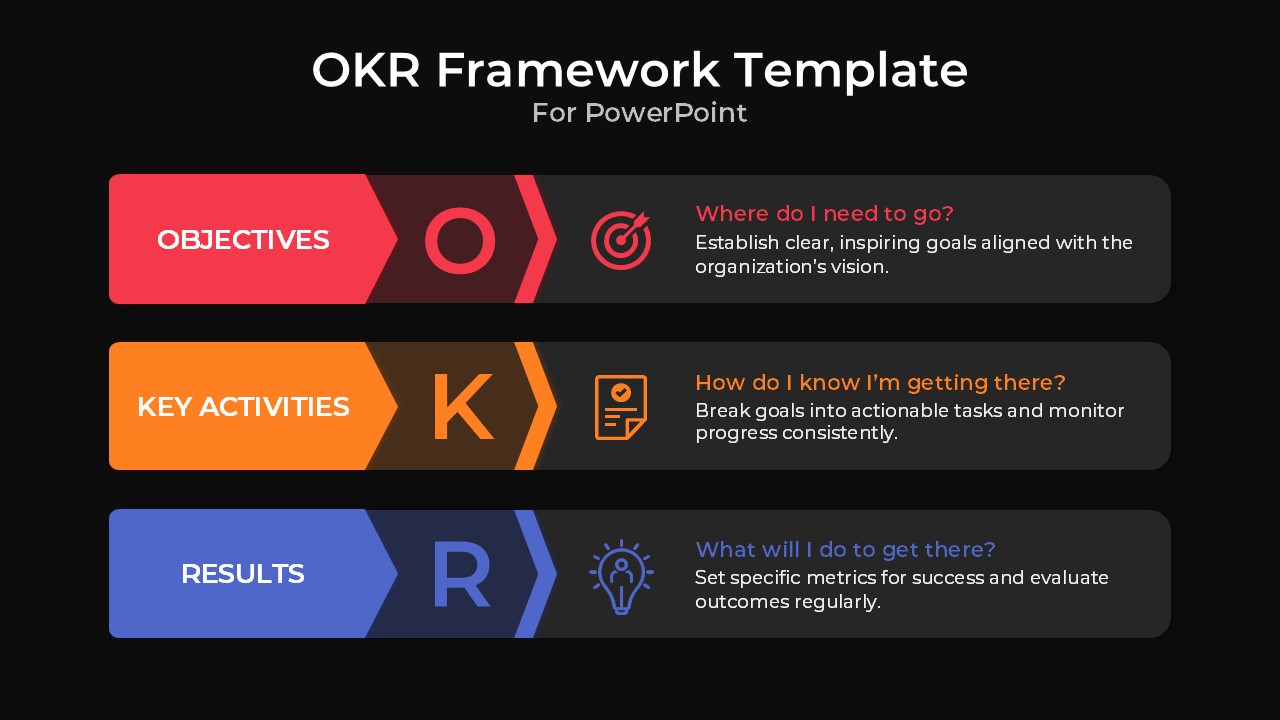
OKR Framework Template for PowerPoint & Google Slides
Process
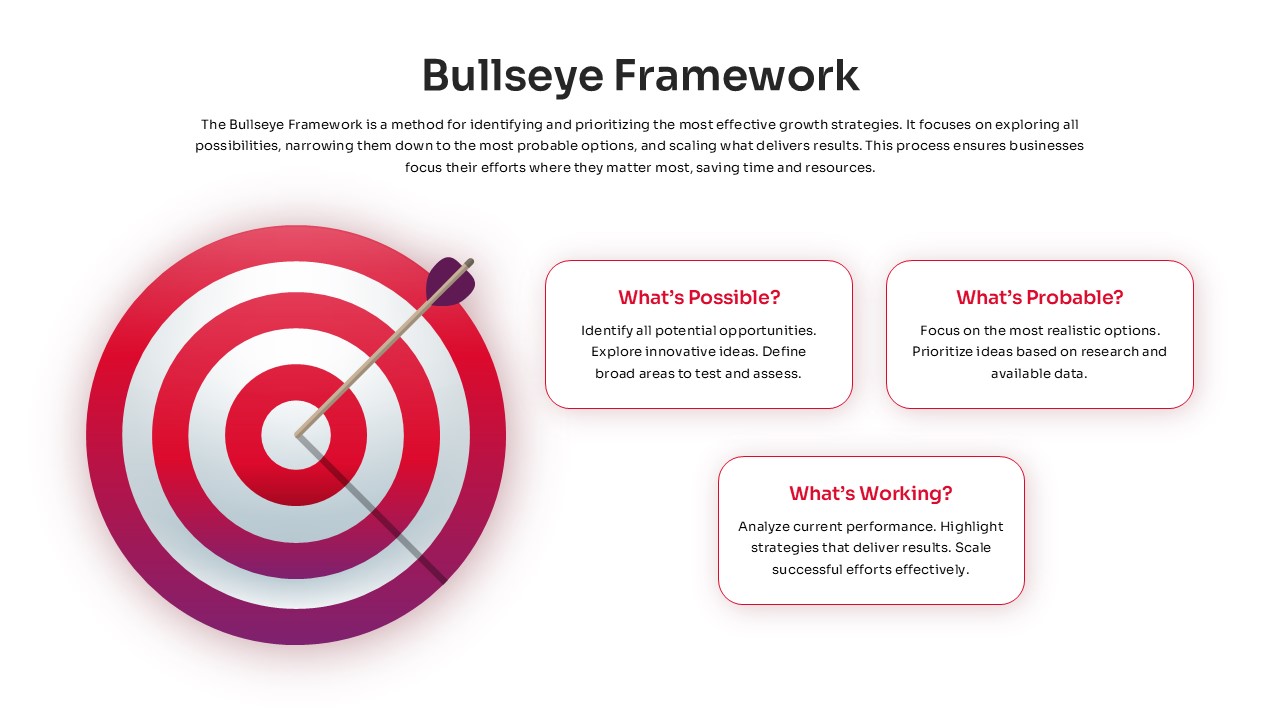
Bullseye Framework Growth Strategy Template for PowerPoint & Google Slides
Business Strategy
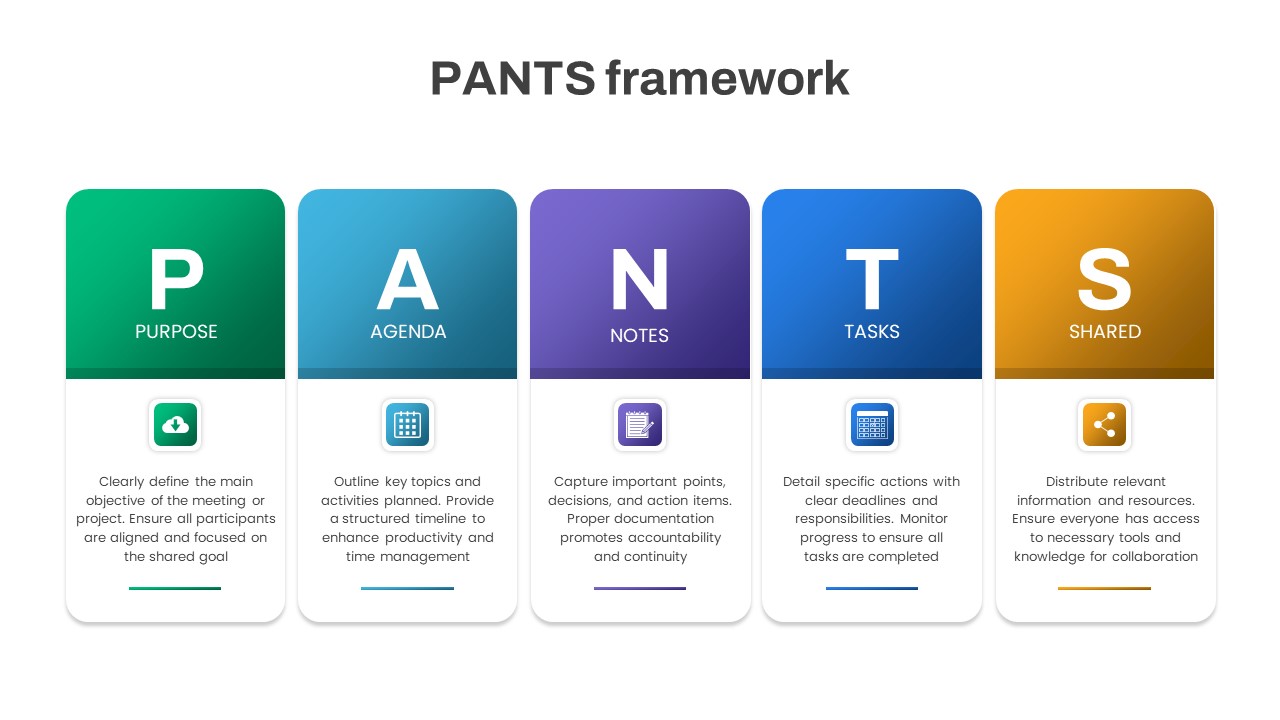
PANTS Framework for Effective Meetings Template for PowerPoint & Google Slides
Process
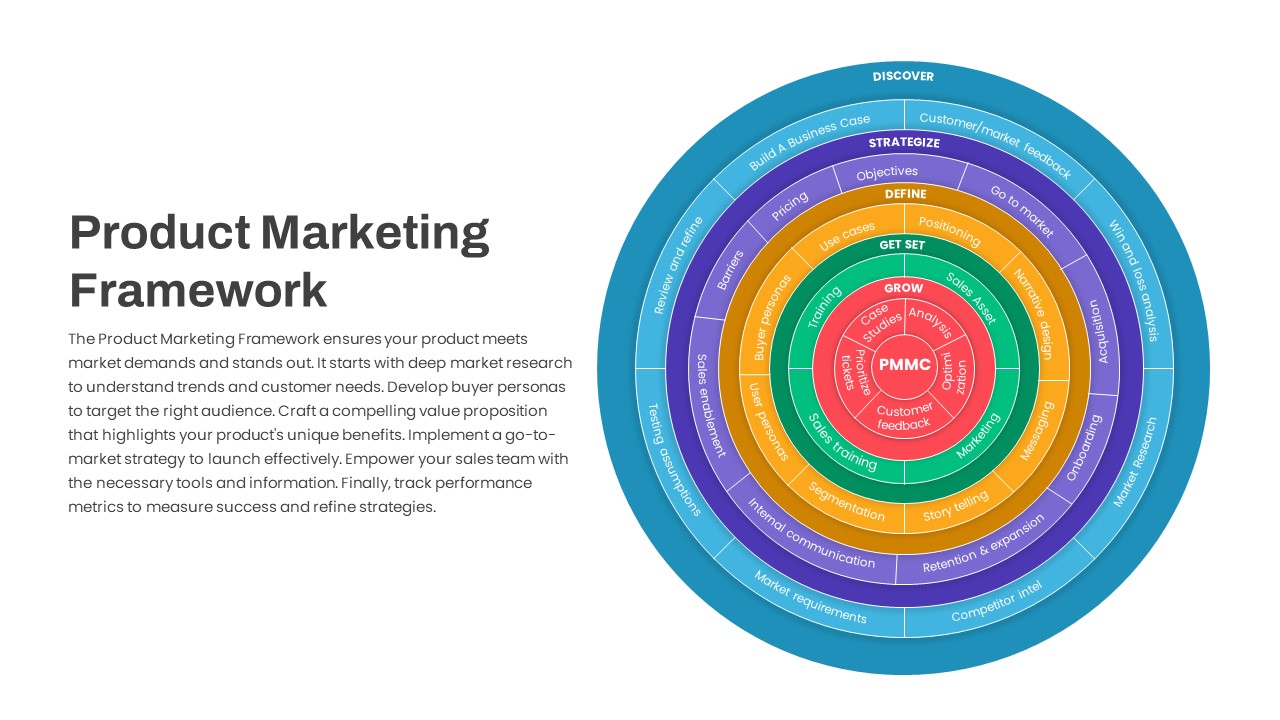
Product Marketing Framework Circular Template for PowerPoint & Google Slides
Circular
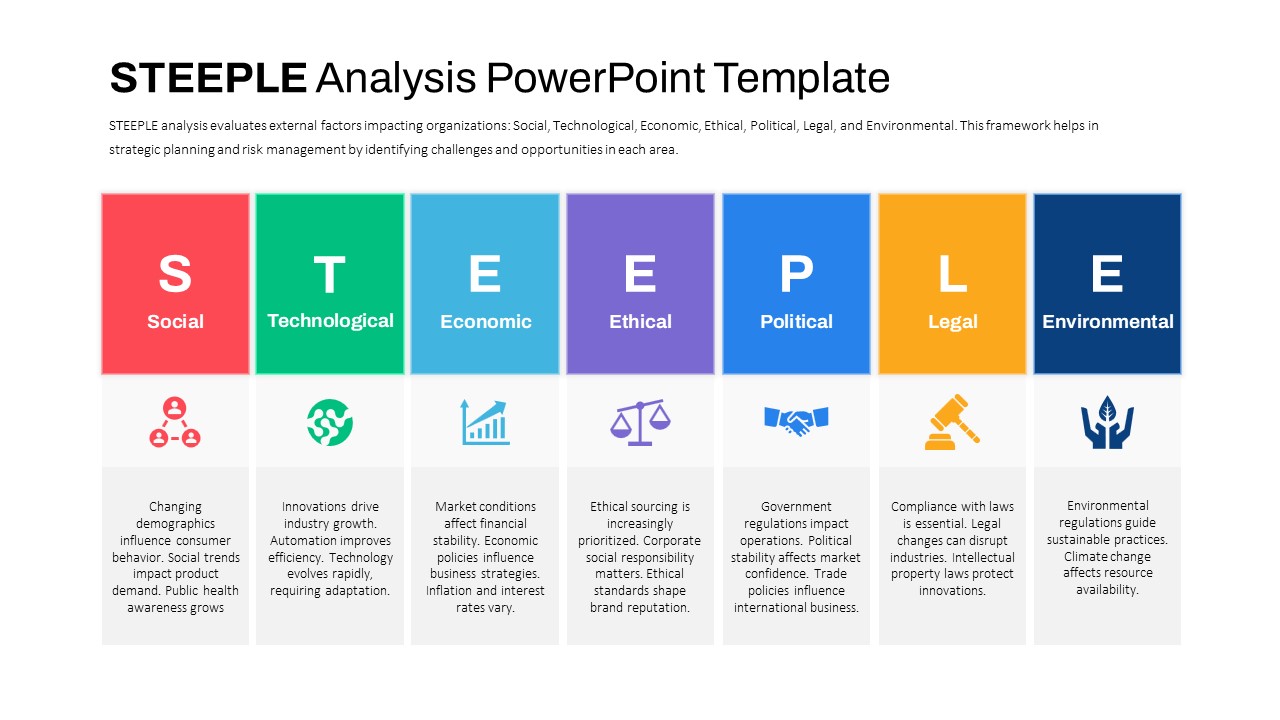
STEEPLE Analysis framework template for PowerPoint & Google Slides
Business Strategy
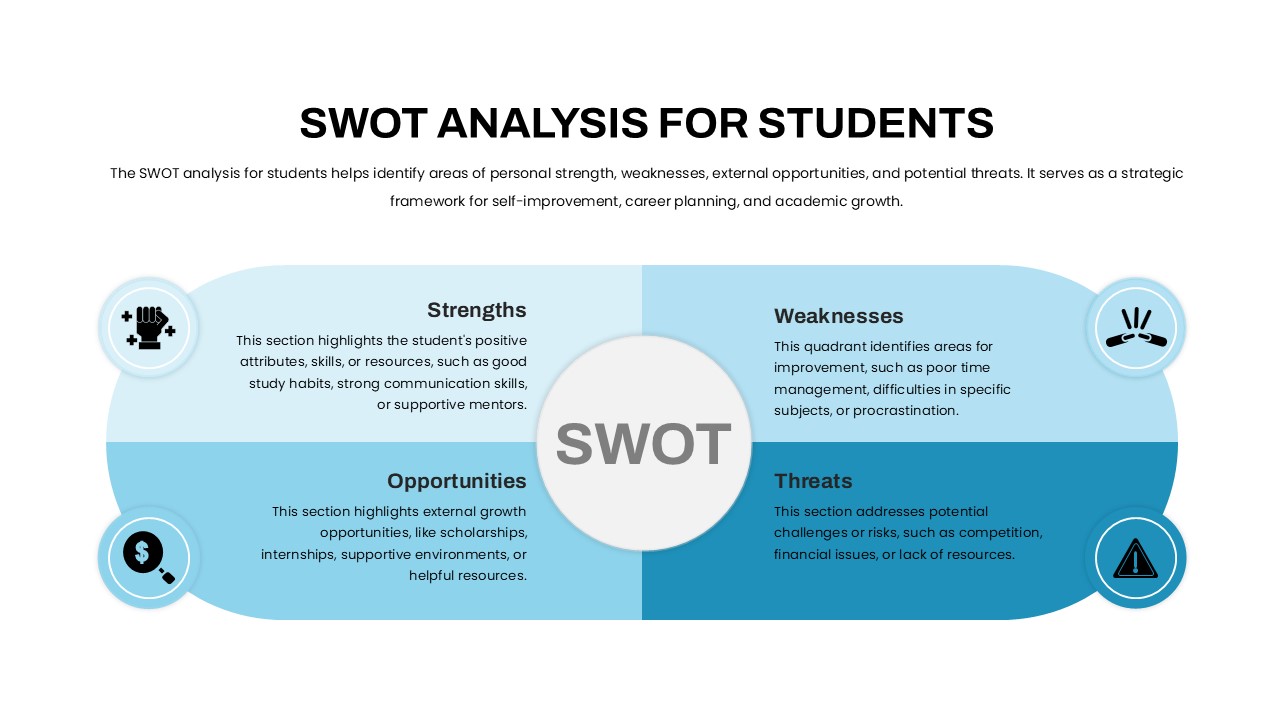
Student SWOT Analysis Framework Template for PowerPoint & Google Slides
SWOT
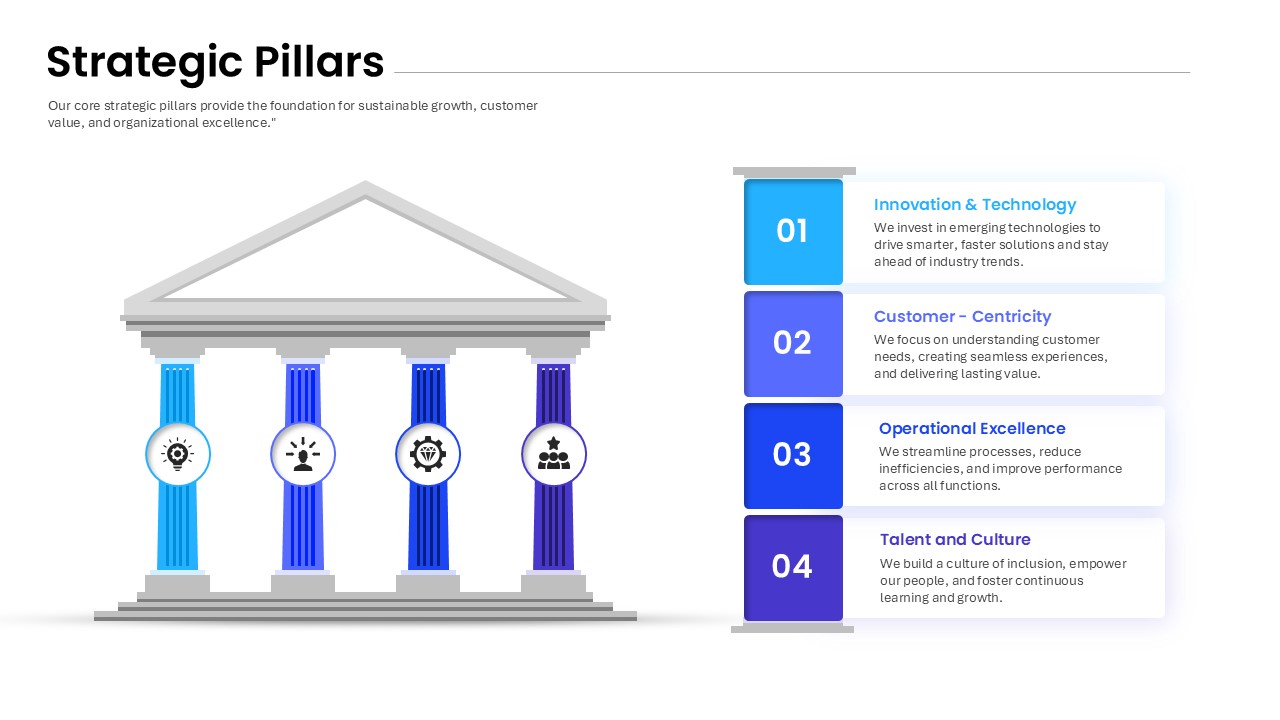
Strategic Pillars Foundation Framework Template for PowerPoint & Google Slides
Business Strategy
Personal Branding Canvas Framework Template for PowerPoint & Google Slides
Circular
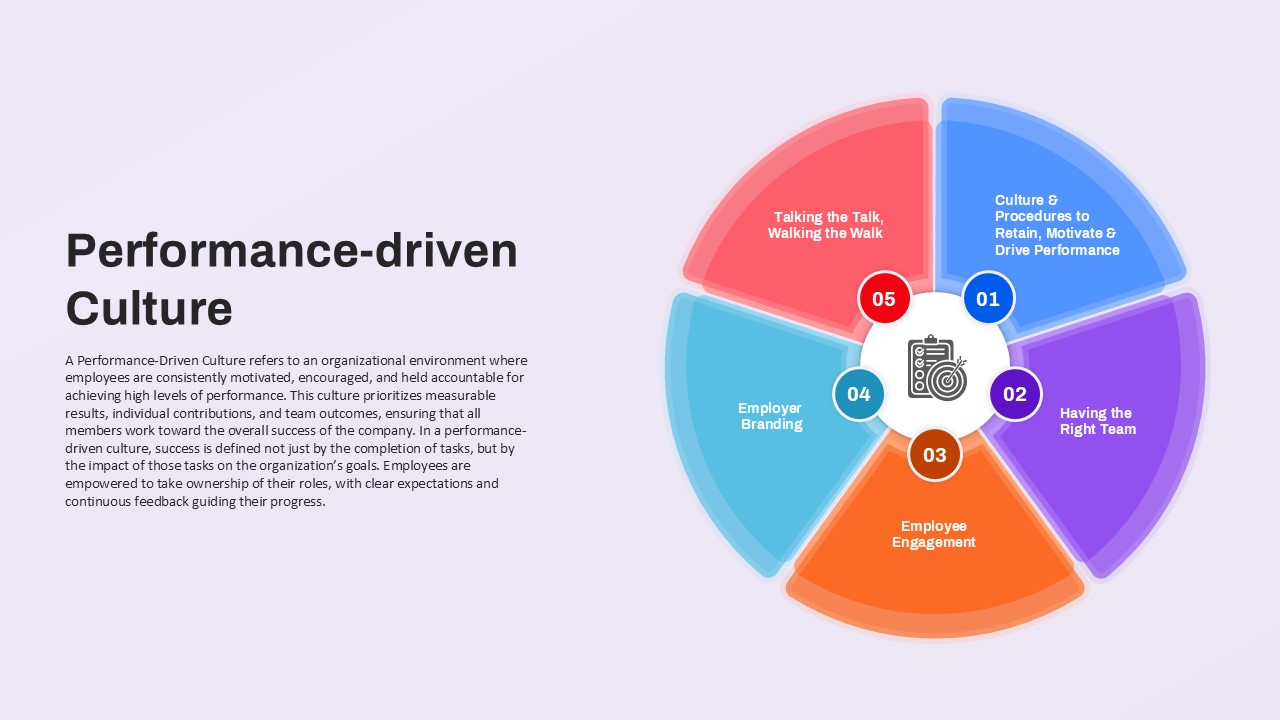
Performance-driven Culture framework template for PowerPoint & Google Slides
Leadership
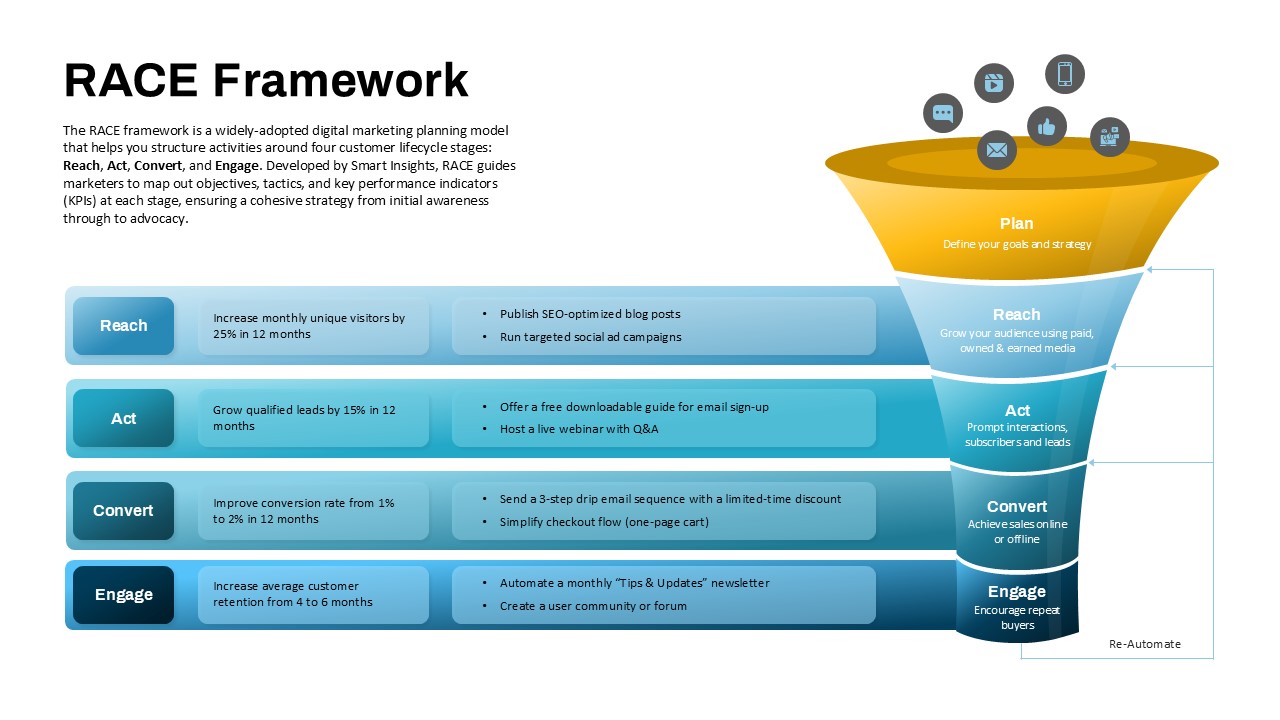
RACE Framework for Digital Marketing Strategy template for PowerPoint & Google Slides
Funnel
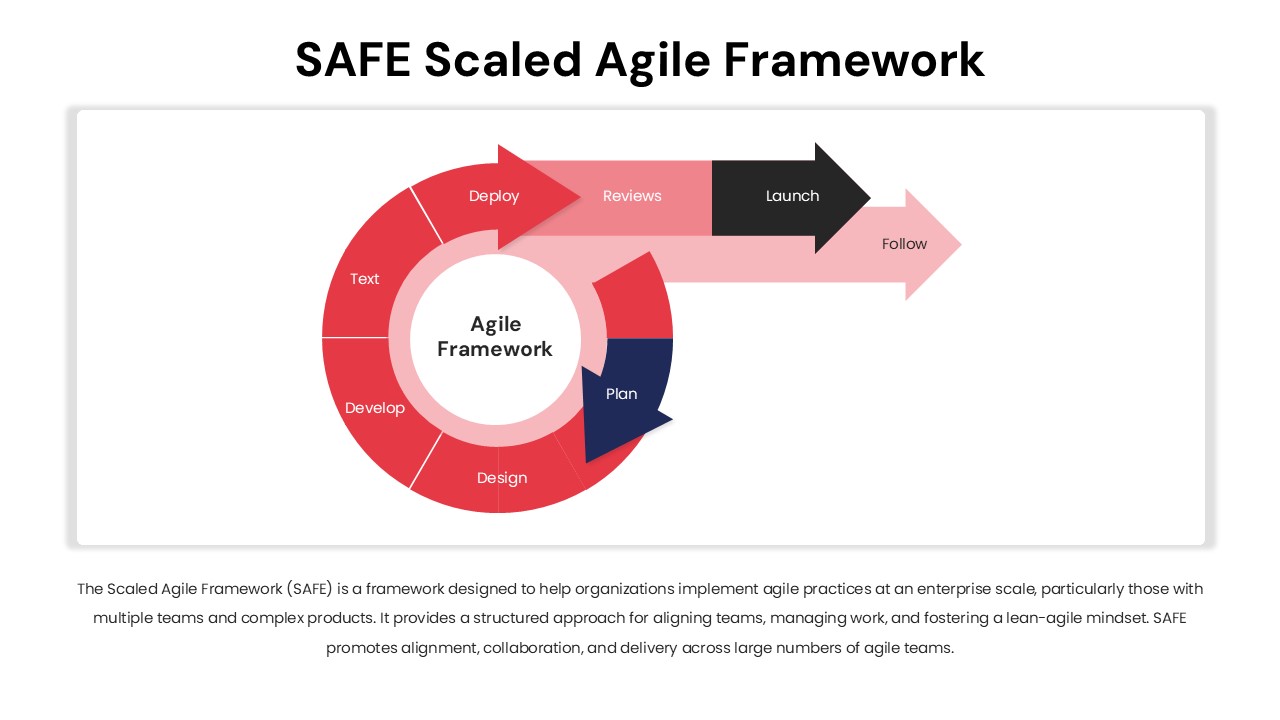
SAFE Scaled Agile Framework Template for PowerPoint & Google Slides
Process
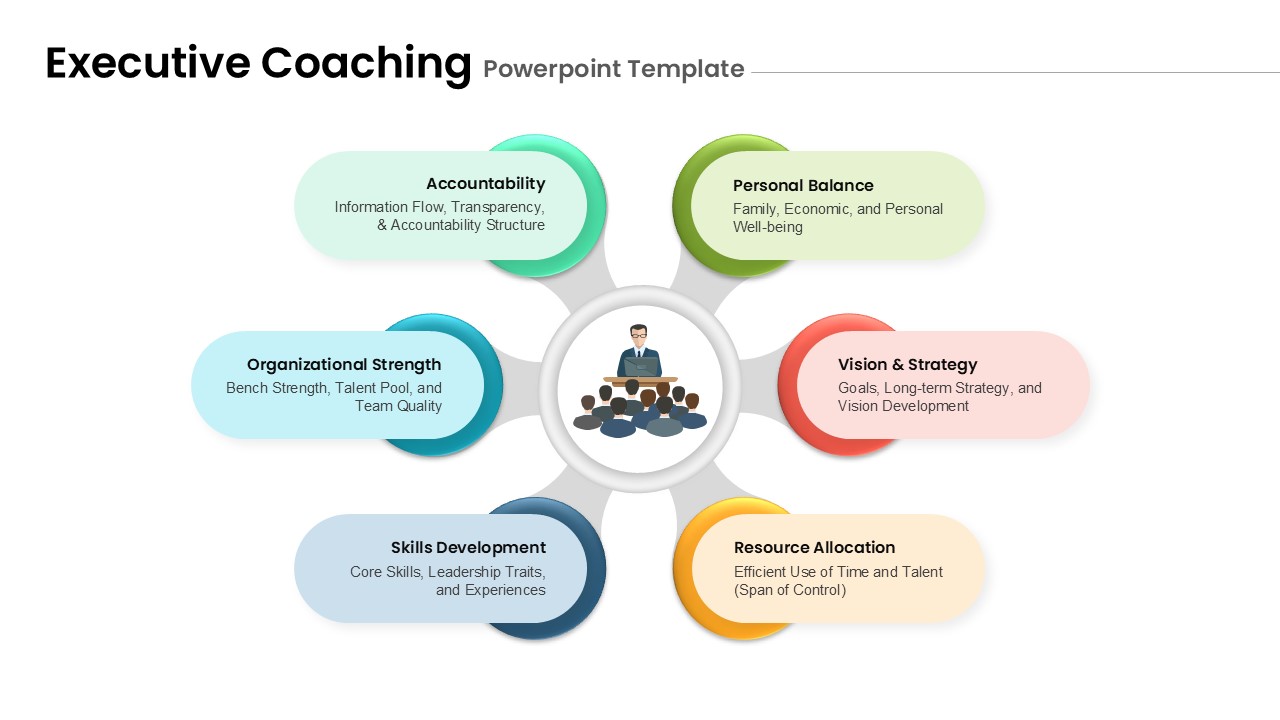
Executive Coaching Framework template for PowerPoint & Google Slides
Leadership
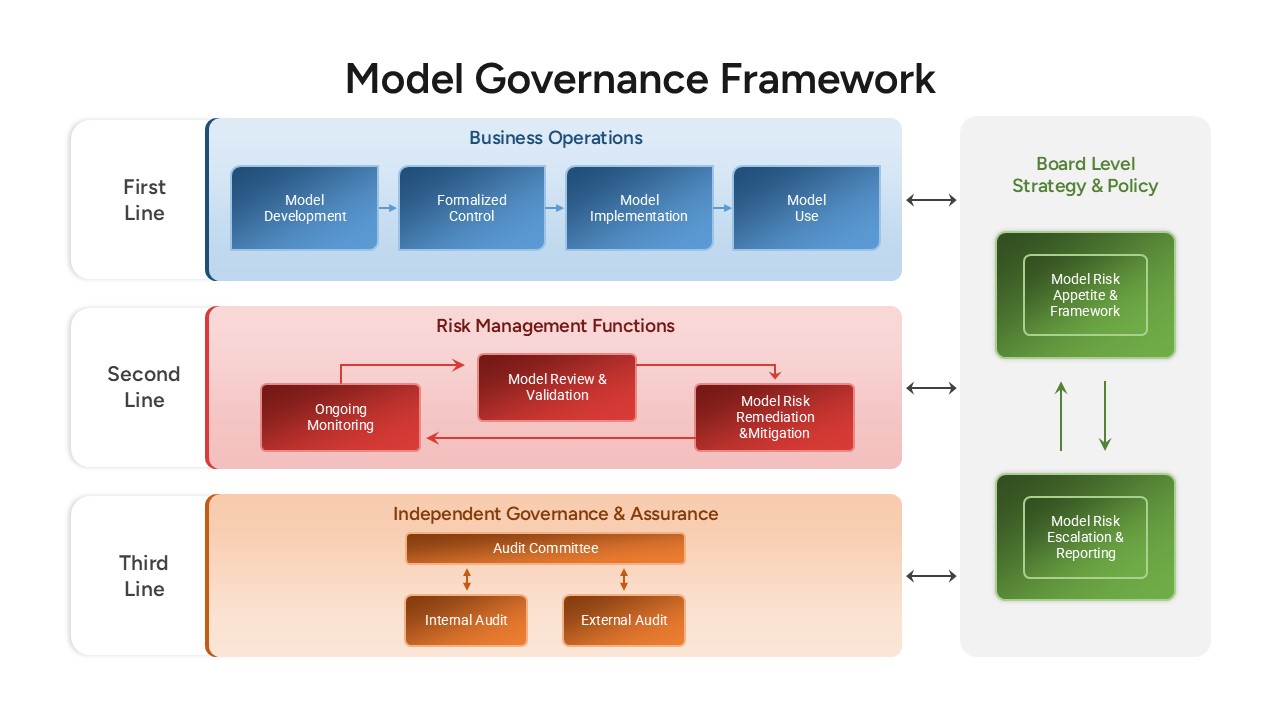
Model Governance Framework Template for PowerPoint & Google Slides
Risk Management
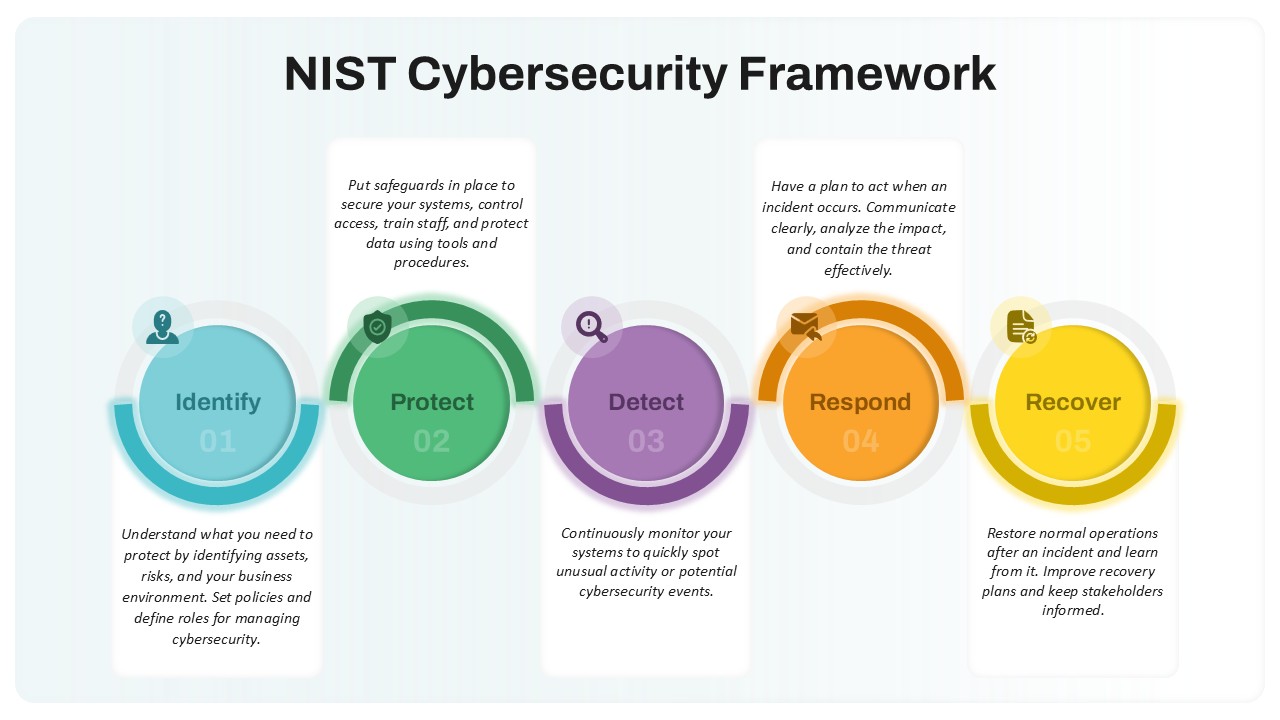
NIST Cybersecurity Framework Overview template for PowerPoint & Google Slides
Technology
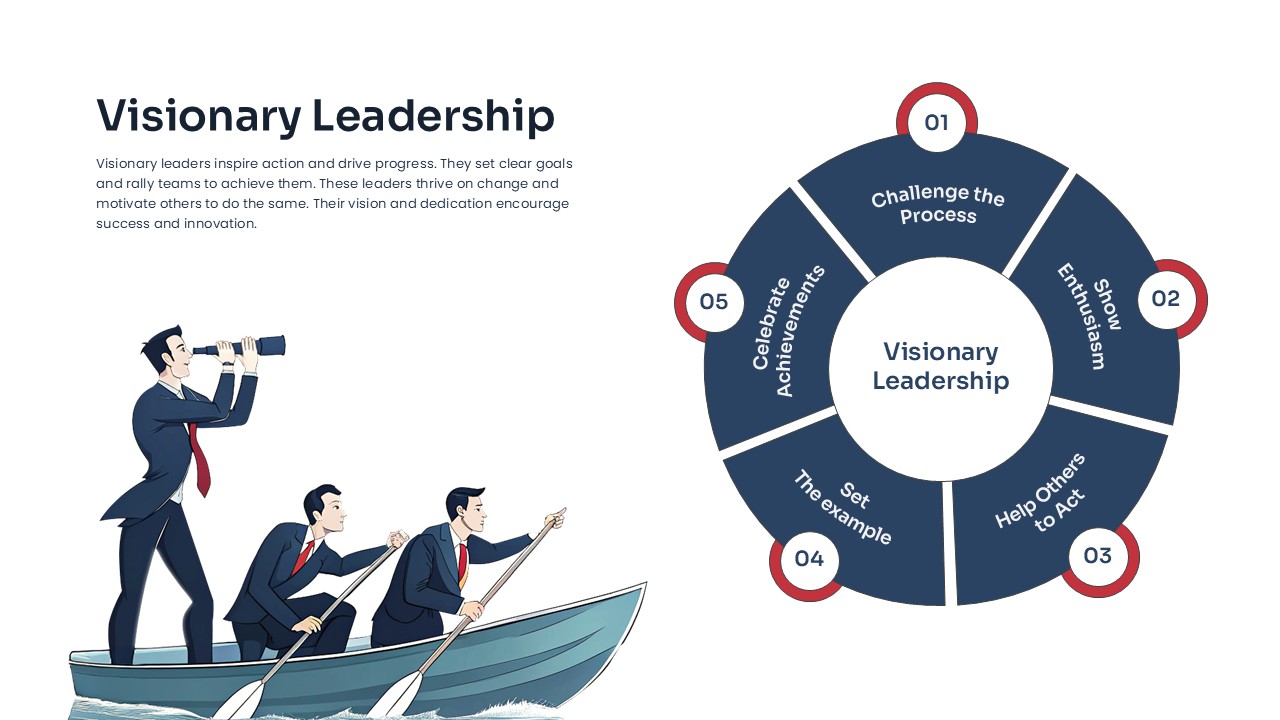
Visionary Leadership Framework template for PowerPoint & Google Slides
Business

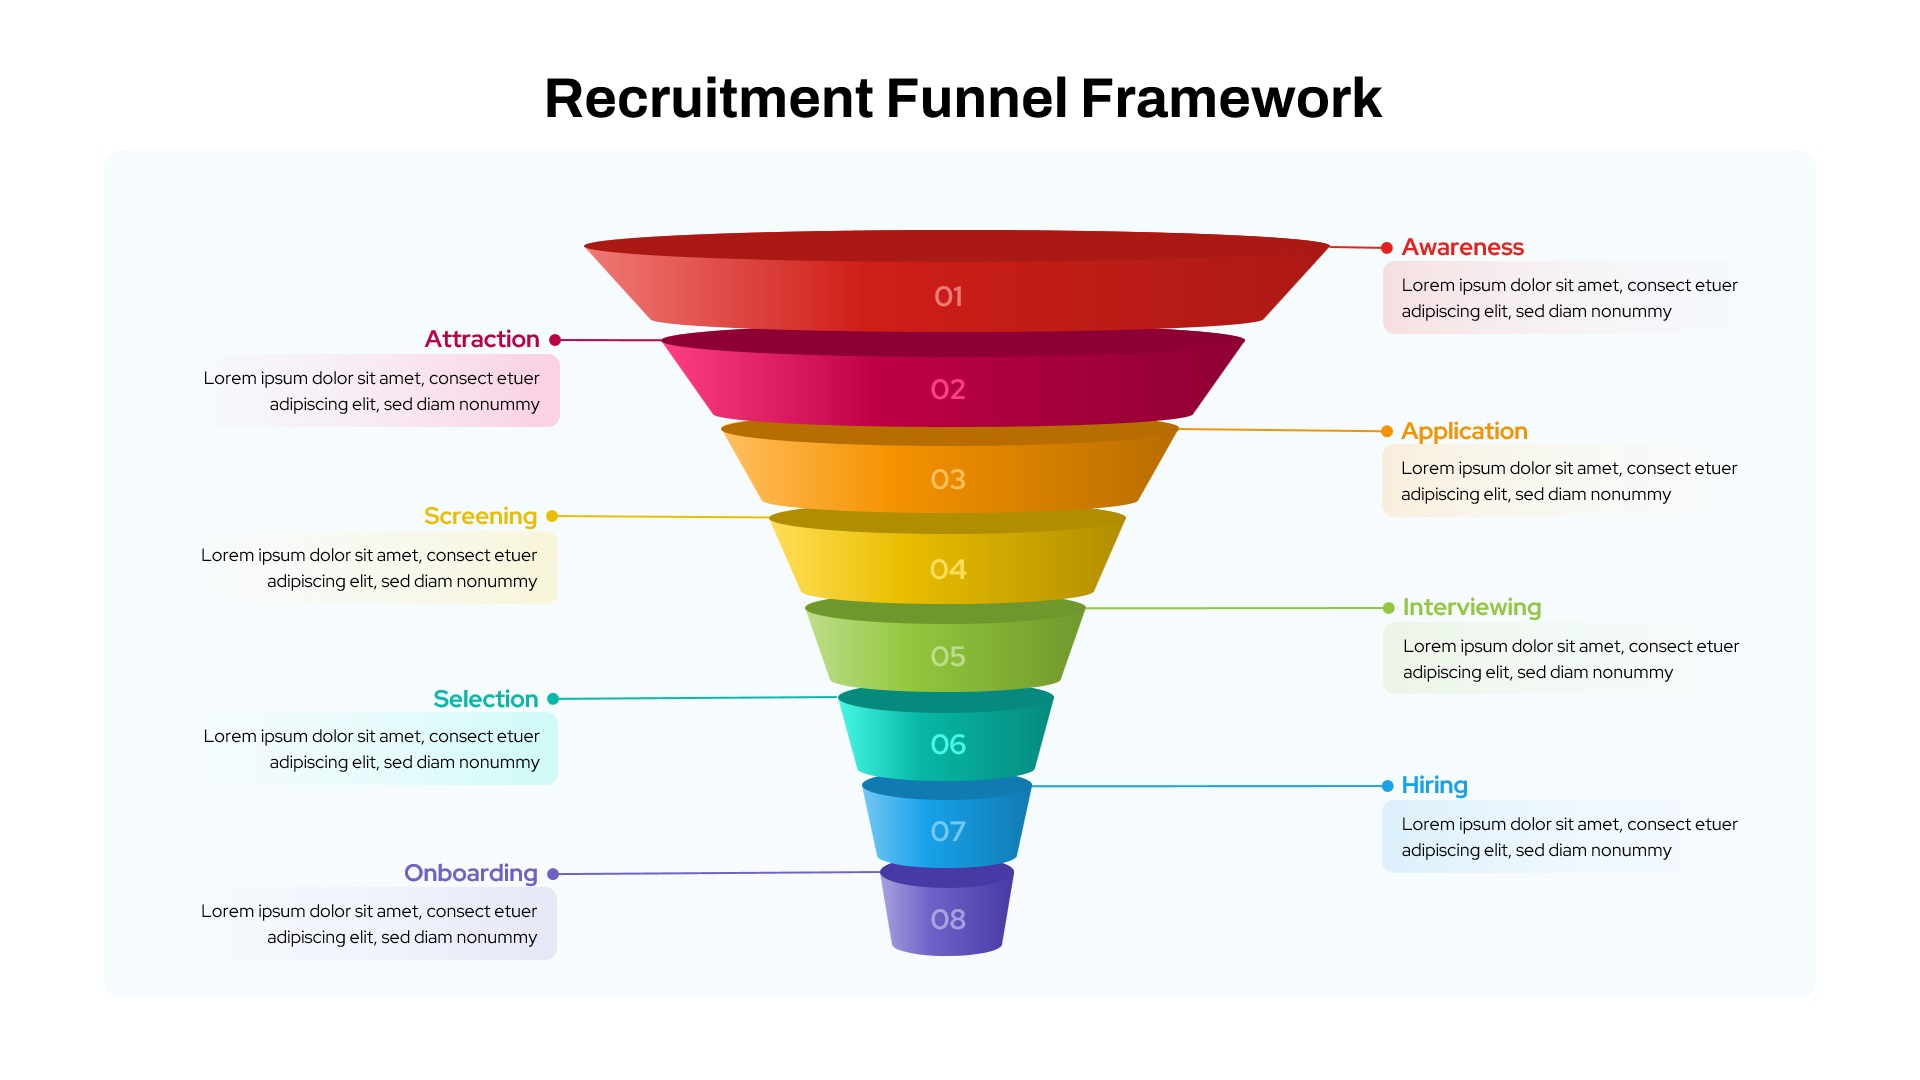
Recruitment Funnel Framework template for PowerPoint & Google Slides
Recruitment
Pirate Metrics AARRR Funnel Framework Template for PowerPoint & Google Slides
Funnel
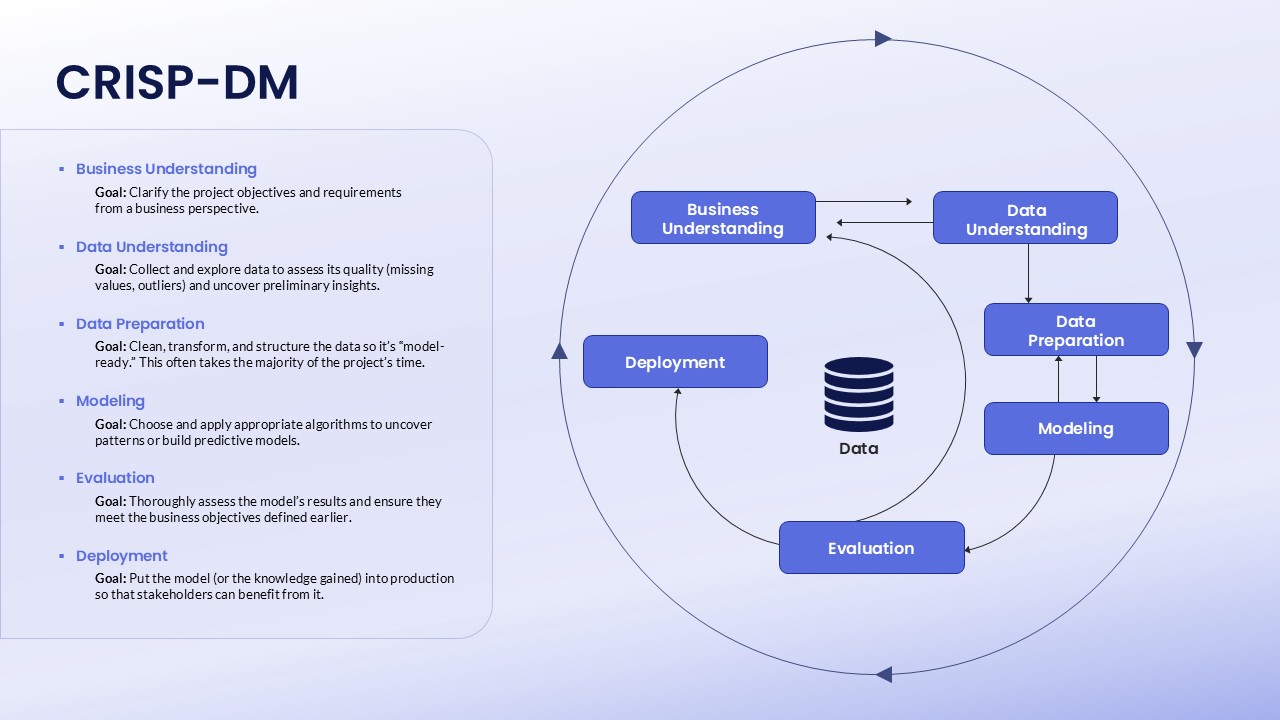
CRISP-DM Process Framework template for PowerPoint & Google Slides
Technology
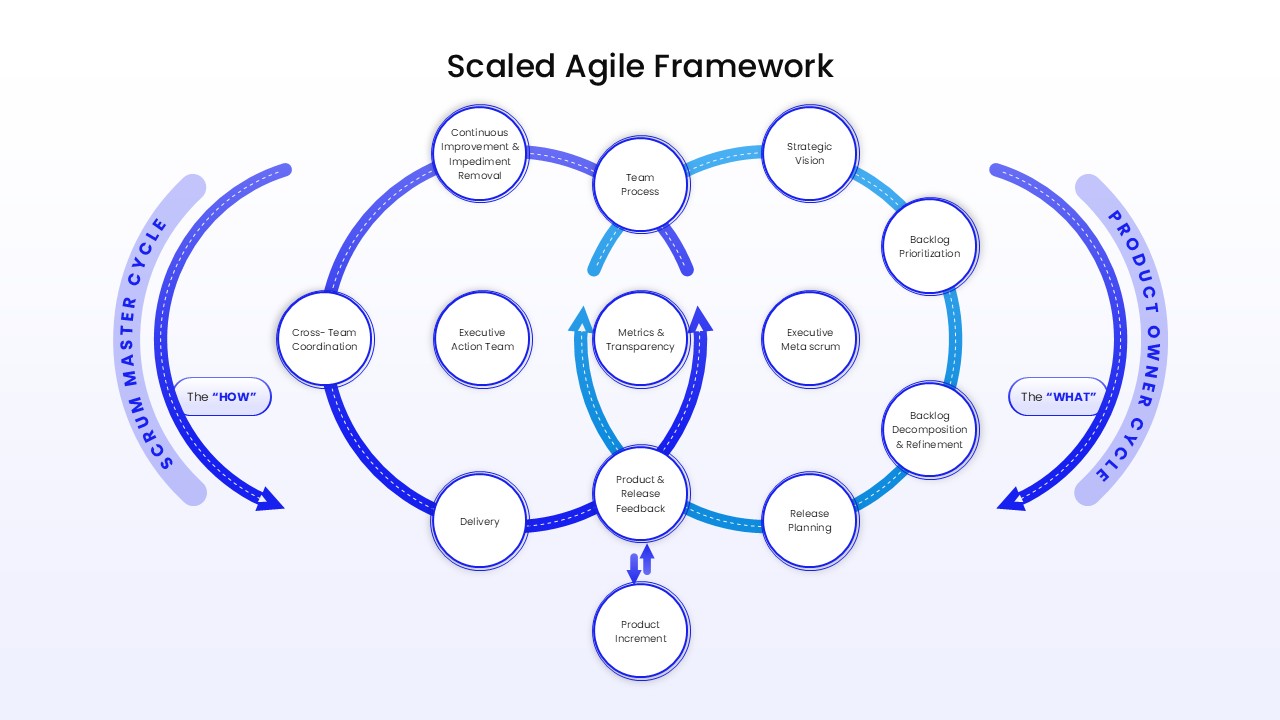
Two-Cycle Scaled Agile Framework Template for PowerPoint & Google Slides
Scrum
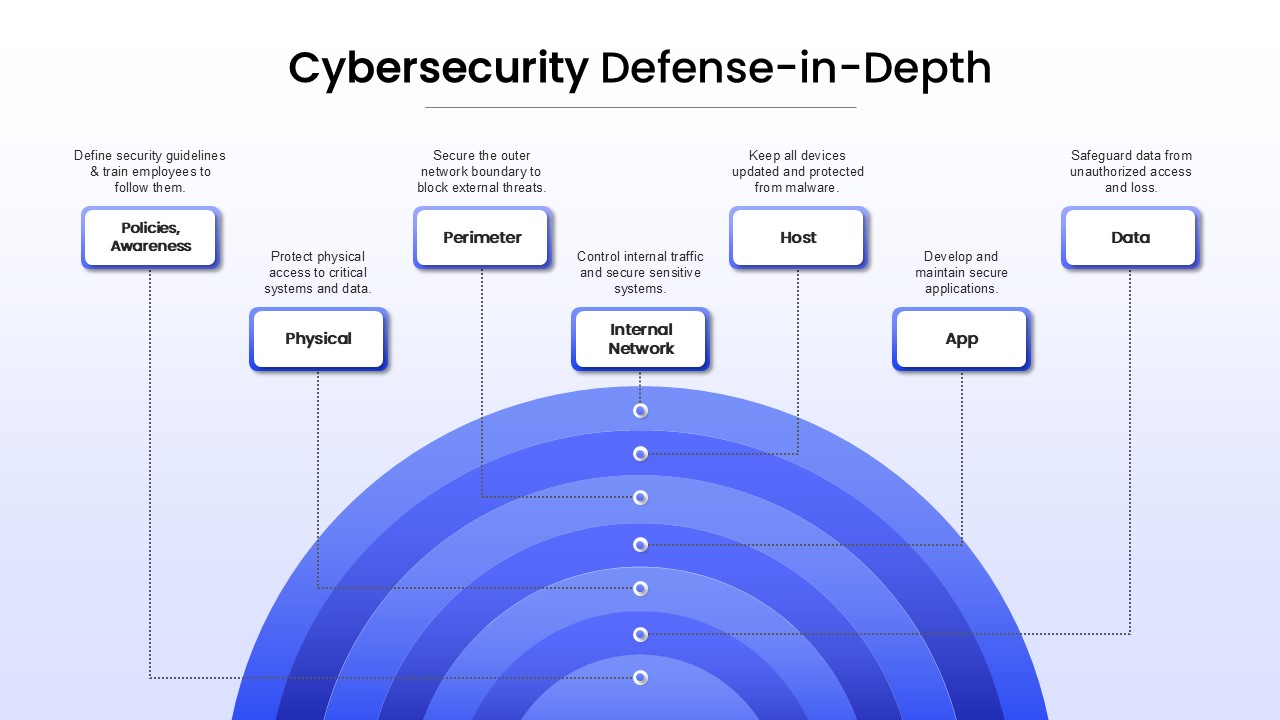
Cybersecurity Defense-in-Depth Framework template for PowerPoint & Google Slides
Technology
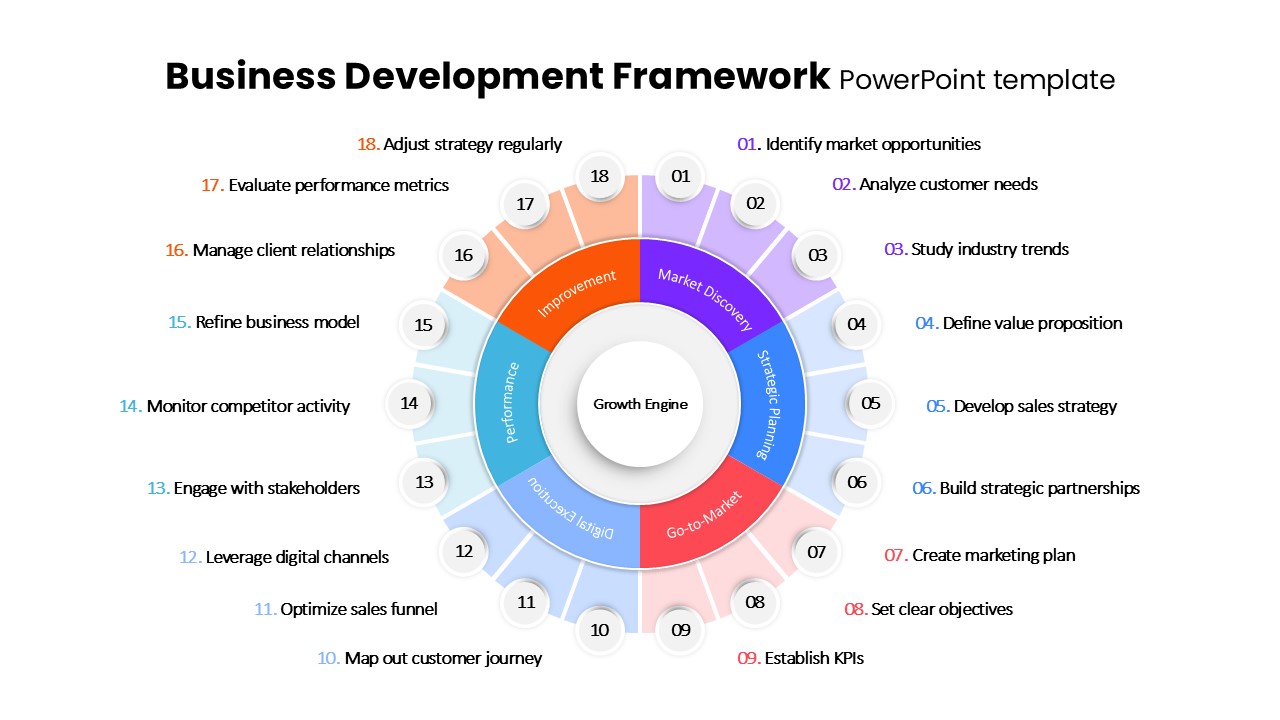
Business Development Framework Pack Template for PowerPoint & Google Slides
Business Strategy
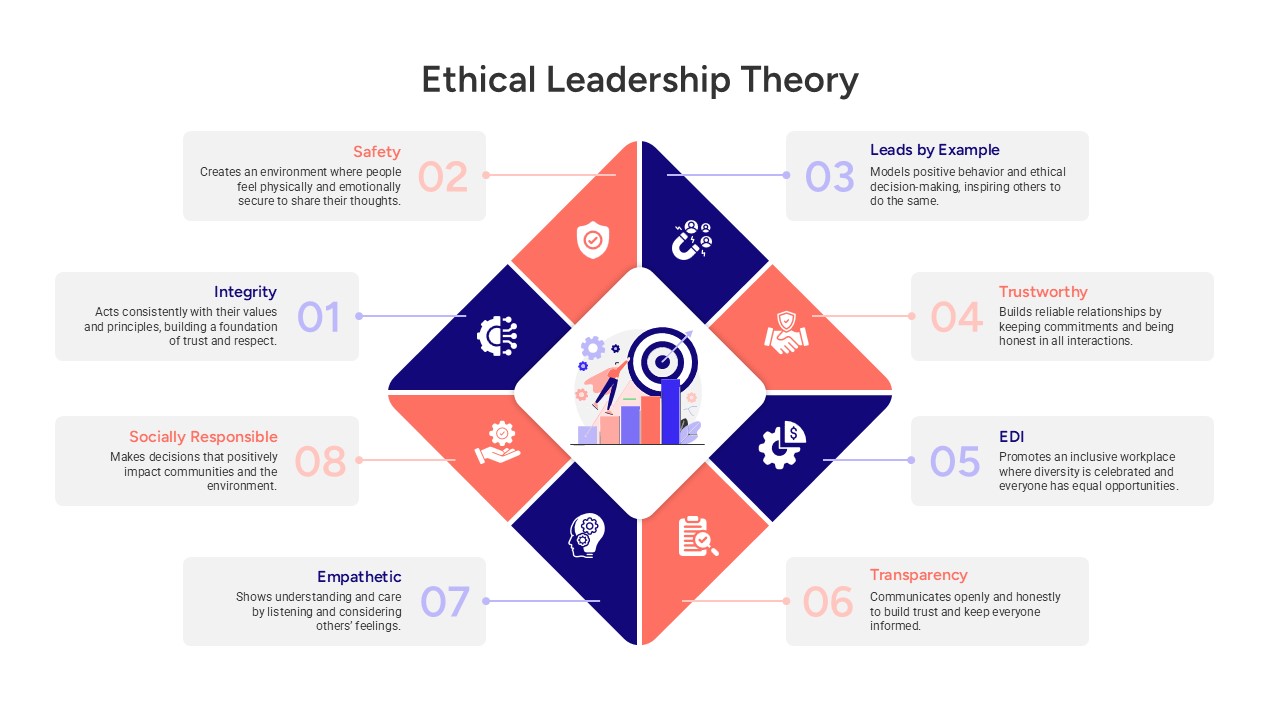
Ethical Leadership Theory Framework Template for PowerPoint & Google Slides
Leadership
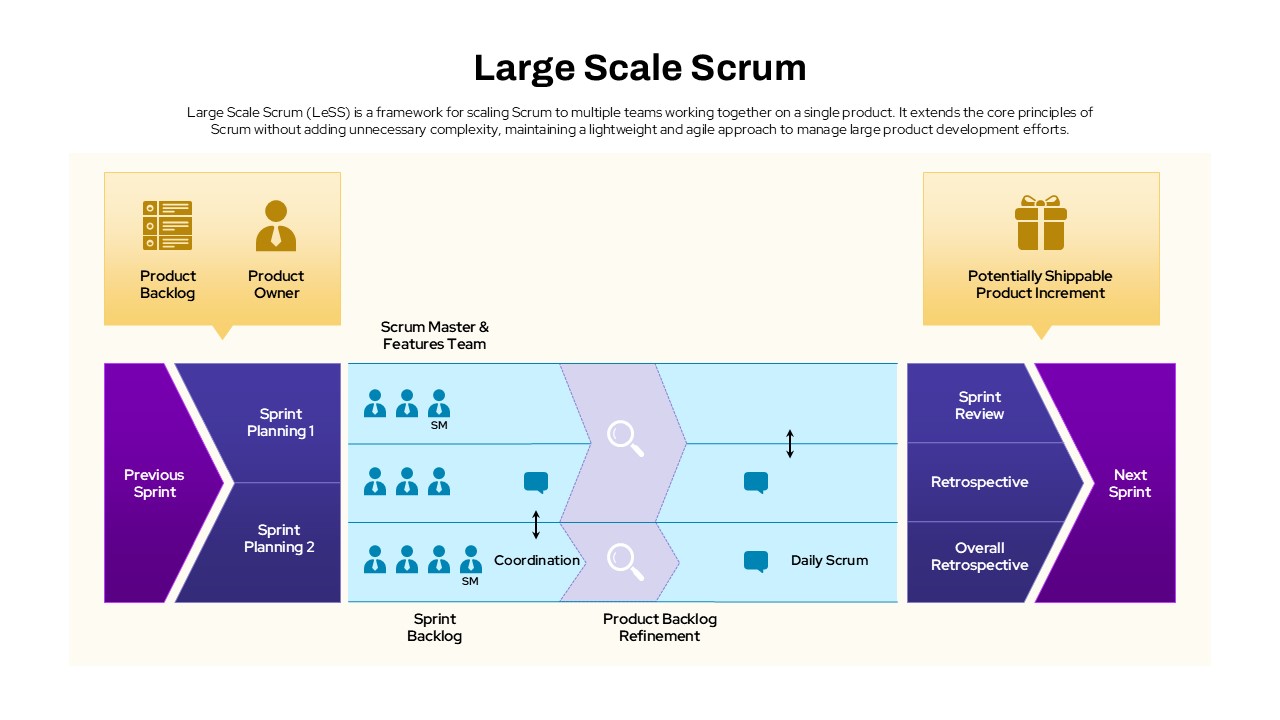
Large Scale Scrum Framework Process Template for PowerPoint & Google Slides
Scrum
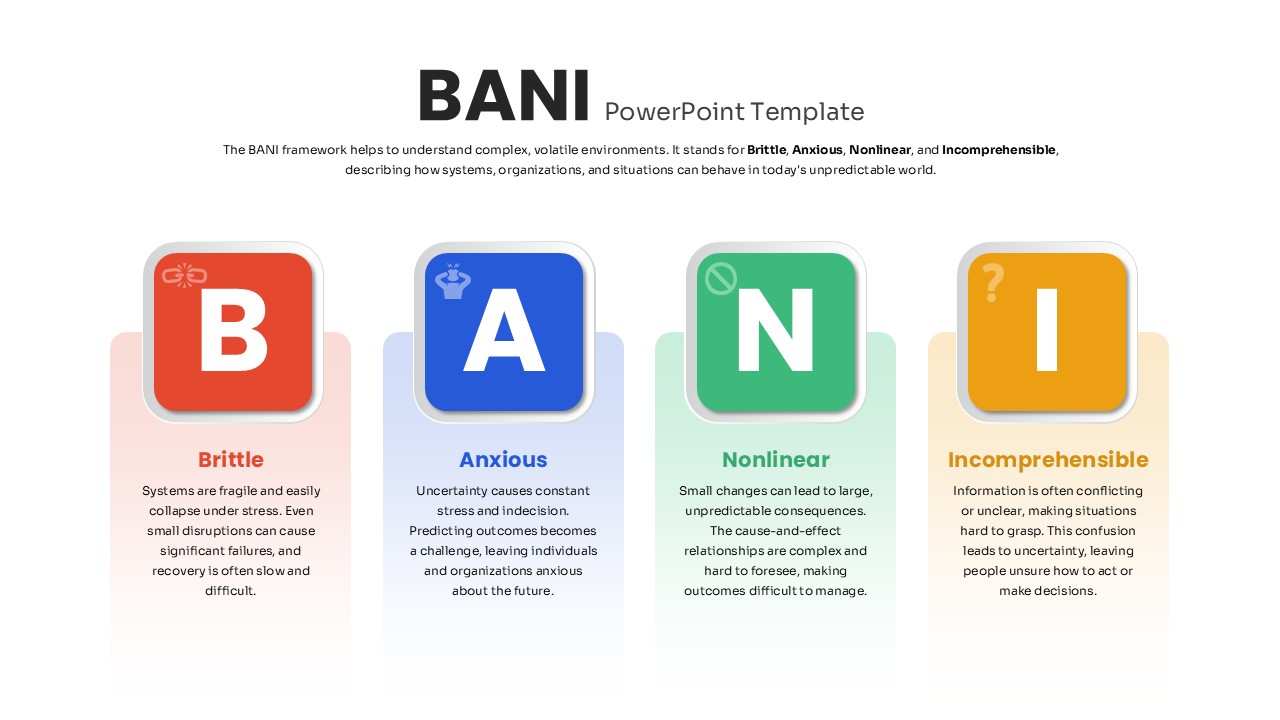
Four-Part BANI Framework Overview Template for PowerPoint & Google Slides
PEST
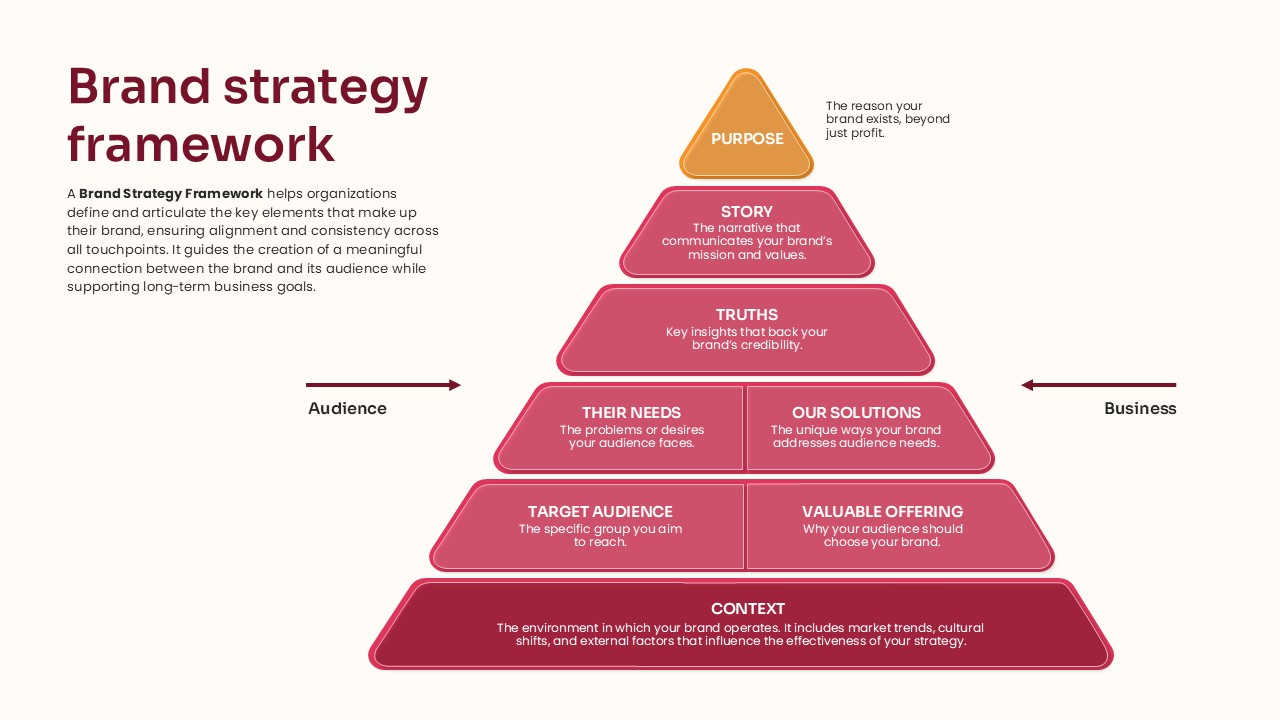
Pyramid Brand Strategy Framework Template for PowerPoint & Google Slides
Business Strategy
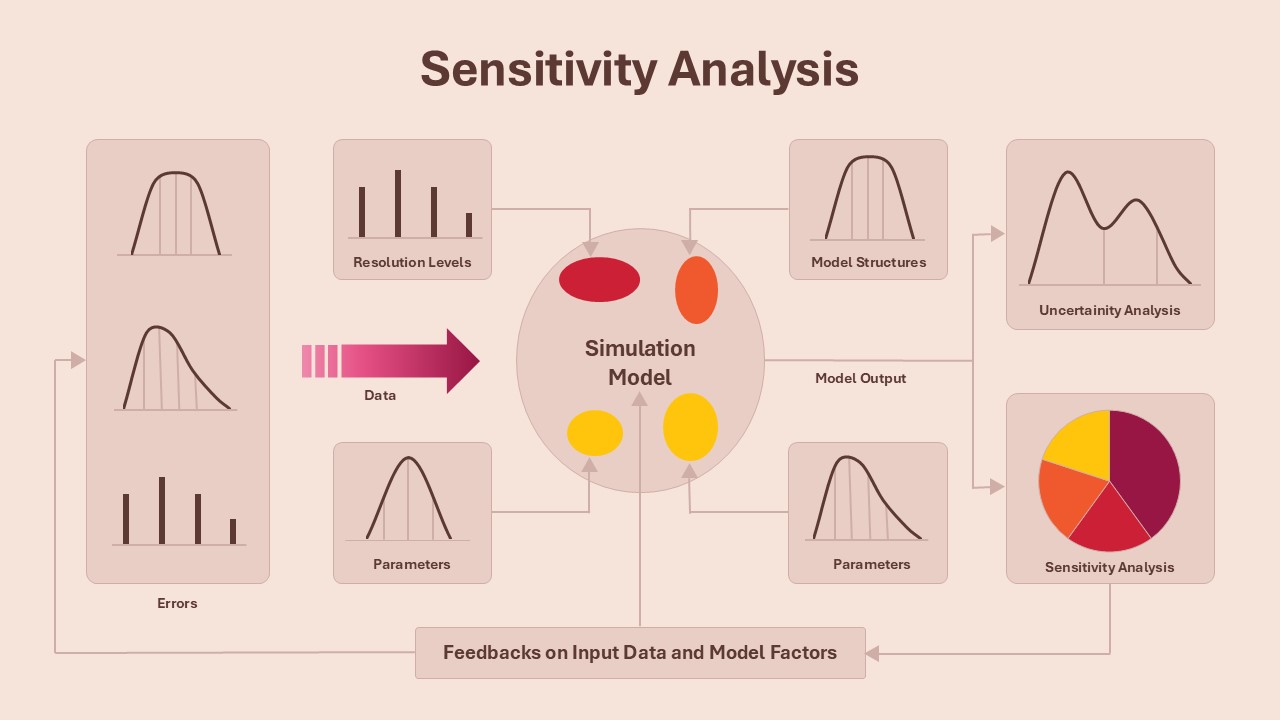
Sensitivity Analysis Framework template for PowerPoint & Google Slides
Business Strategy
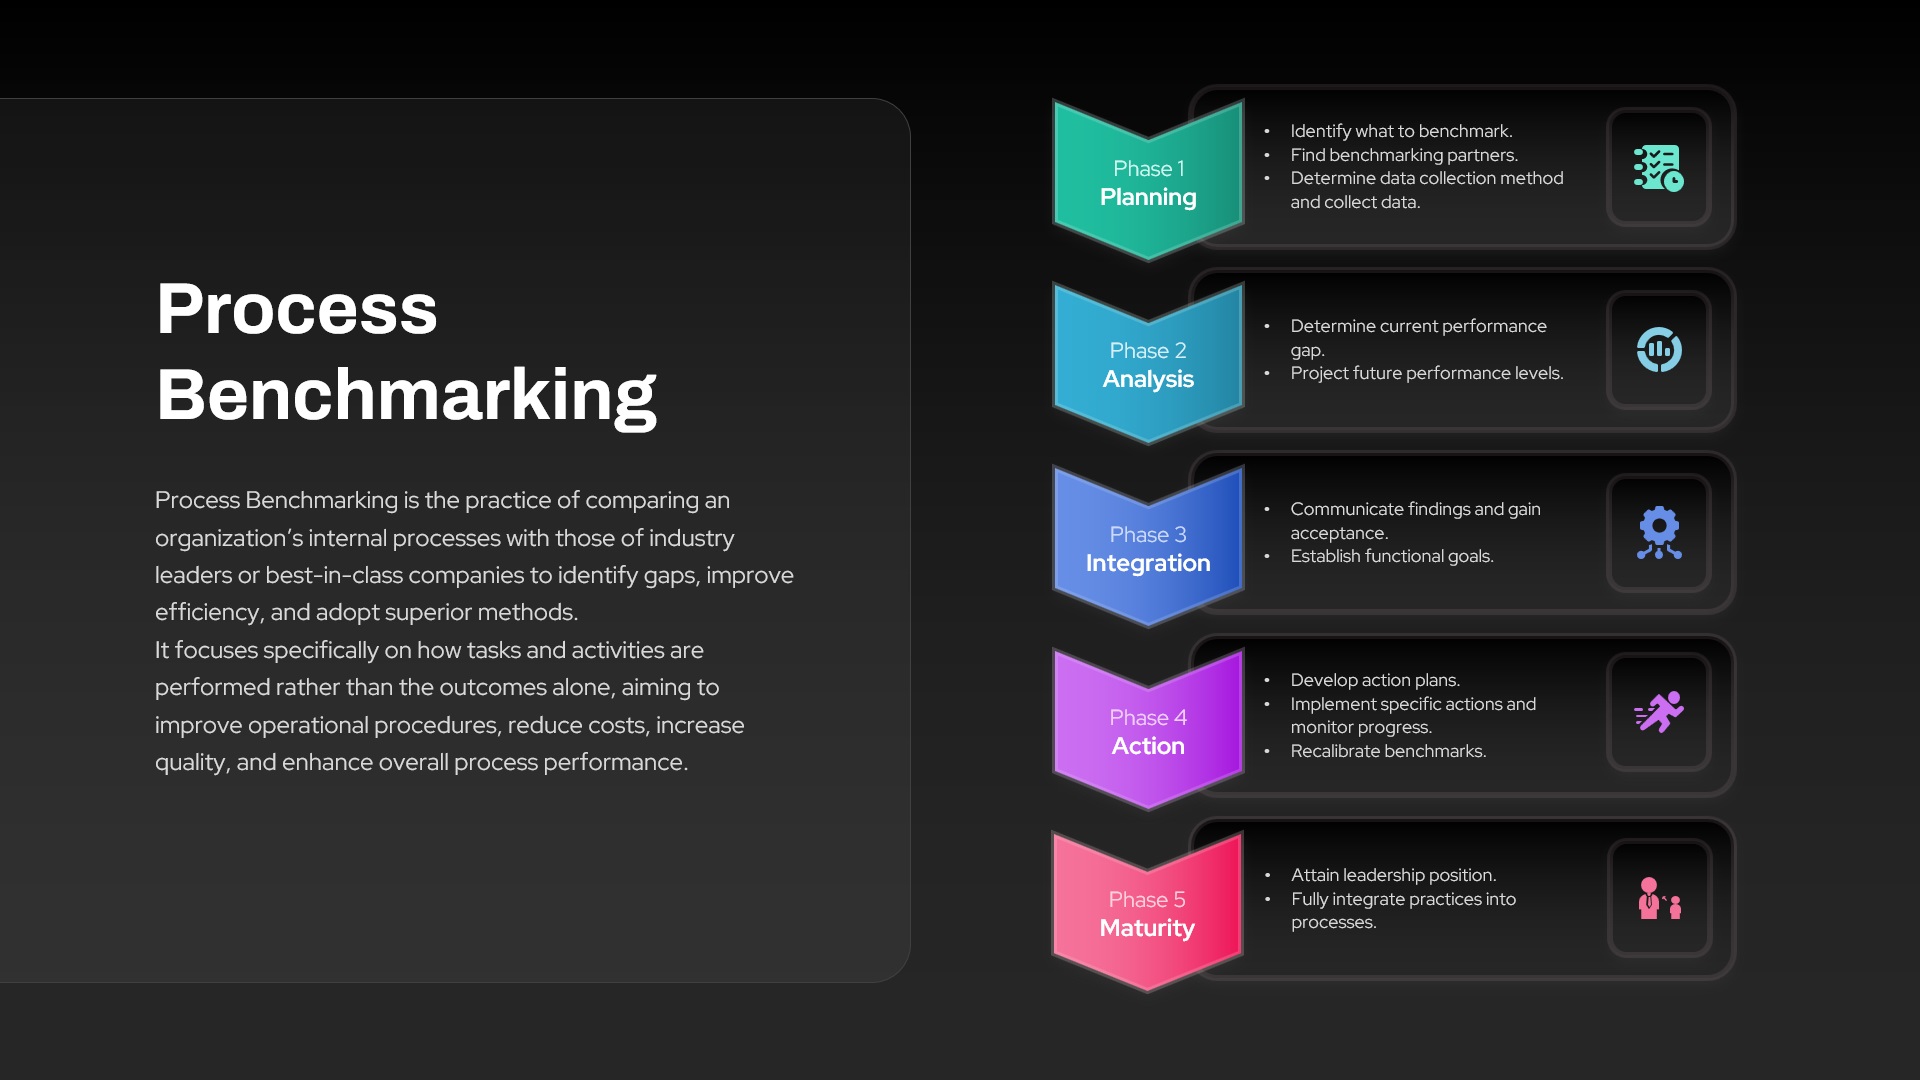
Process Benchmarking Five-Phase Framework Template for PowerPoint & Google Slides
Process
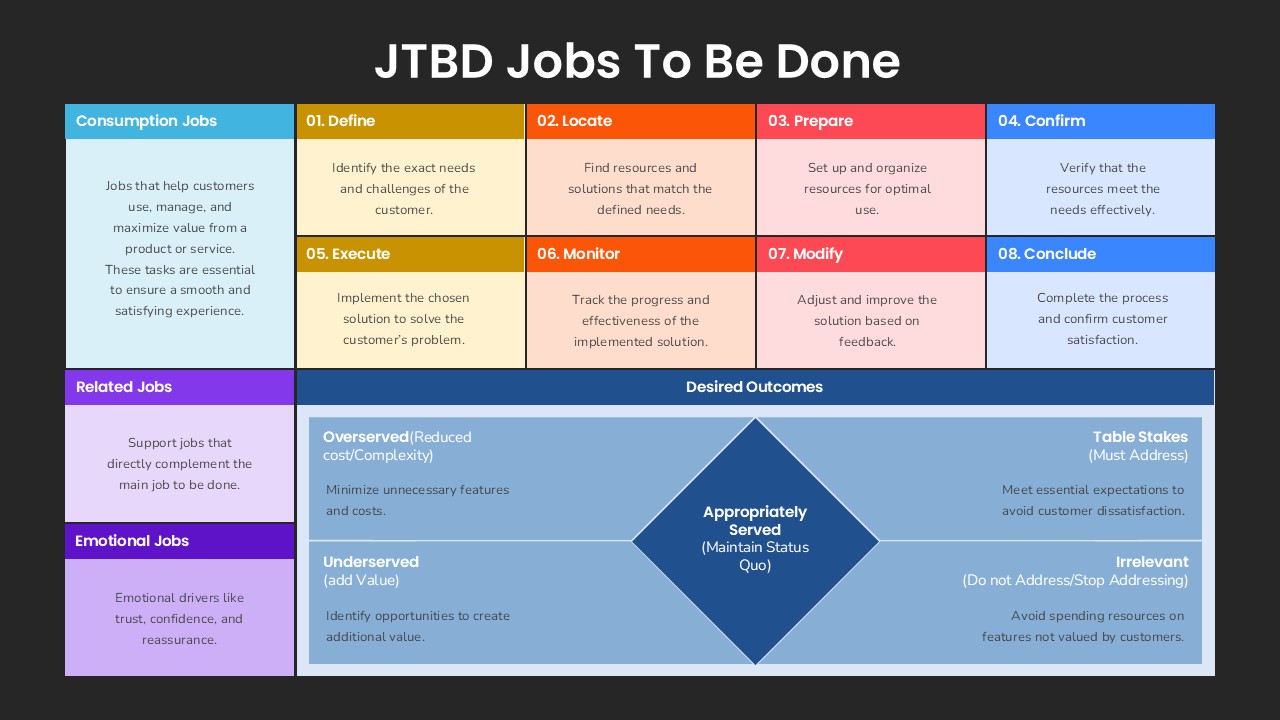
JTBD Jobs To Be Done Outcomes Framework Template for PowerPoint & Google Slides
Process
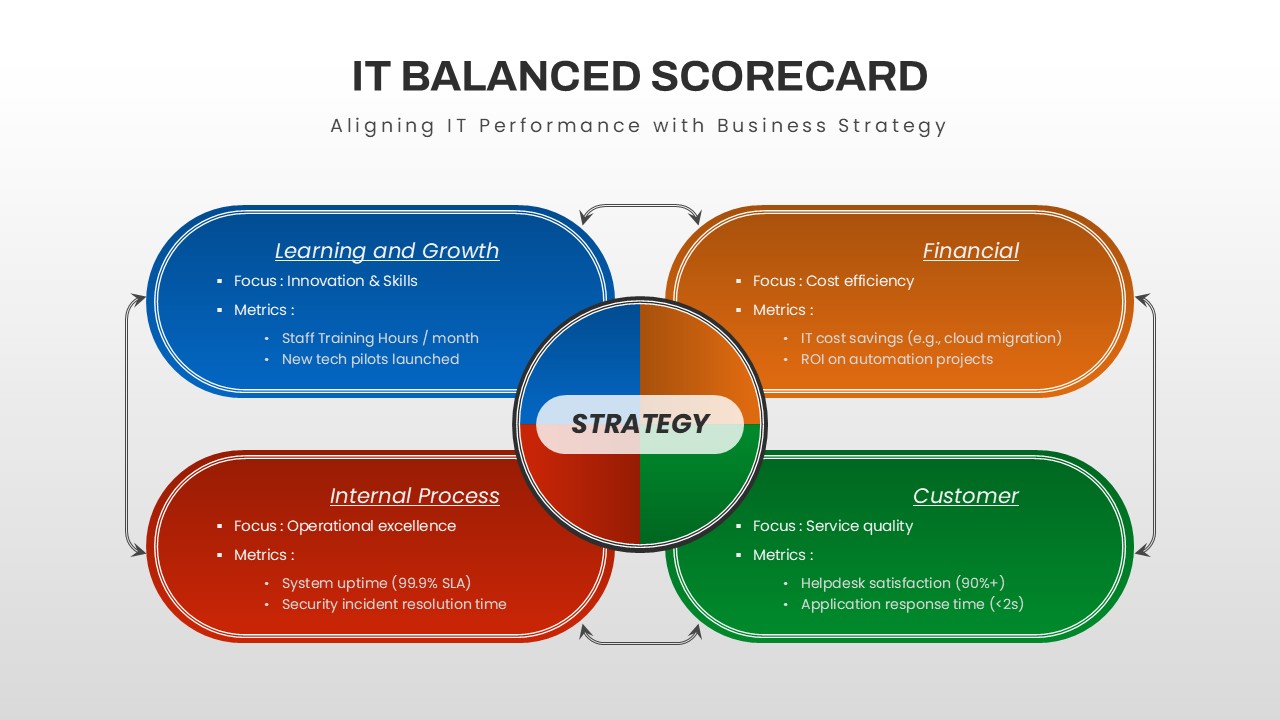
IT Balanced Scorecard Strategy Framework Template for PowerPoint & Google Slides
Business Strategy
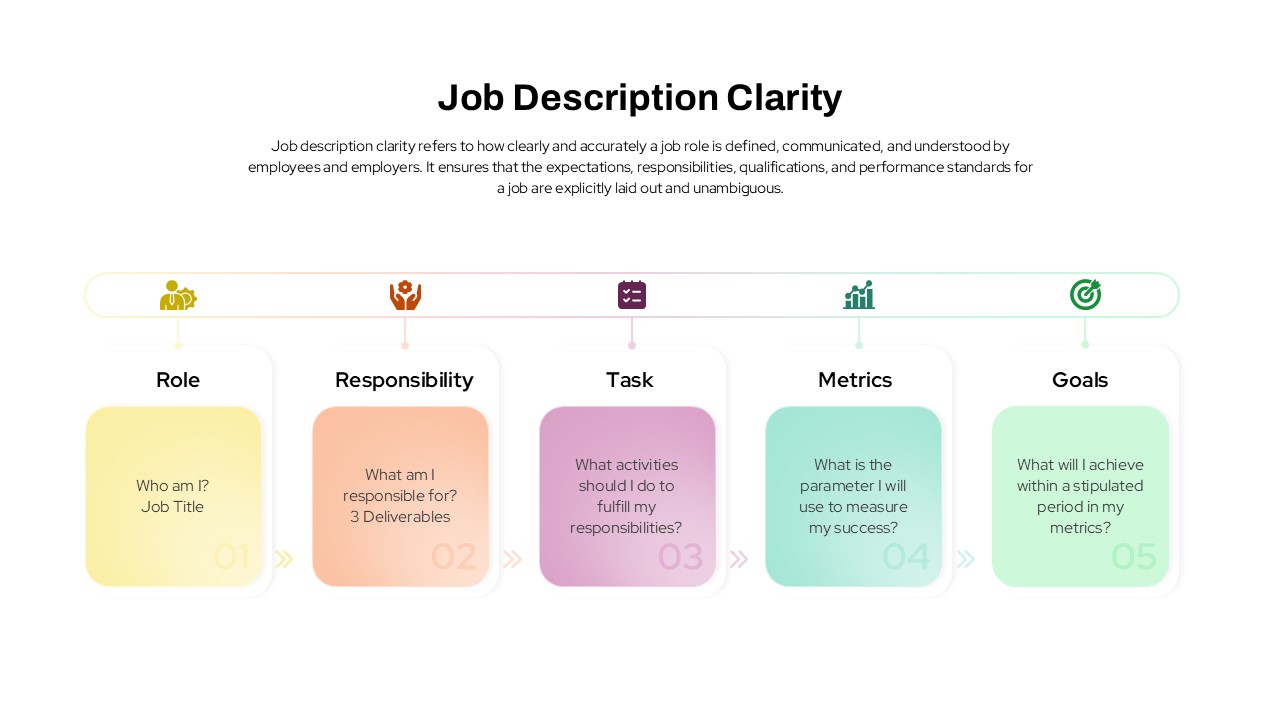
Job Description Clarity Framework template for PowerPoint & Google Slides
Business
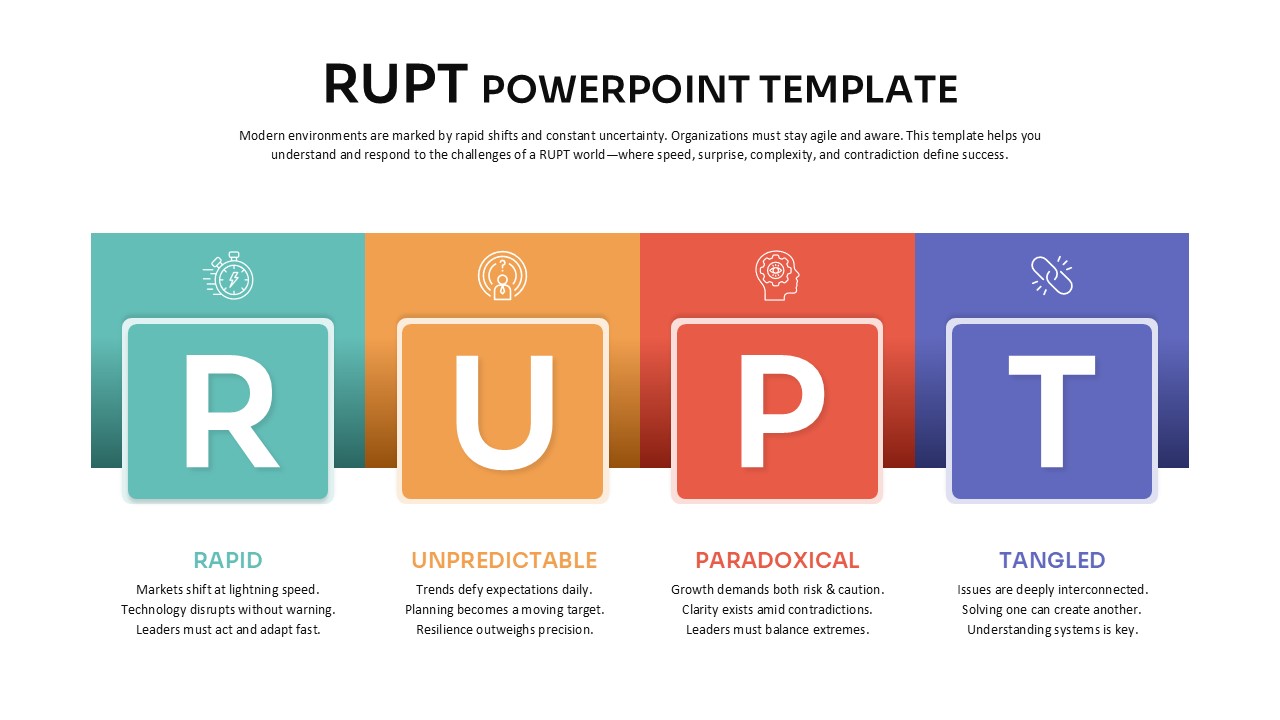
RUPT Framework template for PowerPoint & Google Slides
Business
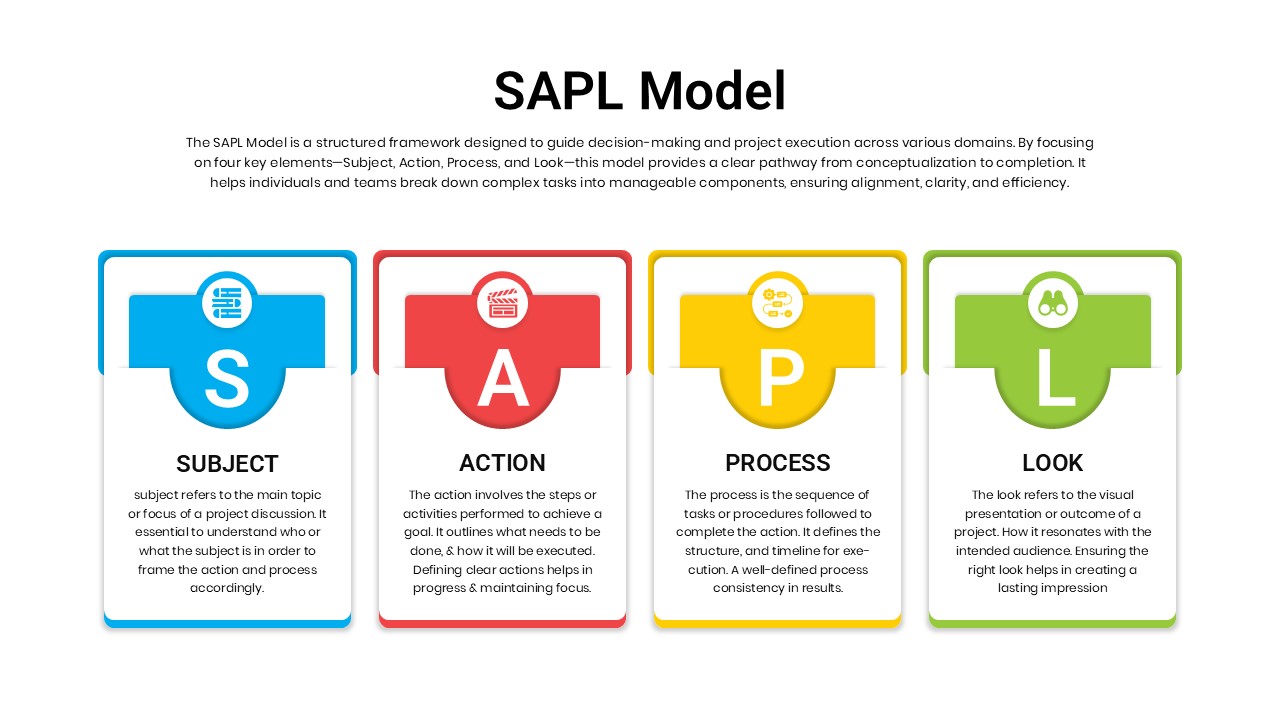
SAPL Model Framework template for PowerPoint & Google Slides
Business
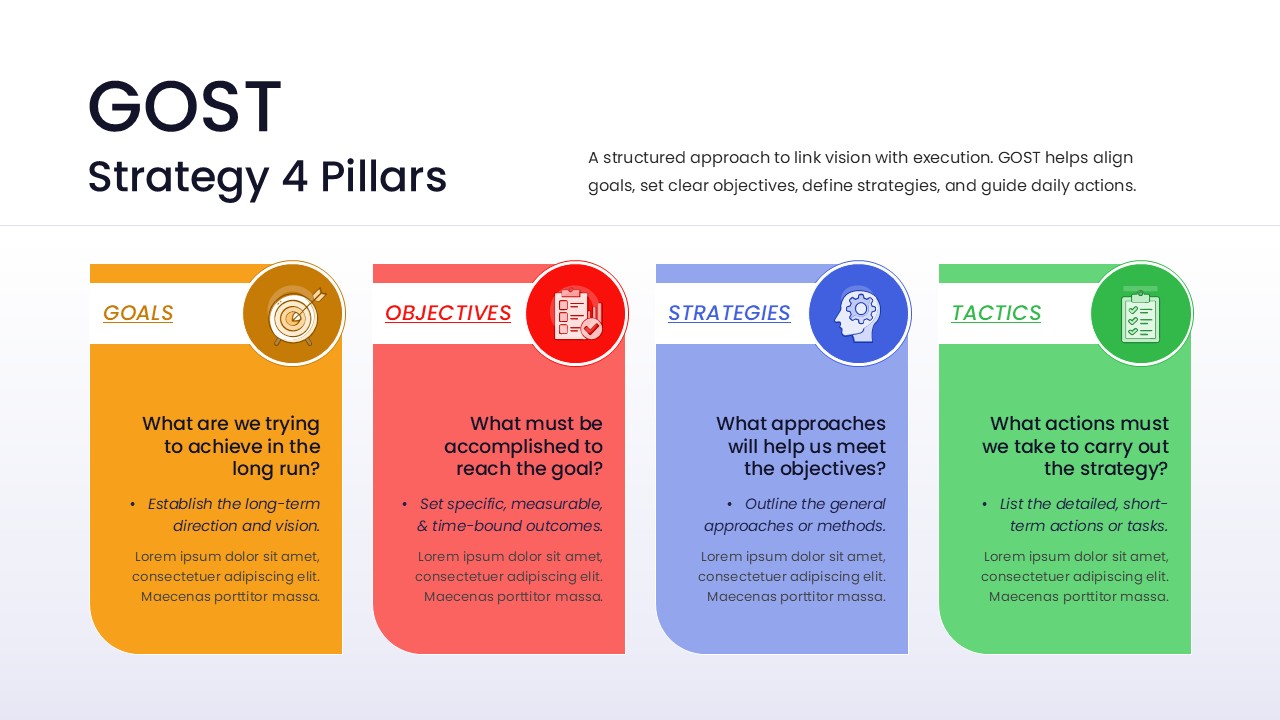
GOST Strategy 4 Pillars Framework Template for PowerPoint & Google Slides
Goals
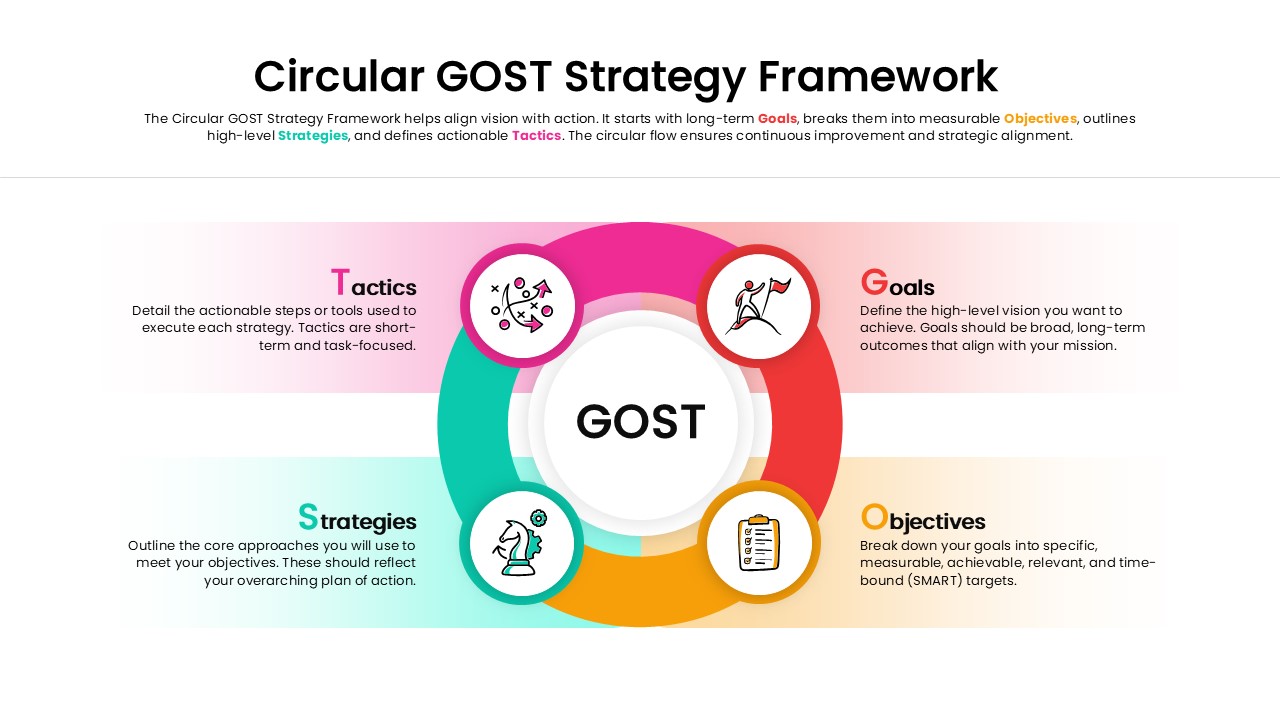
Circular GOST Strategy Framework Template for PowerPoint & Google Slides
Goals
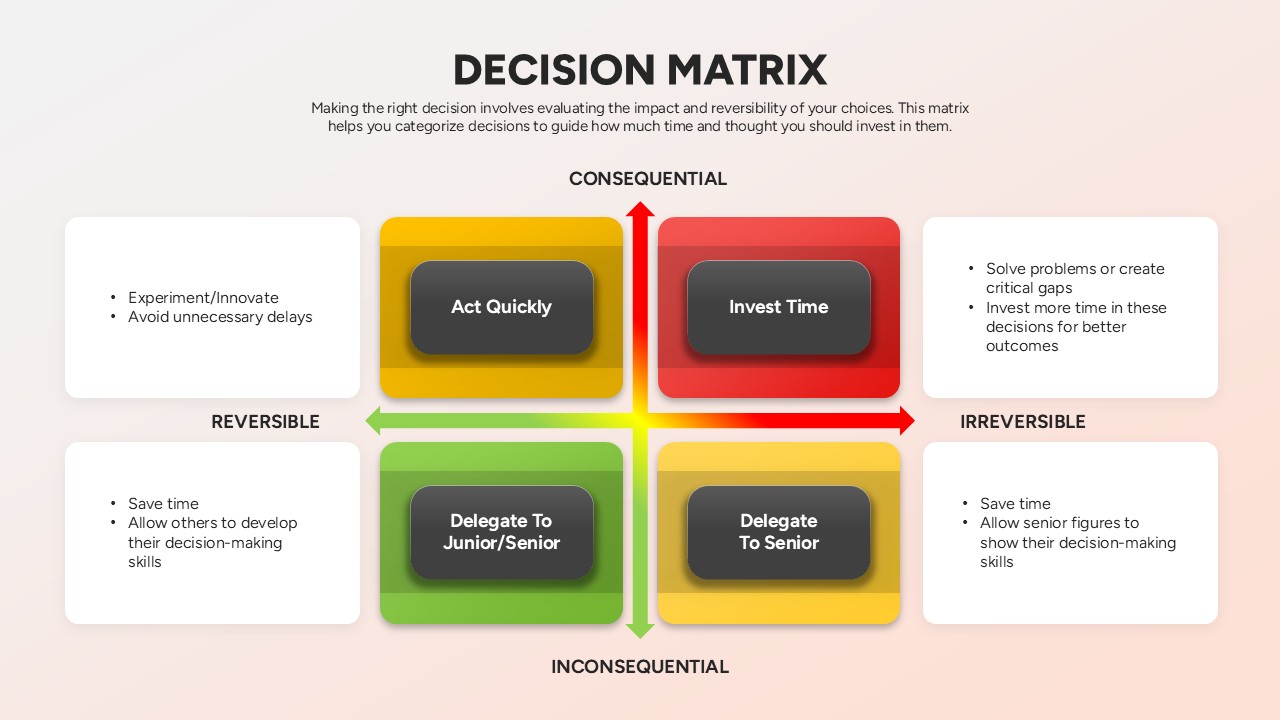
Decision Matrix Evaluation Framework Slide Template for PowerPoint & Google Slides
Leadership
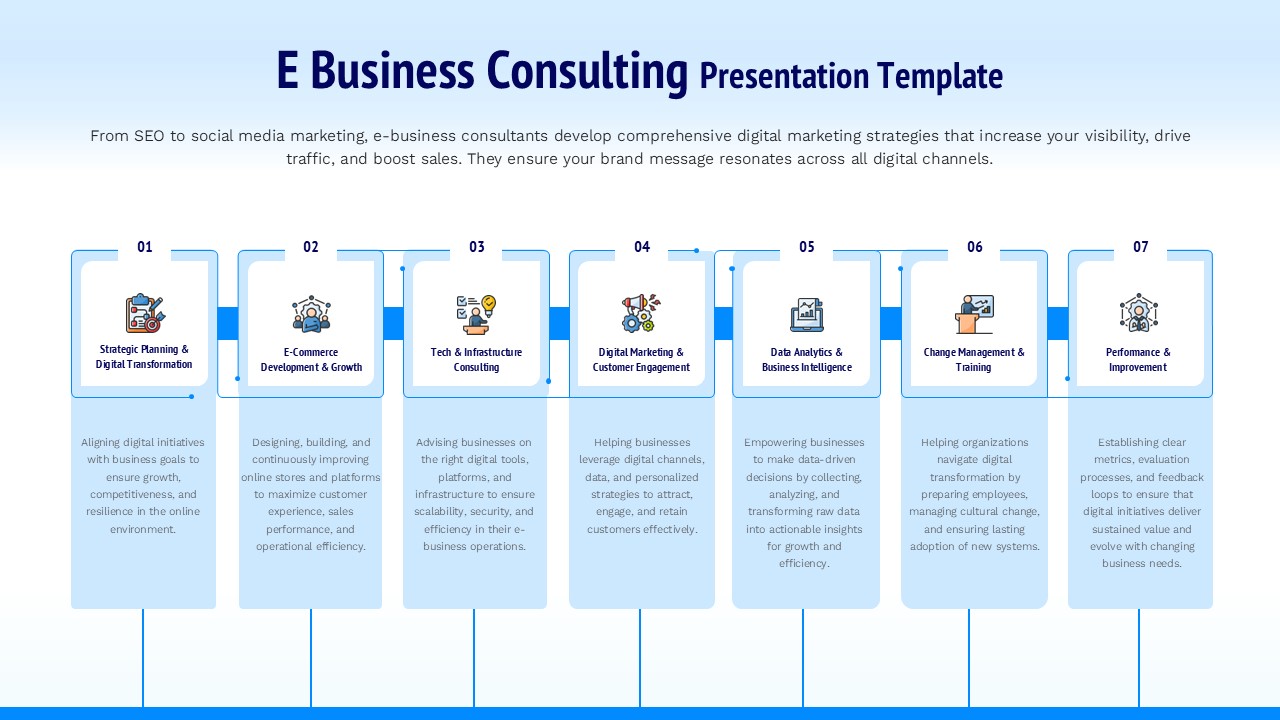
E Business Consulting Service Framework Template for PowerPoint & Google Slides
Business Strategy
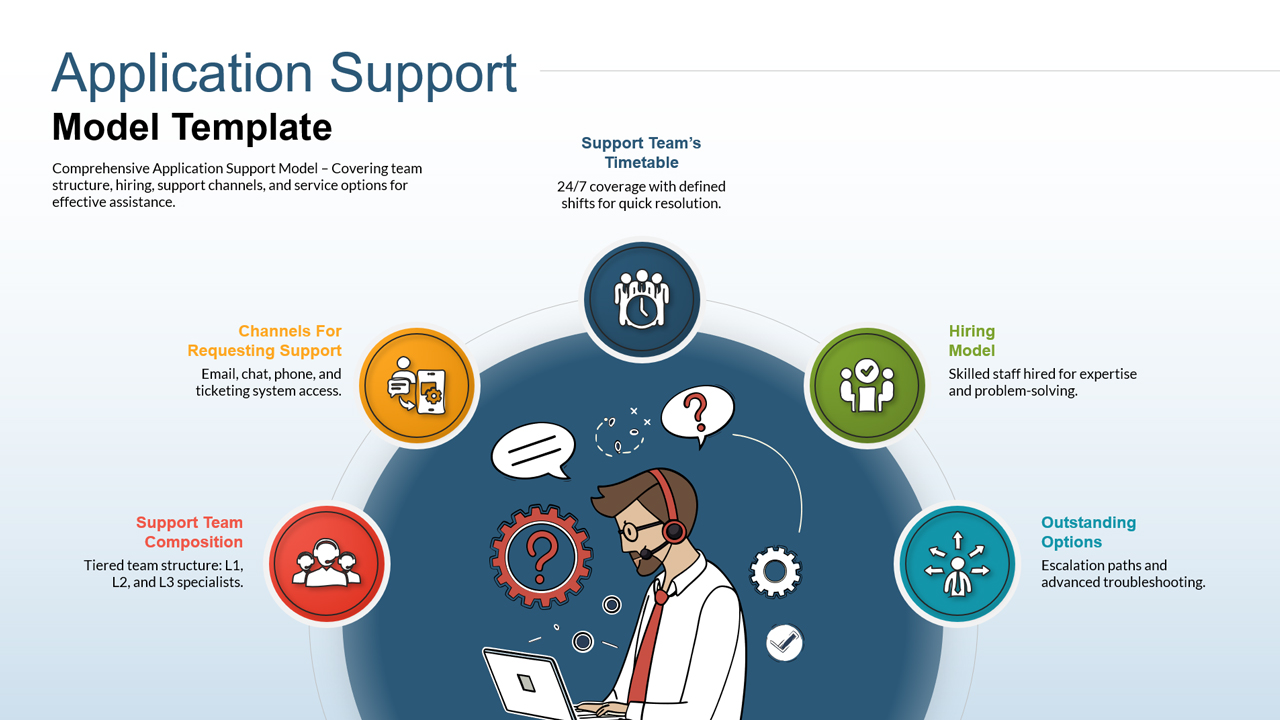
Application Support Operating Model Framework Slide Template for PowerPoint & Google Slides
Information Technology
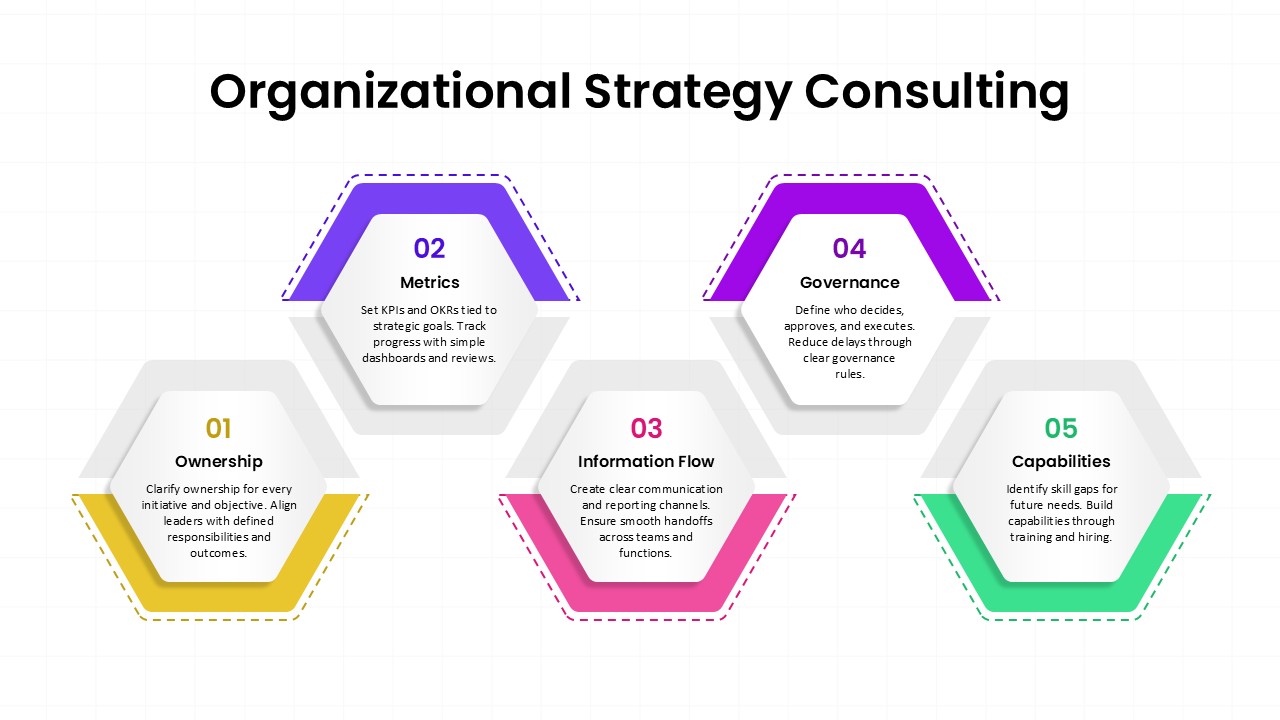
Organizational Strategy Consulting Framework Template for PowerPoint & Google Slides
Consulting
Financial Gap Analysis Framework Template for PowerPoint & Google Slides
Finance
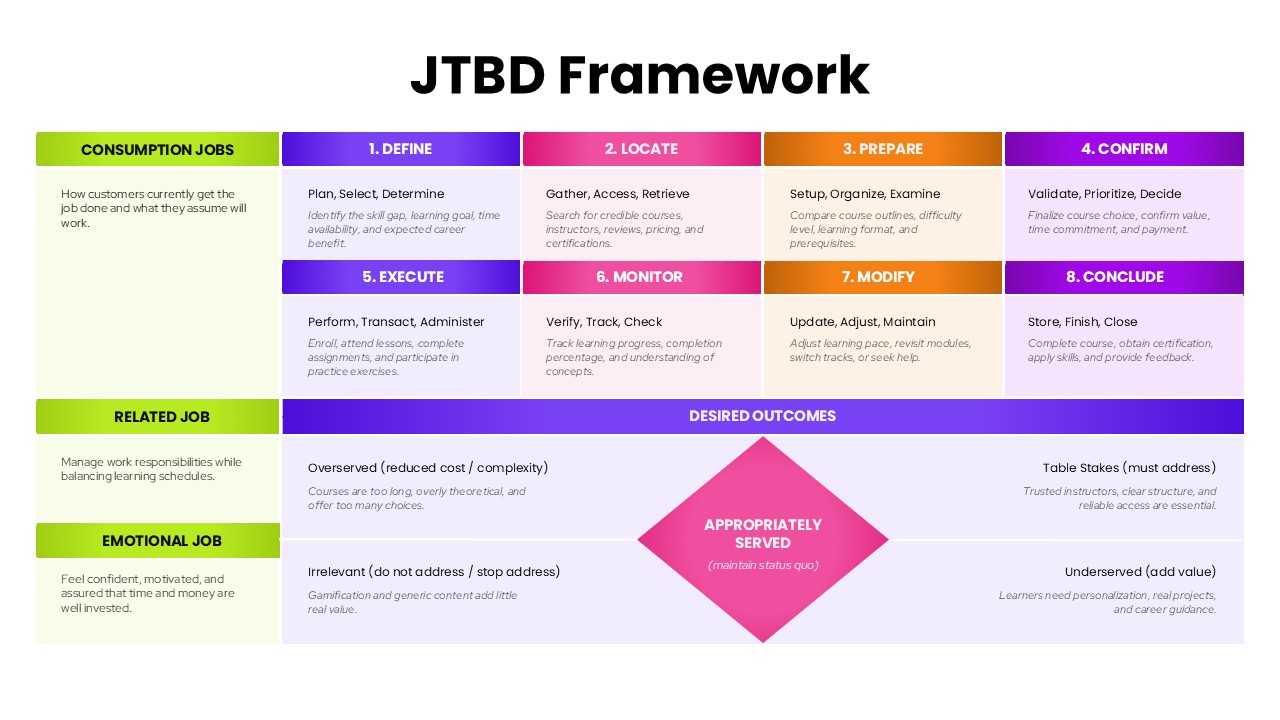
JTBD Framework Process and Outcomes Matrix Template for PowerPoint & Google Slides
Marketing