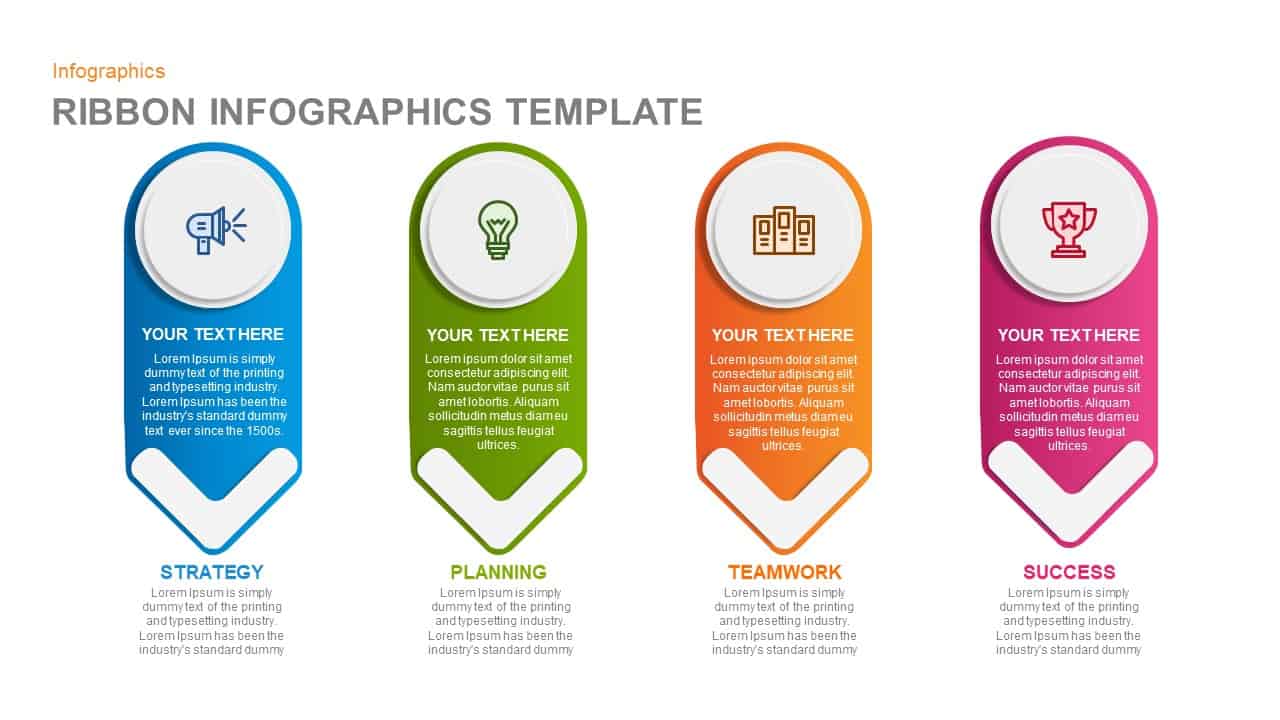
Ribbon Infographics Step-by-Step Process Template for PowerPoint & Google Slides
Description
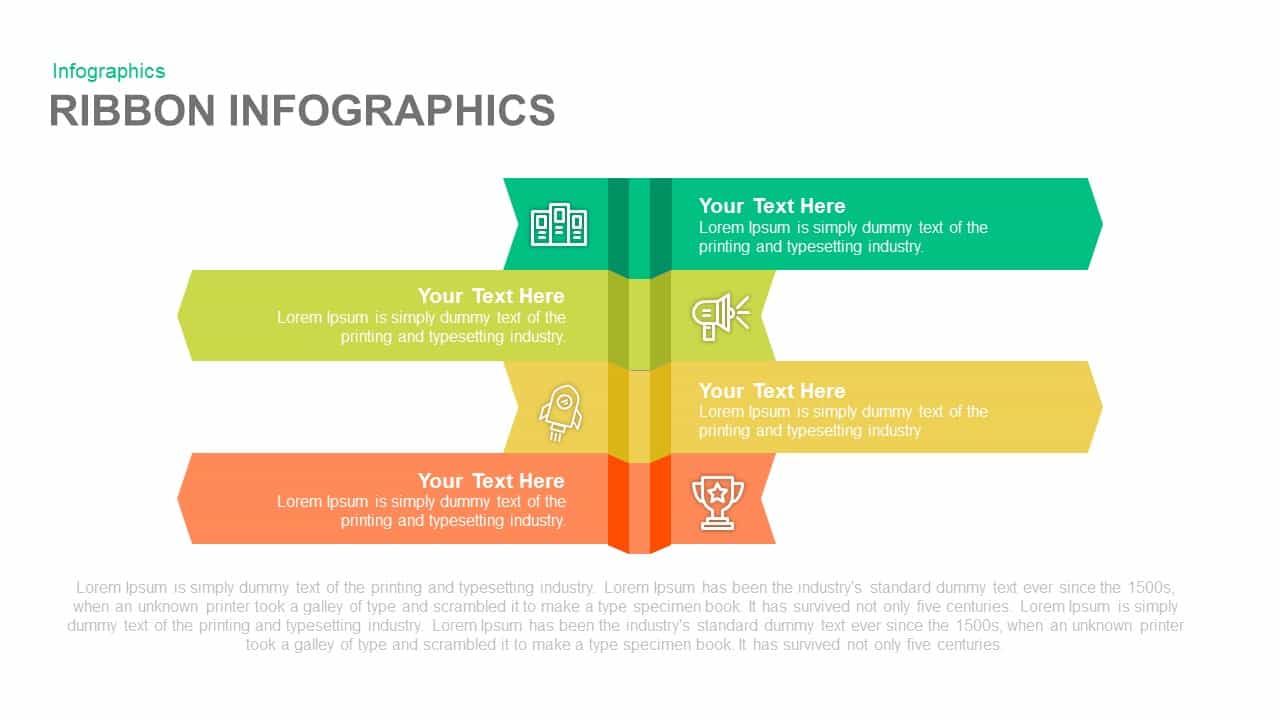
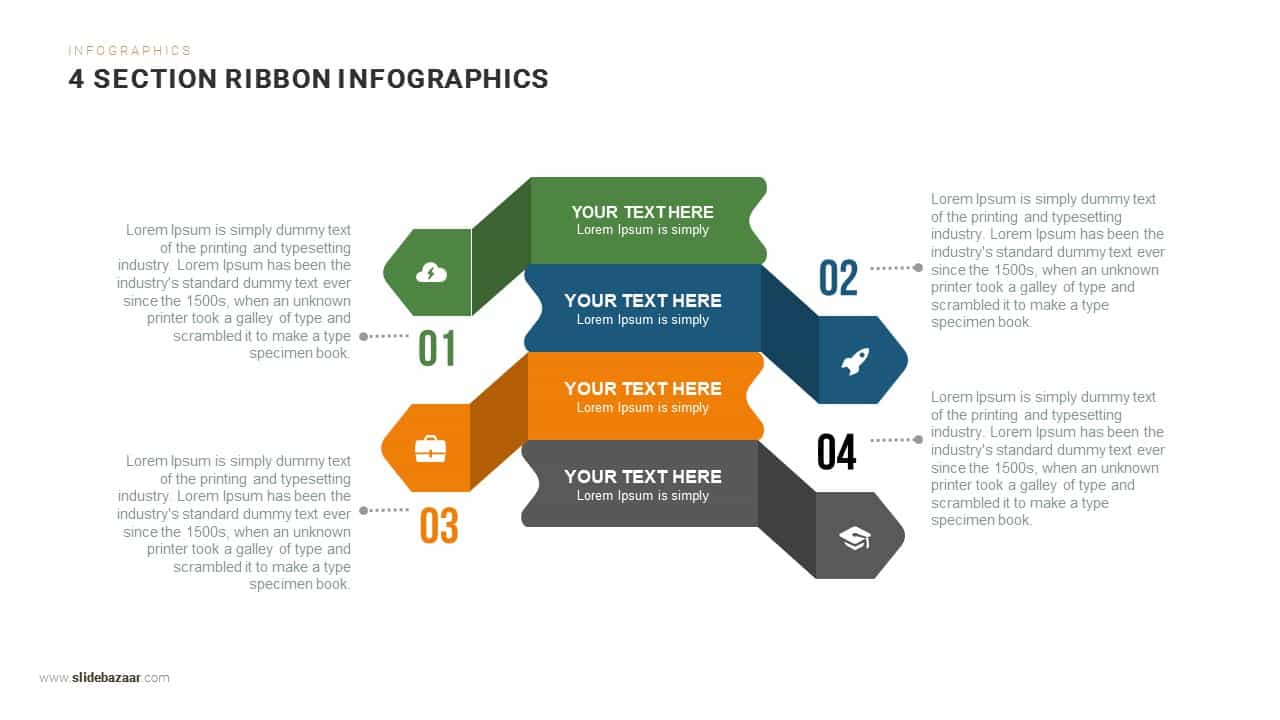
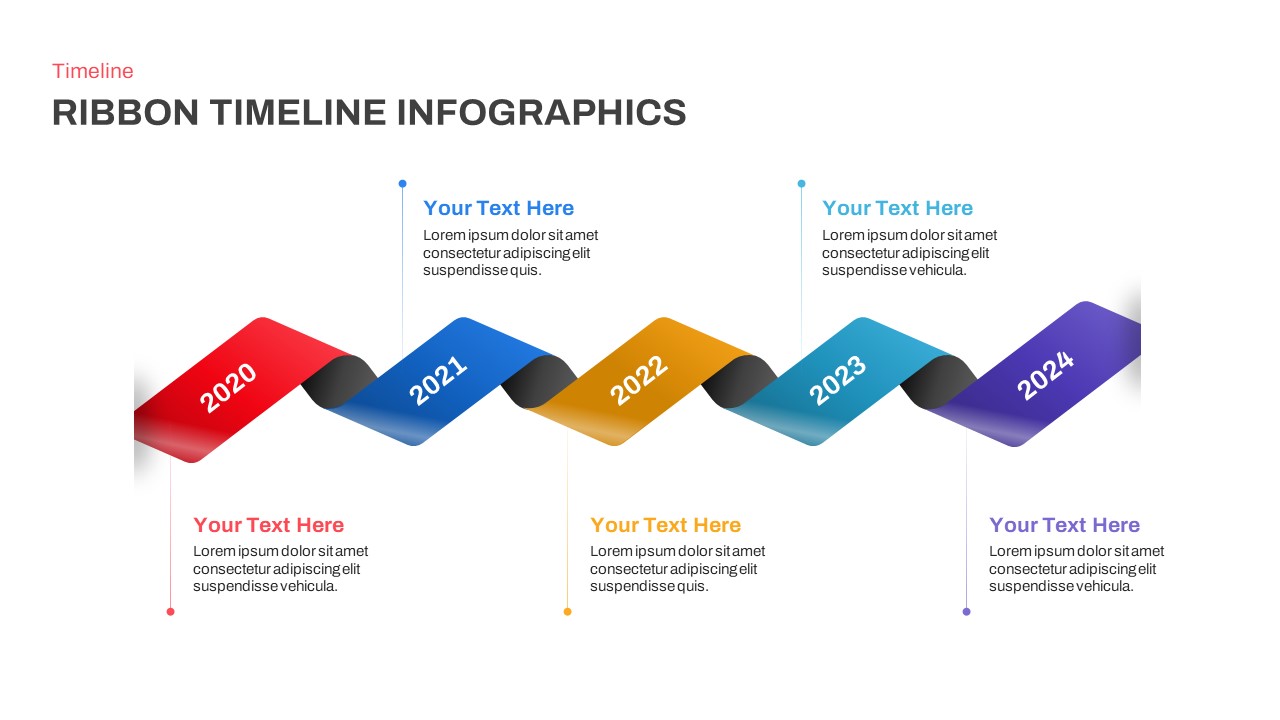
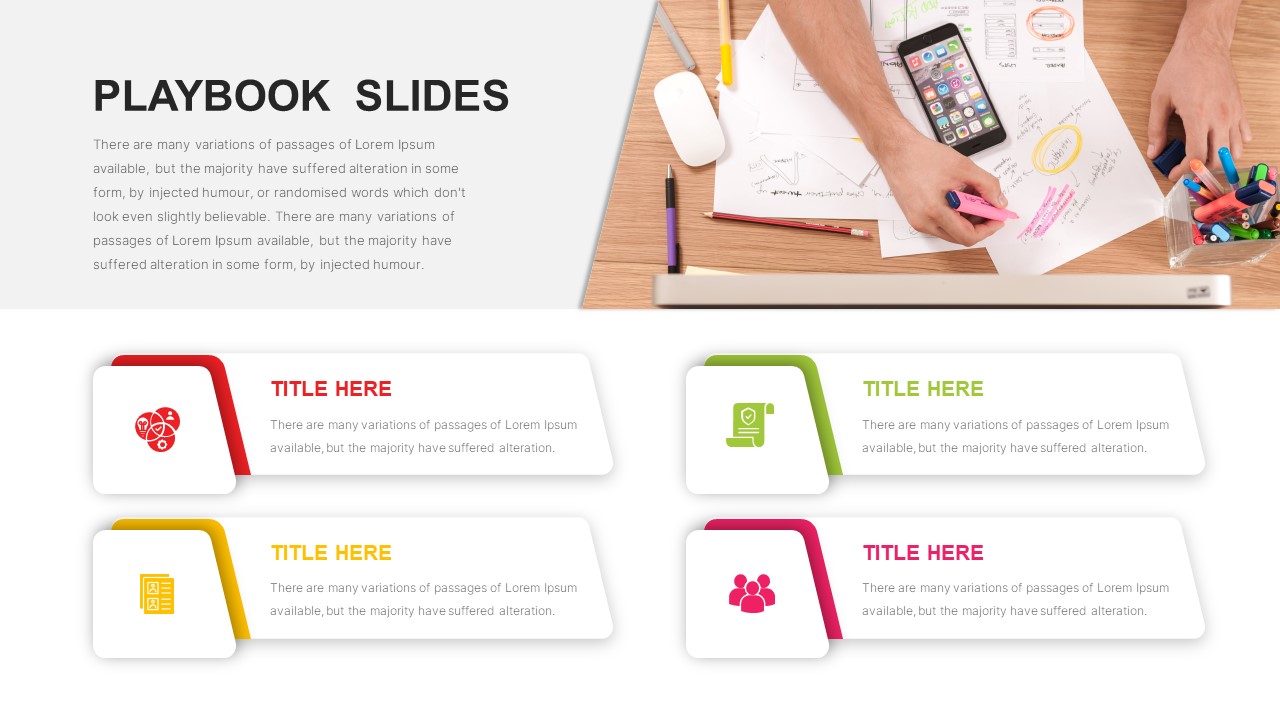
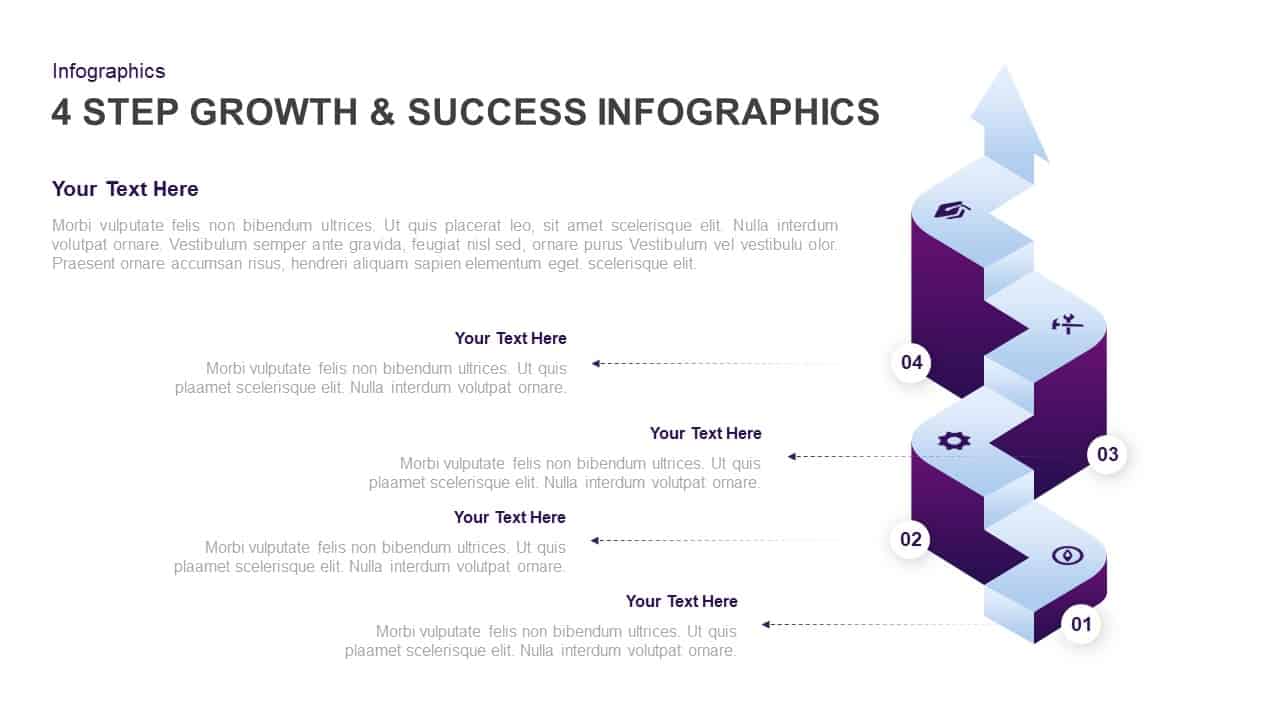
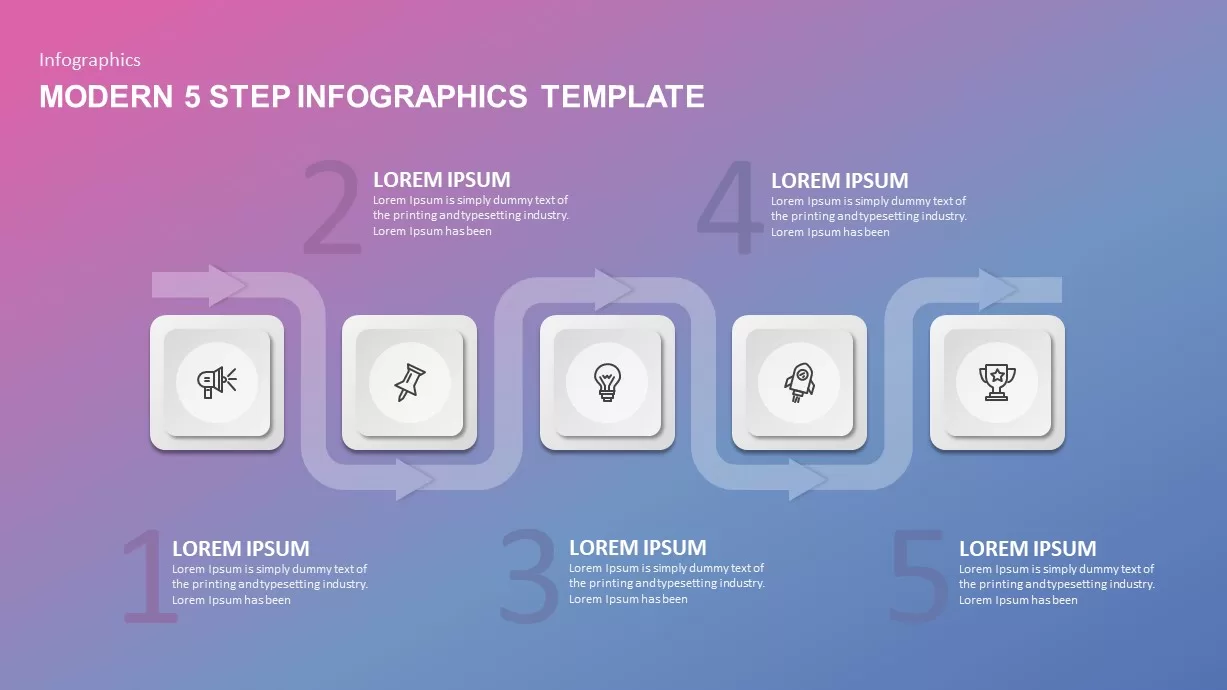
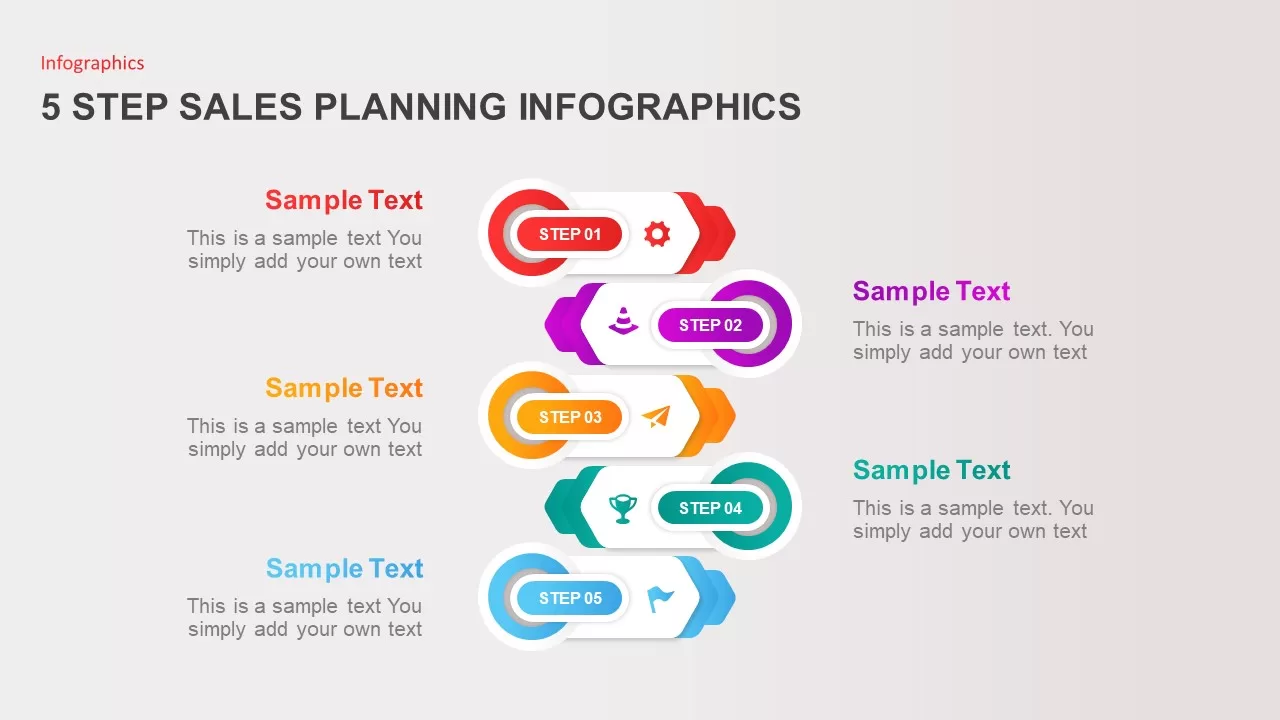
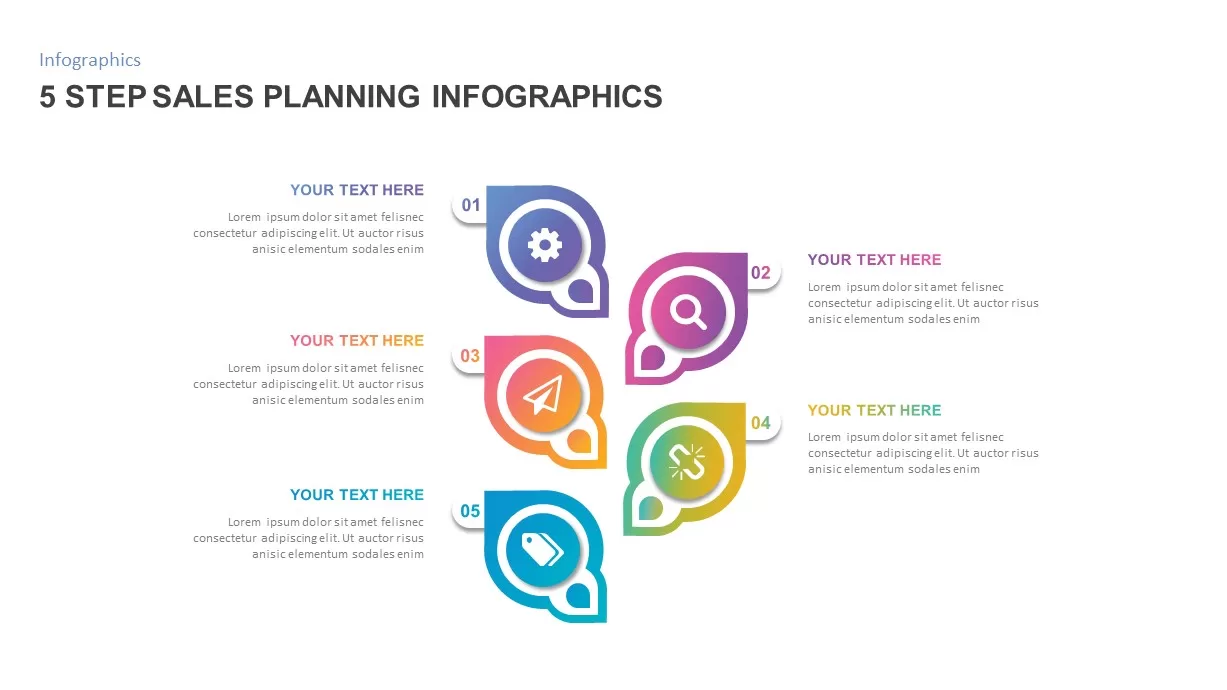
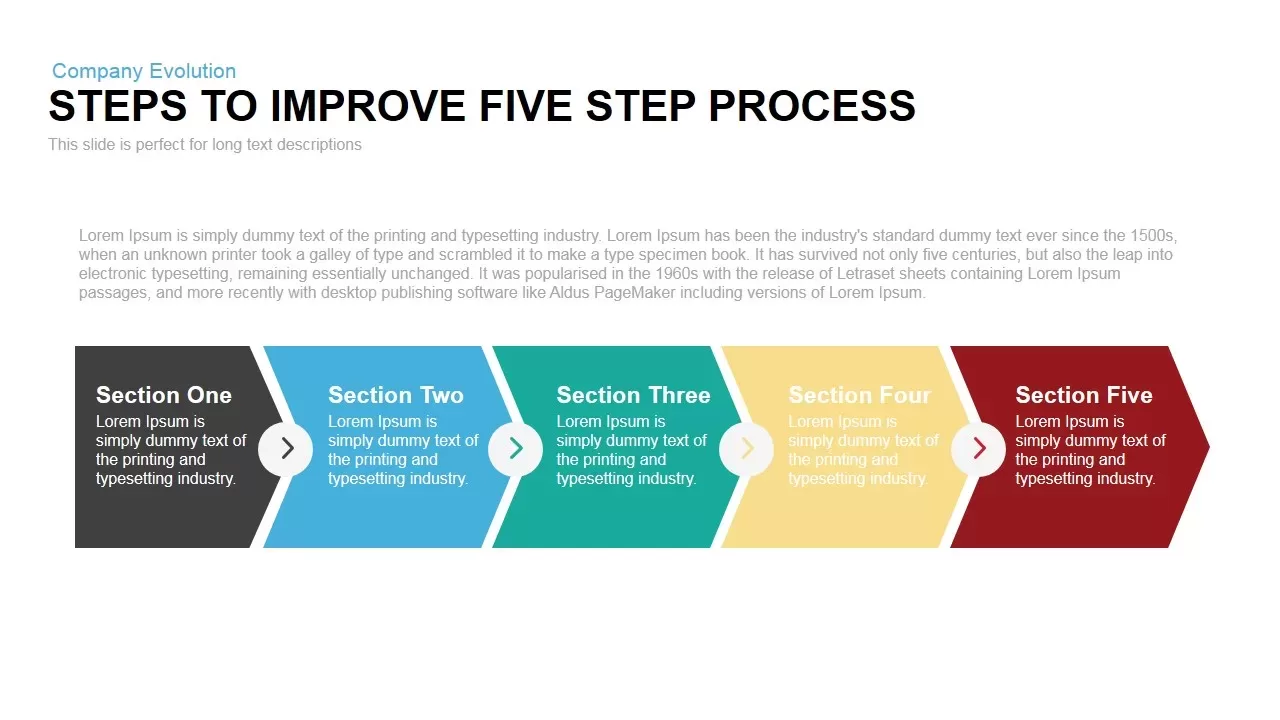
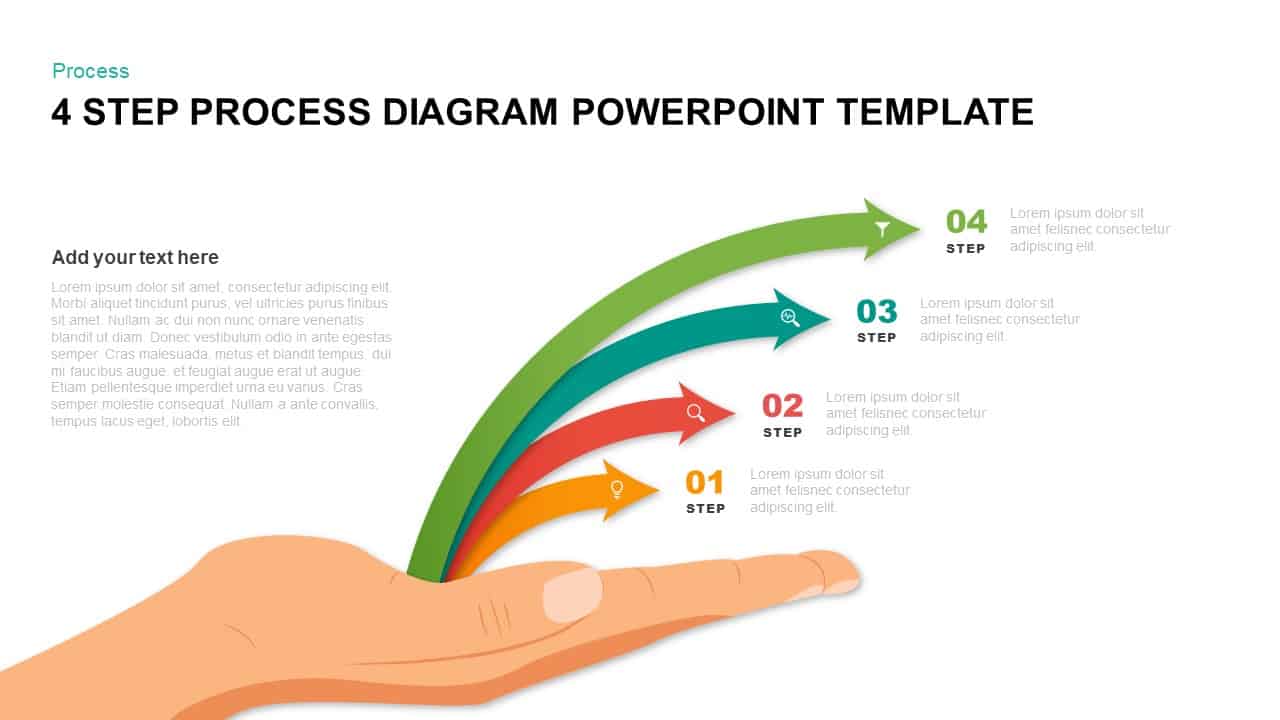
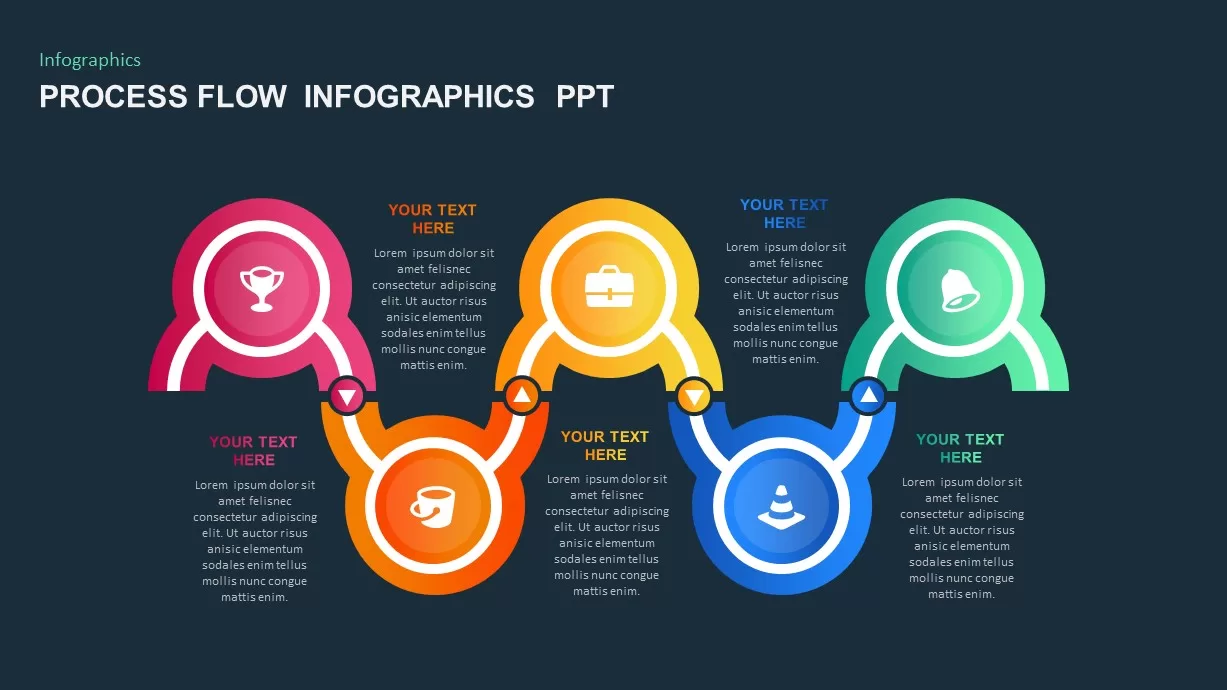
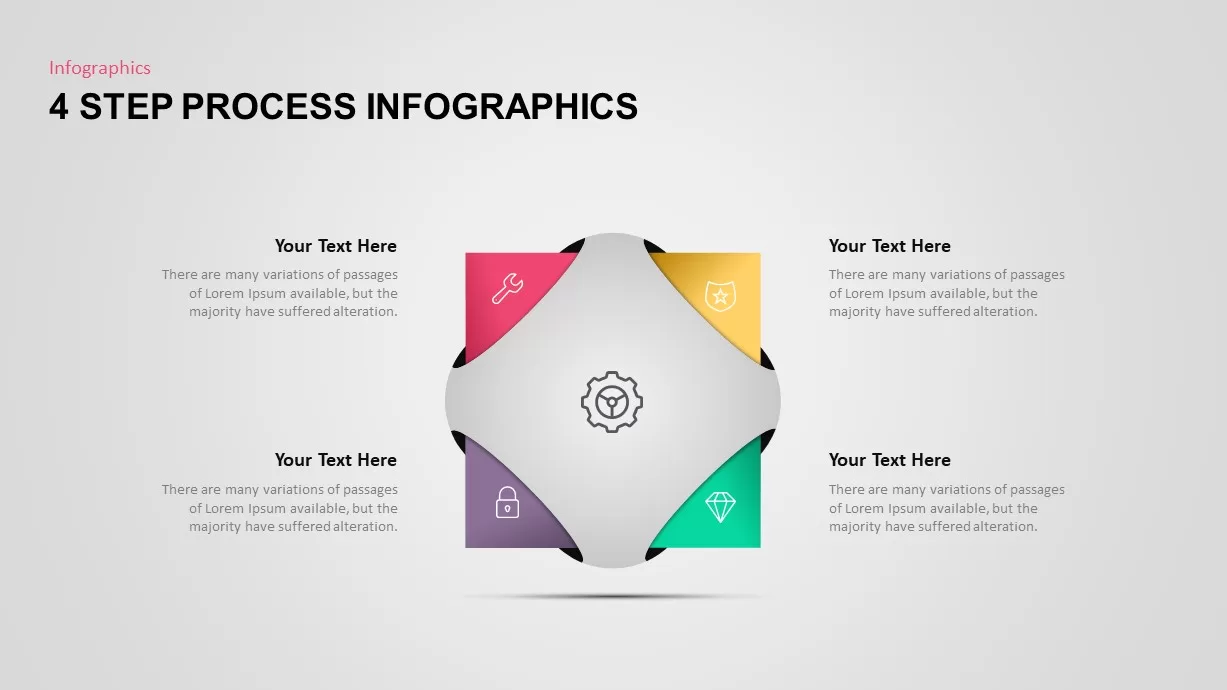
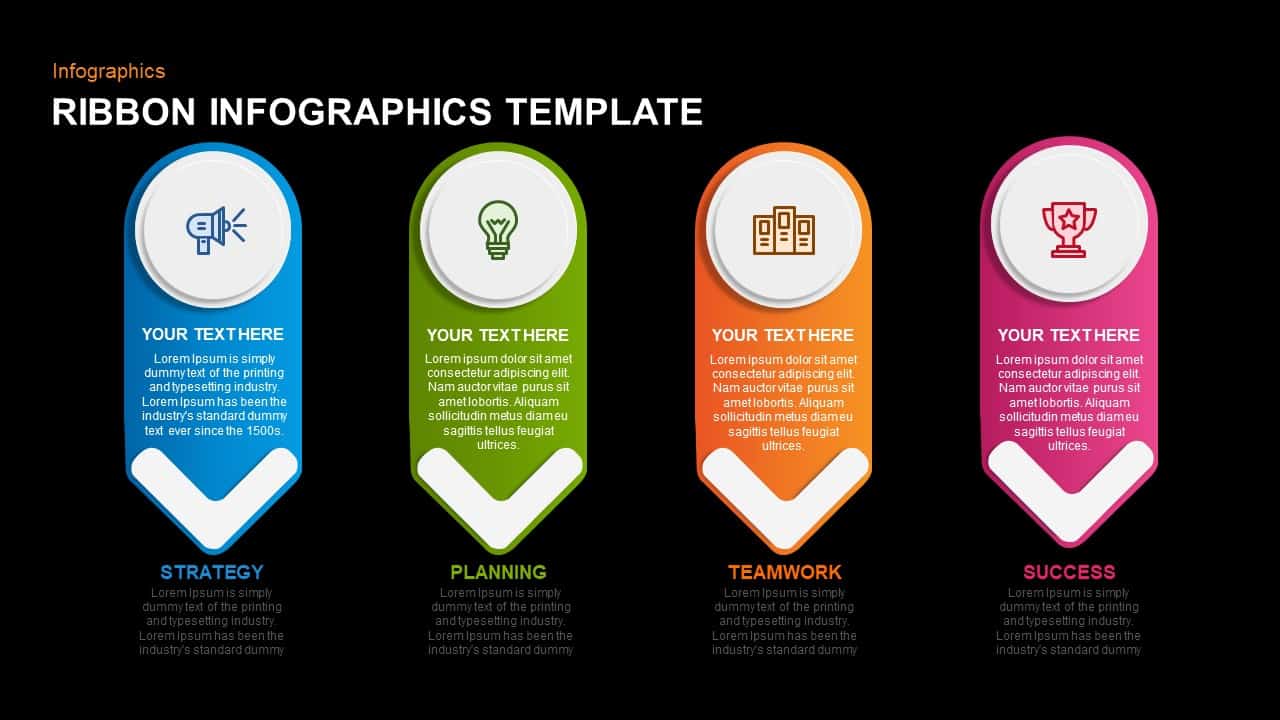
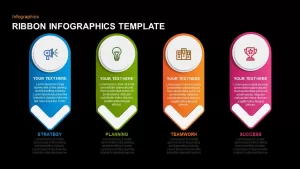
This fully editable ribbon infographics slide uses four vertical chevron‐style ribbons—each topped with a circular icon placeholder—to guide viewers through sequential stages of strategy, planning, teamwork, and success. Vibrant hues of blue, green, orange, and magenta provide clear visual differentiation, while the clean white background and crisp typography ensure your messaging remains front and center. Each ribbon contains a headline area and text block for concise explanations, with a bold label beneath for quick reference.
Built on master slides for both PowerPoint and Google Slides, this template leverages vector shapes and smart placeholders to streamline customization. Swap icon sets in seconds, adjust ribbon colors to match your brand palette, or reorder stages with intuitive drag‐and‐drop controls. Text boxes automatically resize to accommodate longer descriptions, eliminating formatting headaches. Apply entrance animations on each ribbon or icon to direct audience focus sequentially, ensuring your narrative flows smoothly from one step to the next. High-resolution vector graphics guarantee perfect clarity on large‐format screens, printed reports, or PDF handouts.
Use this ribbon framework to map multi‐phase processes, workshop agendas, or product roadmaps. Its modular design supports expansion to additional steps or contraction for streamlined overviews. Combine this slide with complementary layouts—like flowcharts, Gantt charts, or comparison tables—to maintain a cohesive visual language across your deck.
Who is it for
Project managers, marketing teams, and training facilitators can leverage this slide to present stepwise plans, campaign rollouts, or workshop agendas. Consultants, educators, and executive teams will also find the ribbon design ideal for illustrating structured frameworks in boardroom and virtual settings.
Other Uses
Beyond process mapping, repurpose these ribbons to compare feature sets, outline service tiers, or display quarterly goals. Customize colors and icons to highlight performance metrics, risk levels, or strategic priorities—adapting the slide to virtually any business scenario.
Login to download this file

Item ID
SB00944
Related Templates

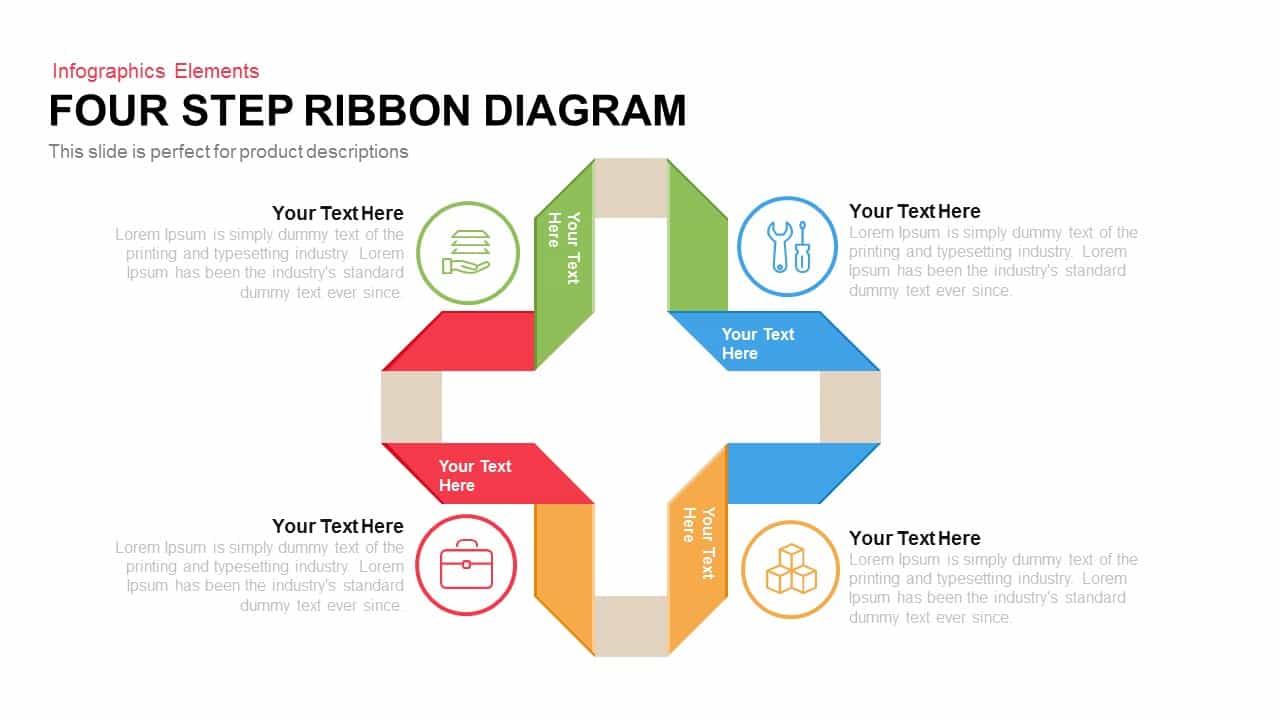
Four Step Ribbon Diagram Template for PowerPoint & Google Slides
Infographics
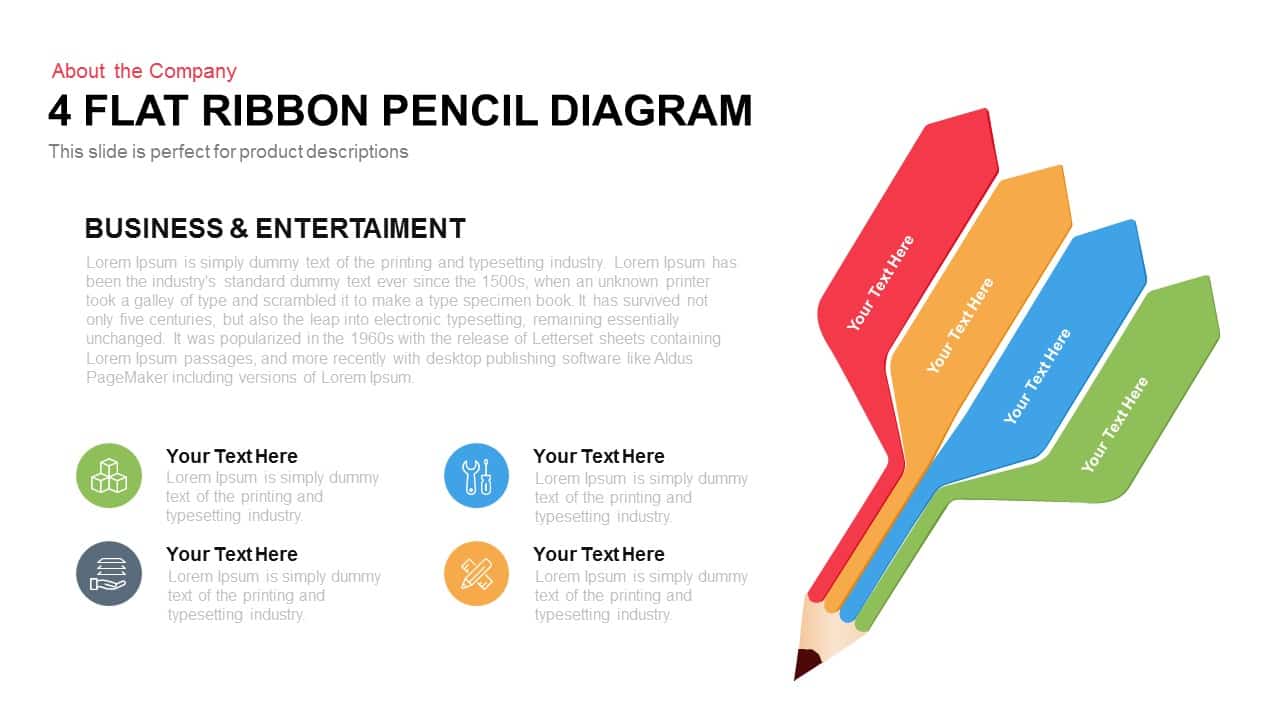
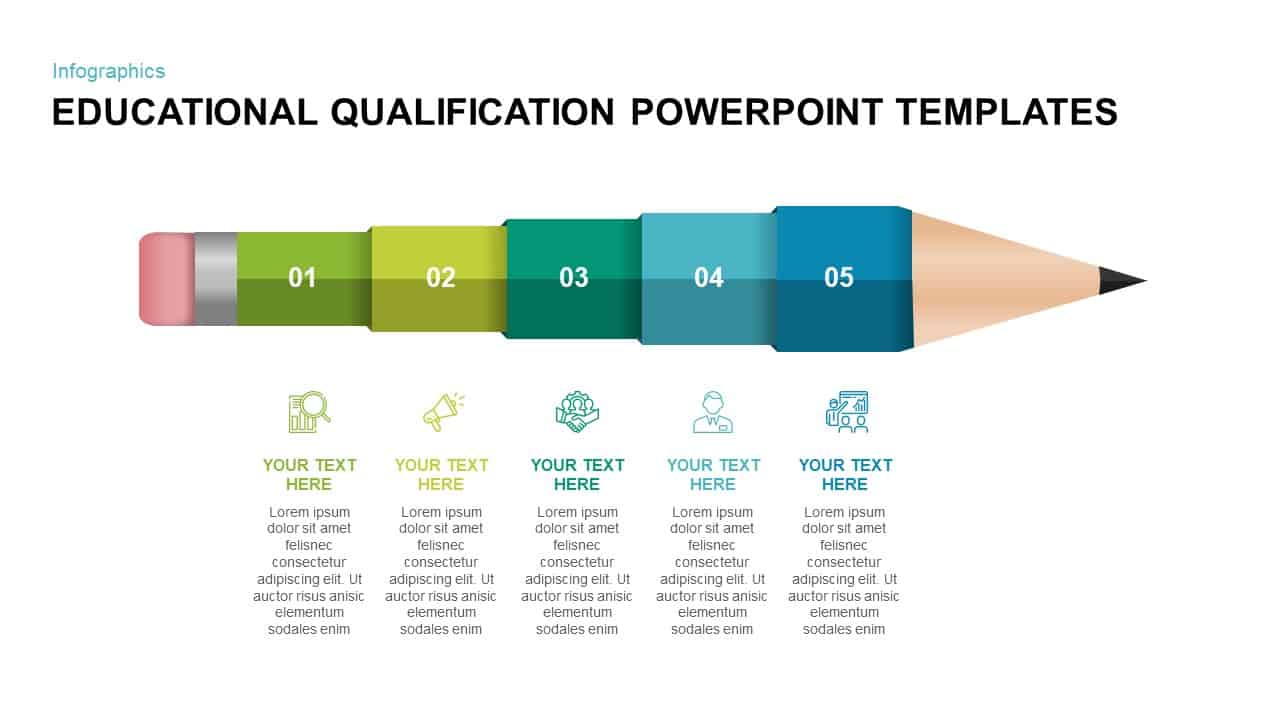
4-Step Flat Ribbon Pencil Diagram Template for PowerPoint & Google Slides
Process
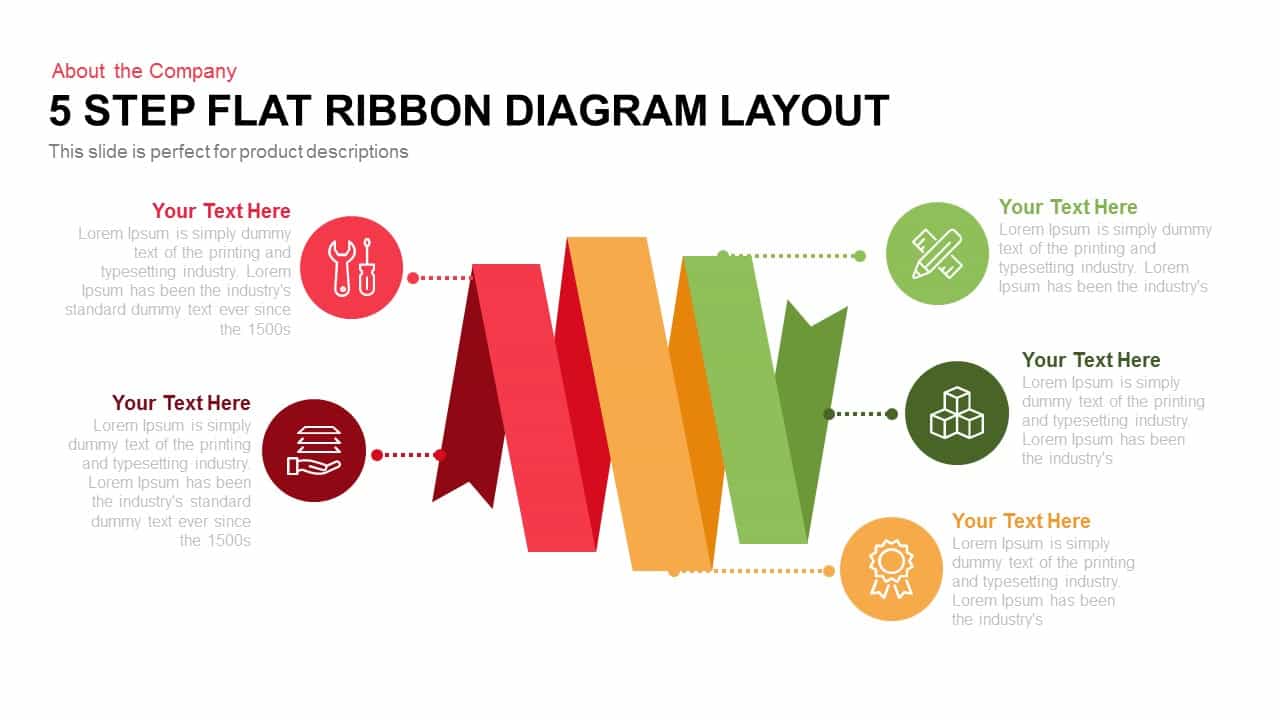
Five-Step Flat Ribbon Diagram Layout template for PowerPoint & Google Slides
Process
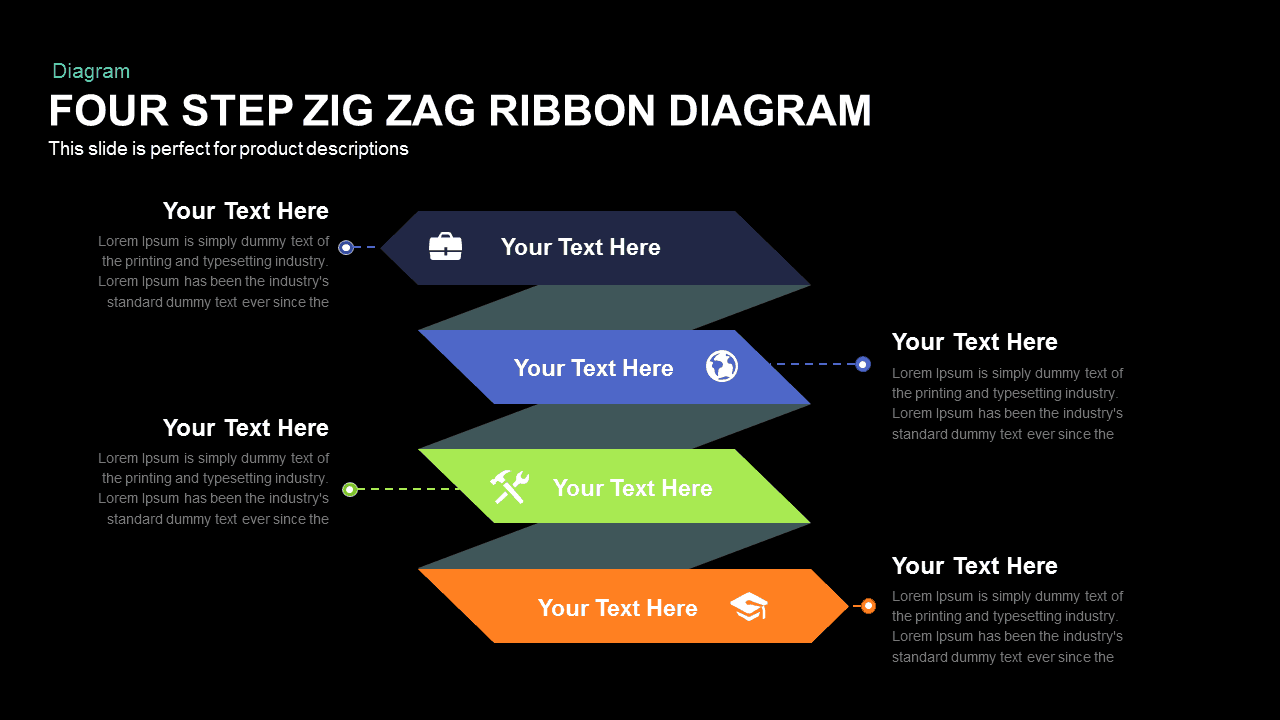
Four-Step Zigzag Ribbon Diagram template for PowerPoint & Google Slides
Arrow
Dynamic Five-Step Ribbon Agenda Layout Template for PowerPoint & Google Slides
Agenda
Multi-Color Eight-Step Ribbon Diagram Template for PowerPoint & Google Slides
Process
Dual-Side Three-Step Ribbon Infographic Template for PowerPoint & Google Slides
Comparison
Modern Ribbon Six-Step Agenda Slide Template for PowerPoint & Google Slides
Agenda
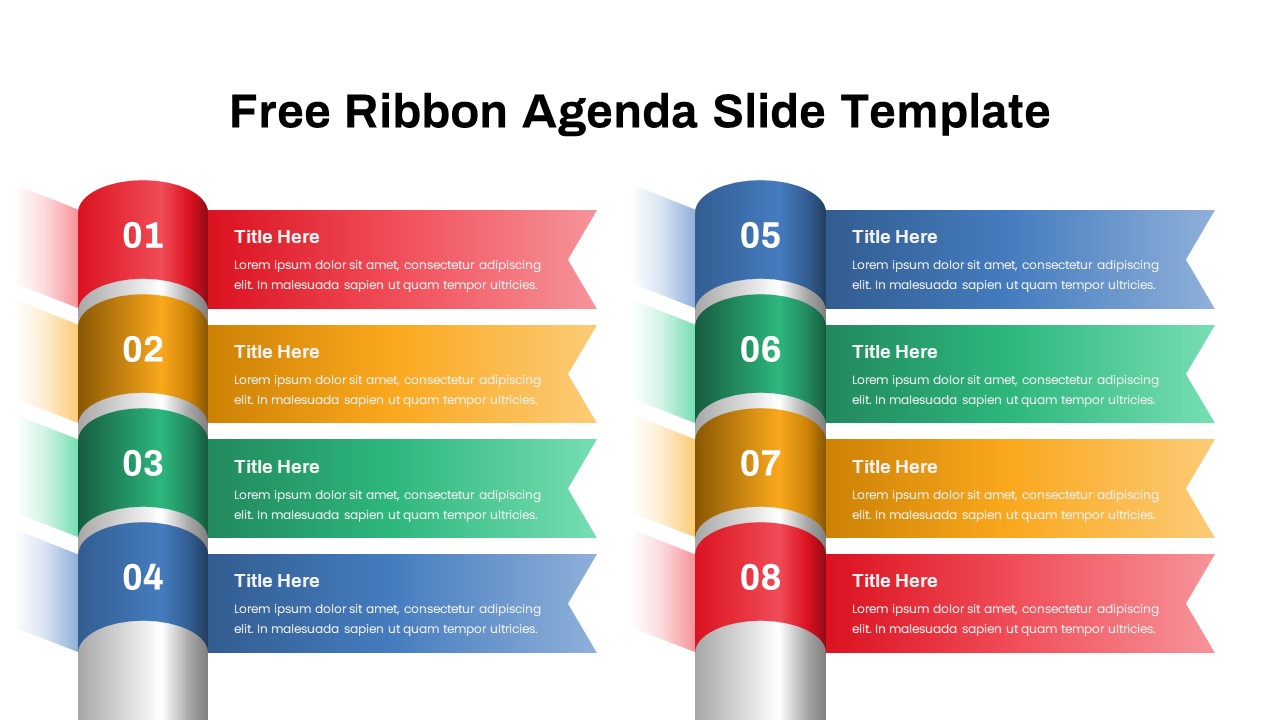
Free Editable Multi-Step Ribbon Agenda Slide Template for PowerPoint & Google Slides
Agenda
Free
Four-Section Ribbon Infographics Template for PowerPoint & Google Slides
Process
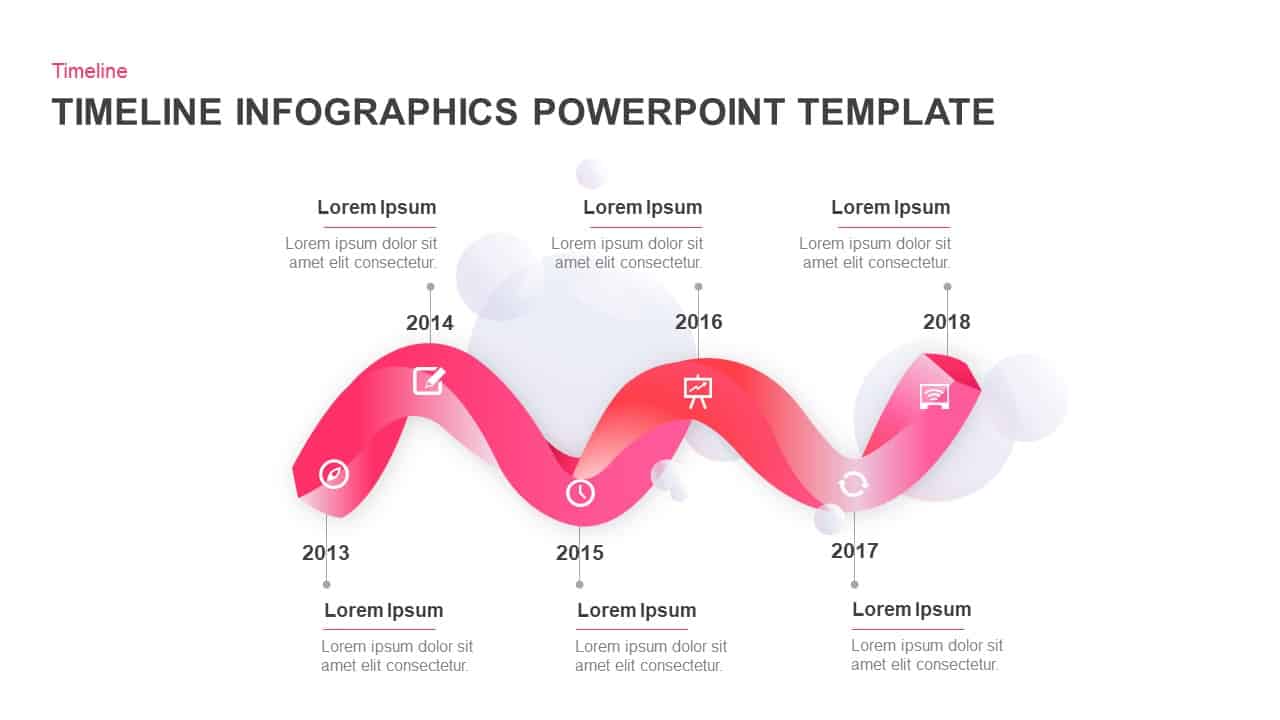
Wavy Ribbon Timeline Infographics Template for PowerPoint & Google Slides
Timeline
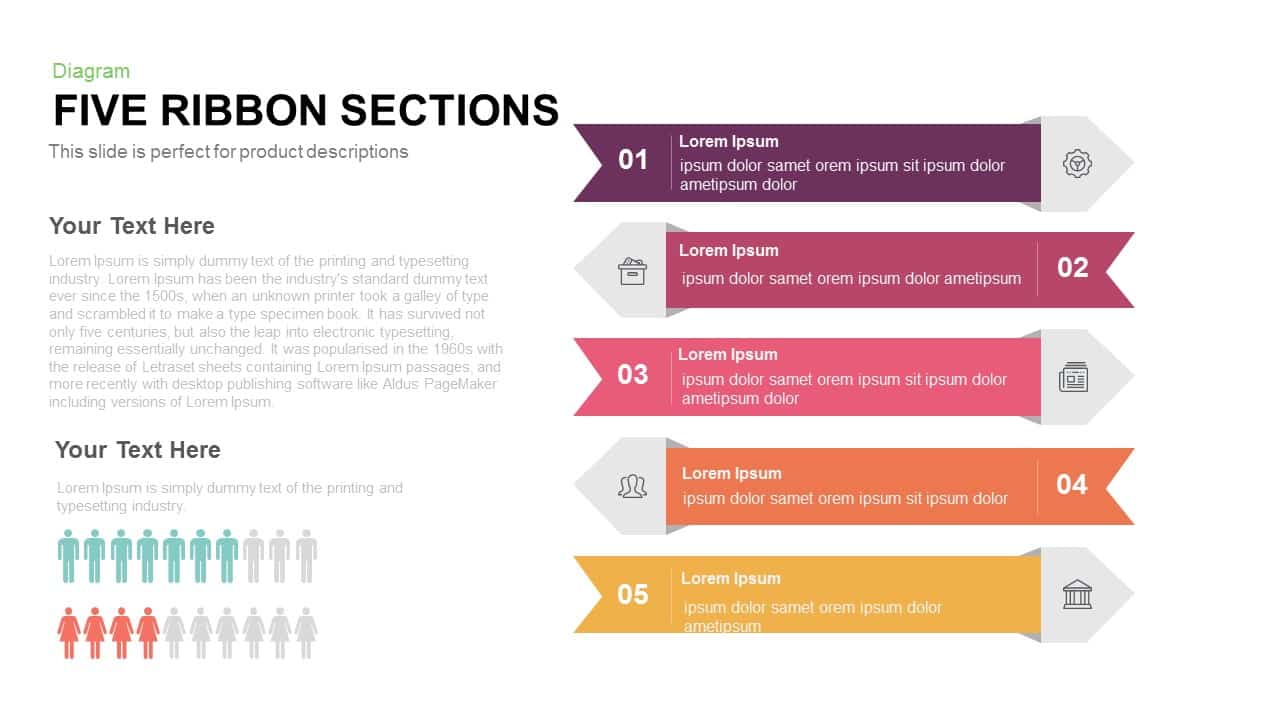
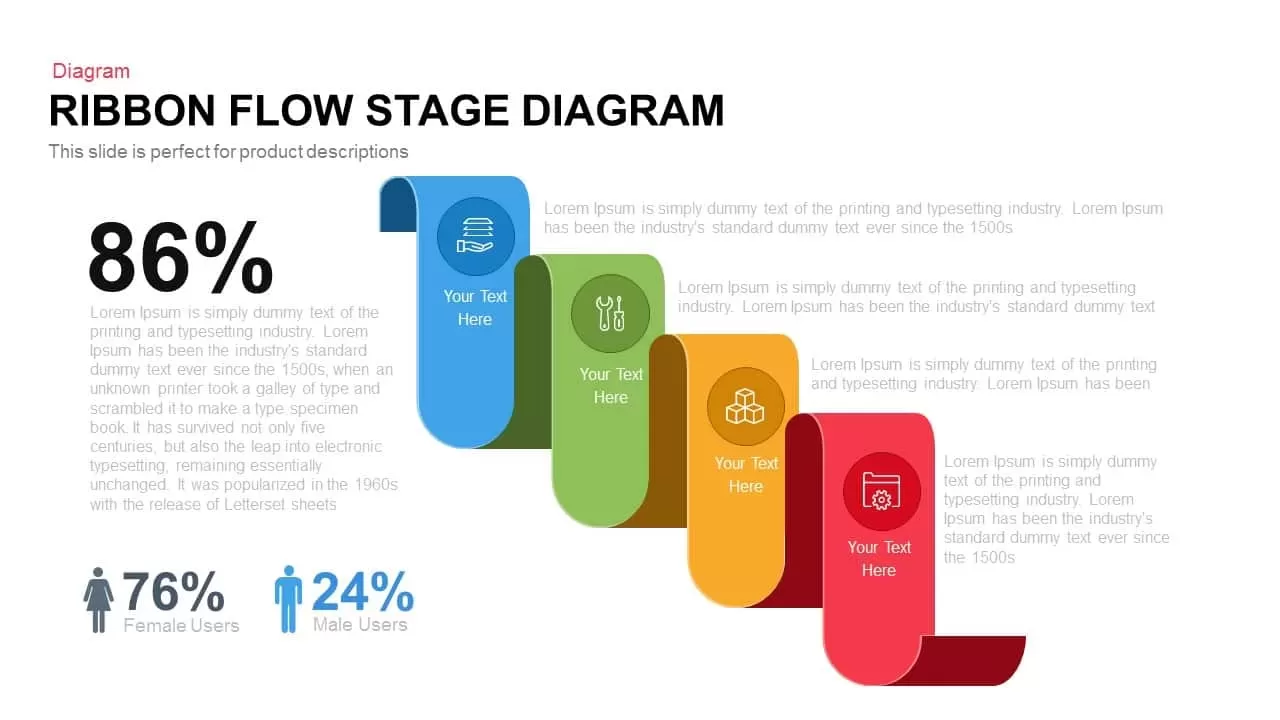
Five Ribbon Sections Process Diagram Template for PowerPoint & Google Slides
Process
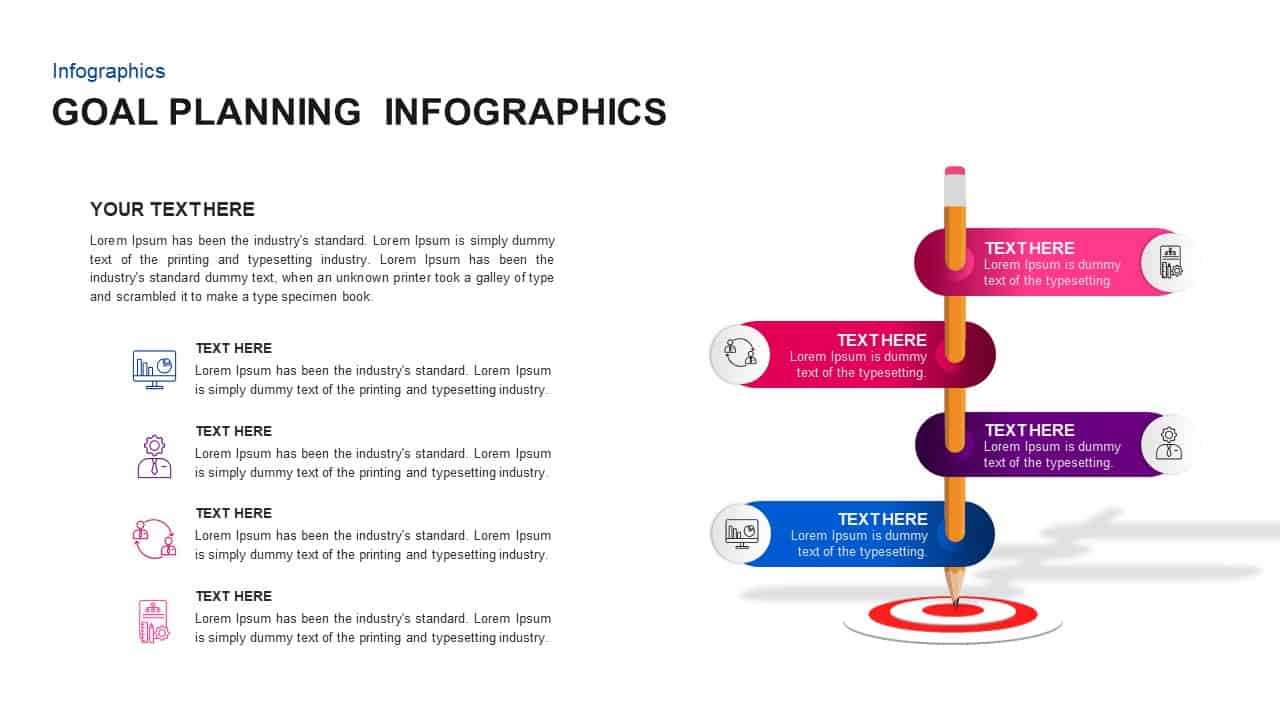
Goal Planning Ribbon Process Infographic Template for PowerPoint & Google Slides
Goals
Ribbon Flow Diagram template for PowerPoint & Google Slides
Process
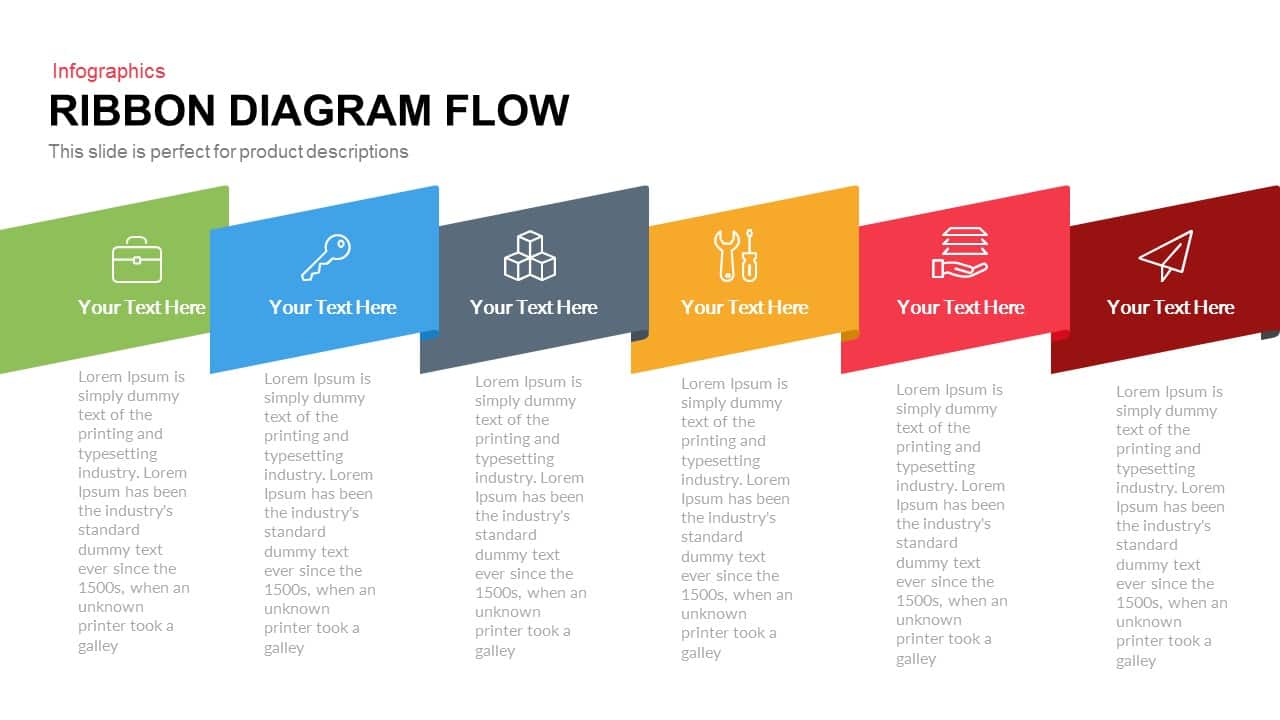
Ribbon Diagram Flow template for PowerPoint & Google Slides
Process
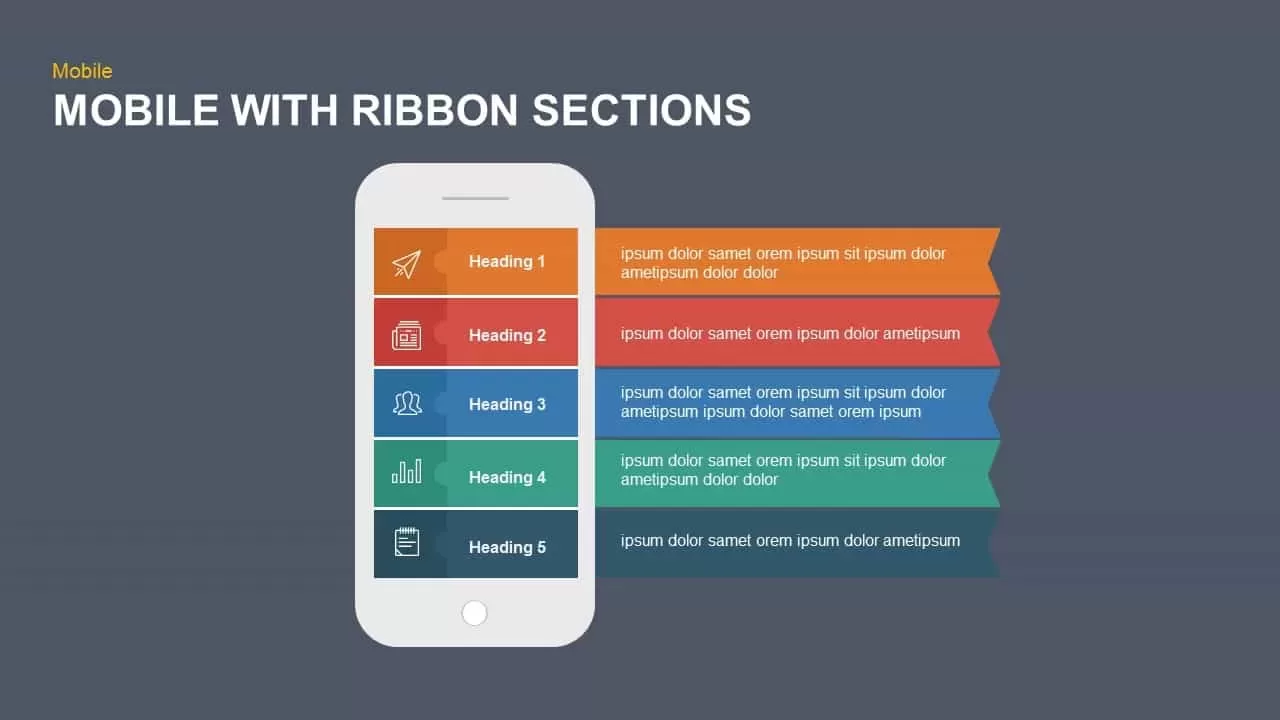
Mobile Ribbon Sections Diagram Template for PowerPoint & Google Slides
Process
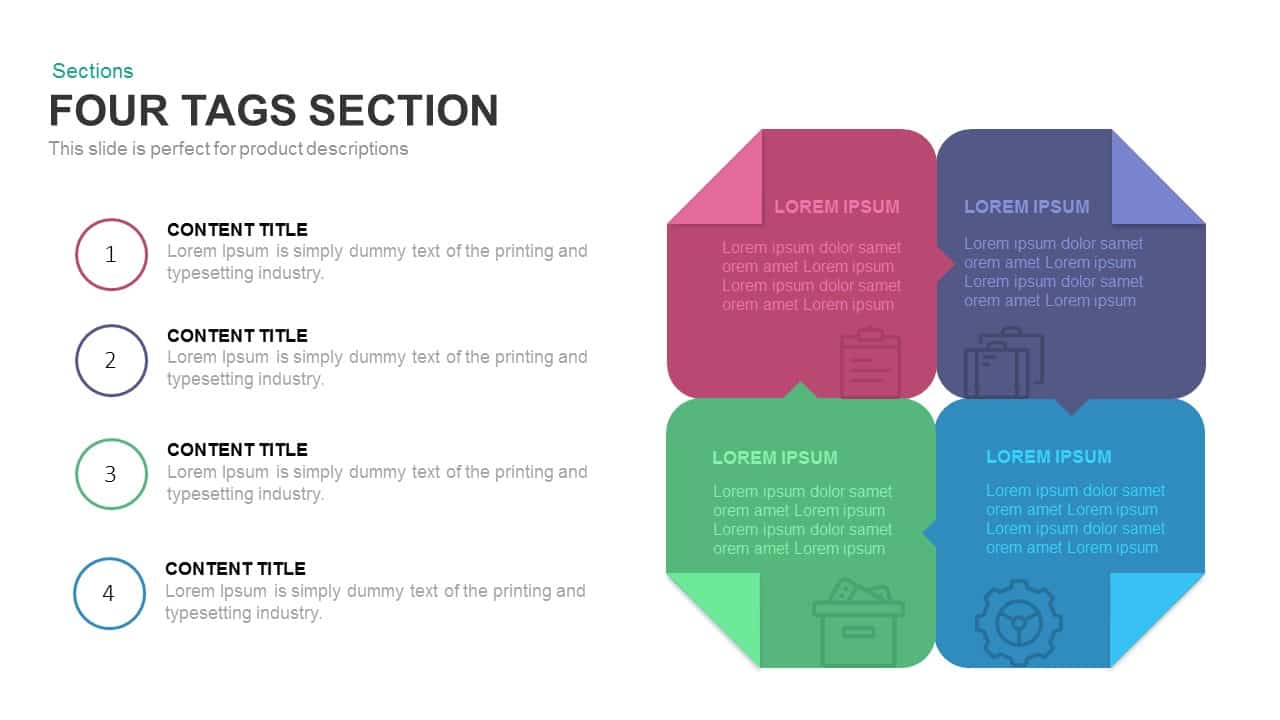
Four-Tag Section Ribbon Infographic Template for PowerPoint & Google Slides
Comparison
Five-Year Ribbon Timeline Diagram Template for PowerPoint & Google Slides
Timeline
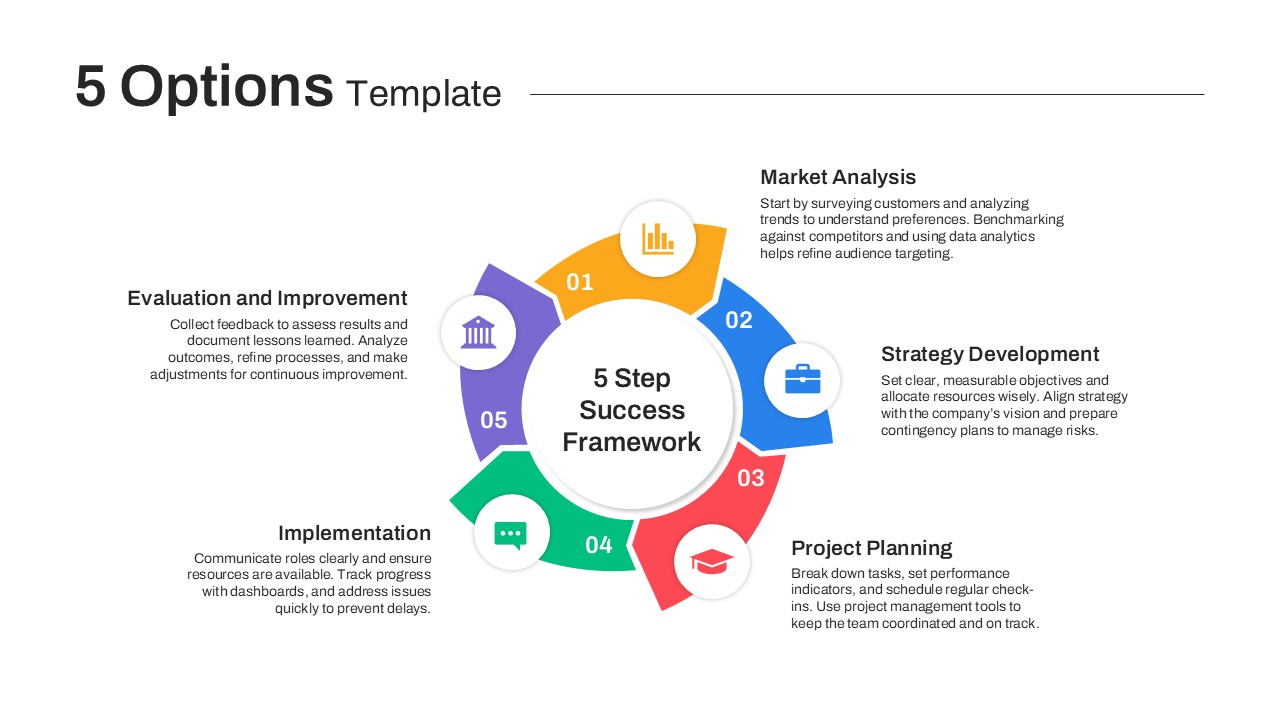
Colorful Five-Option Ribbon Infographic Template for PowerPoint & Google Slides
Process
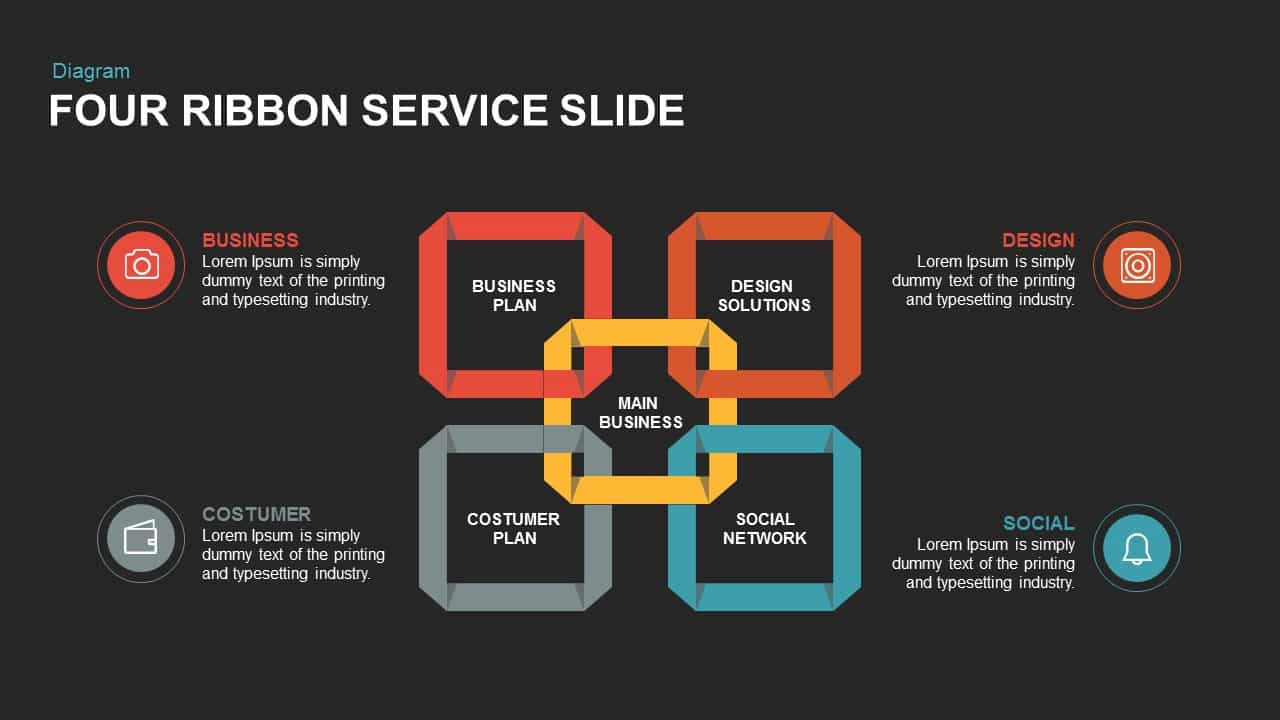
Four Ribbon Service Slide for PowerPoint & Google Slides
Infographics
Sales Playbook Step-by-Step Process Template for PowerPoint & Google Slides
Process
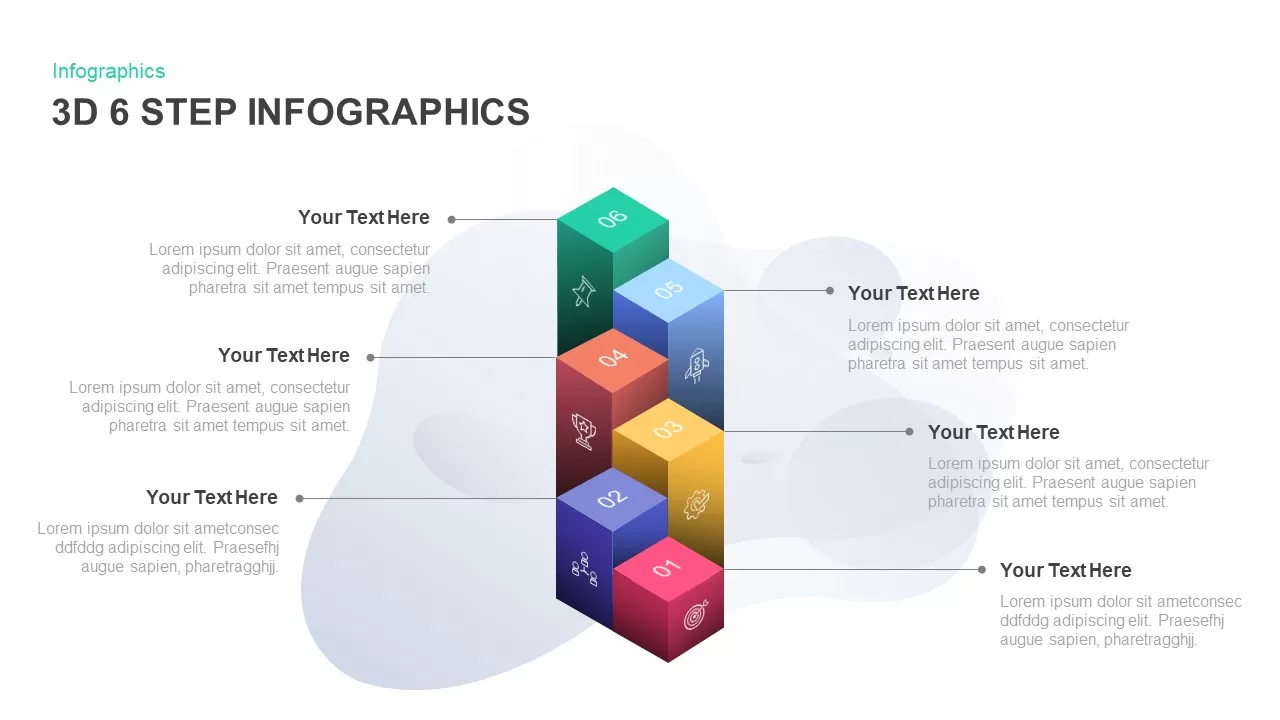
3D 6-Step Infographics Process Diagram Template for PowerPoint & Google Slides
Infographics
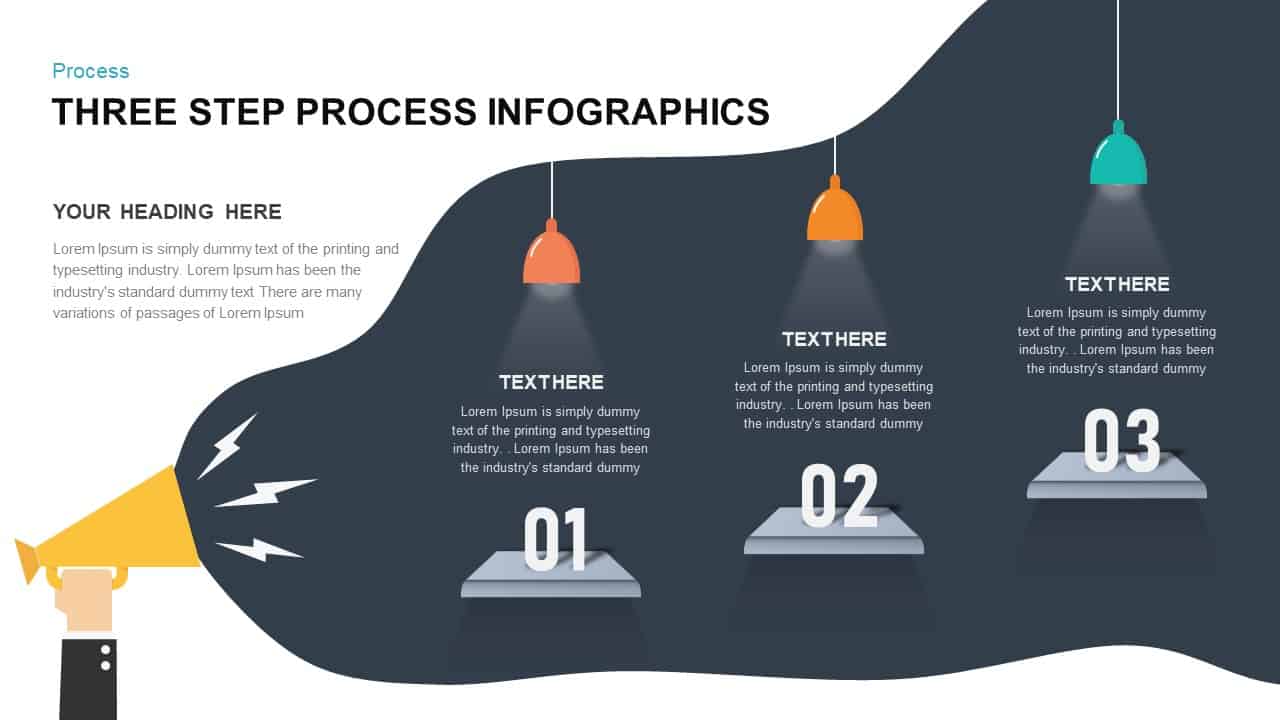
Three-Step Process Infographics Template for PowerPoint & Google Slides
Process

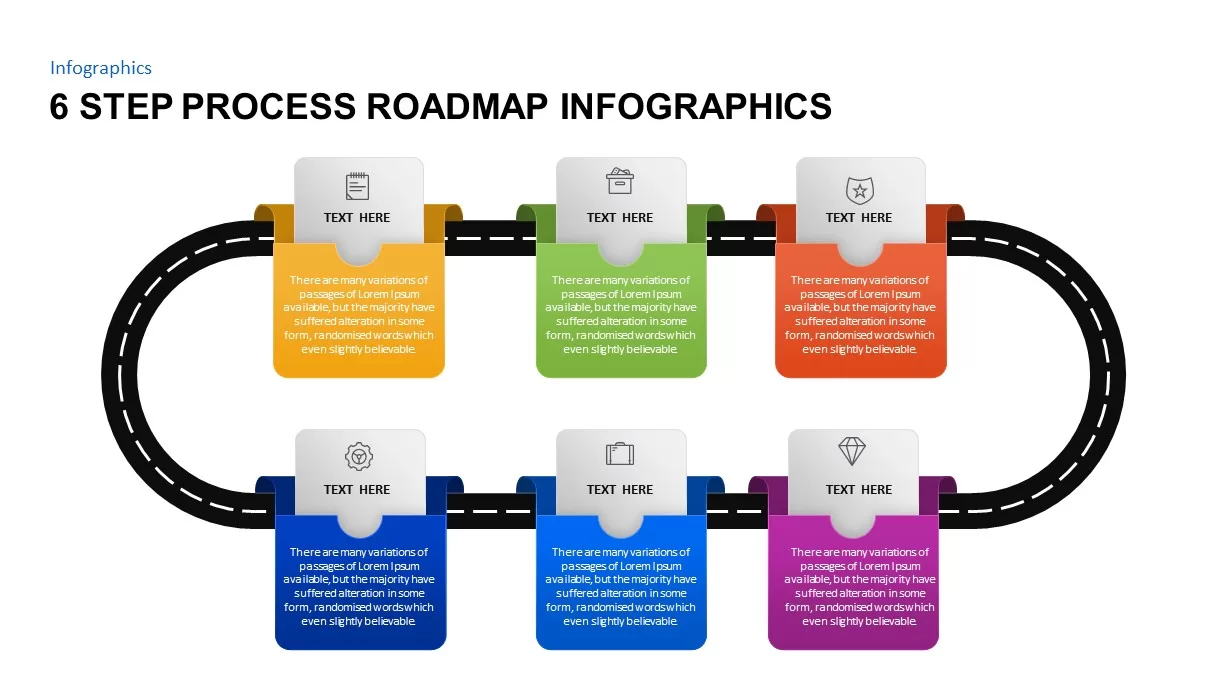
6 Step Process Roadmap Infographics Template for PowerPoint & Google Slides
Roadmap
Four-Step Circular Process Infographics Template for PowerPoint & Google Slides
Circular
4 Step Process PowerPoint & Google Slides Template for PowerPoint & Google Slides
Process
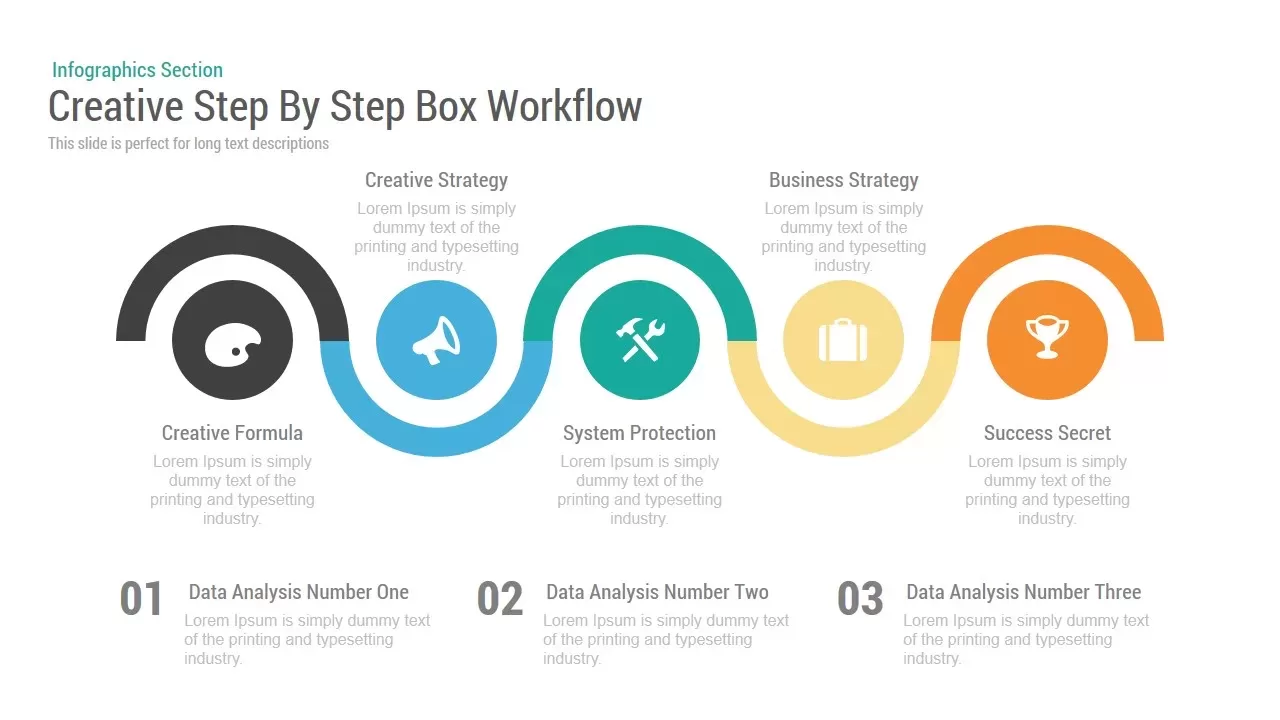
Creative Step By Step Workflow template for PowerPoint & Google Slides
Process
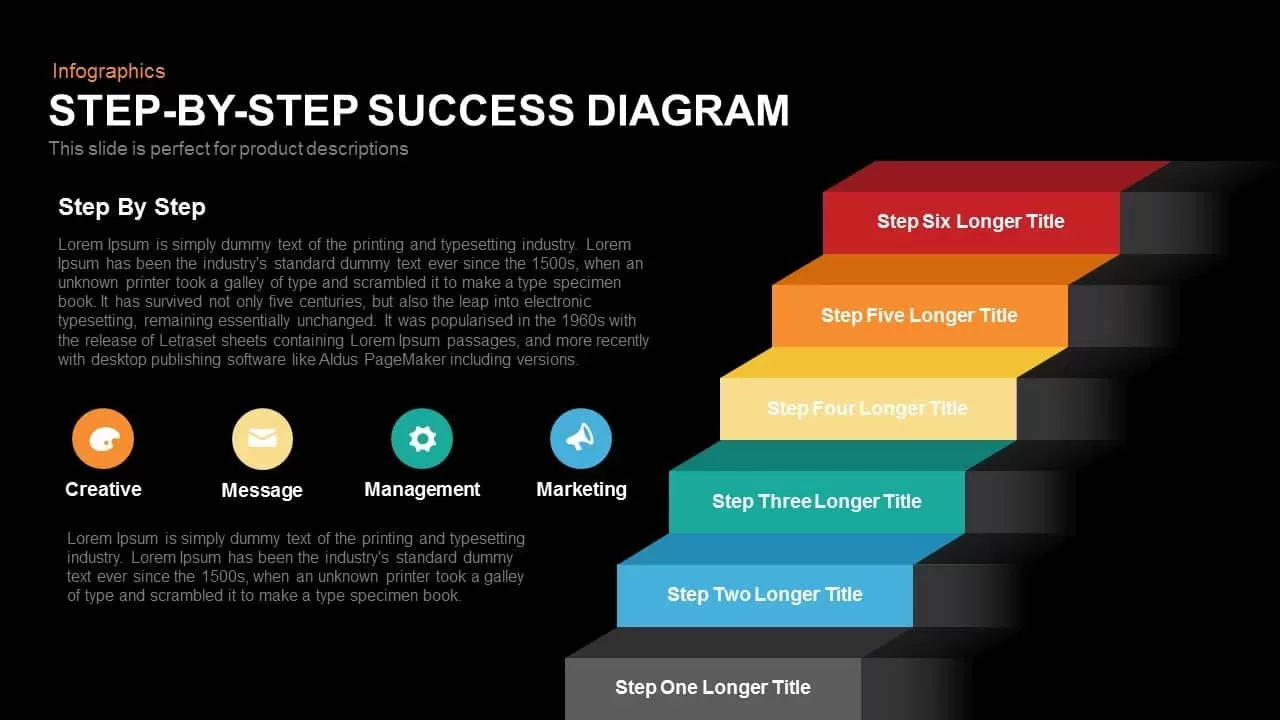
Step-by-Step Success Staircase Diagram template for PowerPoint & Google Slides
Process
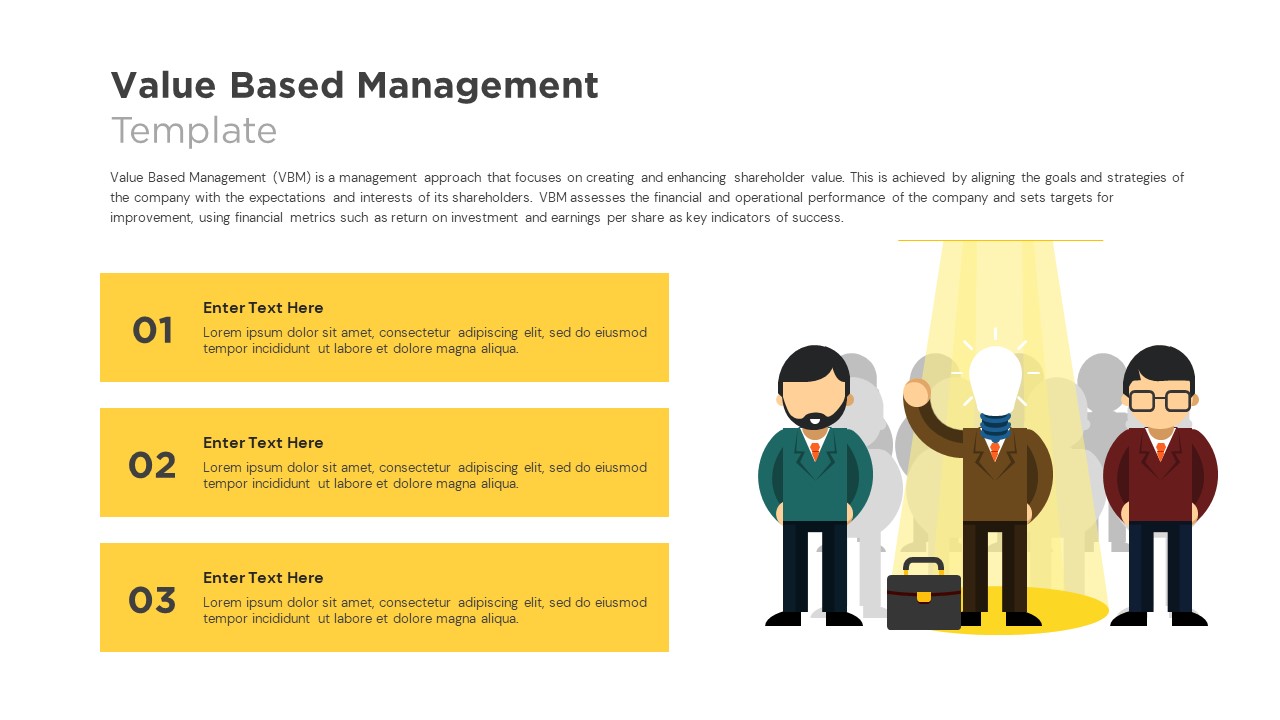
Value Based Management Step-by-Step Template for PowerPoint & Google Slides
Business Strategy
Top 10 Step-by-Step Image & Text Layouts Template for PowerPoint & Google Slides
Graphics
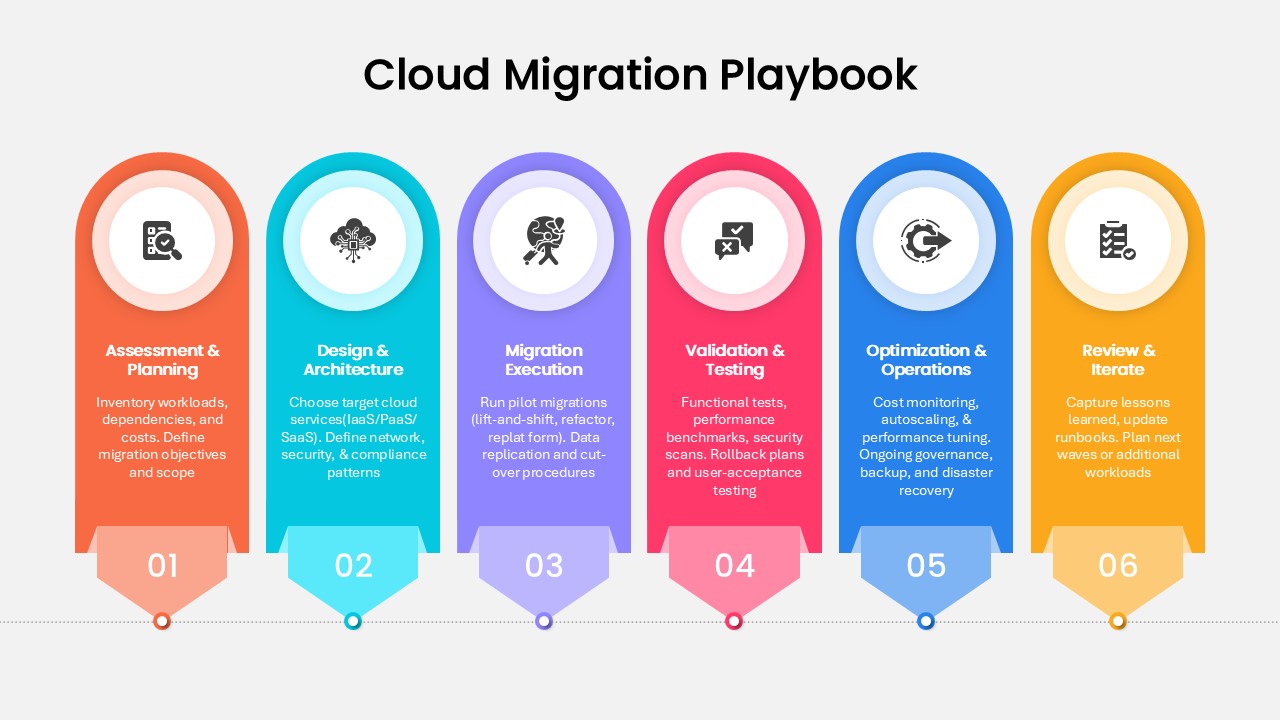
Step-by-Step Cloud Migration Playbook Template for PowerPoint & Google Slides
Cloud Computing
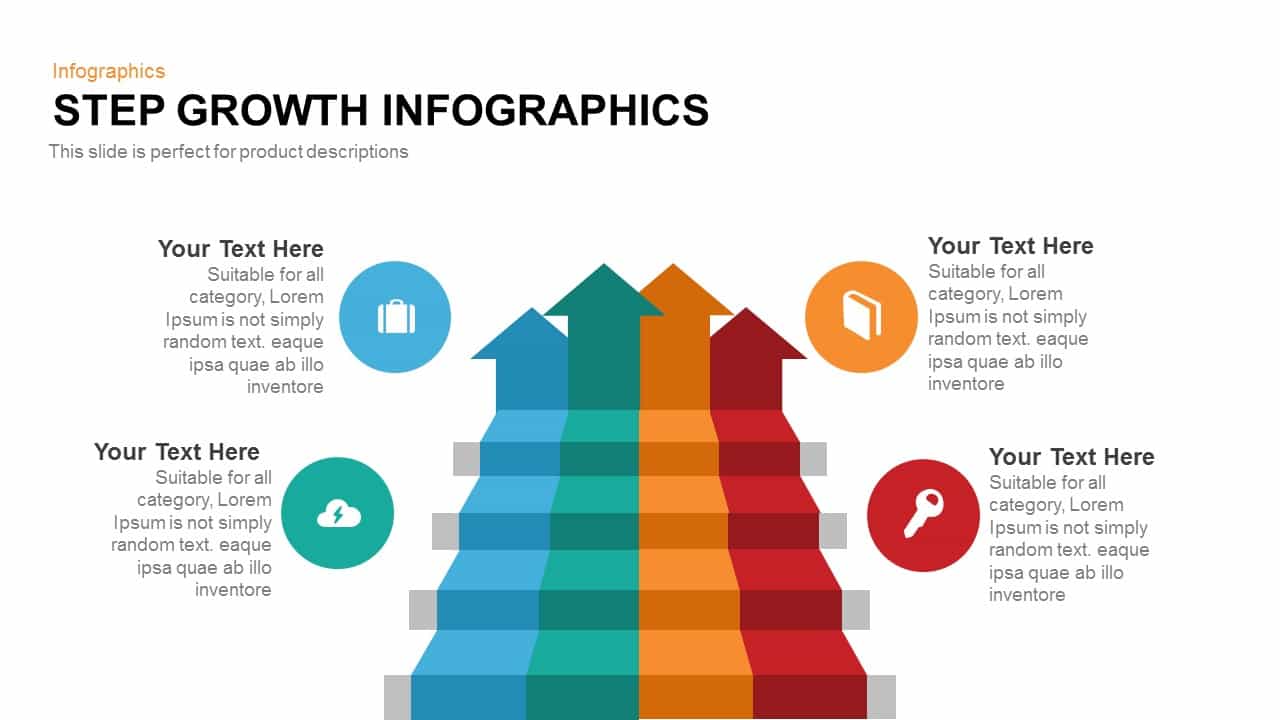
Modern Step Growth Infographics Template for PowerPoint & Google Slides
Process
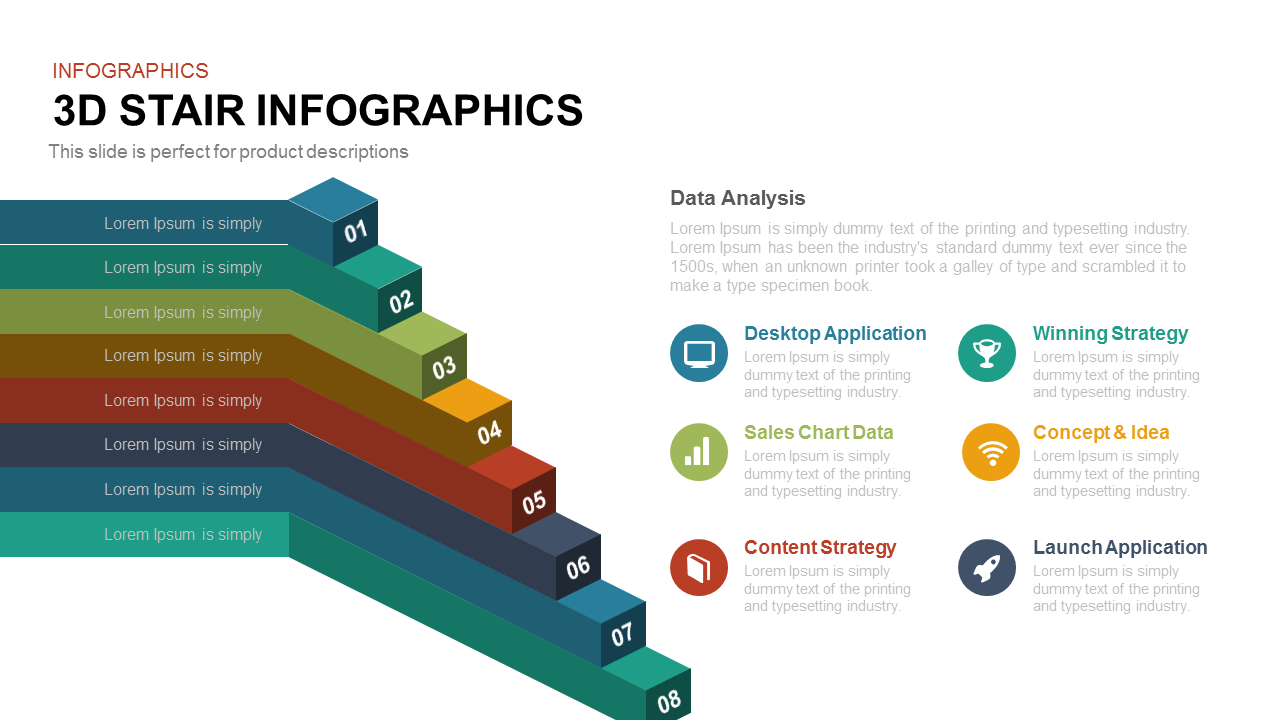
8-Step 3D Stair Infographics Slide template for PowerPoint & Google Slides
Process

Arrow Step Infographics Workflow Template for PowerPoint & Google Slides
Arrow
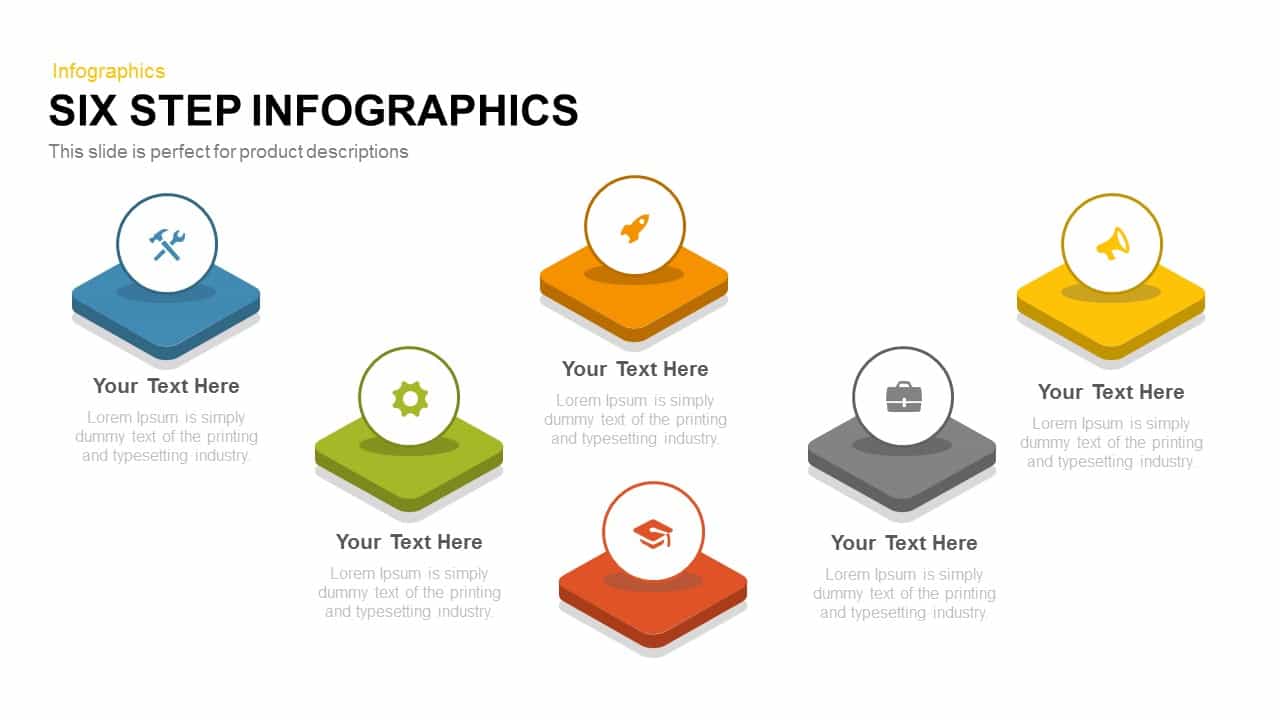
Six-Step Infographics Template for PowerPoint & Google Slides
Process
4-Step Growth & Success Infographics Template for PowerPoint & Google Slides
Accomplishment
Six-Step Purple Gradient Infographics Template for PowerPoint & Google Slides
Process
5-Step Growth Arrow Infographics Template for PowerPoint & Google Slides
Arrow
Five-Step Business Infographics Template for PowerPoint & Google Slides
Infographics
Modern 5-Step Flow Infographics Template for PowerPoint & Google Slides
Process
Five-Step Circular Badge Infographics Template for PowerPoint & Google Slides
Circular
Four-Step Business Plan Infographics Template for PowerPoint & Google Slides
Business Plan
5 Step Sales Planning Infographics Template for PowerPoint & Google Slides
Process
Six-Step Circular Diagram Infographics Template for PowerPoint & Google Slides
Circular
8-Step Circular Diagram Infographics Template for PowerPoint & Google Slides
Circular
3, 4, and 5 Step Gear Infographics Template for PowerPoint & Google Slides
Process
8-Step Circular Gear Infographics Diagram for PowerPoint & Google Slides
Process
4 and 5 Step Honeycomb Infographics for PowerPoint & Google Slides
Process
5 Step Sales Planning Infographics for PowerPoint & Google Slides
Infographics
Four Step Infographics Diagram for PowerPoint & Google Slides
Process
Five-Step Process Improvement Template for PowerPoint & Google Slides
Process
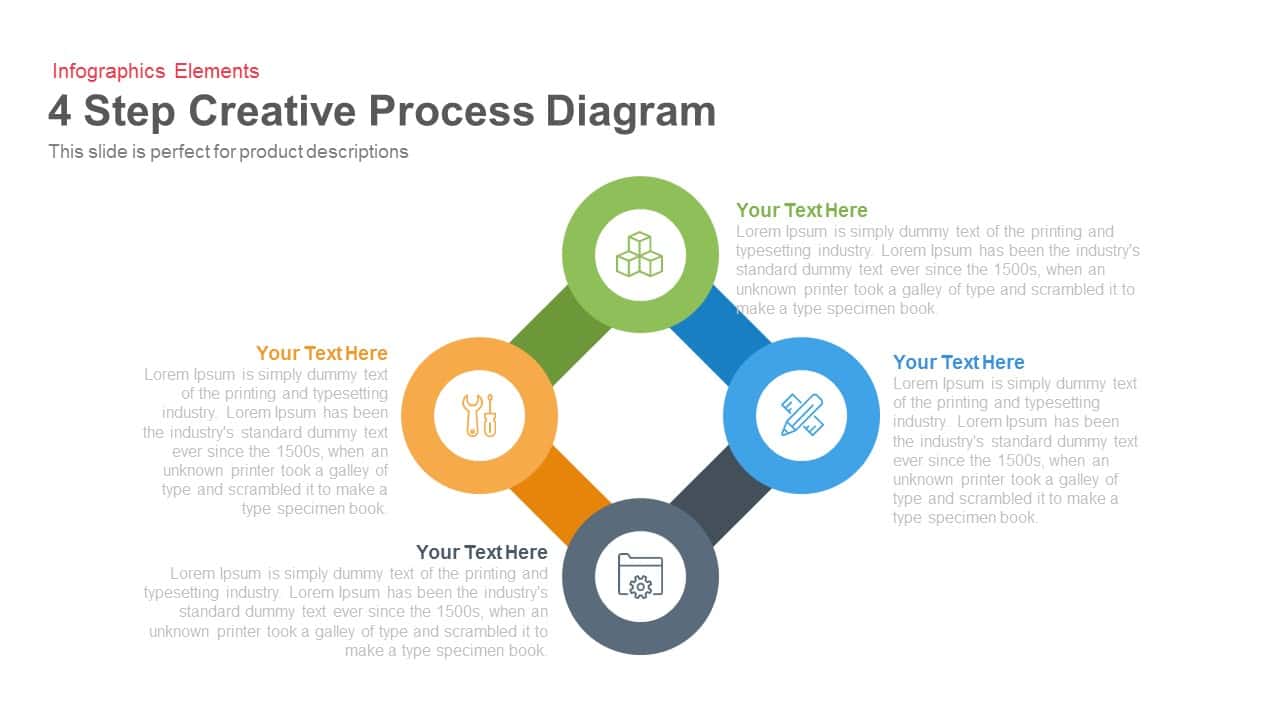
4 Step Creative Process Diagram Template for PowerPoint & Google Slides
Infographics
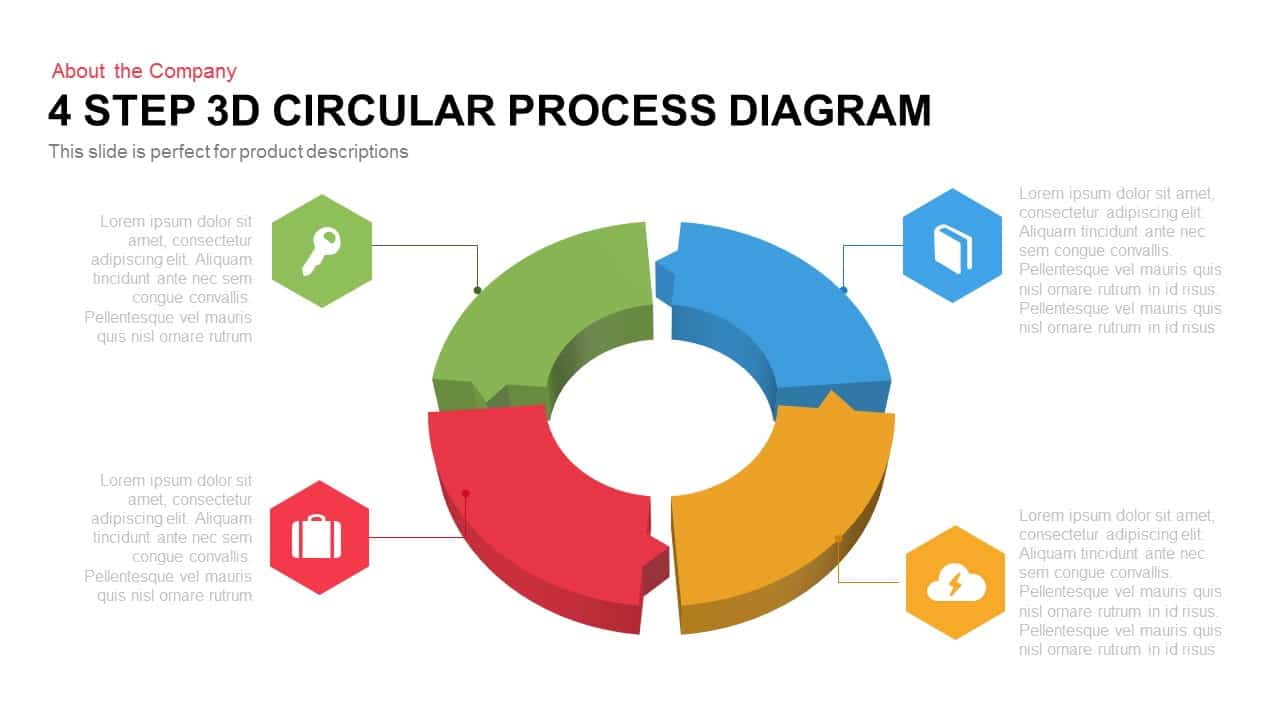
4 Step 3D Circular Process Diagram template for PowerPoint & Google Slides
Process
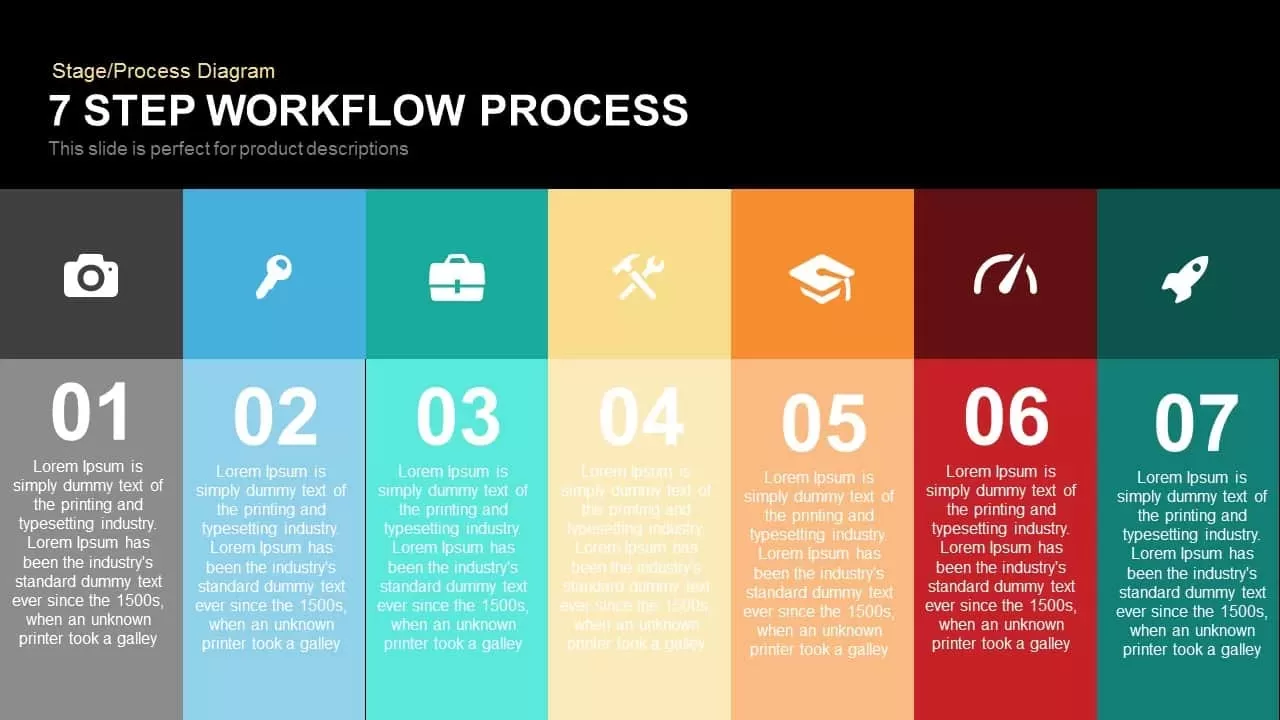
7-Step Workflow Process Diagram Template for PowerPoint & Google Slides
Process
15-Step Process Flow Diagram Template for PowerPoint & Google Slides
Process
Roadmap Six-Step Process Diagram Template for PowerPoint & Google Slides
Roadmap
Editable Six-Step Bubble Process Diagram Template for PowerPoint & Google Slides
Process
Five-Step Concept to Delivery Process Template for PowerPoint & Google Slides
Process
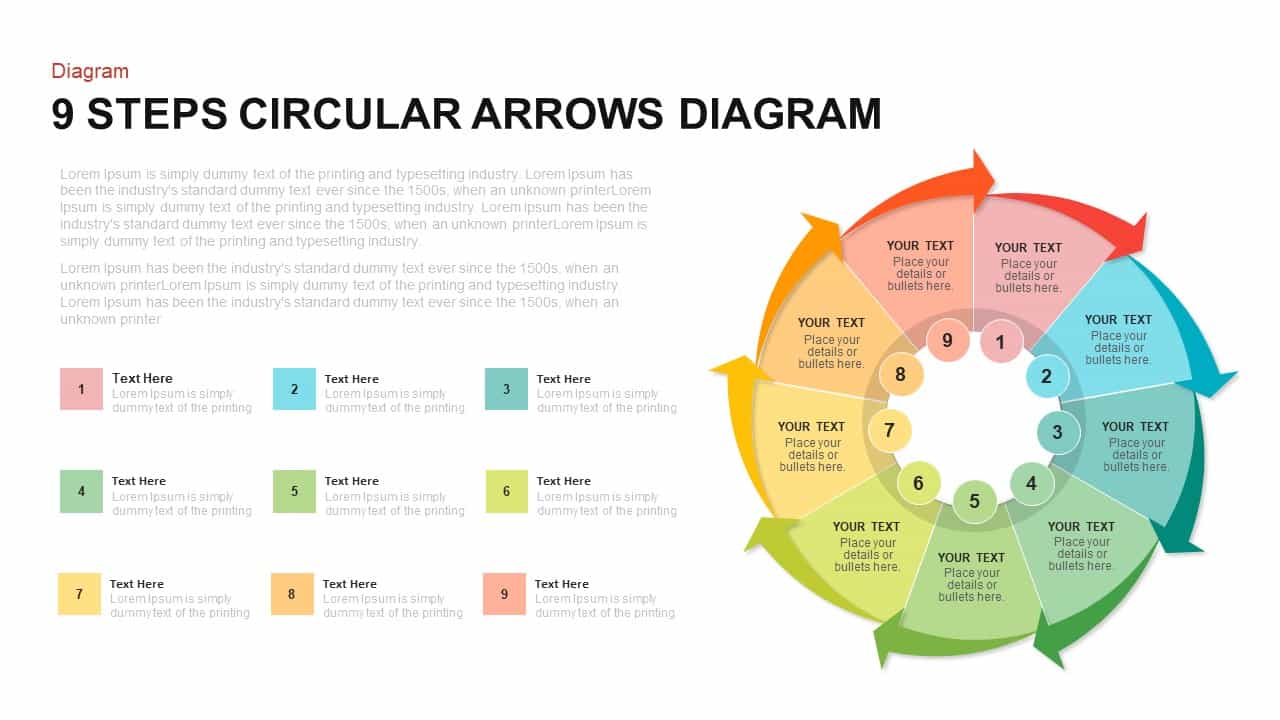
9-Step Circular Arrows Process Diagram Template for PowerPoint & Google Slides
Process
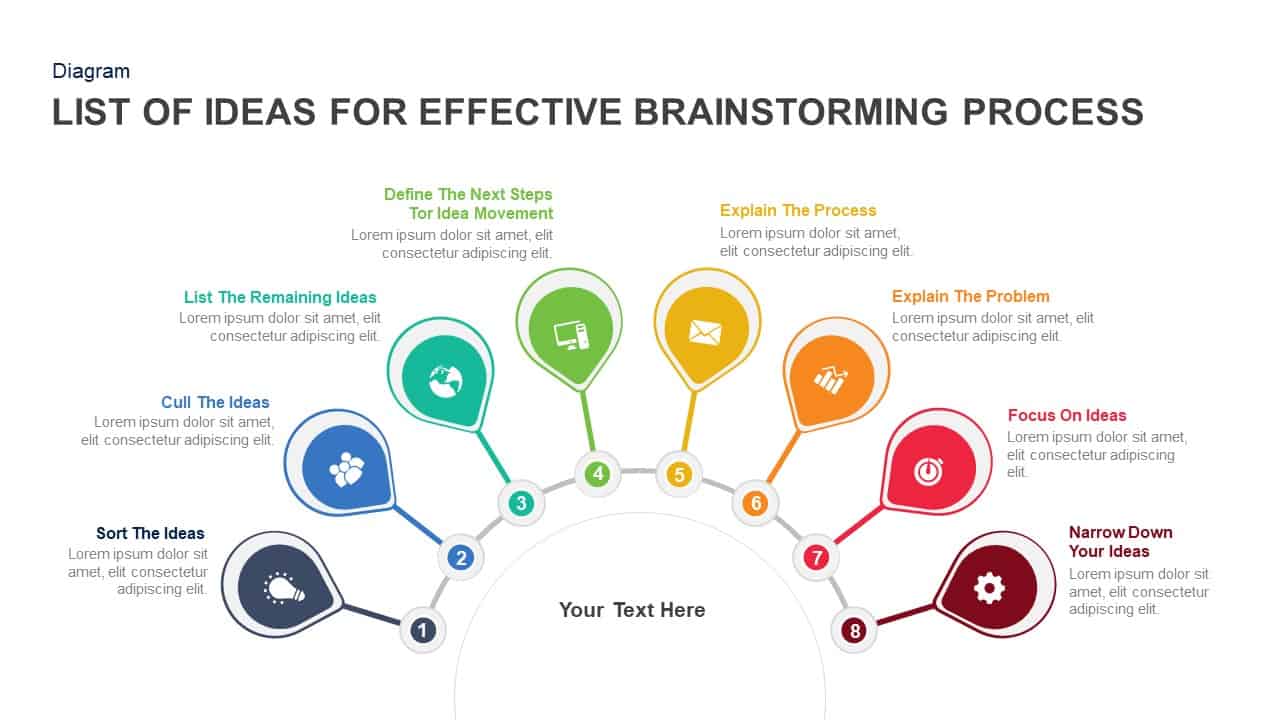
Eight-Step Brainstorming Process Diagram Template for PowerPoint & Google Slides
Process
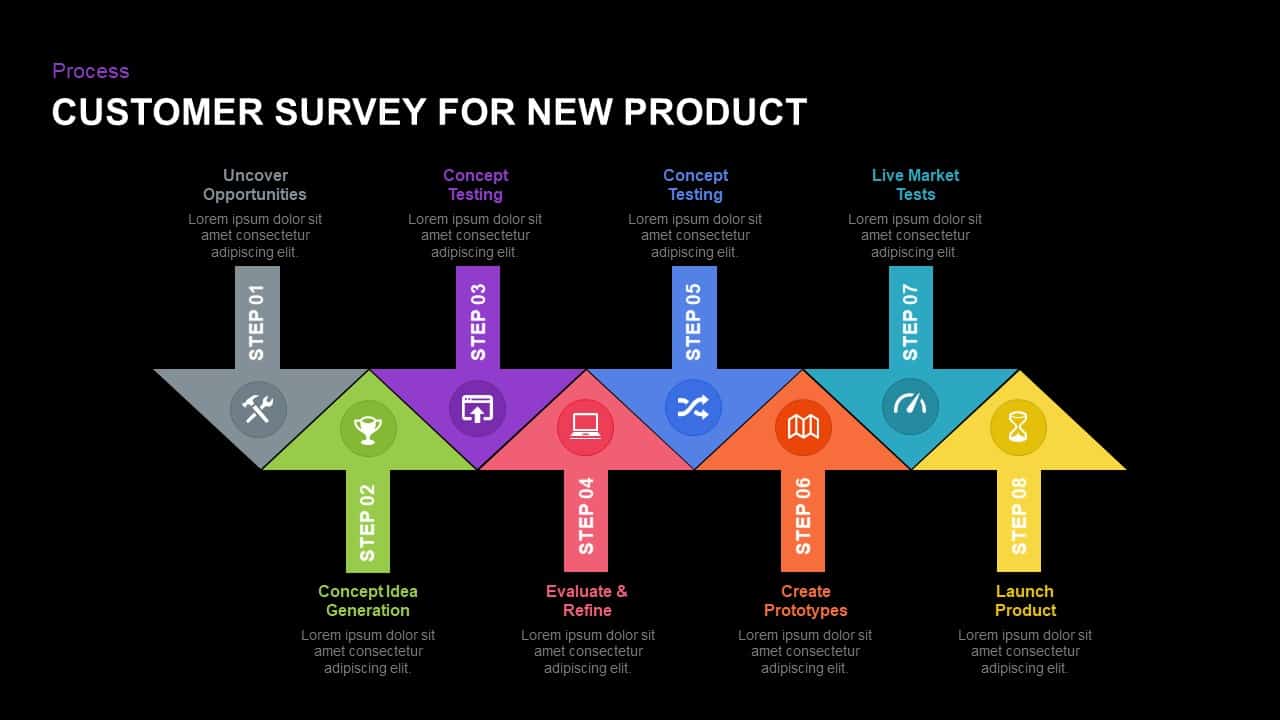
Eight-Step New Product Survey Process Template for PowerPoint & Google Slides
Process
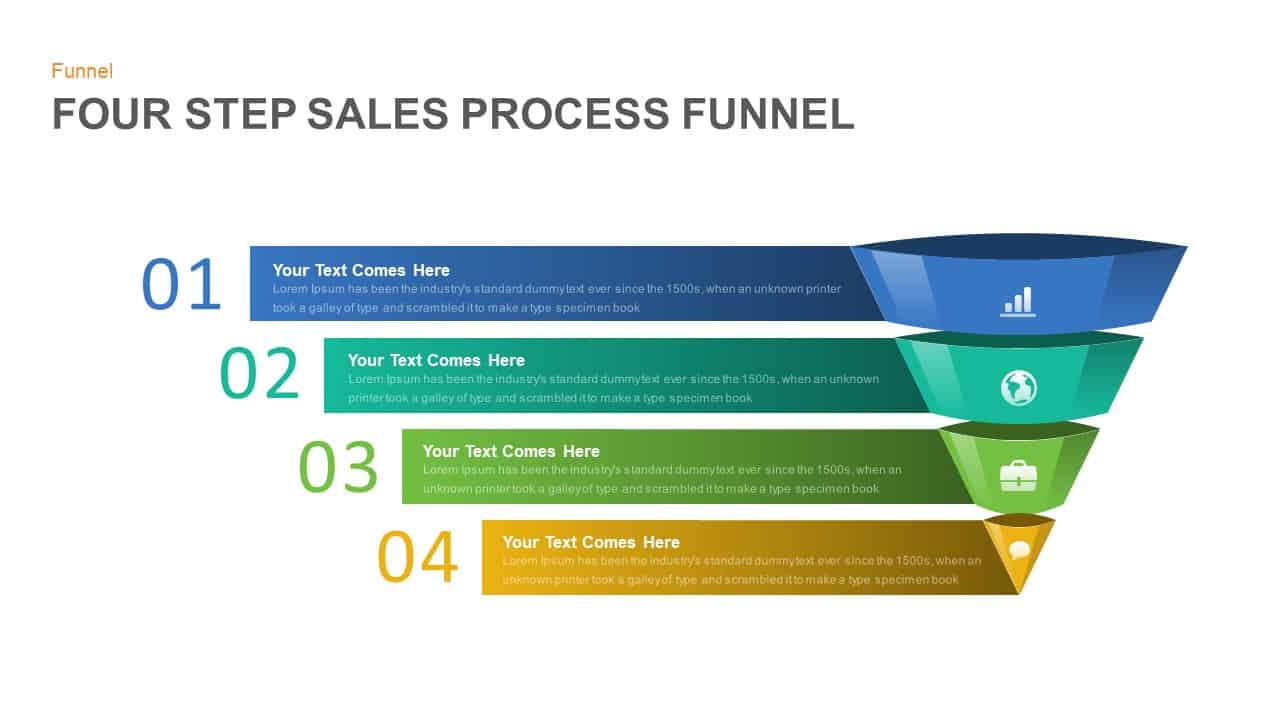
Four Step Sales Process Funnel Template for PowerPoint & Google Slides
Funnel
Five-Step Circular Process Diagram Template for PowerPoint & Google Slides
Circular
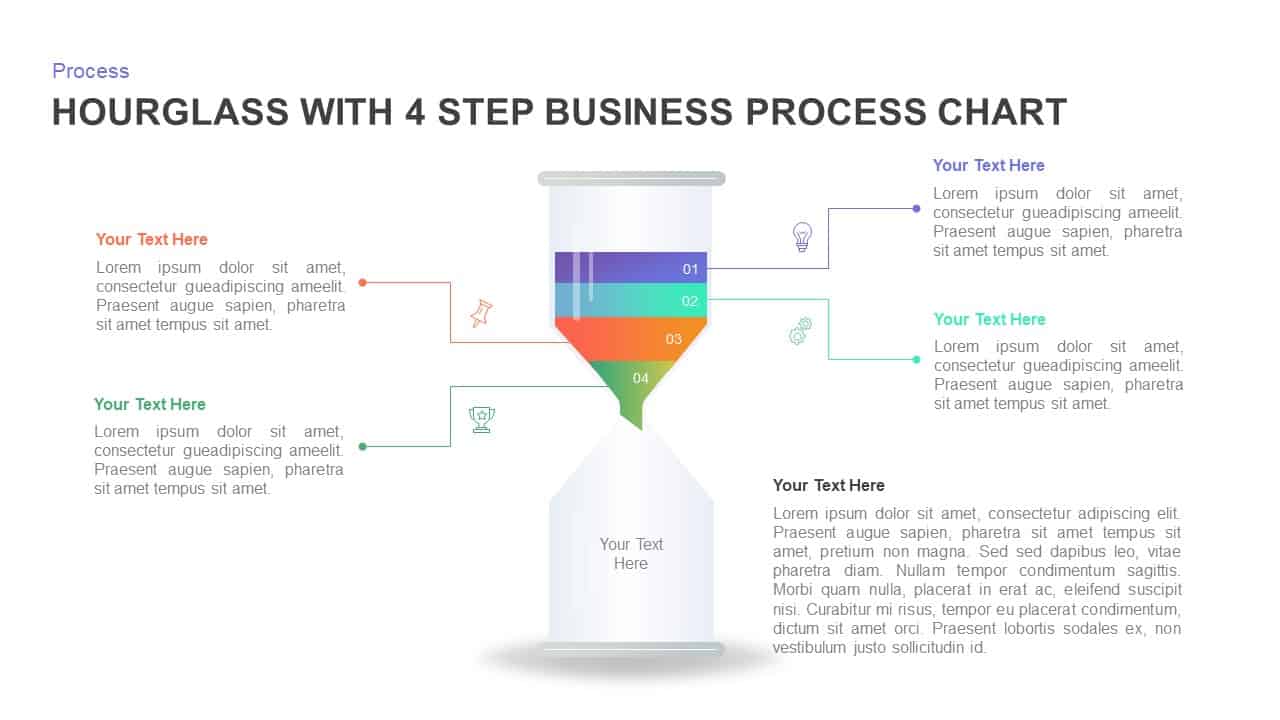
Four-Step Hourglass Business Process Template for PowerPoint & Google Slides
Process
Three to Nine-Step Puzzle Ring Process Diagram Template for PowerPoint & Google Slides
Circular
Hand-Held Four-Step Process Diagram Template for PowerPoint & Google Slides
Process
Business System Five-Step Process Template for PowerPoint & Google Slides
Process
Modern 5-Step Sales Process Diagram Template for PowerPoint & Google Slides
Process
8 Step Circular Process Flow Diagram Template for PowerPoint & Google Slides
Process
Six-Step Accounting Process Development Template for PowerPoint & Google Slides
Process
6-Step Circular Process Flow Diagram Template for PowerPoint & Google Slides
Process
Pencil Qualification Process Five-Step Template for PowerPoint & Google Slides
Process
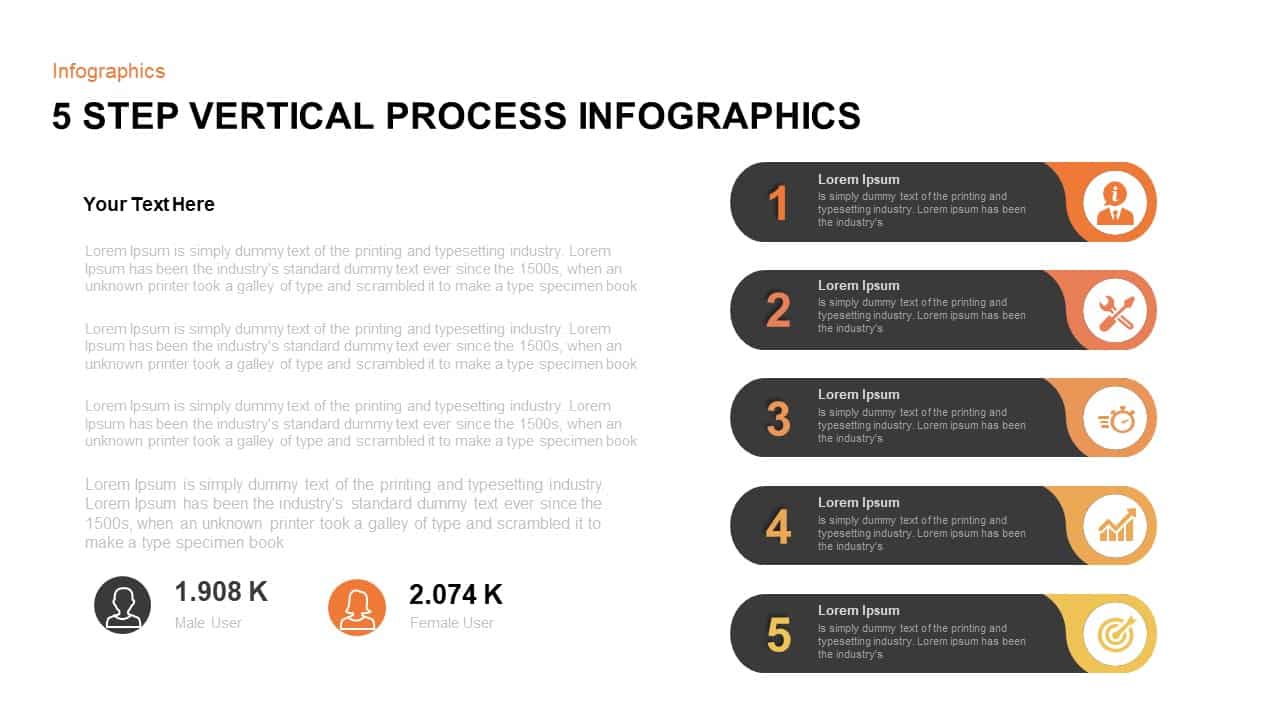
Five-Step Vertical Process Infographic Template for PowerPoint & Google Slides
Process
4-Step Linear Process Flow Diagram Template for PowerPoint & Google Slides
Process
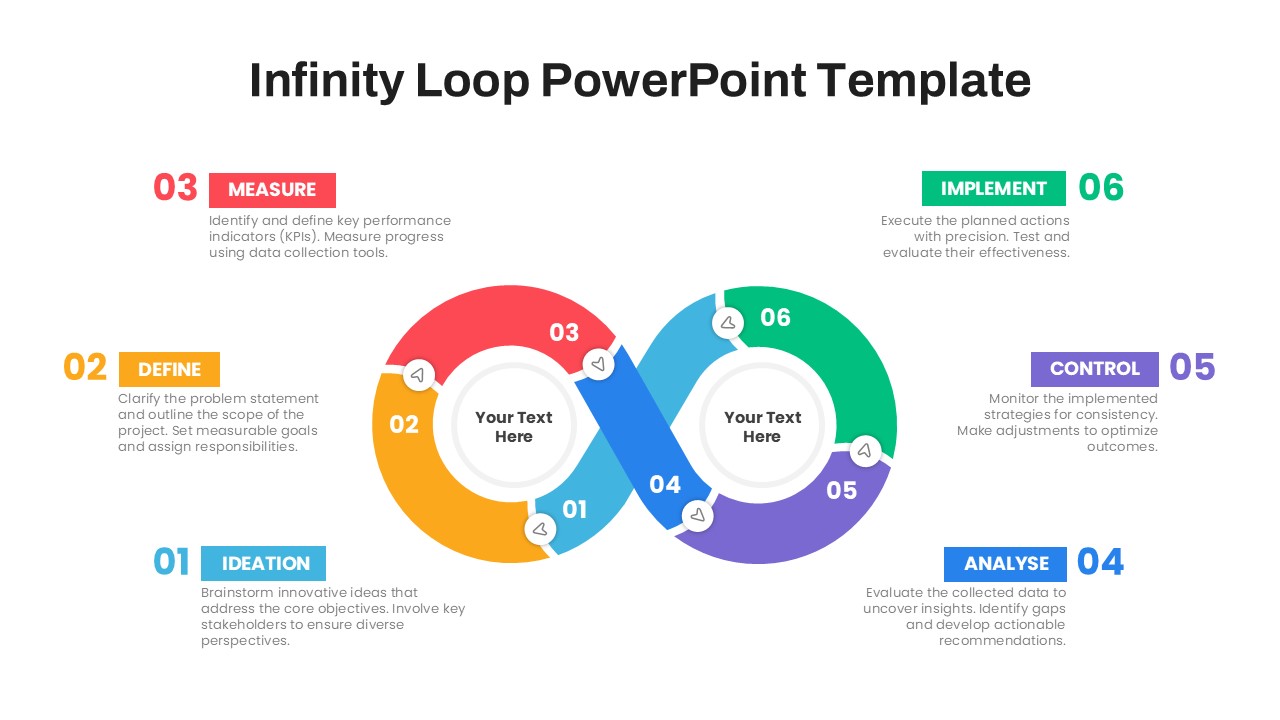
Six-Step Infinity Loop Process Diagram Template for PowerPoint & Google Slides
Process
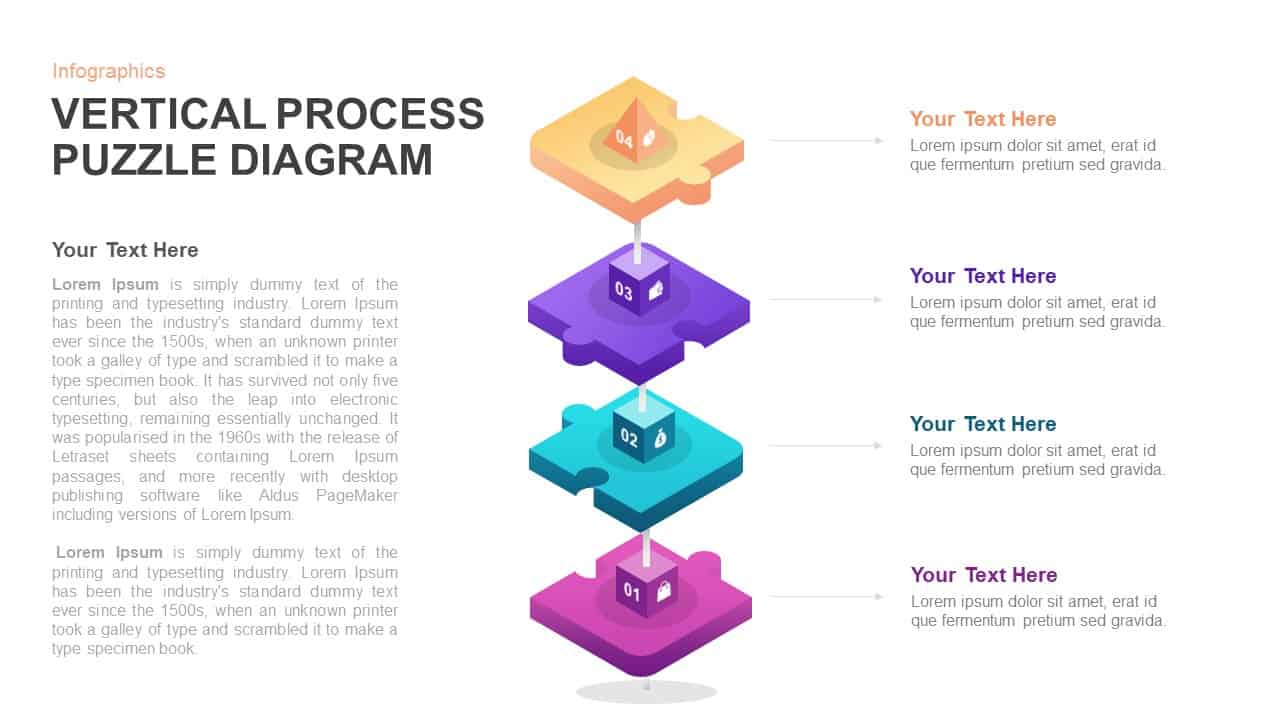
Vertical 4-Step Puzzle Process Diagram Template for PowerPoint & Google Slides
Process
Colorful 5-Step Circular Process Template for PowerPoint & Google Slides
Process
Modern 5-Step Process Flow Infographic Template for PowerPoint & Google Slides
Process
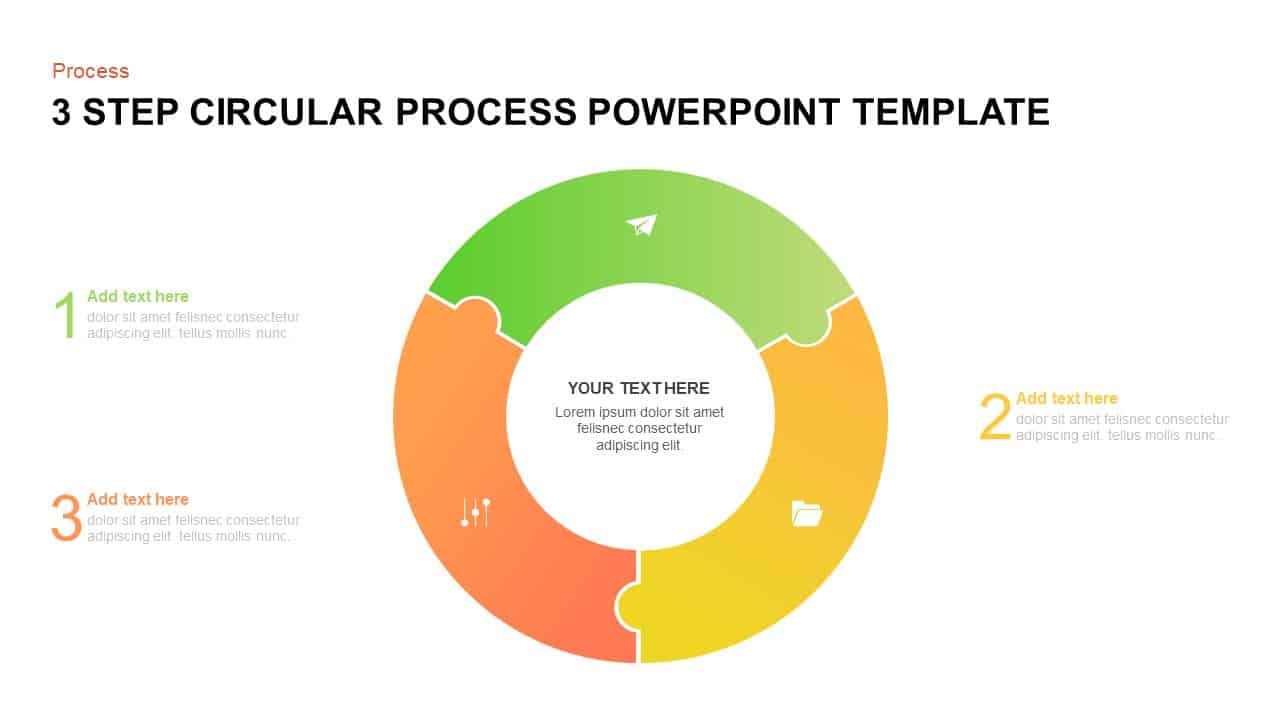
3 Step Circular Process Fidget Spinner Template for PowerPoint & Google Slides
Process
Five-Step Process Flow Infographic Template for PowerPoint & Google Slides
Process
Folded Square Four-Step Process Template for PowerPoint & Google Slides
Process
Five-Step Marketing Process Infographic Template for PowerPoint & Google Slides
Process
3 & 4 Step Circular Process Infographic Template for PowerPoint & Google Slides
Process
Three-Step Objective Goal Process Template for PowerPoint & Google Slides
Goals
Four-Step Curved Arrow Process Template for PowerPoint & Google Slides
Process
Three-Step Curved Arrow Process Diagram Template for PowerPoint & Google Slides
Arrow
Five-Step Animated Accordion Process Template for PowerPoint & Google Slides
Process
Five-Step Hexagon Infographic Process Template for PowerPoint & Google Slides
Process
Three-Step Hexagon Infographic Process Template for PowerPoint & Google Slides
Process
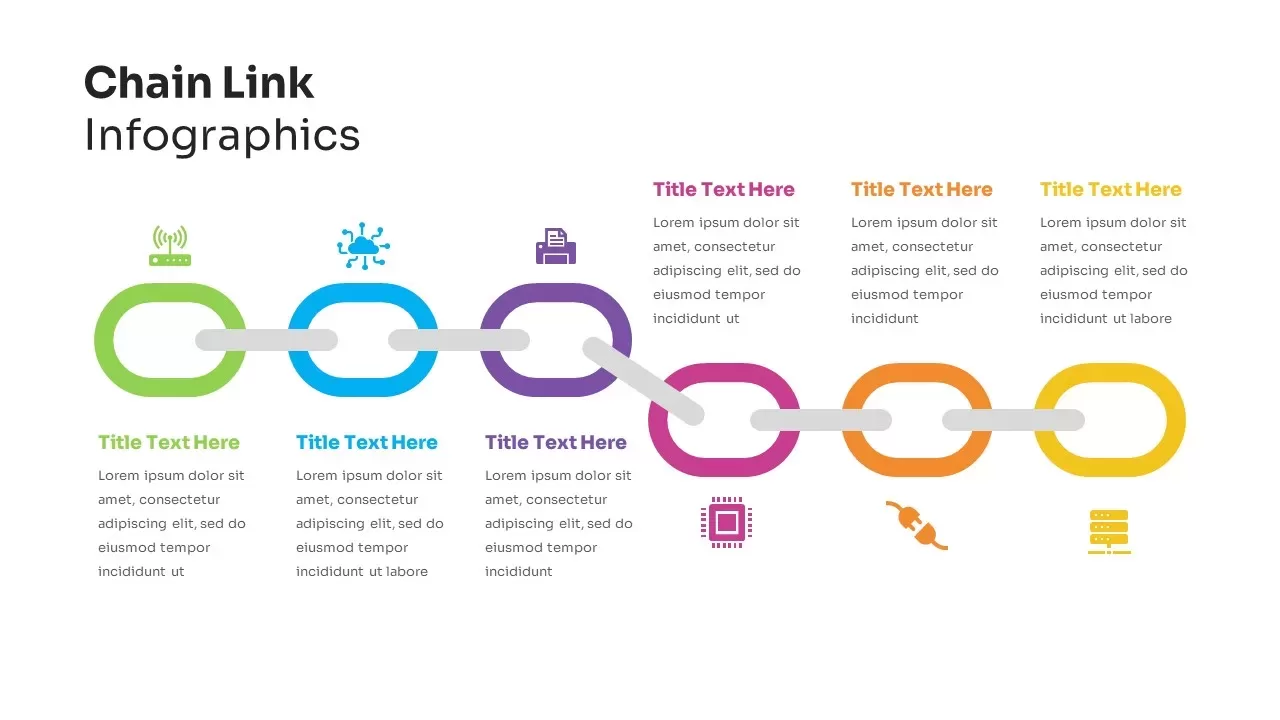
Five-Step Chain Link Process Infographic Template for PowerPoint & Google Slides
Process
Six-Step Chain Link Technology Process Template for PowerPoint & Google Slides
Process
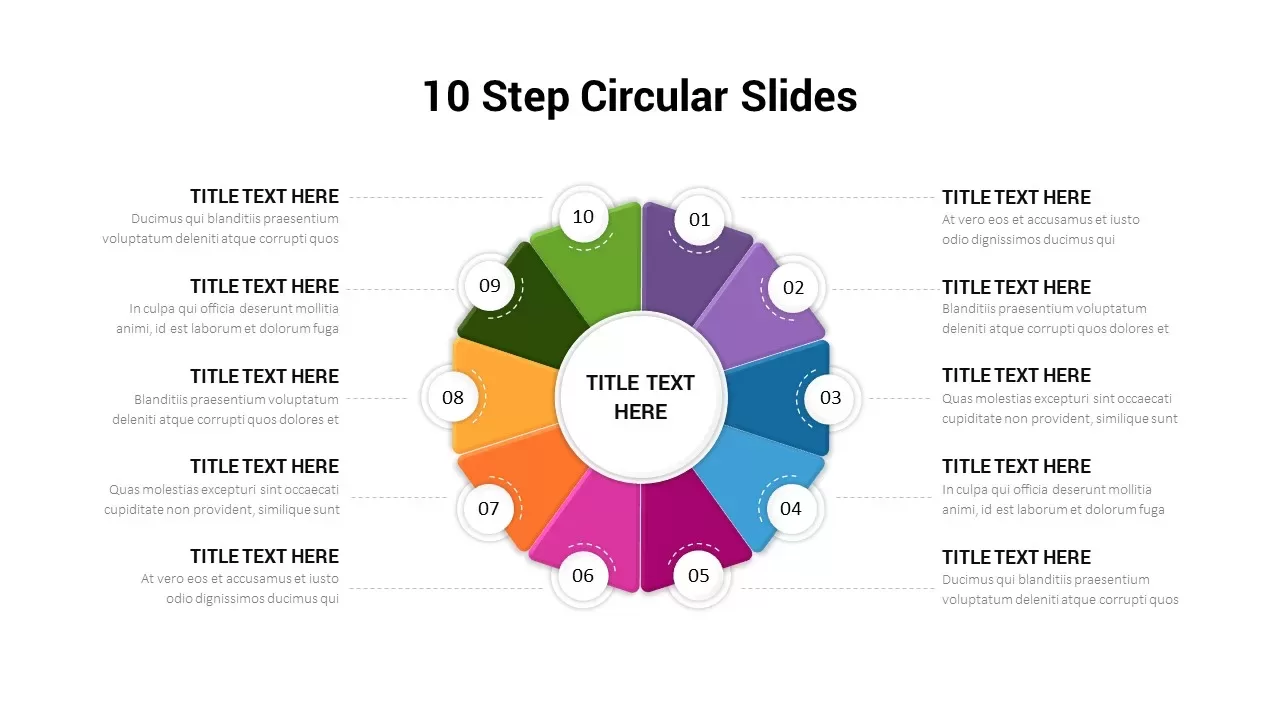
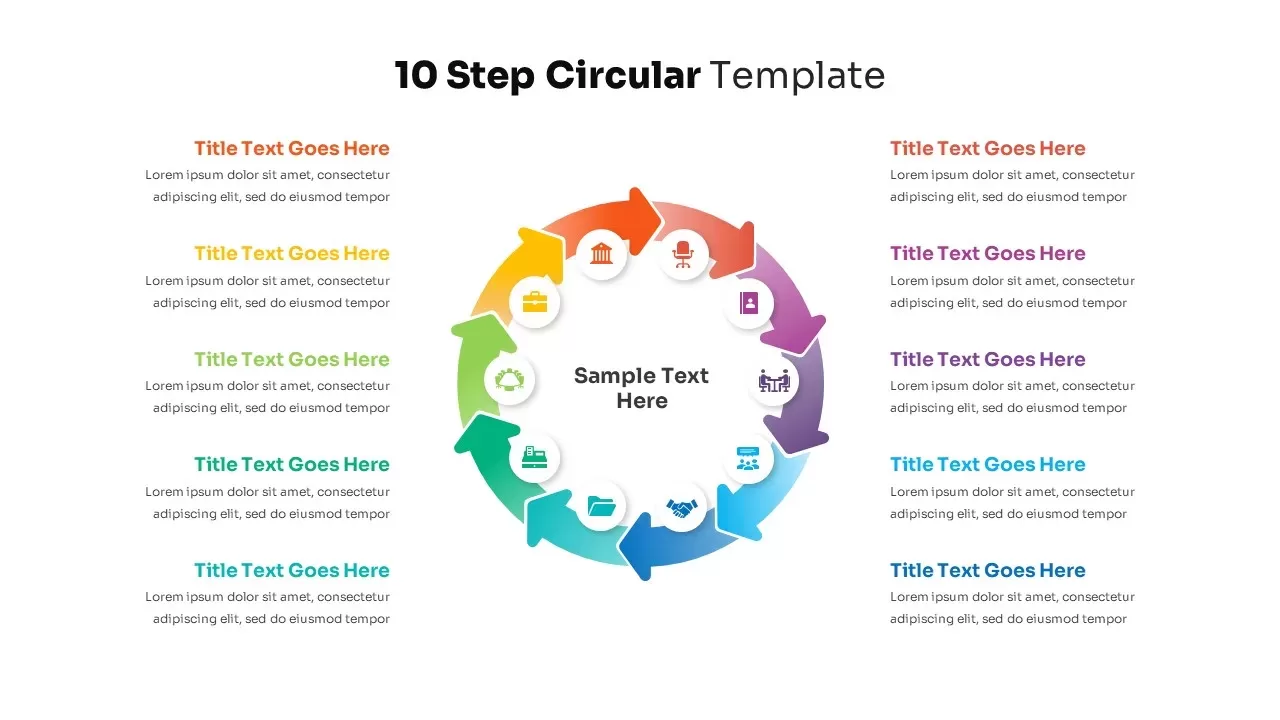
10-Step Circular Process Diagram Template for PowerPoint & Google Slides
Process
10-Step Circular Process Diagram Template for PowerPoint & Google Slides
Process
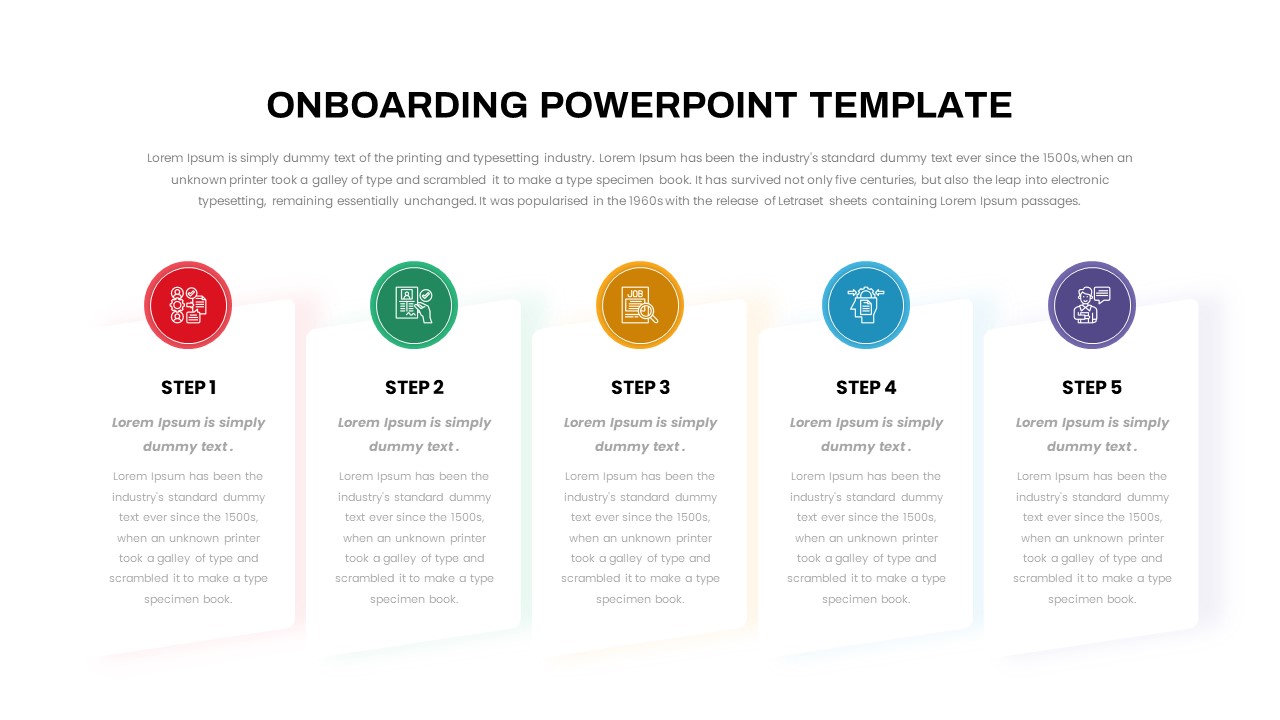
Free Five-Step Employee Onboarding Process Template for PowerPoint & Google Slides
Recruitment
Free
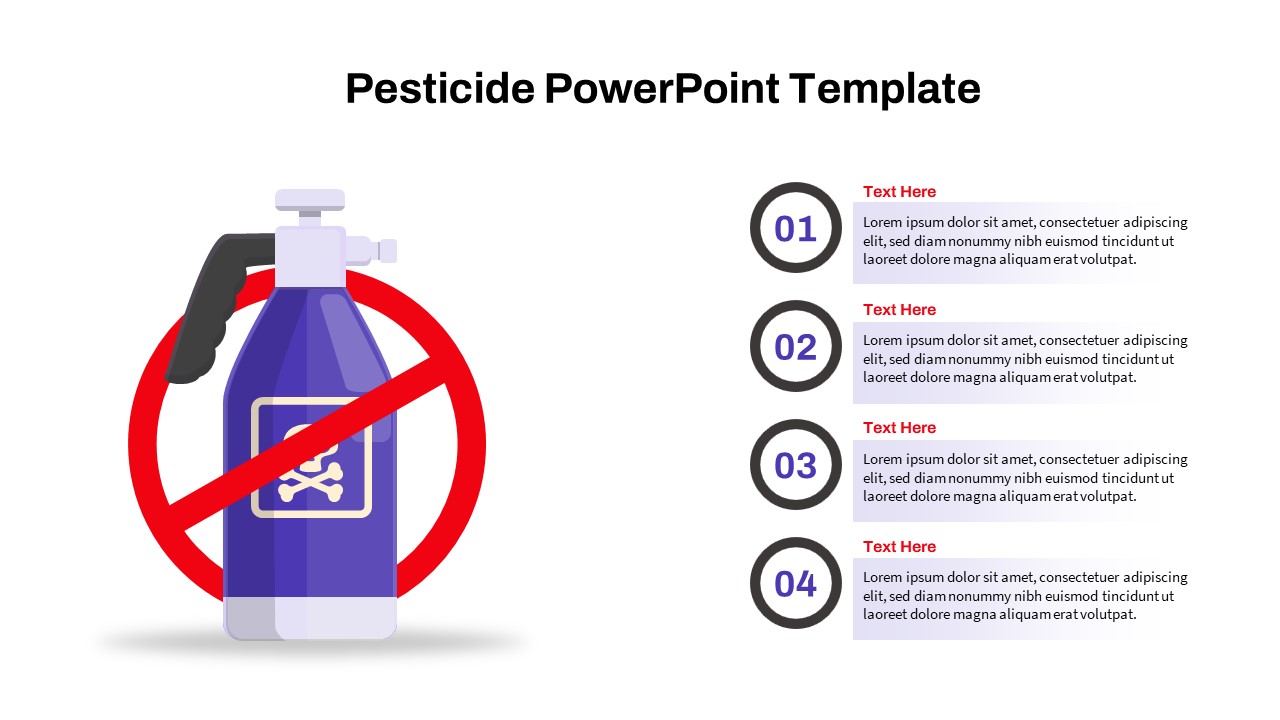
Pesticide Four-Step Process Infographic Template for PowerPoint & Google Slides
Process
Open Door Policy Three-Step Process Template for PowerPoint & Google Slides
Process
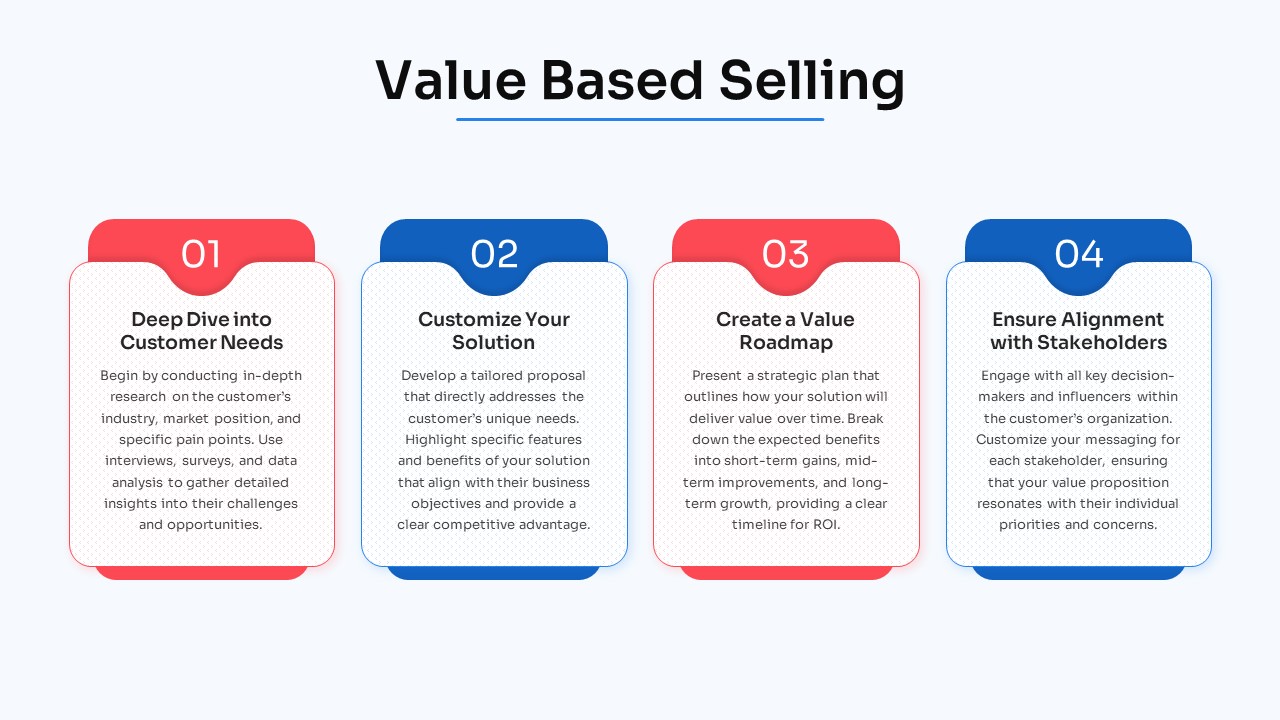
Free Four-Step Value-Based Selling Process Template for PowerPoint & Google Slides
Process
Free
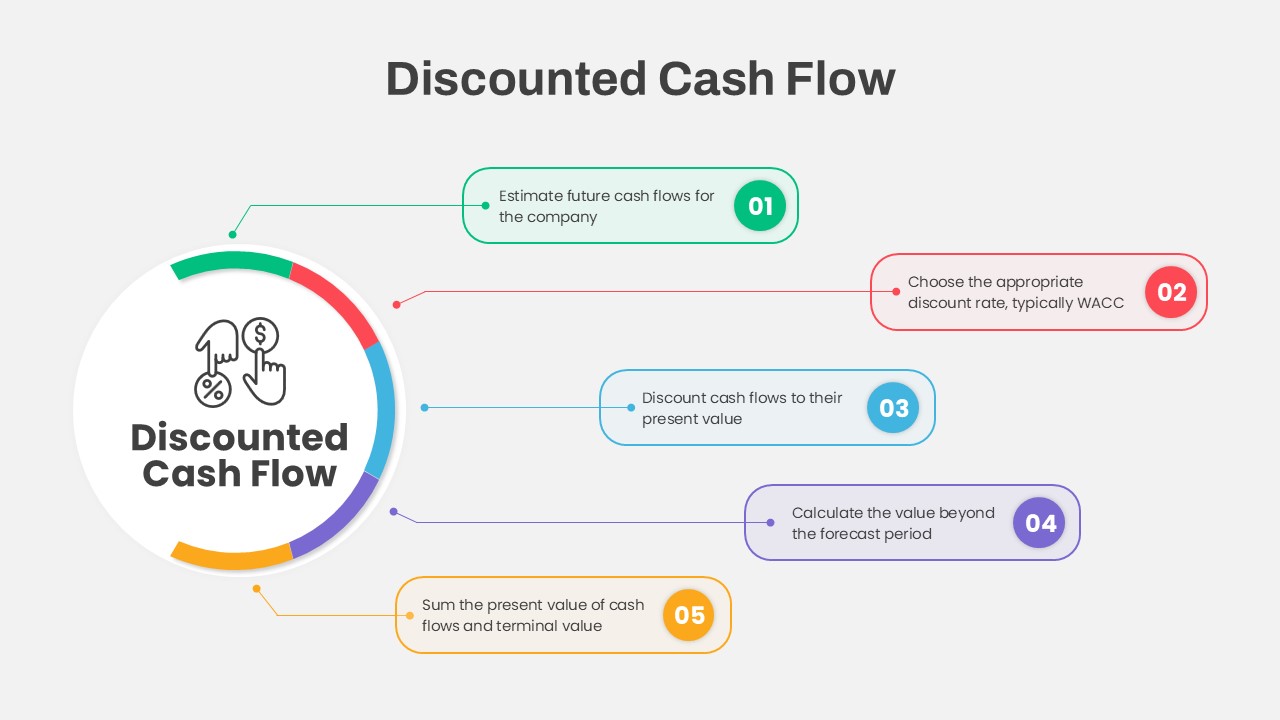
Discounted Cash Flow Five-Step Process Template for PowerPoint & Google Slides
Process
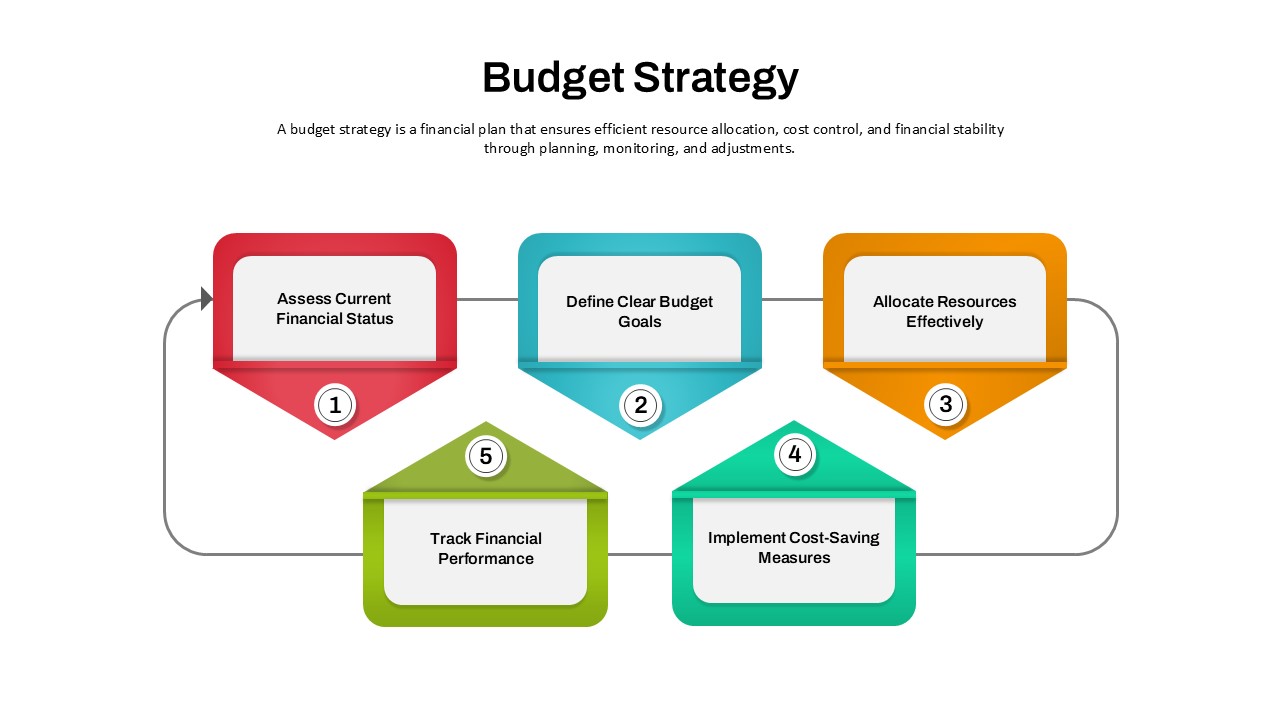
Budget Strategy Five-Step Process Template for PowerPoint & Google Slides
Finance
7-Step Contingency Planning Process Template for PowerPoint & Google Slides
Risk Management